Abstract
This study presents an integrated digital and archaeometric investigation of the Roman fortress of Sacidava, located in Dobrogea, Romania. Combining 3D digital reconstruction and advanced material analysis, the research explores both the original architecture and the preserved state of the site. Using Autodesk Fusion 360, a complete 3D model was developed, digitally restoring the fortress as it likely appeared in the 4th century AD and enabling the generation of precise plans, sections, and photogrammetric elevations. Mortar samples from the eight towers of the Sacidava fortress were examined through scanning electron microscopy with energy dispersive spectroscopy (SEM-EDS), atomic force microscopy (AFM), and confocal laser scanning microscopy (CLSM), revealing phyllosilicate-rich matrices, carbonated lime residues, and heterogeneous microstructures. The most severe degradation was found in the towers facing the Danube (E2, F, G), which was strongly influenced by humidity and salt crystallization, while the southern towers (A–C) retained more stable textures. Hydroxyapatite (HAp) treatments visibly improved the surface condition by reducing roughness and sealing active pores. For the first time, chromatic parameters were correlated with environmental factors, such as pH, moisture, and salt content. ImageJ-based pseudo-computed tomography (pseudo-CT), principal component analysis (PCA), and dendrogram analyses confirmed a clear pattern of deterioration near the ancient port area, where increased acidity and moisture coincided with darker surface coloration and deeper microstructural alteration.
1. Introduction
The Roman Empire is recognized as one of the most technologically sophisticated civilizations of the ancient world. Many of its innovations were so advanced that some were lost or forgotten during the upheavals of Late Antiquity and the early Middle Ages []. Throughout both the Republic and Imperial periods, the Romans demonstrated a remarkable talent for adopting and improving ideas, technologies, and strategies borrowed from other cultures—often those they had conquered or traded with, such as the Etruscans, Greeks, and Persians.
Across the Mediterranean and along the Black Sea, the remains of massive Roman harbor structures reveal the empire’s exceptional engineering skills. These constructions, long exposed to seawater and the Danube waters (Roman borderline in Dacia—Romania in present) were built using reactive, alkaline materials and pumice-rich volcanic ash aggregates [,]. Over time, major flooding events reshaped landscapes and even altered the borders of the Roman Empire, leaving lasting marks on both its infrastructure and its history [,].
Under such context, the 3D technologies in archeology and cultural heritage are becoming extremely popular. The acquisition of this geometry can be performed using image capturing [], photogrammetric techniques, and photo surveying methods—LIDAR (other alternatives include laser scanning from helicopters or ground-based aerial inspections) [,]. To make an accurate digital model of the fortress in 3D, realistic wall and column textures are necessary. This involves a process that includes uploaded photograms depicting all of the fortress geometry and its textures (photos taken from different ground viewpoints or with a helicopter at low altitude), combined with historical research (architectural measurements, drawings of buildings, and printed materials found by earlier visitors) and 3D-modeling techniques that enable us to build a digital model of the fortress on our own computers [].
Archeological research consists of several stages: stratigraphic excavation, the recovery of artifacts and field documentation, digitization with photogrammetry of all excavated areas, scanning by drone and geospatial mapping followed by data banking, and the final reconstruction into 3D (3D models, virtual reconstruction of the site and structures, visualization tools for analysis and presentation), all of which are adequately detailed [].
From the Sacidava fortress, some samples of mortar, used as a building material, will be studied in this paper. The mortar is a mixture of sand grains held together by a binder such as lime or cement. For centuries, this material has played a vital role in construction, giving shape and cohesion to walls, mosaics, and monuments. In the past, mortars were usually made from lime and sand, though builders sometimes added clay or pozzolana to enhance strength or water resistance [].
Lime mortars stand out for their high porosity and their network of fine pores—mostly in the mesopore range (102–104 Å). They are relatively soft materials, with a compressive strength of around 5 MPa, but their flexibility and permeability make them well-suited for historic structures. However, their low internal cohesion and high porosity make them vulnerable to damage caused by salt crystallization and freeze–thaw cycles, particularly when water seeps into the material. Among the main causes of deterioration of ancient Roman buildings, water and pollutant gases are the most damaging []. The natural environment plays a powerful role in how materials age and eventually break down. Factors like humidity, rain, frost, soil deposits, standing water, and extreme temperatures can all wear away at a structure over time, slowly weakening its surface and interior. Water acts as both a solvent and a carrier, bringing salts into the material’s pores and causing physical damage when it freezes. Pollutants such as chloride ions, sulfur dioxide (SO2), and nitrogen oxides (NOx) dissolve in rainwater to form weak acids (pH 4–5) that slowly dissolve the lime binder, increasing porosity and weakening the material until it loses cohesion altogether [,,,]. The ingredients for Roman lime mortars had to be obtained by exploiting natural raw materials that were not always readily available or of a sufficient quantity and quality. Although their choice was closely related to the mortar function, it was also mostly guided by the economy. Thus, the local geological setting, the availability of the energy source for producing lime, and the spatial relationship of the source of raw materials to the building site were the most important factors in the production of mortars []. Many examples of mortars found in the structures around the former Roman Empire were produced using local materials that were not always of the best quality but were “the best choice from an economic point of view” []. At the same time, we have examples of the intentional mixed use of imported and local raw materials, but even in those cases, it was always economically justified as much as possible. It has already been established that Romans transported the natural volcanic pozzolanic materials, pozzolana, for mortars from the Campi Flegrei along the Italian coast, and it was also assumed that it was the case with the wide Mediterranean area []. Recently, during the research on mortars used in the harbor of Sebastos in Caesarea Maritima, Israel, volcanic pozzolanic materials imported from the Campi Flegrei were detected, but their use was “accurate,” limited to the concrete-like structures and masonry walls in the intertidal zone, which confirmed the Roman optimization for the supply of raw materials [].
The Sacidava complex site is located on the right side of the Danube, on the Muzait hill, approx. 5 km northeast of the village of Dunăreni, commune Aliman, in the county of Constanţa, Figure 1.
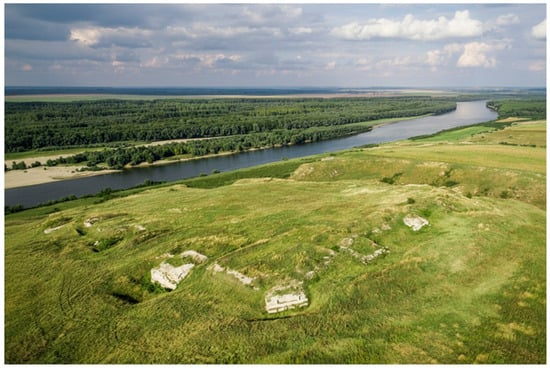
Figure 1.
The photo of the Sacidava fortress (adapted after [], with permission).
The name Sacidava is known to us from ancient literary sources. Thus, in the Notitia Dignitatum, Sacidava is indicated as the locality where the Cuneus equitum scutariorum was stationed—the southernmost cavalry unit in the province of Scythia [].
Built on a terrace overlooking the river, Sacidava stood as a key outpost along the Danubian frontier (limes Moesiae), controlling trade routes and defending the empire’s borders. When the Danube flooded, its waters rose quickly, reaching the lower terraces and seeping into the lime mortar and stone foundations of the fortress. Over time, the pressure of trapped water and the soaked soil beneath the walls led to cracks, dislodged masonry, and salt buildup inside the structures. The result was gradual but visible—collapsed sections, eroded ramparts, and buried ruins were hidden under layers of sediment carried by the river [].
The Sacidava complex site is located on the right side of the Danube, on the Muzait hill, approx. 5 km northeast of the village of Dunăreni, commune Aliman, in the county of Constanţa, Figure 1. The fortress supported several phases of development, having an uninterrupted evolution from the beginning of the second century A.D. to the first quarter of the seventh century A.D. Twelve construction phases have been archeologically identified, of which ten belong to the dominated era, including from the time of Justinian to the first decades of the seventh century A.D. [].
Sacidava now has a rectangular plan, with 125 m-long sides, which surrounded an area of about 4 ha. The walls were about 2 m thick, and the towers are rectangular.
The restoration and flourishing of the fortress at the beginning of the sixth century were interrupted by a great fire, probably related to the attack of Kutrigur in 559. The next level of this century, with the restorations on the southern side of the enclosure, was dated to the second half of the 6th century. The last stage of inhabitation within the walls of Sacidava took place between 602 and 620. Even after the decommissioning of the enclosure, a sporadic Romano-Byzantine type of habitation was observed, which disappeared with the abandonment of these places by the last inhabitants.
Systematic archeological research took place between 1969 and 1982; the most comprehensive plan of the site and adequate interpretations was published by Al. S. Ștefan more than two decades ago []. After almost four decades, systematic archeological research was resumed in 2019 under the coordination of Colesniuc [].
In order to evaluate the deterioration process of the Sacidava fortress for a correct preservation and restoration process, the main topic of this paper is an adequate diagnosis that used some analytical techniques—spectroscopic techniques (FTIR, Raman, UV-VIS), X-ray analysis (XRF, XRD, micro-XRF), and microscopy (SEM-EDS, optical microscopy)—to identify the mechanisms of chemical, physical, and biological degradation. For this work, all the above-mentioned techniques have been applied and reported in the literature, with some of them being our publications [,]. The main objectives of the paper are as follows:
3D reconstruction material characterization (SEM-EDS, CLSM, AFM);
Environmental correlation (CIELAB, PCA);
Conservation assessment (HAp activity);
3D reconstruction with methodological reproducibility (data resolution, image overlap, and software parameters).
Under this context, some analytical techniques have been used: computed tomography (CT) and microphotography (for qualitative visualizations of the material’s internal structure), scanning electron microscopy (SEM) paired with energy dispersive spectroscopy (EDS) (for revealing the structure), X-ray diffraction (XRD) (to identify the crystalline phases in a mortar sample), and thermal analyses, such as thermogravimetric analysis (TGA) and differential scanning calorimetry (DSC), help explain how mortars respond to heat—showing when and how different minerals decompose, transform, or react [,,,].
In this paper, since only small pieces of stone and mortars are visible above ground in the Sacidava fortress (this being one of the gaps in this study), specific and performant microscopic techniques were used: the scanning electron microscope (SEM), coupled with an EDS microanalyzer, is one of the most interesting techniques used in the study of material characterization and the diagnosis of degradation in architectural heritage, mainly due to its ability to obtain topographical, morphological, and chemical information [].
Also, confocal laser scanning microscopy (CLSM) or laser scanning confocal microscopy (LSCM), combines high-resolution optical imaging with depth selectivity, which allows us to do optical sectioning. This means that we can view visual sections of tiny structures for which it would be difficult to physically section and construct 3D structures from the 2D micrographs []. By capturing a series of two-dimensional images at different depths within a sample, this allows scientists to reconstruct detailed three-dimensional structures—a process known as optical sectioning []. It is a combination of the optical microscope, the modern laser technology, Raman detection technology, scanning control technology, the computer image processing technique, and the fluorescence labeling technique [].
These microscopy technique data could be correlated with atomic force microscopy (AFM), which can offer useful information about topology and morphology, together with 3D profilometry of the hydroxyapatite (HAp) layers, which is used in this case for consolidating the visible mortars at the investigated towers [].
In order to complete the above-mentioned data, X-ray computed tomography (CT), which is a common method to examine the interior of museum objects in a non-destructive way, provided evidence of the overall structure and the interior of objects, voids, and extended surface defects [].
In the same context, the development of nanomaterial-based consolidants marks a new chapter in the science of heritage preservation. These materials enable restorers to stabilize and protect ancient structures while respecting their original chemistry and appearance, offering deep penetration, chemical compatibility, and effective strengthening of fragile materials such as stone, mortar, and plaster. Related studies reported different nanomaterials that allowed them to reinforce the internal structure without altering the original appearance. Aside from calcium hydroxide (Ca(OH)2), calcium carbonate (CaCO3), silica nanoparticles (SiO2), and titanium dioxide (TiO2), hydroxyapatite (HAp) is a new and versatile nano-consolidant, due to its capacity to create bonds with calcitic surfaces, forming a strong, water-resistant nanolayer. This last nanomaterial is used for the preservation of stone surfaces on monuments, either alone or as hybrid nanolime–silica or nanolime–HAp [,,].
Complementary surface techniques (CIELab colorimetry, SEM-EDS, AFM, and confocal imaging (CLSM) were used in this paper to quantify surface roughness. Also, these techniques have been used to observe the consolidation and preservation effects of hydroxyapatite (HAp) on the mortars from the eight towers belonging to the fortress.
Apart from the characterization, another topic of this paper is 3D digital reconstruction, which is necessary to restore the exterior of the fortress as it looked in the sixth century A.D., and to highlight its historical significance and provide insights into Roman fortifications in the region.
In this paper, a 3D reconstruction model serves as a spatial model of this fortress and, by correlating them with the archaeometric and environmental observations, the evidence-based dimensions and initial shapes of this monument are proposed. The chromatic parameters of the walls of each tower and the environmental parameters (soil pH, humidity, and salt concentration) will be correlated with the microscopic images, and the conclusions will be discussed accordingly. Statistical research is performed to interpret the results through principal component analysis (PCA), and the dendrogram helps to reveal groups of towers with similar surface and environmental profiles, as well as the direction of exposure (surfaces facing north and south may change differently).
This study presents, for the first time, an archaeometric 3D digital reconstruction and HAp nanocoating evaluation for a Roman fortress on the banks of the Danube River.
2. Methods and Materials
2.1. Methods
Atomic force microscopy (AFM) analyses were carried out using an Agilent 5500 SPM system (formerly molecular imaging), equipped with a PicoSPM that was operated in MAC Mode and controlled through a PicoScan controller (Agilent Technologies, Tempe, AZ, USA). A multipurpose large-area scanner was used together with Point Probe Plus (PPP-FM) silicon cantilevers (n+-doped silicon, uncoated), which were approximately 227 μm in length and had a spring constant of about 1.8 N·m−1. The cantilever tips were operated in air, oscillating close to their resonance frequency (~64 kHz). All measurements were performed at room temperature in tapping mode, at a scan rate of 0.8–1.2 lines per second. Surface roughness values were extracted from the height images. In this context, Ra represents the average roughness, Rq provides the root-mean-square roughness (more sensitive to height variations), and Rz measures the height difference between the highest peaks and lowest valleys. Together, these parameters help describe the microtopography and any changes in surface texture resulting from material degradation or treatment.
Scanning electron microscopy (SEM) was visualized with the help of the FESEM-FIB (field-emission scanning electron microscope for electronics and focused ion beam) workstation Auriga model produced by Carl Zeiss SMT Oberkochen, Germany, by means of the secondary electron/ion detector (SESI) in the sample chamber for the topography/morphology of the surface of the analyzed samples. Scanning electron microscopy (SEM) and energy-dispersive X-ray spectroscopy (EDS) analyses were performed with a TESCAN VEGA3 LMU from the Tescan company, Brno–Kohoutovice, Czech Republic, this system being equipped with an Oxford X-act EDS detector, operating at 15–20 kV and a working distance of 10 mm. Samples were coated with a 5–7 nm Au/Pd film prior to imaging.
The chemical composition verification was performed using the EDS (characteristic X-radiation energy dispersive spectrum) probe produced by Oxford Instruments, Abingdon, UK—the X-MaxN energy dispersive spectrometer model with Aztec acquisition and processing software was integrated into the FESEM-FIB Auriga workstation.
Secondary electron (SE) topography images were taken and analyzed with the Everhart Thornley secondary electron detector with a Faraday cup (SESI)/column annular type SE detector (InLens) from the sample chamber at the acceleration voltage of 5 kV for sample visualization and 10 kV for EDS for the following types of analyses performed by the energy dispersive probe on the surface of the analyzed sample, such as the following:
- Point semi-quantitative analyses located at certain intervals in the same micro-area, for the distribution of compositional elements on the material surface, as well as the variational verification of the composition of the investigated micro-area with the points from which the respective spectra were acquired.
- Elemental mapping analyses, namely obtaining spectral images—where the distribution of the elements on the surface swept by the electron beam are superimposed and possible compositional differences have been highlighted—the increase in the area of the element present or the appearance/disappearance of an analyzed and identified element.
The confocal laser scanning microscopy (CLSM) was achieved with a confocal microscope (Leica DCM8—Leica Microsystems CMS GmbH, Wetzlar, Germany), which enabled precise control of imaging conditions. It operated with laser lines ranging from 405 nm (UV) to 633 nm (far-red) and allowed surface roughness determination. Confocal laser scanning microscopy (CLSM) images were obtained using a Leica TCS SP2 (Leica Microsystems, Wetzlar, Germany), equipped with an argon–krypton laser (λ = 488 nm) and a 63×/0.90 NA objective lens. Three-dimensional optical sectioning was performed using Leica Confocal Software v2.61.
Simulated computed tomography (Pseudo-CT) has been achieved by image segmentation performed using ImageJ software for Mac V 1.54 Softonic International S.A. © 1997–2025, Barcelona, Catalonia, Spain [,,]. The stack composite was opened in software, using the split channel function in the hyper stack plugin. ImageJ is an open-source software used to process and analyze. ImageJ is used afterward for data processing and quantification [,]. CT is able to offer us information about pores, voids, or cracks, distributed throughout the matrix.
The chromatic parameters were measured using a CR-410 colorimeter from Konica Minolta, Tokyo, Japan, following the CIELAB standard []. These included Lx* for brightness (ranging from 0 for black to 100 for white), ax* for red/green variation (where +ax* denotes red and −ax* denotes green), and b* for yellow/blue variation (+bx* for yellow and −bx* for blue).
pH and chloride/sulfate/nitrates total concentration of ions measurements were executed with a HANNA HI 9828 multiparameter analyzer (UK Office Keison Products, P.O. Box 2124, Chelmsford, Essex, CM1 3UP, UK). Statistical research was undertaken for the interpretation of the results, by using principal component analyses (PCA) [].
The season parameters (e.g., temperature, humidity, and salt concentration) and locations (i.e., each tower of the Sacidava fortress) were analyzed using IBM SPSS Statistics (software version 21) for MS Windows). The computation of multiple range tests provided the statistical significance of comparisons between principal component analysis (PCA) and the component plot in a rotated space with the microclimate parameters. This was performed according to Varimax with Kaiser normalization to reduce the number of factors that explain the variability in air pollution from the historically studied area []. The input matrix began with two seasons (i.e., summer and autumn) and three variables (i.e., temperature, humidity, and salts concentration).
The mortar breathability has been evaluated with the capillary water-absorption coefficient (C) []. The procedure involved drying specimens to a constant mass, and after that, immersing base ≈ 5 mm in water and recording the mass gain at intervals (1, 5, 10, 20, 40 min, 1 h, 2 h). Plot M (kg/m2) vs. √t (s0.5), and from the slope, parameter C could be determined.
The 3D digital reconstruction of the Sacidava fortress was executed using Autodesk Fusion 360 (under a Valahia University of Târgoviște license). The process involved several methodical stages. It began with measuring the dimensions of the ruins using satellite images from Google Earth (publicly available software). These images were then imported into Fusion 360, where a 100 m fixed-size guiding line was drawn to facilitate the scaling of the satellite images, using a 100 m reference taken from Google Earth’s measurement function. Next, images of the 1980 plan of Sacidava after Scorpan [] were imported and scaled using the 20 m reference size from that drawing. This plan served as the basis for the 2D sketch design of the fortress foundation, followed by its 3D design, using approximate depth dimensions. The workflow continued with the 2D sketch design of the walls and columns, referencing the foundation, and their subsequent 3D design, where the height was approximated based on the specialized literature and the elements existing in the 1980 plan. The fortress was then completed by adding walls and columns to ensure it was square and closed, followed by the design of the defensive walls for the columns and walls. Finally, the 3D design included the fortress gates, the windows and exits of the fortress columns, and the creation and overlay of textures: specifically, fortress textures for the walls and columns and drone images for the ground texture. The schematic workflow for the Sacidava fortress is shown in Figure 2.
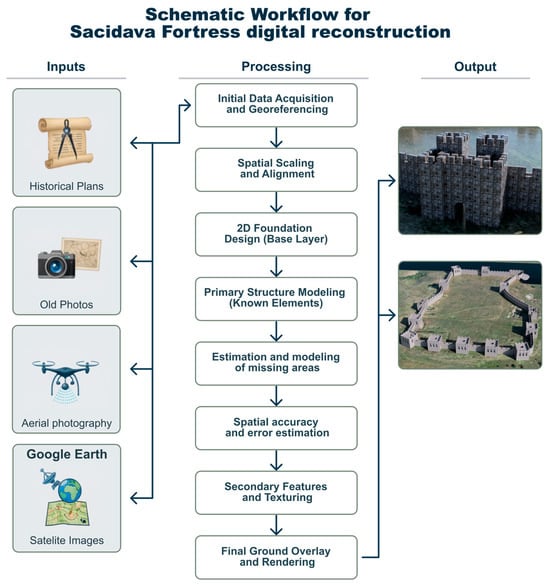
Figure 2.
The schematic workflow for the Sacidava fortress reconstruction.
2.2. Materials
The samples collected from the Sacidava fortress were taken by an archeologist, by using the standard procedure. Polyethylene recipients were used, and the samples were analyzed on the spot. Sampling and sample analyses for physicochemical parameters were realized accordingly. Hydroxyapatite (HAp), used for preservation, was synthesized and characterized in our labs, as was reported in previous reports []. At the mortar samples collected from each tower (Figure 3), HAp in water solution (0.5 mg/L) has been applied by spraying.
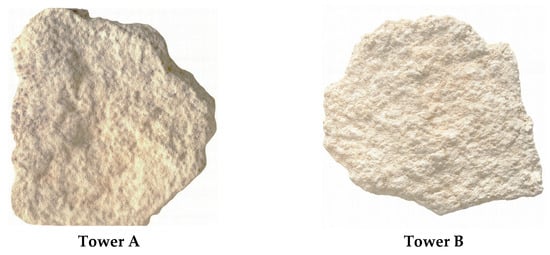
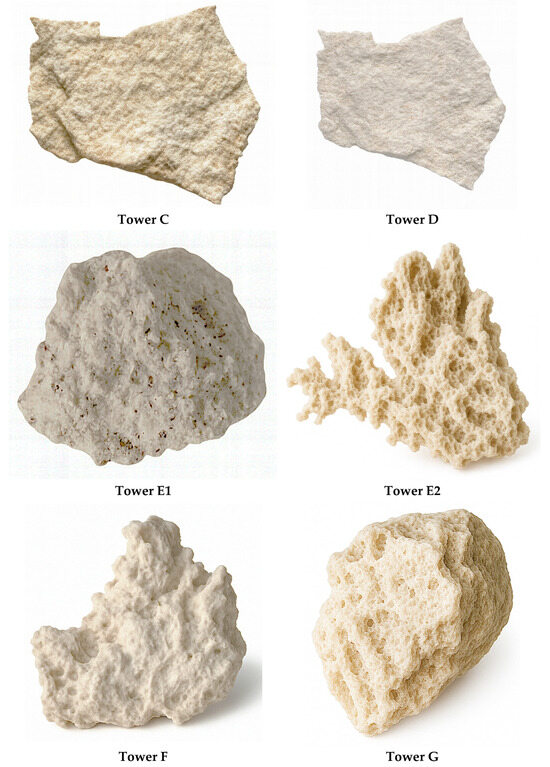
Figure 3.
The investigated mortar samples.
2.3. Sample Selection, Replication, and Statistics
For all eight towers, we selected the eligible surfaces: the original masonry (brick/stone/mortar) with no modern coatings, no recent repairs and with crack width < 2 mm, with no visible biological crusts, and with a stable surface to permit AFM tapping. For all the AFM and SEM analysis, we removed the dust with a soft, clean brush, and no solvent/water was applied.
As material replicates (between-site), the independent surface fragments/areas per tower (n = 6 per tower) were spaced ≥ 0.5 m to avoid pseudo-replication. From every tower, from the same marked micro-areas, paired samples were measured before and after HAp treatment (repeated measures).
For AFM, 3 regions of interest (ROI) were selected (50 × 50 µm or 100 × 100 µm) per sample × 3 repeat scans/ROI (independent re-approach), resulting in 9 scans per sample. AFM acquisition (tapping) mode was set up to minimize surface deformation and target tip radius < 10 nm, setpoint of 70%–80% of free amplitude, and scan rate of 0.8–1.2 lines/s and 256 × 256 px. The surface parameters Ra (average roughness), Rq (root mean square roughness), and Rz (maximum height difference), which were automatically computed by PicoView 1.4 software (Version 1.14.4, Agilent Technologies, 800 Altamor Drive, Los Angeles, CA, 90045, USA), have been collected and processed.
For SEM analyses, three micrographs per ROI were examined at magnifications between 500× and 5000×, enabling the pore size, crack density, and particle distribution to be quantified using ImageJ. For a good resolution of the SEM images, a 5–7 nm Au coating was applied.
All numerical data were expressed as mean ± standard deviation (SD). Statistical comparisons between untreated and HAp-treated surfaces were carried out using one-way ANOVA, with p < 0.05.
3. Results and Discussion
3.1. Three-Dimensional Digital Reconstruction Material Characterization
The experiments will start with the historical records concerning the fortress of Sacidava, which form an indispensable source for its economic, political, and military background in the Roman empire: particularly to date those known from the eastern Black Sea (province). As excavation of the fortress is unable to expose any endogenous interior architecture, comparative studies with contemporary fortresses are necessary. This serves to recover lost information on account of partial excavation. Such surveys can help reveal as yet unknown parts of the fortress: structures which have risen above ground level as a result of natural weathering. In view of the new findings, we were able to propose that one such Roman quay foot ruin is being traced in a low water level time for the Danube river observation []. The Roman fortress of Sacidava had a quay, used as an internal port (610 m in length), which was intended for entering warships or vessels. The fort, a cantonment on the Moesian Limes, had been used to control supply and transportation passing by the Roman frontier for hundreds of years. Today, practically the whole southern side of the encircling wall, and also in part the western side, a total length of some 200 m that had been most closely surrounded due to easy accessibility are left uncovered: on one side, from towers A to G; on the other, only from D to E (Figure 4). On the east is the entrance gate and some of the curtain at its north-eastern end. The towers have been noted with the letters of the alphabet in order of discovery [].
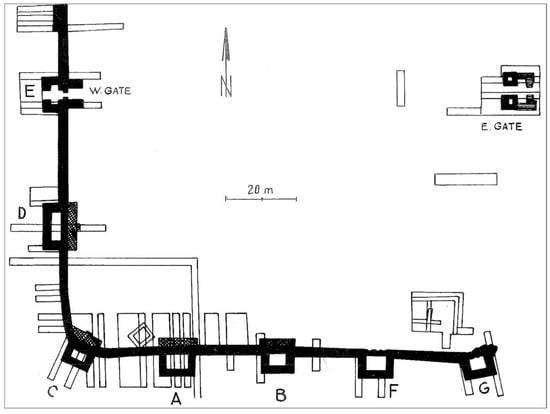
Figure 4.
The towers and gates of the Sacidava fortress (noted as A to G) (SCORPAN 1977 [], with permission).
3.1.1. SEM-EDS
The SEM images (Figure 5) show two samples of black crust, perpendicular to the surface. EDX spectra of a mortar sample (tower D) show the content of calcium (blue EDX spectrum) and sulfur (red EDX spectrum), while the EDX spectra of Figure 6 show the content of calcium (purple EDX spectrum) and sulfur (EDX spectrum), with an aluminum spectrum (red line) and silicon spectrum (green line). The inner part is mainly composed of calcium, due to calcite of the limestone, while the surface is composed of sulfur and calcium, due to the gypsum generated in a reaction between the SO2 from pollution and calcium carbonate from limestone. This layer captures other particles that are present in the atmosphere and produces a characteristic gray-black color. SEM-EDX allows for analyzing the process to assess the effect of pollution on built heritage and to provide evidence of the difference in texture and porosity in the new surface []. The line scan is a useful tool for the surface analysis and layer characterization of weathering forms.
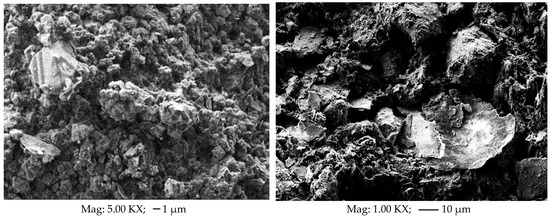
Figure 5.
SEM images of non-treated mortar samples.
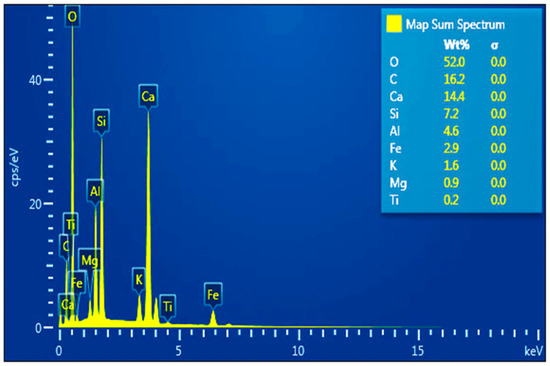
Figure 6.
EDS results for non-treated mortar samples.
From the SEM image analysis (archaeometry context), the following morphological features could be mentioned. Large, plate-like particles dominate the scene; these are clearly lamellar (layered) structures, typically including the following: phyllosilicates (clays) such as clintonite, illite, kaolinite, or mica; degraded mineral binders or ash components in ancient mortars; secondary reaction products (e.g., carbonates or silica gels); or decomposed lime or volcanic ash. Large flakes were assigned to the mica group minerals (e.g., muscovite, phlogopite), which are often used in mortars and bricks, or present in natural aggregates, and the fine porous background is assigned a degraded binder matrix: possibly a lime-rich environment, reacting with silica or alumina. A high heterogeneity is consistent with ancient construction materials where additives (ash, pozzolana, clays) were mixed with lime. This texture and structure would be typical for the following: ancient lime mortar or earthen building materials with natural clay inclusions, ceramic or daub fragments in archeological fills, and conservation layers where phyllosilicate-based fillers are used, as previously reported [].
Some recycled materials (e.g., bricks) were identified in the investigated samples, and were visible through the heterogeneous microstructure, resulting from the mixture of dense ceramic fragments with finer binder matrices and angular inclusions, possibly indicating crushed ceramics or mortar reused as aggregate [].
SEM images reveal the presence of crushed brick fragments characterized by angular, reddish-to-brownish grains, showing zonal alteration—for example, a fired clay particle with a vitrified outer layer and an unreacted core. Inclusions of crushed ceramics or tiles are also visible; these have irregular, often angular shapes, distinct color and texture contrasts compared to the surrounding matrix, and in some cases, glassy edges (Figure 5).
Additionally, the microstructure displays clay platelets and quartz grains embedded in a matrix of varying density, with some regions appearing more compact and sintered than others.
It is well-established that Roman and post-Roman builders intentionally added crushed brick (cocciopesto) to mortars to enhance their hydraulic properties, particularly in structures such as baths and cisterns. Recycled brick fragments also acted as pozzolanic aggregates, improving the mechanical performance of the mortar.
At a higher magnification (20,000×), the images suggest the presence of a precipitated or recrystallized binder phase, possibly formed through reactions with the reused ceramic particles. At a lower magnification (1000×), a large lamellar flake—likely mica or a similar mineral originating from a fired clay matrix—can be seen, further supporting the interpretation of crushed ceramic fillers [,].
By analyzing the images, some planar structures could be observed and could be attributed to minerals from the muscovite and phlogopite group, often used in mortars, bricks, or even natural aggregates. The fine, porous background is attributed to a degraded binder matrix, possibly a limestone-rich environment reacting with silica or alumina. The high heterogeneity is consistent with ancient building materials, where additives (ash, pozzolan, and clays) were mixed with lime. This texture and structure would be typical of ancient lime mortar or earthen building materials with natural clay inclusions, ceramic or ash fragments from archeological fills, and conservation layers where phyllosilicate or hydroxyapatite-based fillers are used. Carbon-based materials (e.g., carbon black or biochar), common in some carbon aggregates, can be identified sporadically, most likely due to the fires that devastated the fortress [].
In ancient Roman buildings, slaked lime mixed with pozzolanic materials was often used as a binder and crushed brick fragments of various sizes were added as aggregates, creating mortars that stood out for their strength, flexibility, and incredible durability. The inclusion of brick fragments made the material more porous, breathable, lighter, and adhesive: all essential qualities for structures that are constantly exposed to water. For their mortars, the Romans combined fine pores with high overall porosity, a combination that proved essential to their remarkable durability []. While many Roman structures crumbled over time due to the relentless forces of water, salt, and temperature, certain incredible creations endured for thousands of years.
Evidence of recycled materials—particularly reused brick fragments—was identified in several of the samples. These components can be recognized by their heterogeneous microstructure, where dense ceramic particles are embedded within a finer binder matrix. The presence of angular fragments suggests that crushed brick or previously used mortar may have been intentionally incorporated as an aggregate. In some cases, we observed thermally altered features, such as burnt edges or partial vitrification, indicating that the original material underwent high-temperature firing before being reused. Additionally, small plate-like inclusions of clay or mica could be distinguished, likely representing incompletely fired particles that survived the original ceramic production process and were later crushed and introduced into the mortar [].
Elemental analysis carried out by energy dispersive spectroscopy (EDS) further supports the identification of ceramic fragments. These areas typically show relatively high concentrations of Si, Al, and K, which are characteristic of fired clay materials [] (Figure 6). The presence of Fe is significant as well, as it is commonly associated with old bricks or pottery used as temper. In several grains, mixed elemental compositions were detected, suggesting that the aggregates originated from previously used building materials, rather than natural raw sources. This supports the interpretation that recycling practices—such as crushing demolished masonry to produce new construction mortars—were employed as part of the historical building process.
3.1.2. AFM Studies
Atomic force microscopy (AFM) allows us to look at Roman mortar in an extremely detailed way, down to the nanoscale texture of the binder. Roman mortar is made from lime and various aggregates (quartz, crushed brick, volcanic sand, etc.), and over centuries it weathers, dissolves, and develops micro-cracks that are too small to see with ordinary microscopy. AFM helps us visualize the tiny features as 3D surface landscapes, where peaks and valleys represent the degree of surface roughness and cohesion [,].
Before conservation, AFM helps us to visualize the small pores and micro-cracks, which allow water and salts to penetrate the mortar; rough, uneven surfaces, where the binder has been weakened; and irregular crystal growth, indicating aging and environmental stress.
An example of these can be seen in Figure 7, for tower D (up) and tower E2 (down). Overall, this figure simply illustrates how improving the sharpness of an AFM image helps to better understand the actual micro-topography of a material’s surface—how rough it is, how the grains connect, and how the surface behaves at the nanoscale. The figure shows what the surface of a material looks like under an atomic force microscope (AFM) and how its roughness can be understood by looking at a single line in the image.
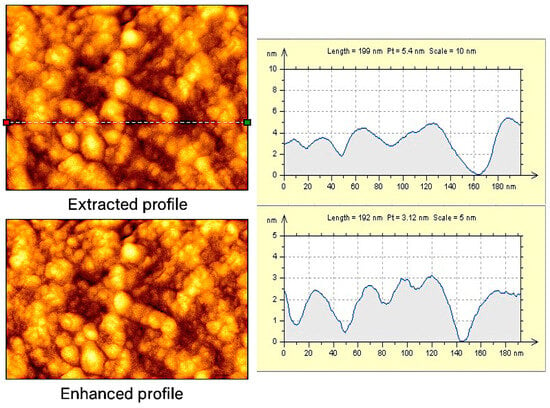
Figure 7.
AFM surface topography (profilometry) of the non-treated mortar surface, before and after image enhancement. The left images show the original AFM scan (top) and its enhanced version (bottom), where surface grains and micro-reliefs appear more clearly defined. The dashed line indicates the location of the extracted height profile. The right plots illustrate the corresponding height profiles along this line, highlighting how image enhancement improves the visibility of local peaks and valleys and provides a clearer representation of the material’s nanoscale roughness.
Also, the topography could be obtained by this technique, providing evidence of the shape and relief of the investigated surface (for example, Tower D), Figure 8. The mortar shows a rough, heterogeneous topography with elongated ridges characteristic of lime-based matrices. In contrast, the HAp scan reveals discrete nano- to micro-scale agglomerates with well-defined height variations, visible as bright elevated peaks. The height scales (in nm) illustrate the clear difference between the continuous mineral matrix and the isolated HAp deposits.
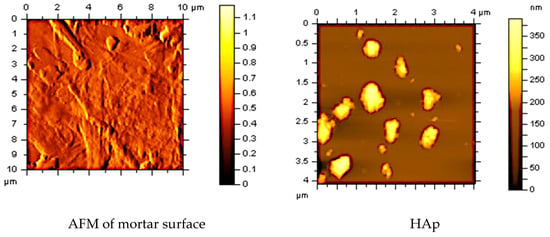
Figure 8.
AFM surface topography of (left) the untreated mortar surface and (right) hydroxyapatite (HAp) particles deposited on the substrate. The mortar surface shows a heterogeneous micro-relief with elongated ridges and fine textural variations typical of lime-based matrices. In contrast, the HAp image reveals well-defined nano- to micro-sized agglomerates with higher topographic elevations, highlighted by the bright yellow peaks. The color scales represent the height distribution, illustrating the difference between the rough, continuous mineral matrix and the discrete HAp deposits.
3.1.3. Simulated Computed Tomography (Pseudo-CT)
Computed tomography (CT) is a powerful technique used to create detailed three-dimensional (3D) images of an object’s internal structure. In cultural heritage research, CT imaging has been widely applied to study artifacts, revealing how they were made, their current condition, and even their origins [,,,]. In recent years, advances in image processing have greatly expanded the potential of CT imaging. Researchers can now virtually unfold sealed documents, combine CT data with other 3D imaging techniques, and use deep learning algorithms to enhance image resolution [,].
ImageJ is an important imaging tool in the fields of biological and medical science []. It has also been investigated for applications in archeological research []. ImageJ has been used with focal stacking for shape/region counting [,].
Testing conservation treatments before applying them to heritage materials is essential to assess their compatibility and performance in specific contexts. Such evaluations often rely on in situ (non- or semi-destructive) methods that provide indirect yet valuable empirical evidence. Computed tomography (CT) offers a powerful means to visualize a material’s pore structure. In the example shown in Figure 9, the analysis revealed that deterioration progressed more deeply when a higher proportion of water was present, indicating its significant role in accelerating the internal damage [].
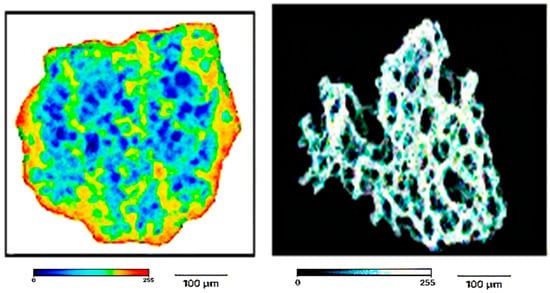
Figure 9.
Simulated CT of the porous mortar microstructure. (Left): Tower D; porosity 56.8%; (Right): Tower E2, porosity 79.8%; Blue and green areas = open pores and less dense micro-zones, orange regions: compact mineral aggregates or recrystallized areas.
The images processed with ImageJ are pseudo-CT. Even though they are not using real tomography, this is a 3D digital simulated reconstruction, starting from a 2D image (optic, SEM, confocal, etc.) to generate a 3D volume and to provide evidence of porosity distribution. In order to be clearer about the porosity of some samples, the ImageJ-processed images for tower D and Tower E2 (E gate) are shown below, Figure 9.
This heterogeneous pattern reflects a balanced solid–void ratio, possibly resulting from aging, carbonation, or microstructural self-healing processes.
The pseudo-CT visualization provides a realistic representation of the internal structure of the sample, revealing a moderately porous and compact mineral matrix []. The pseudo-CT grayscale uniformity increase is consistent with higher light-scattering homogeneity, often observed as a slightly lighter, less granular appearance in treated surfaces.
In the grayscale CT-style image, lighter tones indicate denser regions of solid material, while darker zones represent pores and micro-voids distributed throughout the matrix. The contrast suggests a fairly uniform texture with locally interconnected pores, which is typical of carbonated lime mortars or calcium-based materials after partial consolidation.
At tower D, the model-based porosity (~56.8%) is consistent with a material that maintains good air and moisture permeability while providing sufficient cohesion. Such microstructures are often observed in lime mortars where partial pore filling occurs without losing overall breathability. The degraded layer thickness would be approximately 25–50 µm.
Usually, the breathability is evaluated through the water vapor permeability (WVP) and water absorption/capillarity. For these studies, the breathability has been evaluated using the capillary water-absorption coefficient (C), and the obtained values are shown in Table 1.

Table 1.
The chromatic parameters (L*, a*, b*) and environmental factors (pH, humidity, and salts) for the Sacidava towers (measurements in July).
The grayscale CT section highlights how the material’s density changes across its porous network. Bright areas represent the dense, mineral-rich phase, forming the structural skeleton. Dark regions correspond to pores or voids, indicating pathways for air or moisture. No strong phase separation is visible—the texture looks homogeneous, with subtle density variations that may affect how water or gases move through the sample.
At Tower E2, the model-based porosity (~79.8%) is the most deteriorated; the CT images reveal valuable insights into the interface contact area, which directly influences both the durability and mechanical strength of the mortar. The interface is a key factor in moisture transport, since, in practice, there is rarely a perfectly sealed hydraulic connection between the mortar and the adjoining unit. In such mortars, the absence of coarse aggregates and the limited carbonation occurring at the interface can lead to the formation of a moisture barrier, restricting water movement and suggesting localized variations in the interfacial structure []. A porosity of nearly 80% indicates an extremely open and permeable structure.
Overall, the CT model reveals a highly porous, interconnected 3D network, with a good balance between the solid and void phases. The structure behaves like a mineral foam—lightweight, yet potentially strong after consolidation. The false-color CT makes density gradients visible, showing how the material could respond to surface treatments, mineral deposition, or environmental exposure. The pore morphology (CT analysis) has allowed for identifying manufacturing features [].
The porosity values have provided durability factors. The open and total porosity values (around 60% and 40%, respectively) can be related to a water-resistant potential worsening. The spherical-shaped porous system (water-released spherical pores), as well as the large number of pores with a diameter less than 1 μm that have been observed, are typical of ancient hydraulic mortars. The diameter of the pores (0.77–0.95 μm on average and 10.6 μm maximum) and the porous volume (3.30%–12% within the weathering range) also point to their hydraulic nature. The pore size values contribute to satisfactory binder–aggregate cohesion, enhancing the mechanical performance and minimizing the risk of disintegration.
3.2. Environmental Correlation
Over time, tracking these color changes can provide an index or proxy for weathering progression. The chromatic parameters can serve as a quantitative proxy for assessing the weathering status. Combining chromatic data with the environmental and material analyses strengthens the correlation.
First of all, we identify the areas with visible signs of degradation, such as walls with biological growth, mineral efflorescence, or surface erosion. Regions showing signs of discoloration, erosion, or biological colonization should be detected. Secondly, the chromatic parameters should be measured by utilizing a colorimeter to measure the CIELab values (L*, a*, b*) at each identified spot. These data could be correlated with the environmental data, by recording local weather conditions, humidity levels, and any visible signs of biological activity. Analyzing the relationship between chromatic parameters and weathering indicators allows us to identify patterns and groupings based on chromatic and weathering data [].
The local environmental data are relevant to weathering, such as the following: temperature, humidity, rainfall, pollution levels (SO2, NOx, particulate matter), and exposure direction (north and south-facing surfaces may weather differently). We used the CIELab system to obtain the L*, a*, b* values, surface roughness measurements (profilometer or laser scanner), microscopic or petrographic analysis for surface decay, and chemical analysis (XRF or FTIR) for mineralogical changes [,].
- Lightness (L*) decreases, meaning that the surface appears darker and more matte.
- Decrease in L* (darkening) means that the surface has an increased soiling or biological growth.
- Higher L* means that the surface becomes brighter from sunlight exposure.
- The color measurements show a slight shift toward green (lower a values) or a faint red tint, typical of natural stone (slightly higher a values), suggesting minor oxidation or mineral changes. The b values shift moderately toward yellow, which is likely influenced by a yellow-green lichen layer or the stone’s natural yellowish tones. Overall, these color changes appear to be closely linked to surface roughness and chemical weathering.
In the Rașova region, the reported humidity level is 31%. Also, the water quality parameters are in the official data [,].
The parameter a* is negatively correlated with both humidity and salts. Higher humidity and salt content may shift the surface color toward green, and the parameter L* (lightness) shows a weak or no strong correlation with pH, humidity, or salts, Figure 10 and Figure 11.
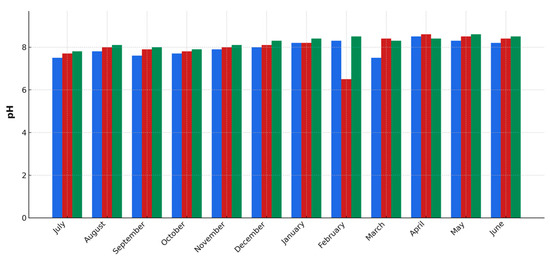
Figure 10.
pH variation (July 2019–June 2020) (Blue column: Tower F; Red column: Tower E2; Green column; Tower G).
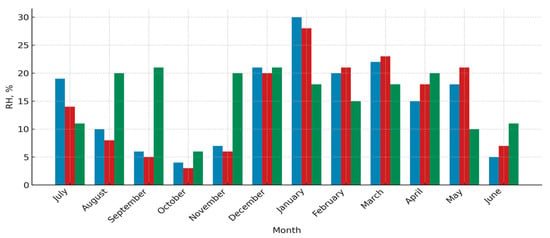
Figure 11.
Humidity variation at the towers: (July 2019–June 2020). (Blue column: Tower E2; Red column: Tower G; Green column; Tower F).
The climate around Sacidava is shaped by its position along the Danube, where dry continental influences alternate with periods of higher moisture. These seasonal changes directly affect the stone walls and lime mortars of the fortress.
During the summer months, the air is generally drier, with humidity levels around 45%–55% (medium value for all towers). In some cases, this value could decrease to 30% (as could be observed in Figure 11). In spring and autumn, especially during wetter periods, the relative humidity (RH) rises to 70%–85% (especially during rainy time). Over the year, the average humidity remains fairly high, at around 60%–68%. When the humidity drops again, salts crystallize and exert stress on pores, which slowly leads to surface powdering and material loss.
From the point of view of the surface pH, it could be observed that the films and small amounts of runoff that form on the walls usually have a pH between 6.3 and 8.4. During rainy seasons, the pH could drop slightly (around 6.2–6.5), due to the dissolved atmospheric gases and urban pollutants transported along the Danube corridor. In drier periods, the pH tends to return closer to neutral.
Even this mild acidity is enough to dissolve and weaken lime binders, gradually increasing surface roughness and porosity, especially on exposed edges and tower faces.
Salts and humidity are strongly positively correlated, which makes sense if salt efflorescence is moisture related. Salts (total chloride, sulfate, and nitrates) may exacerbate weathering, especially crystallization in pores (causing microcracks and pigment migration); moisture transport, leading to uneven leaching or staining; interaction with iron-rich phases; and creating secondary mineral stains (e.g., greenish ferrous sulfates or whitish sulfates). The chloride ions (Cl−) are highly mobile and hygroscopic, leading to moisture retention, increasing freeze–thaw stress, and efflorescence or sub-efflorescence. The effects are crystallization pressure in pores, scaling, flaking, and grain detachment, and chemical interaction with calcium compounds, forming soluble CaCl2, and with iron compounds, promoting rust stains or corrosion if metals are present nearby [].
Also, the chlorides themselves are colorless, but they may trigger or accelerate color changes indirectly, as follows: they can mobilize iron ions, which reprecipitate as reddish-brown stains; could combine with environmental dust or pollution, darkening surfaces; and they could create whitish salt crusts on the surface when they recrystallize (NaCl, CaCl2, etc.). This is the reason for considering the dark/gray zone as being chloride-driven staining, especially if there is moisture cycling, and the reddish zone is more consistent with thermal oxidation of Fe.
The relationship between chromatic parameters (L*, a*, b*) and environmental factors (pH, humidity, and salts), are shown in Table 1. Also, the capillary water-absorption coefficient (C) shows the same trend: the towers A, B, C are relatively stable, D, E1, are medium-weathered, and F, G and E2 towers are strongly destroyed. It should be taken into account that the Sacidava fortress is close to this location (Rașova/Dunăreni–Muzait). Using the fort’s published coordinates (≈44.2403 N, 27.8492 E) and site descriptions that place it on the edge of the plateau above the right bank, the ramparts essentially sit at the cliff line. The vertical drop to the Danube is ~50 m, and the horizontal (plan) distance to the present waterline is on the order of a few hundred meters—typically ~300–600 m, varying with the shoreline position and river level (donau-uni.ac.at). Its position is responsible for the damaging processes of the fortress, too.
For all these data, a correlation matrix has been created, Figure 12. The correlation analysis indicates that moisture is the primary driver of the stone and mortar deterioration at Sacidava. Towers with higher humidity levels show significantly increased salt concentrations (r = 0.91), leading to salt crystallization cycles that promote surface roughening and material loss. These areas also display higher L* values, reflecting a visually lighter and more weathered appearance. At the same time, the decrease in b* values suggest fading of the original warm tones, which is consistent with patina erosion and granular disintegration. Overall, the combined effect of humidity-driven salt mobilization and surface bleaching defines the dominant degradation pathway across the fortress walls [].
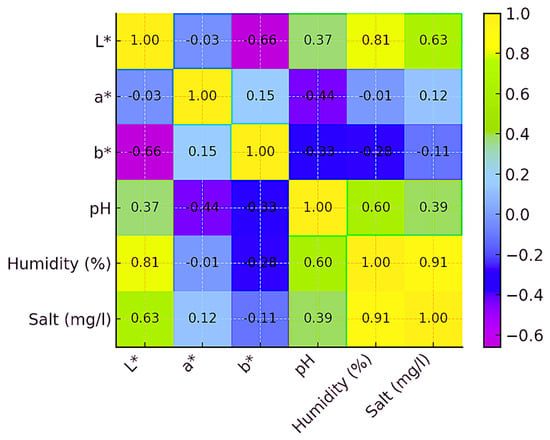
Figure 12.
The correlation matrix created for the weathering factors of the Sacidava fortress.
The matrix measures how strongly two parameters change together, as shown in Table 2.

Table 2.
Meaning of the parameters from the correlation matrix.
So, as stone deteriorates, it loses its natural warm color and becomes pale, bleached, and matte.
Taking into account the data obtained, some statistical techniques, such as principal component analysis (PCA), could be applied. PCA reduces the complexity of large datasets and transforms data (e.g., many chemical or physical measurements) into a new set of uncorrelated variables called principal components (PCs). In cultural heritage, PCA can highlight which environmental factors (humidity, salts, pollutants, freeze–thaw cycles) contribute most to material decay []. In the Sacidava case, PCA helps to identify the main factors in wall deterioration, such as the following: pH, humidity, and salt content, Figure 13.
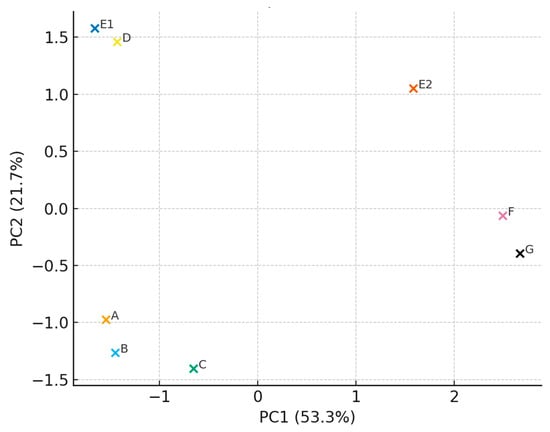
Figure 13.
PCA diagram for Sacidava towers (The “x” symbols show where each tower lands on this map).
The fort’s construction used local limestone and mortar: materials that are susceptible to weathering over time due to environmental factors, such as humidity, temperature fluctuations, and biological colonization. Given its exposure to the elements and historical events, the Roman fortress Sacidava presents an excellent case study for evaluating the relationship between chromatic parameters and weathering.
In the same context, a dendrogram could be created that could reveal the natural groupings of towers with similar surface and environmental profiles; they are visual maps of similarity, helping us to see connections, clusters, and hierarchies among materials, techniques, or environmental factors, Figure 14.
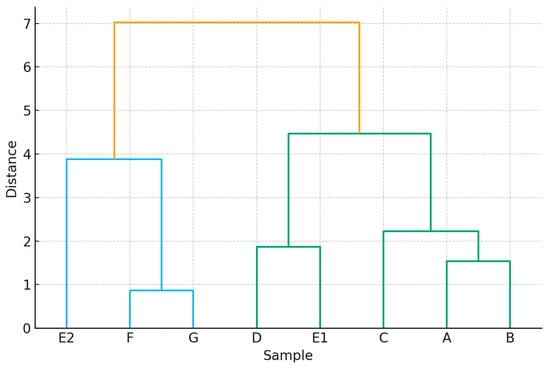
Figure 14.
Dendrogram for the Sacidava towers (The colors in the dendrogram highlight groups (clusters) of samples that behave similarly based on all the variables included in the analysis (colorimetric values, pH, humidity, salts, etc.)).
Most towers lie along the southern wall, directly facing the Danube, where humidity, salts, and temperature changes are strongest. Towers A, B, C, F, and G are part of this vulnerable front, while D and E1, on the western wall, remain more sheltered. The E2 gatehouse, to the east, marks the main entrance and has a distinct structural character. All towers were built with limestone blocks and lime-based mortars, though their preservation varies widely.
The PCA diagram combines surface parameters with environmental factors.
- PC1 (53.3%) separates towers by humidity and salt stress: A and F sit on the negative side, confirming their exposure.
- PC2 (21.7%) reflects treatment success and microstructural stability: C, D, and E1 group near the center, showing balanced conditions, while E2 stands apart as the best preserved.
The principal component analysis (PCA) showed that the first two components captured most of the variation in the data—PC1 explained about 54% and PC2 about 28%, together covering roughly 82% of the total variability. The results suggest that the humidity and salt concentrations are the main factors influencing surface changes, especially through moisture absorption and salt crystallization []. Meanwhile, pH variations appear to play a secondary but important role, likely linked to chemical reactions such as lime dissolution. Overall, the analysis highlights how environmental conditions directly shape the color and surface degradation patterns observed at Sacidava.
The Danube river’s influence remains the key challenge, as the southern towers continue to face moisture, salts, and temperature extremes that drive ongoing decay.
Similar results have been obtained by generating a dendrogram [], Figure 14.
E2, F, and G group on the right side (higher humidity and salt), while A, B, and C cluster together on the left (lower humidity and less salt).
In the dendrogram, two main clusters appear: [(A, B, C) and (D, E1)] with lower humidity/salt, and similarly, L*, a*, b*, and (E2, F, G) with higher humidity/salt, are distinct from the others.
The dendrogram for Sacidava samples shows two main clusters, reflecting clear environmental and material differences across the site. Cluster 1 (E2, F, G) shows the closest similarity, indicating shared conditions characterized by higher humidity and salt crystallization, which are likely linked to their southern or river-facing exposure. In contrast, Cluster 2 (D, E1, C, A, B) represents samples with more stable microclimatic conditions and less surface alteration, corresponding to better-protected interior areas of the fortress. The distinct separation between these clusters confirms the influence of environmental gradients on surface degradation patterns at Sacidava.
3.3. Conservation Assessment (HAp Activity)
In conservation assessment, different materials are used: hydroxyapatite (HAp) or other calcium phosphates, often appearing as clumped, cauliflower-like particles; nanostructured metal oxides (e.g., TiO2, ZnO), which can form aggregates of this type; and activated or functionalized clays or silicates, which exhibit this porous, aggregated structure. Carbon-based materials (e.g., carbon black or biochar), which are common in some carbonaceous aggregates, can look similar. Morphology involves the irregular, globular particles that suggest recrystallized or synthetic mineral phases are often associated with the following: lime-based mortars or plasters, hydroxyapatite-rich coatings (e.g., consolidation with Ca-phosphate solutions), and burnt clays or pozzolanic ash residues, with similar morphologies in volcanic ash or fired ceramics []. If it was possible to identify recycled bricks and other recycled materials in ancient construction (Figure 5) with the initial mortar samples, in the treated mortar samples with HAp, the SEM image shows a relatively homogeneous layer of HAp, and aggregated, irregularly shaped particles with a rough, nodular surface morphology (Figure 15). The specific elemental analyses are shown in Figure 16. The morphology suggests nanostructured or microporous material, with possible sintering or agglomeration effects. The presence of phosphorous indicates the presence of HAp.
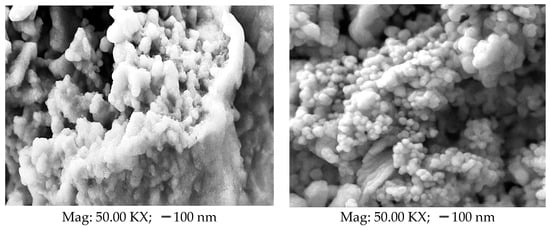
Figure 15.
SEM images of the treated mortar samples.
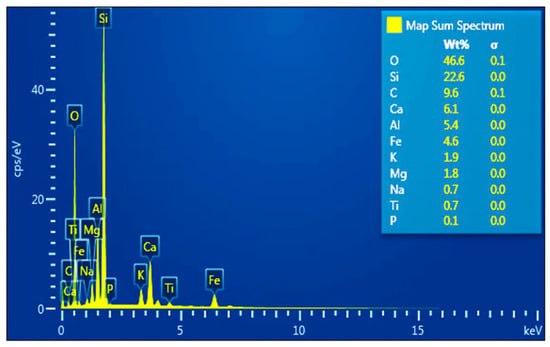
Figure 16.
EDS for treated mortar samples with HAp.
AFM (atomic force microscopy), as a nanoscale investigation technique, is able to evaluate the granular structure and uniformity of HAp deposition. The profilometry of a layer of hydroxyapatite (HAp) applied on a Roman mortar (lime, sand, possibly additions—ceramic fragments, volcanic ash, burnt bones, etc.) has the role of characterizing the morphology, thickness, and roughness of the protective layer. The profilometry (contact) records the variations in height. This technique is good for determining HAp layer thickness and medium roughness []. Hydroxyapatite treatments significantly reduce roughness and close active pores; layers applied in the Roman era (observed at C and G) show a controlled finish, with a microtopography intended for adhesion.
Also, 3D topography is recorded through some maps with height variations, showing how HAp covers sand aggregates, organic fibers, or microcracks in mortar (Figure 17).
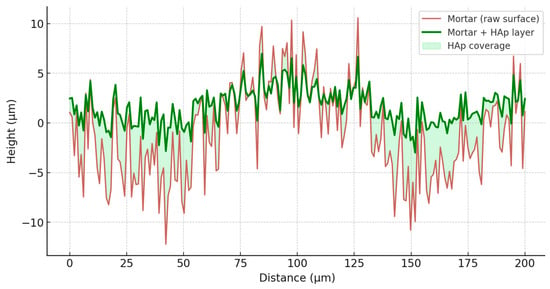
Figure 17.
Cross-section profilometry HAp layer on Roman mortar (Tower D).
The brown line represents the raw Roman mortar, with roughness and depressions. The green line shows the surface after the deposition of the hydroxyapatite layer, which fills the gaps and evens out the relief. The light green area highlights the volume “covered” by the protective layer.
Analyzed parameters have materialized in HAp layer thickness, which is typical between a few micrometers and tens of micrometers, and surface roughness (Ra, Rq, Rz), points out that Ra (arithmetic mean roughness) shows the uniformity of the layer and Rq (quadratic roughness) highlights the roughness. From our experiments, a well-crystallized HAp layer reduces roughness and closes the pores of the mortar.
For the values of the surface roughness, Ra indicates the overall smoothness after applying the treatment, Rq shows whether the surface has marked local defects, and Rz allows the assessment of the adhesion between the water/deposit holding capacity.
For mortar, the values of the roughness (in μm) are Ra = 3.784; Rq = 4.567; Rz = 22.784, while the mortar covered with HAp has the following roughness (in μm): Ra = 1.509; Rq = 1.847; Rz = 9.968. By applying HAp, all the roughness parameters are reduced by half, which implies an improvement in surface fineness, a reduction in marked local defects, and a reduced water/deposit holding capacity.
Analyzing the results obtained, a layer thickness of 2–20 μm and a roughness Ra of 0.5–2 μm (depending on the method and substrate) were found, but also a uniformity of 70%–90% coverage of the mortar surface visible with 3D profilometry. Basically, profilometry provides a three-dimensional “landscape” of the protective layer of HAp and shows whether it can function as an effective barrier against degradation factors (humidity, salts, and pollutants), without compromising the original properties of Roman mortar. The layer is observed as a more uniform surface, which “fills” the depressions and reduces the initial roughness of the mortar.
For the preservation of the Roman mortar, the following aspects were important:
- Reduction in open porosity: Profilometry confirms the “leveling” of microcavities, leading to a better protection against water and salts (Figure 18).
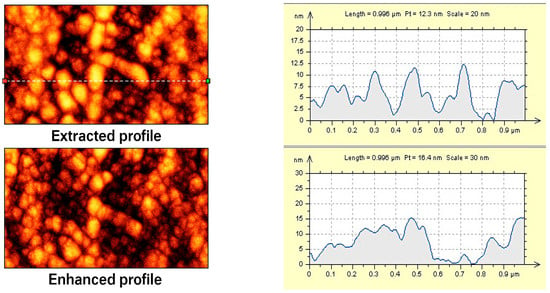 Figure 18. Profilometry (AFM surface topography) of the mortar sample treated with HAp, before and after image enhancement. The left images show the original AFM scan (top) and its enhanced version (bottom), where surface grains and micro-reliefs appear more clearly defined. The dashed line indicates the location of the extracted height profile. The right plots illustrate the corresponding height profiles along this line, highlighting how image enhancement improves the visibility of local peaks and valleys and provides a clearer representation of the material’s nanoscale roughness.
 - Layer compatibility: A thin, uniform HAp layer does not block vapor diffusion, preserving the “breathability” of antique mortar (Figure 19).
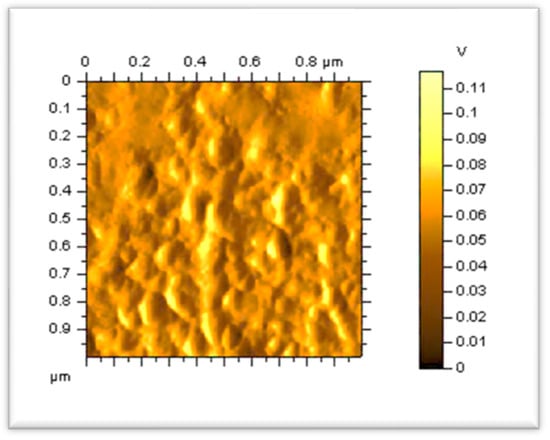 Figure 19. AFM surface topography of the treated mortar surface. The mortar surface shows a homogeneous micro-relief with fine textural variations typical of lime-based matrices. The color scales represent the height distribution, illustrating the difference between the rough, continuous mineral matrix and the discrete HAp deposits.
 - Mechanical stability: The relief analysis highlights possible areas with low adhesion, where the layer is at risk of exfoliating.
The typical result is reduced roughness and the creation of a more uniform but permeable barrier that is compatible with antique mortar, Table 3.

Table 3.
The values of roughness of the non-treated mortar samples.
Hydroxyapatite treatments significantly reduce roughness and close active pores; layers applied in the Roman era (observed at C and G) show a controlled finish, with a microtopography intended for adhesion, in agreement with the other literature reports [,,,].
With treatment with HAp, a reduced surface roughness is observed: a smoother, more compact microrelief than is typical for untreated porous surfaces. This implies that HAp crystals or coatings have filled part of the surface cavities and covered micro voids, leading to a lower amplitude of height variations. Hydroxyapatite tends to precipitate preferentially on alkaline substrates (e.g., lime or calcite), through ion exchange with Ca2+ and PO43− species. The result is a thin, cohesive layer that binds grains and consolidates friable zones, which are visible in the shaded pseudo-CT as smoother, merged areas instead of open pores. By reducing roughness and pore connectivity, the HAp phase enhances bonding between mineral grains, improving both the mechanical strength and resistance to disaggregation under freeze–thaw or salt crystallization cycles [,,,].
At Sacidava, the use of hydroxyapatite (HAp) as a consolidant has shown encouraging results, especially in the Danube’s challenging microclimate, with its constant humidity, salt exposure, and freeze–thaw cycles. Its performance can be understood in several stages:
0–1 month—Initial reaction and bonding: HAp begins to interact with the lime-based substrate. It forms calcium–phosphate bonds and fills microcracks without sealing the surface completely. This early stage strengthens the structure slightly while keeping it breathable. The color and texture remain stable, and the surface roughness (Ra, Rq, Rz) decreases just enough to make the surface more cohesive.
1–6 months—Facing the first wet season: The treated areas start to show better water resistance. Rainwater and salt deposits are less able to penetrate the pores. Efflorescence that appears is usually finer and less destructive than in untreated zones.
6–18 months—Resistance to freeze–thaw and floods: During winter and the Danube floods, the HAp layer remains stable because it is only slightly soluble and has good structural compatibility with the original lime. Microscopy (AFM, CLSM) often shows fewer new cracks and a smoother surface. Salt cycles may still occur, but damage is visibly reduced.
The fortress had a quadrangular shape, reinforced with seven towers—corner and intermediate—built of stone blocks, bound with lime mortar. Over time, each tower suffered different degradations, depending on its position relative to the Danube and exposure to wind, humidity, and salts [].
To understand the microstructural state of the materials, confocal laser scanning microscopy (CLSM) was applied—a method that allows for three-dimensional visualization of surfaces without damaging them, Figure 20.
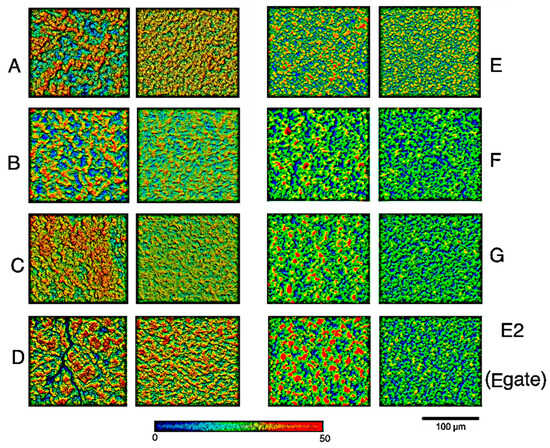
Figure 20.
Confocal images of each tower from the Sacidava fortress (before and after treatment with HAp). The colored scale represents relief height (mm). The letters signify the fortress towers (A–G).
Some microcavities likely remain visible (small local maxima and minima), indicating that the HAp layer does not seal the surface completely: a desirable feature in heritage conservation.
Confocal microscopy highlights how moisture and salt exposure shape each surface.
From the analysis of the images obtained, either for non-treated mortar samples or mortar samples treated with HAp, the following can be noticed:
Tower A—The southeast corner is closest to the Danube and is exposed to large variations in humidity. Confocal microscopy showed an irregular texture, with deep microcracks and pronounced porosity. The average roughness (Ra) was between 12 and 15 µm. After applying the hydroxyapatite consolidant, the surface became uniform, the roughness decreased to 4 µm, and the microcracks were visibly reduced.
Tower B—The south, partially collapsed, was analyzed on interior sections of mortar protected from the elements. Confocal images revealed a compact microstructure, with a uniformly distributed micropore network. The roughness was between 6 and 8 µm: a typical value for mortars with fine sand. The HAp treatment generated a thin film, which was visible in 3D as a shiny, uniform, but fragile film.
Tower C—The southwest was located in an area with good natural drainage; Tower C preserved clear traces of a layer of Roman plaster. Confocal microscopy captured overlapping layers of microrelief, with particles of reddish mineral pigments (probably ochre). The roughness was moderate (Ra ≈ 9 µm). After cleaning and consolidation, the relief remained visible, without the loss of chromatic details.
Tower D—The west, exposed to air currents and freeze–thaw cycles, presents radial microcracks caused by internal stresses. Confocal microscopy allowed the measurement of the crack depth (20–40 µm) and the pore volume. Hydroxyapatite treatment reduced the crack amplitude by ~30%, confirming the mechanical stabilization effect.
Tower E—The northwest is located on the best-preserved side, and 3D confocal images showed a relatively smooth surface, with glossy areas where the consolidant penetrated uniformly. The roughness was reduced from 10 to 3 µm after treatment.
Fine crystals of salts (NaCl) were observed in microcavities, confirming the migration of capillary moisture from the inside of the wall.
Tower F—The north is affected by massive saline deposits, originating from condensation and water infiltration. Confocal microscopy revealed prismatic and acicular crystals (Na2SO4, MgSO4), which are clearly visible through specific light reflections (marked in red). After treatment with an aqueous solution of glass water, the surface became more compact, but active microdeposits persist in the deeper pores.
Tower G—The northeast is the most protected from wind and sun, but suffered stratified micro-debonding of the mortar. Confocal microscopy allowed the observation of delaminations between successive application layers. After consolidation, 3D images show better cohesion between layers and a stabilized texture (Ra ≈ 5 µm). The roughness for mortar samples treated with HAp is shown in Table 4.

Table 4.
The surface roughness of the non-treated mortar samples.
Confocal results for all towers show that the areas directly exposed to the Danube (A, F) are the most affected by humidity and salts and the inner towers (C, D, E) have preserved stable micro-structures, with minor cracks.
At Sacidava, HAp-treated mortars resist frost and salt better than untreated ones, keeping their cohesion and surface integrity. Repeated tests (colorimetry, roughness, capillarity, and pseudo-CT imaging) show more stable surfaces, less cracking, and slower degradation rates.
Over time, Sacidava’s HAp-treated surfaces have proven to be more resistant to weathering, while still allowing the ancient materials to breathe.
3.4. Three-Dimensional Digital Reconstruction
The 3D digital reconstruction of Sacidava was generated based on accurate orthophotos, photogrammetric point clouds, and field measurements. In other words, the orthophotos and photogrammetric data served as the foundation for constructing the 3D model, not the other way around. This integrated approach ensures both architectural accuracy and the ability to visualize structural transformations and weathering patterns over time. To make a correct reconstruction plan, the sizes of each tower were very important, as presented in Table 4.
The location of these towers is mentioned in Figure 21, which was created to reflect the real position of these towers.
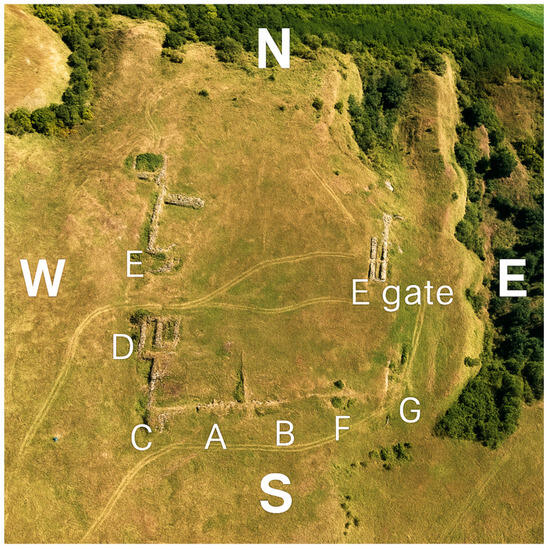
Figure 21.
The position of the Sacidava towers [https://minac.ro/rasova/ (accessed on 7 October 2025) and with permission].
Based on a drone image showing multiple labeled features (A–G and E Gate (E2)), some structural and analytical summary of the towers within the Roman fortress of Sacidava is in Table 5.

Table 5.
Tower-by-tower description (after authors’ personal photos and measurements).
The analysis includes the architectural layout and tower condition, derived from visual cues and the archeological literature.
The 3D digital reconstruction of the Sacidava Roman fortress was developed using a combination of photogrammetric drone surveys, historical plans, and satellite imagery [,,,,]. High-resolution aerial photographs obtained by drone were processed through structure-from-motion (SfM) algorithms to generate accurate digital surface models and orthophotos of the site. These were compared and aligned with georeferenced historical maps and archival sketches to restore the presumed ancient layout of the towers, walls, and gate structures.
We compared three sources—drone photogrammetry, satellite imagery, and historical plans—to quantify the spatial scaling consistency and positional error, Figure 22. Drone models, when constrained with Ground Control Points (GCPs), provide centimeter-level accuracy and serve as the reference frame.
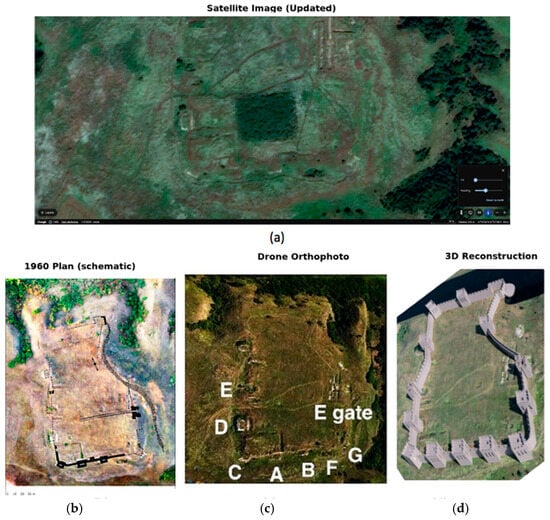
Figure 22.
Comparative visualization of the Sacidava fortress: (a) satellite imagery; (b) the 1960 survey plan, which simplifies the enclosure as rectilinear; (c) drone-based orthophoto; and (d) 3D reconstruction, aligned to terrain.
The drone (GSD = 2.7 cm/px), georeferenced with 7 GCPs, achieved RMSE_2D = 0.045 m.
Satellite imagery registered to the drone yielded RMSE_2D = 0.98 m. RMSE_2D (root mean square error in two dimensions) measures how far the predicted 2D landmark/point positions are from the ground-truth positions, on average. The position of features in a satellite image can vary by about 0.5 to 2 m from their actual location, and depends on image resolution, terrain correction, and the underlying georeferencing model.
At an operational flight altitude for the drone (90 m), as we used in our measurements, the drone-derived photogrammetric model achieves a ground sampling distance (GSD) of approximately 2.7 cm/px. When referenced with ground control points (GCPs), the spatial accuracy is on the order of 3–6 cm in plan (X–Y) and 6–9 cm in elevation (Z). In the absence of GCPs, the absolute positional accuracy is limited by the drone’s GNSS system (global navigation satellite system), which is typically from ±0.5 to ±2.0 m horizontally and ±1.5 to ±3.0 m vertically. GNSS provides positioning, navigation, and time synchronization data on Earth [].
For the 3D digital reconstruction, we started with the eight towers of the Sacidava fortress, strategically placed along the curtain wall (enceinte) at key corners and intervals (~30–40 m apart), which is typical for castra or fortified Roman camps. The corner towers were likely square or rectangular in plan. The intermediate wall towers were semi-projecting or D-shaped for better field visibility and flanking fire. The gate towers, flanking the main gates (e.g., porta praetoria), contain some presumed construction materials. For example, at the core, Opus caementicium (Roman concrete), embedded with local limestone and river stone aggregates, could be observed. At the surface, ashlar blocks or spolia set in lime mortar, with some reused from earlier Dacian or Roman structures, are visible. Different colors could be observed at the blocks’ surface: white and light or dark yellow, Figure 23 and Figure 24.
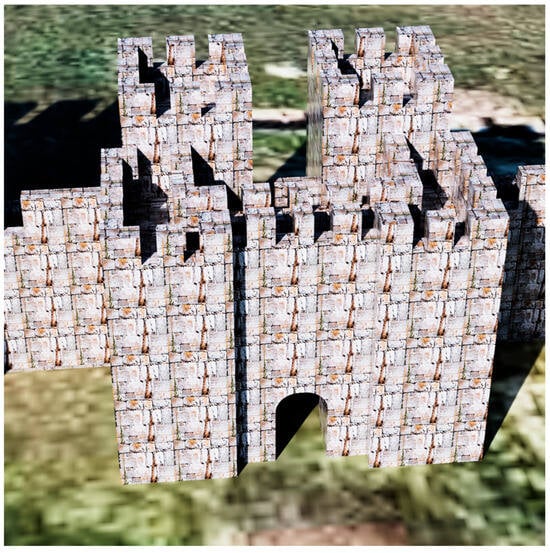
Figure 23.
The block surface, rebuilt with the Fusion 360 program.
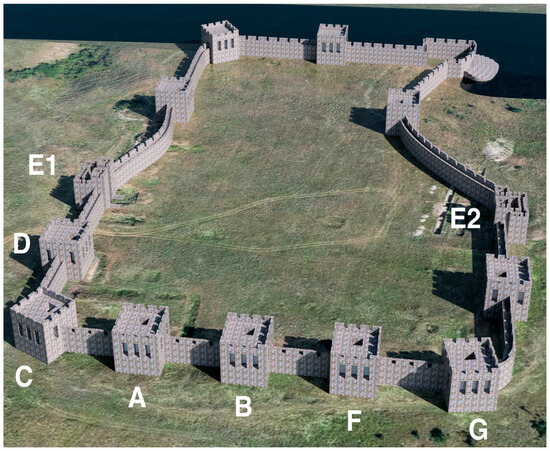
Figure 24.
The whole image of the Sacidava fortress (only the visible towers have been noted, not those underground).
The Fusion 360 reconstruction is well-described, but a schematic workflow figure would enhance readability and clarify the accuracy of spatial scaling and error estimation between drone, satellite, and historical sources [,,,,].
To verify the spatial accuracy and minimize scaling errors between the drone-based, satellite, and historical data sources, the reconstructed site plan was superimposed onto a recent satellite image from Google Earth, as presented in Figure 25, as an example for Tower C of the Sacidava fortress. This overlay confirmed the overall precision of the spatial alignment, highlighting only minor deviations—mainly along the southern curtain wall, where terrain erosion and vegetation have altered the ancient topography. The resulting model provided a reliable geometric foundation for the subsequent structural interpretation, digital elevation mapping, and correlation with archaeometric analyses (e.g., surface roughness and environmental parameters).
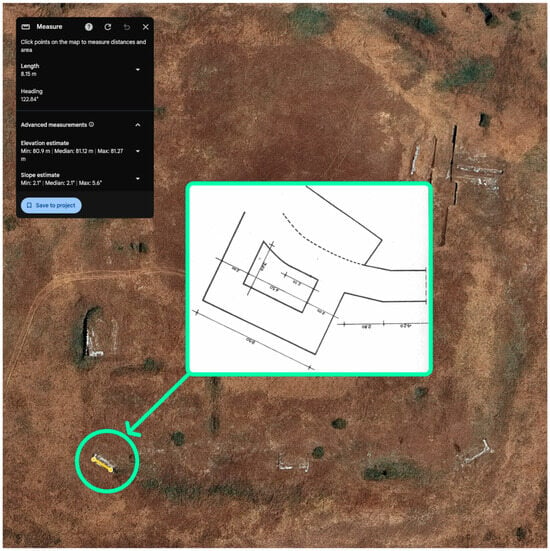
Figure 25.
The reconstructed site plan superimposed onto a recent satellite image from Google Earth.
To elucidate the stone texture, the colored stones could be visualized and sent to be investigated, Figure 26. At first glance, the yellow coloration observed on the surface might appear to result from microbial growth. However, when fragments of stone detached from the fortress were analyzed, it became evident that these color variations also occur within the stone itself.
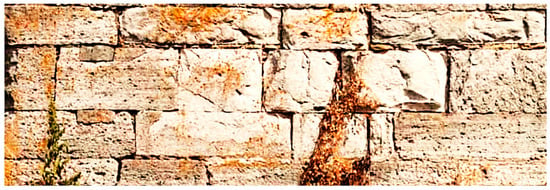
Figure 26.
The sample stone from the Sacidava fortress.
Overall, the analyzed material appears to be heterogeneous, containing angular particles and possible fibrous phases. This composition could include quartz, calcium silicate hydrates (CSH), clay minerals such as illite, and iron oxides, as previously confirmed through WXRF, EDS, and XRD analyses []. The orange-brown region visible at the center likely represents a fired clay or iron-rich inclusion: possibly a fragment of ceramic grog (crushed brick or pottery) or an iron-altered domain. Its porous and uneven texture suggests a thermally transformed phase, which is indicative of past high-temperature exposure.
The white to creamy areas, visible at the bottom and upper left, likely represent calcite grains or small lime nodules. Their fine texture and carbonate-rich composition are typical of such materials. In some spots, these regions might also include traces of quartz or feldspar—especially if they originate from a ceramic or mineral matrix.
The matrix, forming the light orange-pinkish background, consists of a fine-grained mixture, which is most likely a lime-based binder or fine clay matrix, enriched with iron oxides that impart warm coloration.
Dark inclusions, which are randomly distributed across the sample, may correspond to voids, carbonaceous residues, or fine mineral inclusions. These could also represent incipient salt deposition zones or iron-rich nodules. Elemental analysis reveals an iron concentration of approximately 3% in the white area and 0.7% in the red zone.
Overall, the sample appears to be a historic mortar or plaster fragment, likely composed of a lime binder mixed with ceramic or sand inclusions, recycled grog particles, and lime nodules. Signs of environmental degradation—such as chloride-salt exposure—are evident, particularly where calcite grains show alteration that is consistent with salt crystallization and moisture cycles.
The background matrix, pale cream-beige and semi-translucent, further supports the presence of a carbonate-rich binder, such as lime (CaCO3), which is typical of ancient mortars and plasters. The orange-red inclusions are attributed to iron oxides—hematite (Fe2O3) and goethite (FeOOH)—originating from burnt or weathered clays. These inclusions are fine-grained, irregularly shaped, and commonly observed in archeological building materials.
The gray granular spots correspond to quartz, feldspar, or other rock fragments, interpreted as aggregate or detrital minerals. They exhibit amorphous to granular textures that are often angular and typical of sand grains or ceramic debris. The pale fibrous or plate-like features likely reflect calcite cleavage planes or traces of mica and other phyllosilicates.
Finally, the small dark grains, rich in iron, suggest micro-inclusions from clay impurities or remnants of thermal alteration. The blackened areas are associated with organic matter, moisture retention, and salt crystallization zones, which often promote microbial colonization. Over time, these biological and environmental processes can form black crusts: a common signature of pollution and salt weathering cycles on ancient mortars and plasters.
The 3D reconstruction, combined with CIELab colorimetry and microstructural analysis, highlights both structural transformations (loss of masonry courses, detachment of facing blocks, wall deformation, and localized collapse) and weathering patterns (salt-related surface bleaching, dust-driven yellowing, biological patina in shaded areas, and micro-cracking due to granular disintegration) that have evolved progressively over time.
4. Conclusions
The main scientific and practical findings of these studies are very important for this area, and clarified many aspects about Sacidava Fortress (Romania), as follows:
- ○
- 3D digital reconstruction of Sacidava (the first complete model of the site) enabled precise architectural documentation and visualization of structural and environmental risks.
- ○
- Archaeometric analyses (SEM-EDS, AFM, CLSM, and pseudo-CT) identified a heterogeneous microstructure, composed of phyllosilicates, ash residues, and secondary reaction products such as carbonates and silica gels, with a high degree of destruction.
- ○
- Hydroxyapatite (HAp) treatment demonstrated high compatibility with lime-based substrates, improving cohesion and maintaining the historical materials’ visual and chemical authenticity.
- ○
- Surface roughness parameters (Ra, Rq, Rz) decreased significantly after HAp application, confirming smoother topographies and reduced micro-defects in treated areas.
- ○
- Pore sealing and densification were observed through pseudo-CT and CLSM imaging, indicating enhanced compactness and reduced capillary water uptake. The breathability completed these data.
- ○
- Multivariate analyses (PCA and dendrogram) revealed correlations between degradation intensity and environmental parameters (humidity, pH, and salt content), distinguishing exposed towers (E2–F–G) from more stable zones (A–B-C–D–E1).
- ○
- Colorimetric data (CIELab) provided a non-destructive diagnostic tool, linking chromatic changes with microstructural and environmental factors.
The integrated workflow establishes a replicable and sustainable conservation protocol, combining analytical, digital, and material-science approaches for Roman and other archeological architectures.
Author Contributions
Conceptualization, R.-M.I. and S.M.C.; methodology, R.-M.I.; software, E.-V.B. and A.M.; validation, R.-M.I.; formal analysis, R.-M.I.; investigation, R.-M.I., S.M.C., E.-V.B. and A.M.; resources, R.-M.I.; data curation, R.-M.I.; writing—original draft preparation, R.-M.I.; writing—review and editing, R.-M.I., E.-V.B. and A.M.; visualization, R.-M.I.; supervision, R.-M.I.; project administration, R.-M.I.; funding acquisition, R.-M.I. All authors have read and agreed to the published version of the manuscript.
Funding
This work was supported by a grant from the Romanian Ministry of Education and Research, National Authority for Scientific Research (ANC), Nucleu project PN 23.06.02.01—InteGral.
Institutional Review Board Statement
Not applicable.
Informed Consent Statement
Not applicable.
Data Availability Statement
Data are unavailable due to privacy restrictions.
Acknowledgments
During the preparation of this revised manuscript, the authors did not use AI. The authors have reviewed and edited the output and take full responsibility for the content of this publication.
Conflicts of Interest
The authors declare no conflicts of interest.
References
- Moropoulou, A.; Bakolas, A.; Anagnostopoulou, S. Composite materials in ancient structures. Cem. Concr. Compos. 2005, 27, 295–300. [Google Scholar] [CrossRef]
- Medeghini, L.; Calzolari, L.; Botticelli, M.; Di Fazio, M.; De Vito, C.; Pettiti, I.; Bardelli, F.; Mignardi, S. The secret of ancient Roman hydraulic mortar: The lesson learnt from the past for future cements. Cem. Concr. Compos. 2024, 148, 105484. [Google Scholar] [CrossRef]
- Rhodes, C. Roman Concrete for Durable, Eco-Friendly Construction—Applications for Tidal Power Generation, and Protection against Sea Level Rise. Sci. Prog. 2018, 101, 83–91. [Google Scholar] [CrossRef]
- Quagliarini, E.; Sparvoli, G.; Ferreira, T.M.; Bernardini, G. Integrating Physical Vulnerability and Exposure with User Factors in Flood Risk Assessment and Mitigation for Historic Built Environments. In Envisioning the Futures—Designing and Building for People and the Environment. Colloqui.AT.e 2025; Lecture Notes in Civil Engineering; Albatici, R., Dalprà, M., Gatti, M.P., Maracchini, G., Torresin, S., Eds.; Springer: Cham, Switzerland, 2025; Volume 765. [Google Scholar] [CrossRef]
- Scorpan, C. Results of the archaeological excavations at Sacidava. Pontica 1977, 10, 229–251. [Google Scholar]
- Ion, R.-M.; Iancu, L.; Grigorescu, R.M.; Colesniuc, S.M.; Schroder, V.; Trandafir, R.A.; Ionita, S.; Gheboianu, A.I.; Slamnoiu-Teodorescu, S. Diagnosis, Photogrammetry and Conservation Treatment with Nanomaterials of Sacidava Fortress. Chem. Proc. 2023, 13, 25. [Google Scholar] [CrossRef]
- Hermon, S.; Kalisperis, L. Between the Real and the Virtual: 3D visualization in the Cultural Heritage domain—Expectations and prospects. Virtual Archaeol. Rev. 2011, 2, 59. [Google Scholar] [CrossRef]
- Pieraccini, M.; Guidi, G.; Atzeni, C. 3D Digitizing of Cultural Heritage. J. Cult. Herit. 2001, 2, 63–70. [Google Scholar] [CrossRef]
- Maté-González, M.Á.; Di Pietra, V.; Piras, M. Evaluation of Different LiDAR Technologies for the Documentation of Forgotten Cultural Heritage under Forest Environments. Sensors 2022, 22, 6314. [Google Scholar] [CrossRef]
- Ion, R.M.; Gurgu, V.; Bucurica, A.I.; Teodorescu, S.; Dulama, I.D.; Stirbescu, R.M.; Gheboianu, A.I. Digital Scanning and Non-destructive Techniques for Size Recovering and Rehabilitating the Structural Performance of Traditional Stuccoes. In VR Technologies in Cultural Heritage. VRTCH 2018; Communications in Computer and Information Science; Duguleană, M., Carrozzino, M., Gams, M., Tanea, I., Eds.; Springer: Cham, Switzerland, 2019; Volume 904. [Google Scholar] [CrossRef]
- Guidi, G.; Remondino, F.; Russo, M.; Menna, F.; Rizzi, A.; Ercoli, S. A Multi-Resolution methodology for the 3D modeling of large and complex archaeological areas. Int. J. Archit. Comput. 2009, 7, 39–55. [Google Scholar]
- El-Hakim, S.F.; Beraldin, J.A.; Picard, M.; Godin, G. Detailed 3D reconstruction of large-scale heritage sites with integrated techniques. IEEE Comput. Graph. Appl. 2004, 23, 21–29. [Google Scholar] [CrossRef]
- Columbu, S.; Palomba, M.; Sitzia, F.; Murgia, M.R. Geochemical, mineral-petrographic and physical-mechanical characterization of stones and mortars from the Romanesque Saccargia Basilica (Sardinia, Italy) to define their origin and alteration. Ital. J. Geosci. 2018, 137, 369–695. [Google Scholar] [CrossRef]
- Puertas, F.; Blanco-Varela, M.T.; Palomo, A.; Ortega-Calvo, J.J.; Ariño, X.; Saiz-Jimenez, C. Decay of Roman and repair mortars in mosaics from Italica, Spain. Sci. Total Environ. 1994, 153, 123–131. [Google Scholar] [CrossRef]
- Rosvall, J. (Ed.) Air Pollution and Conservation: Safeguarding Our Architectural Heritage; Elsevier Technical Press: New York, NY, USA, 1988. [Google Scholar]
- Laurie, A.P.; Milne, J. The Evaporation of Water and Salt Solutions from Surfaces of Stone, Brick and Mortar. Proc. R. Soc. Edinb. 1926, 47, 52–69. [Google Scholar] [CrossRef]
- Morton, J.; Richardson, B.; de Vekey, R.C. Deterioration of materials. In The Maintenance of Brick and Stone Masonry Structures; Sowden, A.M., Ed.; E & F SPON: New York, NY, USA, 1990; pp. 117–139. [Google Scholar]
- Collepardi, M. Degradation and Restoration of Masonry Walls of Historic Buildings. Mater. Struct. 1990, 23, 81–102. [Google Scholar] [CrossRef]
- De Laine, J. Production, Transport and On-Site Organisation of Roman Mortars and Plasters. Archaeol. Anthropol. Sci. 2021, 13, 195. [Google Scholar] [CrossRef]
- Coutelas, A. The Selection and Use of Lime Mortars on the Building Sites of Roman Gaul. Comm. Hum. Litt. 2011, 128, 139–151. [Google Scholar]
- Brandon, C.J.; Hohlfelder, R.L.; Jackson, M.D.; Oleson, J.P. Building for Eternity. In The History and Technology of Roman Concrete Engineering in the Sea; Oxbow Press: Oxford, UK, 2015. [Google Scholar]
- Secco, M.; Asscher, Y.; Ricci, G.; Tamburini, S.; Preto, N.; Sharvit, J.; Artioli, G. Cementation Processes of Roman Pozzolanic Binders from Caesarea Maritima (Israel). Const. Build. Mat. 2022, 355, 129128. [Google Scholar] [CrossRef]
- Alexandrescu, C.G. Roman funerary stelai from Moesia inferior and their reuse as building material: The Sacidava case. Pontica 2022, 55, 433–449. [Google Scholar]
- Aricescu, A. Quelques precisions sur la carte. Scinthia Minor. Dacia N.S. XlV 1970, 292, 298–309. [Google Scholar]
- Popescu, F.M. The Roman Army in Moesia Inferior; Conphys Publishing House: Râmnicu Vâlcea, Romania, 2010. [Google Scholar]
- Buchsenschultz, O. L’histoire vue du ciel: Archéologie aérienne en Roumanie. Nouv. L’archéologie 1987, 26, 102–104. [Google Scholar]
- Colesniuc, S.M.; Cliante, T.; Potârniche, T.; Mototolea, A.; Stanc, S.M. Cercetări Arheologice Sistematice în Așezarea Romană Fortificată Sacidava, punct Dealul Muzait, loc. Dunăreni, com. Aliman, jud. Constanța, în Cronica Cercetărilor Arheo-logice din România. Campania 2020, București, 2021; p. 84. Available online: https://biblioteca-digitala.ro/reviste/carte/cronica-cercetarilor-arheologice-campania_2020.pdf (accessed on 7 October 2025).
- Ion, R.-M.; Gurgu, V.; Alin Bucurica, I.; Teodorescu, S.; Ion, M.-L.; Postolache, D.; Darida, I. 3D-Reconstruction of the Complex Stuccoes from Patrimony Buildings. Digit. Present. Preserv. Cult. Sci. Herit. 2017, 7, 107–112. [Google Scholar] [CrossRef]
- Remondino, F. Heritage Recording and 3D Modeling with Photogrammetry and 3D Scanning. Remote Sens. 2011, 3, 1104–1138. [Google Scholar] [CrossRef]
- Binda, L.; Saisi, A.; Tiraboschi, C. Investigation procedures for the diagnosis of historic masonries. Constr. Build. Mater. 2000, 14, 199–233. [Google Scholar] [CrossRef]
- Middendorf, B.; Hughes, J.J.; Callebaut, K.; Baronio, G.; Papayianni, I. Investigative methods for the characterisation of historic mortars—Part 1: Mineralogical characterisation. Mater. Struct. Constr. 2005, 38, 761–769. [Google Scholar] [CrossRef]
- Rispoli, C. Ancient roman mortars: Mix design, mineralogical composition and minerogenetic secondary processes. PLINIUS 2017, 43, 93–100. [Google Scholar] [CrossRef]
- Divya Rani, S.; Rahul, A.V.; Santhanam, M. A multi-analytical approach for pore structure assessment in historic lime mortars. Constr. Build. Mater. 2021, 272, 121905. [Google Scholar] [CrossRef]
- Cardell, C.; Yebra, A.; Van Grieken, R.E. Applying digital image processing to SEM-EDX and BSE images to determine and quantify porosity and salts with depth in porous media. Microchim. Acta 2002, 140, 9–14. [Google Scholar] [CrossRef]
- Pawley, J.B. (Ed.) Handbook of Biological Confocal Microscopy, 3rd ed.; Springer: Berlin/Heidelberg, Germany, 2006; ISBN 0-387-25921-X. [Google Scholar]
- Peterson, D.A. Confocal Microscopy. In Encyclopedia of Movement Disorders; Kompoliti, K., Metman, L.V., Eds.; Academic Press: Cambridge, MA, USA, 2010; pp. 250–252. [Google Scholar] [CrossRef]
- Mironova, A.; Robache, F.; Deltombe, R.; Guibert, R.; Nys, L.; Bigerelle, M. Digital Cultural Heritage Preservation in Art Painting: A Surface Roughness Approach to the Brush Strokes. Sensors 2020, 20, 6269. [Google Scholar] [CrossRef]
- Gomez-Villalba, L.S.; Salcines, C.; Fort, R. Application of Inorganic Nanomaterials in Cultural Heritage Conservation, Risk of Toxicity, and Preventive Measures. Nanomaterials 2023, 13, 1454. [Google Scholar] [CrossRef]
- Sassoni, E. Hydroxyapatite and Other Calcium Phosphates for the Conservation of Cultural Heritage: A Review. Materials 2018, 11, 557. [Google Scholar] [CrossRef]
- David, M.E.; Ion, R.-M.; Grigorescu, R.M.; Iancu, L.; Andrei, E.R. Nanomaterials Used in Conservation and Restoration of Cultural Heritage: An Up-to-Date Overview. Materials 2020, 13, 2064. [Google Scholar] [CrossRef]
- Götz, P.; Melamed, D.; Bohling, H.; Brovkina, C.; Hussain, I.; Reims, N.; Junge, L.; Hoffmann, D.; Wiskandt, C.; Schilling, R.; et al. Embedding of X-ray computed tomography data of cultural heritage objects in interactive web applications—Old technical instruments brought back to novel virtual life. J. Cult. Herit. 2025, 76, 100–110. [Google Scholar] [CrossRef]
- Vera-Olmos, J.; Torrado-Carvajal, A.; Prieto-de-la-Lastra, C.; Catalano, O.A.; Rozenholc, Y.; Mazzeo, F.; Soricelli, A.; Salvatore, M.; Izquierdo-Garcia, D.; Malpica, N. How to Pseudo-CT: A Comparative Review of Deep Convolutional Neural Network Architectures for CT Synthesis. Appl. Sci. 2022, 12, 11600. [Google Scholar] [CrossRef]
- Kak, C.; Slaney, M. Principles of Computerized Tomographic Imaging; The Institute of Electrical and Electronics Engineers, Inc.: New York, NY, USA, 1999; p. 119. [Google Scholar]
- Seletchi, E.D.; Duliu, O.G. Image processing and data analysis in computed tomography. Rom. J. Phys. 2007, 52, 667–675. [Google Scholar]
- Abramoff, M.D.; Magalhaes, P.J.; Ram, S.J. Image processing with ImageJ. Biophotonics Int. 2004, 11, 36–42. [Google Scholar]
- ISO/CIE 11664-2:2022; Colorimetry—Part 2: CIE Standard Illuminants. ISO: Geneva, Switzerland, 2006.
- Available online: https://www.geeksforgeeks.org/data-analysis/principal-component-analysis-pca/ (accessed on 1 September 2025).
- Ruffolo, S.A.; Comite, V.; La Russa, M.F.; Belfiore, C.M.; Barca, D.; Bonazza, A.; Crisci, G.M.; Pezzino, A.; Sabbioni, C. An analysis of the black crusts from the Seville Cathedral: A challenge to deepen the understanding of the relationships among microstructure, microchemical features and pollution sources. Sci. Total Environ. 2015, 502, 157–166. [Google Scholar] [CrossRef]
- CEN EN 1015-18:2002(MAIN); Methods of Test for Mortar for Masonry—Part 18: Determination of Water Absorption Coefficient due to Capillary Action of Hardened Mortar. iTeh, Inc.: Newark, DE, USA, 2002.
- Scorpan, C. Limes Scythiae: Topographical and Stratigraphical Research on the Late Roman Fortifications on the Lower Danube; Biblioteca Academiei: Bucharest, Romania, 1980; Volume 88, 219p. [Google Scholar]
- Ion, R.-M.; Doncea, S.-M.; Ţurcanu-Caruțiu, D. Nanotechnologies in Cultural Heritage—Materials and Instruments for Diagnosis and Treatment; InTech: Vienna, Austria, 2018. [Google Scholar] [CrossRef]
- Colesniuc, S.M.; Potârniche, T.; Mototolea, A.; Cliante, T.; Stanc, S.M. Intramuros Archaeological Research at Sacidava. Preliminary Information. In ArheoVest. Interdisciplinaritate în Arheologie, nr. VIII; JATEPress Kiadó: Szeged, Hungary, 2020. [Google Scholar]
- Ion, R.M.; Colesniuc, S.M.; Schröder, V.; Ioniţă, S.; Trandafir, R.A. Structural/Compositional Identification of Materials from Sacidava Fortress. Învăţământ Cercetare Creaţie 2024, X, 171–182. [Google Scholar]
- Casadio, F.; Chiari, G.; Simon, S. Evaluation of binder/aggregate ratios in archaeological lime mortars with carbonate aggregate: A comparative assessment of chemical, mechanical and microscopic approaches. Archaeometry 2005, 47, 671–689. [Google Scholar] [CrossRef]
- Kirk, R.E. Experimental Design: Procedures for The Behavioral Sciences, 3rd ed.; Brooks/Cole: Pacific Grove, CA, USA, 1995. [Google Scholar]
- Lascu, M.F. Scythia Minor and consequences of the breakup of the danubian limes. Rev. Română De Stud. Eurasiatice 2016, 12, 15–30. [Google Scholar]
- Pozo-Antonio, J.S.; Pereira, M.F.C.; Rocha, C.S.A. Microscopic characterisation of black crusts on different substrates. Sci. Total Environ. 2017, 584, 291–306. [Google Scholar] [CrossRef]
- Elsen, J. Microscopy of historic mortars—A review. Cem. Concr. Res. 2006, 36, 1416–1424. [Google Scholar] [CrossRef]
- Portilla Mendoza, K.; Pinzón-Núñez, D.; Moreno-González, L.; Mier-Umaña, R.; Rios, C.; Henao Martínez, J. Archaeometry study of the mineral and chemical composition of pre-Hispanic pottery from “Los Teres”, Mesa de Los Santos (Colombia). Memorias 2020, 42, 7–43. [Google Scholar] [CrossRef]
- Huseien, G.F.; Joudah, Z.H.; Baghban, M.H.; A. Khalid, N.H.; Faridmehr, I.; Dong, K.; Li, Y.; Gu, X. Sustainability of Recycling Waste Ceramic Tiles in the Green Concrete Industry: A Comprehensive Review. Buildings 2025, 15, 2406. [Google Scholar] [CrossRef]
- Moropoulou, A.; Bakolas, A.; Bisbikou, K. Physico-chemical adhesion and cohesion bonds in joint mortars imparting durability to the historic structures. Constr. Build. Mater. 2000, 14, 35–46. [Google Scholar] [CrossRef]
- Ontiveros-Ortega, E.; Rodríguez-Gutierrez, O.; Navarro, A.D. Mineralogical and physical-chemical characterisation of Roman mortars used for monumental substructures on the Hill of San Antonio, in the Roman city of Italica (prov. Baetica, Santiponce, Seville, Spain). J. Archaeol. Sci. Rep. 2016, 7, 205–223. [Google Scholar] [CrossRef]
- Almaviva, S.; Lecci, S.; Puiu, A.; Spizzichino, V.; Fantoni, R.; Falconieri, M.; Gagliardi, S.; Chiari, M.; Mazzinghi, A.; Ruberto, C.; et al. Raman/XRF/EDX microanalysis of 2nd-century stuccoes from domus valeriorum in Rome. J. Cult. Herit. 2019, 37, 225–232. [Google Scholar] [CrossRef]
- Genestar, C.; Pons, C.; Mas, A. Analytical characterisation of ancient mortars from the archaeological Roman city of Pollentia (Balearic Islands, Spain). Anal. Chim. Acta 2006, 557, 373–379. [Google Scholar] [CrossRef]
- Dorscheid, J.; Bossema, F.; van duin, P.; van Liere, R.; Di Stefano, G.P. Looking under the skin: Multi-scale CT scanning of a peculiarly constructed cornett in the Rijksmuseum. Herit. Sci. 2022, 10, 161. [Google Scholar] [CrossRef]
- Dambrogio, J.; Ghassaei, A.; Smith, D.S.; Jackson, H.; Demaine, M.L.; Davis, G.; Mills, D.; Ahrendt, R.; Akkerman, N.; van der Linden, D.; et al. Unlocking history through automated virtual unfolding of sealed documents imaged by X-ray microtomography. Nat. Commun. 2021, 12, 1184. [Google Scholar] [CrossRef] [PubMed]
- Schneider, C.A.; Rasband, W.S.; Eliceiri, K.W. NIH Image to ImageJ: 25 years of image analysis. Nat. Methods 2012, 9, 671–675. [Google Scholar] [CrossRef] [PubMed]
- Freeman, A.; Doutre, M.; Bevan, G.; Murray, A. Craquelure Documentation and Analysis: A Preliminary Process Using Reflectance Transformation Imaging and ImageJ. In Proceedings of the ANAGPIC 2013, Los Angeles, CA, USA, 26 April 2013; 13p. [Google Scholar]
- Artioli, G.; Secco, M.; Addi, A. The Vitruvian legacy: Mortars and binders before and after the Roman world. EMU Notes Mineral. 2019, 20, 151–202. [Google Scholar]
- Ortiz, R.; Ortiz, P.; Vázquez, M.A.; Martín, J.M. Integration of georeferenced informed system and digital image analysis to assess the effect of cars pollution on historical buildings. Constr. Build. Mater. 2017, 139, 320–333. [Google Scholar] [CrossRef]
- Fried, P.; Woodward, J.; Brown, D.; Harvell, D.; Hanken, J. 3D scanning of antique glass by combining photography and computed tomography. Digit. Appl. Archaeol. Cult. Herit. 2020, 18, e00147. [Google Scholar] [CrossRef]
- Figueiredo, E.; Silva, R.; Araujo, F.; Fernandes, F. Multifocus Optical Microscopy Applied to the Study of Archaeological Metals. Microsc. Anal. 2013, 19, 1248–1254. [Google Scholar] [CrossRef] [PubMed]
- Brocken, H.J.P.; Adant, O.C.G.; Pel, L. Moisture transport properties of mortar and mortar joint: A NMR study. Heron 1997, 42, 55–69. [Google Scholar]
- Schild, L.; Weiser, L.; Höger, K.; Lanza, G. Analyzing the error of Computed Tomography-based pore detection by using microscope images of matched cross-sections. Precis. Eng. 2023, 81, 192–206. [Google Scholar] [CrossRef]
- Skoulikidis, T.; Papakonstantinou-Ziotis, P. Mechanism of sulphation by atmospheric SO2 of the limestones and marbles of the ancient monuments and statues: I. observations in situ (Acropolis) and laboratory measurements. Br. Corros. J. 1981, 16, 63–69. [Google Scholar] [CrossRef]
- Sanjurjo-Sánchez, J.; Trindade, M.J.; Blanco-Rotea, R.; Benavides Garcia, R.; Fernández Mosquera, D.; Burbidge, C.; Prudêncio, M.I.; Dias, M.I. Chemical and mineralogical characterization of historic mortars from the Santa Eulalia de Bóveda temple, NW Spain. J. Archaeol. Sci. 2010, 37, 2346–2351. [Google Scholar] [CrossRef]
- Borsoi, G.; Santos Silva, P.; Menezes, A.; Candeias, A.; Mirão, J. Analytical characterization of ancient mortars from the archaeological roman site of Pisões (Beja, Portugal). Constr. Build. Mater. 2019, 204, 597–608. [Google Scholar] [CrossRef]
- Malaga-Starzec, K.; Panas, I.; Lindqvist, J.E.; Lindqvist, O. Efflorescence on thin sections of calcareous stones. J. Cult. Herit. 2003, 4, 313–318. [Google Scholar] [CrossRef]
- Iticescu, C.; Georgescu, L.P.; Topa, C.M. Assessing the Danube water quality index in the city of Galati, Romania. Carpath. J. Earth Environ. Sci. 2013, 8, 155–164. [Google Scholar]
- Available online: https://www.accuweather.com/en/ro/rasova/283386/hourly-weather-forecast/283386 (accessed on 25 September 2025).
- Maravelaki-Kalaitzaki, P. Black crusts and patinas on Pentelic marble from the Parthenon and Erechtheum (Acropolis, Athens): Characterization and origin. Anal. Chim. Acta 2005, 532, 187–198. [Google Scholar] [CrossRef]
- Mengis, N.; Keller, D.P.; Oschlies, A. Systematic Correlation Matrix Evaluation (SCoMaE)—A bottom–up, science-led approach to identifying indicators. Earth Syst. Dyn. 2018, 9, 15–31. [Google Scholar] [CrossRef]
- Sonar, C.; Al-Hammadi, A.; Padme, Y. Water Quality Assessment Using Principal Component Analysis. In Intelligent Computing and Big Data Analytics; Springer Nature: Cham, Switzerland, 2024. [Google Scholar] [CrossRef]
- Fraino, P.E. Using principal component analysis to explore multi-variable relationships. Nat. Rev. Earth Environ. 2023, 4, 294. [Google Scholar] [CrossRef]
- Amao, A.O.; Al-Ramadan, K.; Kaminski, M.; Frontalini, F. Benthic foraminiferal diversity in the Arabian Gulf: Spatial patterns in a basin-wide assessment. PLoS ONE 2025, 20, e0327033. [Google Scholar] [CrossRef]
- Marchenko, E.S.; Dubovikov, K.M.; Baigonakova, G.A.; Gordienko, I.I.; Volinsky, A.A. Surface Structure and Properties of Hydroxyapatite Coatings on NiTi Substrates. Coatings 2023, 13, 722. [Google Scholar] [CrossRef]
- Carcagnì, P.; Daffara, C.; Gambino, M.; Mastroianni, M.; Mazzotta, C.; Pampaloni, E.; Pezzati, L. Optical micro-profilometry for archaeology. Proc. SPIE 2005, 5857, 58570F. [Google Scholar] [CrossRef]
- Le Quellec, J.-L.; Duquesnoy, F.; Defrasne, C. Digital Image Enhancement with D-Stretch®; Is Complexity Always Necessary for Efficiency? Digit. Appl. Archaeol. Cult. Herit. 2015, 2, 55–67. [Google Scholar]
- Akçam Ergin, İ.D. Digital approach in conservation of heritage: 3D virtual reconstruction applications in ancient cities. J. Archit. Sci. Appl. 2023, 8, 969–987. [Google Scholar] [CrossRef]
- Bianconi, F.; Filippucci, M.; Cornacchini, F.; Meschini, M.; Mommi, C. Cultural Heritage and Virtual Reality: Application for Visualization of Historical 3D Reproduction. The International Archives of the Photogrammetry. Remote Sens. Spat. Inf. Sci. 2023, 48, 203–210. [Google Scholar]
- Butnariu, S.; Gîrbacia, F.; Orman, A. Methodology for 3D reconstruction of objects for teaching virtual restoration. Virtual Learn. 2012, 46, 16–21. [Google Scholar]
- Guidi, G.; Russo, M.; Angheleddu, D. 3D survey and virtual reconstruction of archeological sites. Digit. Appl. Archaeol. Cult. Herit. 2014, 1, 55–69. [Google Scholar] [CrossRef]
- Pietroni, E.; Ferdani, D. Virtual restoration and virtual reconstruction in cultural heritage: Terminology, methodologies, visual representation techniques and cognitive models. Information 2021, 12, 167. [Google Scholar] [CrossRef]
- Portalés, C.; Alonso-Monasterio, P.; Viñals, M.J. 3D virtual reconstruction and visualisation of the archaeological site Castellet de Bernabé (Llíria, Spain). Virtual Archaeol. Rev. 2017, 8, 72–85. [Google Scholar]
- Quattrini, R.; Pierdicca, R.; Frontoni, E.; Barcaglioni, R. Virtual reconstruction of lost architectures: From the TLS survey to AR visualization. Int. Arch. Photogramm. Remote Sens. Spat. Inf. Sci. 2016, 41, 383–390. [Google Scholar] [CrossRef]
- Reilly, P. Towards a virtual archaeology. In Computer Applications in Archaeology; British Archaeological Reports: Oxford, UK, 1990; pp. 133–139. [Google Scholar]
- Remondino, F.; El-Hakim, S. Image-based 3D modeling: A review. Photogramm. Rec. 2006, 21, 269–291. [Google Scholar] [CrossRef]
- Chellini, G.; Baiocchi, E.; Malatesta, S.G.; Caruso, M.; La Torre, P.; Rosati, P.; Lucatelli, S.; Leopardi, L.; Manzollino, R. The virtual reconstruction of Cervara di Roma fortress: Methods and tools for the dissemination of the past. Acta IMEKO 2024, 13, 1–6. [Google Scholar] [CrossRef]
- Di Mascio, D.; Chiuini, M.; Fillwalk, J.; Pauwels, P. 3D Digital Reconstructions of Lost Buildings, A first critical framing. In Proceedings of the 34th International Conference on Education and Research in Computer Aided Architectural Design in Europe (eCAADe 2016), Oulu, Finland, 20–26 August 2016; Volume 2, pp. 511–520. [Google Scholar]
Disclaimer/Publisher’s Note: The statements, opinions and data contained in all publications are solely those of the individual author(s) and contributor(s) and not of MDPI and/or the editor(s). MDPI and/or the editor(s) disclaim responsibility for any injury to people or property resulting from any ideas, methods, instructions or products referred to in the content. |
© 2025 by the authors. Licensee MDPI, Basel, Switzerland. This article is an open access article distributed under the terms and conditions of the Creative Commons Attribution (CC BY) license (https://creativecommons.org/licenses/by/4.0/).