Abstract
Based on actual topography measurement data, this study adopts a paraboloid of revolution to characterize asperity geometry and establishes a lateral contact model that accounts for substrate deformation and covers the full elastic–plastic process. The proposed model achieves smooth transitions in contact behavior, effectively avoiding non-physical oscillations and discontinuities in the elastoplastic regime exhibited by existing models. Comparative results with multiple classical models demonstrate that the proposed model maintains strict monotonicity and continuity in predicting contact load, average contact pressure, and contact stiffness. This significantly improves prediction accuracy and physical consistency, providing a more reliable theoretical tool for modeling precision mechanical joint interfaces.
1. Introduction
In the field of mechanical engineering, connection structures serve as critical components for transmitting forces and loads among parts within complex equipment. The surfaces where components contact each other are termed joint interfaces, whose contact characteristics directly govern the operational performance of mechanical systems. During the entire service life of mechanical equipment, they are subjected to vibration and impact loads. The contact surfaces will experience mechanical behaviors such as friction, wear, slippage, collision, and separation. These result in a decrease in preload force, structural damage, and a reduction in contact stiffness, which affects the contact characteristics of the joint interfaces, thereby influencing the lifespan and reliability of the mechanical equipment.
Since the contact characteristics of joint interfaces, such as contact load, contact stiffness, and contact area, are difficult to measure, calculating and predicting these properties has become a major challenge in the field of engineering. This plays a crucial role in determining the contact state of connected structures, predicting service life, and guiding design. Typically, contact models of joint interfaces are established to compute and predict these contact characteristics. Developing more accurate and efficient contact models to study the contact behavior of joint interfaces forms the foundation for further dynamic modeling and analysis of mechanical equipment. It holds significant theoretical and practical value for evaluating the mechanical performance of complex machinery, deeply understanding the mechanical behavior of joint interfaces, and improving overall equipment performance and service life [,].
Hertzian elastic contact theory [] represents the foundation of classical contact mechanics. Greenwood and Williamson [] were among the earliest pioneers in contact theory research. They modeled the height distribution of asperities on rough surfaces as a random function and proposed a statistical micro-scale elastic contact model (GW model) based on Hertz theory, thereby establishing the theoretical framework of contact mechanics. For an extended period in subsequent research, most models adopted the flat plane-asperity assumption introduced by the GW model as the basis for further development.
Zhao et al. [] employed a function interpolation fitting method to investigate the discontinuity at the critical point of elastic-to-plastic deformation, proposed the (Zhao–Maietta–Chang)ZMC model, and established a comprehensive deformation model for asperities on rough surfaces. However, the ZMC model is limited by the nature of the interpolation function, resulting in shortcomings such as non-smooth average contact pressure at the critical points of elastic, elastoplastic, and plastic deformation, as well as an undefined critical point for fully plastic deformation. In 2007, Zhao Yongwu et al. [] addressed the issues of discontinuity at critical points and the undefined critical point for fully plastic deformation in the ZMC model by establishing (Modified-ZMC) MZMC model using a function interpolation fitting method. This model ensured smoothness at the critical points and resolved the problem of the undefined fully plastic deformation threshold, achieving a seamless transition from elastic to elastoplastic deformation.
Kogut and Etsion [,] refined the deformation stages of asperities based on the ZMC model using the finite element method. They removed the volume conservation constraint for asperity deformation and subdivided the elastoplastic stage into the first and second elastoplastic phases. This resulted in a smoother integration of all deformation stages into a continuous process, leading to the development of the (Kogut–Etsion) KE model, which describes contact behavior during elastic, elastoplastic, and fully plastic deformation.
Bush et al. [] proposed the (Bush-Gibson-Thomas) BGT model by employing height-eccentric ellipsoids with their major axes aligned along the texture direction to characterize asperity geometry. However, their analysis of asperity deformation was limited to the elastic regime. So and Liu [] subsequently extended the ellipsoidal asperity model to incorporate both elastoplastic and plastic deformation stages by incorporating the maximum principal stress yield criterion. Greenwood [] developed a new ellipsoidal contact model by extending Nayak’s theory. This model offers a more concise and accurate representation of the full elliptical solution of the BGT model.
Based on the GW model, Chang et al. [] investigated the deformation of asperities on rough surfaces beyond the elastic stage. By considering the volume conservation principle of asperities during plastic deformation, they extended the GW model to include plastic deformation, thereby establishing the (Chang–Etsion–Bogy) CEB model. Horng et al. [] extended the CEB model [] to ellipsoidal asperities, establishing the (Jeng Haur-Horng) JH model. Similar to the CEB model, the JH model does not account for the elastoplastic transition phase. Jeng and Wang [] developed the JW elastoplastic ellipsoidal asperity contact model, which accounts for the abrupt transitions in assumptions during the deformation progression from elastic to fully plastic states, thereby addressing limitations inherent in both the JH and ZMC models.
Buczkowski et al. [] integrated the BGT, CEB, and ZMC models to develop a novel statistical model of rough surfaces. Chung [] established a finite element model by assuming ellipsoidal geometry for asperities, providing the first comprehensive analysis of elastoplastic deformation behavior during contact between ellipsoids with varying ellipticity ratios and a rigid plane. This work filled a critical knowledge gap in the field. Jeng [] investigated variations in the coefficient of friction for contact surfaces with elliptical asperities under different parametric conditions. The study revealed that the friction coefficient increases with the plasticity index but decreases with increasing effective radius ratio.
Experimental investigations of rough surface topographies by several researchers [,] have demonstrated that sinusoidal contact models yield superior agreement with measured asperity interactions compared to hemispherical contact approximations. Jackson et al. [] demonstrated that under light loading conditions, sinusoidal contacts exhibit behavior remarkably similar to spherical contacts. However, as the contact load increases and approaches full contact, significant deviations emerge between sinusoidal and spherical surface behaviors. In a separate development, An et al. [] established an effective contact model for joint surfaces by modeling asperity profiles as semi-periodic sinusoidal bodies of revolution, providing improved simulation accuracy for machined surface asperities.
Gorbatikh [] demonstrated that the flat plane-asperity contact assumption in Hertzian contact theory significantly reduces model complexity and computational requirements, but introduces deviations from actual contact conditions. The study proposed that adopting an asperity-asperity contact hypothesis for modeling asperity interactions provides more physically accurate representation of real joint surface contact behavior. Jager [] investigated the side-contact behavior between two elastic spheres under the dual rough surface assumption, developing a computational methodology for estimating frictional energy dissipation. This model, however, neglects both the elastoplastic transition phase and fully plastic deformation regimes. Faulkner and Arnell [] developed finite element models incorporating both cylindrical and spherical asperity geometries to investigate the influence of surface roughness on interfacial friction coefficients. Sepehri and Farhang [] derived the governing equations for side-contact between asperities based on the (Kogut–Etsion) KE model, establishing the (Sepehri–Farhang) SF model. The analysis yielded closed-form solutions for both contact load and contact area. Li and Hong et al. [] developed a dual rough surface contact model with ellipsoidal asperities in side-contact configurations by synthesizing the KE and SF modeling frameworks.
Jamshidi and Ahmadian et al. [] developed a dual rough surface contact model with spherical asperities in side-contact configurations, considering purely elastic deformation. Their investigation of frictional hysteresis behavior between contacting planes led to modifications of Mindlin’s spherical elastic contact equations through analysis of partial micro-slip and complete slip regimes on rough surfaces. This work ultimately produced a Modified Tribological Rough Interface (MTRI) model based on dual rough surface contact theory.
In addition to their respective limitations mentioned above, existing asperity contact models primarily suffer from the following three issues: (1) Overly idealized shape assumptions, where most studies adhere to the hemispherical assumption of the GW model or adopt standard geometries such as ellipsoids or cylinders for simplification, lacking support from real topography data; (2) Predominant use of the plane-asperity contact assumption, which, while reducing computational complexity, deviates from actual contact conditions; (3) Non-physical oscillations or discontinuities in predicted contact characteristics when simulating the full deformation process from elastic to elastoplastic to fully plastic stages, resulting in insufficient continuity. To address these limitations, this study first determines a more representative asperity geometry (Paraboloid of revolution) based on actual topography measurements, avoiding subjective shape assumptions, and subsequently establishes a smooth contact model covering the entire deformation process that accounts for lateral contact effects, thereby more accurately reflecting the microscopic contact behavior of joint interfaces. It should be noted that the asperity contact model developed in this study primarily focuses on the contact characteristics of joint interfaces in connection structures. Consequently, the model does not address surface coatings and is specifically applicable to the study of contact behavior between two uncoated metal surfaces. For research concerning the mechanical properties of coated surfaces, literature [,,,,,] contains significant and relevant findings.
2. Surface Topography Characterization and Data Processing
Even surfaces that appear “smooth” at macroscopic scales typically exhibit significant roughness in their micro-topography. Macroscopically smooth surfaces inherently comprise discrete rough structures formed by numerous randomly distributed asperities. The geometric characteristics of these asperities—such as height distribution, spatial arrangement, and curvature radii—directly govern the macroscopic roughness parameters and contact mechanical behavior of the surface. The tribological behavior of a macroscopic surface fundamentally depends on the interactions at the asperity contact level. Therefore, the fidelity of the assumed geometrical topography of these asperities in the model, especially the geometric fidelity of their individual morphology, has a decisive influence on the prediction accuracy of the final contact load, real area of contact, and contact stiffness.
In large mechanical equipment, the joint interfaces at connection structures are critical areas subjected to high loads and high stresses, often made of nickel steel with high strength and toughness. A nickel steel material (40CrNiMoA) prepared by a grinding process was selected for surface topography scanning. After cleaning the sample surface with anhydrous ethanol for decontamination, the surface morphology of the measured specimen was scanned using a white light interferometer (Type: UP 3000). The obtained microscopic topography of the metal surface is shown in Figure 1.
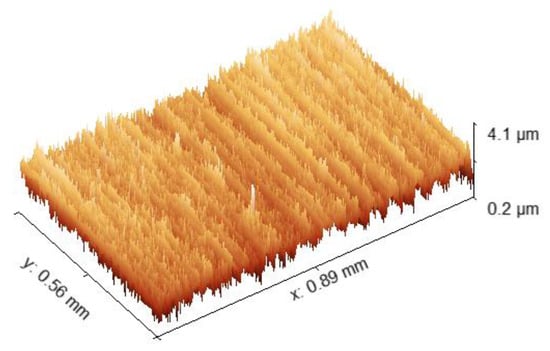
Figure 1.
Microscale 3D Surface Topography.
A segment of two-dimensional surface profile data along the X-axis was randomly extracted from the metal surface (as shown schematically in Figure 2a. After processing this data with a Gaussian filter, the result is illustrated in Figure 2b. Gaussian filtering is commonly applied in surface metrology to separate roughness, waviness, and form components, enabling more accurate quantification of surface asperity characteristics and contact behavior relevant to joint interface performance.
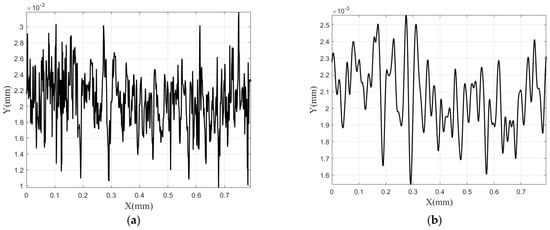
Figure 2.
(a) Original 2D Topography; (b) Gaussian Filtered 2D Topography.
Two distinct methods, namely the standard circular arc curve and the parabolic curve, were employed to fit the shape of each individual asperity within the filtered 2D profile as shown in Figure 3a. The fitted curve based on the circular arc assumption exhibited an elliptical form due to a mismatch in scaling factors between the horizontal (X-axis) and vertical (Z-axis) directions of the contour data points, which led to a scaling artifact.
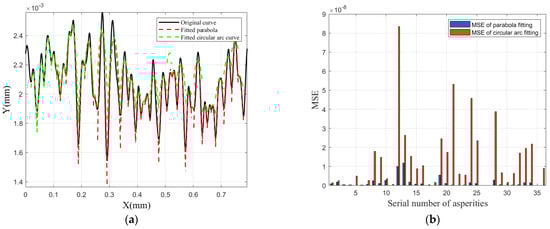
Figure 3.
(a) Parabolic and Circular Arc Fitting Results; (b) Bar Chart of MSE for Fitting Methods.
The Root Mean Square Error (RMSE) was computed for the fitting results obtained with both curves, and the results are presented in Figure 3b. Statistical analysis of the fitting data revealed that the RMSE of the parabolic fits for asperity shapes was consistently lower than that of the circular arc fits. Therefore, fitting the asperity shapes using parabolic curves is more accurate than using circular arcs. Building upon the measured rough surface topography, this study will establish an asperity contact model in which each asperity is represented as a parabolic solid of revolution.
3. Asperity Contact Model
3.1. Study on the Geometric Model of Lateral Contact in Paraboloids of Revolution
This study will investigate the paraboloidal asperity contact model based on the following five assumptions:
- (1)
- Asperity shape: The asperity geometry is that of a parabolic solid of revolution, and each contacting asperity pair possesses identical peak curvatures.
- (2)
- Independence of asperities: Asperities are isolated and do not interact with each other.
- (3)
- Absence of friction: The tangential friction force arising from friction between contacting asperities is neglected.
- (4)
- Volume conservation: The volume of each asperity remains conserved before and after contact-induced deformation.
- (5)
- Elastic substrate: The deformation of the base material is always elastic, and its deformation stiffness is .
- (6)
- The adhesion effects between asperity contacts are neglected [], with all intermolecular attractive forces being disregarded, as the model considers only mechanical loads and elastic deformation.
The aforementioned fundamental assumptions are all based on those adopted in previous literature. Specifically, assumptions (1) to (3) follow those used in the classical GW model [], assumption (4) is derived from the CEB model [], and assumption (5) originates from reference [].
The equations defining the shapes of two contacting asperities in three-dimensional space are:
Consider a pair of side-contacting asperities in a two-dimensional Cartesian coordinate system. Their respective profile equations are defined as follows:
The two-dimensional geometric model of lateral contact between asperities is shown in Figure 4.
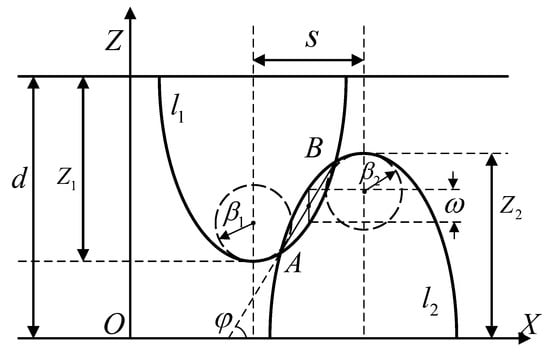
Figure 4.
Schematic of lateral contact geometry between asperities.
: Height values of the asperities.
: Side-contact angle.
: Horizontal distance between the asperities.
: Distance between the jointing surfaces.
Force analysis at the contact point is shown in Figure 5.
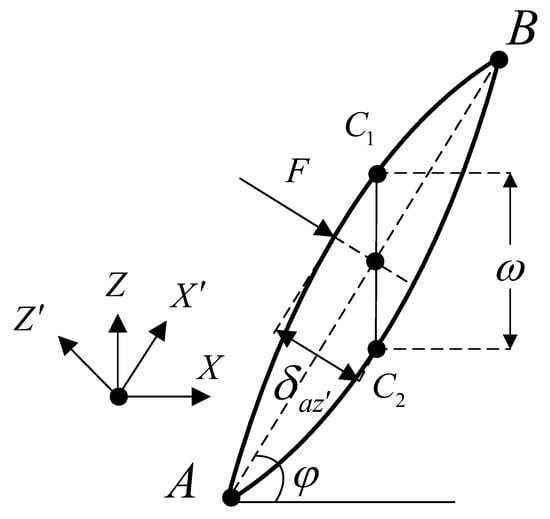
Figure 5.
Force Analysis Diagram at the Contact Point. Points A and B are the intersection points of profiles
and
.
: Interference quantity of the asperity in the
-direction.
During the contact deformation process of an asperity, as the load increases, the deformation progresses through three stages: elastic deformation, elastoplastic deformation, and fully plastic deformation. According to contact mechanics theory, when the normal interference amount increases to the initial yield critical point
, the asperity begins to undergo plastic yielding. The critical interference value at the initial yield point is given by:
where : Equivalent elastic modulus,
At this stage, plastic deformation occurs exclusively within the contact body, surrounded by a considerably larger elastic deformation region. The asperity is in the elastoplastic contact stage. As the normal contact load increases, the plastic deformation zone progressively evolves from the interior toward the surface. Ultimately, when reaching the fully plastic critical point
, the asperity transitions into the fully plastic deformation stage. The relationship between the critical plastic interference quantity
and the critical initial yielding interference quantity
is given by:
In the fully plastic contact stage, the contact pressure across the asperity interface is uniform, constant, and equal
. The contact characteristics (e.g., contact area, pressure distribution) vary distinctly with the normal interference quantity ω across different deformation stages. Therefore, a stage-specific analytical methodology is essential to characterize the contact state evolution across sequential deformation regimes.
The contact angle-geometrically defined by the asperity contact plane and nominal surface plane-controls elastoplastic load-deformation behavior at contacting asperities. This angle constitutes a pivotal governing parameter in side-contact mechanics. The geometric dependence of the contact angle—exclusively determined by asperity shape parameters and inter-axis horizontal distance—enables closed-form solutions in analytical contact models, eliminating computational overhead associated with numerical approximation.
As the normal load increases, the distance between the two planes decreases, causing asperities to approach each other along the normal direction. Based on the 2D geometric modeling in Equation (2), this phenomenon is described by line
displacing downward by
until tangency with line
at point
. Consequently, the boundary conditions of equal value and equal slope are derived at the contact point:
The solution is derived from the boundary conditions in Equation (5):
Based on the 3D model defined in Equation (1), the equivalent radius of curvature at the contact point is determined by gradually translating surface
downward until tangency with surface
is achieved at
. The gradient (surface normal vector) at the contact point is expressed as:
The boundary conditions for continuous contact:
The contact point coordinates are
and
. At point
, the principal radii of curvature along the x-direction and y-direction for surfaces
and
are given by:
For each principal direction, the equivalent curvature is computed separately by:
The equivalent radius of curvature at the contact point is calculated using the harmonic mean method [] as follows:
3.2. Study on Contact Characteristics of the Lateral Contact Model for Paraboloids of Revolution
3.2.1. Elastic Contact Stage
During the initial contact stage under normal loading at the joint surfaces, asperities undergo minor deformations. When the normal interference quantity satisfies
, the asperities are in the elastic contact regime according to Hertz contact theory. Consequently, their contact characteristics can be determined using Hertzian contact theory. Traditional contact models often neglect substrate deformation, leading to reduced accuracy in predicting contact characteristics []. When asperities are subjected to loading, the substrate undergoes corresponding deformations as shown in Figure 6. Failure to account for substrate deformation results in overestimated deformation magnitudes of the asperities themselves.
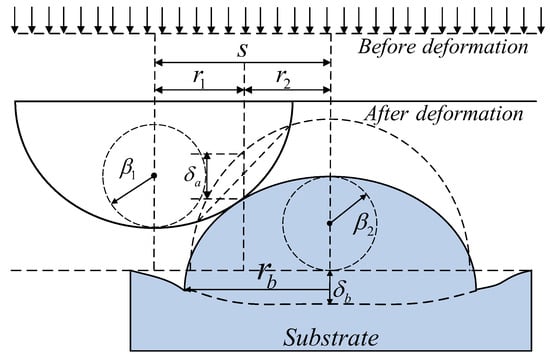
Figure 6.
Contact State under Substrate Deformation.
When the ratio of actual contact area to nominal contact area is relatively small, the influence of substrate deformation can be neglected. For instance, the Greenwood-Williamson (GW) model provides accurate predictions for contact behavior under low-load conditions [,]. However, at elevated contact loads, substrate deformation significantly affects the calculation of asperity deformation magnitudes. Therefore, investigations into interface contact characteristics must account for microscale substrate deformation.
Based on Sepehri’s theory [] and the assumptions of the present model, let
and
denote the vertex curvature radii of the two asperities, respectively:
By employing a quadratic approximation in the vicinity of the asperity vertex, the normal deformation magnitude neglecting substrate deformation is obtained as follows:
The normal interference quantity on the substrate surface varies with the radial distance r from the contact center, expressed as:
where
The substrate deformation at the contact center is expressed as:
According to Hertz contact theory, the contact stiffness between the asperity and the substrate is given by:
From the principle of force equilibrium, it follows that
, thus:
where
Assuming identical elastic moduli for the asperity and substrate (
), and substituting Equation (16) into Equation (17):
where
.
Using the iterative computation method [], we obtain:
Parameters:
,
,
.
According to Hertz contact law, the relationships between contact load, contact stiffness, contact area, and the interference quantity in the elastic stage are given by:
Therefore, the formula for calculating the normal average contact load is given by:
3.2.2. Plastic Contact Stage
When the interference further increases to the point where the plastic zone expands across the entire contact area, the contact enters the fully plastic stage. At this point, the elastic constraint effect vanishes, and the material undergoes unconstrained plastic flow, leading to an enlarged contact area while deforming in accordance with the principle of volume conservation. Microscopically, massive multiplication and movement of dislocations result in continuous material flow. Macroscopically, this is manifested by the average contact pressure stabilizing near the material’s hardness value, and the contact area exhibiting an approximately linear relationship with the applied load.
Assuming the vertices of two asperities are initially at the same height level with a horizontal separation distance
, and the upper asperity is displaced downward by a displacement
, the volume enclosed by their intersecting profiles under these geometric conditions is calculated as follows:
where
.
Based on the volume conservation hypothesis, the plastically flowing region is idealized as a prismatic volume, which equals the product of contact area and deformation magnitude. Therefore:
The interference quantity in the
-direction,
, is defined as:
Substituting Equation (23) yields the contact area in the Z′-direction for the plastically deforming region:
The total contact area equals the sum of the areas of the plastically deforming region and the central zone:
For the fully plastic contact stage, the contact load equals the product of contact area and average contact pressure [,] (
). Therefore, the normal contact load of the asperity is
The derivative of the contact load with respect to interference gives the normal contact stiffness of the asperity:
3.2.3. Elastoplastic Contact Stage
- Average Contact Load
When the interference
at an asperity contact reaches a value that satisfies
, the contact is in the elastoplastic stage. The deformation mechanism during this stage is characterized by a mixture of elastic and plastic behavior. The microscopic process begins with the formation of a plastic nucleus beneath the asperity tip, where the maximum shear stress occurs. As the load increases, this plastic nucleus becomes constrained by the surrounding elastic matrix, strongly inhibiting material flow and resulting in a state of confined plastic deformation. Consequently, the material exhibits both recoverable elastic deformation and irreversible plastic deformation simultaneously. Macroscopically, this is manifested as a gradual decrease in contact stiffness with increasing deformation, while the average contact pressure increases steadily from the value predicted by Hertz theory to a level approaching the material’s hardness. The relationship between contact parameters and the interference in this stage is governed by the interaction between elastic and plastic deformations, leading to highly nonlinear contact behavior [].
Since closed-form analytical solutions are intractable for the elastoplastic stage, a boundary-driven piecewise function approximation is adopted: leveraging elastic/plastic stage solutions as boundary conditions, contact characteristics versus interference are derived through curve fitting [].
Scholars worldwide have achieved numerous research results in the field of elastoplastic contact models. These include the KE model based on finite element analysis [], the improved ZMC model using cubic spline function interpolation as the fitting function [,], the Brake model employing Hermite interpolation as the fitting function [], and Xu model based on elliptic curve equations as the fitting function [], among others.
According to continuum deformation theory, the average contact force satisfies the following conditions at the initial yield threshold and the fully plastic deformation threshold:
The elliptical curve equation from the (Xu-Wang) XW model [] was adopted as the fitting function, with its minor axis aligned with the vertical line passing through
.
Parameter Definitions:
: the length of the major semi-axis of the elliptical curve.
: the length of the minor semi-axis of the elliptical curve.
: the offset of the ellipse’s center relative to the
-axis.
The normal average contact force during the elastic stage is:
According to Equations (3) and (21), Equation (31) can be rewritten as:
The normal average contact force
and its slope
at
are:
Based on the smoothness and continuity conditions, the following relationships hold:
Solving for the expressions of
and
yields:
Substituting Equation (30) yields the average contact force for the elastic–plastic stage:
Therefore, the average contact force for the entire contact process is:
- 2.
- Contact Load
Since the contact force in the plastic stage is a linearly increasing function of
rather than constant, the elliptical curve is unsuitable as the fitting function for the contact force in the elastic–plastic stage. This model adopts the Hermite interpolation method to derive the contact force formula for the elastic–plastic stage. The contact force function is defined as a cubic Hermite interpolation function:
According to the ZMC model [,], the following boundary conditions are imposed:
When the deformation reaches the critical deformation amount
, the contact load satisfies the following relationship:
Substitute into Equation (38) to solve for the interpolation coefficients
,
:
At
the following relation holds:
where
The coefficients
and
can be solved as:
Substituting the solved coefficients into Equation (38) yields the contact force formula for the elastic–plastic stage as:
The contact force calculation formula for the entire contact process is as follows:
- 3.
- Contact Stiffness
According to the contact stiffness Formulas (20) and (28) for the elastic and plastic stages, it can be observed that
, and
(a constant), which exhibits behavior similar to the initial condition of the average contact load. Therefore, it can also be fitted using an elliptic curve. Let
, and select an elliptic curve for fitting.
where
: the length of the semi-major axis of the elliptic curve,
: the length of the semi-minor axis
: the offset of the ellipse center relative to the
-axis.
The contact stiffness and its slope at
are:
Based on the smoothness and continuity conditions, we have:
Solve for the expressions of
,
,
.
Substituting into Equation (30), the contact stiffness and load in the elastoplastic stage can be obtained as follows:
Combining the contact stiffness calculation formulas for both the elastic and plastic stages, the contact stiffness throughout the entire asperity contact process is derived as follows:
4. Verification via Case Study Simulations
To verify the correctness and advancement of the contact model proposed in this paper in predicting mechanical responses, this chapter conducts simulation case studies. The study systematically compares the predictions of the proposed model with those of classical models such as CEB, ZMC, and KE, focusing on three key performance indicators: contact load, average contact pressure, and contact stiffness. Under identical conditions of asperity deformation and material parameters, the response curves and variation trends of each model across the elastic, elastoplastic, and fully plastic stages are quantitatively analyzed. Emphasis is placed on examining the monotonicity, continuity, and consistency with physical laws of the predictions, thereby comprehensively evaluating the superiority of the proposed model in terms of mechanistic rationality and numerical accuracy.
4.1. Non-Dimensionalization
To facilitate unified analysis and comparison of model performance across different scales and parameter conditions, this section first applies non-dimensionalization to the formulas for contact load, average contact pressure, and contact stiffness in the proposed model. By converting physical quantities into dimensionless forms, the influence of dimensional differences is eliminated, highlighting the essential characteristics of the model’s response behavior. The following normalization is applied to the asperity contact characteristics:
where
.
After applying the non-dimensionalization process described above, the dimensionless expressions for the average contact pressure, contact load, and contact stiffness can be derived as follows:
4.2. Model Comparison
40CrNiMoA steel was selected as the material for the model, and its specific mechanical properties are listed in Table 1. The variation curves of the non-dimensionalized contact load, average contact load, and contact stiffness of a single asperity with respect to the normal deformation amount, calculated using different elastoplastic models, are shown in Figure 7, Figure 8 and Figure 9.

Table 1.
Model Parameters Table.
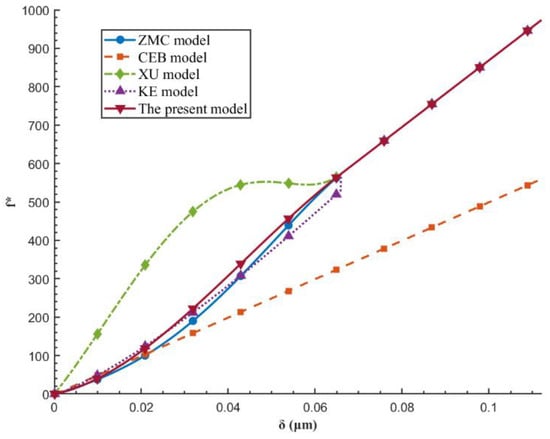
Figure 7.
Non-dimensional Contact Load.
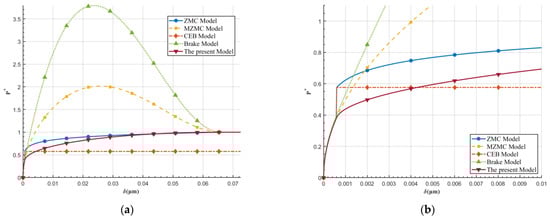
Figure 8.
(a) Non-dimensional Average Contact Load; (b) Partial Enlarged View of Non-dimensional Average Contact Load.
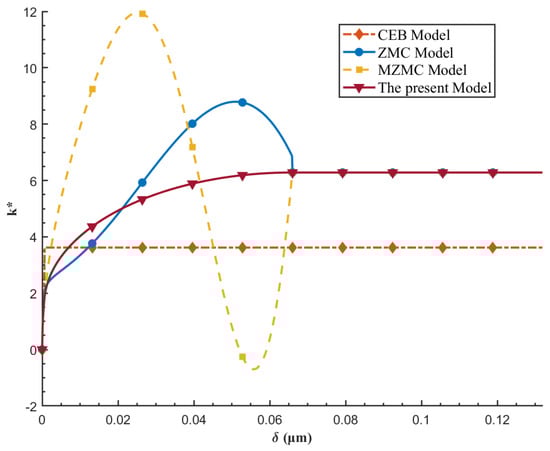
Figure 9.
Non-dimensional Contact Stiffness.
To validate the proposed model in this study, comparisons were made between the present model and various classical models, such as ZMC [], CEB, XW, and KE models. The results are shown in Figure 7.
In the comparative study of classical plane-asperity contact models (such as CEB, XW, and KE) and the model proposed in this paper, significant differences were observed in the predicted contact load-deformation relationships among these models. Among the five different elastoplastic contact models, except for the KE model, the variation curves of contact load with normal interference for the other models are monotonic, continuous, and smooth throughout the elastic, elastoplastic, and fully plastic deformation states. The CEB model does not explicitly account for the elastoplastic transition stage, leading to premature full plastic deformation of the asperity. Additionally, by directly introducing the maximum contact pressure coefficient into the calculation of the plastic stage, this model systematically underestimates the contact load in the plastic phase compared to other models.
The XW model achieves a globally smooth and continuous response curve in its predictions; however, it exhibits noticeable numerical oscillations during the elastoplastic stage, and its prediction curve is not monotonically increasing. This, to some extent, affects the model’s physical rationality and numerical stability. The KE model divides the asperity contact process into four more refined deformation stages (including elastic, two elastoplastic, and fully plastic stages). This segmentation strategy enhances the model’s ability to describe different deformation mechanisms, particularly improving the resolution during the transition from elastic to plastic behavior, thereby contributing to a more accurate representation of the material’s progressive yielding. However, the model exhibits a discontinuous jump during the transition from the elastoplastic stage to the fully plastic stage, revealing a flaw in the constitutive relationship between these phases.
In contrast, the model proposed in this study demonstrates excellent overall performance in predicting the full-range contact load: its curve is not only smooth and continuous across all stages but also strictly monotonic and increasing, consistent with the fundamental physical principles of contact mechanical behavior. Furthermore, the predicted trends of the proposed model align closely with established authoritative studies. By incorporating a more realistic geometrical representation of asperities based on actual surface topography, the model significantly improves the accuracy of contact load predictions, effectively balancing theoretical innovation and result reliability. This fully demonstrates the notable advancements of the proposed model in both mechanistic rationality and predictive superiority.
The numerical simulation results of the average contact load for the proposed model, along with the ZMC, MZMC, CEB, and Brake models, are shown in Figure 8. Based on comparative analysis, although the Brake model [] achieves a continuous transition from elastic to plastic deformation in predicting the average contact load, the Hermite interpolation method it employs constructs a cubic polynomial relationship between the average contact load and the normal approach during the elastoplastic stage. This high-order interpolation function is prone to induce numerical oscillations, leading to abnormally high predicted values of the average contact load in certain regions within the elastoplastic stage—even exceeding the load level in the fully plastic stage. This phenomenon violates the fundamental physical principle in contact mechanics that the load should increase monotonically with deformation, indicating the limited applicability of high-order power functions in constructing elastoplastic contact constitutive relationships. Meanwhile, the CEB model fails to accurately describe the continuous progressive yielding process, as it lacks an explicit elastoplastic transition mechanism, causing the material to enter the fully plastic stage prematurely.
Although the ZMC model effectively avoids non-physical oscillations and achieves a smooth transition between the elastoplastic and fully plastic stages, it still exhibits a step phenomenon at the transition from the elastic to the elastoplastic region, as shown in Figure 8b, reflecting insufficient constitutive continuity in the model. The MZMC model [], an improved version of the ZMC model, addresses the discontinuity issue during the transition from the elastic to the elastoplastic stage present in the ZMC model. However, it encounters the same oscillation problem in the average contact load during the elastoplastic stage as observed in the Brake model.
The model proposed in this study constructs the expression for average contact pressure based on an elliptic function, achieving strict monotonic increase and smooth transition across all stages—from elastic and elastoplastic to fully plastic deformation. It effectively overcomes the step and oscillation issues observed in existing models, demonstrating superior numerical stability and physical consistency.
Based on the information in Figure 9, a comparative analysis of the contact stiffness predicted by the CEB, ZMC, MZMC, and the proposed model reveals significant differences in terms of smoothness, monotonicity, and physical rationality. The CEB model fails to accurately describe the stiffness variation in the elastoplastic transition zone due to its insufficient consideration of the elastoplastic deformation stage, leading to a premature entry into the fully plastic stage. Both the ZMC and MZMC models exhibit noticeable non-physical oscillations in their predicted contact stiffness, owing to the use of high-order polynomial fitting methods. Their predicted stiffness values in the elastoplastic stage even exceed those in the fully plastic stage at certain points, violating the fundamental physical principle that contact stiffness should increase monotonically with normal deformation. Notably, the MZMC model even produces negative stiffness within specific intervals, a result clearly inconsistent with actual contact mechanisms. Furthermore, the ZMC model displays discontinuity in its curve during the transition from the elastoplastic to the fully plastic stage, further exposing deficiencies in its handling of phase transitions.
In contrast, the model proposed in this study demonstrates excellent numerical stability and physical consistency throughout the entire asperity deformation process. Its predicted curve not strictly maintains a monotonically increasing trend but also achieves a smooth and continuous transition from the elastic to the elastoplastic and fully plastic stages, aligning more closely with the actual evolution of stiffness during contact. The results indicate that the proposed model offers superior accuracy and reliability in revealing the mechanism of how asperity contact stiffness varies with deformation, thereby providing a more solid modeling foundation for further research on rough surface contact behavior.
5. Results and Discussion
Based on the measured topography data of metallic surface asperities, this study investigates the feasibility of using paraboloids of revolution to characterize asperity geometry. A lateral contact model of asperities was established based on paraboloids of revolution, and the elliptic curve fitting method along with Hermite interpolation were employed to derive the formulas for calculating the average contact load, contact stiffness, and contact load during the elastoplastic deformation stage of asperities. Multiple elastoplastic contact models (CEB, XW, KE, Brake, ZMC, MZMC, and the proposed model) were compared and analyzed in terms of their predictions of contact load, average contact load, and contact stiffness. The performance of each model was evaluated from multiple perspectives, including curve continuity, monotonicity, numerical stability, and physical consistency, with a focus on demonstrating the theoretical and numerical advantages of the proposed model.
- Contact Load
The results indicate that, in terms of the relationship between contact load and normal deformation, all models except the KE model exhibit a continuous, smooth, and monotonically increasing trend across the elastic, elastoplastic, and fully plastic stages, consistent with fundamental contact mechanics principles. However, each classical model still exhibits significant limitations in its specific response behavior:
The CEB model lacks an explicit elastoplastic transition mechanism, causing premature entry into the fully plastic stage and systematically underestimating plastic-stage predictions. The XW model achieves smooth transition throughout the entire process but exhibits non-physical oscillations during the elastoplastic stage, violating monotonicity and compromising numerical stability and physical credibility. The KE model employs a four-stage refined modeling strategy, improving resolution of deformation mechanisms, yet displays step discontinuities during the transition from elastoplastic to fully plastic deformation, revealing deficiencies in constitutive continuity. The Brake model achieves continuous transition but induces oscillations in the elastoplastic stage due to its use of cubic Hermite interpolation, even producing average contact loads exceeding those in the fully plastic stage, which contradicts physical laws. The ZMC model exhibits step discontinuities at the elastic-elastoplastic transition, while the MZMC model improves continuity but introduces oscillations similar to the Brake model and even produces negative stiffness, significantly undermining practicality.
In contrast, the proposed model maintains strict monotonic increase, smoothness, and continuity throughout the entire deformation process, without oscillations or step discontinuities. Its response behavior is highly consistent with actual physical principles, demonstrating superior predictive stability and reliability.
- 2.
- Average Contact Load
In the prediction of average contact load, the Brake model exhibits abnormally high values in the elastoplastic stage due to numerical oscillations induced by high-order interpolation; the CEB model prematurely enters the plastic stage owing to the lack of an elastoplastic transition mechanism; the ZMC model shows a step discontinuity at the elastic–plastic transition, reflecting insufficient constitutive continuity; while the MZMC model improves the continuity of ZMC but introduces oscillation issues. The model proposed in this study, which constructs the expression for average contact pressure based on an elliptic function, successfully achieves strict monotonicity and smoothness across all stages—from elastic and elastoplastic to fully plastic deformation. It effectively avoids oscillations and step discontinuities, combining clear physical interpretability with excellent numerical stability.
- 3.
- Contact Stiffness
In terms of contact stiffness, the CEB model fails to accurately capture the stiffness variation in the transition zone due to its neglect of the elastoplastic transition. The ZMC and MZMC models, owing to their use of high-order polynomial fitting, exhibit non-physical oscillations and even negative stiffness, with predicted stiffness values in the elastoplastic stage exceeding those in the fully plastic stage—a clear violation of physical principles. Additionally, the ZMC model suffers from discontinuities between deformation stages. In contrast, the proposed model demonstrates excellent numerical stability and physical consistency throughout the entire deformation process. Its stiffness curve is strictly monotonic increasing and smoothly continuous, clearly revealing the rational mechanism underlying the variation in asperity contact stiffness with deformation. This significantly enhances the ability to describe contact stiffness behavior.
The paraboloid-of-revolution-based lateral contact model proposed in this study outperforms the compared classical models in terms of smoothness, monotonicity, stage continuity, and numerical stability. Its predictions are not only consistent with physical intuition but also align closely with the trends observed in classical models, demonstrating that the proposed model offers a more rational mechanical mechanism and higher predictive accuracy in elastoplastic contact modeling.
6. Conclusions
Based on measured topography data of joint interface rough surfaces, a systematic evaluation was conducted on the applicability of parabolic and circular arcs in characterizing two-dimensional asperity profiles. Furthermore, the advantages and disadvantages of paraboloids of revolution versus spheres in describing three-dimensional asperity geometry were investigated. Results indicate that the paraboloid of revolution provides a more accurate representation of actual asperity morphology compared to spherical shapes. On this basis, a lateral contact model of parabolic asperities accounting for substrate deformation was established. Using elliptic curve fitting and Hermite interpolation, analytical expressions for the average normal contact load, contact stiffness, and total contact load throughout the entire deformation stages (elastic, elastoplastic, and fully plastic) were derived. This approach achieves smooth transitions between different deformation phases, effectively avoiding non-physical oscillations and discontinuities commonly observed in traditional models. Numerical simulations demonstrate that the trends predicted by the proposed model align with authoritative existing studies, verifying its validity. Compared to classical models, the present model exhibits superior numerical stability and physical consistency in predicting contact load, average contact pressure, and contact stiffness, with no unphysical phenomena such as oscillations, discontinuities, or negative stiffness observed. These advantages highlight its significant improvement in mechanical rationality and predictive accuracy. The model provides a more reliable predictive tool for analyzing contact behavior in joint structures of large-scale equipment, offering a theoretical basis for structural design and lifespan assessment. The definitions of the symbols used in the text are provided in the Appendix A below.
Author Contributions
Conceptualization, M.G., M.Z. and X.L.; Methodology, Z.L., S.W. and Z.X.; Software, Y.L. (Yuqing Liu); Validation, Z.L. and Y.L. (Yilong Liu); Writing – original draft, Z.L.; Writing – review & editing, M.G.; Supervision, Y.L. (Yuqing Liu); Project administration, X.L. All authors have read and agreed to the published version of the manuscript.
Funding
This research received no external funding.
Institutional Review Board Statement
Not applicable.
Informed Consent Statement
Not applicable.
Data Availability Statement
Data are contained within the article.
Conflicts of Interest
The authors declare no conflict of interest.
Abbreviations
The following abbreviations are used in this manuscript:
| CEB | Chang–Etsion–Bogy |
| XW | Xu-Wang |
| KE | Kogu–Etsion |
| ZMC | Z hao –M aietta– C hang |
| MZMC | M odified- ZMC |
| BGT | B ush- G ibson- T homas |
| JH | Jeng-Horng |
| SF | Sepehri–Farhang |
Appendix A
Table A1.
Symbol Definition Table.
Table A1.
Symbol Definition Table.
| Symbol | Meaning |
|---|---|
| Equivalent elastic modulus | |
| Elastic modulus of the substrate | |
| Effective elastic modulus of the substrate | |
| Material hardness | |
| Maximum Contact Pressure Coefficient | |
| Maximum pressure acting on the substrate | |
| Equivalent Radius of Curvature | |
| Contact radius at the substrate surface | |
| Initial yielding critical interference quantity | |
| Asperity interference quantity | |
| Poisson’s ratio of the substrate material |
References
- Li, Z.; Guo, M.; Liu, Y.; Wang, S.; Lu, X.; Xu, Z. Cross-Scale Mechanical Contact Analysis from Asperities to Rough Surfaces: A Critical Review. Coatings 2025, 15, 333. [Google Scholar] [CrossRef]
- Yeo, C.-D.; Katta, R.R.; Lee, J.; Polycarpou, A.A. Effect of asperity interactions on rough surface elastic contact behavior: Hard film on soft substrate. Tribol. Int. 2010, 43, 1438–1448. [Google Scholar] [CrossRef]
- Johnson, K.L. Contact Mechanics; Cambridge University Press: Cambridge, UK, 1987. [Google Scholar]
- Greenwood, J.A.; Williamson, J.B.P. Contact of nominally flat surfaces. Proc. R. Soc. Lond. Ser. A Math. Phys. Sci. 1966, 295, 300–319. [Google Scholar] [CrossRef]
- Zhao, Y.; Maietta, D.M.; Chang, L. An asperity microcontact model incorporating the transition from elastic deformation to fully plastic flow. J. Tribol. 2000, 122, 86–93. [Google Scholar] [CrossRef]
- Zhao, Y.W.; Lü, Y.M.; Jiang, J.Z. A new elastic-plastic contact model for rough surfaces. Chin. J. Mech. Eng. 2007, 43, 95–101. [Google Scholar] [CrossRef]
- Kogut, L.; Etsion, I. Elastic-plastic contact analysis of a sphere and a rigid flat. J. Appl. Mech. 2002, 69, 657–662. [Google Scholar] [CrossRef]
- Kogut, L.; Etsion, I. A Finite Element Based Elastic-Plastic Model for the Contact of Rough Surfaces. Tribol. Trans. 2003, 46, 383–390. [Google Scholar] [CrossRef]
- Bush, A.; Gibson, R.; Thomas, T. The elastic contact of a rough surface. Wear 1975, 35, 87–111. [Google Scholar] [CrossRef]
- So, H.; Liu, D.C. An elastic-plastic model for the contact of anisotropic rough surfaces. Wear 1991, 146, 201–218. [Google Scholar] [CrossRef]
- Greenwood, J.A. A simplified elliptic model of rough surface contact. Wear 2006, 261, 191–200. [Google Scholar] [CrossRef]
- Chang, W.R.; Etsion, I.; Bogy, D.B. An Elastic-Plastic Model for the Contact of Rough Surfaces. J. Tribol. 1987, 109, 257–263. [Google Scholar] [CrossRef]
- Horng, J.H. An Elliptic Elastic-Plastic Asperity Microcontact Model for Rough Surfaces. J. Tribol. 1998, 120, 82–88. [Google Scholar] [CrossRef]
- Jeng, Y.-R.; Wang, P.-Y. An Elliptical Microcontact Model Considering Elastic, Elastoplastic, and Plastic Deformation. J. Tribol. 2003, 125, 232–240. [Google Scholar] [CrossRef]
- Buczkowski, R.; Kleiber, M. Statistical Models of Rough Surfaces for Finite Element 3D-Contact Analysis. Arch. Comput. Methods Eng. 2009, 16, 399–424. [Google Scholar] [CrossRef]
- Chung, J.C. Elastic–plastic contact analysis of an ellipsoid and a rigid flat. Tribol. Int. 2010, 43, 491–502. [Google Scholar] [CrossRef]
- Jeng, Y.-R.; Peng, S.-R. Static Friction Model of Elastic-Plastic Contact Behavior of Surface With Elliptical Asperities. J. Tribol. 2009, 131, 021403. [Google Scholar] [CrossRef]
- Shah, S.; Krithivasan, V.; Jackson, R.L. An electro-mechanical contact analysis of a three-dimensional sinusoidal surface against a rigid flat. Wear 2011, 270, 914–921. [Google Scholar] [CrossRef]
- Jackson, R.L.; Krithivasan, V.; Wilson, W.E. The pressure to cause complete contact between elastic—Plastic sinusoidal surfaces. Proc. Inst. Mech. Eng. Part J 2008, 222, 857–863. [Google Scholar] [CrossRef]
- An, Q.; Suo, S.F.; Lin, F.Y.; Bai, Y.Z.; Geng, H.X.; Shi, J.W. A micro-contact model for surface ground rough surfaces. Chin. J. Mech. Eng. 2020, 56, 240–248. [Google Scholar]
- Gorbatikh, L.; Popova, M. Modeling of a locking mechanism between two rough surfaces under cyclic loading. Int. J. Mech. Sci. 2006, 48, 1014–1020. [Google Scholar] [CrossRef]
- Jager, J. Uniaxial deformation of a random packing of particles. Arch. Appl. Mech. 1999, 69, 181–203. [Google Scholar] [CrossRef]
- Faulkner, A.; Arnell, R.D. The development of a finite element model to simulate the sliding interaction between two, three-dimensional, elastoplastic, hemispherical asperities. Wear 2000, 242, 114–122. [Google Scholar] [CrossRef]
- Sepehri, A.; Farhang, K. A Finite Element-Based Elastic-Plastic Model for the Contact of Rough Surfaces. Model. Simul. Eng. 2011, 2011, 561828. [Google Scholar] [CrossRef]
- Jamshidi, H.; Ahmadian, H. A modified rough interface model considering shear and normal elastic deformation couplings. Int. J. Solids Struct. 2020, 203, 57–72. [Google Scholar] [CrossRef]
- Jaffar, M. Asymptotic behaviour of thin elastic layers bonded and unbonded to a rigid foundation. Int. J. Mech. Sci. 1989, 31, 229–235. [Google Scholar] [CrossRef]
- Liao, S.J.; Zhang, X.L.; Lian, Y.Z. Statistical modeling of contact stiffness for rough surfaces with hard coatings. Lubr. Eng. 2025, 50, 52–59. [Google Scholar]
- Chen, Z.; Etsion, I. The elastic-plastic contact behavior of rough surfaces with hard coatings. Tribol. Int. 2019, 134, 435–442. [Google Scholar] [CrossRef]
- Goltsberg, R.; Etsion, I. A universal model for the load–displacement relation in an elastic coated spherical contact. Wear 2015, 322–323, 126–132. [Google Scholar] [CrossRef]
- Chen, Z.; Goltsberg, R.; Etsion, I. A universal model for a frictionless elastic-plastic coated spherical normal contact with moderate to large coating thicknesses. Tribol. Int. 2017, 114, 485–493. [Google Scholar] [CrossRef]
- Johns-Rahnejat, P.M.; Dolatabadi, N.; Rahnejat, H. Elastic and elastoplastic contact mechanics of concentrated coated contacts. Lubricants 2024, 12, 162. [Google Scholar] [CrossRef]
- Johnson, K.L.; Kendall, K.; Roberts, A. Surface energy and the contact of elastic solids. Proc. R. Soc. Lond. Ser. A Math. Phys. Sci. 1971, 324, 301–313. [Google Scholar]
- Sepehri, A.; Farhang, K. Closed-Form Equations for Three Dimensional Elastic-Plastic Contact of Nominally Flat Rough Surfaces. J. Tribol. 2009, 131, 041402. [Google Scholar] [CrossRef]
- Nassar, S.A.; Abboud, A. An improved stiffness model for bolted joints. J. Mech. Des. 2009, 131, 121001. [Google Scholar] [CrossRef]
- Wang, G.F.; Long, J.M.; Feng, X.Q. A self-consistent model for the elastic contact of rough surfaces. Acta Mech. 2015, 226, 285–293. [Google Scholar] [CrossRef]
- Li, L.; Wang, J.J.; Pei, X.Y.; Chu, W.; Cai, A.J. A new modeling method for contact stiffness of mechanical joint interfaces. J. Mech. Eng. 2020, 56, 162–169. [Google Scholar]
- Sepehri, A.; Farhang, K. On elastic interaction of nominally flat rough surfaces. J. Tribol. 2008, 130, 011014. [Google Scholar] [CrossRef]
- Yang, Z. Contact Stiffness Modeling of Joint Interfaces Considering Asperity Lateral Contact. Master’s Thesis, Xi’an University of Technology, Xi’an, China, 2022. [Google Scholar]
- Liu, X. Mechanical Modeling and Damping Research of Asperities during the Elastoplastic Deformation Stage. Master’s Thesis, Taiyuan University of Science and Technology, Taiyuan, China, 2019. [Google Scholar]
- Li, B.T.; Hong, J.; Shao, G.Q.; Du, F. An Integrated Mechanica–Electrical Predictive Model of Electrical Contact Resistance between Two Rough Surfaces. Tribol. Trans. 2015, 58, 537–548. [Google Scholar] [CrossRef]
- Chang, W.-R.; Etsion, I.; Bogy, D. Adhesion model for metallic rough surfaces. J. Tribol. 1988, 110, 50–56. [Google Scholar] [CrossRef]
- Brake, M.R. An analytical elastic-perfectly plastic contact model. Int. J. Solids Struct. 2012, 49, 3129–3141. [Google Scholar] [CrossRef]
- Xu, C.; Wang, D. An Improved Analytical Model for Normal Elastic-Plastic Contact of Rough Surfaces. J. Xi’an Jiaotong Univ. 2014, 48, 115–121. [Google Scholar]
- Cheng, D. Machine Design Handbook; Chemical Industry Press: Beijing, China, 2025. [Google Scholar]
Disclaimer/Publisher’s Note: The statements, opinions and data contained in all publications are solely those of the individual author(s) and contributor(s) and not of MDPI and/or the editor(s). MDPI and/or the editor(s) disclaim responsibility for any injury to people or property resulting from any ideas, methods, instructions or products referred to in the content. |
© 2025 by the authors. Licensee MDPI, Basel, Switzerland. This article is an open access article distributed under the terms and conditions of the Creative Commons Attribution (CC BY) license (https://creativecommons.org/licenses/by/4.0/).