


Abstract
Background/Objectives: Farm-level monitoring of antimicrobial use (AMU) is essential for mitigating antimicrobial resistance (AMR) within a One Health framework because aggregated sales data cannot identify farms and production stages with high AMU. This study evaluated year-to-year changes in AMU intensity and antimicrobial-class distribution in a longitudinal cohort of 492 large-scale Hungarian pig farms in 2023 and 2024 and identified priorities for antimicrobial stewardship. Methods: Mandatory veterinarian-reported AMU data were analyzed retrospectively. The same 492 farms were included in both years, representing approximately 3.7 million pigs in 2023 and 3.8 million in 2024. AMU intensity was expressed as milligrams of active substance per kilogram of pig biomass using the standard live weights specified in the European Medicines Agency’s ESUAvet methodology: 120 kg per slaughter pig and 240 kg per breeding sow. Antimicrobials were grouped by Antimicrobial Advice Ad Hoc Expert Group (AMEG) category. Results: In the 492-farm cohort, AMU intensity was 5.1% lower in 2024 than in 2023 (55.0 versus 57.9 mg/kg biomass). Category B intensity decreased in all farm categories; Category C increased on only-fattener and breeding farms but decreased on farrow-to-finish farms; Category D remained dominant. AMU was concentrated in specific production stages and farms: 57.5–86.4% of breeding-unit AMU was reported for post-weaning pigs, the 20 farms with the highest absolute use accounted for 43.3% of total cohort AMU, and the 20 farms with the highest absolute Category B use accounted for approximately 68.8% of cohort Category B use. Oral formulations represented 93% of reported antimicrobial quantity. Medicated-premix use decreased by approximately 25%, while drinking-water and injectable formulations increased. Conclusions: Mandatory farm-level surveillance provides data for benchmarking and targeted stewardship. Interventions should distinguish absolute use from biomass-adjusted intensity and focus on farms with disproportionate use and the post-weaning phase. The observed 2023–2024 difference is descriptive; additional years of data are needed to assess longer-term patterns in AMU intensity.
1. Introduction
1.1. One Health, Antimicrobial Resistance, and the Role of Antimicrobial Use Monitoring
Antimicrobials have been essential for the control of bacterial diseases in both human and veterinary medicine for decades. However, antimicrobial exposure exerts strong selective pressure on bacterial populations, contributing to the emergence and dissemination of resistant strains [1]. In intensive pig production systems, high treatment frequencies, particularly prophylactic use and the historical use of antimicrobials for growth promotion, have contributed to the development and persistence of antimicrobial resistance (AMR). In response to these risks, the European Union banned the use of veterinary antibiotics as growth promoters in 2006, representing a major regulatory step toward reducing nontherapeutic antimicrobial exposure in livestock production [2,3]. Several studies report high resistance to commonly used antimicrobials in swine-associated Escherichia coli and Enterococcus spp., including tetracycline resistance in the approximate 65–85% range in selected farm studies; however, estimates vary by organism, country, sample type, and method [4,5]. Antimicrobial residues and resistance determinants can enter manure and agricultural soils, creating environmental reservoirs that may contribute to AMR dissemination [6,7].
The Ninth WOAH Annual Report on Antimicrobial Agents Intended for Use in Animals estimated that 70,000–74,000 metric tons of antimicrobials were used globally in veterinary medicine in 2022 across 107 reporting countries. In that report, tetracyclines accounted for the largest share of use, approximately 28%, followed by penicillins, approximately 18%, and macrolides, approximately 11% [8]. Secondary global trend summaries similarly indicate that tetracyclines remain a leading antimicrobial class and that reductions in veterinary antimicrobial use (AMU) have been uneven across periods and regions [9].
Within the One Health framework, which integrates human, animal, and environmental health, reducing AMU in food-producing animals is considered a key component of global AMR mitigation strategies [10,11]. The Global Action Plan on Antimicrobial Resistance, developed by WHO in collaboration with FAO, WOAH, and UNEP, provides a strategic framework for addressing AMR. It is organized around five core objectives: improving awareness and understanding, strengthening surveillance and research, reducing the incidence of infection, optimizing AMU, and promoting sustainable investment in new medicines, diagnostic tools, vaccines, and other interventions. The plan emphasizes global implementation of the One Health approach and supports measurable progress in antimicrobial stewardship, including reductions in agricultural AMU, restrictions on the veterinary use of critically important antimicrobials for human medicine, and the development of functional national AMR action plans [12,13,14]. Effective AMU reduction policies require reliable, comparable, and interpretable indicators, together with systematic data collection capable of identifying high-risk sectors, production phases, and management factors associated with antimicrobial exposure.
1.2. European Union Framework and Mandatory Reporting
At the European level, AMU surveillance has evolved from voluntary sales-data reporting toward mandatory, harmonized data collection. Among the 25 countries that reported continuously between 2011 and 2020, an overall reduction of approximately 43% was observed [15,16,17]. According to the 2022 ESVAC report, aggregated veterinary antimicrobial sales across 31 reporting countries amounted to 73.9 mg/PCU in 2022, representing a 12.7% decrease compared with 2021. Since 2011, a consistent downward trend has been observed, particularly for antimicrobials classified as critically important for human medicine under Antimicrobial Advice Ad Hoc Expert Group (AMEG) category B, including third- and fourth-generation cephalosporins, fluoroquinolones, and polymyxins. Category B (“Restrict”) comprises antimicrobial classes that are of particular importance in human medicine, including for the treatment of serious infections for which therapeutic alternatives may be limited. Their use in animals may contribute to the selection and dissemination of antimicrobial-resistant bacteria and resistance determinants, with potential consequences for human health. Therefore, the use of Category B antimicrobials in veterinary medicine should be restricted to situations where lower-category alternatives are not clinically effective, and their consumption should be closely monitored as an important component of One Health AMR surveillance. Overall, European data indicate a 53% reduction in veterinary antimicrobial sales between 2011 and 2022 [18,19].
The regulatory framework was substantially strengthened by Regulation (EU) 2019/6 and related implementing acts, which require Member States, from 2024 onward, to collect and transmit detailed data on veterinary antimicrobial sales and use [20,21]. Routine prophylactic use is restricted, metaphylaxis is limited, and certain critically important antimicrobials are subject to additional safeguards [21,22,23,24]. These measures are embedded in the EU One Health Action Plan against AMR, which emphasizes prudent AMU, enhanced monitoring, disease prevention, and innovation [11,19,25,26].
Despite substantial progress, marked differences remain among Member States, particularly in countries with intensive livestock production systems. These differences highlight the need for species-specific and farm-level analyses that can identify sectoral patterns, high-use holdings, and production-stage-specific intervention points.
1.3. The Hungarian Farm-Level Antimicrobial Use Reporting System
In Hungary, a legislative amendment adopted in 2021 and effective from January 2022 introduced mandatory monthly reporting of AMU in food-producing animals by veterinarians to the national competent authority, the National Food Chain Safety Office (NÉBIH) [23,27]. This reporting system provides structured farm-level AMU data for the first time, enabling more detailed assessments than those based solely on aggregated antimicrobial sales data.
By 2024, reporting coverage in the pig sector had reached a level sufficient for robust sectoral analysis. In contrast, data completeness in other livestock sectors remains under development. The Hungarian system therefore represents a transition from aggregated sales data toward detailed, use-based monitoring aligned with EU requirements.
1.4. Knowledge Gap and Study Objectives
Although systematic AMU reporting is now mandatory, translating raw reporting data into meaningful, farm-relevant indicators remains challenging. AMU metrics must be comparable at the national and international levels while remaining sufficiently simple for interpretation and use at the farm level. In addition, information on farm-specific management factors influencing antimicrobial exposure is often limited.
The objectives of this study were to: (i) characterize AMU in the Hungarian pig sector using mandatory veterinarian-reported data and assess changes in AMU intensity between 2023 and 2024; (ii) characterize the distribution of AMU according to AMEG category, active substance, pharmaceutical form, and route of administration; (iii) identify production stages and farms associated with a disproportionate share of AMU, with particular attention to post-weaning pigs and farms with the highest absolute AMU; and (iv) place pig-sector AMU within the broader context of AMU across food-producing animal sectors in Hungary.
2. Results
2.1. Pig-Sector Antimicrobial Use in 2023 and 2024
Across all reporting pig farms, 1177 farms submitted AMU data in 2023 and 1021 in 2024 (Table 1). The total reported quantity of antimicrobials increased from 30,535.6 to 32,244.5 kg (+5.6%), while the estimated total pig biomass increased by 6.6%. Consequently, AMU intensity decreased slightly from 51.4 to 50.9 mg/kg biomass (−1.0%). Category D remained predominant, although its share decreased from 68.6% to 66.1%; the share of Category C increased from 26.9% to 30.2%. Category B decreased in both absolute quantity and relative contribution.
Table 1.
Overall antimicrobial use in the Hungarian pig sector in 2023 and 2024.
For the all-reporting populations, the increase in absolute antimicrobial quantity was smaller than the increase in the biomass denominator, resulting in a slight decrease in AMU intensity. Absolute quantity and biomass-adjusted intensity therefore describe different aspects of AMU and should not be interpreted interchangeably.
To compare the same farms across years, we defined a longitudinal cohort of 492 farms with complete data for both 2023 and 2024 (Table 2). Animal numbers for these farms were obtained from the Hungarian Pig Breeders and Keepers Association (MSTSZ), and the corresponding antimicrobial quantities were obtained from the NÉBIH reporting system. The numerator was the total active-substance quantity reported for the included farms, and the denominator was the standardized biomass calculated from the MSTSZ animal numbers, as described in Section 4.2 and Section 4.4. These estimates therefore apply specifically to the 492-farm longitudinal cohort and are separate from the all-reporting population summarized in Table 1.
Table 2.
Characteristics and antimicrobial use of the longitudinal study population (492 farms with complete data available for both 2023 and 2024).
The cohort composition was identical in both years: 297 only-fattener farms, 59 breeding farms, and 136 farrow-to-finish farms. Total AMU decreased from 26,961 kg in 2023 to 26,787 kg in 2024, while estimated pig biomass increased from 465,534,120 to 487,337,760 kg (+4.7%). Consequently, AMU intensity decreased from 57.9 to 55.0 mg/kg biomass (−5.1%).
The fixed-cohort comparison showed a larger year-to-year decrease in AMU intensity than the comparison of the two all-reporting populations. Because the same 492 farms were included in both years, the fixed-cohort difference was not caused by changes in cohort membership. However, two years of data are insufficient to establish a sustained temporal trend.
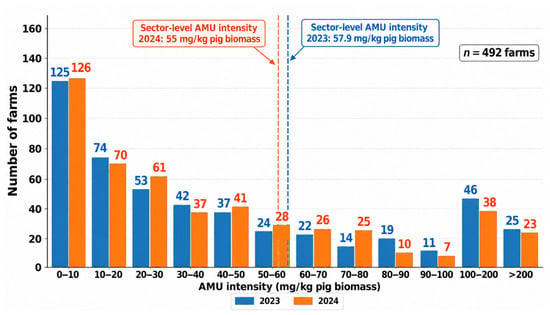
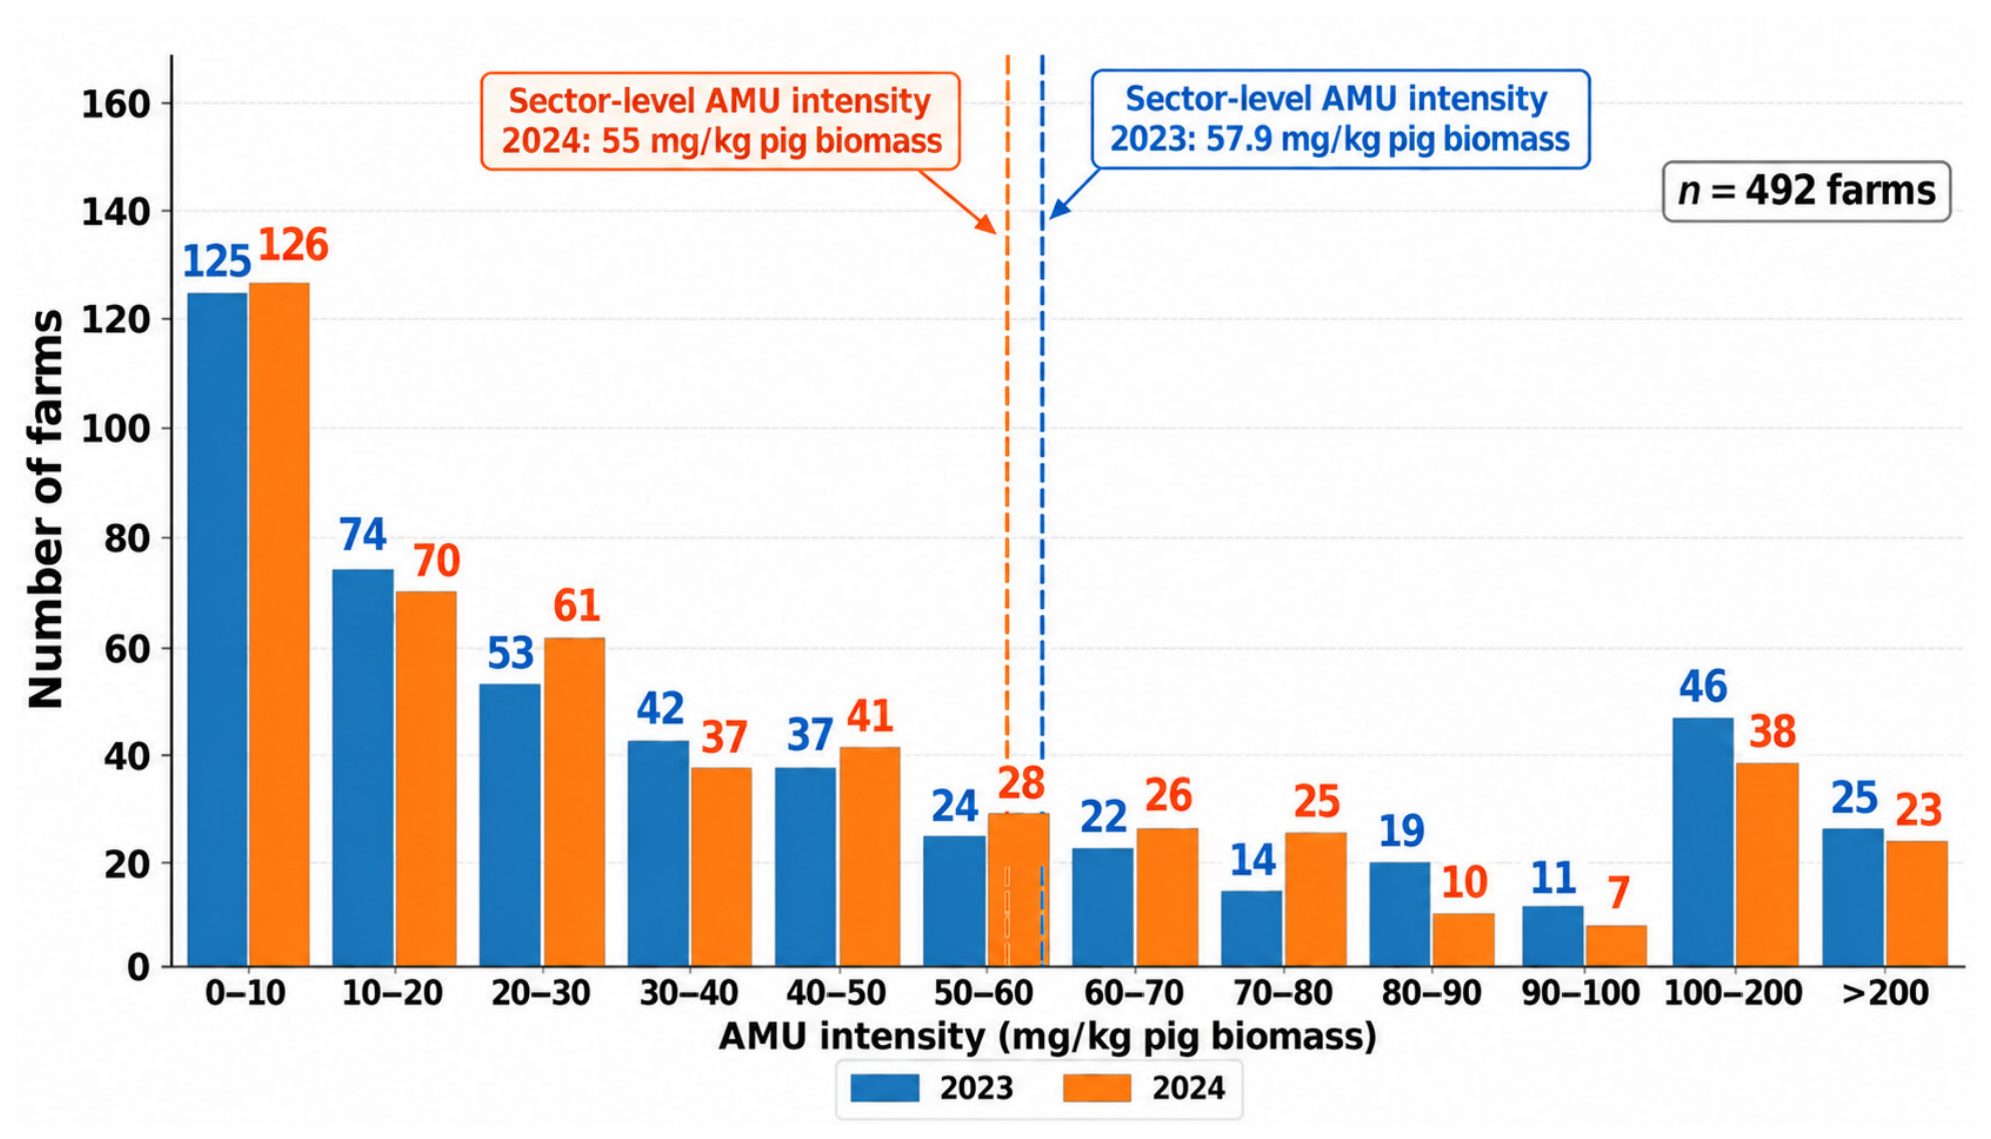
Farm-level analysis further revealed considerable heterogeneity among holdings. Wide variation in mg/kg biomass values was observed across individual farms, indicating an uneven distribution of AMU within the sector. The distribution of farm-level AMU intensity is shown in Figure 1. Among the 492 farms, AMU intensity varied considerably, with most farms concentrated at lower intensity values and a smaller number of farms showing substantially higher AMU intensity.
Figure 1.
Distribution of farm-level antimicrobial use (AMU) intensity in the 492-farm longitudinal cohort in 2023 and 2024. Bars show the number of farms in each AMU-intensity interval. Dashed lines indicate the aggregate cohort-level AMU intensity of 57.9 mg/kg biomass in 2023 and 55.0 mg/kg biomass in 2024.
Farm-level AMU showed a modest reduction between 2023 and 2024 in the longitudinal study population (Table 3). The median decreased from 28.14 to 27.74 mg/kg biomass (−1.4%), while reductions were more pronounced in the upper part of the distribution: P75 decreased by 6.1%, P90 by 13.2%, and P95 by 12.9%. The mean changed only slightly (−1.4%). In contrast, the maximum value increased from 937.13 to 1845.79 mg/kg, indicating the presence of extreme outlying observations despite the lower values observed across the upper percentiles.
Table 3.
Distribution of farm-level antimicrobial-use intensity in 2023 and 2024.
The reduction in the upper percentiles indicates a downward shift in the higher-use part of the AMU distribution between the two years. However, the marked increase in the maximum value demonstrates that extreme high-use observations persisted. As only two consecutive years were analyzed, these differences should not be interpreted as evidence of a sustained temporal trend.
In the 492-farm longitudinal population, aggregate AMU intensity decreased from 57.9 mg/kg biomass in 2023 to 55.0 mg/kg in 2024, corresponding to a reduction of 5.1%. This change occurred alongside a 0.6% decrease in the total quantity of antimicrobials used (from 26,961.0 to 26,787.0 kg) and a 4.7% increase in the aggregate biomass denominator. At the farm level, the distribution of changes in AMU intensity was heterogeneous: 38.9% of farms recorded a reduction exceeding 20%, 40.8% recorded an increase exceeding 20%, and 20.3% remained within ±20% of their previous-year intensity (Table 4). These findings demonstrate substantial variability in the direction and magnitude of changes in the biomass-adjusted indicator. However, changes in AMU intensity cannot be attributed exclusively to changes in antimicrobial consumption or prescribing practices, because the indicator is influenced by both the absolute quantity of antimicrobials used and the biomass denominator. Accordingly, the observed farm-level differences should be interpreted as changes in calculated AMU intensity rather than direct evidence of heterogeneous changes in antimicrobial stewardship behavior. Table 4 presents intensity-change categories only. Paired farm-level antimicrobial quantities and biomass values, and a farm-level numerator–denominator decomposition, are not presented.
Table 4.
Distribution of farms according to the percentage change in biomass-adjusted AMU intensity between 2023 and 2024 in the 492-farm longitudinal population.
2.2. AMEG Category-Specific Changes in Antimicrobial Use Intensity
AMU intensity differed substantially between farm categories (Table 5). Using the original biomass denominator, breeding farms showed markedly higher AMU intensity than the other farm categories in both study years. In 2023, total AMU intensity was 353.8 mg/kg biomass on breeding farms, compared with 61.1 mg/kg on farrow-to-finish farms and 38.3 mg/kg on farms keeping only fatteners. In 2024, the corresponding values were 299.1, 59.5 and 36.5 mg/kg, respectively. When the exploratory denominator calculation accounting for the cumulative monthly sow exposure was applied, as described in Section 4, the total AMU intensity for breeding farms decreased to 29.5 mg/kg in 2023 and 24.9 mg/kg in 2024, bringing the estimates substantially closer to those observed for the other farm categories.
Table 5.
Antimicrobial use intensity (mg/kg biomass) by AMEG and farm category in 2023 and 2024.
The same pattern was observed for the individual AMEG categories. Based on the original denominator, Category D antimicrobials represented the largest component of AMU intensity on breeding farms, with values of 260.8 mg/kg in 2023 and 207.7 mg/kg in 2024. After the exploratory exposure adjustment, these values were 21.7 and 17.3 mg/kg, respectively. Category B intensity decreased from 29.8 to 18.5 mg/kg using the original denominator and from 2.5 to 1.5 mg/kg after the supplementary calculation, while Category C increased from 63.1 to 72.8 mg/kg and from 5.3 to 6.1 mg/kg, respectively (Table 5).
Between 2023 and 2024, total AMU intensity decreased by 4.9% on only-fattener farms, 15.5% on breeding farms, and 2.7% on farrow-to-finish farms, corresponding to a 5.1% decrease across the 492-farm cohort. Category B intensity decreased by 8.2%, 37.9%, and 24.0% in these three farm categories, respectively. Category C intensity increased by 15.4% on only-fattener farms and 15.3% on breeding farms but decreased by 5.9% on farrow-to-finish farms. Category D intensity decreased by 14.4% on only-fattener farms and 20.4% on breeding farms and was essentially unchanged on farrow-to-finish farms (+0.3%) (Table 6).
Table 6.
Change in antimicrobial use (AMU) intensity by AMEG and by farm category between 2023 and 2024.
2.3. Production Groups: Breeding Units and the Nursery Phase
Analysis by production group showed that most AMU on breeding farms was associated with the nursery phase. Specifically, 57.5–86.4% of total AMU reported on breeding units was administered to post-weaning piglets, depending on herd-size category. Table 7 provides a more detailed breakdown of AMU within breeding farms according to production stage, including suckling piglets, weaners and finishers. These production-stage categories differ from the farm-level categories, where fattener farms represent separate fattening farms.
Table 7.
Distribution of antimicrobial use by active substance quantity and production stage within breeding farms, stratified by number of breeding sows.
2.4. AMEG Category B Active Substances: Dominance of Colistin
Analysis of AMEG Category B antimicrobials on farrow-to-finish farms showed that colistin accounted for the largest quantity of Category B use in three of the four herd-size categories. The exception was farms with 500–999 sows, where marbofloxacin accounted for the largest quantity. On farms with at least 2000 sows, colistin represented 91.0% of the total quantity of Category B antimicrobials (Table 8).
Table 8.
Quantity of AMEG category B active substances used in farrow-to-finish farms in 2024, stratified by number of breeding sows.
In 2024, only-fattener farms used a total of 9304.3 kg of antimicrobials. The distribution of absolute AMU and biomass-adjusted intensity by herd-size category is presented in Table 9, and Category B intensity and composition are shown in Table 10. Category B accounted for 1.5% of total AMU on only-fattener farms (143.0 kg; 0.56 mg/kg biomass). Within Category B, colistin accounted for 92.1% (131.7 kg). Thus, colistin dominated the composition of Category B use on these farms, although Category B represented a small share of their total AMU.
Table 9.
Absolute antimicrobial use (AMU) and AMU intensity by herd-size category on only-fattener farms in the Hungarian pig sector in 2024.
Table 10.
AMEG Category B antimicrobial-use (AMU) intensity and the colistin share of Category B use by herd-size category on only-fattener farms in the Hungarian pig sector in 2024.
2.5. Top 10 Active Substances, 2023–2024
The ranking of antimicrobial substances by total quantity used changed between 2023 and 2024, although the three highest-ranked substances remained unchanged (Table 11).
Table 11.
Quantitative distribution of the top 10 antimicrobial active substances, comprising the combined set of substances ranked among the top 10 in either 2023 or 2024, in the 492-farm longitudinal population of Hungarian large-scale pig farms.
In 2024, total use of the top 10 active substances was 24,212.9 kg. Amoxicillin (10,672.0 kg) and doxycycline (4335.8 kg) together accounted for 62% of this total. When tiamulin (3374.1 kg), the third-ranked substance and a common treatment option for respiratory and selected gastrointestinal diseases, was included, the top three substances represented 75.9% of total consumption within the 2024 top-10 list.
In 2024, the category C substance tilmicosin was no longer among the top 10, whereas apramycin, also classified as category C, entered the ranking in fourth position. Concurrently, colistin, the only category B substance included in the top 10, decreased by 26.3% between 2023 and 2024 (Table 11).
2.6. Pharmaceutical Form and Route of Administration
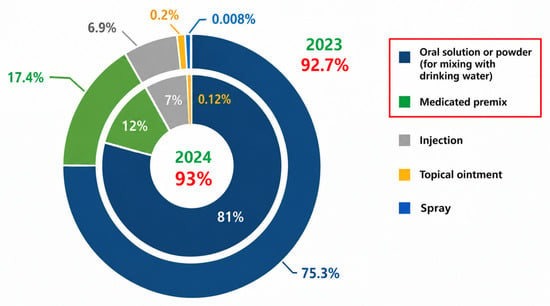
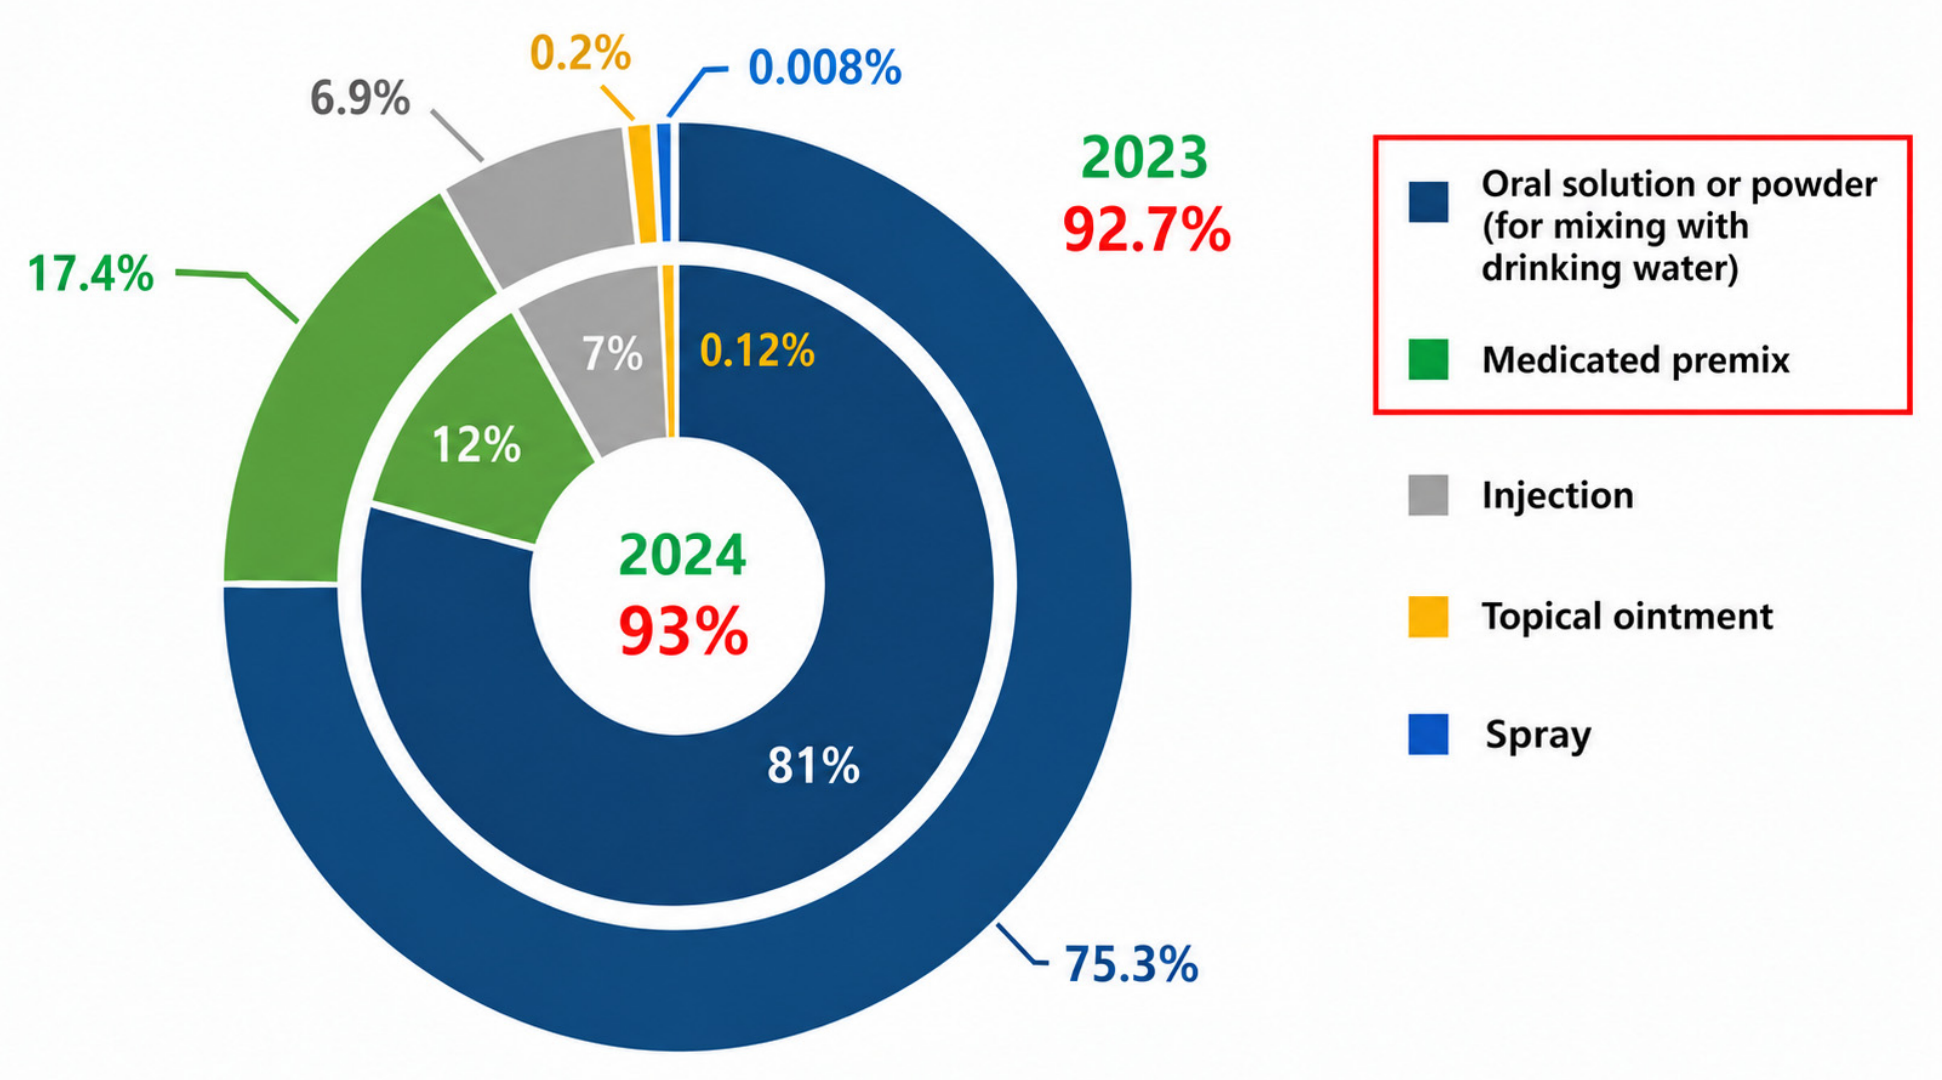
In the Hungarian pig sector, oral formulations for administration through drinking water or medicated feed represented 93% of reported antimicrobial quantity. Reducing reliance on oral group treatment remains an important stewardship objective. Between 2023 and 2024, based on the underlying quantities, medicated-premix use declined by approximately 25%, indicating a potential shift in administration practices. During the same period, antimicrobial administration through drinking water increased by 12%, and injectable formulations for individual treatment increased by 6.2% (Figure 2).
Figure 2.
Distribution of reported antimicrobial quantity by pharmaceutical form in the Hungarian pig sector in 2023 and 2024.
2.7. Highest Absolute-Use Farms
Absolute AMU was concentrated among a relatively small proportion of farms. The 10 farms with the highest absolute use accounted for 25.8% of total antimicrobial quantity while representing 2.0% of the study population. The corresponding shares were 43.3%, 61.5%, and 76.8% for the top 20, 50, and 100 farms, respectively (Table 12).
Table 12.
Distribution of antimicrobial consumption and antimicrobial use intensity among all farms and selected groups of highest-consuming farms in 2024.
Production volume did not fully explain this concentration. The 20 farms with the highest absolute AMU represented 15.9% of cohort biomass but accounted for 43.3% of total antimicrobial quantity. The top 100 farms represented 45.4% of cohort biomass and accounted for 76.8% of total antimicrobial quantity. Absolute use was therefore disproportionately concentrated relative to the biomass represented by these farms.
A similar pattern was observed for AMEG-B antimicrobials. Among the groups ranked by total AMU, the top 10, 20, 50, and 100 farms accounted for 12.9%, 38.2%, 67.4%, and 79.8% of total AMEG-B consumption, respectively, while representing only 2.0%, 4.1%, 10.2%, and 20.3% of the study population (Table 12). Separately, when farms were ranked directly by absolute AMEG-B use, the 20 highest-use farms accounted for 640.8 kg, or approximately 68.8%, of the 931.0 kg of AMEG-B antimicrobials used in the cohort.
AMU intensity also increased markedly among farms ranked according to total antimicrobial consumption. While population-level AMU was 55.0 mg/kg biomass, the corresponding values for the top 10, 20, 50, and 100 farms were 148.0, 149.5, 123.7, and 93.0 mg/kg biomass, respectively. AMU intensity was therefore approximately 2.7-fold higher among both the top 10 and top 20 farms than in the overall study population, decreasing to 2.2-fold and 1.7-fold among the top 50 and top 100 farms, respectively.
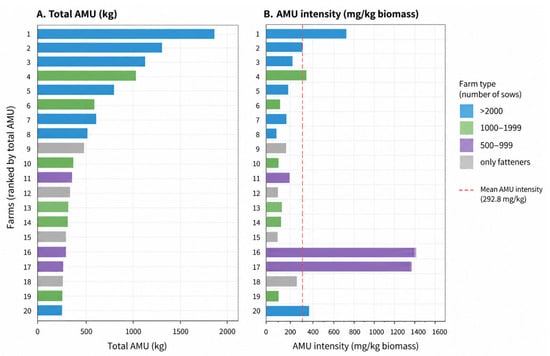
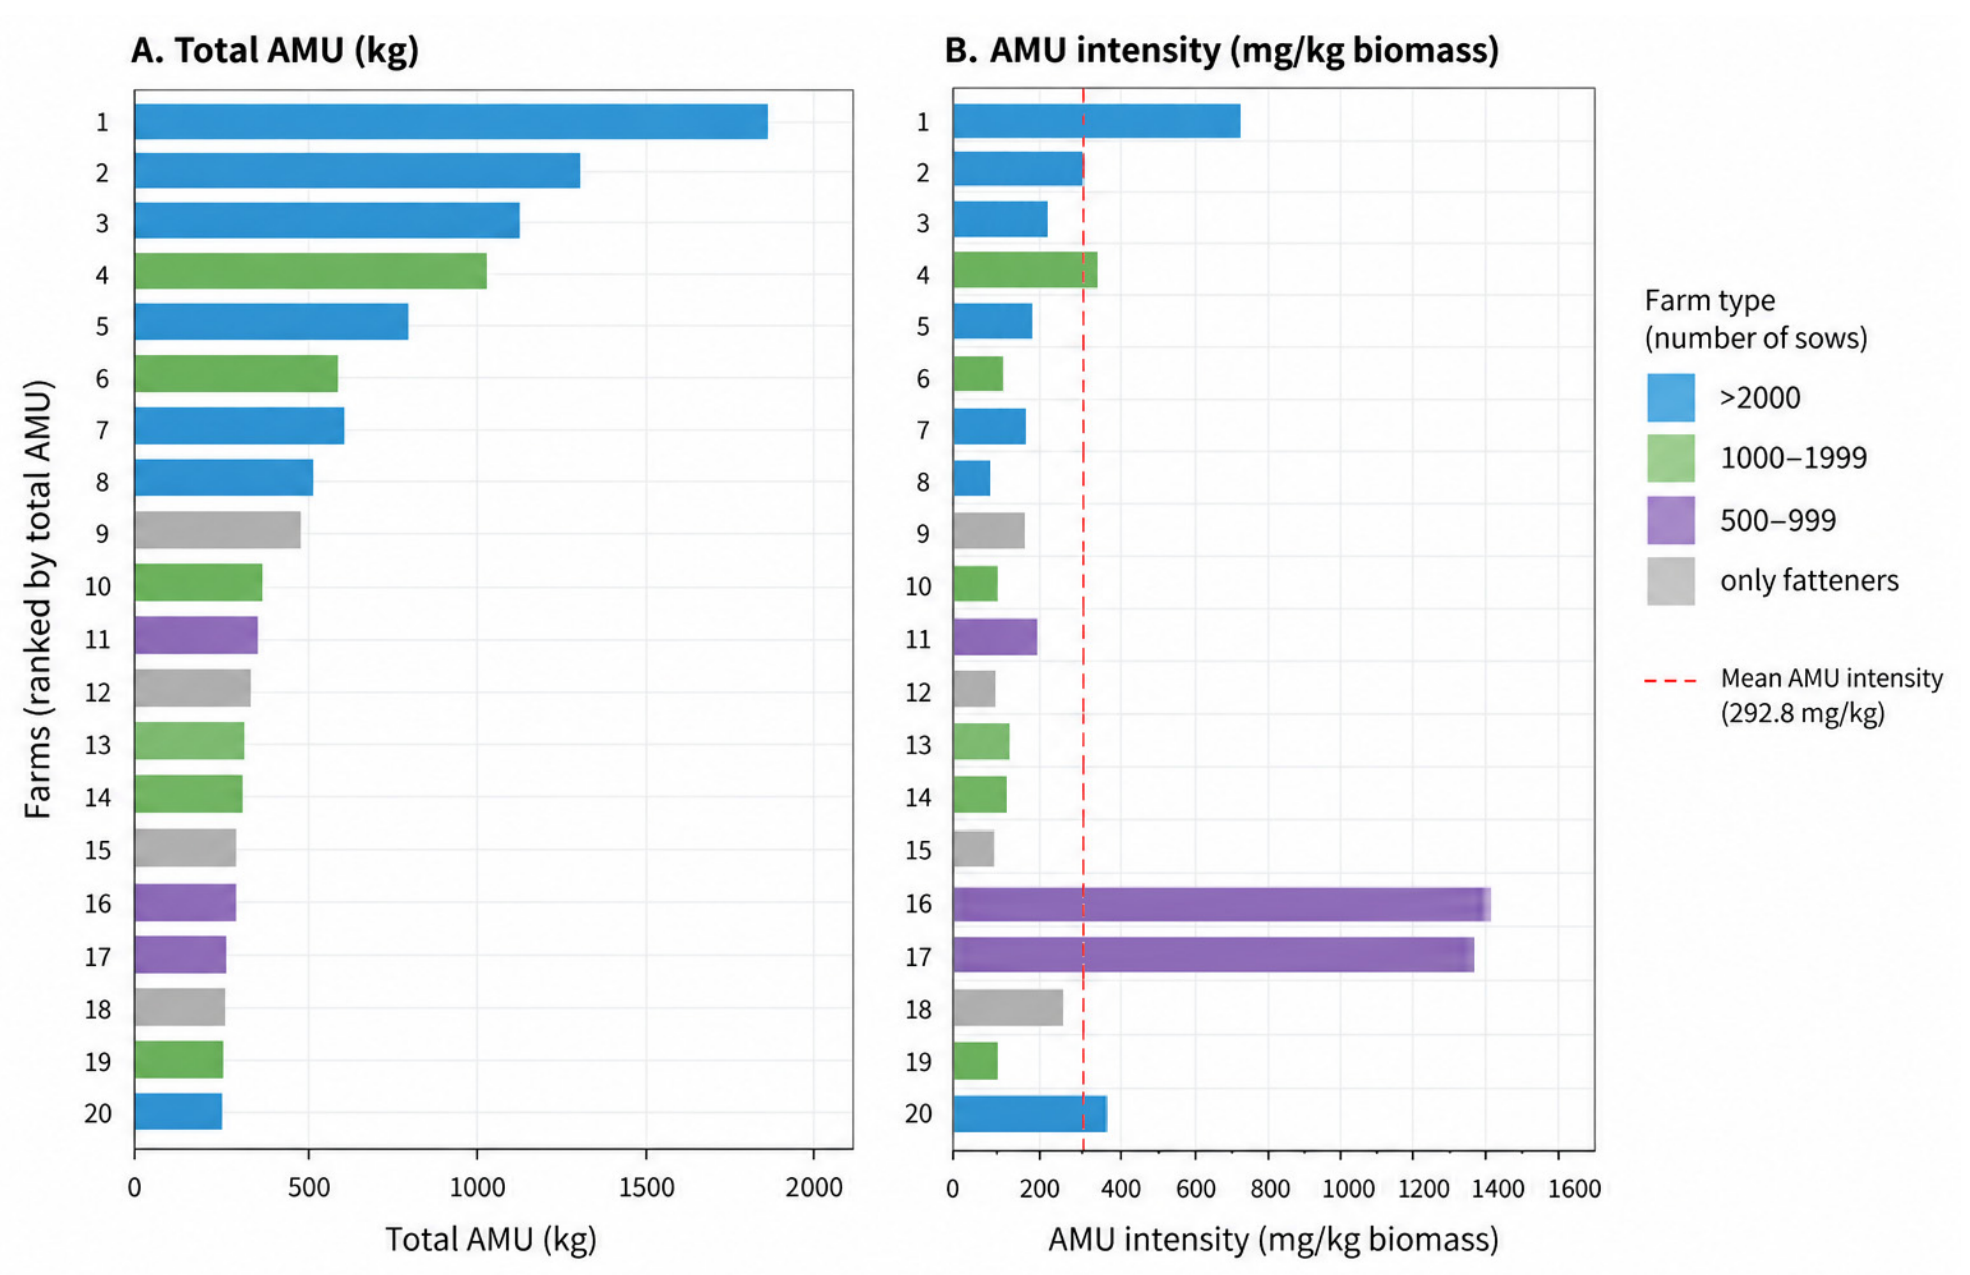
Among the 20 farms with the highest absolute AMU, mean use was 579.6 kg per farm, and the median was 350.7 kg (range: 229.4–1797.5 kg). The arithmetic mean of the farm-level AMU-intensity values was 292.8 mg/kg biomass, and the median was 128.0 mg/kg (range: 52.4–1432.1 mg/kg) (Table 13; Figure 3). The higher mean than median reflects a right-skewed distribution. In Table 12, the Top 20 value of 149.5 mg/kg biomass is the aggregate intensity, calculated by dividing the group’s total antimicrobial quantity by its combined biomass. In Table 13, the mean of 292.84 mg/kg is the arithmetic mean of 20 farm-level intensity values, which gives each farm equal weight. The two statistics therefore answer different questions and are not expected to be identical.
Table 13.
Summary statistics for antimicrobial use (AMU) among the 20 farms with the highest absolute use in the Hungarian pig sector. The final two rows show AMU intensity calculated using the exploratory sow-biomass denominator, whereas the preceding rows use the primary denominator.
Figure 3.
Absolute antimicrobial use (AMU) and AMU intensity among the 20 farms with the highest absolute AMU in 2024. Panel (A) presents total AMU (kg), and Panel (B) presents AMU intensity (mg/kg biomass) on an independent x-axis. Farms are shown in the same ranking order in both panels. The dashed line in Panel (B) indicates the mean AMU intensity (292.8 mg/kg).
To further assess the impact of the denominator definition, a secondary calculation was performed using an exploratory definition of sow biomass to evaluate its influence on the estimated AMU intensity. Using this approach, the mean AMU intensity among the same 20 farms decreased to 75.0 mg/kg biomass, with a substantially narrower range of 23.3–145.4 mg/kg. Thus, the exploratory denominator calculation markedly reduced the extreme AMU intensity values observed under the primary calculation and resulted in a distribution that was more comparable across farms (Table 13).
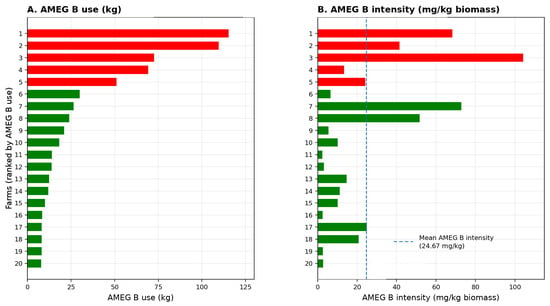
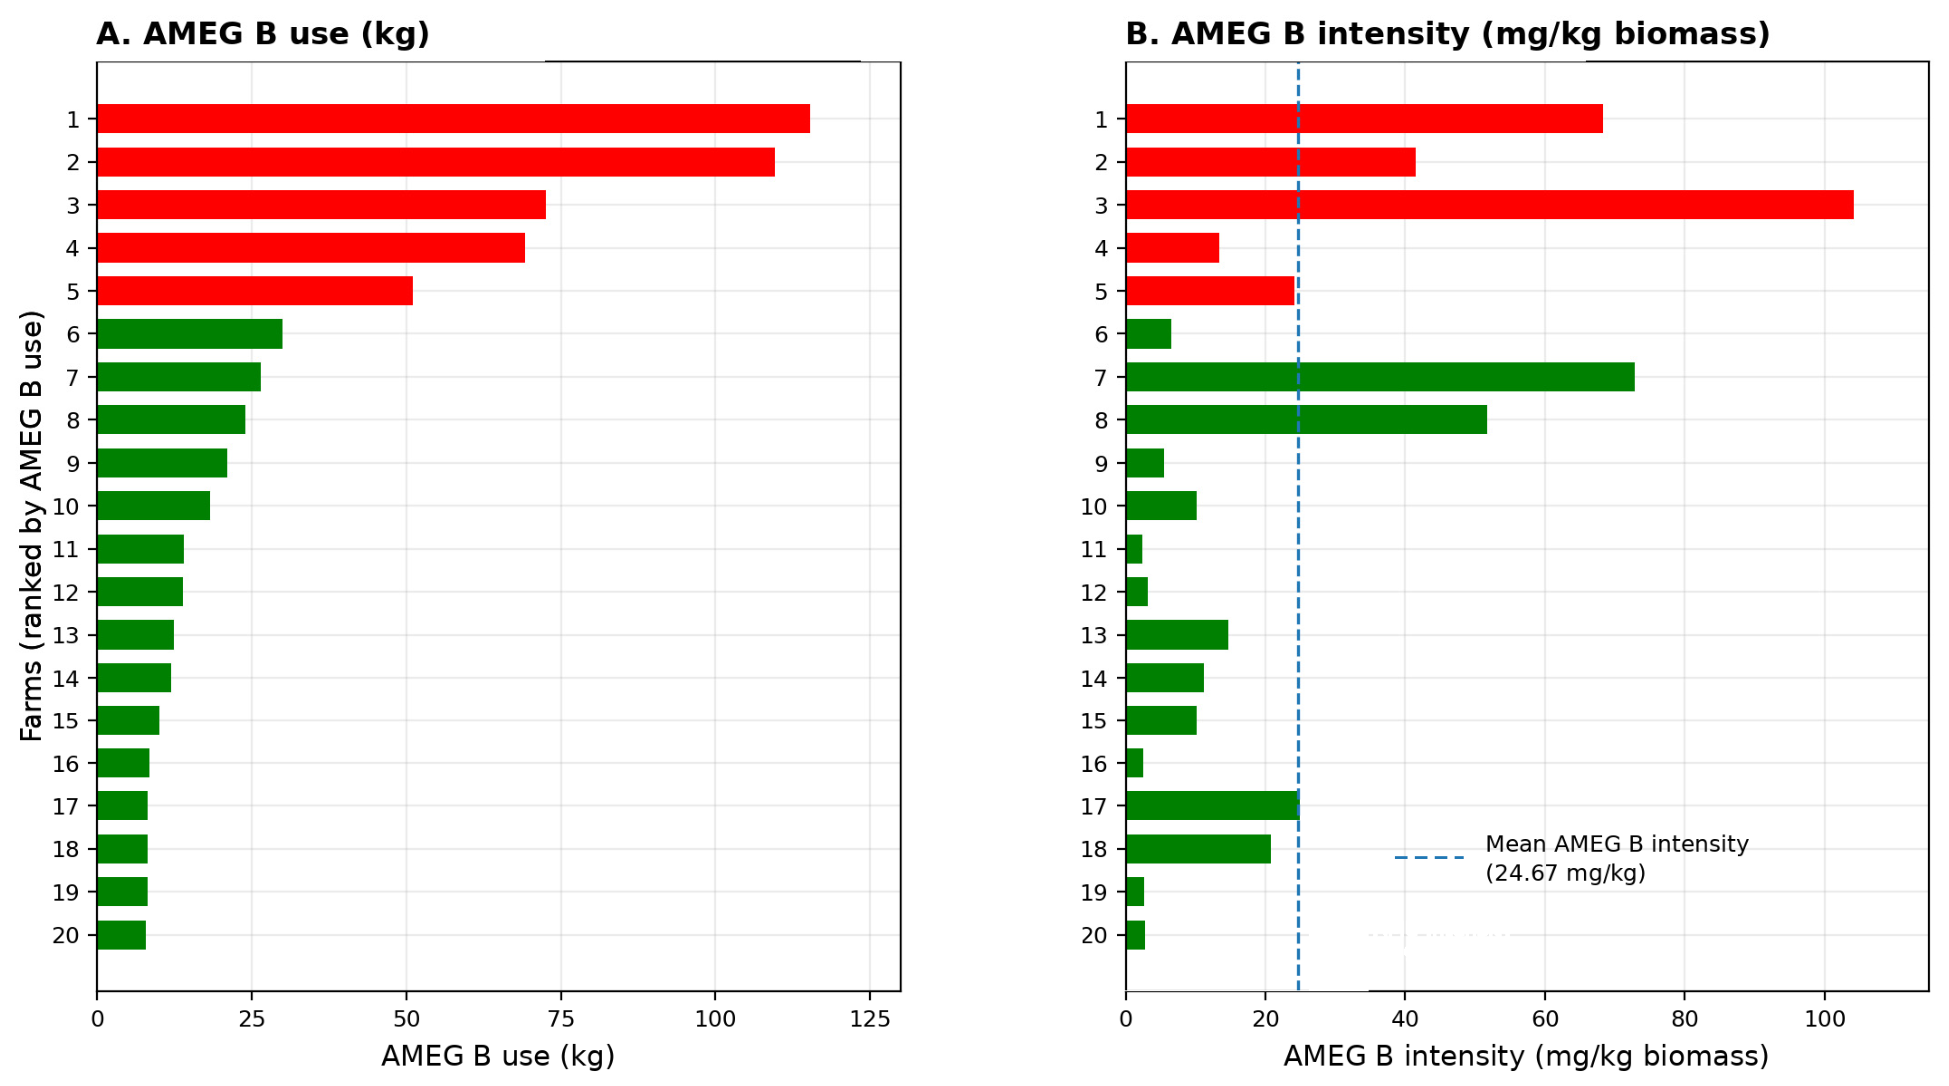
The concentration of AMEG B AMU was also reflected in farm-level indicators. Among the 20 farms with the highest absolute AMEG B use, mean AMEG B intensity was 24.67 mg/kg biomass and the median was 12.30 mg/kg, with values ranging from 2.4 to 104.2 mg/kg. These farms accounted for 640.8 kg of AMEG B antimicrobials, representing approximately 68.8% of the total AMEG B use (931.0 kg) recorded across the 492 farms (Table 14; Figure 4). Thus, approximately 4.1% of the cohort accounted for more than two-thirds of total AMEG B use.
Table 14.
Descriptive statistics of AMEG Category B antimicrobial use among the 20 farms with the highest absolute Category B use in 2024, including exploratory intensity estimates based on the exploratory denominator.
Figure 4.
AMEG Category B antimicrobial use and biomass-adjusted Category B intensity among the 20 farms with the highest absolute AMEG Category B use in 2024. Panel (A) presents absolute Category B use (kg), and Panel (B) presents Category B intensity (mg/kg biomass). Red bars indicate the five farms with the highest absolute Category B use. The dashed line in Panel (B) indicates the mean Category B intensity (24.67 mg/kg).
2.8. Cross-Sectoral Context
Based on the analyzed AMU reports, pigs accounted for the largest absolute quantity of veterinary antimicrobials reported in Hungary, followed by poultry and rabbits (Table 15). These rankings describe reported antimicrobial quantity and do not compare farm-level AMU intensity. Reporting coverage varied across sectors: approximately 80% of active pig and rabbit holdings submitted regular reports, whereas coverage was below 50% for poultry and cattle and lower for small ruminants.
Table 15.
Total reported antimicrobial quantity and species-level distribution across food-producing animal sectors in Hungary, 2023–2024.
The pig-sector quantities in Table 15 are drawn from the broader all-reporting dataset used for the cross-sectoral analysis and are not the numerators used for the 492-farm longitudinal comparison. The increase in pig-sector quantity in Table 15 therefore should not be combined with the fixed-cohort AMU-intensity estimates.
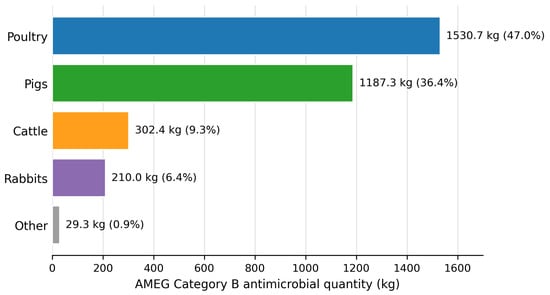
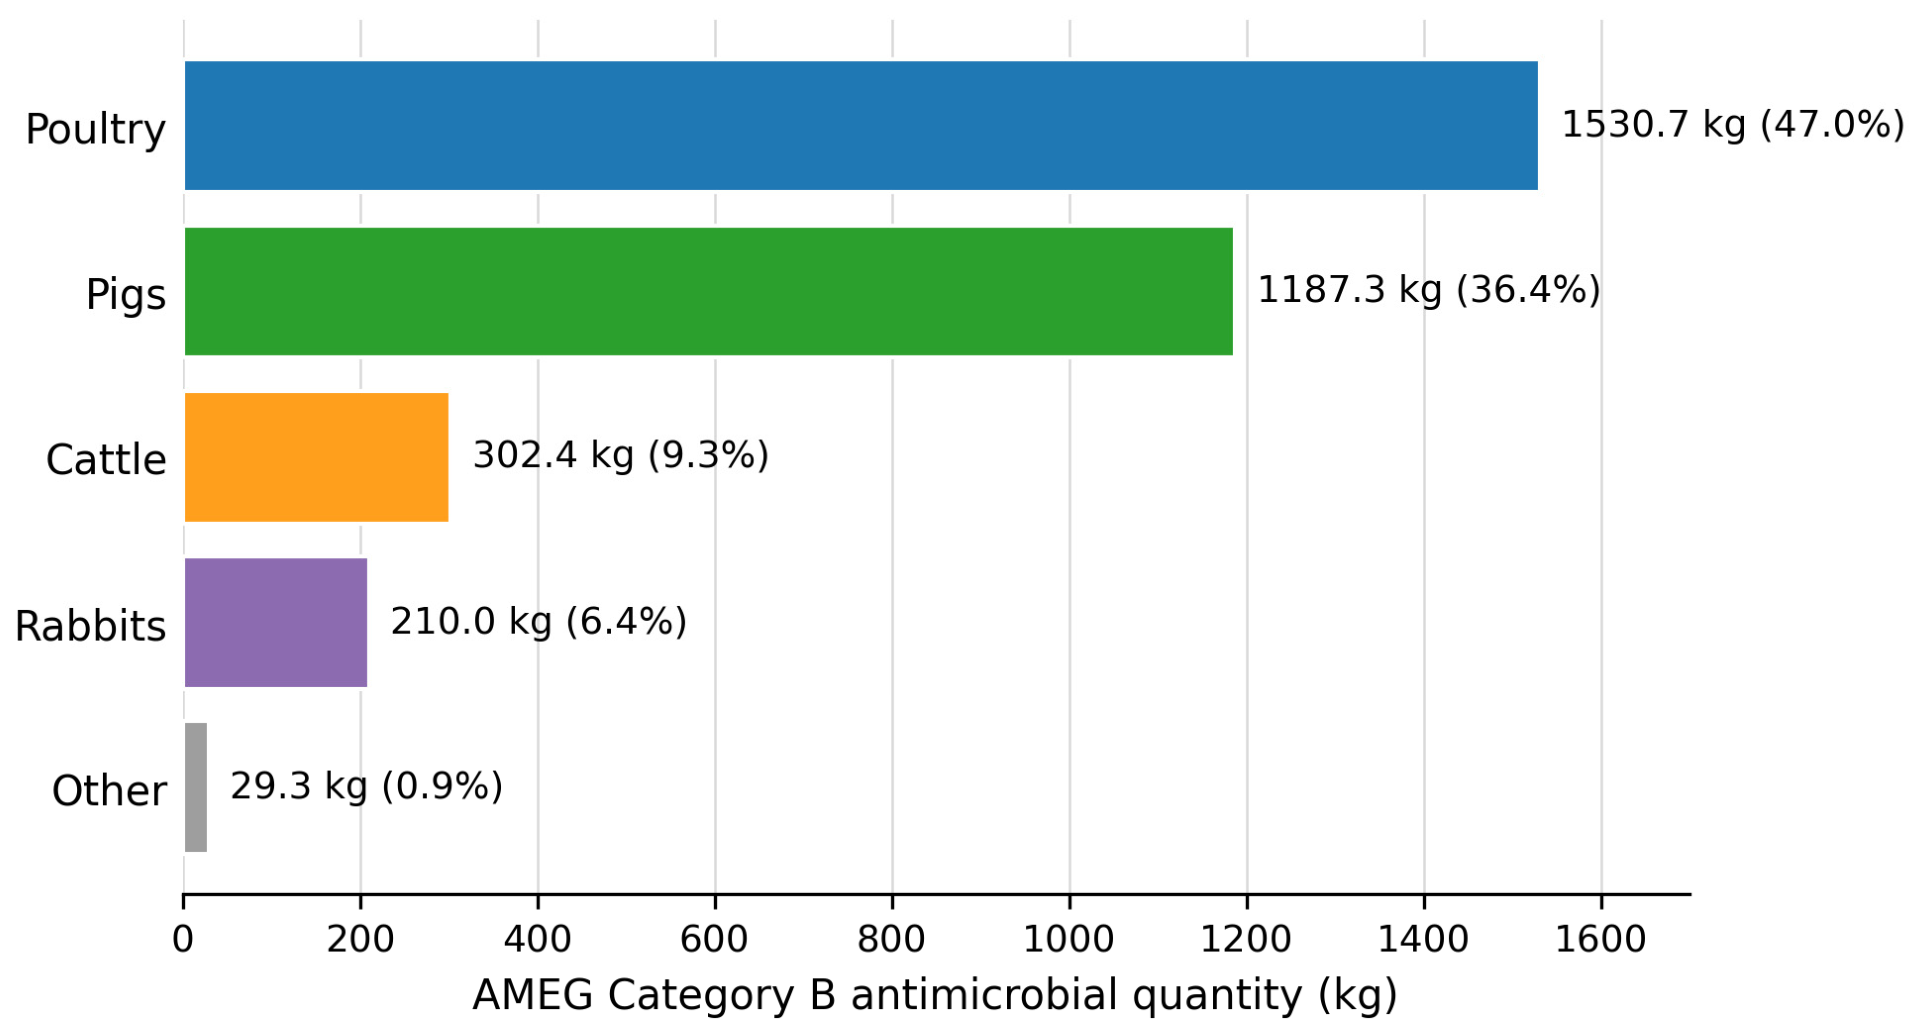
AMEG B antimicrobials accounted for 6.8% of total reported AMU across food-producing animal sectors in 2023 and 6.5% in 2024. Poultry had the highest absolute Category B quantity in both years (1750.0 and 1530.7 kg), followed by pigs (1359.9 and 1187.3 kg), cattle (290.3 and 302.4 kg), and rabbits (282.6 and 210.0 kg) (Table 16). In 2024, poultry accounted for approximately 47.0% and pigs for approximately 36.4% of total AMEG B quantity; together they represented approximately 83.4% (Figure 5).
Table 16.
Antimicrobial use by AMEG category and food-producing animal sector, 2023–2024.
Figure 5.
Distribution of total AMEG Category B antimicrobial quantity across food-producing animal sectors in 2024.
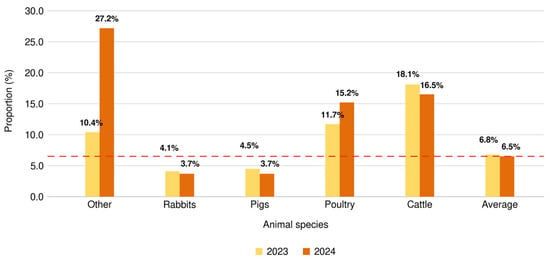
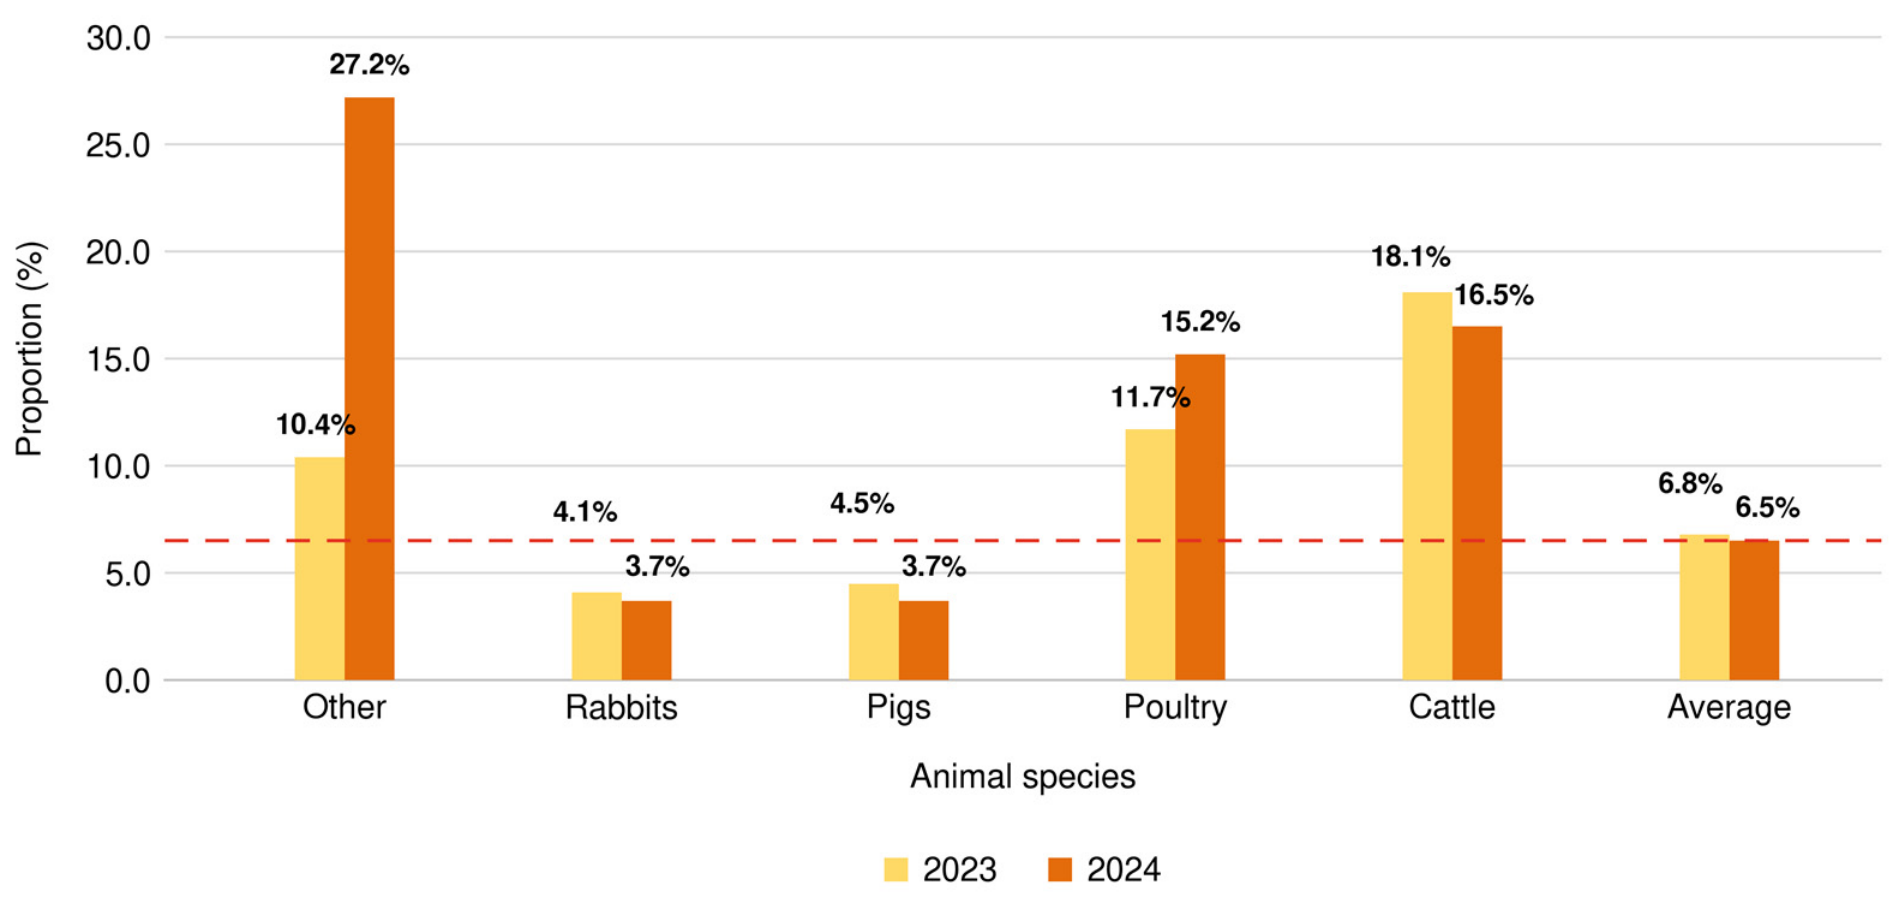
When evaluated within species in 2024, pigs and rabbits had the lowest proportion of AMEG B use relative to total antimicrobial quantity, at 3.7% in both sectors. The corresponding proportions were 27.2% for other species, 16.5% for cattle, and 15.2% for poultry (Figure 6).
Figure 6.
AMEG category B antimicrobials as a percentage of the total antimicrobial quantity used in each animal sector in 2023 and 2024. The red dashed line indicates the overall proportion across all sectors combined in 2024 (6.5%).
Across food-producing animal sectors, AMEG B antimicrobials accounted for 6.8% of total reported AMU in 2023 and 6.5% in 2024. Within the 492-farm longitudinal cohort, the absolute quantity of AMEG B antimicrobials decreased by 22.2%, from 1196.4 to 931.0 kg, whereas AMEG C increased by 10.5%, from 7560.2 to 8355.0 kg. These year-to-year changes are consistent with partial reallocation toward lower-priority classes, but they do not establish a sustained trend or identify the causes of the change.
3. Discussion
3.1. Main Findings
In the fixed cohort of 492 farms, total antimicrobial quantity decreased from 26,961 to 26,787 kg while biomass increased from 465,534,120 to 487,337,760 kg. AMU intensity was therefore 5.1% lower in 2024 than in 2023 (57.9 versus 55.0 mg/kg biomass). In the broader all-reporting population, absolute quantity increased by 5.6%, but biomass increased by 6.6%, resulting in a 1.0% decrease in intensity (51.4 to 50.9 mg/kg biomass). These analyses involve different populations and must remain separate. They also show why absolute quantity and biomass-adjusted intensity can move in different directions. Because only two consecutive years were analyzed, the observed differences describe year-to-year variation in the Hungarian farm-level AMU indicators and cannot establish a sustained temporal trend. Longer-term European sales data provide broader context but do not establish whether the observed difference in the Hungarian farm-level cohort is part of a persistent pattern [19].
The pronounced farm-level heterogeneity in AMU intensity is consistent with evidence from other European settings, where substantial between-farm variation persists despite aggregate reductions [28,29]. Aggregate indicators may therefore obscure clusters of farms with high intensity or high absolute use, supporting targeted farm-level assessment alongside sector-wide measures. Systematic-review evidence that restricting AMU in food-producing animals is associated with lower AMR further supports stewardship interventions [30].
3.2. Interpretation of AMU Intensity in Breeding Farms
A major consideration in interpreting the farm-category-specific AMU estimates concerns the definition of the biomass denominator for breeding farms. Previous studies have highlighted that biomass-based AMU estimates are sensitive to the definition of the denominator and that different indicators may reflect different aspects of the animal population and production process. In particular, denominators based on standing animal populations and those reflecting production throughput can yield substantially different AMU estimates, limiting direct comparisons between production systems [31,32,33].
The sow data available for this study describe the average number of sows present during the year rather than the annual throughput of animals. Consequently, multiplying this average inventory by the ESUAvet standard live weight of 240 kg yields an estimate of the average standing biomass of the sow herd. In contrast, the denominator for fattening pigs is more closely related to the biomass passing through the production system during the year. Thus, the two denominators do not represent exactly the same type of production exposure.
This difference provides an important context for the substantially higher AMU intensity initially observed on breeding farms. When annual AMU accumulated over a full year is related to an average standing biomass, the denominator may be relatively small compared with the amount of AMU recorded during the same period. This can result in considerably higher mg/kg estimates without necessarily indicating a proportionally higher treatment intensity.
This issue is relevant not only for statistical interpretation but also for practical farm-level benchmarking. At the farm level, veterinarians and farm managers may reasonably wish to know how the AMU of an individual holding relates to national or sector-level indicators expressed as mg/kg biomass or mg/PCU. These indicators are currently among the principal standardized measures available for national and European surveillance. However, when the available farm-level population data describe a standing animal inventory rather than annual production throughput, direct comparison may be affected by the way the denominator represents the population at risk. Alternative farm-level indicators based on defined daily doses, treatment incidence, or animal-time exposure may provide additional information, but these measures are not currently available as a single harmonized benchmark against which Hungarian farm-level AMU expressed in mg/kg biomass can be directly compared with national or EU-level indicators.
For this reason, we performed a secondary exploratory calculation to illustrate the potential magnitude of this denominator effect. The average annual sow inventory was multiplied by 12 before applying the standard 240 kg sow weight. The factor of 12 was not intended to imply that the true sow biomass is twelve times larger, nor was it intended as a validated correction for sow turnover. Rather, it represents a simple annual exposure-time proxy in which the average monthly standing population is conceptually accumulated across the 12 months of the reporting year. This calculation was therefore designed as a sensitivity analysis to demonstrate how strongly the resulting mg/kg value can depend on whether the denominator is interpreted as standing biomass or as a cumulative population-at-risk over the reporting period.
Using this exposure-time-adjusted denominator, the total AMU intensity on breeding farms decreased from 353.8 to 29.5 mg/kg in 2023 and from 299.1 to 24.9 mg/kg in 2024. The purpose of these values is not to propose 29.5 or 24.9 mg/kg as the correct AMU intensity for breeding farms. Rather, the difference between the primary and exploratory estimates demonstrates the magnitude of uncertainty introduced by denominator construction and illustrates why apparently high farm-level mg/kg values should not automatically be interpreted as proportionally higher antimicrobial exposure.
The exploratory calculation also highlights a broader methodological challenge for farm-level AMU surveillance. A single indicator may be required to serve two different purposes: standardized aggregation and comparison at national or European level, and meaningful interpretation of antimicrobial exposure at individual-farm level. These objectives are not necessarily fully compatible when production systems differ in population turnover and the available denominator data describe different aspects of the population. Therefore, we present the exposure-adjusted calculation explicitly as exploratory and use it to demonstrate the sensitivity of the indicator rather than as a replacement for the primary ESUAvet-based denominator.
Despite this limitation, the 2023–2024 comparison provides descriptive information on differences in AMU intensity across farm categories. AMU intensity was 15.5% lower in breeding farms, 4.9% lower in only-fattener farms, and 2.7% lower in farrow-to-finish farms in 2024 than in 2023. These year-to-year differences should be interpreted alongside the observed changes in antimicrobial class composition and do not establish a sustained temporal pattern.
3.3. Interpretation of AMEG Shifts
Category B antimicrobials represented the smallest share of pig-sector use and their intensity decreased in all three farm categories. Category C intensity increased on only-fattener and breeding farms but decreased on farrow-to-finish farms, while Category D remained dominant. These descriptive changes are compatible with stewardship priorities that restrict critically important antimicrobials, but they also indicate that changes in total AMU may involve substitution between classes.
The European Medicines Agency reported that sales of polymyxins, including colistin, decreased across Europe by 81% between 2011 and 2022, whereas sales of third- and fourth-generation cephalosporins and fluoroquinolones decreased by 49% and 24.7%, respectively [19]. The 2022–2023 EFSA–ECDC report documents continuing EU-level AMR surveillance and heterogeneous trends in indicator Escherichia coli across countries; therefore, any colistin-specific resistance trend should be interpreted with reference to the exact microorganism, country, and table reported in that source [34].
The farm-category results require careful interpretation because the reporting system does not capture treatment indications. On breeding farms, Category B intensity decreased by 37.9%, while Category C increased by 15.3%. On only-fattener farms, colistin accounted for 92.1% of Category B quantity, but Category B represented only 1.5% of total antimicrobial quantity and 0.56 mg/kg biomass. Colistin’s dominance within Category B on finisher-only farms therefore should not be described as high overall colistin use. Without indication-level clinical and diagnostic data, the observed class composition cannot be attributed to post-weaning diarrhea or another specific disease pressure.
3.4. Farms with the Highest Absolute Use as Priority Targets
AMU was highly heterogeneous across farms. Among the 20 farms ranked by highest absolute antimicrobial quantity, the arithmetic mean farm-level intensity was 292.8 mg/kg biomass and the median was 128.0 mg/kg (range: 52.4–1432.1 mg/kg). These farms accounted for 43.3% of total cohort antimicrobial quantity and 38.2% of cohort Category B quantity. Separately, the 20 farms ranked by highest absolute Category B use accounted for approximately 68.8% of total cohort Category B quantity. The distinction between rankings based on total AMU and rankings based specifically on Category B use is therefore important when identifying priority farms.
Larger farms generally had higher absolute AMU but lower biomass-adjusted intensity, which highlights the importance of normalized measures for farm-level comparisons. An exploratory denominator sensitivity analysis showed that the calculated intensity was strongly influenced by the definition of sow biomass, with the use of this denominator reducing the mean intensity from 292.8 to 75.0 mg/kg and narrowing the range from 52.4–1432.1 to 23.3–145.4 mg/kg. Part of the observed variability may therefore reflect denominator construction rather than AMU alone. Harmonized biomass denominators would improve comparability. The concentration of absolute AMU supports targeted audit and feedback for the relatively small number of farms contributing a disproportionate share of total use.
Comparable farm-level studies have demonstrated substantial variation in AMU among holdings and shown that benchmarking outcomes depend on the use of consistent indicators and transparent classification criteria [28,29]. To ensure reproducibility and policy relevance, a national protocol should be established that explicitly specifies whether farms are ranked according to the total kilograms of active substance used, mg/kg biomass intensity, standardized treatment frequency, or a combination of these indicators. This distinction is critical because the choice of metric can materially influence farm classification, the identification of priority holdings, and subsequent antimicrobial stewardship decisions.
3.5. Production-Stage Drivers and Post-Weaning Management
The distribution of AMU within breeding operations identifies the post-weaning period as a critical control point. In the present study, 57.5–86.4% of AMU on breeding farms was attributed to nursery, or post-weaning, pigs, consistent with the vulnerability of this production stage to gastrointestinal and respiratory disease. These findings align with international evidence identifying the post-weaning period as a high-risk phase for antimicrobial consumption.
In Ontario, Canada, nursery pigs had the highest AMU intensity when measured by mg/kg biomass and Canadian defined daily dose rates, and preventive use was prominent in feed- and water-administered treatments in that study [35]. Similarly, U.S. veterinarians reported that 55–60% of AMU in growing pigs occurs during the nursery phase, with 11 of 19 active ingredients used predominantly in nursery pigs aged 3–10 weeks [36].
The concentration of use among a limited set of active substances and the continuing role of colistin within Category B identify priorities for veterinary review, but the data do not establish treatment indications. In breeding units, high Category B use coincided with the concentration of overall AMU in the post-weaning phase. On only-fattener farms, however, the reporting data cannot link colistin use to post-weaning diarrhea or another specific condition. Appropriate interventions include stronger biosecurity, vaccination where indicated, improved diagnostics, and veterinary decision support for targeted therapy.
3.6. Administration Practices and Precision of Treatment
Oral formulations accounted for 93% of reported antimicrobial quantity. Medicated-premix use decreased by approximately 25%, while drinking-water and injectable formulations increased by 12.0% and 6.2%, respectively. These descriptive changes indicate a shift in formulation mix, but the available data do not show whether treatment became more precise at the individual-animal level.
Hungarian pig production reflects a broader European pattern in which oral solutions, premixes, and oral powders account for most antimicrobial veterinary medicinal product sales [37]. From a stewardship perspective, route of administration is relevant because it affects exposure patterns, dosing accuracy, therapeutic effectiveness, and environmental release. A Belgian qualitative risk assessment identified moderate-to-high risks of reduced homogeneity and stability in both medicated feed and drinking water, driven by human error during preparation, feed-intake variability, and dosing-pump inconsistencies [38]. Therefore, any claims that changing administration routes improves bacteriological outcomes or reduces prophylactic use should be supported by external evidence or presented explicitly as hypotheses.
3.7. Data Quality and System Limitations
Several limitations are inherent in the current reporting framework. First, although national legislation [25] requires treatment indications to be recorded in farm treatment logs—a requirement that extends beyond the corresponding provisions of EU legislation—these data are not incorporated into the official AMU dataset. Consequently, the relationship between specific antimicrobial classes and the clinical indications for which they are used cannot be assessed directly. Second, reporting errors and coding practices may introduce bias. For example, multiple production sites may be reported under a single holding code, potentially obscuring differences in AMU among individual sites. These limitations are not unique to Hungary but reflect broader challenges affecting AMU surveillance systems across Europe.
A quality assessment of the Norwegian veterinary prescription register (VetReg) for 2023 found that data were only 85% complete in the first year of mandatory AMU reporting, with accuracy issues affecting animal-category classification and package-size or use values that deviated strongly from sales records [39]. The 2024 ESUAvet report similarly confirmed persistent variability in coverage and accuracy, with only 51% of EU pig biomass represented by countries achieving at least 90% coverage [37].
Third, an important limitation of the farm-level analysis is that changes in biomass-adjusted AMU intensity do not necessarily reflect changes in antimicrobial prescribing or treatment behavior. The indicator is determined by both the absolute quantity of antimicrobials used and the biomass denominator, which may vary between years because of changes in production volume, herd composition, animal turnover, or the population structure represented in the reported data. Consequently, a decrease in AMU intensity may occur without a corresponding decrease in the absolute quantity of antimicrobials used, while an increase in intensity does not necessarily indicate less responsible AMU. Although aggregate antimicrobial quantities and biomass are reported for the longitudinal population, paired farm-level quantities and biomass values and a farm-level numerator–denominator decomposition are not presented. Therefore, Table 4 describes changes in calculated intensity only and cannot establish differences in prescribing behavior or stewardship performance. Furthermore, the available annual indicators do not independently establish the underlying clinical, management, or prescribing decisions responsible for the observed changes.
Fourth, clinical antimicrobial susceptibility testing results are not captured in a centralized system, limiting the ability to triangulate AMU patterns with resistance phenotypes. A systematic review of European AMR monitoring systems identified data management and representativeness as major weaknesses, with passive sample collection limiting the reliability of AMR surveillance [40]. Together, these constraints indicate that AMU benchmarking should be accompanied by continuous data validation, standardized reporting guidance, and stronger integration of diagnostic information streams.
Finally, farm-level AMU-intensity estimates were sensitive to the biomass-denominator definition, particularly for breeding farms. The primary and exploratory approaches produced substantially different intensity estimates and a narrower range under the exploratory definition. Farm comparisons may therefore reflect both AMU and the way biomass is defined. Rankings and between-farm differences should be interpreted cautiously when annual animal throughput cannot be derived directly from available inventory data.
3.8. Implications for Benchmarking and Action Planning
The lower AMU intensity observed in 2024 and the concentration of use among a limited number of farms support consideration of a farm-level benchmarking and feedback framework. Such a framework should distinguish farms ranked by absolute quantity from those ranked by biomass-adjusted intensity and should use transparent thresholds and structured veterinary review. The two-year comparison alone does not demonstrate a sustained national trend.
Farm-level studies from the Belgian–Dutch border region demonstrate the importance of linking AMU patterns with biosecurity assessment [29], while multicountry farm-level analyses show that AMU estimates and farm rankings are sensitive to data sources, indicators, and classification rules [28]. Danish data-based health surveillance further illustrates how surveillance outputs can support antimicrobial stewardship in pig production [41].
In a sector-led stewardship framework, a pragmatic approach would be to: (i) formalize farm-level indicators, including mg/kg biomass and AMEG composition; (ii) establish transparent thresholds, such as top-decile status or persistent exceedance; (iii) implement standardized audit tools focused on factors associated with increased AMU; and (iv) provide structured veterinary decision support and training.
4. Materials and Methods
4.1. Study Design and Reporting Period
This retrospective descriptive study analyzed AMU in the Hungarian pig sector using mandatory farm-level reporting data. In accordance with Regulation (EU) 2019/6, Member States are required, from 2024 onward, to transmit national data on veterinary antimicrobial sales and use to the European Medicines Agency (EMA) [20,21]. Hungary implemented an electronic AMU data collection system in 2022, operated by the National Food Chain Safety Office (NÉBIH).
The primary analysis used AMU data submitted for the 2024 reporting year for domestic pigs (Sus scrofa domesticus). Data from the 2023 reporting year were used as a comparator to assess changes in AMU intensity and antimicrobial class composition between reporting years.
4.2. Data Sources and Population Coverage
AMU data were extracted from the NÉBIH electronic reporting platform, which is integrated into the national Client Profile System. Veterinarians who prescribe or administer antimicrobial treatments are legally required to submit monthly reports by the 15th day of the following month. Reports are farm-code-based and include product name, formulation, package size, quantity used, active substance, treated species, production category, number of treated animals, and, for medicated feed, inclusion rate and total feed quantity. The reporting system uses the national veterinary medicinal product register, which is synchronized with the Union Product Database (UPD), as the source for product and package selection. Each farm is identified by a unique farm identifier, which is checked by the system during data entry.
The primary year-to-year analysis used a longitudinal cohort of 492 large-scale pig farms with complete AMU records for both 2023 and 2024. Large-scale farms were defined under national legislation as holdings with at least 100 pigs [42]; the analytical cohort comprised MSTSZ-registered farms with at least 50 sows and/or at least 100 finishers. The same 297 only-fattener farms, 59 breeding farms, and 136 farrow-to-finish farms were included in both years. Within breeding farms, AMU was additionally assigned to the relevant production stage to distinguish the use in suckling piglets, weaners, and finishers. Thus, the term ‘fattener’ refers to a farm-level category representing a separate fattening farm, whereas ‘finisher’ refers to pigs in the growing/fattening production stage that may also be kept within a breeding farm. MSTSZ animal numbers were used to calculate farm biomass, and the corresponding antimicrobial quantities were obtained from the NÉBIH reporting system. The broader all-reporting populations comprised 1177 farms in 2023 and 1021 in 2024 and were analyzed separately in Table 1 and the cross-sectoral analysis in Table 15.
4.3. Inclusion and Exclusion Criteria and Data Cleaning
Finisher and breeding farms were evaluated separately where relevant. An automated validation rule prevents the same reporter from submitting more than one record for the same farm and veterinary medicinal product. Mandatory fields must be completed before submission; consequently, records with missing mandatory information cannot enter the reporting dataset. Data cleaning and validation were performed using internal NÉBIH quality procedures aligned with Commission Delegated Regulation (EU) 2021/578 [20]. The main data-quality checks concerned reported antimicrobial quantities and numbers of animals treated. AMU was calculated per animal unit for each species, and records yielding unusually high or otherwise implausible values were flagged for manual review. Additional verification was performed when the calculated dose differed substantially from the dose recommended in the Summary of Product Characteristics (SPC), or when the reported treatment indicated potential off-label use. Such records were verified with the reporting veterinarian, and implausible outlying records that could not be confirmed or validated were excluded from the calculations. Production-category consistency was also checked; records with inconsistent production-type coding, such as AMU in sows reported under finisher-farm codes, were excluded to minimize misclassification bias. Thus, exclusions were limited to records failing the production-category consistency check or records with implausible values that could not be validated. Data management was coordinated by the Data Collection Department of NÉBIH.
4.4. AMU Indicators and Biomass Calculation
AMU was expressed as milligrams of active substance per kilogram of biomass (mg/kg), in line with EMA methodological guidance [43]. The numerator was the total quantity of active substance used, expressed in milligrams. The denominator was total farm biomass, expressed in kilograms and calculated as follows:
Biomass (kg) = number of animals × standardized live weight (kg).
Standardized EMA ESUAvet live weights of 120 kg for slaughter pigs and 240 kg for sows were applied. The mg/kg biomass indicator enables standardized comparison across farms and is aligned with EU-level reporting requirements.
For farms keeping sows, the reported sow number represented the average number of sows present on the farm during the year rather than the annual number of animals passing through the production system. For sows, the primary biomass denominator was calculated using the average annual sow inventory multiplied by the ESUAvet standard live weight of 240 kg. Because the available sow data represented the average annual inventory rather than annual animal throughput, the primary denominator represents standing sow biomass and is not directly equivalent to a throughput-based denominator.
Because the objective of the study was also to examine the practical comparability of farm-level AMU indicators with national and European biomass-based indicators, a secondary exploratory calculation was performed to illustrate the effect of incorporating exposure time into the denominator. For this calculation, the average annual sow inventory was multiplied by 12 before applying the ESUAvet standard live weight of 240 kg. The factor of 12 corresponds to the 12 months of the reporting year and should be interpreted as a simple cumulative monthly population proxy rather than as an empirically validated sow-turnover or lifespan correction.
The exploratory calculation was therefore not intended to define an alternative official biomass denominator or to imply that the actual sow biomass was twelve times greater. Its purpose was to quantify the sensitivity of the mg/kg indicator to the conceptual distinction between standing population biomass and cumulative population exposure over the reporting period. The resulting values were interpreted only as an exploratory sensitivity analysis and were not used for the primary longitudinal comparison or for the principal farm-level AMU estimates.
For each farm in the longitudinal population, the percentage change in AMU intensity between 2023 and 2024 was calculated and used to classify farms into the categories presented in Table 4. AMU intensity was expressed as mg/kg biomass. At the aggregate cohort level, changes in absolute antimicrobial quantity and biomass were reported alongside the change in intensity (Table 2; Section 2.1). The mathematical relationship between these components is I2024/I2023 = (A2024/A2023)/(B2024/B2023), where I denotes AMU intensity, A the absolute antimicrobial quantity, and B the biomass denominator. This identity explains how either component can affect intensity; it does not constitute a farm-level numerator–denominator decomposition. Table 4 was used only to describe changes in the calculated indicator, not to infer changes in antimicrobial prescribing or stewardship behavior.
4.5. AMEG Classification
After aggregation by active substance, AMU data were categorized according to the EMA Antimicrobial Advice Ad Hoc Expert Group (AMEG) classification, categories A–D [44]. This classification enabled qualitative assessment of shifts in antimicrobial class use, with particular attention to category B antimicrobials, which include substances considered critically important for human medicine.
4.6. Definition of Farms with the Highest Absolute Use
For the descriptive concentration analysis, farms were ranked by absolute active-substance quantity (kg), and the selected groups are therefore described as farms with the highest absolute use. AMU intensity (mg/kg biomass) was calculated separately for farm-level comparison. Category B rankings were likewise based on the absolute quantity of Category B active substances. Keeping these measures separate avoids classifying a large farm with high total quantity as necessarily having high biomass-adjusted intensity.
4.7. Statistical Analysis
Data aggregation and descriptive statistical analyses were performed using Microsoft Excel for Microsoft 365 (version 2610, build 16.0.20527.20088, 64-bit; Microsoft Corporation, Redmond, WA, USA). Results are reported as totals, proportions, percentage changes, and AMU intensity, expressed as mg/kg biomass. Analyses were stratified by reporting year, production type, farm-size category, AMEG category, active substance, pharmaceutical form, and route of administration. No inferences were made at the individual-animal level.
Farm-level AMU intensity distributions were described using the minimum, 25th percentile (P25), median (P50), 75th percentile (P75), 90th percentile (P90), 95th percentile (P95), maximum, and arithmetic mean. Percentage change between 2023 and 2024 was calculated as (2024 value − 2023 value)/2023 value × 100. For farms with observations available in both years, this calculation was also applied at the farm level, and farms were subsequently assigned to the predefined percentage-change categories used in the analysis.
For the analysis of farms with the highest total AMU, farms were ranked according to their 2024 absolute active-substance quantity (kg). The Top 10, Top 20, Top 50, and Top 100 groups comprised the 10, 20, 50, and 100 farms with the highest absolute antimicrobial quantity, respectively. For each group, the number and proportion of farms, total antimicrobial quantity and its share of total AMU, AMEG-B quantity and its share, biomass and its share, aggregate AMU intensity, and the ratio of group AMU intensity to the AMU intensity of all 492 farms were calculated. A separate ranking based on absolute AMEG-B quantity was used for the Category B-specific analysis shown in Table 14 and Figure 4.
For high-use farms, antimicrobial quantity and AMU intensity were summarized using the mean, median, standard deviation, and range. Intensity estimates in the final two rows of Table 13 were calculated using the exploratory sow-biomass denominator. No confidence intervals are reported in Table 13.
All analyses were descriptive, and no inferential hypothesis tests were performed.
4.8. Ethics and Data Governance
Routinely collected regulatory data were used in this study. All analyses were conducted on aggregated farm-level datasets in compliance with national and EU data governance requirements. No individual personal data were processed. Data collection and transmission were performed under the authority of NÉBIH, the designated national competent authority for veterinary medicinal products.
5. Conclusions
In the 492-farm longitudinal cohort, AMU intensity was 5.1% lower in 2024 than in 2023, decreasing from 57.9 to 55.0 mg/kg pig biomass. Because the analysis covers only two consecutive years, this result is a year-to-year difference and should not be interpreted as evidence of a sustained temporal trend.
In 2024, Category B accounted for 3.7% of AMU in the all-reporting pig-farm population. Within the 492-farm cohort, Category B intensity decreased by 25.7%, while Category C intensity increased overall and Category D remained dominant. The continued predominance of colistin within Category B, particularly in some large-herd categories, warrants focused veterinary review. The available data do not identify the clinical indications for its use.
AMU was concentrated by production stage and farm. Within breeding farms, post-weaning pigs accounted for 57.5–86.4% of reported antimicrobial quantity. The 20 farms with the highest absolute use accounted for 43.3% of total cohort AMU, while the 20 farms with the highest absolute Category B use accounted for approximately 68.8% of cohort Category B quantity.
These findings support the development of a national farm-level benchmarking framework that distinguishes absolute antimicrobial quantity from biomass-adjusted intensity. Priority actions include transparent thresholds, structured veterinary feedback, validation of biomass denominators, and targeted review of post-weaning AMU. Consistent monitoring over additional years will be essential to assess the persistence of the observed differences and inform future stewardship strategies.
Author Contributions
Conceptualization, L.G. and L.V.; Methodology, L.G., I.N., L.B., E.V. and L.V.; Formal analysis, L.G.; Investigation, L.G., I.N., L.B., E.V., E.K.-N., Z.S. and V.S.; Data curation, L.G., I.N. and E.V.; Writing—original draft, L.G., I.N., L.B., E.V., E.K.-N., Z.S. and V.S.; Writing—review & editing, L.V.; Visualization, L.G. and L.V.; Supervision, L.V.; Project administration, L.G.; Funding acquisition, L.G., V.S. and L.V. All authors have read and agreed to the published version of the manuscript.
Funding
This research was funded by Project No. KDP-2023-C2307694, supported by the Ministry of Culture and Innovation of Hungary, through the National Research, Development, and Innovation Fund, under the KDP-2023 funding scheme. The funder had no role in the study design; in data collection, analysis, or interpretation; in the writing of the manuscript; or in the decision to publish the results.
Institutional Review Board Statement
Not applicable. Routinely collected regulatory data and aggregated farm-level datasets were used in this study.
Informed Consent Statement
Not applicable.
Data Availability Statement
The aggregated data supporting the findings of this study are included in the article. Farm-level regulatory data are not publicly available because they are subject to applicable Hungarian and EU confidentiality and data-protection requirements, including, where applicable, protections for personal and commercially sensitive information. Requests for access may be submitted to the National Food Chain Safety Office (NÉBIH), Budapest, Hungary; access is subject to the Office’s legal and administrative review and any required approvals.
Acknowledgments
During the preparation of this article, the authors used ChatGPT (OpenAI; GPT-5.6 Sol; accessed July 2026) solely for language editing and improving clarity. The authors subsequently reviewed and approved the final manuscript and take full responsibility for its content.
Conflicts of Interest
Author Veronika Szűr is employed by Vadócdoki Research and Development Division. The remaining authors declare that the research was conducted in the absence of any commercial or financial relationships that could be construed as potential conflicts of interest.
References
- Scicchitano, D.; Leuzzi, D.; Babbi, G.; Palladino, G.; Turroni, S.; Laczny, C.C.; Wilmes, P.; Correa, F.; Leekitcharoenphon, P.; Savojardo, C.; et al. Dispersion of antimicrobial resistant bacteria in pig farms and in the surrounding environment. Anim. Microbiome 2024, 6, 17. [Google Scholar] [CrossRef] [Scilit] [PubMed]
- European Commission. Ban on Antibiotics as Growth Promoters in Animal Feed Enters into Effect. Available online: https://europa.eu/rapid/press-release_IP-05-1687_en.htm (accessed on 19 July 2026).
- Nunan, C. Ending Routine Farm Antibiotic Use in Europe: Achieving Responsible Farm Antibiotic Use Through Improving Animal Health and Welfare in Pig and Poultry Production. Available online: https://www.saveourantibiotics.org/media/2019/report_ending-routine-farm-antibiotic-use-in-europe_final_january2022-1.pdf (accessed on 19 July 2026).
- Monger, X.C.; Gilbert, A.A.; Saucier, L.; Vincent, A.T. Antibiotic resistance: From pig to meat. Antibiotics 2021, 10, 1209. [Google Scholar] [CrossRef] [Scilit] [PubMed]
- Pinto, B.F.; Silva, S.A.M.; Rodrigues, I.C.; Lopes-Jorge, J.M.; Niza-Ribeiro, J.; Prata, J.C.; da Costa, P.M. Antimicrobial resistance in swine and cattle farms. Microbiol. Res. 2025, 16, 83. [Google Scholar] [CrossRef] [Scilit]
- Zalewska, M.; Błażejewska, A.; Czapko, A.; Popowska, M. Pig manure treatment strategies for mitigating the spread of antibiotic resistance. Sci. Rep. 2023, 13, 11999. [Google Scholar] [CrossRef] [Scilit] [PubMed]
- Greff, B.; Posgay, M.; Lakatos, E.; Varga, L. Colistin residues and colistin-resistant Enterobacteriaceae in agricultural soils: Sources, risks, and remediation strategies. Environ. Res. 2026, 294, 123771. [Google Scholar] [CrossRef] [Scilit] [PubMed]
- World Organisation for Animal Health (WOAH). Annual Report on Antimicrobial Agents Intended for Use in Animals, 9th Report; WOAH: Paris, France, 2025; pp. 1–49. [Google Scholar] [CrossRef] [Scilit]
- HealthforAnimals. Global Trends in Animal Antibiotic Use. Available online: https://healthforanimals.org/wp-content/uploads/2023/12/Global-Trends-in-Animal-Antibiotic-Use-December-2023.pdf (accessed on 19 July 2026).
- European Centre for Disease Prevention and Control (ECDC). Antimicrobial Resistance in the EU/EEA (EARS-Net)—Annual Epidemiological Report for 2022. Available online: https://www.ecdc.europa.eu/en/publications-data/surveillance-antimicrobial-resistance-europe-2022 (accessed on 19 July 2026).
- European Commission. A European One Health Action Plan Against Antimicrobial Resistance (AMR). Available online: https://health.ec.europa.eu/system/files/2020-01/amr_2017_action-plan_0.pdf (accessed on 19 July 2026).
- Mendelson, M.; Matsoso, M.P. The World Health Organization global action plan for antimicrobial resistance. S. Afr. Med. J. 2015, 105, 325. [Google Scholar] [CrossRef] [Scilit] [PubMed]
- World Health Organization (WHO). Global Action Plan on Antimicrobial Resistance. Available online: https://www.who.int/publications/i/item/9789241509763 (accessed on 19 July 2026).
- World Health Organization (WHO); Food and Agriculture Organization of the United Nations (FAO); United Nations Environment Programme (UNEP); World Organisation for Animal Health (WOAH). Implementing the Global Action Plan on Antimicrobial Resistance: First Quadripartite Biennial Report. Available online: https://iris.who.int/server/api/core/bitstreams/af8a5f2b-70a8-4bcb-92b4-5f6f2bf9f0d6/content (accessed on 19 July 2026).
- European Medicines Agency (EMA). European Sales and Use of Antimicrobials for Veterinary Medicine (ESUAvet) Annual Surveillance Reports. Available online: https://www.ema.europa.eu/en/veterinary-regulatory-overview/antimicrobial-resistance-veterinary-medicine/european-sales-use-antimicrobials-veterinary-medicine-esuavet-annual-surveillance-reports (accessed on 19 July 2026).
- European Medicines Agency (EMA). Sales of Veterinary Antimicrobial Agents in 31 European Countries in 2021: Trends from 2010 to 2021—12th ESVAC Report. Available online: https://www.ema.europa.eu/en/documents/report/sales-veterinary-antimicrobial-agents-31-european-countries-2021-trends-2010-2021-twelfth-esvac-report_en.pdf (accessed on 19 July 2026).
- Organisation for Economic Co-operation and Development (OECD). Antimicrobial Resistance in the EU/EEA: A One Health Response. Available online: https://www.oecd.org/content/dam/oecd/en/publications/reports/2022/03/antimicrobial-resistance-in-the-eu-eea_146cd4e5/a213cd5a-en.pdf (accessed on 19 July 2026).
- European Medicines Agency (EMA). European Surveillance of Veterinary Antimicrobial Consumption (ESVAC): 2009–2023. Available online: https://www.ema.europa.eu/en/veterinary-regulatory-overview/antimicrobial-resistance-veterinary-medicine/european-surveillance-veterinary-antimicrobial-consumption-esvac-2009-2023 (accessed on 19 July 2026).
- European Medicines Agency (EMA). Sales of Veterinary Antimicrobial Agents in 31 European Countries in 2022: Trends from 2010 to 2022—13th ESVAC Report. Available online: https://www.ema.europa.eu/en/documents/report/sales-veterinary-antimicrobial-agents-31-european-countries-2022-trends-2010-2022-thirteenth-esvac-report_en.pdf (accessed on 19 July 2026).
- European Commission. Commission Delegated Regulation (EU) 2021/578 of 29 January 2021 Supplementing Regulation (EU) 2019/6 of the European Parliament and of the Council with Regard to Requirements for the Collection of Data on the Volume of Sales and on the Use of Antimicrobial Medicinal Products in Animals. Available online: https://eur-lex.europa.eu/legal-content/EN/TXT/?uri=CELEX:32021R0578 (accessed on 19 July 2026).
- European Parliament; Council of the European Union. Regulation (EU) 2019/6 of the European Parliament and of the Council of 11 December 2018 on Veterinary Medicinal Products and Repealing Directive 2001/82/EC. Available online: https://eur-lex.europa.eu/legal-content/EN/TXT/?qid=1764425969381&uri=CELEX%3A02019R0006-20220128 (accessed on 19 July 2026).
- European Commission. Commission Delegated Regulation (EU) 2021/1760 of 26 May 2021 Supplementing Regulation (EU) 2019/6 of the European Parliament and of the Council by Establishing the Criteria for the Designation of Antimicrobials to be Reserved for the Treatment of Certain Infections in Humans. Available online: https://eur-lex.europa.eu/eli/reg_del/2021/1760/oj (accessed on 19 July 2026).
- European Commission. Commission Implementing Regulation (EU) 2022/209 of 16 February 2022 Establishing the Format of the Data to be Collected and Reported in Order to Determine the Volume of Sales and the Use of Antimicrobial Medicinal Products in Animals in Accordance with Regulation (EU) 2019/6 of the European Parliament and of the Council. Available online: https://eur-lex.europa.eu/legal-content/EN/TXT/?uri=CELEX:32022R0209 (accessed on 19 July 2026).
- European Parliament; Council of the European Union. Regulation (EU) 2019/4 of the European Parliament and of the Council of 11 December 2018 on the Manufacture, Placing on the Market and Use of Medicated Feed, Amending Regulation (EC) No 183/2005 of the European Parliament and of the Council and Repealing Council Directive 90/167/EEC. Available online: https://eur-lex.europa.eu/legal-content/EN/TXT/?uri=CELEX:32019R0004 (accessed on 19 July 2026).
- Ministry of Agriculture and Rural Development (FVM). Ministerial Decree No. 128/2009 (X. 6.) FVM on Veterinary Medicinal Products. Magy. Közlöny 2009, 65, 37796–37889. (In Hungarian). Available online: https://magyarkozlony.hu/dokumentumok/251d1fdc34f3b47e883d356f9565a51db7d8fef0/megtekintes (accessed on 19 July 2026).
- European Commission. Communication from the Commission to the Council and the European Parliament: A European One Health Action Plan Against Antimicrobial Resistance (AMR) (COM2017 339 Final). Available online: https://eur-lex.europa.eu/legal-content/EN/TXT/?uri=CELEX:52017DC0339 (accessed on 19 July 2026).
- Ministry of Agriculture (AM). Ministerial Decree No. 27/2021. (VIII. 11.) AM on Amending Ministerial Decree No. 128/2009. (X. 6.) FVM on Veterinary Products. Available online: https://net.jogtar.hu/jogszabaly?docid=a0900128.fvm (accessed on 19 July 2026).
- Sarrazin, S.; Joosten, P.; Van Gompel, L.; Luiken, R.E.C.; Mevius, D.J.; Wagenaar, J.A.; Heederik, D.J.J.; Dewulf, J. Quantitative and qualitative analysis of antimicrobial usage patterns in 180 selected farrow-to-finish pig farms from nine European countries based on single batch and purchase data. J. Antimicrob. Chemother. 2019, 74, 807–816. [Google Scholar] [CrossRef] [Scilit] [PubMed]
- Caekebeke, N.; Jonquiere, F.J.; Ringenier, M.; Tobias, T.J.; Postma, M.; van den Hoogen, A.; Houben, M.A.M.; Velkers, F.C.; Sleeckx, N.; Stegeman, J.A.; et al. Comparing farm biosecurity and antimicrobial use in high-antimicrobial-consuming broiler and pig farms in the Belgian–Dutch border region. Front. Vet. Sci. 2020, 7, 558455. [Google Scholar] [CrossRef] [Scilit] [PubMed]
- Tang, K.L.; Caffrey, N.P.; Nóbrega, D.B.; Cork, S.C.; Ronksley, P.E.; Barkema, H.W.; Polachek, A.J.; Ganshorn, H.; Sharma, N.; Kellner, J.D.; et al. Restricting the use of antibiotics in food-producing animals and its associations with antibiotic resistance in food-producing animals and human beings: A systematic review and meta-analysis. Lancet Planet. Health 2017, 1, e316–e327, Correction in Lancet Planet Health 2017, 1, e359. https://doi.org/10.1016/S2542-5196(17)30141-9. [Google Scholar] [CrossRef] [Scilit] [PubMed]
- Góchez, D.; Raicek, M.; Ferreira, J.P.; Jeannin, M.; Moulin, G.; Erlacher-Vindel, E. OIE annual report on antimicrobial agents intended for use in animals: Methods used. Front. Vet. Sci. 2019, 6, 317. [Google Scholar] [CrossRef] [Scilit] [PubMed]
- O’Neill, L.; da Costa, M.R.; Leonard, F.; Gibbons, J.; Díaz, J.A.C.; McCutcheon, G.; Manzanilla, E.G. Does the use of different indicators to benchmark antimicrobial use affect farm ranking? Front. Vet. Sci. 2020, 7, 558793. [Google Scholar] [CrossRef] [Scilit] [PubMed]
- Vribék, K.; Farkas, M.; Csorba, S.; Süth, M.; Gombos, L.; Kerek, Á.; Somogyi, Z.; Jerzsele, Á.; Farkas, Z. Antimicrobial use and Escherichia coli resistance patterns in Hungarian pig farms: A data-driven farm-level analysis. Sci. Rep. 2026, 16, 11874. [Google Scholar] [CrossRef] [Scilit] [PubMed]
- European Food Safety Authority (EFSA); European Centre for Disease Prevention and Control (ECDC). The European Union summary report on antimicrobial resistance in zoonotic and indicator bacteria from humans, animals and food in 2022–2023. EFSA J. 2025, 23, e9237. [Google Scholar] [CrossRef] [Scilit]
- Bosman, A.L.; Deckert, A.E.; Carson, C.A.; Poljak, Z.; Reid-Smith, R.J.; McEwen, S.A. Antimicrobial use in lactating sows, piglets, nursery, and grower-finisher pigs on swine farms in Ontario, Canada during 2017 and 2018. Porc. Health Manag. 2022, 8, 17. [Google Scholar] [CrossRef] [Scilit] [PubMed]
- Davies, P.R.; Singer, R.S. Antimicrobial use in wean to market pigs in the United States assessed via voluntary sharing of proprietary data. Zoonoses Public Health 2020, 67, 6–21. [Google Scholar] [CrossRef] [Scilit] [PubMed]
- European Medicines Agency (EMA). European Sales and Use of Antimicrobials for Veterinary Medicine (ESUAvet): Annual Surveillance Report for 2024. Available online: https://www.ema.europa.eu/en/documents/report/european-sales-use-antimicrobials-veterinary-medicine-annual-surveillance-report-2024_en.pdf (accessed on 19 July 2026).
- Georgaki, D.; Vandael, F.; de Carvalho Ferreira, H.C.; Filippitzi, M.E.; De Backer, P.; Devreese, M.; Dewulf, J.; Croubels, S. Qualitative risk assessment of homogeneity, stability, and residual concentrations of antimicrobials in medicated feed and drinking water in pig rearing. BMC Vet. Res. 2023, 19, 9. [Google Scholar] [CrossRef] [Scilit] [PubMed]
- Udhwani, T.; Grave, K.; Hopp, P.; Helgesen, K.O. Quality assessment of antibiotic use data in the Norwegian veterinary prescription register for 2023. BMC Vet. Res. 2025, 21, 510. [Google Scholar] [CrossRef] [Scilit] [PubMed]
- Mader, R.; Madero, C.M.; Aasmäe, B.; Bourély, C.; Broens, E.M.; Busani, L.; Callens, B.; Collineau, L.; Crespo-Robledo, P.; Damborg, P.; et al. Review and analysis of national monitoring systems for antimicrobial resistance in animal bacterial pathogens in Europe: A basis for the development of the European Antimicrobial Resistance Surveillance Network in Veterinary Medicine (EARS-Vet). Front. Microbiol. 2022, 13, 838490. [Google Scholar] [CrossRef] [Scilit] [PubMed]
- Glavind, A.S. Data-Based Health Surveillance in Pigs and Trends in Antimicrobial Use in Companion Animals. Ph.D. Thesis, University of Copenhagen, Copenhagen, Denmark, 2024. Available online: https://dkvet.dk/rapporter/Data-based_health_surveillance_in_pigs_and_trends_in_antimicrobial_use_in_companion_animals_-_Glavind_2025.pdf (accessed on 19 July 2026).
- Ministry of Agriculture (FM). Ministerial Decree No. 41/1997. (V. 28.) FM on the Issuance of Animal Health Regulations. Available online: https://net.jogtar.hu/jogszabaly?docid=99700041.fm (accessed on 19 July 2026).
- European Medicines Agency (EMA). Guideline on the Reporting of Antimicrobial Sales and Use in Animals at the EU Level—Denominators and Indicators. Available online: https://www.ema.europa.eu/en/documents/scientific-guideline/guideline-reporting-antimicrobial-sales-and-use-animals-eu-level-denominators-and-indicators_en.pdf (accessed on 19 July 2026).
- European Medicines Agency (EMA). Categorisation of Antibiotics in the European Union. Available online: https://www.ema.europa.eu/en/documents/report/categorisation-antibiotics-european-union-answer-request-european-commission-updating-scientific_en.pdf (accessed on 19 July 2026).

Disclaimer/Publisher’s Note: The statements, opinions and data contained in all publications are solely those of the individual author(s) and contributor(s) and not of MDPI and/or the editor(s). MDPI and/or the editor(s) disclaim responsibility for any injury to people or property resulting from any ideas, methods, instructions or products referred to in the content. |
© 2026 by the authors. Licensee MDPI, Basel, Switzerland. This article is an open access article distributed under the terms and conditions of the Creative Commons Attribution (CC BY) license.