


Abstract
Background: Antimicrobial resistance (AMR) is a major challenge among hospitalized patients, particularly when bacterial infection coexists with laboratory evidence of organ dysfunction. This study assessed AMR patterns and laboratory abnormality burden among hospitalized patients in Jazan, Saudi Arabia. Methods: This retrospective single-center study included 43 hospitalized patients with a culture-positive bacterial isolate and antimicrobial susceptibility testing (AST) results at King Fahd Central Hospital, Jazan, Saudi Arabia, from 1 January 2019 to 1 January 2022. Demographic, ward, organism-identification, antimicrobial susceptibility, hematological, coagulation, and biochemical data were analyzed. Only AST results for agents applicable to the identified organism were analyzed. Multidrug resistance (MDR) was primarily defined as non-susceptibility to at least one antimicrobial agent in three or more antimicrobial categories, with intermediate and resistant results grouped as non-susceptible. An alternative resistance-based sensitivity analysis classified isolates as MDR when resistance was detected to three or more individual antimicrobial agents, regardless of antimicrobial category. Laboratory abnormalities were classified using institutional reference ranges, with sex-specific hemoglobin intervals and a random-glucose threshold of >140 mg/dL. Results: The median age was 41 years (IQR, 28.0–58.5), and 22 patients were female (51.2%). The most frequent admission locations were the intensive care unit (27.9%), female medical ward (20.9%), and male neurology ward (20.9%). Gram-negative bacilli accounted for 60.5% of the total isolates. The most common organisms were Staphylococcus epidermidis (20.9%), Klebsiella pneumoniae (20.9%), and Acinetobacter baumannii complex (16.3%). MDR was identified in 30/43 isolates (69.8%) using the primary class-based non-susceptibility definition and in 30/43 isolates (69.8%) using the alternative resistance-based definition. All MDR-stratified clinical and laboratory comparisons were based on the primary class-based definition. High resistance rates were observed for oxacillin (11/11 staphylococci, 100%), erythromycin (81.2%), levofloxacin (61.1%), imipenem (56.0%), ceftazidime (53.8%), meropenem (50.0%), and cefepime (50.0%) among the tested isolates. No resistance was detected to vancomycin, teicoplanin, or tigecycline. Laboratory abnormalities were frequent, including anemia (73.8%), leukocytosis (33.3%), platelet abnormalities (47.6%), hyperglycemia (27.9%), elevated blood urea nitrogen (BUN) (67.4%), elevated creatinine (32.6%), hypoalbuminemia (71.4%), and elevated INR (52.9%). In exploratory MDR-stratified comparisons (30 MDR vs. 13 non-MDR), platelet counts were lower in the MDR group (p = 0.032), but no laboratory difference remained significant after correction for multiple comparisons, and these comparisons were underpowered, so the absence of significant differences does not exclude an association. Conclusions: Hospitalized patients in this cohort showed a high burden of AMR and frequent hematological, renal, metabolic, hepatic, and coagulation abnormalities. These descriptive findings highlight the need for denominator-aware, organism-specific AMR surveillance; whether integrating routine laboratory biomarkers into antimicrobial stewardship improves outcomes was not evaluated and requires a prospective study. Larger multicenter studies are needed to determine whether the MDR phenotype independently predicts adverse clinical outcomes.
1. Introduction
Antimicrobial resistance (AMR) compromises the effectiveness of antibacterial therapy and is associated with treatment failure, prolonged hospitalization, increased healthcare costs, and excess mortality [1]. The burden is particularly relevant in hospitalized patients exposed to broad-spectrum antimicrobials, invasive devices, repeated microbiological sampling, and prolonged healthcare contact. Critical care, acute care, and neurology units represent high-risk environments because antimicrobial selective pressure, device-related colonization, and host vulnerability facilitate the emergence and transmission of multidrug-resistant (MDR) bacterial phenotypes [2,3,4].
Hospitalized patients with impaired consciousness, metabolic derangement, reduced mobility, surgical wounds, vascular catheters, urinary catheters, mechanical ventilation, or other breaches in host barriers are more predisposed to colonization and infection by opportunistic organisms [5,6]. In this context, Acinetobacter baumannii is of particular concern because of its ability to persist in the hospital environment, acquire resistance determinants, and cause difficult-to-treat infections, particularly in critically ill patients [6,7]. Gram-positive organisms such as Staphylococcus epidermidis are also relevant to device-associated infections because of their capacity to form biofilms on intravascular catheters and implanted materials [8,9]. Similarly, Klebsiella pneumoniae and related Enterobacterales may acquire extended-spectrum beta-lactamases and carbapenemases, resulting in resistance to broad-spectrum cephalosporins and carbapenems and limiting therapeutic options [6,7]. Coagulase-negative staphylococci, historically regarded as low-virulence skin commensals, are now recognized as opportunistic pathogens in patients with indwelling devices, immunological vulnerability, or prolonged hospitalization [8,9]. Such organisms may cause device-associated or persistent infection and can complicate antimicrobial management [8,9]. Bacterial infection in hospitalized patients is frequently accompanied by hematological, coagulation, biochemical, and metabolic abnormalities [10,11,12,13,14]. Systemic inflammation may impair erythropoiesis, alter iron metabolism, and contribute to anemia of inflammation [11,15]. Acute infection and physiological stress may also be associated with leukocyte abnormalities, dysglycemia, renal dysfunction, hypoalbuminemia, and coagulation disturbances [10,12,13,14,16]. These laboratory abnormalities may reflect pre-existing comorbidity, acute organ dysfunction, sepsis-associated pathophysiology, antimicrobial toxicity, nutritional depletion, or a combination of these processes. Accordingly, routine laboratory biomarkers provide complementary information on host physiological status during bacterial infection and may support risk assessment, antimicrobial dosing, and monitoring for treatment-related toxicity [16,17].
Despite increasing attention to AMR surveillance, hospital-level studies that integrate organism distribution, antimicrobial susceptibility profiles, and routine laboratory biomarkers remain limited. Such integration is relevant because stewardship decisions require microbiological susceptibility information to be interpreted alongside patient-specific physiological factors that influence antimicrobial selection, dosing, and safety [16,17]. In addition, resistance estimates require careful interpretation because antimicrobial susceptibility testing panels vary by organism group, and individual agents are not uniformly tested across all isolates. This retrospective single-center study aimed to characterize bacterial isolates and antimicrobial resistance patterns among hospitalized patients in Jazan, Saudi Arabia, and to describe the associated hematological, coagulation, biochemical, and metabolic abnormality burden. Exploratory analyses were performed to compare laboratory profiles between patients with MDR and non-MDR isolates using a class-based non-susceptibility definition of MDR.
2. Results
2.1. Demographic and Clinical Characteristics
The study cohort included 43 hospitalized patients. The median age was 41.0 years (IQR, 28.0–58.5), with an age range of 16–83 years. Twenty-two patients were female (51.2%) and 21 patients were male (48.8%). Patients were distributed across all 12 clinical locations. The most frequent locations were the intensive care unit (ICU; 12/43, 27.9%), female medical ward (9/43, 20.9%), and male neurology ward (9/43, 20.9%). These three locations accounted for 30 of 43 cases (69.8%), indicating that most of the bacterial isolates were obtained from patients managed in high-acuity or specialized inpatient services (Table 1). The specimen source was not recorded in the extracted dataset. A clinical diagnosis was documented for 15 patients: 10 had a neurological or neurosurgical condition (external ventricular drain or shunt infection, n = 4; ventriculitis, n = 1; meningitis or suspected meningitis, n = 2; traumatic brain injury, n = 1; subarachnoid hemorrhage, n = 1; post-cerebellar stroke, n = 1), two had trauma, and three had other conditions (pericardial effusion, n = 1; COVID-19, n = 2, one with end-stage renal disease).
Table 1.
Demographic and microbiological characteristics by MDR status (n = 43).
2.2. Microbiological Characteristics and MDR Classification
The 43 identified isolates in this study comprised 17 organism groups. Gram-negative bacilli accounted for 26 isolates (60.5%), whereas Gram-positive cocci accounted for 17 isolates (39.5%) of the total bacterial isolates in the study. The most frequently isolated organisms were Staphylococcus epidermidis (9/43, 20.9%), Klebsiella pneumoniae (9/43, 20.9%), and Acinetobacter baumannii complex (7/43, 16.3%). Other organisms included Enterococcus faecalis (3/43, 7.0%), Pseudomonas aeruginosa (2/43, 4.7%), Proteus mirabilis (2/43, 4.7%), and Staphylococcus haemolyticus (2/43, 4.7%). The remaining organism groups each occurred in single cases. Using the primary class-based non-susceptibility definition, MDR was identified in 30 of 43 bacterial isolates (69.8%). All isolates were tested against agents in at least four applicable antimicrobial categories (median, 10; range, 4–15), so no isolate was classified as non-MDR because of insufficient testing; the categories applied to each organism group are provided in Supplementary Table S3. MDR was identified in all seven A. baumannii complex isolates, eight of nine S. epidermidis isolates, and seven of nine K. pneumoniae isolates. In the alternative resistance-based sensitivity analysis (resistance to three or more individual applicable agents, regardless of category), MDR was identified in 30 of 43 isolates (69.8%), with agreement between the two definitions for 41 of 43 isolates. Because this alternative definition is not nested within the class-based definition, the concordant estimate indicates that the conclusion of a high MDR burden was not dependent on the classification approach used. Therefore, all subsequent MDR-stratified demographic, microbiological, and laboratory comparisons used the primary class-based non-susceptibility definition. Age distribution did not differ significantly between MDR and non-MDR groups (p = 0.822), and MDR status was not significantly associated with sex (p = 0.332), ward (p = 0.841), or Gram morphology (p = 0.513), whereas the distribution of organisms differed by MDR status (p = 0.009) (Table 1).
2.3. Antimicrobial Resistance Patterns
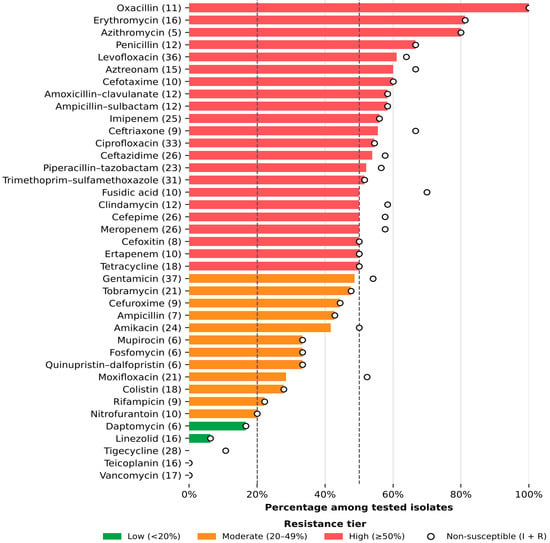
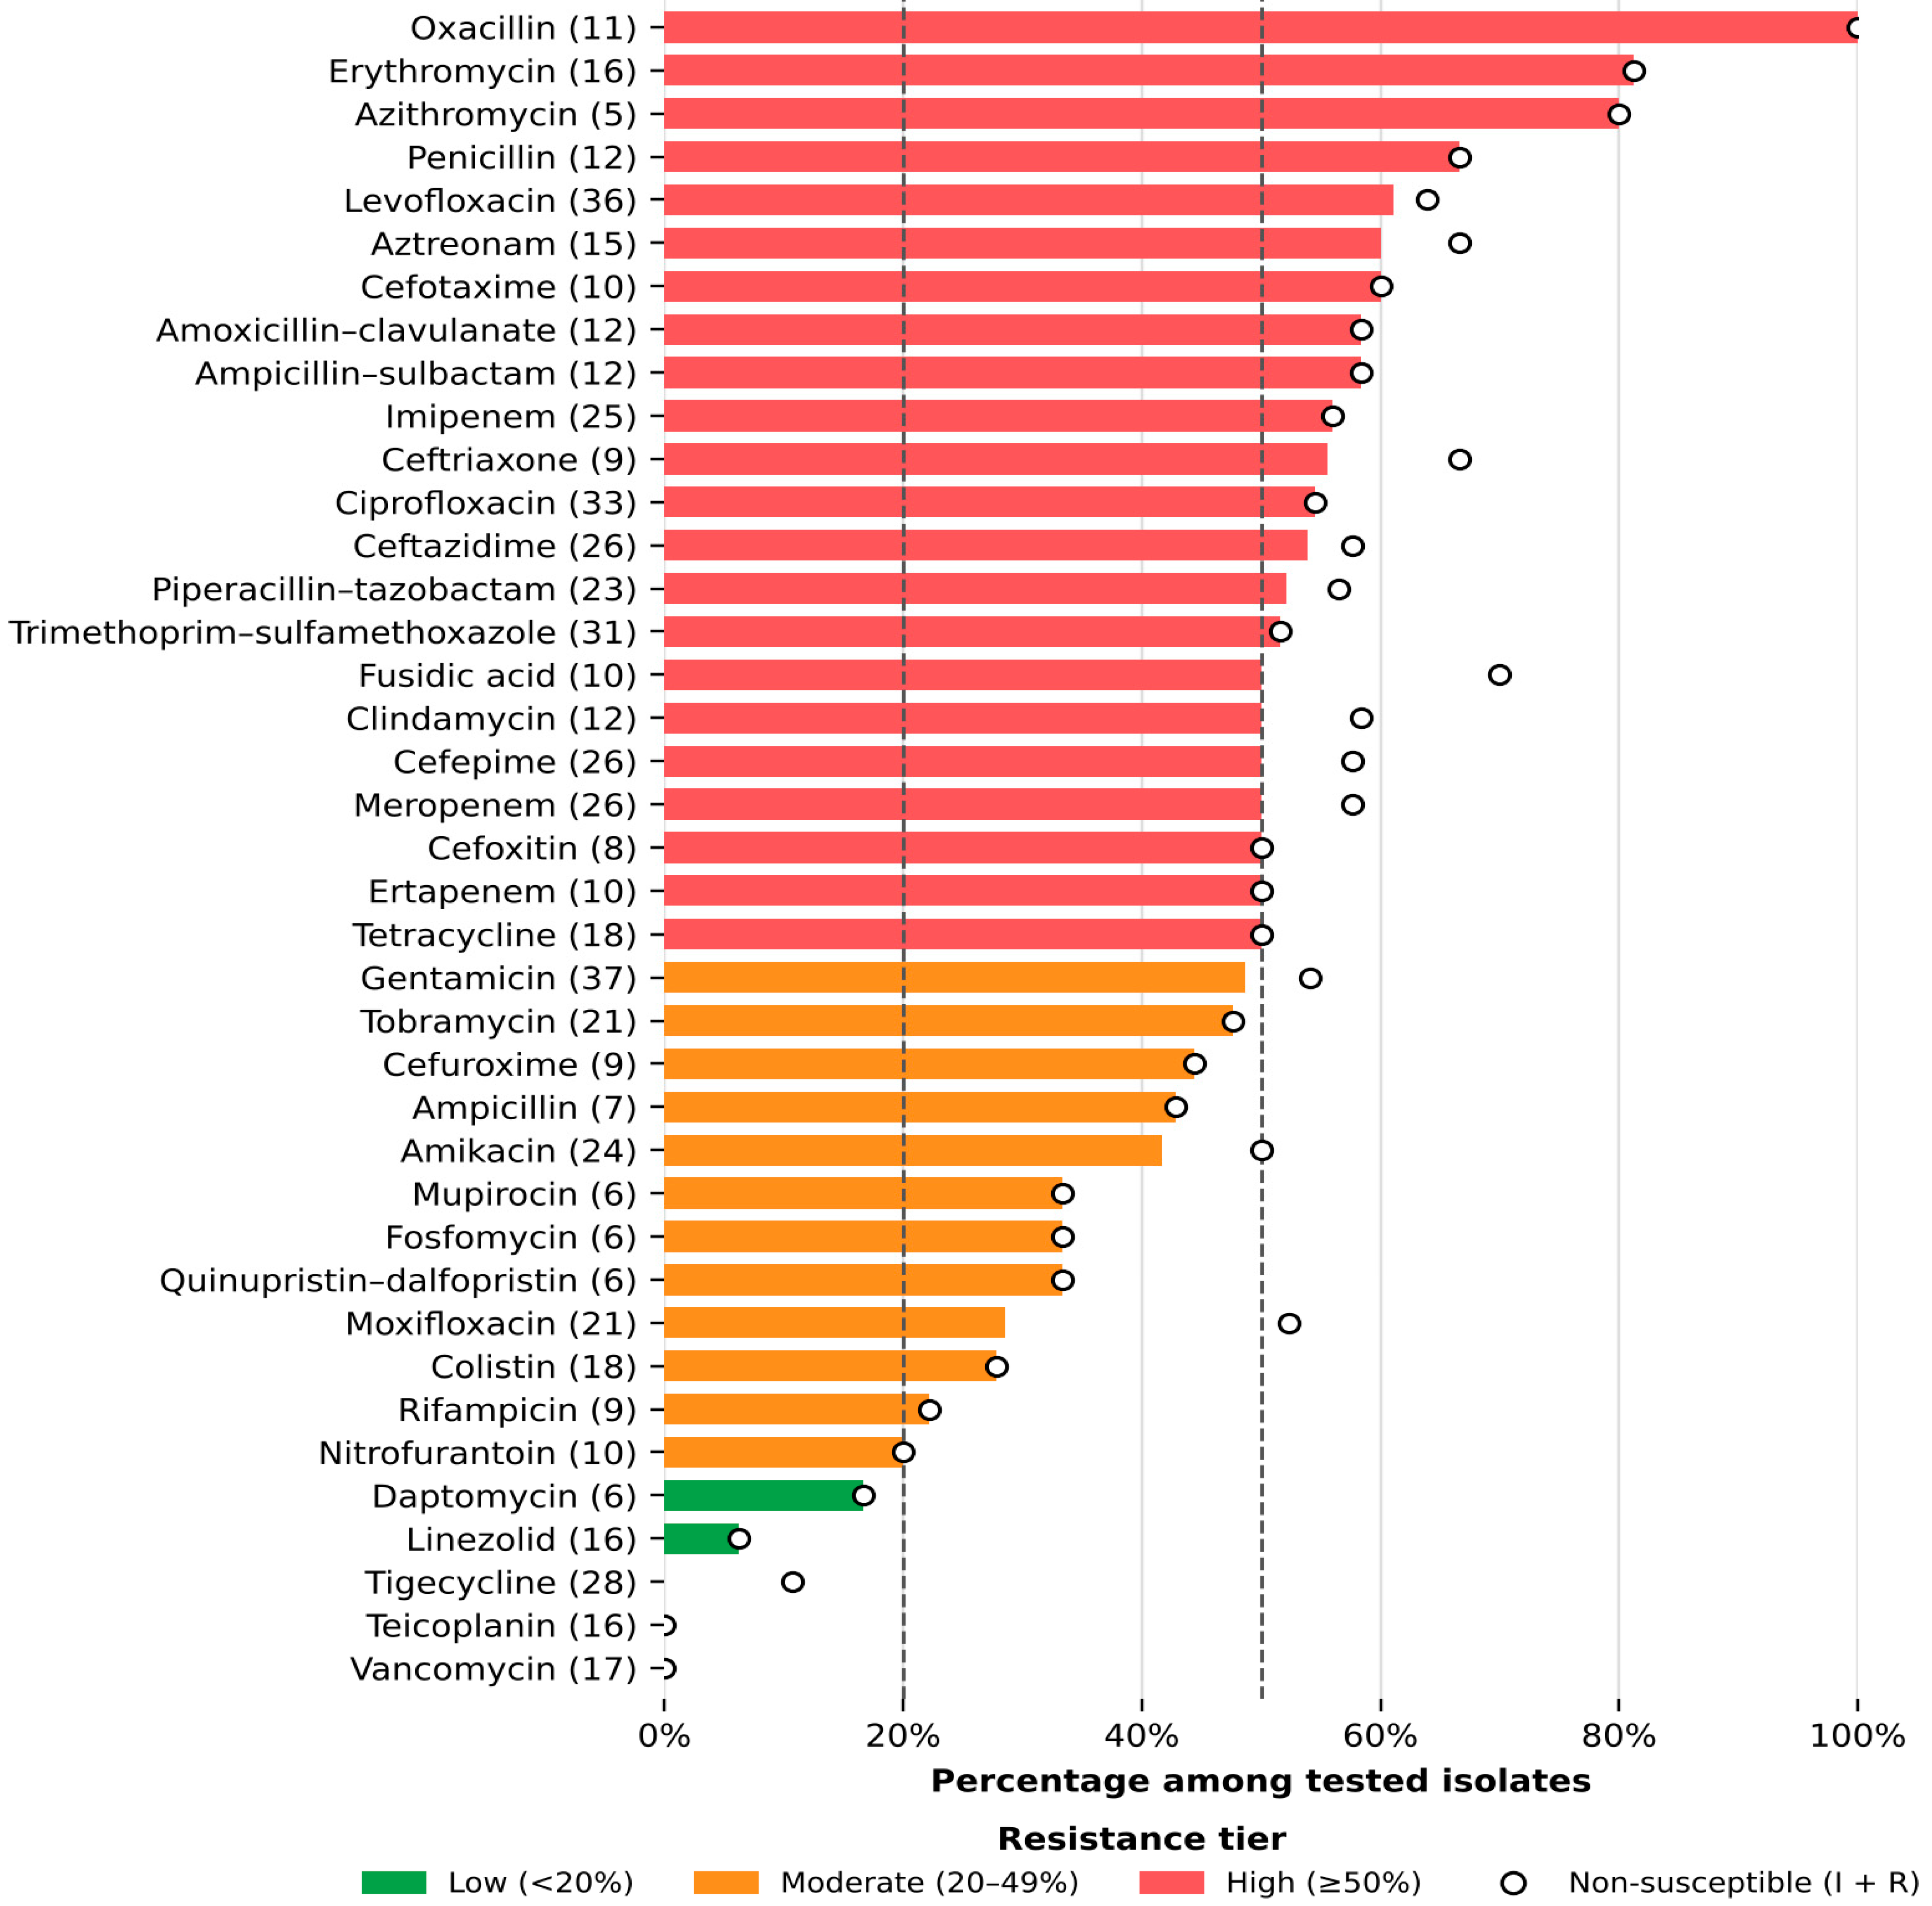
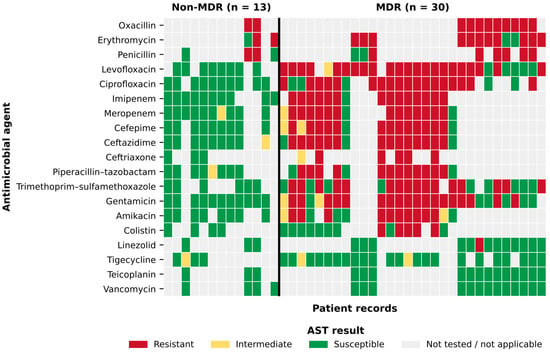
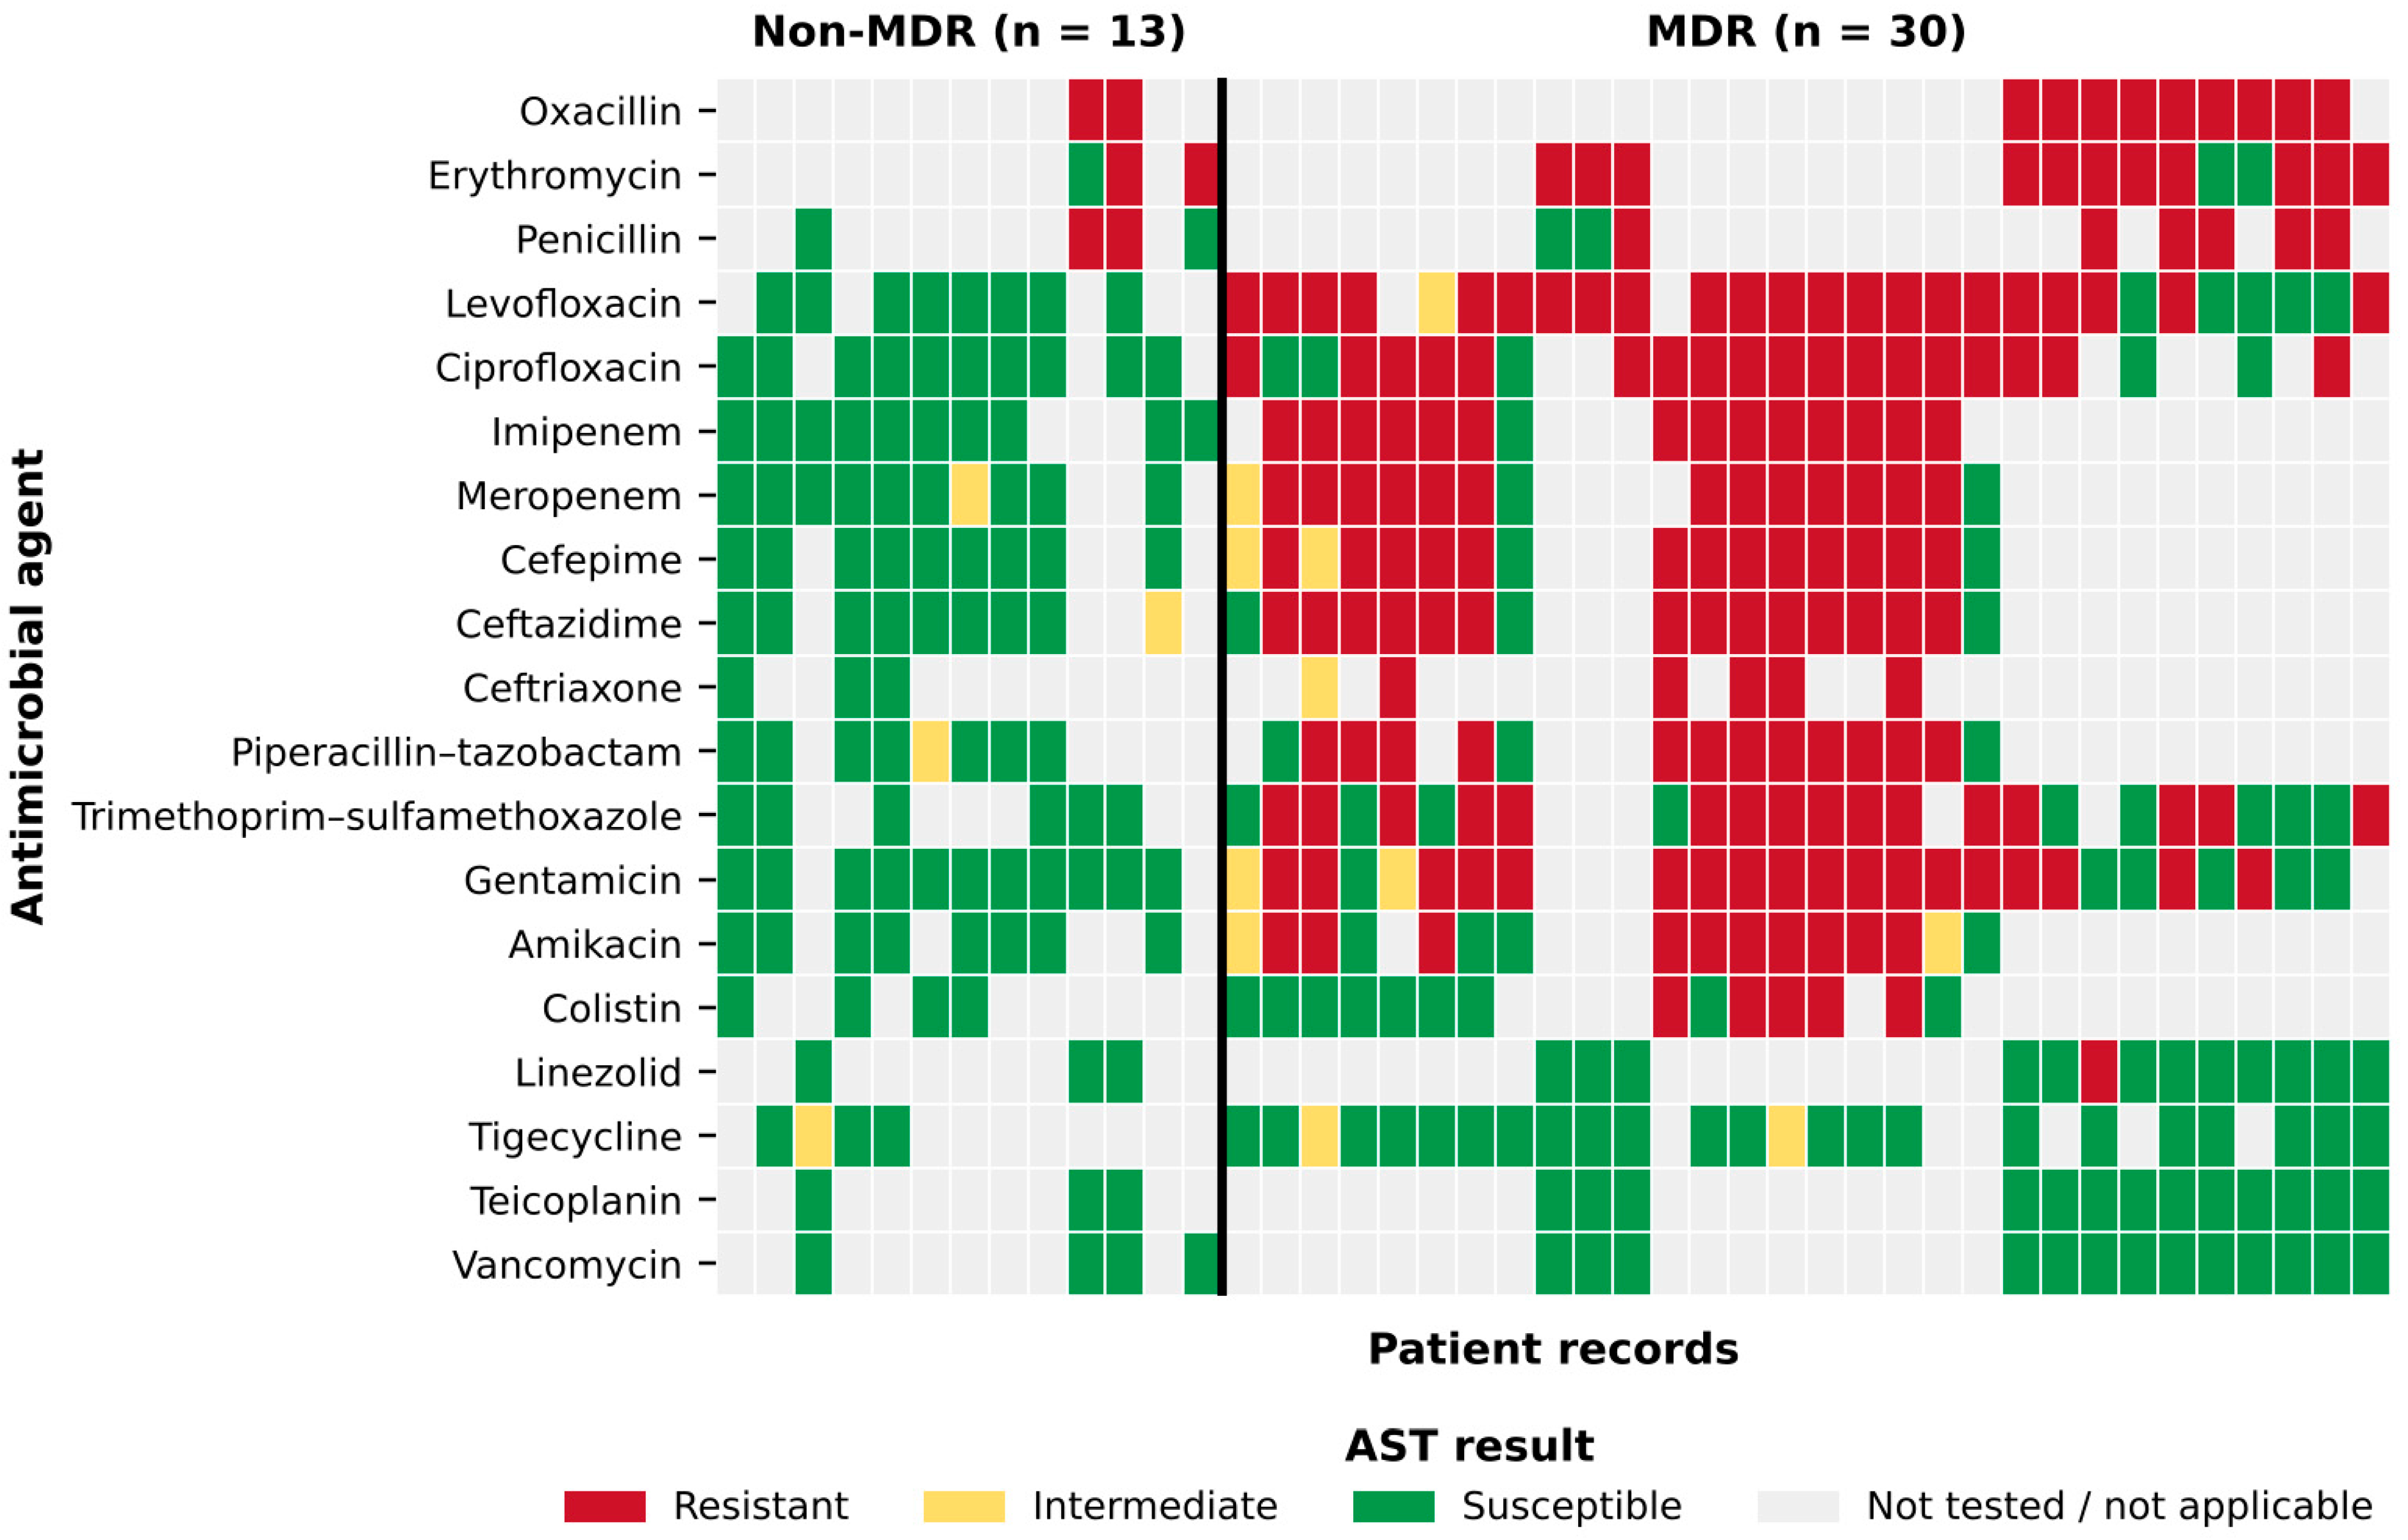
After restriction to agents applicable to the identified organism, 652 valid AST results for 43 antimicrobial agents were analyzed (median, 15 agents per isolate; range, 7–24). Because organism-specific AST panels were used, individual antimicrobial agents were not tested uniformly across all 43 isolates. Resistance and non-susceptibility rates were therefore calculated using the number of valid results for each antimicrobial agent as the denominator. To reduce instability from very small denominators, the main resistance-rate summary was restricted to agents with at least five valid AST results. The highest resistance rates were observed for oxacillin (11/11, 100%), erythromycin (81.2%), azithromycin (80.0%), penicillin (66.7%), levofloxacin (61.1%), aztreonam (60.0%), cefotaxime (60.0%), imipenem (56.0%), ciprofloxacin (54.5%), ceftazidime (53.8%), meropenem (50.0%), and cefepime (50.0%) among the tested isolates. Moderate resistance rates were observed for aminoglycosides and selected reserve or adjunctive agents, including gentamicin, tobramycin, amikacin, cefuroxime, ampicillin, quinupristin–dalfopristin, fosfomycin, mupirocin, moxifloxacin, colistin, rifampicin, and nitrofurantoin, whereas resistance to daptomycin and linezolid was low. No resistance was detected to vancomycin, teicoplanin, or tigecycline among isolates with valid susceptibility results (Table 2 and Figure 1). Table 2 summarizes antimicrobial resistance and non-susceptibility rates by agent and antimicrobial class. Figure 1 displays the ranked resistance profile, with agents grouped according to resistance-rate strata. Figure 2 shows the patient-level AST heatmap for selected clinically relevant antimicrobial agents, illustrating heterogeneity in susceptibility patterns across patient records and the distribution of resistant, intermediate, susceptible, and untested results according to MDR status. Organism-specific results, showing the number of isolates of each species tested against each agent and the resistant, intermediate, and susceptible counts, are provided in Supplementary Table S4. All 11 oxacillin results were from staphylococci (S. epidermidis, n = 9; S. haemolyticus, n = 1; S. aureus, n = 1), all of which were resistant; the oxacillin resistance rate therefore reflects predominantly coagulase-negative staphylococci. All eight cefoxitin results were cefoxitin MICs for Enterobacterales (K. pneumoniae, n = 5; P. mirabilis, n = 2; Citrobacter sp., n = 1); no staphylococcal cefoxitin screen results were recorded, and none of the cefoxitin-tested isolates were among the oxacillin-tested isolates. All five colistin-resistant isolates were K. pneumoniae (5/7 tested); colistin results were obtained by VITEK 2 without reference broth microdilution confirmation and should be interpreted with caution.
Table 2.
Antimicrobial resistance rates for antibiotics with at least five valid AST results.
Figure 1.
Bars show the percentage of resistant isolates among isolates with valid antimicrobial susceptibility testing results for each agent; numbers in parentheses indicate the number of isolates tested. Only agents applicable to the identified organism are included. Open circles show the percentage of non-susceptible isolates, defined as isolates with intermediate or resistant results. Antimicrobial agents are ordered by decreasing resistance percentage. Dashed vertical lines indicate the 20% and 50% resistance thresholds. Because organism-specific antimicrobial susceptibility testing panels were used, denominators differ between agents.
Figure 2.
Patient-level antimicrobial susceptibility profile according to MDR status. Heatmap showing antimicrobial susceptibility testing results by patient record and selected clinically relevant antimicrobial agents. Each column represents one patient record, and patients are grouped by MDR status. Red indicates resistant, yellow intermediate, green susceptible, and gray not tested or not applicable to the identified organism. MDR was defined as non-susceptibility to at least one antimicrobial agent in three or more antimicrobial categories.
2.4. Hematological, Coagulation, and Biochemical Abnormality Burden
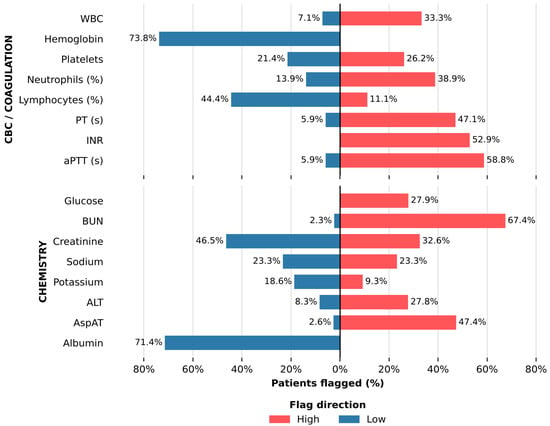
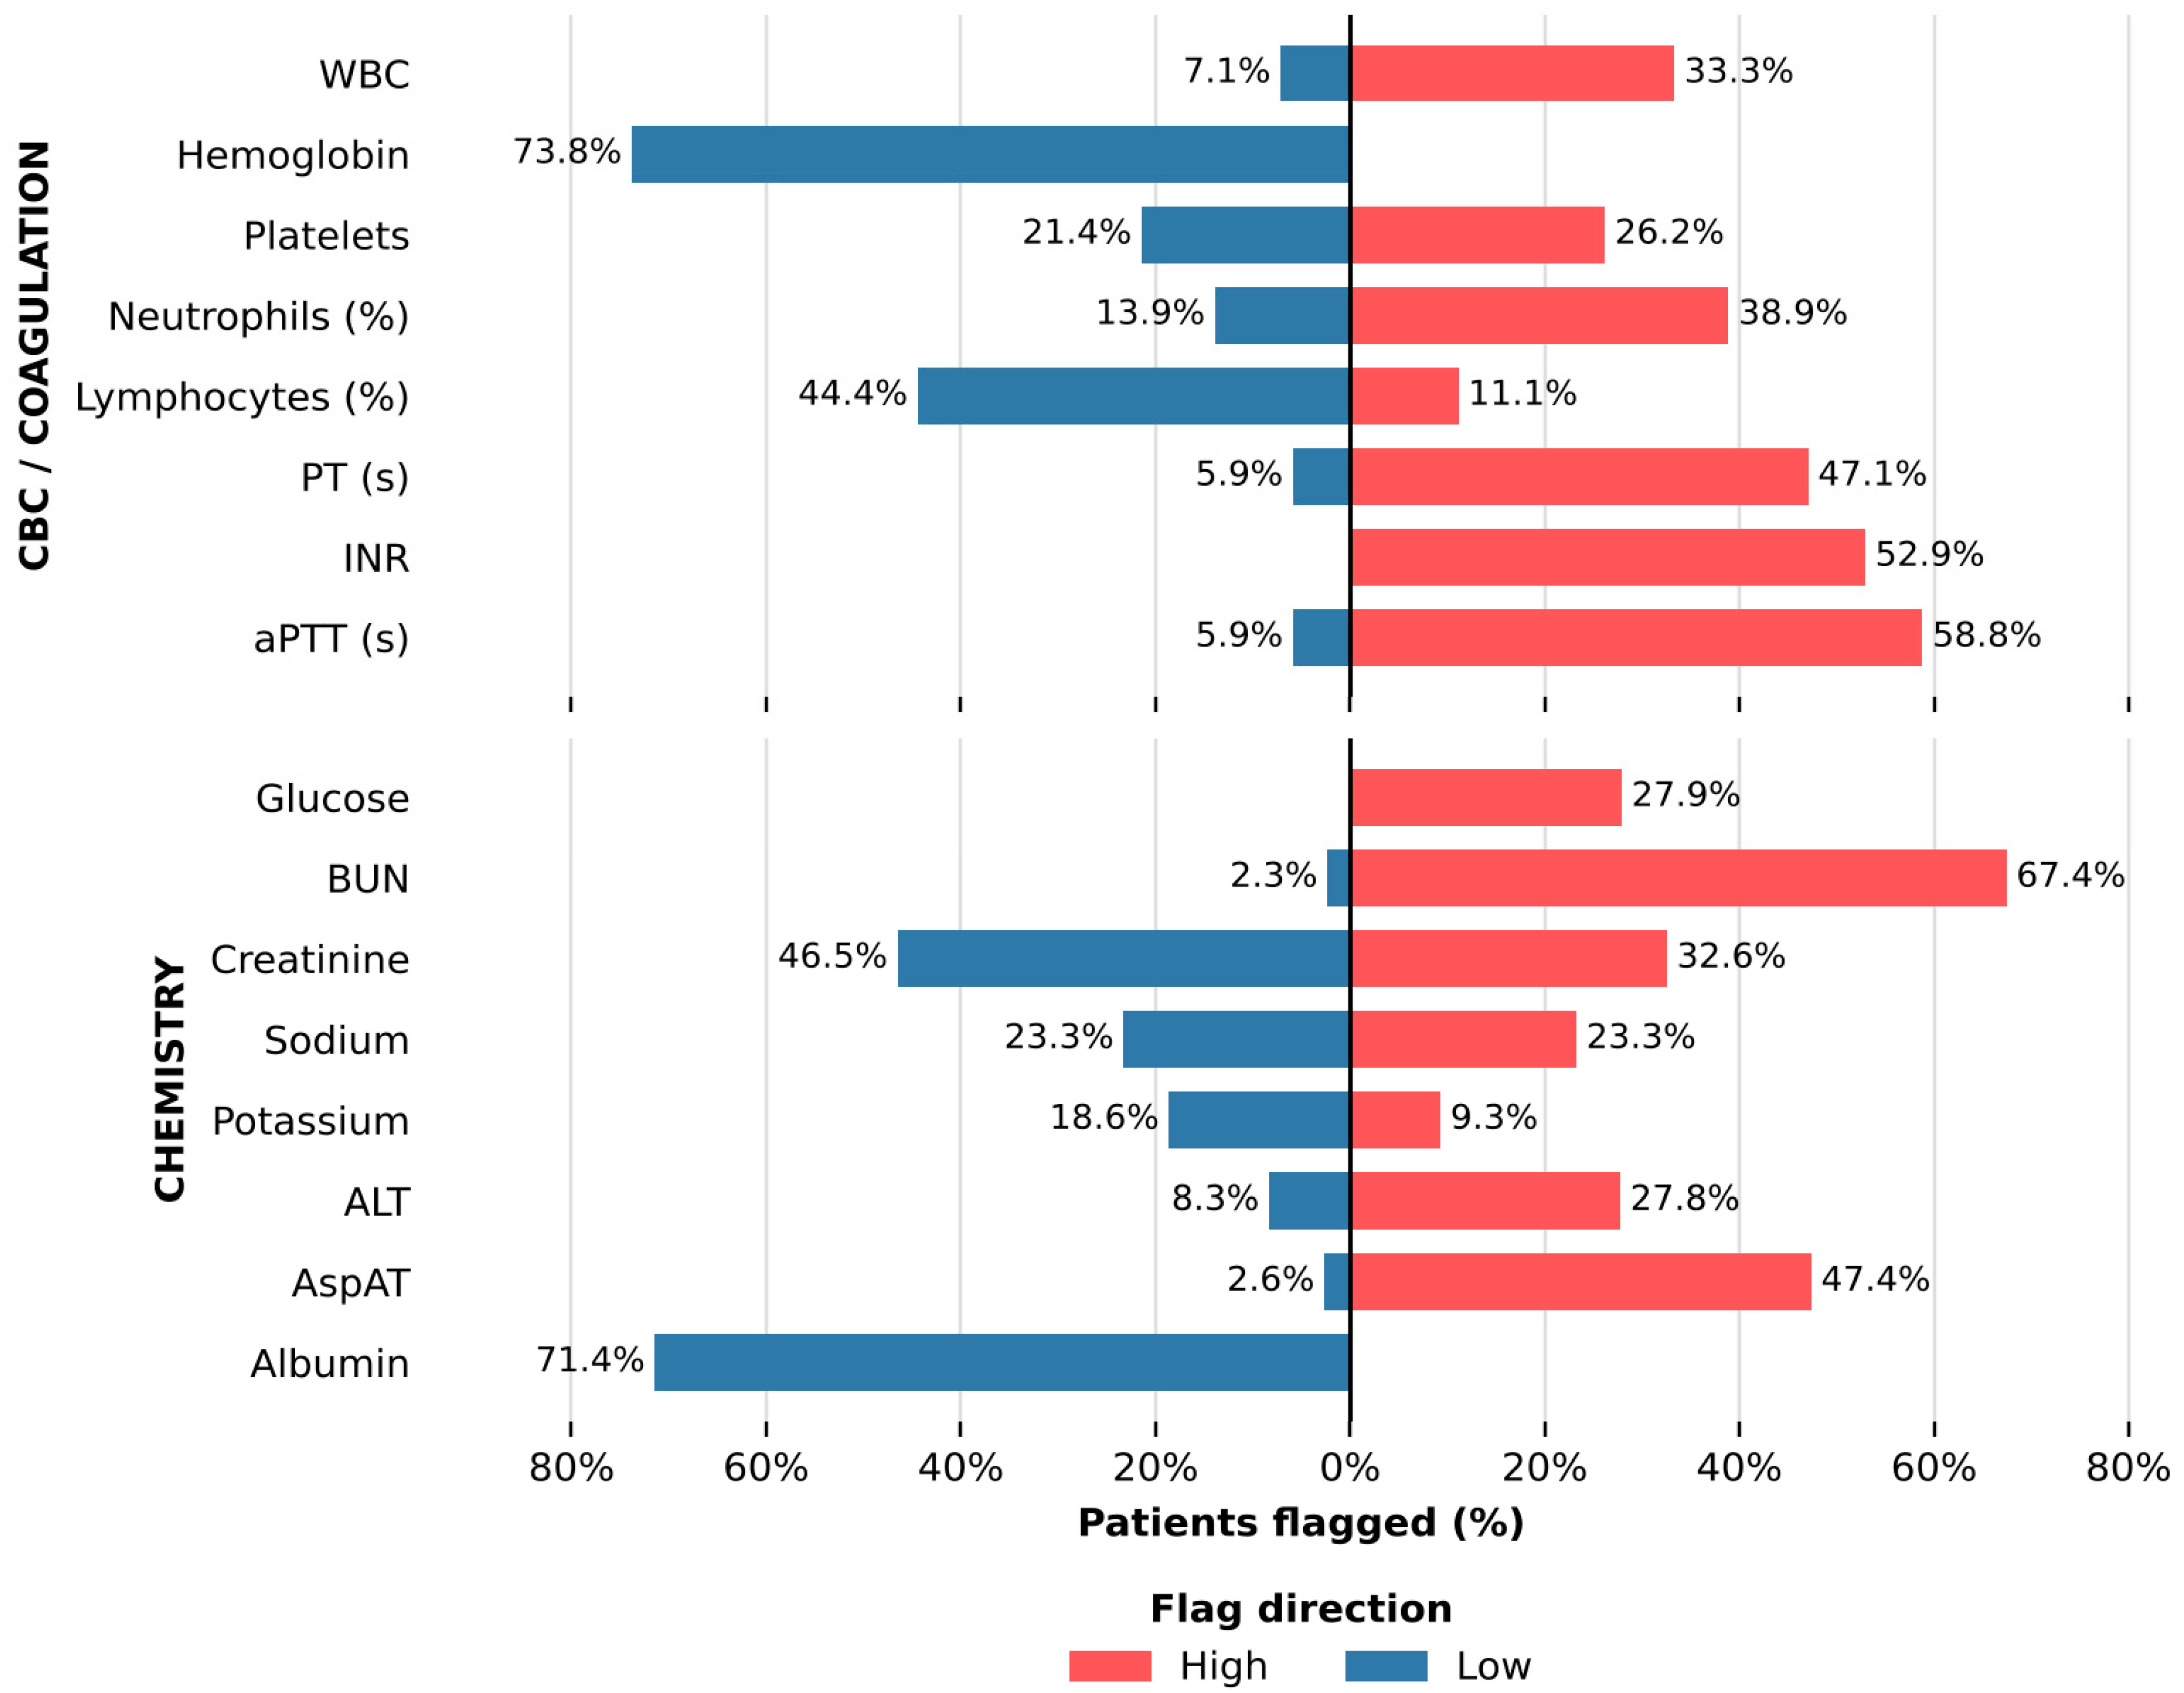
Complete blood count and coagulation results were available for most patients in the analytical cohort (Table 3). Hematological abnormalities were frequent, with anemia, defined using sex-specific reference intervals, observed in 31 of the 42 patients (73.8%). Leukocytosis was present in 14 of 42 patients (33.3%), whereas leukopenia was less frequent among the study patients. Differential leukocyte abnormalities were also common: neutrophil percentage was outside the reference interval in 19 of 36 patients (52.8%), and lymphocyte percentage was outside the reference interval in 20 of 36 patients (55.6%). Platelet abnormalities were present in 20 of 42 patients (47.6%), including thrombocytopenia seen in 9 patients (21.4%) and thrombocytosis noted in 11 patients (26.2%). Among patients with available coagulation results, elevated INR was observed in 9 of 17 patients (52.9%) (Table 3; Figure 3). Biochemical abnormalities were also frequent. Random glucose exceeded 140 mg/dL in 12 of 43 patients (27.9%), and 33 of 43 patients (76.7%) had values above 100 mg/dL. Elevated blood urea nitrogen (BUN) was observed in 29 of 43 patients (67.4%) and elevated creatinine in 14 of 43 patients (32.6%). Creatinine below the reference interval was observed in 20 of 43 patients (46.5%); low creatinine is not an indicator of renal dysfunction and most likely reflects reduced muscle mass, fluid administration, or increased renal clearance in acutely ill patients. Hypoalbuminemia was observed in 25 of 35 patients (71.4%). Hepatic enzyme abnormalities were also reported, including elevated AspAT in 18 of 38 patients (47.4%) and elevated ALT in 10 of 36 patients (27.8%) (Table 4). A summary of the direction and magnitude of laboratory abnormality burden across hematological, coagulation, and biochemical parameters, distinguishing values below and above the institutional reference intervals, is depicted in Figure 3. Because several laboratory variables showed skewed distributions and extreme values, central tendency was summarized using medians and interquartile ranges in Table 3 and Table 4. Selected biochemical markers showed wide analytical ranges, including glucose 124.0 mg/dL (IQR, 101.5–156.5; maximum, 628.0), BUN 26.0 mg/dL (IQR, 18.95–59.90; maximum, 310.0), creatinine 0.70 mg/dL (IQR, 0.48–1.51; maximum, 5.93), albumin 2.92 g/dL (IQR, 2.52–3.60), AspAT 33.5 U/L (IQR, 16.7–65.3; maximum, 888.6), ALT 26.4 U/L (IQR, 13.6–60.6; maximum, 522.3), and INR 1.23 (IQR, 0.96–1.32; maximum, 10.0) (Table 3 and Table 4).
Table 3.
Selected complete blood count and coagulation parameters among hospitalized patients with bacterial isolates.
Figure 3.
Laboratory abnormality burden among hospitalized patients with bacterial isolates. Bars show the percentage of patients with laboratory values below or above the institutional reference interval (sex-specific intervals for hemoglobin; >140 mg/dL for random glucose). Leftward bars indicate values below the reference interval, and rightward bars indicate values above the reference interval. Denominators include patients with available results and applicable reference intervals for each analyte. CBC, complete blood count; AspAT, aspartate aminotransferase; BUN, blood urea nitrogen.
Table 4.
Selected serum chemistry parameters among hospitalized patients with bacterial isolates.
2.5. Exploratory MDR-Stratified Laboratory Comparisons
Laboratory biomarker distributions were compared between patients with MDR (n = 30) and non-MDR (n = 13) isolates using the primary class-based MDR definition (Table 5). Platelet counts were lower in the MDR group than in the non-MDR group (median 252.0 vs. 450.0 × 10³/µL; Hodges–Lehmann difference −150.0 × 10³/µL, 95% CI −269.0 to −18.0; p = 0.032), but this difference did not remain significant after Bonferroni correction for 15 comparisons (α = 0.0033). Numerical differences were also observed for BUN, glucose, white blood cell count, and albumin; however, these did not reach statistical significance (Table 5). Hodges–Lehmann estimates of the median differences with 95% confidence intervals for all variables are provided in Supplementary Table S5; the wide confidence intervals indicate that clinically relevant differences cannot be excluded. With 30 MDR and 13 non-MDR cases, these comparisons had approximately 65% power to detect a large standardized difference (Cohen’s d = 0.8) at a two-sided α of 0.05 and reached 80% power only for d ≥ 0.95.
Table 5.
Exploratory comparison of laboratory biomarkers between MDR and non-MDR groups.
3. Discussion
This retrospective single-center study integrated culture-based antimicrobial susceptibility testing with routine laboratory biomarkers from 43 hospitalized inpatients in Jazan, Saudi Arabia, over a three-year period (1 January 2019 to 1 January 2022). The principal observation is the coexistence of a high multidrug-resistance (MDR) frequency with a substantial concurrent burden of hematological, renal, metabolic, and coagulation abnormalities. The cohort was approximately evenly distributed by sex and spanned a wide age range, indicating that the described resistance and laboratory patterns were not confined to a single demographic subgroup. Given the modest sample size, demographic variables should be treated as descriptive characteristics rather than statistically tested predictors of resistance phenotype or laboratory outcome.
Most isolates originated from patients in the intensive care unit, the female medical ward, and the male neurology ward. Patients in these clinical settings commonly carry a high burden of invasive devices, repeated sampling, immobility, and broad-spectrum antimicrobial exposure—all recognized risk factors for resistant nosocomial pathogens [3,5]. Although the dataset lacked consistent admission timing and culture timing data, these isolates are best characterized as culture-positive isolates from hospitalized patients rather than strictly hospital-acquired infections, thereby avoiding overstatement of what the available retrospective records permit. Three organisms collectively accounted for the majority of isolates: Staphylococcus epidermidis, Klebsiella pneumoniae, and Acinetobacter baumannii complex (Table 1). K. pneumoniae and A. baumannii are clinically significant Gram-negative pathogens with a well-characterized capacity to acquire resistance to broad-spectrum agents, including carbapenems and extended-spectrum cephalosporins [6,7]. S. epidermidis requires contextual interpretation: in the appropriate clinical setting it may represent a device-associated pathogen with biofilm-forming potential, but in the absence of specimen-source and clinical-correlate data it may also reflect colonization or laboratory contamination [8,9]. Applying the primary class-based definition of Magiorakos et al. [22], 30 of 43 isolates (69.8%) were classified as MDR after restriction to organism-applicable agents; an alternative resistance-based definition yielded an identical estimate (30 of 43, with agreement for 41 isolates), supporting the conclusion that MDR was prevalent in this cohort. Resistance was distributed across beta-lactams, macrolides, fluoroquinolones, and carbapenems (Table 2, Figure 1); no resistance to vancomycin, teicoplanin, or tigecycline was detected. Oxacillin resistance (11/11 staphylococci) should be interpreted in the context of the high proportion of coagulase-negative staphylococci in the isolate set, in which methicillin resistance was inferred from automated phenotypic testing without mecA or PBP2a confirmation and its classification depends on the CLSI breakpoint edition applied, and carbapenem resistance should be interpreted cautiously in the absence of molecular carbapenemase confirmation. Colistin resistance was confined to K. pneumoniae (5/7 tested) but was determined by an automated method without broth microdilution confirmation. The absence of vancomycin and tigecycline resistance must also be contextualized by organism identity, infection site, pharmacokinetic-pharmacodynamic considerations, and local stewardship policy. Local phenotypic resistance patterns may reflect both antimicrobial selective pressure and transmission dynamics rather than isolated prescribing deficiencies [23,24]. A 2024 systematic review and meta-analysis documented a substantial burden of carbapenem-resistant Enterobacterales in Saudi Arabia, reinforcing the value of locally derived susceptibility surveillance [25]. The patient-level susceptibility heatmap (Figure 2) highlights the heterogeneity of resistance profiles across individual patient records, underscoring the need for organism-specific interpretation of each valid antimicrobial susceptibility result in accordance with standardized resistance definitions [22].
The laboratory data add a second layer of clinical context. Anemia was the most prevalent hematological abnormality, observed in 31 of 42 patients (73.8%) using sex-specific reference intervals with a median hemoglobin concentration of 11.20 g/dL. In a cohort of hospitalized patients with culture-positive bacterial isolates, this finding is clinically relevant but etiologically nonspecific. Anemia in the setting of active bacterial infection may reflect anemia of inflammation, chronic kidney disease, nutritional deficiency, hemorrhage, repeated phlebotomy, dilutional effects, or a combination of these factors [11,26]. The biology of inflammation-associated anemia, including hepcidin-mediated iron restriction, impaired erythropoiesis, and reduced red-cell survival, provides a credible mechanistic explanation [15,27]. However, the absence of iron studies, inflammatory markers, transfusion records, and detailed comorbidity data means that anemia should be treated as a component of the overall abnormality burden rather than ascribed to a specific mechanistic pathway. Leukocyte abnormalities were heterogeneous: leukocytosis was present in approximately one-third of patients, and more than half of those with a differential count had neutrophil or lymphocyte percentages outside the reference range. Platelet abnormalities—comprising both thrombocytopenia and thrombocytosis—affected nearly half of patients, consistent with the variable inflammatory, infectious, and clinical contexts represented in the cohort [28]. Coagulation data were available for only 17 patients; among these, an elevated INR was present in more than half. These findings are compatible with several possible clinical processes, including sepsis-associated coagulopathy, but the available data do not establish a specific cause [12,29]. Because fibrinogen, D-dimer, anticoagulant medication records, and formal sepsis scoring data were unavailable, a diagnosis of disseminated intravascular coagulation cannot be asserted [12,30].
Renal and metabolic abnormalities were frequent and clinically relevant. Elevated BUN was observed in 29 of 43 patients (67.4%) and elevated creatinine in 14 of 43 (32.6%). Low creatinine values, observed in nearly half of the patients, were not interpreted as evidence of renal dysfunction. These findings are relevant to antimicrobial dosing and nephrotoxicity monitoring, even though acute kidney injury staging was not possible without baseline creatinine values, urine output data, or serial measurements [17,31]. Hypoalbuminemia was present in 25 of 35 patients for whom albumin data were available (71.4%). Low serum albumin in acutely ill patients typically reflects inflammation-driven capillary leakage, reduced synthesis, increased losses, nutritional compromise, or dilutional effects, and the present data cannot distinguish these pathways [13]. Hypoalbuminemia may also influence the pharmacokinetics of highly protein-bound drugs [32], although drug-specific exposure was not evaluated in this study. Random glucose above 140 mg/dL was present in 12 of 43 patients (27.9%), with one extreme value of 628 mg/dL. Stress hyperglycemia is common during acute illness and may complicate inpatient management [14]. Experimental evidence also indicates that hyperglycemia can impair neutrophil-mediated bacterial clearance, although direct extrapolation from experimental models to this clinical cohort should be avoided [33]. The available data do not permit distinction between pre-existing diabetes and stress hyperglycemia, corticosteroid exposure, nutritional support, or acute illness severity. Glucose concentration should therefore be interpreted as an indicator of metabolic disturbance rather than proof of a specific causal pathway.
The MDR-stratified laboratory comparisons should be interpreted with caution. Platelet counts were lower in the MDR group (unadjusted p = 0.032), and BUN, glucose, white blood cell count, and albumin showed numerical differences, but no difference remained significant after correction for multiple comparisons (Table 5, Supplementary Table S5). With 13 non-MDR cases, these comparisons were underpowered, and the wide confidence intervals around the median differences mean that the absence of statistical significance does not establish that MDR status was unrelated to laboratory abnormalities; equally, the data do not show that MDR phenotype drove them. The lower platelet counts in the MDR group may reflect greater illness severity and should be regarded as hypothesis-generating. Given the available data, illness severity, comorbidities, infection source, and other hospitalization-related factors remain plausible alternative explanations for the laboratory abnormality burden. A larger, outcome-annotated dataset would be required to determine whether MDR phenotype independently predicts organ dysfunction, prolonged hospital stay, treatment failure, or mortality after adjustment for relevant clinical confounders.
For antimicrobial stewardship, the clinical value of this study lies in the integration of its two data streams. Antimicrobial susceptibility profiles are essential for guiding therapy but are not sufficient in isolation. Renal functional status affects dosing and the risk of nephrotoxicity; coagulation and hepatic abnormalities influence drug safety monitoring; hyperglycemia and hypoalbuminemia indicate physiological stress that may alter drug handling and clinical risk; and hematological abnormalities provide additional context regarding host status. Saudi evidence on carbapenem-resistant Enterobacterales underscores the importance of locally derived resistance data when interpreting empiric treatment options [25]. Although stewardship outcomes were not evaluated in this study, stewardship programs may benefit from combining organism-specific antimicrobial susceptibility interpretation with systematic review of patient-specific clinical and laboratory information. This approach is consistent with evidence supporting hospital antimicrobial stewardship interventions and with formal implementation guidance [17,34]. The CDC Core Elements of Hospital Antibiotic Stewardship Programs likewise emphasize tracking, reporting, and use of local data to improve antimicrobial use [35].
Several limitations constrain the interpretation of these findings. The study was retrospective, single-center, and based on 43 patients, which limits statistical power and generalizability. The absence of consistent specimen-collection and admission-timing data precluded classification of isolates as community-onset or healthcare-associated. Organism-specific susceptibility panels varied in size, so resistance percentages require denominator-aware interpretation. Molecular resistance testing—including mecA profiling and carbapenemase gene detection—was not performed, which constrains mechanistic interpretation of resistance phenotypes. Eleven laboratory records contained results from both Gram-positive and Gram-negative AST panels, most likely reflecting polymicrobial cultures; only results applicable to the identified organism were analyzed, and the MDR frequency was similar when these records were excluded (23/32, 71.9%). The specimen source was not recorded in the extracted dataset. Among patients with a documented clinical diagnosis (n = 15), 10 had a neurological or neurosurgical condition, including four with an external ventricular drain or shunt, which suggests that device-associated central nervous system cultures were likely in this subgroup but does not establish the specimen type. Formal criteria to distinguish infection from colonization or contamination (for example, the number of positive blood culture sets) could therefore not be applied; this is particularly relevant to the interpretation of S. epidermidis. Methicillin resistance in coagulase-negative staphylococci was inferred from automated phenotypic testing only, and colistin results were not confirmed by reference broth microdilution. Interpretive categories were those reported by the laboratory at the time of testing and were not re-interpreted against a single CLSI M100 edition. The requirement for complete laboratory panels may have selected more severely ill patients and limited the representativeness of the cohort. Clinical outcomes, prior antimicrobial exposure, infection source, comorbidity indices, baseline laboratory values, and serial laboratory trajectories were unavailable, preventing causal inference. Despite these constraints, this study provides a locally grounded description of antimicrobial resistance and laboratory abnormality burden among hospitalized patients in the Jazan region. The high MDR frequency, together with the concurrent prevalence of anemia, dysglycemia, renal biochemical abnormalities, hypoalbuminemia, and coagulation disturbances, suggests that AMR surveillance data may be usefully interpreted alongside routine laboratory monitoring. Future multicenter studies incorporating standardized microbiological definitions, molecular resistance testing, longitudinal laboratory trajectories, and clinical outcome data are needed to determine whether MDR phenotype independently predicts adverse clinical outcomes in comparable patient populations.
4. Materials and Methods
4.1. Study Design and Ethics Statement
This retrospective single-center observational study was conducted at King Fahd Central Hospital, a 574-bed tertiary hospital in Jazan, Saudi Arabia. The study included 43 hospitalized patients with culture-positive bacterial isolates whose cultures were collected between 1 January 2019 and 1 January 2022. Four data domains were analyzed, including patient demographics, admission location, routine laboratory biomarkers, and antimicrobial susceptibility testing profiles. Eligible cases were hospitalized patients with a clinical culture positive for a bacterial organism with reported identification and AST, and with hematological and biochemical results available within the laboratory window defined in Section 4.4. The laboratory extraction identified 45 records meeting these criteria; two were excluded (one duplicate record and one repeat isolate from a patient already included), leaving 43 patients (Supplementary Figure S1). Only the first eligible culture episode per patient was included. The study was conducted using fully de-identified retrospective data and involved no direct patient contact or intervention. The study adhered to the Declaration of Helsinki. The study was approved by the Research Ethics Committee of Jazan University, Saudi Arabia (approval number REC43/1/002; approval date 19 February 2022), which waived the requirement for informed consent because only fully de-identified retrospective data were analyzed.
4.2. Data Collection and Variable Definitions
Patient data were extracted from the hospital electronic medical records and the laboratory information system. For each patient, the following data were collected: 1. Demographic data, which included age and biological sex; 2. Clinical data, including the ward or hospital location at the time of sample collection and the recorded clinical diagnosis when available; 3. Microbiological data, including the identified bacterial organism, Gram-staining category, and morphology. For each culture episode, the organism recorded as the identified isolate in the laboratory record was analyzed. When AST results for more than one organism were stored in the same record (11 records containing both Gram-positive and Gram-negative panels), only results applicable to the identified organism were retained (Section 4.3). 4. Laboratory data, including hematological, coagulation, and biochemical results obtained within the window defined in Section 4.4. Antimicrobial susceptibility testing results were recorded as susceptible, intermediate, or resistant. For descriptive microbiological analysis, isolates were grouped by organism species and by Gram-staining/morphological category, such as Gram-negative bacilli and Gram-positive cocci.
4.3. Microbiological Identification and Antimicrobial Susceptibility Testing
Clinical specimens were collected by trained healthcare staff using standard aseptic procedures appropriate for each specimen type and were transported to the microbiology laboratory according to the institutional protocols. Specimens were cultured on routine culture media, including blood agar, MacConkey agar, and chocolate agar, and incubated at 37 °C for 24–48 hours. Preliminary identification was based on colony morphology, Gram staining, hemolysis pattern, and relevant biochemical reactions, including oxidase, catalase, and coagulase testing when appropriate. Final organism identification and antimicrobial susceptibility testing (AST) were performed using the VITEK 2 automated system (BioMérieux, Marcy-l’Étoile, France), with organism-specific Gram-positive or Gram-negative identification and susceptibility cards. Additional verification using the MicroScan WalkAway system (Beckman Coulter, Sacramento, CA, USA) was performed when required by institutional laboratory procedures. Each bacterial isolate was tested against an organism-appropriate antimicrobial panel. Across the dataset, susceptibility results were available for up to 39 antimicrobial agents, including beta-lactams, cephalosporins, carbapenems, fluoroquinolones, aminoglycosides, macrolides, glycopeptides, and oxazolidinones. Because AST panels differed by organism group, resistance and non-susceptibility rates were calculated using only valid tested results for each antimicrobial agent as the denominator. Susceptibility results were recorded as susceptible, intermediate, or resistant according to laboratory-reported interpretive categories, which were assigned according to the Clinical and Laboratory Standards Institute (CLSI) M100 editions in use at the time of testing (29th–31st editions, 2019–2021), as applied by the VITEK 2 Advanced Expert System [18,19,20]; as this was a retrospective analysis, laboratory-reported categories were used without reinterpretation of MICs against a single guideline edition. Oxacillin MICs were determined for staphylococci using VITEK 2 Gram-positive susceptibility cards; species-specific cefoxitin disk diffusion and mecA/PBP2a testing were not performed. Colistin susceptibility was determined by VITEK 2 and was not confirmed by the reference broth microdilution method recommended by the joint CLSI–EUCAST Polymyxin Breakpoints Working Group [36]. Before analysis, AST results were restricted to agents applicable to the identified organism: results belonging to the opposite Gram panel and results for agents to which the organism is intrinsically resistant according to CLSI M100 were excluded (109 of 760 results in 25 records), leaving 652 results for analysis. For the primary MDR classification, intermediate and resistant results were grouped as non-susceptible. MDR was defined according to the international expert proposal by Magiorakos et al. as non-susceptibility to at least one antimicrobial agent in three or more antimicrobial categories, with intermediate and resistant results grouped as non-susceptible [22]. Antimicrobial categories were assigned using the organism-specific category lists proposed by Magiorakos et al. for Staphylococcus aureus (also applied to coagulase-negative staphylococci), Enterococcus spp., Enterobacterales, Pseudomonas aeruginosa (also applied to other non-fermenting Gram-negative bacilli), and Acinetobacter spp.; the single Streptococcus pneumoniae isolate was classified using agents applicable to that species. Agents to which an organism is intrinsically resistant were not counted. Isolates tested in fewer than three applicable categories were to be classified as not evaluable; no isolate met this criterion (median, 10 categories tested; range, 4–15). The categories applied to each organism are given in Supplementary Table S3. Antimicrobial agents not tested for a given isolate were treated as missing and were not considered susceptible. Because organism-specific AST panels were used and not all isolates were tested against the same agents, a study-specific resistance-burden sensitivity analysis was also performed using an alternative rule based on resistance to three or more individual applicable antimicrobial agents, regardless of antimicrobial category. This alternative definition is not stricter than the class-based definition, because resistance to three agents within a single category also qualifies. This secondary analysis was used only to assess the robustness of the estimated resistance burden and was not used for the main MDR-stratified clinical or laboratory comparisons. Because exact admission timing and symptom-onset data were not consistently available, isolates were classified as bacterial isolates from hospitalized patients rather than strictly hospital-acquired infections. Laboratory quality control was performed according to institutional procedures using appropriate reference strains, including Pseudomonas aeruginosa ATCC 27853.
4.4. Hematological, Coagulation, and Biochemical Measurements
Routine laboratory results obtained within 24–48 h of culture collection were extracted from the laboratory information system; when more than one result was available within this window, the result closest in time to culture collection was used. Hematological parameters were measured using the UniCel DxH 900 Coulter Cellular Analysis System (Beckman Coulter, Sacramento, CA, USA). Complete blood count parameters included white blood cell count, red blood cell count, hemoglobin, hematocrit, red cell indices, platelet count, red cell distribution width, and white blood cell differential counts, including neutrophils, lymphocytes, monocytes, eosinophils, and basophils. Coagulation parameters were measured using the Sysmex CS-2500 System (Siemens Diagnostic Services Inc., Tarrytown, NY, USA), which included prothrombin time, activated partial thromboplastin time, and international normalized ratio. Biochemical parameters were measured using the Cobas 6000 Analyzer Series (Roche Diagnostics, Indianapolis, IN, USA). The analyzed chemistry profile included renal and metabolic markers, electrolytes, hepatic and protein markers, and enzyme activity markers. These included blood urea nitrogen, creatinine, uric acid, glucose, sodium, potassium, chloride, calcium, phosphorus, magnesium, total protein, albumin, total and direct bilirubin, alanine aminotransferase, aspartate aminotransferase, alkaline phosphatase, gamma-glutamyl transferase, lactate dehydrogenase, creatine phosphokinase, and triglycerides. All analyses were performed according to the established institutional laboratory procedures and the quality-control protocols in place. Hemoglobin was classified using sex-specific reference intervals (female 12.0–15.5 g/dL; male 13.5–17.5 g/dL) [37]. Glucose measurements were random (non-fasting), and hyperglycemia was defined as a random glucose >140 mg/dL, consistent with inpatient criteria [21]. The analyte reported as urea with a reference interval of 7–20 mg/dL corresponds to blood urea nitrogen (BUN) and is reported as such. One creatinine value recorded in µmol/L was converted to mg/dL. Extreme values were checked against the laboratory information system and retained as recorded.
4.5. Statistical Analysis
Statistical analyses were performed using R software version 4.4.2 (R Foundation for Statistical Computing, Vienna, Austria) [38]. Continuous variables were assessed for distributional characteristics using visual inspection and normality testing. Normally distributed variables were summarized as mean ± standard deviation (SD), whereas skewed variables were summarized as median and interquartile range (IQR). Categorical variables were summarized as frequencies and percentages. Resistance and non-susceptibility rates were calculated for each antimicrobial agent using only isolates with valid susceptibility results for that agent as the denominator. Antimicrobial agents with fewer than five valid susceptibility results were excluded from the main resistance-rate table to reduce instability from small denominators. Multidrug resistance (MDR) was analyzed using the primary class-based definition of non-susceptibility to at least one antimicrobial agent in three or more antimicrobial categories. A sensitivity analysis using resistance to three or more individual antimicrobial agents was also performed. Comparisons between MDR and non-MDR groups were performed using Welch’s t-test for approximately normally distributed continuous variables and the Mann–Whitney U test for skewed continuous variables. Categorical variables were compared using the chi-square test or Fisher’s exact test, as appropriate. Laboratory values were classified as low, within range, or high according to institutional reference intervals. The burden of laboratory abnormality was summarized as the number and percentage of patients with values outside the reference interval. For MDR versus non-MDR comparisons, between-group differences were estimated as Hodges–Lehmann median differences with 95% confidence intervals, and a Bonferroni-adjusted threshold (α = 0.05/15 = 0.0033) was used to account for multiple laboratory comparisons. Fisher’s exact test for tables larger than 2 × 2 used Monte Carlo simulation (200,000 replicates). A post hoc power calculation (two-sample t-test approximation) was performed for the observed group sizes (30 versus 13). All statistical tests were two-sided, and p < 0.05 was considered statistically significant. MDR-stratified laboratory comparisons were considered exploratory.
5. Conclusions
This single-center retrospective study demonstrates a high burden of multidrug resistance (MDR)—identified in 69.8% of isolates using the primary class-based definition—coexisting with a substantial prevalence of hematological, renal, metabolic, and coagulation abnormalities among hospitalized patients in Jazan, Saudi Arabia. Although exploratory analyses showed no biomarker difference between MDR and non-MDR groups that remained significant after correction for multiple comparisons, the frequent concurrency of high resistance rates among the most frequent bacterial isolates (Klebsiella pneumoniae, Acinetobacter baumannii complex, and Staphylococcus epidermidis) and widespread laboratory derangements highlights the complex clinical status of these inpatients. These findings underscore the need for denominator-aware, organism-specific interpretation of local susceptibility data; whether integrating routine laboratory monitoring with AMR surveillance improves antimicrobial stewardship was not evaluated in this study and warrants prospective investigation. Larger multicenter investigations incorporating longitudinal clinical data and molecular resistance profiling are warranted to determine whether the MDR phenotype independently predicts adverse outcomes in comparable regional populations.
Supplementary Materials
The following supporting information can be downloaded at: https://www.mdpi.com/article/10.3390/antibiotics15111065/s1, Figure S1: Flow diagram of patient selection; Table S1: Complete blood count and coagulation parameters: median, IQR, range, and reference-range flags; Table S2: Serum chemistry parameters: median, IQR, range, and reference-range flags; Table S3: Antimicrobial categories applied for MDR classification (Magiorakos et al.) and categories tested and non-susceptible per isolate, by organism; Table S4: Organism-specific antimicrobial susceptibility results: number of isolates of each species tested against each agent and resistant (R), intermediate (I), and susceptible (S) counts; Table S5: Hodges–Lehmann median differences (MDR − non-MDR) with 95% confidence intervals for laboratory biomarkers.
Author Contributions
Conceptualization, E.A., H.M. and M.A.S.; methodology, E.A.; software, E.A., M.A.S. and H.M.; validation, E.A., H.M. and M.A.S.; formal analysis, E.A., H.M. and M.A.S.; investigation, E.A., H.M. and M.A.S.; resources, E.A.; data curation, E.A. and H.M.; writing—original draft preparation, E.A.; writing—review and editing, E.A.; visualization, M.A.S. and H.M.; supervision, E.A.; project administration, E.A. All authors have read and agreed to the published version of the manuscript.
Funding
This research received no external funding.
Institutional Review Board Statement
The study was conducted using fully de-identified retrospective data and involved no direct patient contact or intervention. The study adhered to the Declaration of Helsinki. The study was approved by the Research Ethics Committee of Jazan University, Saudi Arabia (approval number REC43/1/002; approval date 19 February 2022), which waived the requirement for informed consent because only fully de-identified retrospective data were analyzed.
Informed Consent Statement
Patient consent was waived by the Research Ethics Committee of Jazan University because only fully de-identified retrospective data were analyzed.
Data Availability Statement
The original contributions presented in this study are included in the article/Supplementary Material. Further inquiries can be directed to the corresponding authors.
Acknowledgments
The authors are immensely thankful for the participants of this study.
Conflicts of Interest
The authors declare no conflicts of interest.
Abbreviations
The following abbreviations are used in this manuscript:
| ALP | Alkaline phosphatase |
| ALT | Alanine aminotransferase |
| AMR | Antimicrobial resistance |
| AST | Antimicrobial susceptibility testing |
| AspAT | Aspartate aminotransferase |
| aPTT | Activated partial thromboplastin time |
| BUN | Blood urea nitrogen |
| CLSI | Clinical and Laboratory Standards Institute |
| MIC | Minimum inhibitory concentration |
| CBC | Complete blood count |
| CPK | Creatine phosphokinase |
| GGT | Gamma-glutamyl transferase |
| ICU | Intensive care unit |
| INR | International normalized ratio |
| IQR | Interquartile range |
| LDH | Lactate dehydrogenase |
| MDR | Multidrug resistance |
| SD | Standard deviation |
| WBC | White blood cell count |
References
- Murray, C.J.L.; Ikuta, K.S.; Sharara, F.; Swetschinski, L.; Robles Aguilar, G.; Gray, A.; Han, C.; Bisignano, C.; Rao, P.; Wool, E.; et al. Global burden of bacterial antimicrobial resistance in 2019: A systematic analysis. Lancet 2022, 399, 629–655. [Google Scholar] [CrossRef] [Scilit] [PubMed]
- Otter, J.A.; Yezli, S.; Salkeld, J.A.; French, G.L. Evidence that contaminated surfaces contribute to the transmission of hospital pathogens and an overview of strategies to address contaminated surfaces in hospital settings. Am. J. Infect. Control. 2013, 41, S6–S11. [Google Scholar] [CrossRef] [Scilit] [PubMed]
- Eggimann, P.; Pittet, D. Infection control in the ICU. Chest 2001, 120, 2059–2093. [Google Scholar] [CrossRef] [Scilit] [PubMed]
- Klevens, R.M.; Edwards, J.R.; Richards, C.L., Jr.; Horan, T.C.; Gaynes, R.P.; Pollock, D.A.; Cardo, D.M. Estimating health care-associated infections and deaths in U.S. hospitals, 2002. Public Health Rep. 2007, 122, 160–166. [Google Scholar] [CrossRef] [Scilit] [PubMed]
- Vincent, J.L.; Rello, J.; Marshall, J.; Silva, E.; Anzueto, A.; Martin, C.D.; Moreno, R.; Lipman, J.; Gomersall, C.; Sakr, Y.; et al. International study of the prevalence and outcomes of infection in intensive care units. JAMA 2009, 302, 2323–2329. [Google Scholar] [CrossRef] [Scilit] [PubMed]
- Peleg, A.Y.; Hooper, D.C. Hospital-acquired infections due to gram-negative bacteria. N. Engl. J. Med. 2010, 362, 1804–1813. [Google Scholar] [CrossRef] [Scilit] [PubMed]
- Tacconelli, E.; Carrara, E.; Savoldi, A.; Harbarth, S.; Mendelson, M.; Monnet, D.L.; Pulcini, C.; Kahlmeter, G.; Kluytmans, J.; Carmeli, Y.; et al. Discovery, research, and development of new antibiotics: The WHO priority list of antibiotic-resistant bacteria and tuberculosis. Lancet Infect. Dis. 2018, 18, 318–327. [Google Scholar] [CrossRef] [Scilit] [PubMed]
- Rogers, K.L.; Fey, P.D.; Rupp, M.E. Coagulase-negative staphylococcal infections. Infect. Dis. Clin. N. Am. 2009, 23, 73–98. [Google Scholar] [CrossRef] [Scilit] [PubMed]
- Otto, M. Staphylococcus epidermidis—The ‘accidental’ pathogen. Nat. Rev. Microbiol. 2009, 7, 555–567. [Google Scholar] [CrossRef] [Scilit] [PubMed]
- Singer, M.; Deutschman, C.S.; Seymour, C.W.; Shankar-Hari, M.; Annane, D.; Bauer, M.; Bellomo, R.; Bernard, G.R.; Chiche, J.-D.; Coopersmith, C.M.; et al. The Third International Consensus Definitions for Sepsis and Septic Shock (Sepsis-3). Jama 2016, 315, 801–810. [Google Scholar] [CrossRef] [Scilit] [PubMed]
- Ganz, T. Anemia of Inflammation. N. Engl. J. Med. 2019, 381, 1148–1157. [Google Scholar] [CrossRef] [Scilit] [PubMed]
- Iba, T.; Levy, J.H.; Warkentin, T.E.; Thachil, J.; van der Poll, T.; Levi, M. Diagnosis and management of sepsis-induced coagulopathy and disseminated intravascular coagulation. J. Thromb. Haemost. 2019, 17, 1989–1994. [Google Scholar] [CrossRef] [Scilit] [PubMed]
- Soeters, P.B.; Wolfe, R.R.; Shenkin, A. Hypoalbuminemia: Pathogenesis and Clinical Significance. JPEN J. Parenter. Enter. Nutr. 2019, 43, 181–193. [Google Scholar] [CrossRef] [Scilit] [PubMed]
- Vedantam, D.; Poman, D.S.; Motwani, L.; Asif, N.; Patel, A.; Anne, K.K. Stress-Induced Hyperglycemia: Consequences and Management. Cureus 2022, 14, e26714. [Google Scholar] [CrossRef] [Scilit] [PubMed]
- Weiss, G.; Ganz, T.; Goodnough, L.T. Anemia of inflammation. Blood 2019, 133, 40–50. [Google Scholar] [CrossRef] [Scilit] [PubMed]
- Evans, L.; Rhodes, A.; Alhazzani, W.; Antonelli, M.; Coopersmith, C.M.; French, C.; Machado, F.R.; Mcintyre, L.; Ostermann, M.; Prescott, H.C.; et al. Surviving sepsis campaign: International guidelines for management of sepsis and septic shock 2021. Intensive Care Med. 2021, 47, 1181–1247. [Google Scholar] [CrossRef] [Scilit] [PubMed]
- Barlam, T.F.; Cosgrove, S.E.; Abbo, L.M.; MacDougall, C.; Schuetz, A.N.; Septimus, E.J.; Srinivasan, A.; Dellit, T.H.; Falck-Ytter, Y.T.; Fishman, N.O.; et al. Implementing an Antibiotic Stewardship Program: Guidelines by the Infectious Diseases Society of America and the Society for Healthcare Epidemiology of America. Clin. Infect. Dis. 2016, 62, e51–e77. [Google Scholar] [CrossRef] [Scilit] [PubMed]
- Clinical and Laboratory Standards Institute. Performance Standards for Antimicrobial Susceptibility Testing, 29th ed.; CLSI supplement M100; Clinical and Laboratory Standards Institute: Wayne, PA, USA, 2019. [Google Scholar]
- Clinical and Laboratory Standards Institute. Performance Standards for Antimicrobial Susceptibility Testing, 30th ed.; CLSI supplement M100; Clinical and Laboratory Standards Institute: Wayne, PA, USA, 2020. [Google Scholar]
- Clinical and Laboratory Standards Institute. Performance Standards for Antimicrobial Susceptibility Testing, 31st ed.; CLSI supplement M100; Clinical and Laboratory Standards Institute: Wayne, PA, USA, 2021. [Google Scholar]
- American Diabetes Association Professional Practice Committee. 16. Diabetes Care in the Hospital: Standards of Care in Diabetes—2024. Diabetes Care 2024, 47, S295–S306. [Google Scholar] [CrossRef] [Scilit] [PubMed]
- Magiorakos, A.P.; Srinivasan, A.; Carey, R.B.; Carmeli, Y.; Falagas, M.E.; Giske, C.G.; Harbarth, S.; Hindler, J.F.; Kahlmeter, G.; Olsson-Liljequist, B.; et al. Multidrug-resistant, extensively drug-resistant and pandrug-resistant bacteria: An international expert proposal for interim standard definitions for acquired resistance. Clin. Microbiol. Infect. 2012, 18, 268–281. [Google Scholar] [CrossRef] [Scilit] [PubMed]
- Llor, C.; Bjerrum, L. Antimicrobial resistance: Risk associated with antibiotic overuse and initiatives to reduce the problem. Ther. Adv. Drug Saf. 2014, 5, 229–241. [Google Scholar] [CrossRef] [Scilit] [PubMed]
- Schinas, G.; Polyzou, E.; Spernovasilis, N.; Gogos, C.; Dimopoulos, G.; Akinosoglou, K. Preventing Multidrug-Resistant Bacterial Transmission in the Intensive Care Unit with a Comprehensive Approach: A Policymaking Manual. Antibiotics 2023, 12, 1225. [Google Scholar] [CrossRef] [Scilit] [PubMed]
- Alshehri, A.A.; Irekeola, A.A. Prevalence of carbapenem-resistant Enterobacterales (CRE) in Saudi Arabia: A systematic review and meta-analysis. Saudi Pharm. J. 2024, 32, 102186. [Google Scholar] [CrossRef] [Scilit] [PubMed]
- Weiss, G.; Goodnough, L.T. Anemia of chronic disease. N. Engl. J. Med. 2005, 352, 1011–1023. [Google Scholar] [CrossRef] [Scilit] [PubMed]
- Fraenkel, P.G. Anemia of Inflammation: A Review. Med. Clin. N. Am. 2017, 101, 285–296. [Google Scholar] [CrossRef] [Scilit] [PubMed]
- Vincent, J.L.; Yagushi, A.; Pradier, O. Platelet function in sepsis. Crit. Care Med. 2002, 30, S313–S317. [Google Scholar] [CrossRef] [Scilit] [PubMed]
- Iba, T.; Helms, J.; Levy, J.H. Sepsis-induced coagulopathy (SIC) in the management of sepsis. Ann. Intensive Care 2024, 14, 148. [Google Scholar] [CrossRef] [Scilit] [PubMed]
- Levi, M.; Scully, M. How I treat disseminated intravascular coagulation. Blood 2018, 131, 845–854. [Google Scholar] [CrossRef] [Scilit] [PubMed]
- Perazella, M.A. Renal vulnerability to drug toxicity. Clin. J. Am. Soc. Nephrol. 2009, 4, 1275–1283. [Google Scholar] [CrossRef] [Scilit] [PubMed]
- Ulldemolins, M.; Roberts, J.A.; Rello, J.; Paterson, D.L.; Lipman, J. The effects of hypoalbuminaemia on optimizing antibacterial dosing in critically ill patients. Clin. Pharmacokinet. 2011, 50, 99–110. [Google Scholar] [CrossRef] [Scilit] [PubMed]
- Javid, A.; Zlotnikov, N.; Pětrošová, H.; Tang, T.T.; Zhang, Y.; Bansal, A.K.; Ebady, R.; Parikh, M.; Ahmed, M.; Sun, C.; et al. Hyperglycemia Impairs Neutrophil-Mediated Bacterial Clearance in Mice Infected with the Lyme Disease Pathogen. PLoS ONE 2016, 11, e0158019. [Google Scholar] [CrossRef] [Scilit] [PubMed]
- Schuts, E.C.; Hulscher, M.; Mouton, J.W.; Verduin, C.M.; Stuart, J.; Overdiek, H.; van der Linden, P.D.; Natsch, S.; Hertogh, C.M.P.M.; Wolfs, T.F.W.; et al. Current evidence on hospital antimicrobial stewardship objectives: A systematic review and meta-analysis. Lancet Infect. Dis. 2016, 16, 847–856, Erratum in Lancet Infect Dis. 2016, 16, 768. [Google Scholar] [CrossRef] [Scilit] [PubMed]
- CDC. The Core Elements of Hospital Antibiotic Stewardship Programs: 2019; U.S. Department of Health and Human Services, CDC: Atlanta, GA, USA, 2019.
- CLSI-EUCAST Polymyxin Breakpoints Working Group. Recommendations for MIC Determination of Colistin (Polymyxin E) As Recommended by the Joint CLSI-EUCAST Polymyxin Breakpoints Working Group; European Committee on Antimicrobial Susceptibility Testing: Växjö, Sweden, 2016; Available online: https://www.eucast.org/fileadmin/src/media/PDFs/EUCAST_files/General_documents/Recommendations_for_MIC_determination_of_colistin_March_2016.pdf (accessed on 13 October 2026).
- World Health Organization. Haemoglobin Concentrations for the Diagnosis of Anaemia and Assessment of Severity; WHO/NMH/NHD/MNM/11.1; World Health Organization: Geneva, Switzerland, 2011. [Google Scholar]
- R Core Team. R: A Language and Environment for Statistical Computing; R Foundation for Statistical Computing: Vienna, Austria, 2024. [Google Scholar]

Disclaimer/Publisher’s Note: The statements, opinions and data contained in all publications are solely those of the individual author(s) and contributor(s) and not of MDPI and/or the editor(s). MDPI and/or the editor(s) disclaim responsibility for any injury to people or property resulting from any ideas, methods, instructions or products referred to in the content. |
© 2026 by the authors. Licensee MDPI, Basel, Switzerland. This article is an open access article distributed under the terms and conditions of the Creative Commons Attribution (CC BY) license.