


Abstract
Efficient power distribution is needed for visible GaN photonic integrated circuits. We investigate GaN-on-Si Y-branch splitters at 450 nm using three-dimensional beam propagation simulations, comparing planar geometry, slab removal, and backside optical boundaries. In the reference calculations, topside slab removal reduces input-referenced loss from 4.428 to 0.391 dB, and complete backside slab removal reduces the loss to 0.371 dB. Complementary branch widths provide nominal 70:30, 80:20, and 90:10 division with errors below one percentage point under the specified Gaussian launch. A two-stage 1 × 4 cascade provides 71.8% total transmission. Additional modal, absorption, wavelength, and dimensional comparisons clarify the operating conditions of these designs. A direct four-arm comparison shows a trade-off between throughput and output uniformity. The study extends slab and backside engineering to two- and four-port GaN-on-Si power-routing components and identifies the excitation and material parameters relevant to their design.
1. Introduction
1.1. GaN Visible Photonics and On-Chip Power Distribution
Integrated photonics is extending from the near-infrared to the visible range, where compact optical systems are required for visible-light communication, biochemical sensing, spectroscopy, quantum technologies, and display and imaging applications [1]. Gallium nitride (GaN) is attractive because its wide direct bandgap provides transparency in the visible range, while the InGaN/GaN material system can support light emission, photodetection, modulation, and passive routing. This combination provides a route toward monolithic active–passive photonic integrated circuits (PICs).
The GaN-on-Si platform combines III-nitride optoelectronic functionality with large-area, low-cost silicon substrates. Recent studies have integrated transmitters, modulators, waveguides, beam splitters, and receivers on GaN-on-Si wafers [2,3], while heterogeneous electronic–photonic integration has combined a GaN PIC with a silicon transimpedance amplifier [4]. Waveguides and grating couplers have also been reported on GaN platforms [5]. Increasing circuit complexity requires optical power to be delivered to multiple components with low loss and equal or prescribed power ratios. Cascaded splitter networks [6] and reconfigurable two- to four-port splitters [7] illustrate this requirement.
1.2. Y-Branch Splitters and Current Design Limitations
Among power division devices, the Y branch is appealing because it is non-resonant and geometrically simple and can be cascaded into multiport trees. A symmetric junction provides nominal 1:1 division, whereas controlled asymmetry can realize unequal output ratios without active tuning. Its performance depends on the conversion of the input mode into the two branch modes. A large branching angle, an abrupt junction tip, or an unsuitable transition length can excite radiation and higher-order field components. An earlier GaN-on-sapphire study used the beam propagation method (BPM) to optimize a Y-branch splitter at a telecommunication wavelength [8]. More recent studies have optimized branch shape and dimensions [9], introduced subwavelength junction structures [10,11], and demonstrated prescribed-ratio multiport and adiabatic splitters [12,13].
Most of these studies have targeted silicon, silicon nitride, or silica waveguides that operate near 1.55 μm, with vertical confinement provided by a low-index cladding stack. A GaN-on-Si ridge waveguide operating in the visible range is connected to a thick III-nitride slab above absorbing silicon. Its total loss includes junction-induced radiation and power coupled through the slab and substrate. Planar branch-angle or taper optimization should therefore be considered together with vertical confinement [14,15,16,17,18,19]. Evaluation of the splitter must distinguish total transmission, post-junction loss, and division accuracy [9,10,11,12,13].
1.3. Slab Leakage and Backside Optical Boundary Engineering
Losses in a Y-branch splitter accumulate along the input and output waveguides, while the branching transition introduces radiation and mode mismatch. Although these losses occur in different regions, both depend on confinement by the waveguide cross-section. Insufficient vertical isolation increases field overlap with the slab, lower cladding, and substrate. Part of the optical field couples to substrate-supported or radiative channels. The lower optical boundary therefore influences power transfer. In visible Si3N4/SiO2 waveguide–photodetector systems, tapered lower claddings have also been designed and fabricated to promote coupling into silicon detectors [20].
Studies of SiN platforms have demonstrated the influence of the vertical stack. Sacher et al. reported SiN waveguides and power dividers on Si with SiO2 cladding over 430–648 nm [14]. Sanna et al. used 1.7 μm SiO2 lower cladding for visible-to-near-infrared components [15]. In near-infrared devices, Puckett et al. employed 15 μm thermal-SiO2 lower cladding to obtain an equivalent propagation loss of 0.060 dB/m [16]. Bose et al. showed that weakly confined waveguides were more sensitive to cladding absorption, whereas stronger confinement increased the relative influence of sidewall scattering [17].
Reported leakage control methods follow two routes. The first strengthens optical isolation by increasing the low-index buffer, modifying the guiding core, or removing the substrate locally, as demonstrated in hybrid Si–SiN [18] and suspended subwavelength-grating waveguides [19]. The second engineers the lower optical boundary through antiresonant layers [21] or dielectric reflectors, including TiO2/SiO2 distributed Bragg reflectors integrated with GaN structures [22]. Their effect depends on absorption, phase, and coupling of the reflected field to the guided mode. We therefore compare each backside material with a thickness-matched air layer.
1.4. Relationship to Previous Work and Research Gap
This study extends our two previously published investigations of straight and bent GaN-on-Si waveguides [23,24] to Y-branch power splitters. We compare topside and backside processing in a common Y layout, examine backside optical layers, and evaluate two- and four-port power division. The branching devices introduce the additional design requirements of output balance, prescribed ratios, and field evolution between successive junctions.
1.5. Scope and Contributions of This Work
We selected 450 nm as a representative blue wavelength near the 448 nm operation demonstrated in an integrated InGaN modulator–laser [25] to maintain continuity with our earlier waveguide studies [23,24]. The present work compares topside etching, backside thinning, and backside optical boundaries in a common Y layout, and then extends the platform to prescribed two-port ratios and cascaded four-port division. Supplementary calculations examine modal excitation, material absorption, local wavelength response, numerical sensitivity, and dimensional perturbations.
2. Materials and Methods
2.1. GaN-on-Si Epitaxial Platform
The simulated structure followed the GaN-on-Si layer sequence used in our earlier studies [23,24]: air/p-GaN/p-AlGaN/InGaN–GaN multiple quantum wells (MQWs)/n-GaN/GaN/AlGaN/AlN/Si. The nitride thicknesses were 0.080, 0.035, 0.060, 2.600, 0.600, 0.700, and 0.300 μm, totaling 4.375 μm. The epitaxial design specified a 200 μm Si substrate; the calculation represents its portion within the computational window. GaN and Si used RSoft material-library data (Synopsys, Inc., Mountain View, CA, USA). AlGaN, the effective MQW layer, and AlN had assigned real indices of 2.480, 2.550, and 2.150. The MQW region was represented as one homogeneous 60 nm layer. The p- and n-GaN regions shared the GaN optical data in the reference model; alloy compositions, well/barrier periods, and dopant concentrations were not independently specified. SiO2, TiO2, and Ag also used the RSoft material library.
The reference model neglects nitride absorption to separate the effects of geometry and the substrate. We additionally varied absorption in the p-GaN and effective MQW layers, following the separate treatment of these contributions in blue-LED optical models [26,27]. The coefficients are specified sensitivity scenarios; their effects are reported in Section 3.7.
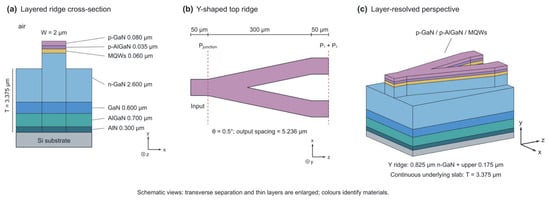
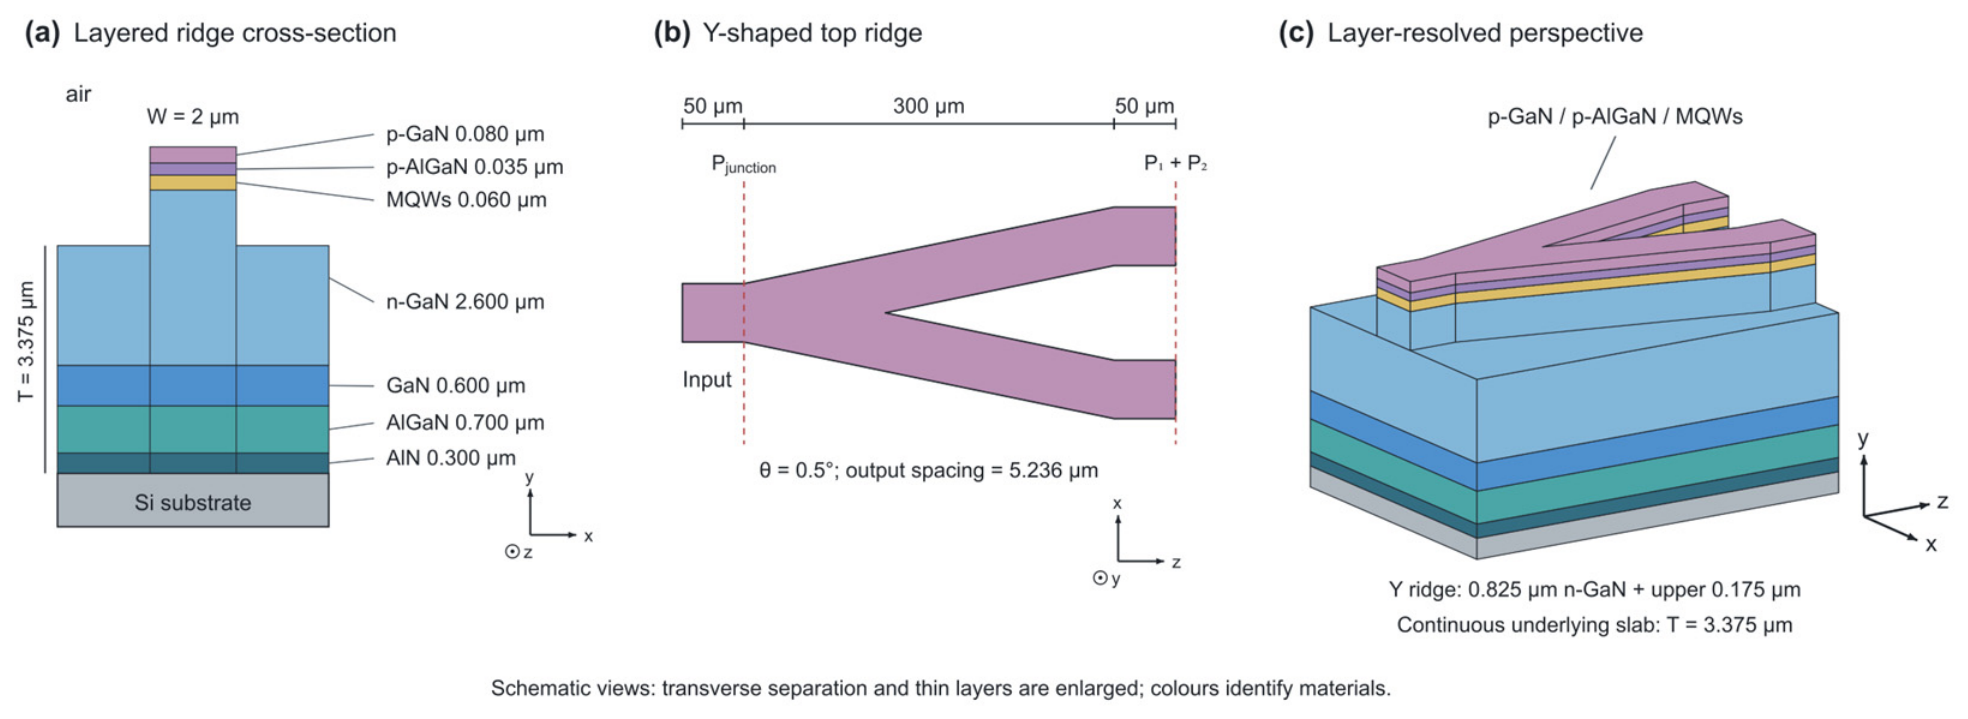
In the original cross-section, the ridge-waveguide width was W = 2 μm, its height above the slab was H = 1 μm, and the slab thickness was T = 3.375 μm. The ridge retained the complete 4.375 μm epitaxial stack. Its patterned upper micrometer comprised 0.825 μm of n-GaN and the MQW, p-AlGaN, and p-GaN layers. The x, y, and z axes denote the lateral, vertical, and propagation directions, respectively (Figure 1). Table 1 summarizes the structural and simulation parameters.
Figure 1.
Layer-resolved geometry of the GaN-on-Si Y-branch splitter: (a) input cross-section; (b) top-view and power-monitor positions; and (c) three-dimensional perspective. The 1 μm ridge relief comprises 0.825 μm of n-GaN and the 0.175 μm upper MQW/p-AlGaN/p-GaN stack above a continuous 3.375 μm nitride slab. Colors identify the same materials across the panels. Thin layers and transverse dimensions are enlarged for clarity. x, y, and z denote the lateral, vertical, and propagation directions, respectively.
Table 1.
Structural and simulation parameters of the GaN-on-Si Y-branch splitter.
2.2. Y-Branch Geometry and Device Configurations
The baseline 1 × 2 splitter comprised a straight input section, two symmetric linear branches, and two straight output sections (Figure 1b). Their longitudinal lengths were Lin = 50 μm, Lbranch = 300 μm, and Lout = 50 μm, respectively. The selected branch half-angle was θ = 0.5°, so the center of each branch was displaced by
giving an output-port center separation of 5.236 μm. The total propagation distance was 400 μm. The baseline and process-modified 1 × 2 models retained this planar layout; the taper and unequal-width variants were defined with their corresponding results.
2.3. Numerical Model and Boundary Conditions
Three-dimensional simulations were performed with the finite-difference beam propagation method in RSoft BeamPROP 2020 (Synopsys, Inc., Mountain View, CA, USA). The scalar paraxial solver factored out the rapid longitudinal phase and propagated the field envelope forward, neglecting its second longitudinal derivative [28]. Simple transparent boundary conditions were used at the transverse boundaries. The reference window spanned x = −12 to 12 μm and y = −1 to 5 μm. The reference grid was Δx = Δy = 0.020 μm with Δz = 0.200 μm; finer settings were identified with the corresponding results. XZ and central YZ slices show the field distribution.
The reference Gaussian field was proportional to exp[−(2x/W)2 − {2(y − h/2)/h}2], where h is the full input-component height. W and h were full 1/e amplitude widths, and the launch plane was z = −0.5 μm. WG_POWER monitors integrated power over pathway-centered rectangles defined by the local component width and height. Pin denotes the entire launched power. The collected powers therefore include coupling and field redistribution, as well as propagation. Comparisons of Gaussian and guided-mode excitation and of direct and cascaded splitters used a common z = 0 input plane; their explicit settings are given in the Supplementary Information.
2.4. Power Monitoring and Performance Metrics
All powers were normalized to the total input power Pin = 1 and are reported as percentages of that input. The power immediately before the first Y junction is denoted by Pjunction, and Pi is the power collected at output port i. The total transmitted output power is
where N = 2 or 4. The overall attenuation is expressed by the total loss
The attenuation from the first junction to all output ports is expressed by
Lpost describes the combined loss of the junction and the downstream branches, as measured by the power collection windows.
The fraction of the total output delivered to port i is
For a symmetric 1 × 2 splitter, the output power imbalance is evaluated by
where 0 dB represents equal division. For an unequal splitter, with P1 assigned to the higher-power output, the deviation from its target fraction Rtarget, in percentage points, is
For the equal 1 × 4 splitter, output uniformity is evaluated by the maximum deviation from the ideal 25% port fraction:
The port-fraction range, in percentage points, and the power imbalance are
and
2.5. Optimization Strategy
This study used a staged, single-parameter strategy. Planar screening established a common Y branch and tested the effect of a linear taper. Vertical confinement was then modified through topside slab removal and backside Si/slab removal. Backside optical layers were assessed on the thinned structure retaining a 0.375 μm GaN slab. The 100 nm SiO2 layer was then fixed while branch-width asymmetry and two-stage cascading were introduced for unequal-ratio 1 × 2 and equal-ratio 1 × 4 power division.
3. Results and Discussion
3.1. Baseline Y-Branch and Planar Geometry Screening
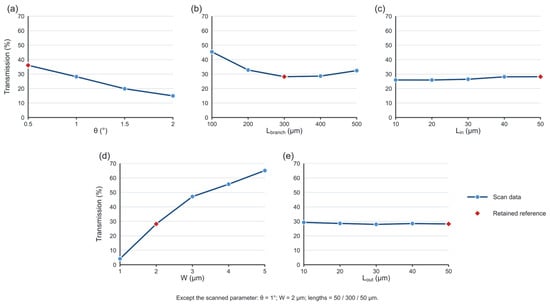
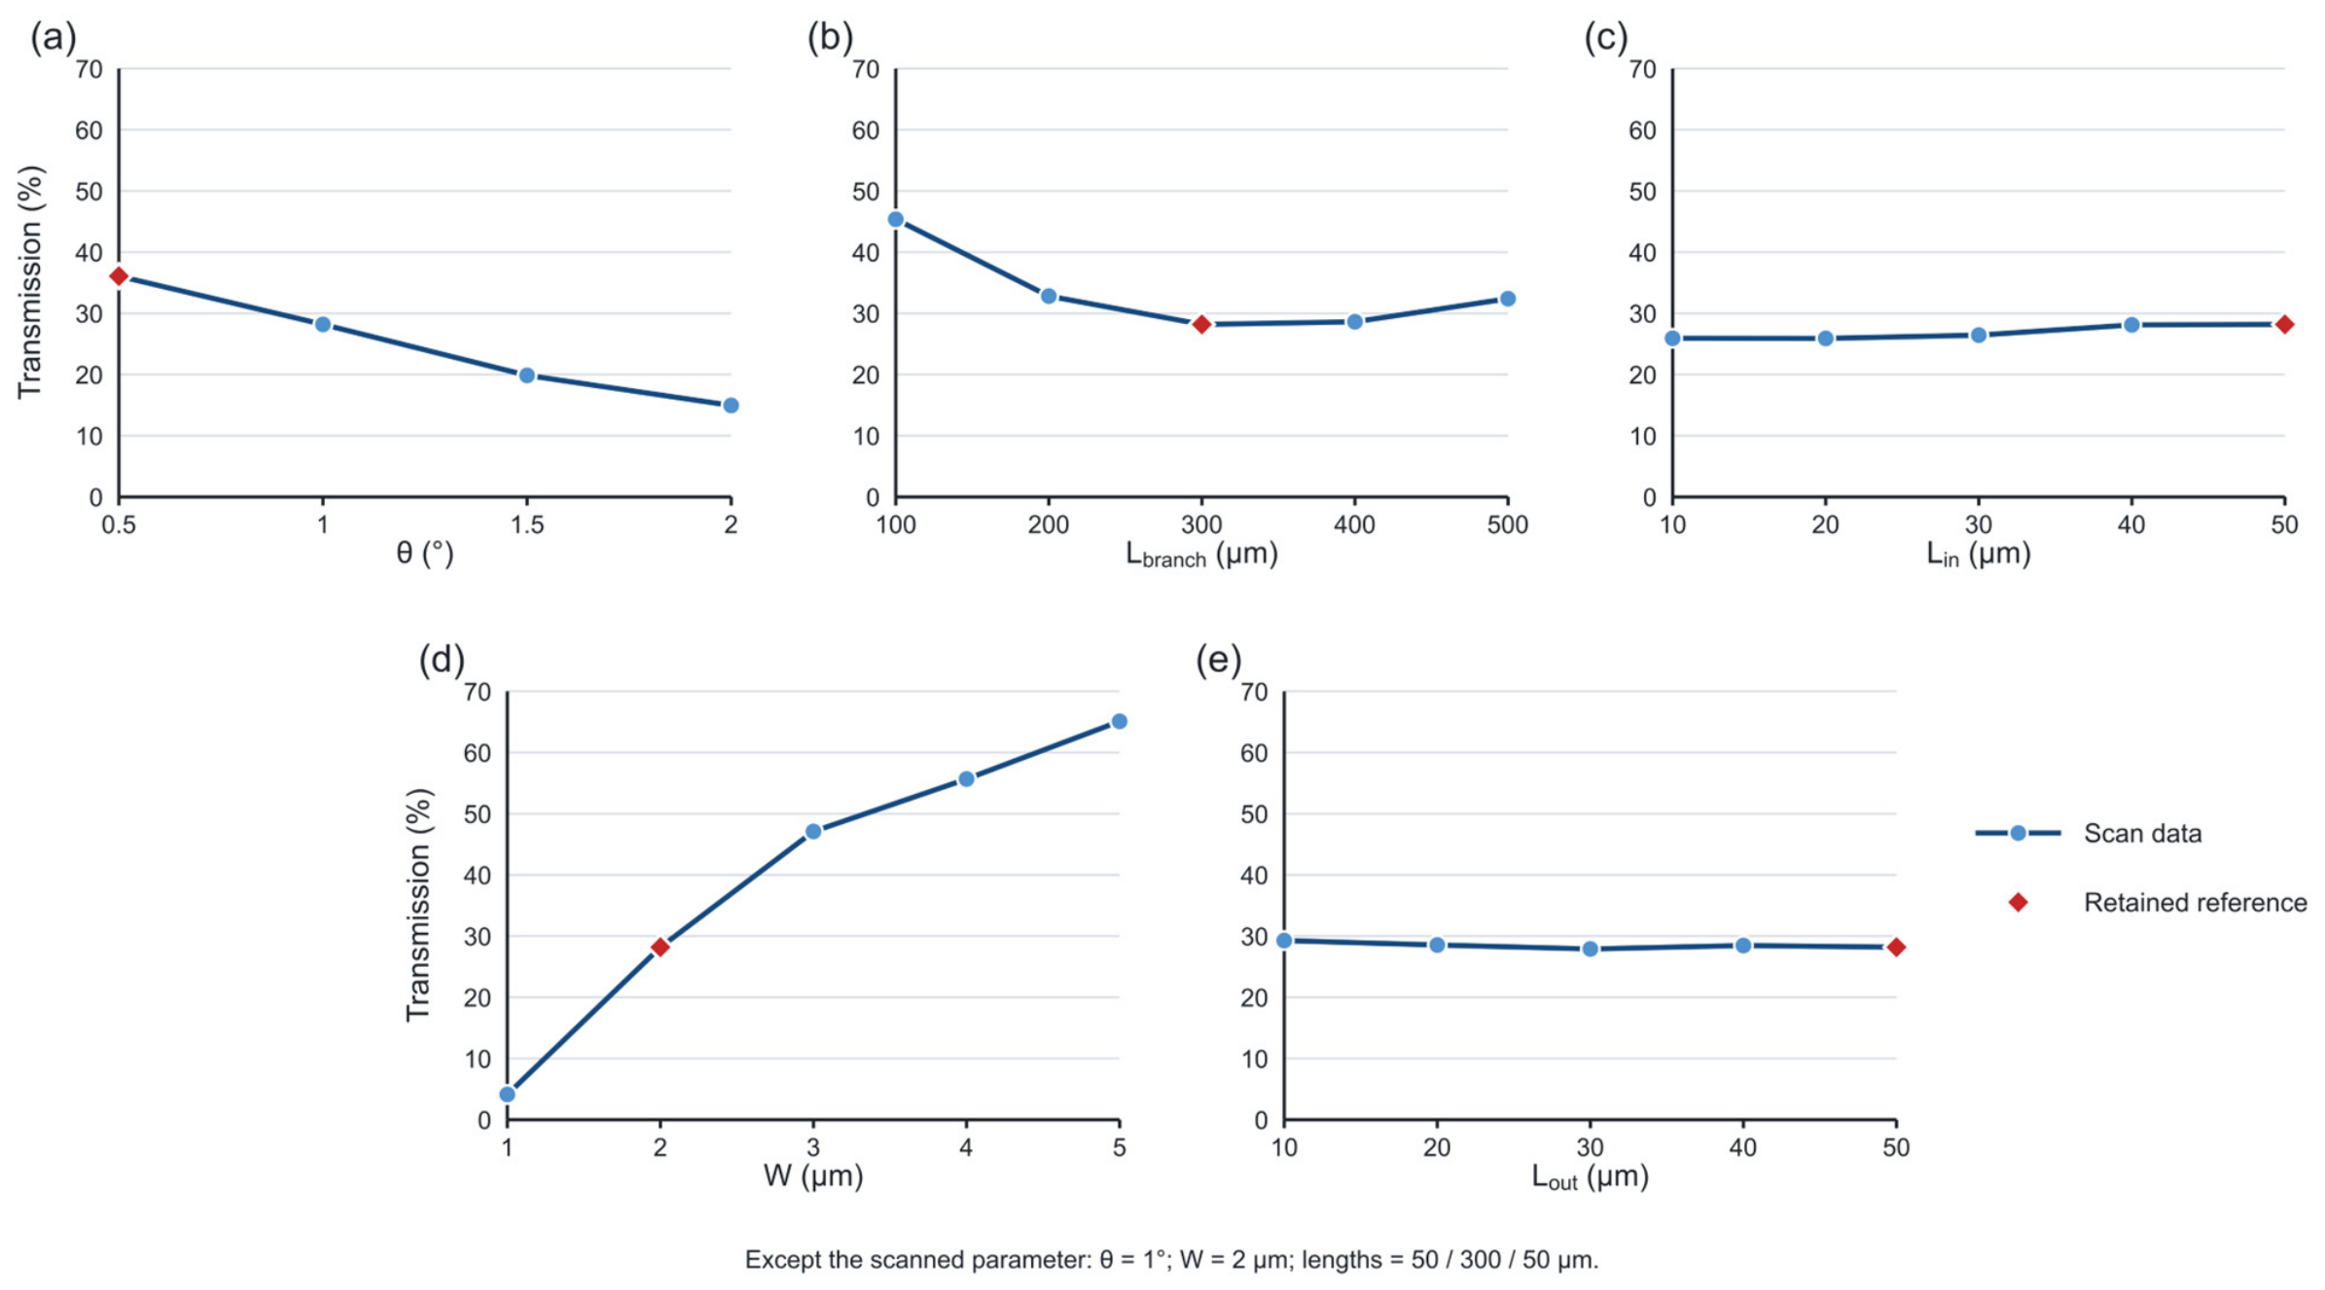
Figure 2 shows single-parameter screening scans. Red markers identify values retained for later comparisons rather than unconstrained transmission maxima. Except for the angle scan, θ = 1° was used. Reducing θ from 2° to 0.5° increased transmission from 15.0% to 36.1%. A 100 μm branch at 1° yielded 45.4%, but pairing that length with the final 0.5° angle would place the output centers only 1.745 μm apart, less than the 2 μm guide width. The retained 300 μm branches provided a 5.236 μm center separation in a 400 μm device. Increasing width also changed modal content and coupling; W = 2 μm kept the nominal platform fixed for the process comparison.
Figure 2.
Single-parameter scans of the original geometry: transmission versus (a) branch half-angle, (b) branch length, (c) input length, (d) waveguide width, and (e) output length. Red diamonds mark the reference values retained for subsequent comparisons. Except for the scanned parameter, θ = 1°, W = 2 μm, and Lin/Lbranch/Lout = 50/300/50 μm. The subsequent reference device used θ = 0.5°. Transmission is expressed as a percentage of input power.
The screening established W = 2 μm, Lin/Lbranch/Lout = 50/300/50 μm, and θ = 0.5° as the common conventional Y-branch baseline. This selection preserved the target footprint and monitoring geometry. It also provided a controlled reference for determining whether added planar complexity or vertical engineering improved transmission.
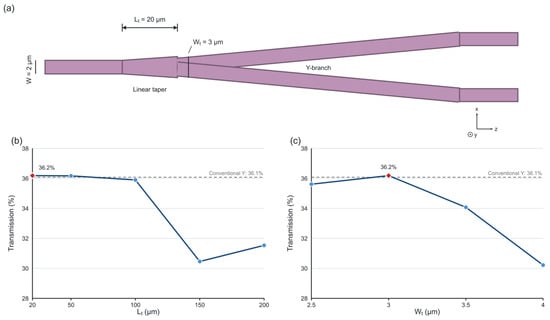
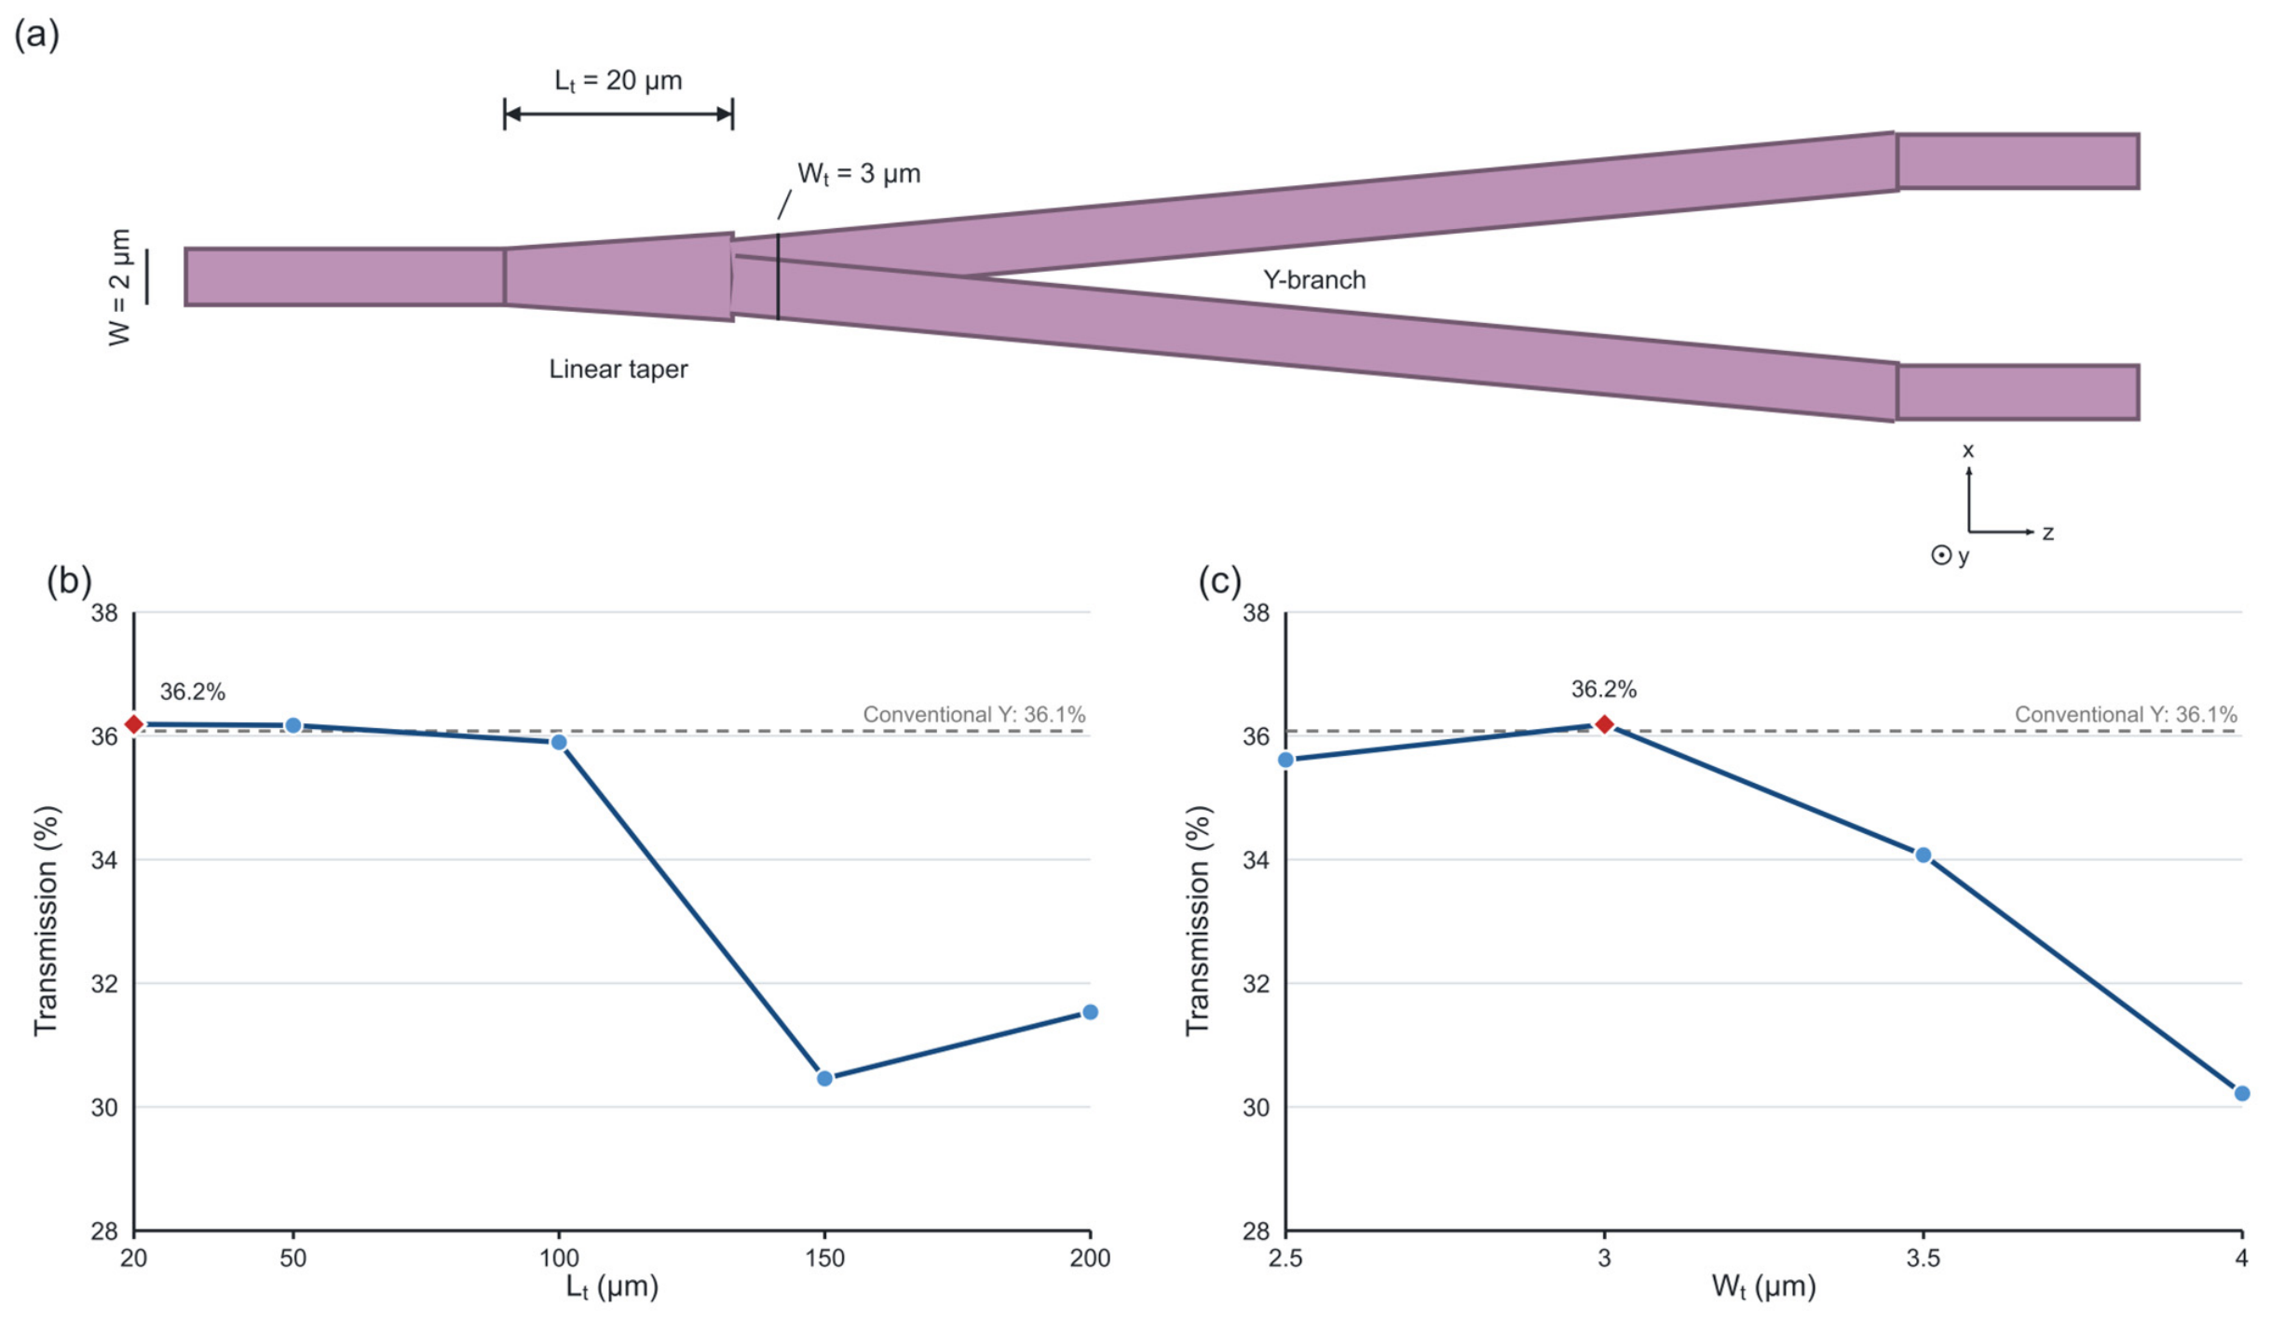
The next step examined a linear widening section before the bifurcation (Figure 3a). A taper of length Lt expanded the 2 μm input to a terminal width Wt, after which, two 2 μm arms separated. The remaining branch length was 300 − Lt μm, and the post-taper angle was recalculated to retain a 400 μm total length and a 5.236 μm output spacing. Because the bifurcation plane shifted with Lt, the taper series was compared using Pout and L at the output plane.
Figure 3.
Linear-taper comparison: (a) top-view geometry; transmission versus (b) taper length at Wt = 3 μm and (c) taper-end width at Lt = 20 μm. Dashed lines indicate the conventional Y-branch reference. The y direction is normal to the XZ plane. Blue circles mark the simulated taper configurations, and blue lines connect the calculated values. Red diamonds identify the configuration common to both scans (Lt = 20 μm, Wt = 3 μm).
At Wt = 3 μm, tapers with Lt = 20–100 μm transmitted 35.8–36.2%, close to the 36.1% untapered reference. The largest nominal improvement was 0.013 dB. Longer tapers or terminal widths above 3 μm reduced transmission in the tested range. This small difference indicates that tapering had a limited benefit for this cross-section, so the untapered reference was retained for the process comparisons.
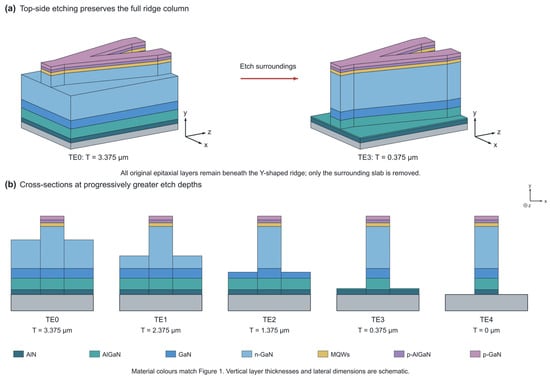
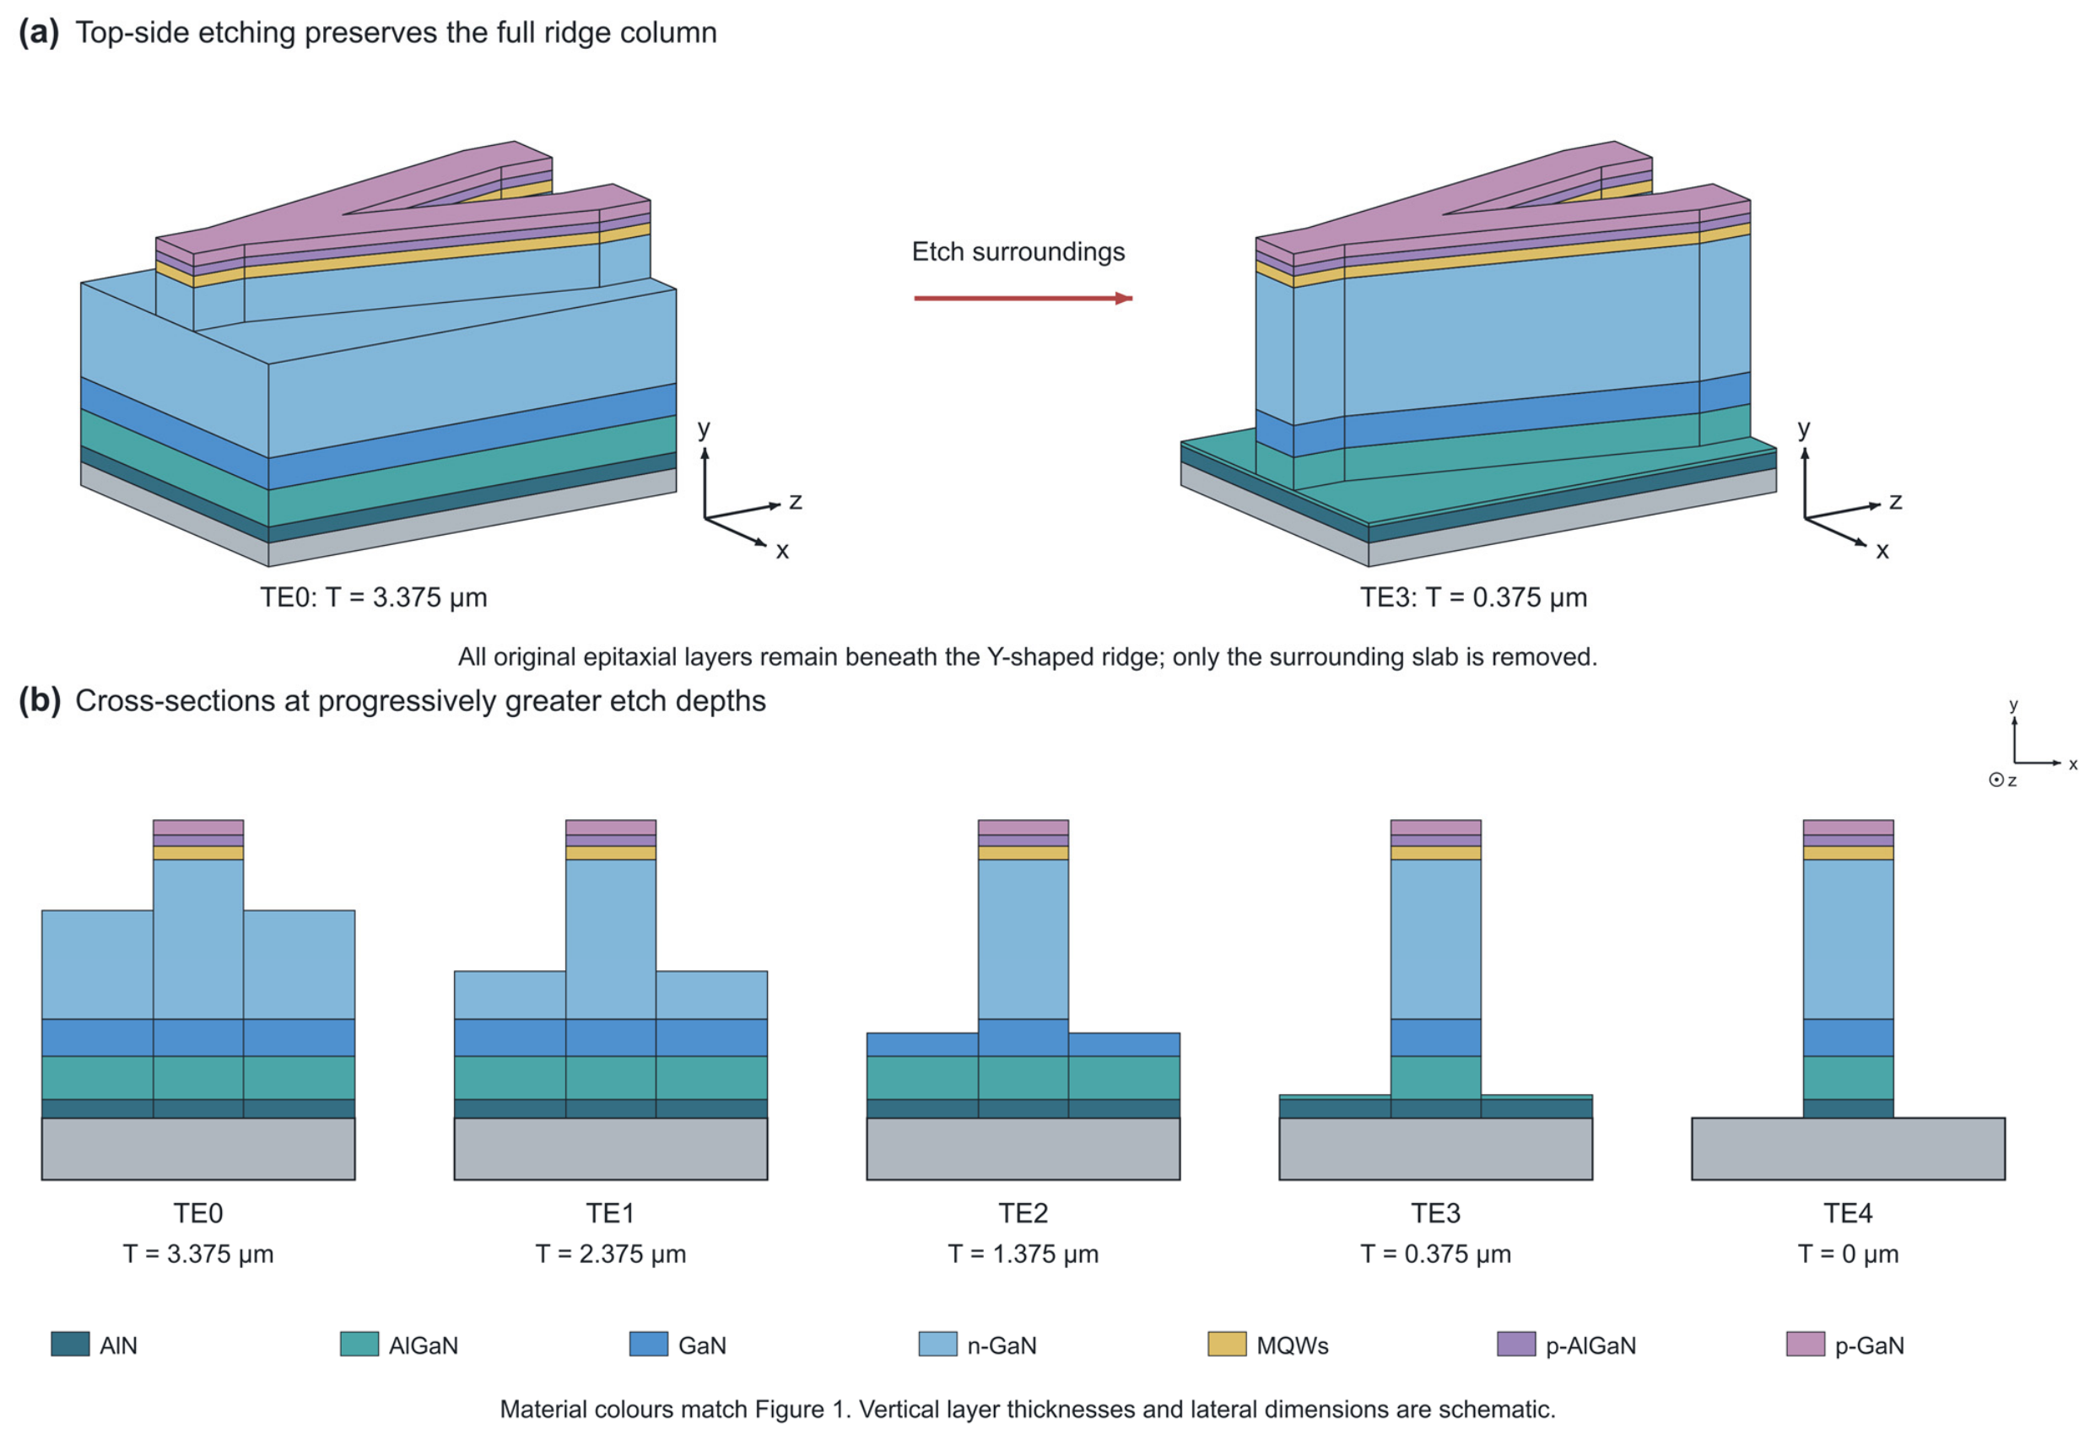
3.2. Topside Slab Etching
Topside slab etching was introduced to suppress slab leakage while preserving equal power division (Figure 4a). The full 4.375 μm epitaxial column was retained beneath the ridge, while material on both sides was removed vertically from the top. The ridge relief therefore increased as the remaining slab thickness T decreased. The five models, TE0–TE4, reduced T from 3.375 to 0 μm (Figure 4b). TE0 is the original GaN-on-Si ridge, TE3 retains a 0.375 μm slab, and TE4 represents complete slab removal.
Figure 4.
Topside etching: (a) layer-resolved three-dimensional views of TE0 and TE3; and (b) cross-sections of TE0–TE4. The full 4.375 μm epitaxial column remained under the ridge as the surrounding residual-slab thickness T decreased. In TE3, the residual slab comprised 0.300 μm AlN and 0.075 μm AlGaN. Colors match Figure 1; dimensions are schematic.
In the unetched structure, the ridge was connected to a laterally extended high-index slab. Reducing T increased lateral isolation and confined more of the field to the ridge and its branches. This interpretation is consistent with the dependence of ridge-waveguide loss on confinement, lower-cladding thickness, and substrate overlap reported for other integrated waveguide platforms [14,15,16,17,18,19,29,30,31].
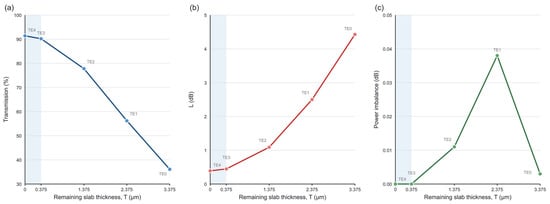
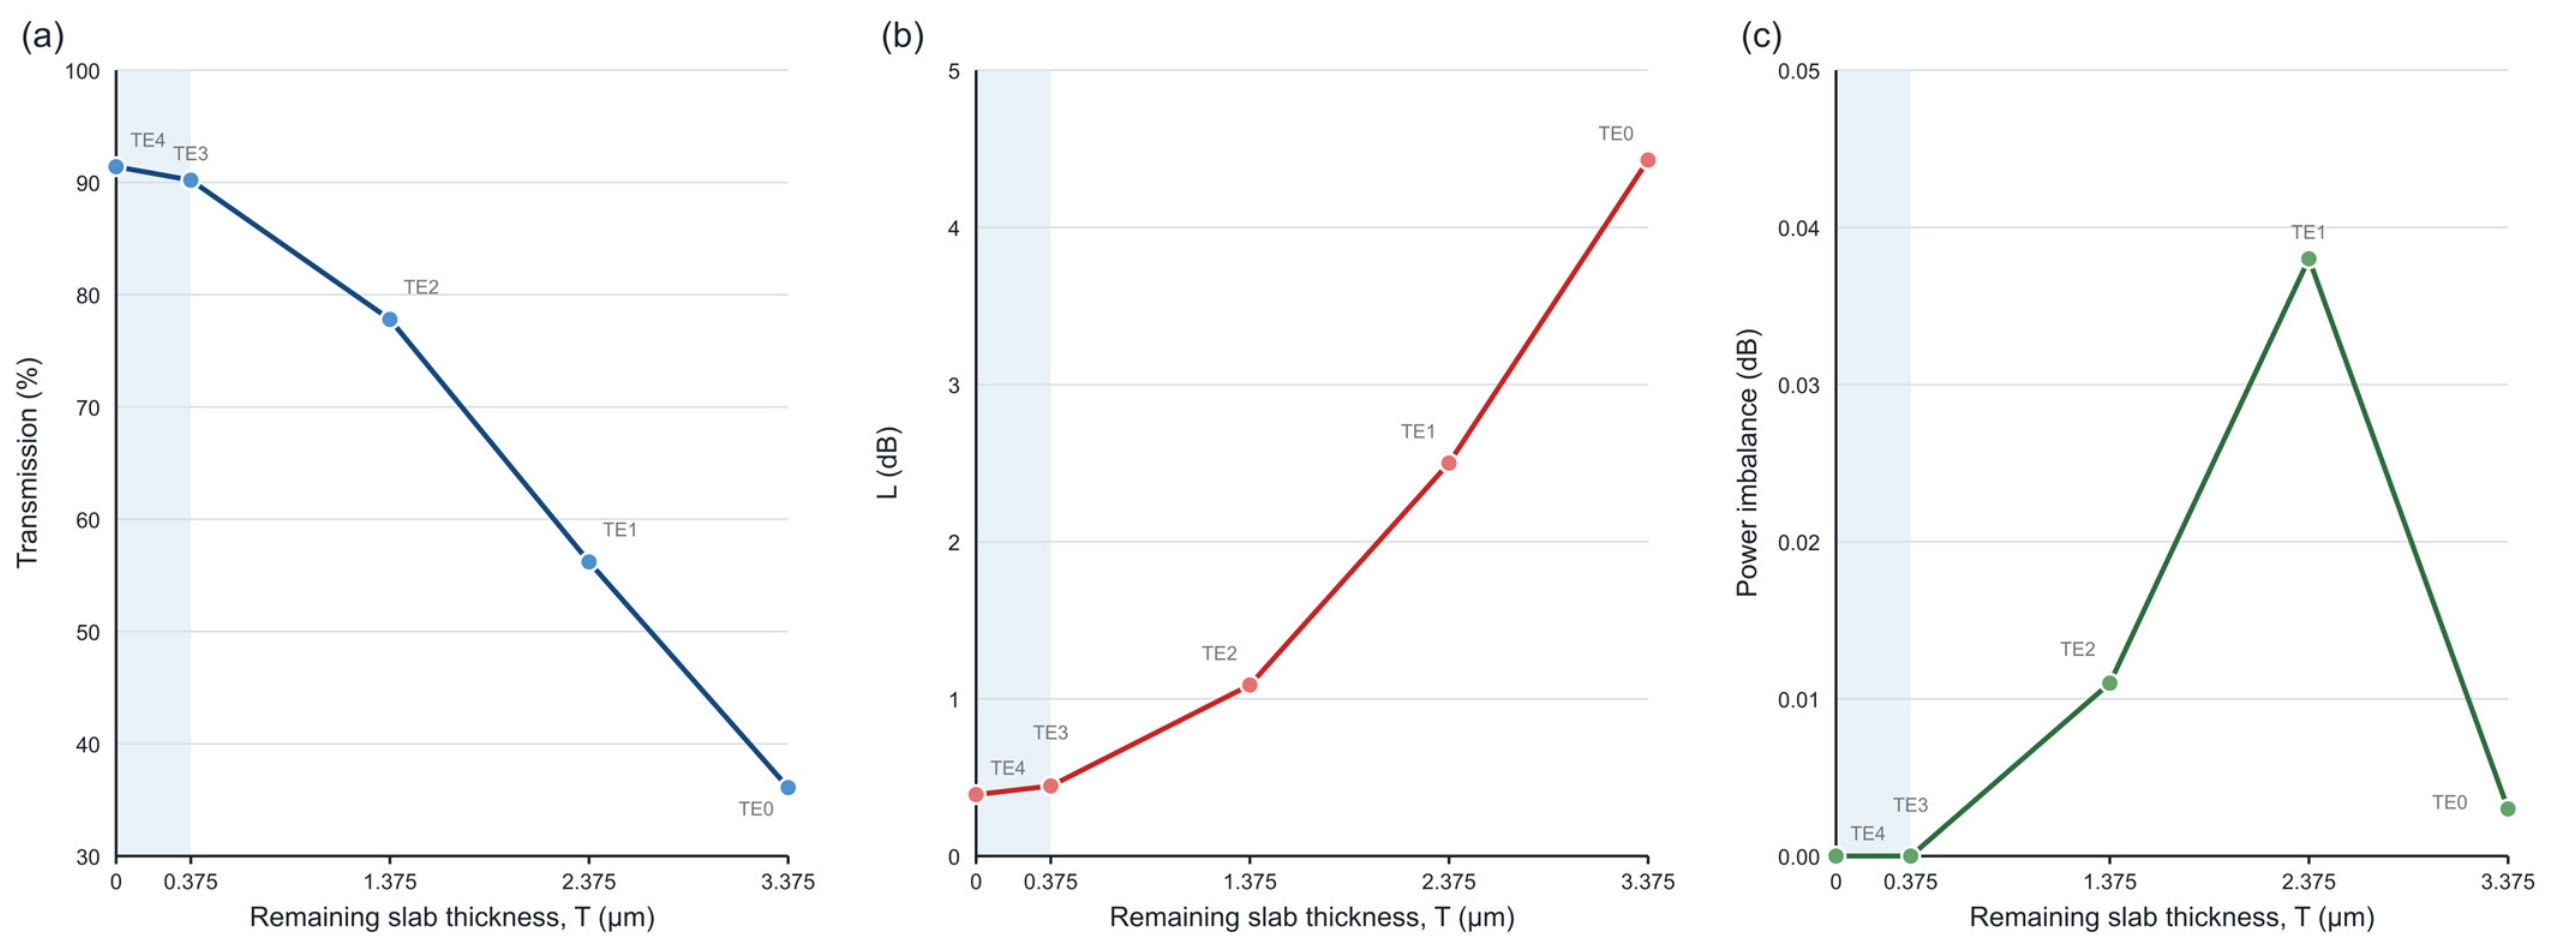
The transmission results follow the expected confinement trend (Figure 5a,b). From TE0 to TE4, total transmission increased from 36.1% to 91.4%, and L decreased from 4.428 to 0.391 dB, a reduction of 4.037 dB. The retained ridge column and Gaussian launch were unchanged in this series. The improvement was much larger than the 0.013 dB change obtained with the linear taper, demonstrating the importance of the slab/substrate cross-section in this Y-branch design.
Figure 5.
Topside etching results versus residual-slab thickness: (a) total transmission; (b) total loss L; and (c) output-port power imbalance. TE0–TE4 correspond to the cross-sections in Figure 4. Blue, red, and green circles denote transmission, total loss, and output-port power imbalance, respectively. The lines connect the simulated cases. The shaded bands span residual-slab thicknesses from 0 to 0.375 μm.
TE3 transmitted 90.2% (L = 0.446 dB); complete removal added about 1.2 percentage points. Equal division was maintained, with imbalance below 0.038 dB across the series. The small final increment motivated studying a finite residual layer together with its fabrication requirements.
3.3. Backside Si Removal and Slab Thinning
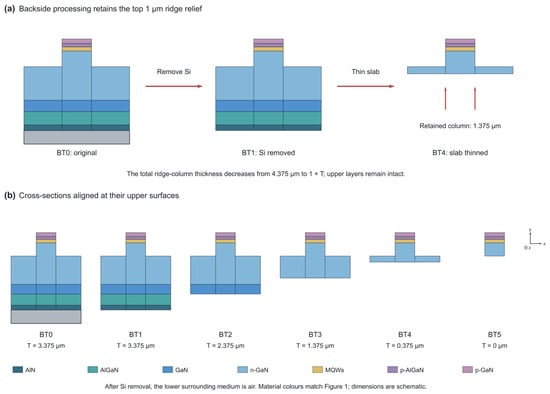
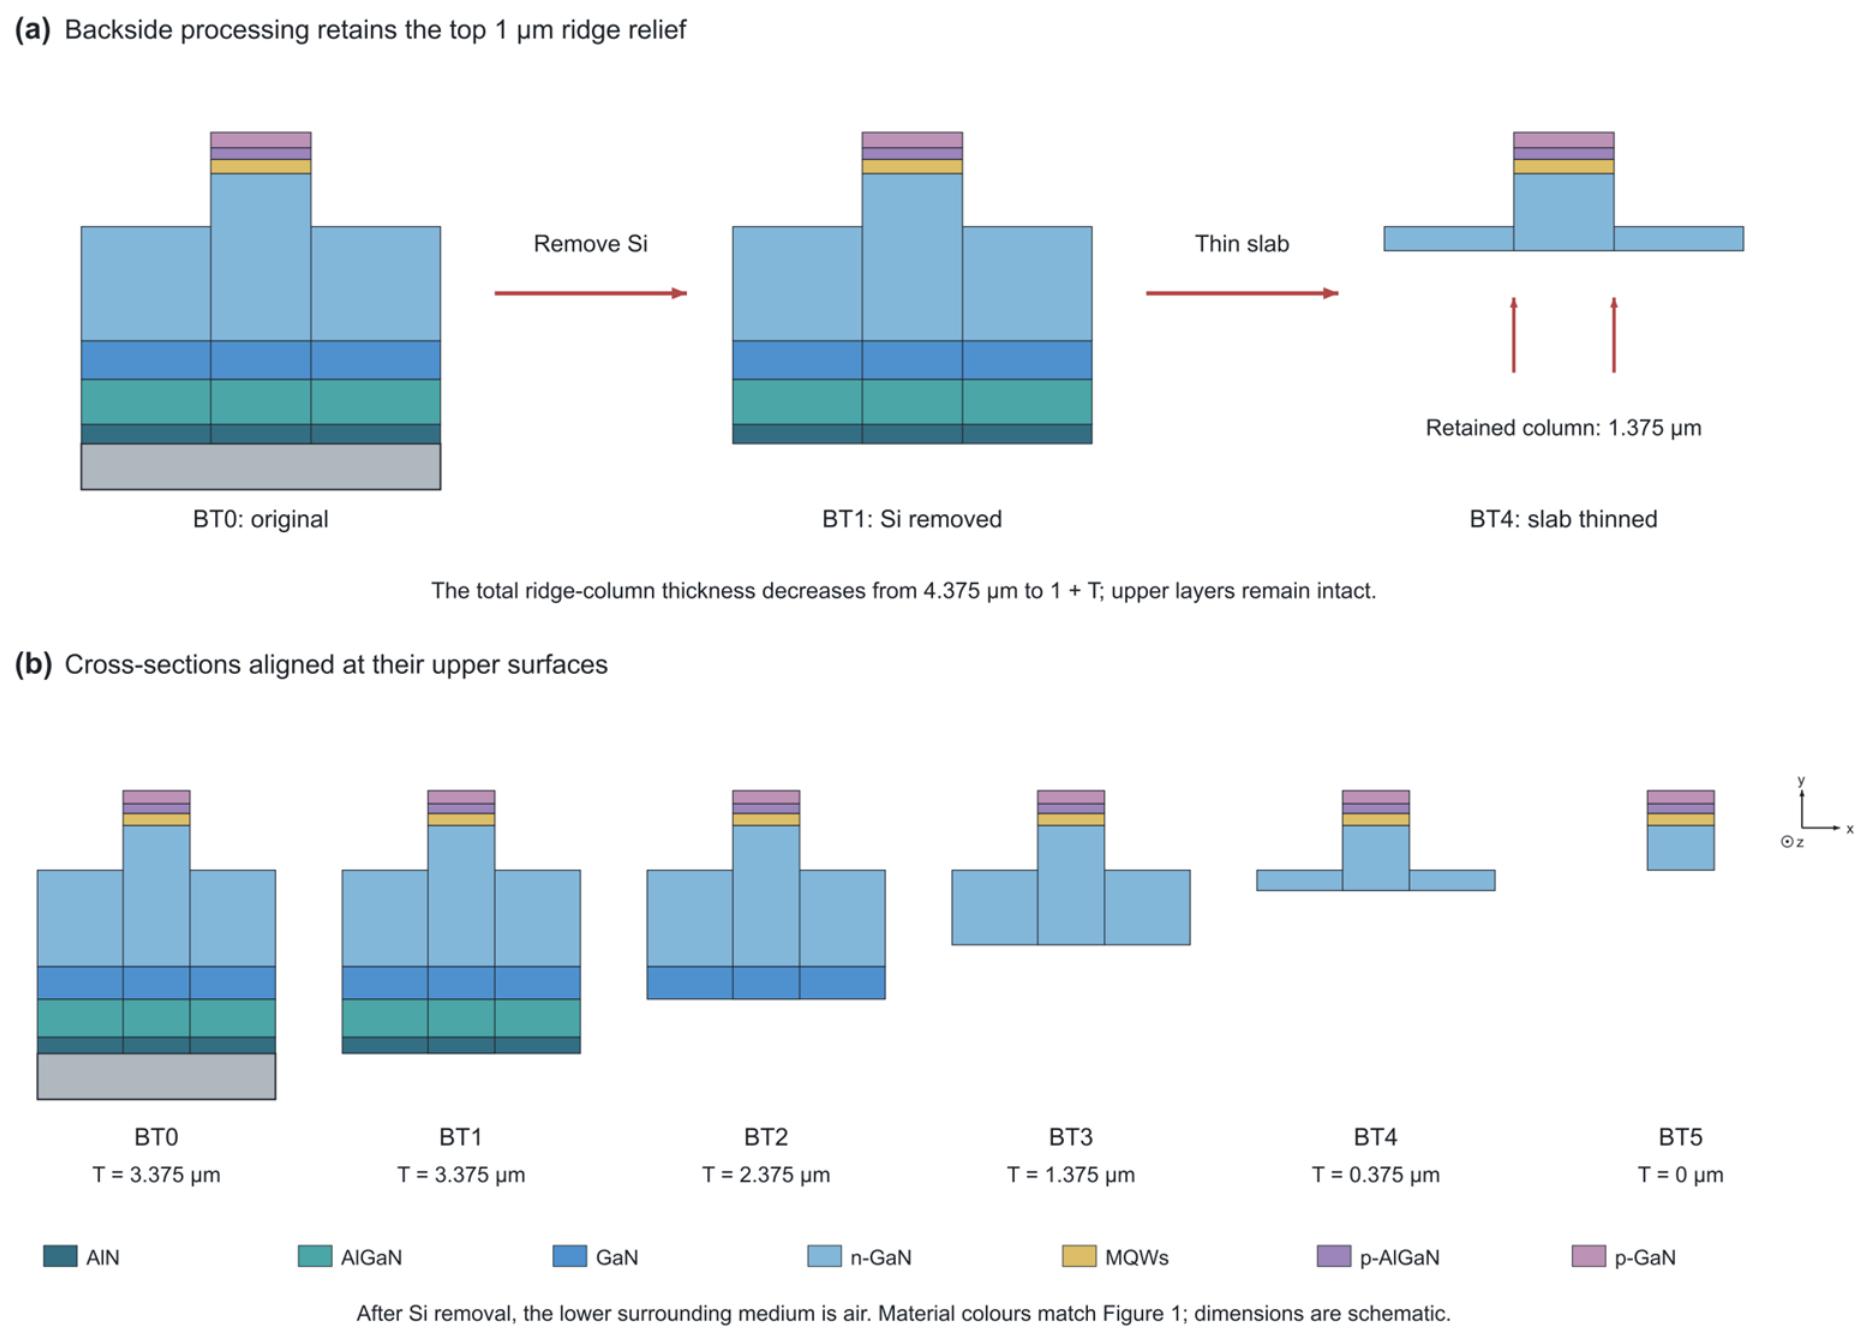
Backside processing first removed Si beneath the device and then thinned the nitride slab (Figure 6). BT1 retained T = 3.375 μm after Si removal; BT2–BT5 reduced T to 2.375, 1.375, 0.375, and 0 μm, respectively. Unlike topside etching, this procedure kept the ridge protrusion at 1 μm and reduced the total column to 1 + T μm. The two routes differed in ridge height, residual-slab composition, and substrate boundary even at the same T. For example, TE3 retained 0.300 μm AlN and 0.075 μm AlGaN outside the ridge, whereas BT4 retained a 0.375 μm n-GaN slab.
Figure 6.
Backside processing: (a) Si removal followed by nitride-slab thinning; and (b) cross-sections of BT0–BT5 aligned at the upper epitaxial surface. The ridge relief remained 1 μm, while its total retained column thickness decreased to 1 + T. BT4 retained a 0.375 μm n-GaN slab. Colors match Figure 1; dimensions are schematic.
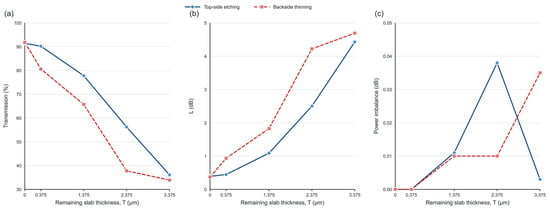
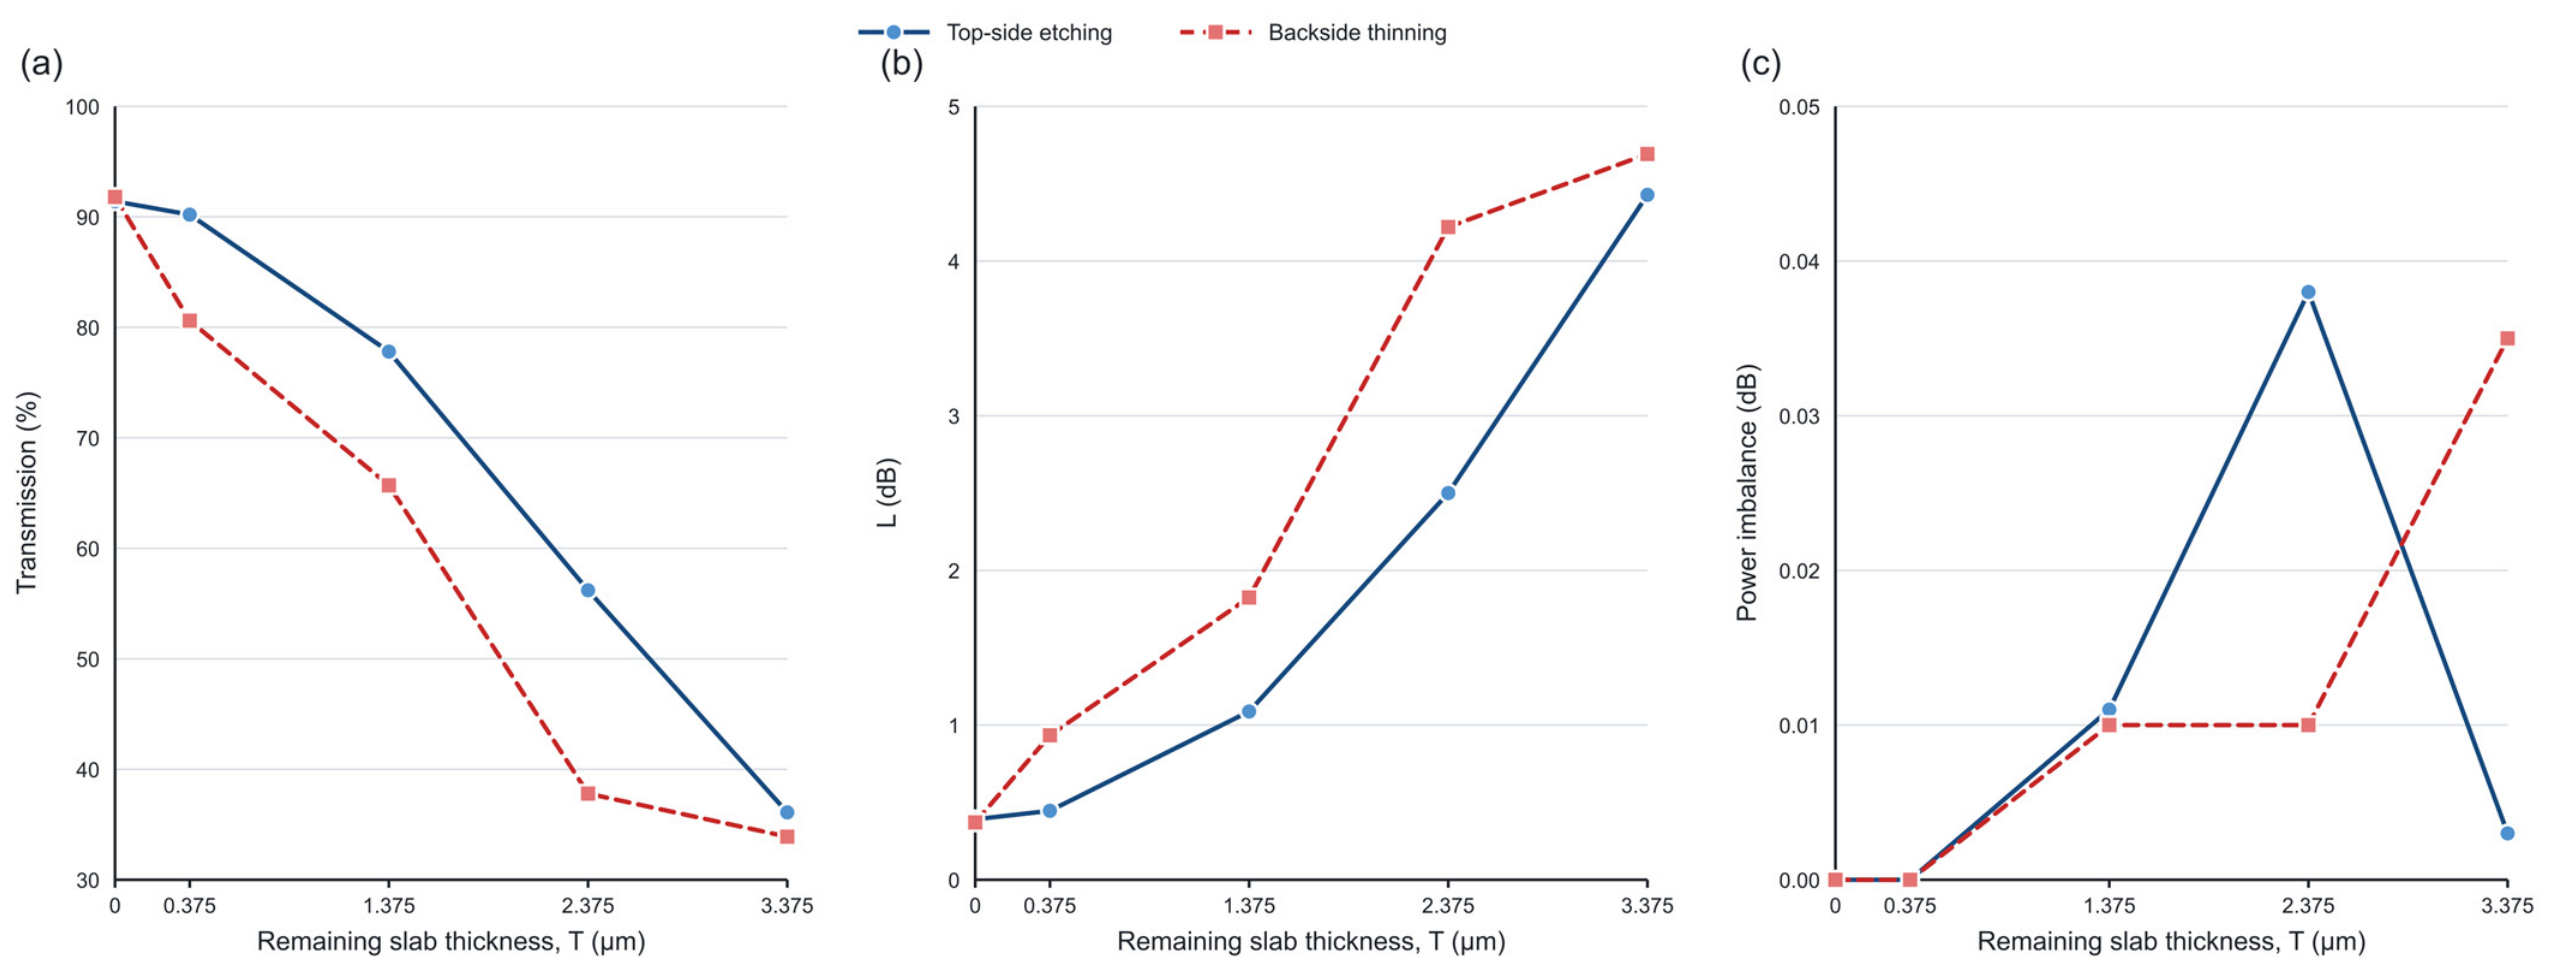
Removing the Si substrate alone changed transmission from 36.1% to 33.9% and L from 4.428 to 4.692 dB. Further slab thinning increased transmission to 91.8%, with L = 0.371 dB in BT5 (Figure 7). At T = 0.375 μm, TE3 and BT4 yielded 90.2% and 80.6% transmission, respectively. Their retained ridge heights and slab compositions differed, as shown in Figure 4 and Figure 6. Both routes preserved equal division, with maximum port imbalances of 0.038 and 0.035 dB. BT4 retained a 0.375 μm slab and was used to evaluate backside air, Ag, SiO2, and DBR layers in Section 3.4.
Figure 7.
Comparison of topside etching and backside thinning: (a) total transmission; (b) total loss L; and (c) output-port power imbalance versus residual-slab thickness T. The two routes retained different ridge-column heights and slab compositions at equal T.
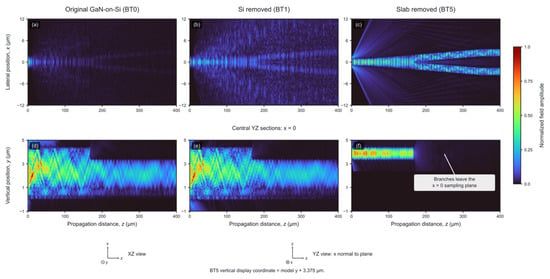
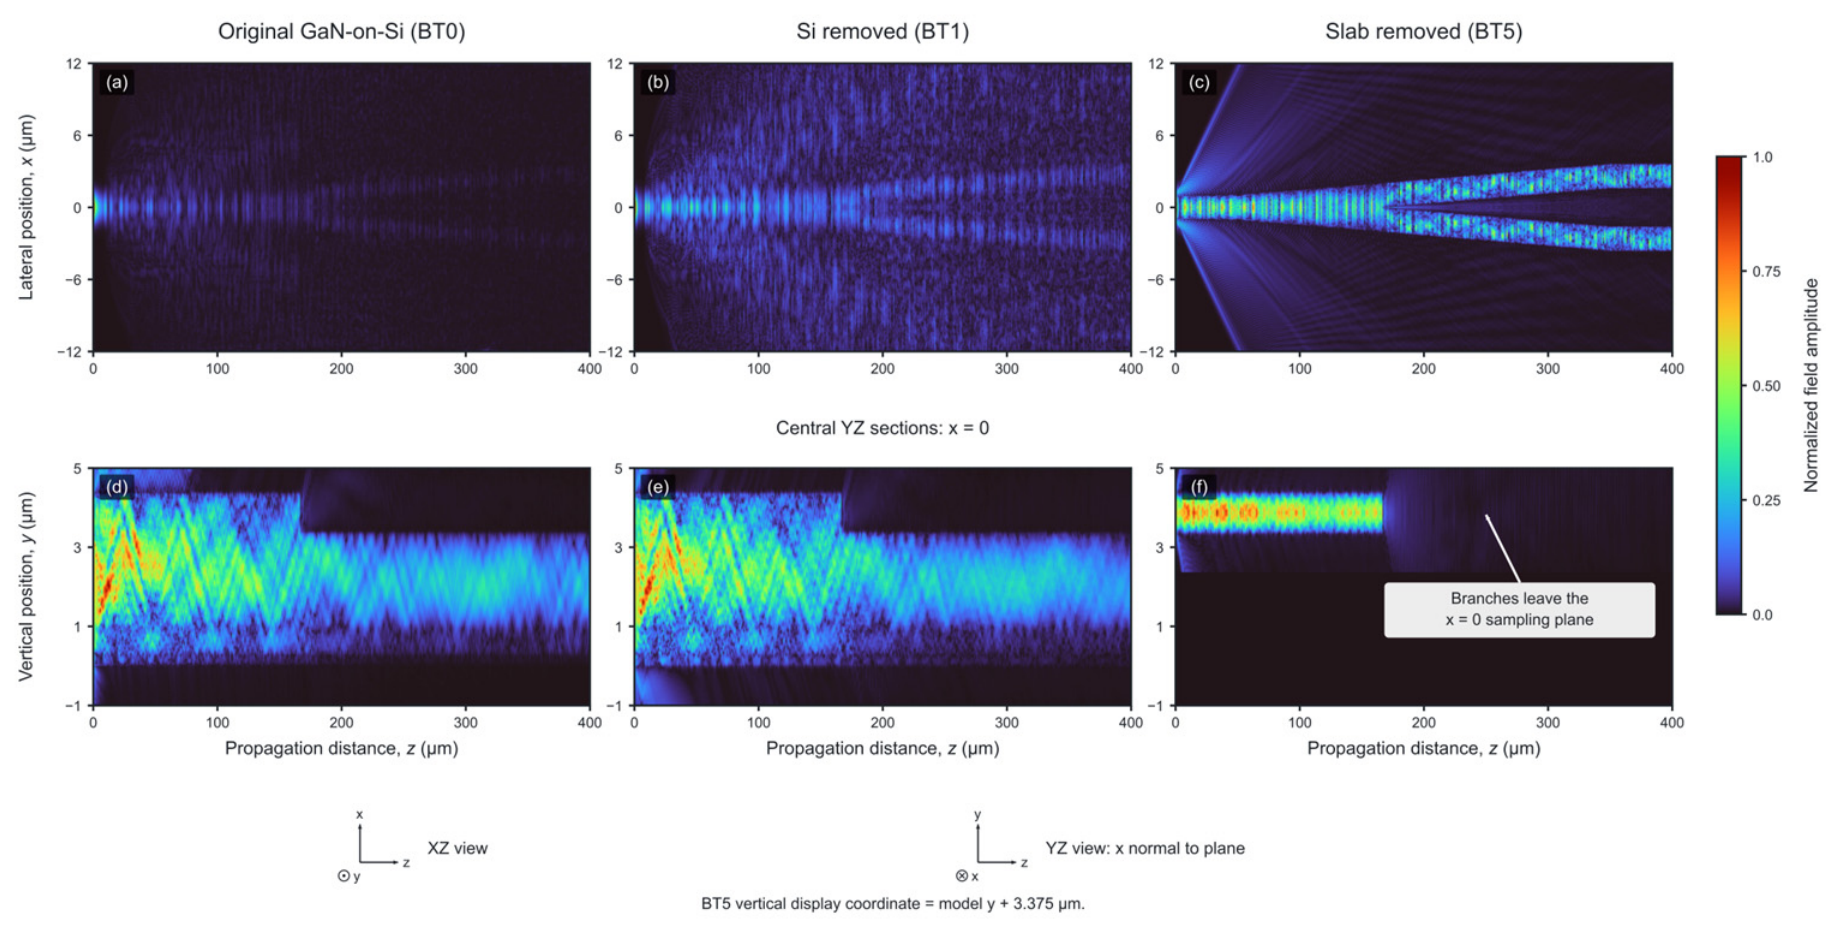
The XZ maps in Figure 8 show broad fields in BT0 and BT1 and two localized output paths in BT5. Figure 8f presents the central YZ plane at x = 0. Once the branches separated, their fields left that plane and remained visible in the XZ view in Figure 8c. The dark downstream region therefore reflects the sampling geometry rather than disappearance of the branch power.
Figure 8.
Normalized field-amplitude distributions for BT0, BT1, and BT5: (a–c) XZ slices; and (d–f) central YZ slices at x = 0. A common amplitude maximum was used within each row. For alignment with BT0 and BT1, the BT5 vertical display coordinate is the model y coordinate plus 3.375 μm. The longitudinal display origin is the launch plane. In (f), the arms leave the x = 0 sampling plane; their continued propagation is visible in (c).
3.4. Backside Optical Engineering
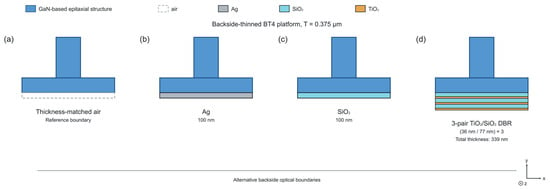
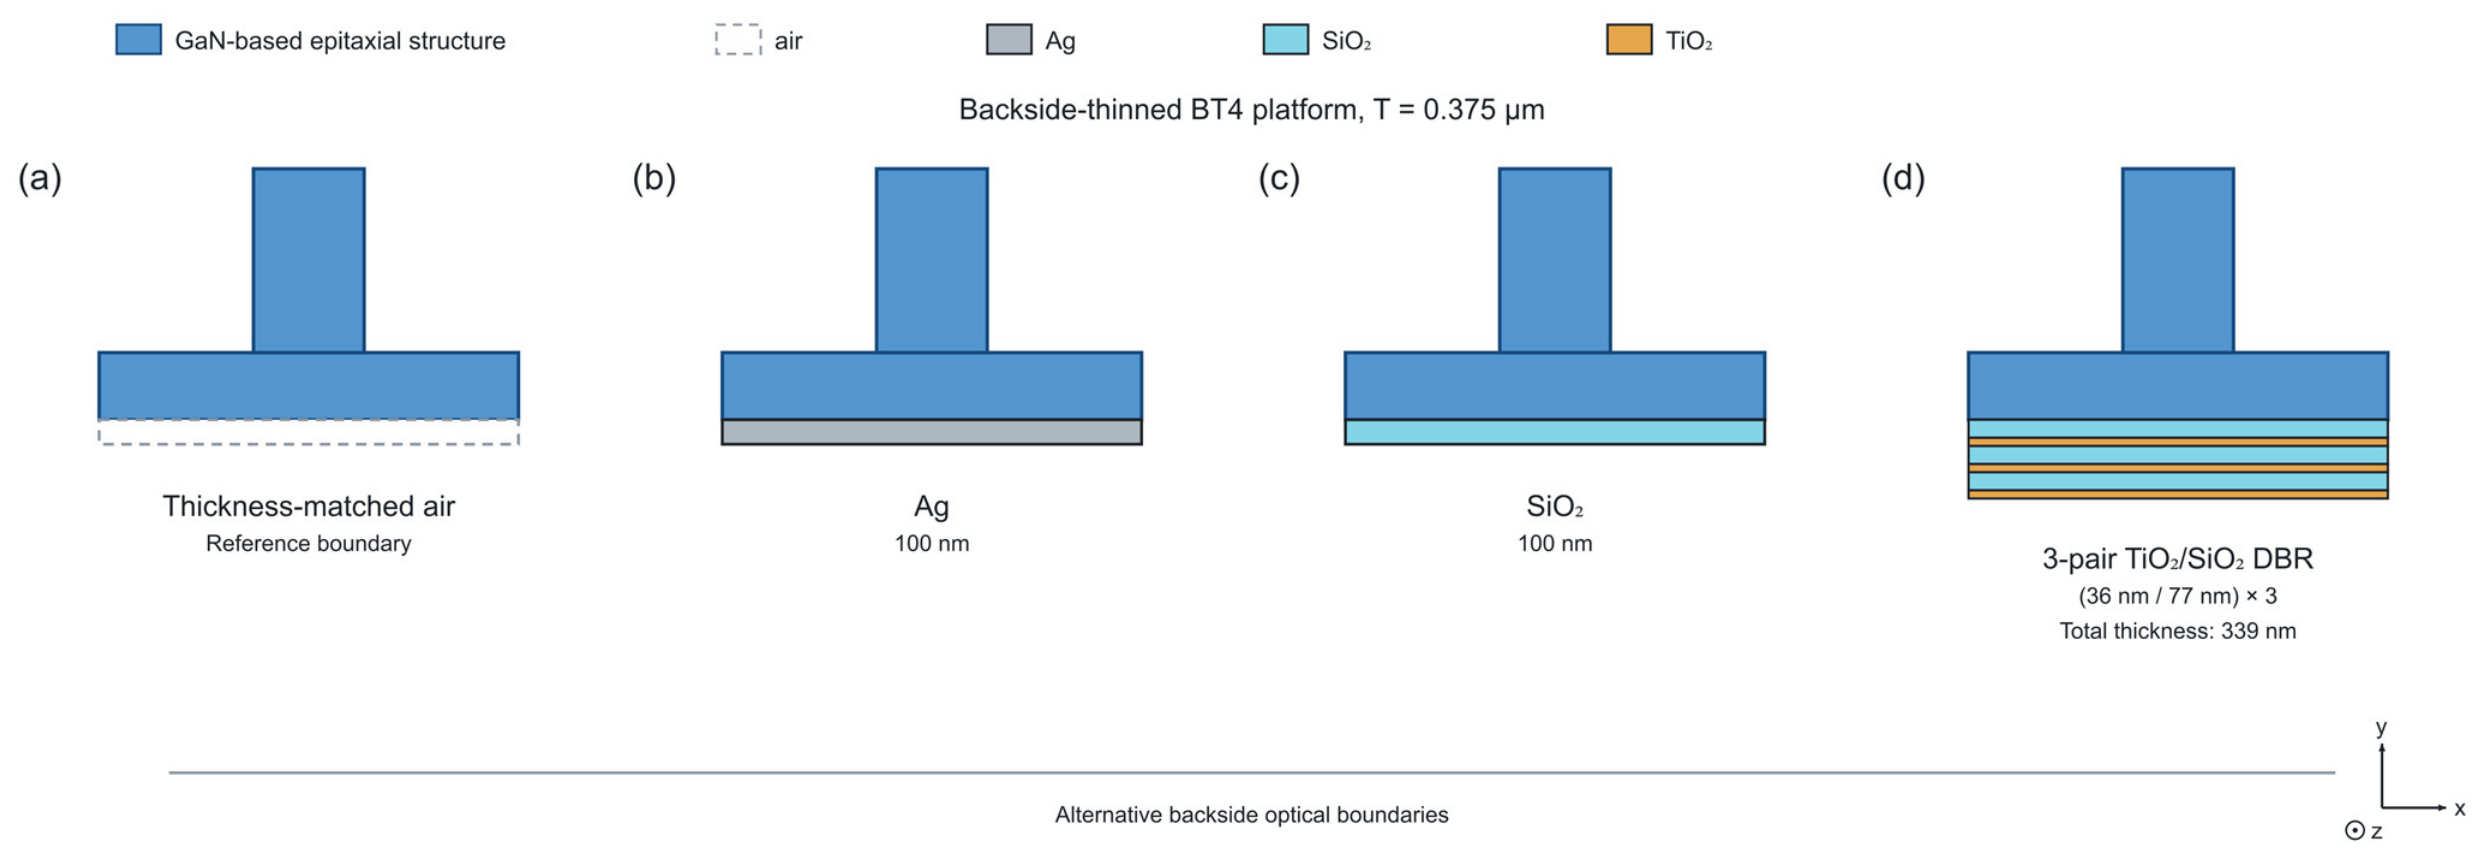
Ag, SiO2, and a TiO2/SiO2 DBR were added to BT4 to modify its backside optical boundary (Figure 9). Each was compared with a thickness-matched air layer on the same numerical grid. The three-pair DBR contained alternating 36 nm TiO2 and 77 nm SiO2 layers, with a total thickness of 339 nm. Ag provided reflection and absorption, SiO2 provided a low-index boundary, and the DBR introduced wavelength-dependent reflection.
Figure 9.
Backside optical boundary configurations on BT4: (a) thickness-matched air reference; (b) 100 nm Ag; (c) 100 nm SiO2; and (d) a three-pair TiO2/SiO2 DBR with alternating 36/77 nm layers. Added-layer thicknesses are enlarged for clarity. The z direction is normal to the XY cross-section.
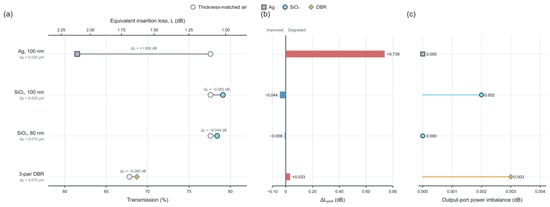
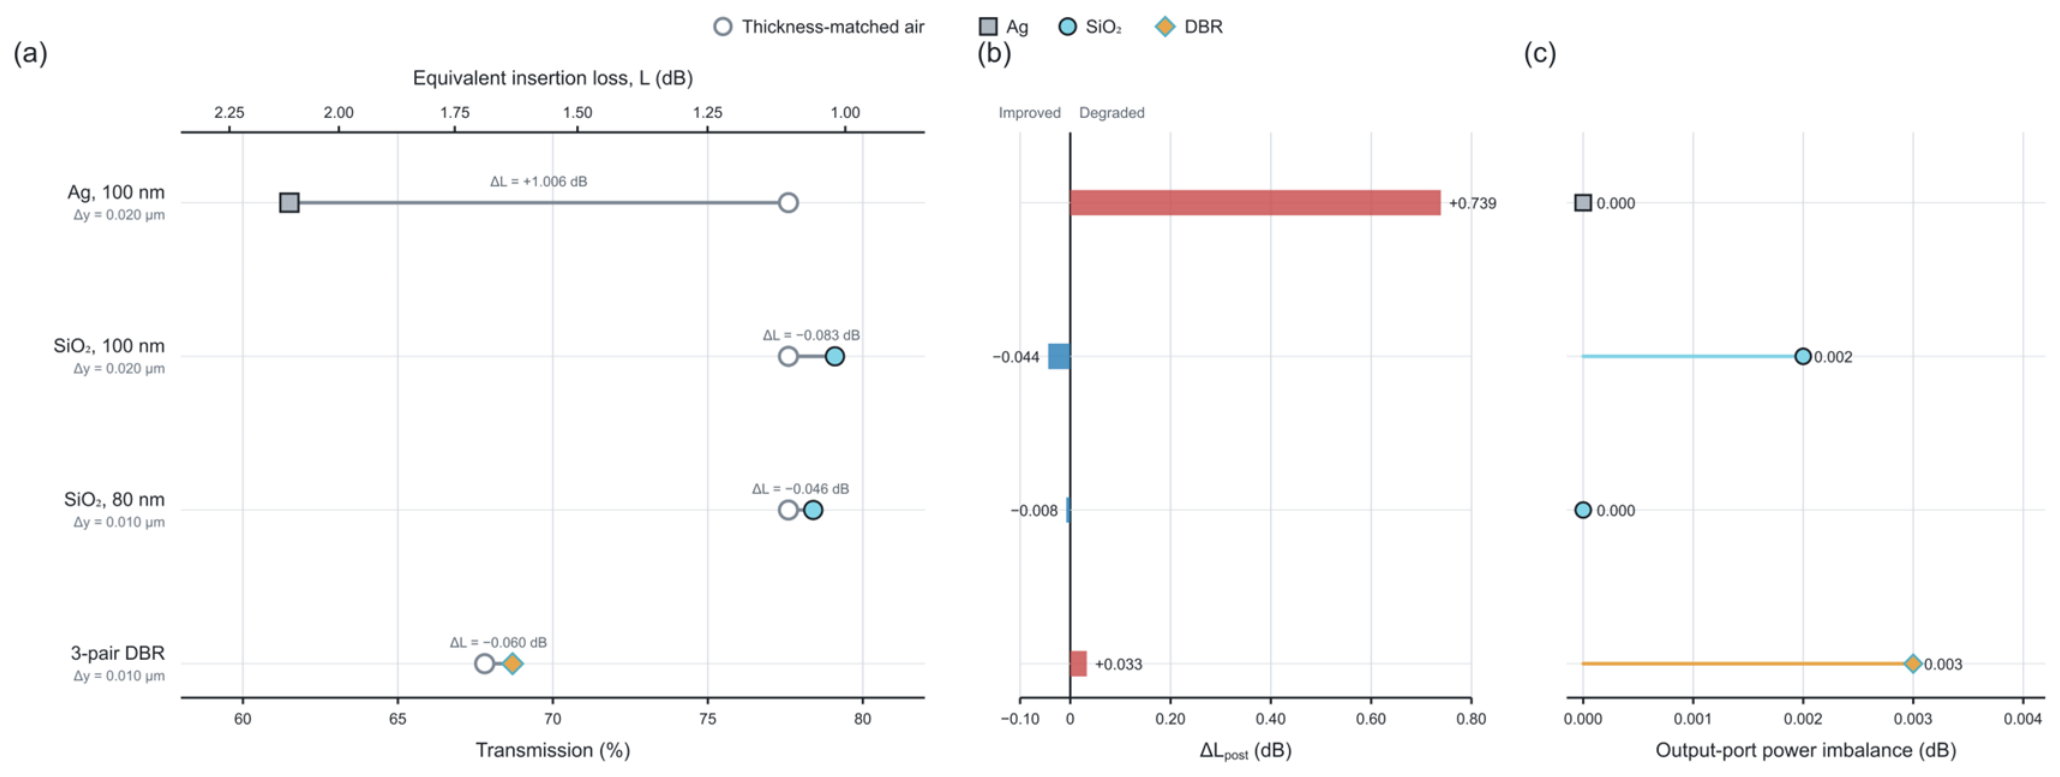
Figure 10 compares transmission, the change in post-junction loss, and output balance. In the reference calculations, 100 nm Ag reduced transmission from 77.6% to 61.5% and increased L from 1.102 to 2.108 dB relative to the thickness-matched air reference. This differs from the Ag-assisted improvement reported for a 90° GaN bend [24], showing that the benefit of a backside reflector depends on the device geometry and field distribution. The 100 nm SiO2 layer yielded 79.1% transmission and a nominal 0.083 dB reduction in L at the reference grid. The three-pair DBR yielded a 0.060 dB reduction. All tested backside configurations retained near-equal division, with a maximum imbalance of 0.003 dB.
Figure 10.
Backside-material comparison: (a) total transmission and equivalent loss L; (b) change in post-junction loss Lpost relative to the air reference; and (c) output-port power imbalance. The vertical grid spacing is shown for each case. Lpost includes the junction and downstream branch propagation. Open circles denote the thickness-matched air references. Gray squares, cyan circles, and orange diamonds denote Ag, SiO2, and the DBR, respectively. In (b), red bars indicate increased post-junction loss and blue bars indicate reduced post-junction loss relative to air.
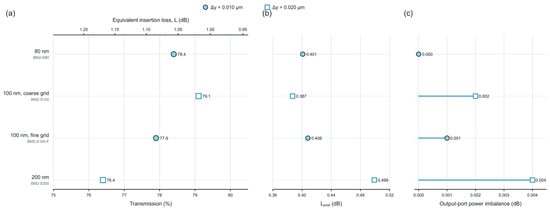
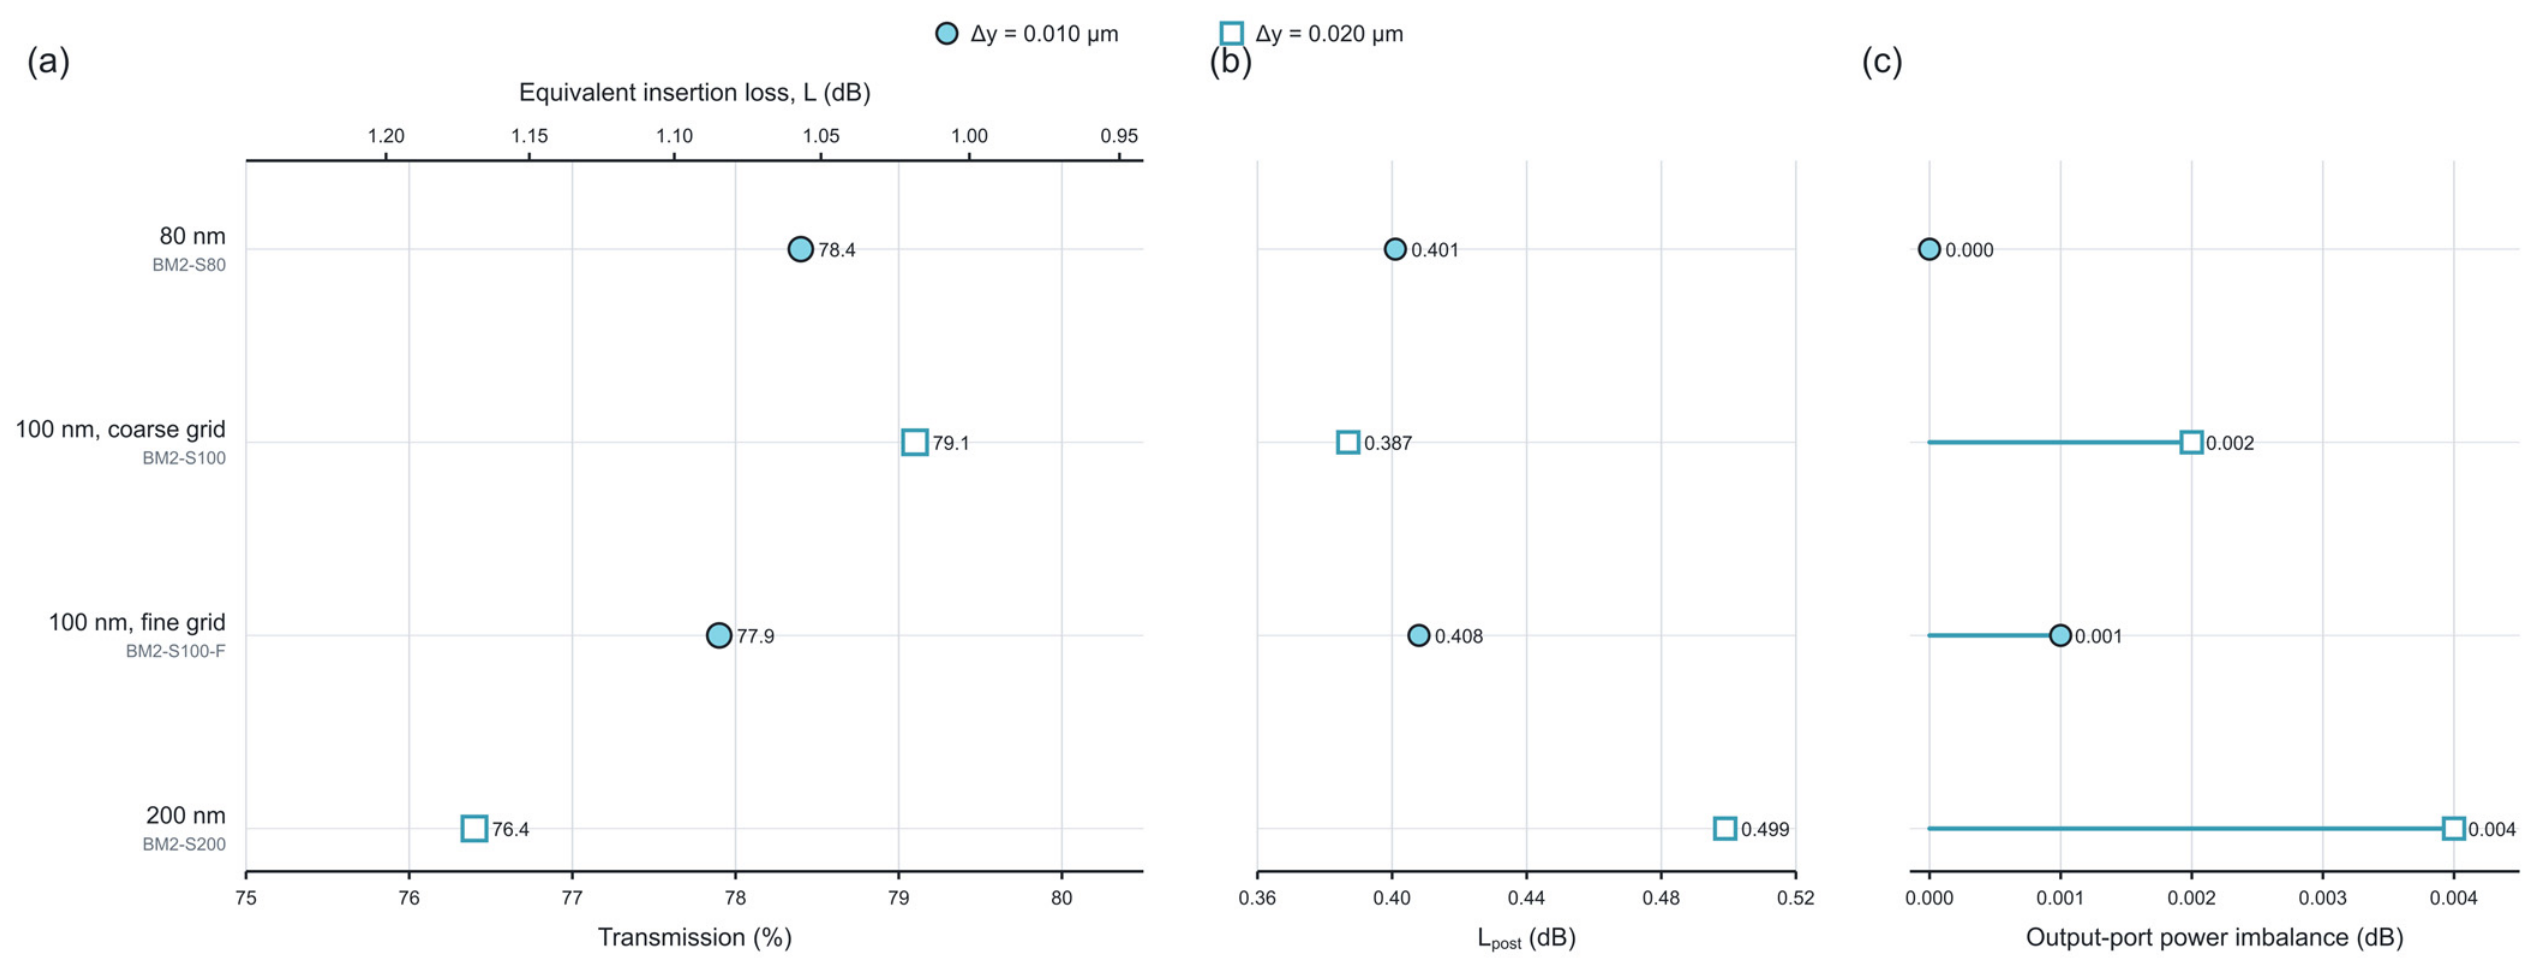
At the finer vertical grid, the 80 and 100 nm SiO2 layers yielded 78.4% and 77.9% transmission, respectively; the 200 nm layer yielded 76.4% at Δy = 0.020 μm (Figure 11). The reference comparisons therefore identify thin SiO2 as a useful candidate backside configuration. The 100 nm layer was retained as the common platform for the unequal-ratio and cascaded devices. Because the nominal improvement was small, its sensitivity to paired grid and propagation-step refinement is examined separately in Section 3.7 and Supplementary Figure S1.
Figure 11.
SiO2-thickness and vertical-grid comparison: (a) total transmission and equivalent loss L; (b) post-junction loss Lpost; and (c) output-port power imbalance. Filled circles and open squares denote Δy = 0.010 and 0.020 μm, respectively.
3.5. Controllable Unequal-Ratio 1 × 2 Y-Branch Splitters
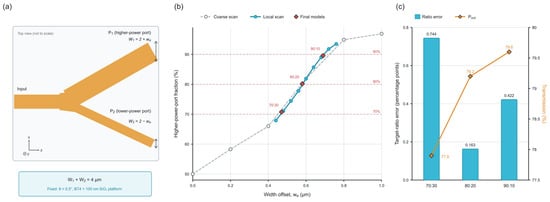
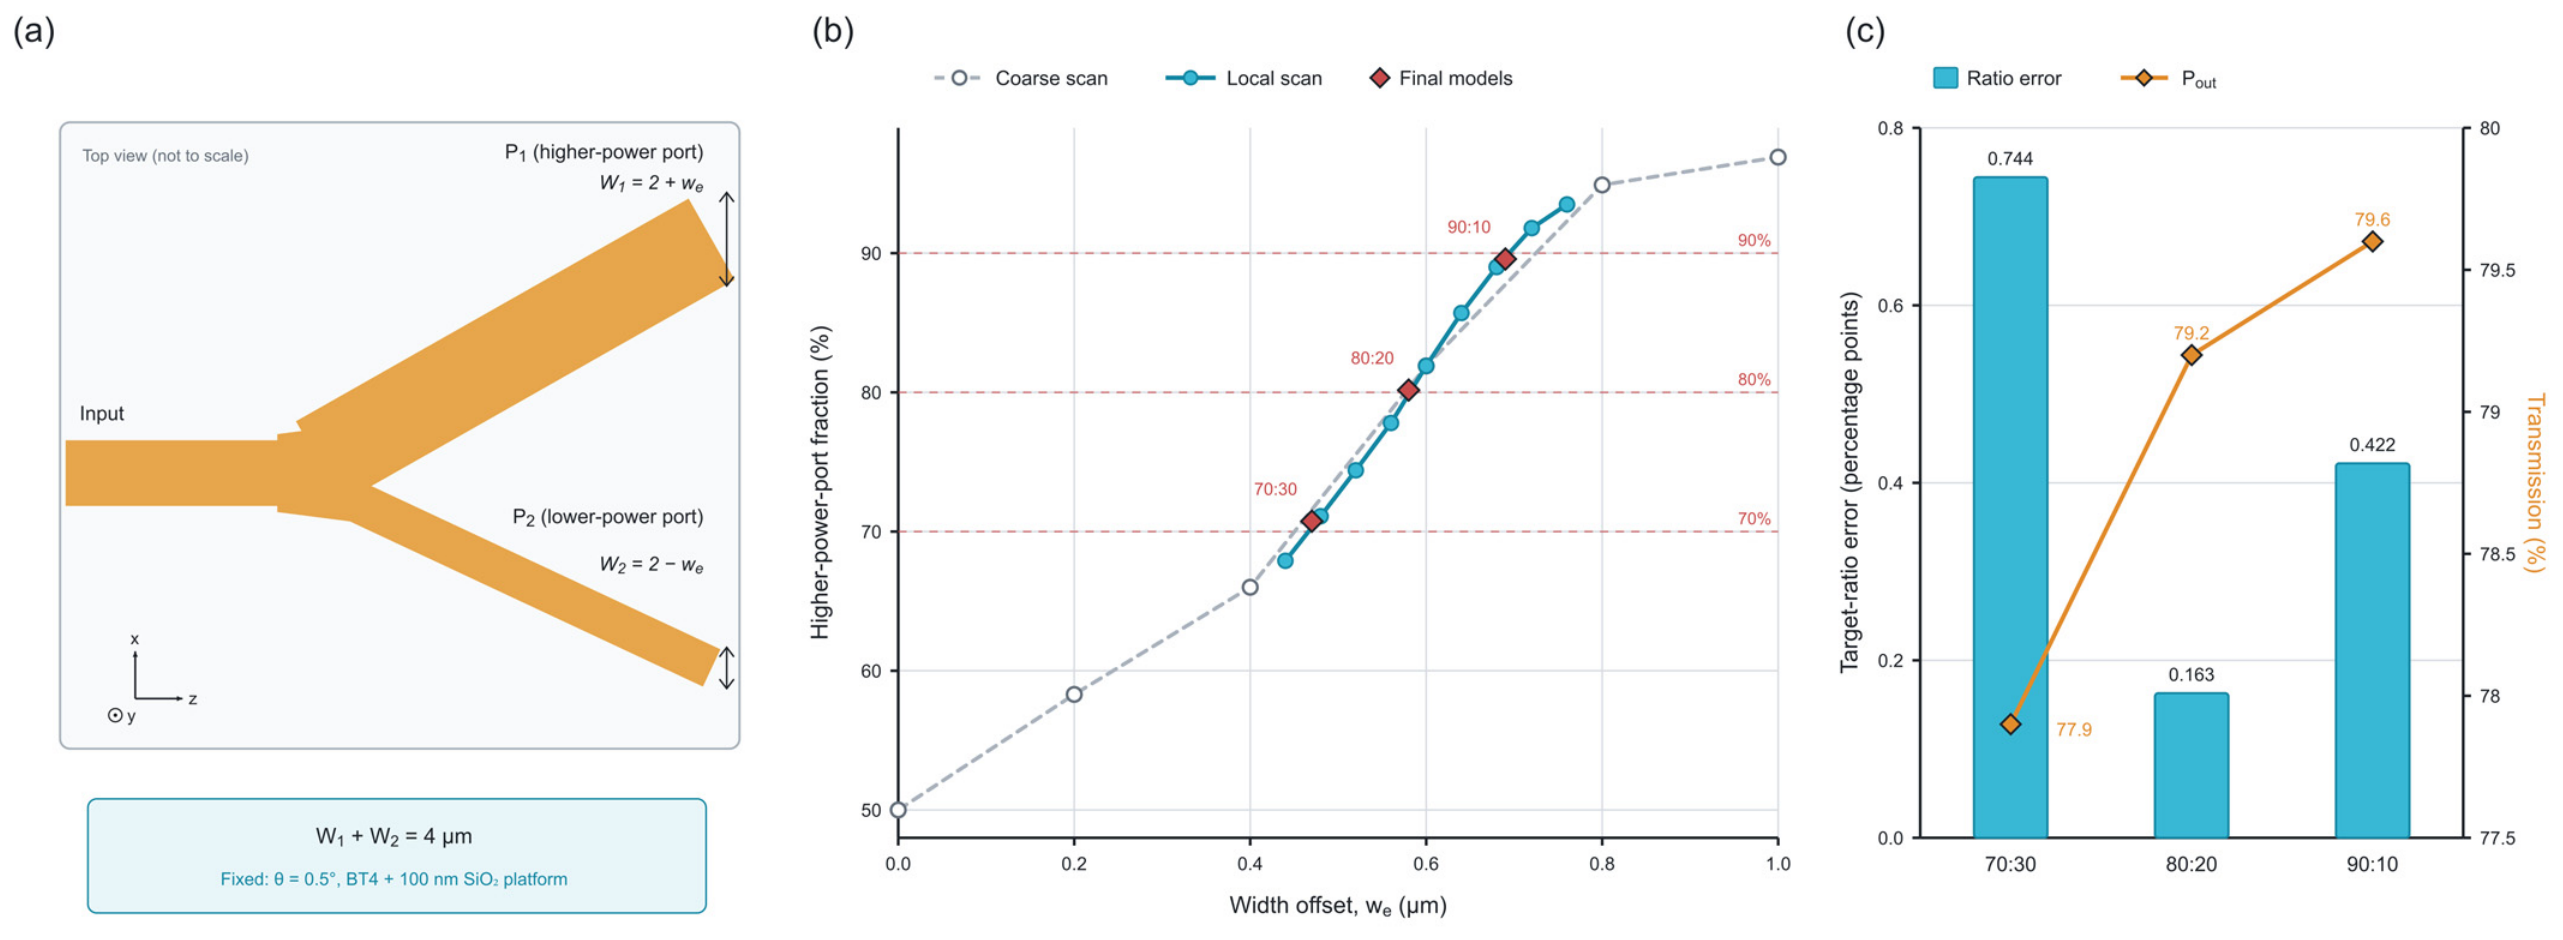
The BT4 + 100 nm SiO2 splitter was used to obtain unequal power division. Only the two branch widths were changed; the branch angle, lengths, footprint, vertical stack, source, and numerical settings remain fixed. As shown in Figure 12a, the branch widths were varied according to
where W1 + W2 = 4 μm is maintained in every design. The inclined and output sections of each arm use the corresponding width, while the input waveguide remains 2 μm wide. The offset we controls the branch-width contrast and hence the output ratio.
Figure 12.
Unequal-ratio 1 × 2 splitters on BT4 with a 100 nm SiO2 backside layer: (a) complementary branch widths W1 = 2 + we and W2 = 2 − we, in μm; (b) higher-power-port fraction versus width offset; and (c) target-ratio error and total transmission for the selected 70:30, 80:20, and 90:10 designs. Port fractions are normalized to total output power; transmission is normalized to input power.
Figure 12b shows the two-stage parameter search. The coarse scan from we = 0 to 1 μm located the 70:30 and 80:20 regions between 0.4 and 0.6 μm and the 90:10 region between 0.6 and 0.8 μm. A local scan from 0.440 to 0.760 μm in 0.040 μm steps resolved the tuning curve. The final values were selected by interpolation and were verified as separate models with a 0.010 μm vertical grid.
The corresponding branch-width pairs were 2.470/1.530, 2.580/1.420, and 2.690/1.310 μm. The achieved output ratios were 70.744:29.256, 80.163:19.837, and 89.578:10.422, with total transmissions of 77.9–79.6% (Figure 12c). Their target errors were 0.744, 0.163, and 0.422 percentage points. Thus, one geometric parameter provided three prescribed ratios within one percentage point under the reference launch. Modal excitation is examined separately in Section 3.7.
3.6. Cascaded and Direct 1 × 4 Splitters
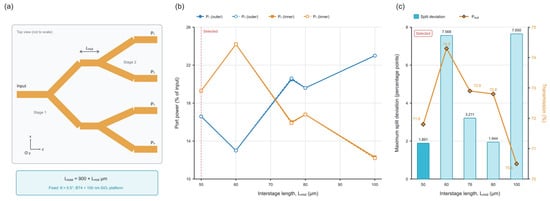
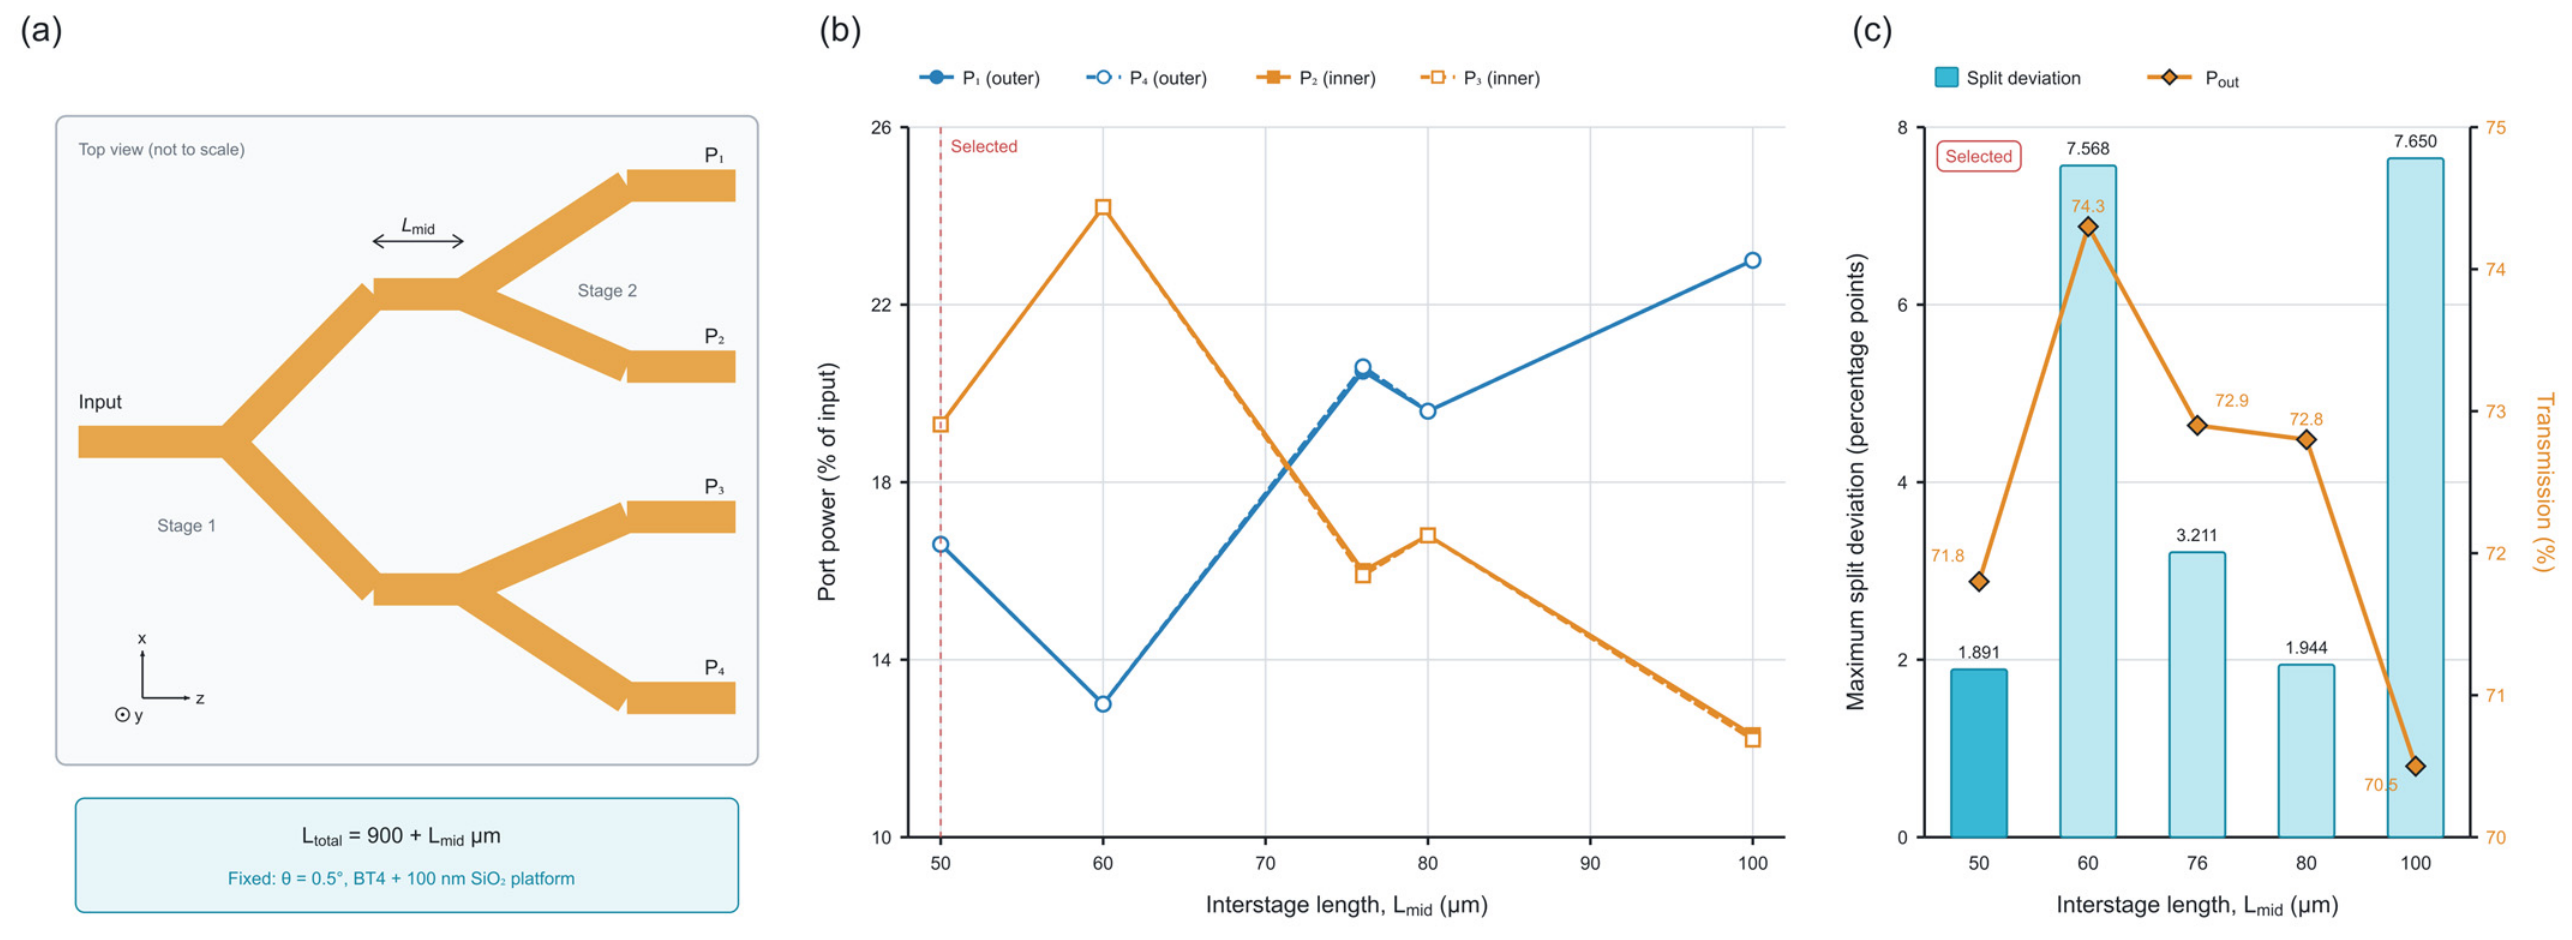
The equal-ratio 1 × 4 splitter consisted of three symmetric Y junctions in two stages on the same BT4 + 100 nm SiO2 platform (Figure 13a). The first-stage Y fed two second-stage junctions to form four outputs. Its branch length increased to 500 μm to separate the second-stage junctions, while each second-stage branch retained the 300 μm length of the 1 × 2 splitter. A straight interstage section of length Lmid yielded a total propagation length of
Figure 13.
Cascaded 1 × 4 splitter on BT4 with a 100 nm SiO2 backside layer: (a) two stages containing three 1 × 2 Y junctions; (b) four output-port powers versus interstage length Lmid; and (c) maximum deviation from a 25% output share and total transmission. Lmid = 50 μm was the selected compact reference.
The tested Lmid values were 50, 60, 76, 80, and 100 μm. Output centers were at x = −6.981, −1.745, 1.745, and 6.981 μm. Mirror-related ports remained paired, but the inner/outer distribution changed nonmonotonically with Lmid (Figure 13b). This is consistent with the multimode phase evolution and redistribution of the field delivered to the second-stage junctions.
The 60 μm interstage section yielded the highest reference transmission, 74.3%, but a 7.568 percentage-point maximum deviation from equal division. The 50 μm section yielded 71.8% transmission and a smaller deviation of 1.891 percentage points in a 950 μm device. Its output shares were 23.131%, 26.891%, 26.842%, and 23.136%, with L = 1.437 dB. It achieved the most balanced division among these sampled reference designs with the shortest tested cascade. The comparison illustrates the separate roles of throughput, uniformity, and device length.
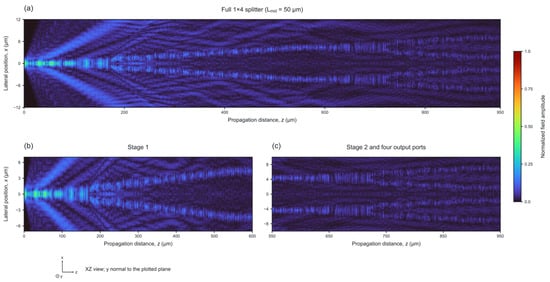
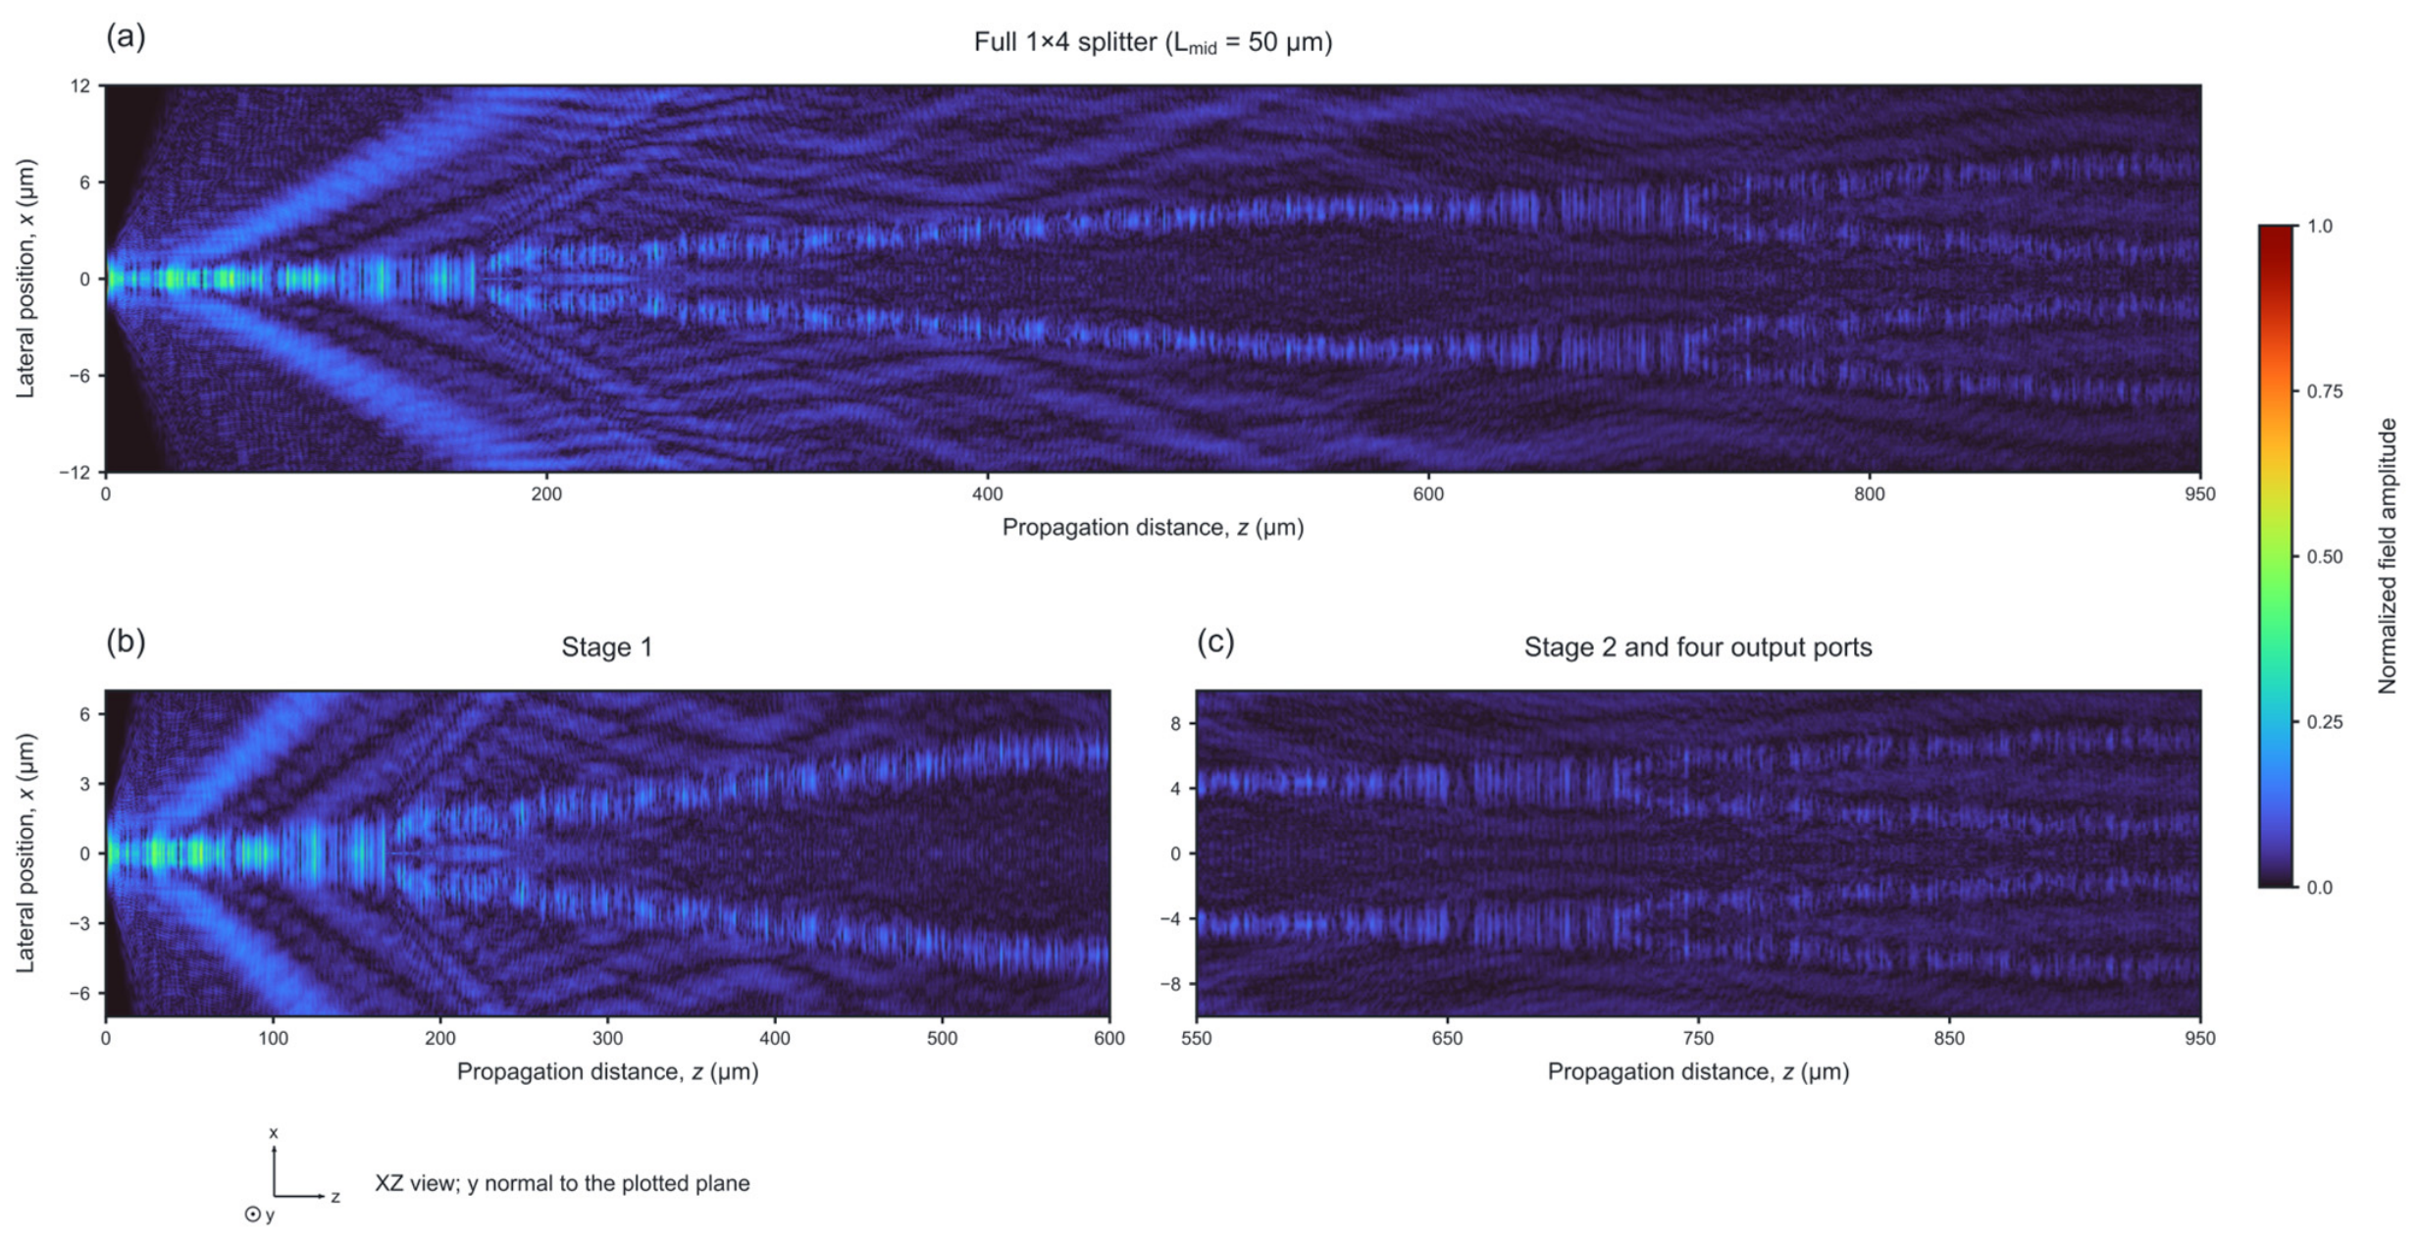
Figure 14 shows the field distributions of the selected 1 × 4 splitter. The full XZ map resolves the initial input, the first division, and the formation of four outputs over 950 μm (Figure 14a). The enlarged views show the first-stage branch (Figure 14b) and the two second-stage junctions (Figure 14c). Mirror-related field distributions agree with the paired output powers.
Figure 14.
Normalized XZ field-amplitude distributions of the selected 1 × 4 splitter with Lmid = 50 μm: (a) full device; (b) first-stage Y branch; and (c) second-stage junctions and four outputs. All panels share a common normalization. The longitudinal display origin is the launch plane; y is normal to the plotted plane.
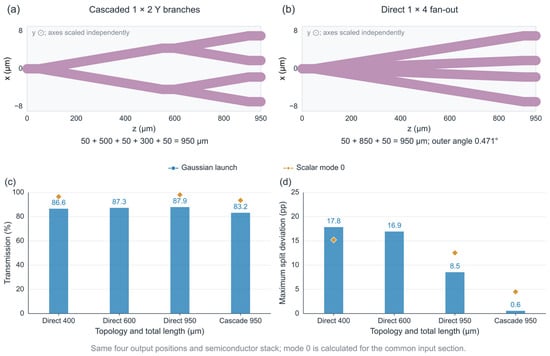
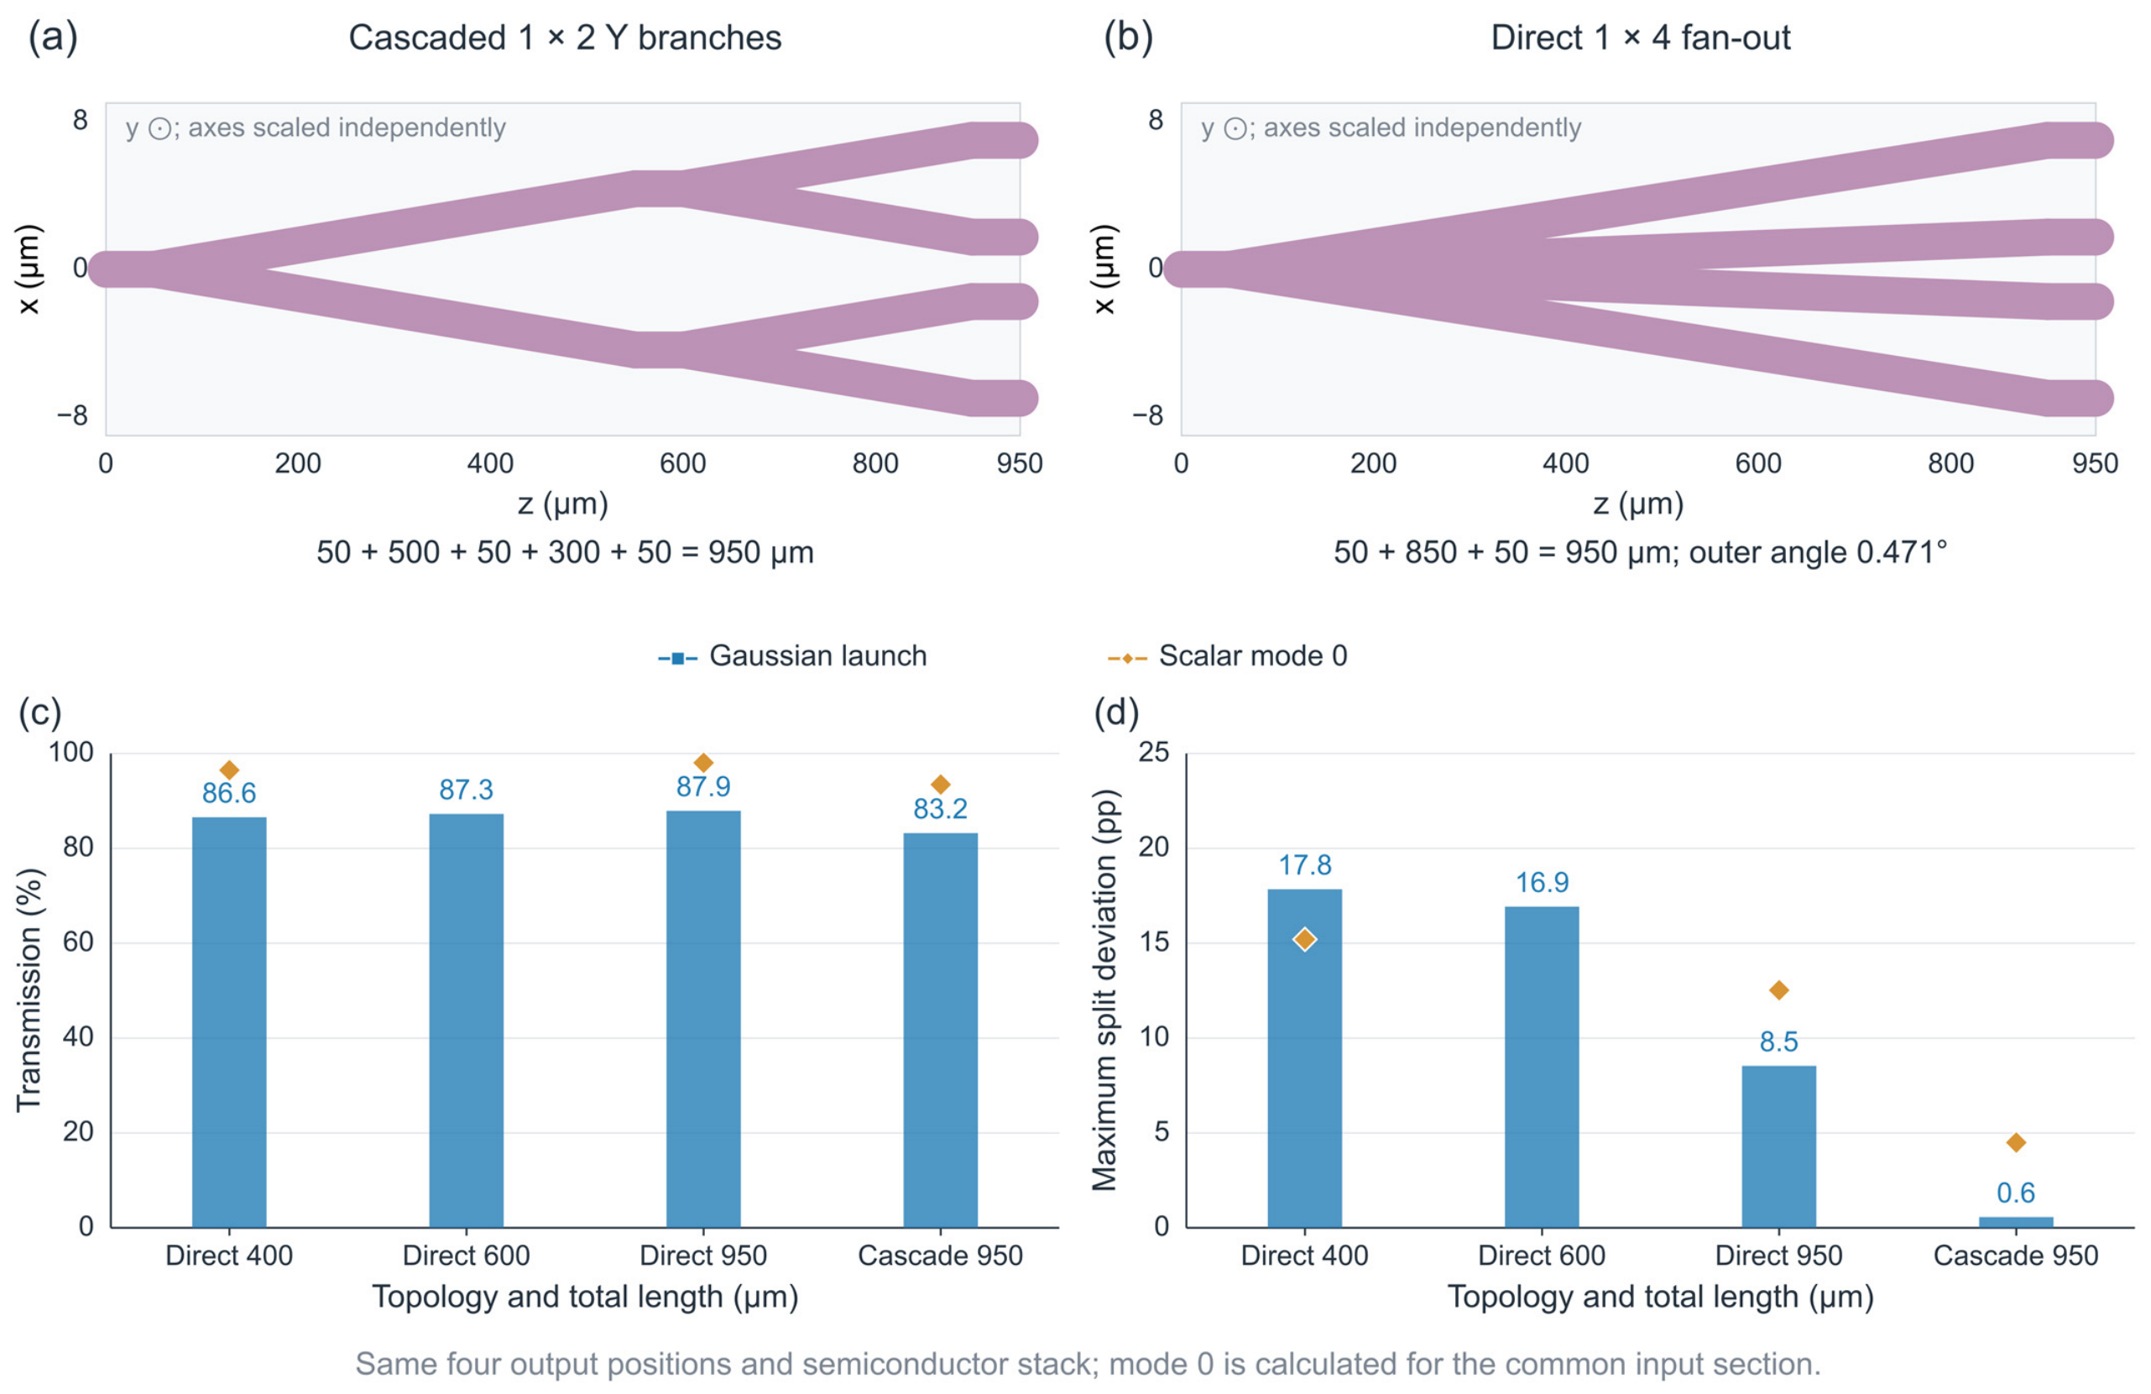
To compare topologies under matched excitation, a direct four-arm splitter was evaluated with the same vertical stack and output positions, using a z = 0 source plane for both layouts (Figure 15). At equal 950 μm length, the direct and cascaded structures transmitted 87.90% and 83.22% under Gaussian excitation, with maximum deviations from equal sharing of 8.53 and 0.57 percentage points, respectively. The reference calculation yielding 71.8% transmission placed the Gaussian waist at z = −0.5 μm, so the field propagated through 0.5 μm of air before reaching the waveguide entrance; the 83.22% comparison placed the waist directly at the entrance. This changed the field coupled into the multimode guide and its redistribution through the two splitting stages, affecting the transmission normalized to total launched power. With fundamental-mode excitation, the corresponding transmissions were 98.03% and 93.45%, and deviations were 12.52 and 4.50 percentage points, respectively. Shorter 400 and 600 μm direct layouts yielded high throughput but greater imbalance. These comparisons show a throughput–uniformity trade-off: the cascade resulted in more balanced division for the tested inputs, while the direct layout transmitted more power. At equal length, the direct outer angle was 0.471°; the compact 400 μm layout required 1.333°.
Figure 15.
Direct and cascaded 1 × 4 comparison: (a,b) 950 μm layouts with identical output positions; (c) total transmission; and (d) maximum deviation from equal four-way sharing. The direct layouts had total lengths of 400, 600, and 950 μm; the cascade was 950 μm long. These additional comparisons use a common z = 0 launch plane and Δx/Δy/Δz = 0.020/0.010/0.200 μm for Gaussian and scalar-mode-0 excitation. Modal results are available for the 400 and 950 μm direct layouts. Axes in (a,b) are scaled independently.
3.7. Excitation and Material Sensitivity
Finite-element input-mode calculations and guided-mode launches examined excitation dependence. The selected TE-like field extended into the continuous slab in BT0 and became strongly confined after thinning (Supplementary Figure S2a). At a common z = 0 source plane, BT4 transmission was 87.62% for a Gaussian input and 96.53% for the scalar fundamental mode. The same source-plane comparison in the 950 μm cascade yielded 83.22% and 93.45%, respectively, while the maximum port-share deviation changed from 0.57 to 4.50 percentage points. These comparisons show that transmission and output-power division depend on the incident field.
Absorption affected the comparison according to modal overlap with the upper layers (Supplementary Figure S2c). With αMQW = 100 cm−1 and αp-GaN = 100 cm−1, the supplementary reference calculations yielded 32.17%, 88.61%, and 67.38% transmission for BT0, TE3, and BT4, respectively. At αMQW = 1000 cm−1, TE3 yielded 80.66%, while BT4 and BT0 yielded 29.07% and 31.11%, respectively. Thus, low geometric leakage and absorption must be considered together when selecting the retained layers. The effective absorption coefficients are the sensitivity parameters defined in Section 2.1.
A local wavelength check at 430, 450, and 470 nm retained the 450 nm fundamental-mode input profile and used library dispersion where available. BT4 transmission varied from 95.11% to 96.71%, and the 100 nm SiO2 structure yielded 95.24–96.34%, with near-equal symmetric outputs (Supplementary Figure S2d). Width, slab-depth, and real-index perturbations quantified the corresponding optical sensitivities (Supplementary Table S1). Extension to other visible bands required the appropriate alloy/MQW dispersion, absorption, and mode profiles.
Numerical checks are summarized in the Supplementary Information. Mesh and boundary tests support the representative FEM input-mode profiles. Paired grid and step refinement changed the sign of the small SiO2–air difference, so the reported 0.083 dB benefit is a nominal reference-grid result. The 100 nm coating remained the specified platform for the functional designs. The small branch angles are compatible with forward BPM, while high-angle substrate radiation and reflection remain limitations of this approximation. The FEM checks address input cross-sections rather than complete three-dimensional propagation.
Backside Si removal and subsequent GaN slab etching have been demonstrated for released GaN photonic structures [30]. In BT4, 0.375 μm was the residual slab outside the ridge; the ridge retained a 1.375 μm nitride column. Fabrication of the present layout would require suitable release-window supports, residual stress control, and characterization of etch depth and surface roughness.
4. Conclusions
This study extends slab and backside engineering to GaN-on-Si Y-branch power splitters at 450 nm. In the reference Gaussian calculations, complete topside slab removal reduced L from 4.428 to 0.391 dB, and complete backside slab removal yielded 0.371 dB. The slab comparison provides the largest transmission improvement among the tested geometric changes. The two processing routes offer different retained cross-sections, and backside access also enables optical boundary engineering.
Complementary branch widths provided nominal 70:30, 80:20, and 90:10 division with errors below one percentage point under the reference launch. The 950 μm cascade provided 71.8% transmission and a maximum port-share deviation of 1.891 percentage points under the reference Gaussian launch at z = −0.5 μm. With fundamental-mode excitation at z = 0, the cascade provided 93.45% transmission and a maximum port-share deviation of 4.50 percentage points. The added direct four-arm comparison shows how throughput and uniformity can favor different layouts. Modal and material sensitivity calculations further identified the input and absorption conditions needed when applying these design results. In the MQW-absorption comparisons, TE3 provided higher transmission than BT4, highlighting the influence of overlap with the retained absorbing layers on the choice of processing route. Together, the comparisons provide a basis for selecting GaN-on-Si power-routing geometries and their operating conditions.
Supplementary Materials
The following supporting information can be downloaded at https://www.mdpi.com/article/10.3390/nano16221472/s1: Table S1 (dimensional and index sensitivity of the symmetric BT4 + 100 nm SiO2 splitter), Figure S1 (paired grid and step refinement), and Figure S2 (input modes and sensitivity to excitation, absorption, and wavelength).
Author Contributions
Conceptualization and methodology, X.L. and W.J.; investigation, W.J. and Y.S.; data curation, W.L.; writing—original draft preparation, W.J. and X.L.; review and editing, Y.S.; visualization, X.L. All authors have read and agreed to the published version of the manuscript.
Funding
This research was funded by the key technical specialized funding of Nanjing City (No. 202512132).
Data Availability Statement
Data are contained within the article, and further inquiries can be directed to the corresponding author.
Acknowledgments
The authors used OpenAI Codex (OpenAI, desktop versions 26.1027.3384.0 and 26.1103.7773.0 during revision) for language editing, literature searches, and citation-related wording during manuscript preparation. All AI-assisted material was reviewed and revised by the authors, who accept responsibility for the final manuscript.
Conflicts of Interest
The authors declare no conflicts of interest.
Abbreviations
| Abbreviation | Definition |
| BPM | Beam propagation method |
| BT | Backside-thinning model |
| DBR | Distributed Bragg reflector |
| MQW | Multiple quantum well |
| PIC | Photonic integrated circuit |
| PML | Perfectly matched layer (FEM eigenmode calculations) |
| TE | Topside etching (model prefix); transverse electric (polarization) |
| FEM | Finite element method |
| TBC | Transparent boundary condition (BPM) |
References
- Tran, M.A.; Zhang, C.; Morin, T.J.; Chang, L.; Barik, S.; Yuan, Z.; Lee, W.; Kim, G.; Malik, A.; Zhang, Z.; et al. Extending the Spectrum of Fully Integrated Photonics to Submicrometre Wavelengths. Nature 2022, 610, 54–60. [Google Scholar] [CrossRef] [Scilit] [PubMed]
- Zhang, H.; Yan, J.; Ye, Z.; Shi, F.; Piao, J.; Wang, W.; Gao, X.; Zhu, H.; Wang, Y.; Liu, Y.; et al. Monolithic GaN Optoelectronic System on a Si Substrate. Appl. Phys. Lett. 2022, 121, 181103. [Google Scholar] [CrossRef] [Scilit]
- Yan, J.; Fang, L.; Sun, Z.; Zhang, H.; Yuan, J.; Jiang, Y.; Wang, Y. Complete Active–Passive Photonic Integration Based on GaN-on-Silicon Platform. Adv. Photonics Nexus 2023, 2, 046003. [Google Scholar] [CrossRef] [Scilit]
- Ma, X.; Cheung, Y.F.; Lyu, H.; Choi, H.W. Heterogeneous Integration of a GaN-Based Photonic Integrated Circuit with an Si-Based Transimpedance Amplifier. Opt. Lett. 2023, 48, 1124–1127. [Google Scholar] [CrossRef] [Scilit] [PubMed]
- Suraj; Rathkanthiwar, S.; Raghavan, S.; Selvaraja, S.K. Polarization Independent Grating in a GaN-on-Sapphire Photonic Integrated Circuit. Opt. Express 2023, 31, 23350–23361. [Google Scholar] [CrossRef] [Scilit] [PubMed]
- Wang, Z.; Feng, J.; Li, H.; Zhang, Y.; Wu, Y.; Hu, Y.; Wu, J.; Yang, J. Ultra-Compact and Broadband Nano-Integration Optical Phased Array. Nanomaterials 2023, 13, 2516. [Google Scholar] [CrossRef] [Scilit] [PubMed]
- Yuan, H.; Wu, J.; Zhang, J.; Pu, X.; Zhang, Z.; Yu, Y.; Yang, J. Non-Volatile Programmable Ultra-Small Photonic Arbitrary Power Splitters. Nanomaterials 2022, 12, 669. [Google Scholar] [CrossRef] [Scilit] [PubMed]
- Purnamaningsih, R.W.; Saraswati, I.; Poespawati, N.R.; Dogheche, E. Design of GaN-Based Low-Loss Y-Branch Power Splitter. Makara J. Technol. 2014, 18, 101–104. [Google Scholar] [CrossRef] [Scilit]
- Serecunova, S.; Seyringer, D.; Uherek, F.; Seyringer, H. Waveguide Shape and Waveguide Core Size Optimization of Y-Branch Optical Splitters up to 128 Splitting Ratio. Opt. Commun. 2021, 501, 127362. [Google Scholar] [CrossRef] [Scilit]
- Fernández de Cabo, R.; González-Andrade, D.; Cheben, P.; Velasco, A.V. High-Performance On-Chip Silicon Beamsplitter Based on Subwavelength Metamaterials for Enhanced Fabrication Tolerance. Nanomaterials 2021, 11, 1304. [Google Scholar] [CrossRef] [Scilit] [PubMed]
- Fernández de Cabo, R.; Vilas, J.; Cheben, P.; Velasco, A.V.; González-Andrade, D. Experimental Characterization of an Ultra-Broadband Dual-Mode Symmetric Y-Junction Based on Metamaterial Waveguides. Opt. Laser Technol. 2023, 157, 108742. [Google Scholar] [CrossRef] [Scilit]
- Liu, Y.; Kang, Z.; Xu, H.; Zhong, G.; Zhang, R.; Fu, C.; Tian, Y. Inverse Design of Multi-Port Power Splitter with Arbitrary Ratio Based on Shape Optimization. Nanomaterials 2025, 15, 393. [Google Scholar] [CrossRef] [Scilit] [PubMed]
- Zheng, L.; Chen, Y.; Xue, Z.; Huang, J.; Zhu, M.; Wang, L. Broadband and Polarization-Independent Arbitrary Ratio Integrated Optical Power Splitter Built on Thick Silicon Nitride Platform. Optoelectron. Lett. 2024, 20, 577–583. [Google Scholar] [CrossRef] [Scilit]
- Sacher, W.D.; Luo, X.; Yang, Y.; Chen, F.-D.; Lordello, T.; Mak, J.C.C.; Liu, X.; Hu, T.; Xue, T.; Lo, P.G.-Q.; et al. Visible-Light Silicon Nitride Waveguide Devices and Implantable Neurophotonic Probes on Thinned 200 mm Silicon Wafers. Opt. Express 2019, 27, 37400–37418. [Google Scholar] [CrossRef] [Scilit] [PubMed]
- Sanna, M.; Baldazzi, A.; Piccoli, G.; Azzini, S.; Ghulinyan, M.; Pavesi, L. SiN Integrated Photonic Components in the Visible to Near-Infrared Spectral Region. Opt. Express 2024, 32, 9081–9094. [Google Scholar] [CrossRef] [Scilit] [PubMed]
- Puckett, M.W.; Liu, K.; Chauhan, N.; Zhao, Q.; Jin, N.; Cheng, H.; Wu, J.; Behunin, R.O.; Rakich, P.T.; Nelson, K.D.; et al. 422 Million Intrinsic Quality Factor Planar Integrated All-Waveguide Resonator with Sub-MHz Linewidth. Nat. Commun. 2021, 12, 934. [Google Scholar] [CrossRef] [Scilit] [PubMed]
- Bose, D.; Harrington, M.W.; Isichenko, A.; Liu, K.; Wang, J.; Chauhan, N.; Newman, Z.L.; Blumenthal, D.J. Anneal-Free Ultra-Low Loss Silicon Nitride Integrated Photonics. Light Sci. Appl. 2024, 13, 156. [Google Scholar] [CrossRef] [Scilit] [PubMed]
- Bian, Y.; Lee, W.S.; Chandran, S.; Aboketaf, A.; Hirokawa, T.; Dezfulian, K.; Sorbara, M.; Banihashemian, F.; Mosleh, S.; Najafi, A.; et al. Mitigating Substrate Leakage Loss on a Monolithic SiPh Platform: Experimental Demonstration of Hybrid Si–SiN Waveguides for O-Band Datacom. In Proceedings of the Optical Fiber Communication Conference (OFC) 2024, San Diego, CA, USA, 24–28 March 2024; Optica Publishing Group: Washington, DC, USA, 2024; Paper Th3H.3. [Google Scholar] [CrossRef] [Scilit]
- Qiao, Q.; Sun, H.; Liu, X.; Dong, B.; Xia, J.; Lee, C.; Zhou, G. Suspended Silicon Waveguide with Sub-Wavelength Grating Cladding for Optical MEMS in Mid-Infrared. Micromachines 2021, 12, 1311. [Google Scholar] [CrossRef] [Scilit] [PubMed]
- Gonzalez-Fernandez, A.A.; Vazquez-Hernandez, J.A.; Aguilar-Valdez, F.; Moffat, N. Tapered Cladding Design for Monolithic Waveguide–Photodetector Coupling in Si-Based Integrated Photonics. Nanomaterials 2025, 15, 1731. [Google Scholar] [CrossRef] [Scilit] [PubMed]
- Wall, T.; Hammon, S.; Hamilton, E.; Zacheu, G.; Orfila, M.; Schmidt, H.; Hawkins, A.R. Mitigating Water Absorption in Waveguides Made from Unannealed PECVD SiO2. IEEE Photonics Technol. Lett. 2017, 29, 806–809. [Google Scholar] [CrossRef] [Scilit] [PubMed]
- Gao, X.; Liu, P.; Yin, Q.; Wang, H.; Fu, J.; Hu, F.; Jiang, Y.; Zhu, H.; Wang, Y. Wireless Light Energy Harvesting and Communication in a Waterproof GaN Optoelectronic System. Commun. Eng. 2022, 1, 16. [Google Scholar] [CrossRef] [Scilit]
- Yin, H.; Li, W.; Feng, X.; Qin, F.; Shi, Z.; Wang, Y.; Li, X. Loss Characteristics Analysis and Process Optimization of GaN Optical Waveguide. Chin. Opt. 2025, 18, 477–486. [Google Scholar] [CrossRef] [Scilit]
- Li, W.; Yin, H.; Fang, Q.; Qin, F.; Shi, Z.; Wang, Y.; Li, X. Optimization of GaN Bent Waveguides in the Visible Spectrum for Reduced Insertion Loss. Nanomaterials 2025, 15, 151. [Google Scholar] [CrossRef] [Scilit] [PubMed]
- Shen, C.; Ng, T.K.; Leonard, J.T.; Pourhashemi, A.; Oubei, H.M.; Alias, M.S.; Nakamura, S.; DenBaars, S.P.; Speck, J.S.; Alyamani, A.Y.; et al. High-Modulation-Efficiency, Integrated Waveguide Modulator–Laser Diode at 448 nm. ACS Photonics 2016, 3, 262–268. [Google Scholar] [CrossRef] [Scilit]
- Matioli, E.; Fleury, B.; Rangel, E.; Hu, E.; Speck, J.; Weisbuch, C. Measurement of Extraction and Absorption Parameters in GaN-Based Photonic-Crystal Light-Emitting Diodes. J. Appl. Phys. 2010, 107, 053114. [Google Scholar] [CrossRef] [Scilit]
- Zhao, Y.; Sonoda, J.; Pan, C.-C.; Brinkley, S.; Koslow, I.; Fujito, K.; Ohta, H.; DenBaars, S.P.; Nakamura, S. 30-mW-Class High-Power and High-Efficiency Blue Semipolar (10) InGaN/GaN Light-Emitting Diodes Obtained by Backside Roughening Technique. Appl. Phys. Express 2010, 3, 102101. [Google Scholar] [CrossRef] [Scilit]
- Synopsys, Inc. BeamPROP BPM v2020.03 User Guide; Synopsys, Inc.: Mountain View, CA, USA, 2020. [Google Scholar]
- Hope, A.P.; Nguyen, T.G.; Mitchell, A.; Bogaerts, W. Quantitative Analysis of TM Lateral Leakage in Foundry Fabricated Silicon Rib Waveguides. IEEE Photonics Technol. Lett. 2016, 28, 493–496. [Google Scholar] [CrossRef] [Scilit]
- Liu, Q.; Wang, W. Free-Standing GaN Grating Couplers and Rib Waveguide for Planar Photonics at Telecommunication Wavelength. Opt. Laser Technol. 2018, 98, 257–263. [Google Scholar] [CrossRef] [Scilit]
- Cai, L.; Mahmoud, A.; Piazza, G. Low-Loss Waveguides on Y-Cut Thin Film Lithium Niobate: Towards Acousto-Optic Applications. Opt. Express 2019, 27, 9794–9802. [Google Scholar] [CrossRef] [Scilit] [PubMed]

Disclaimer/Publisher’s Note: The statements, opinions and data contained in all publications are solely those of the individual author(s) and contributor(s) and not of MDPI and/or the editor(s). MDPI and/or the editor(s) disclaim responsibility for any injury to people or property resulting from any ideas, methods, instructions or products referred to in the content. |
© 2026 by the authors. Licensee MDPI, Basel, Switzerland. This article is an open access article distributed under the terms and conditions of the Creative Commons Attribution (CC BY) license.