


Abstract
Tandem photoelectrochemical (PEC) cells made exclusively of earth-abundant oxides are a promising route to solar hydrogen, but bias-free operation and durability remain challenging, particularly in acidic environments. This work presents a 1 cm2 zero-gap tandem PEC cell, operated without housing and fed only with deionized water, that integrates an electrodeposited nanostructured WO3 photoanode (band gap 2.75 eV), a spray-coated nanostructured CuFe2O4 photocathode (1.43 eV) and a Nafion 117 proton-exchange membrane acting as solid electrolyte and separator. Mott–Schottky analysis in N2-purged 0.1 M HClO4 confirms the expected n-type and p-type semiconductor character, with a band-edge alignment compatible with unassisted operation. Under simulated AM 1.5G sunlight, the device delivers ≈42 µA cm−2 at zero bias (solar-to-hydrogen efficiency ≈ 0.05%, assuming unity Faradaic efficiency) and a saturated photocurrent density of 0.47 mA cm−2 at −1.0 V (throughput efficiency 0.70%). After 96 h of operation (48 h at 0 V and 48 h at −0.7 V), the photocurrent decreases by only ≈5–6%. Impedance spectroscopy and distribution of relaxation times analysis identify a dominant millisecond-scale interfacial charge-transfer process. Post-operando analyses reveal that WO3 undergoes only mild surface reduction, whereas CuFe2O4 shows partial Cu2+ → Cu+ reduction and local delamination, identifying the photocathode as the lifetime-limiting component.
1. Introduction
Hydrogen produced from water and renewable energy is widely regarded as a key vector for the decarbonization of hard-to-abate sectors. At present, proton-exchange membrane [1,2] and anion-exchange membrane [3,4] water electrolyzers, together with solid oxide electrolysis cells [5], represent the most mature routes to green hydrogen; however, they rely on an external supply of renewable electricity and, in several cases, on critical raw materials. Among the emerging alternatives, photoelectrochemical (PEC) water splitting, first demonstrated by Fujishima and Honda on TiO2 [6], stands out because light harvesting, charge separation and electrocatalysis are integrated in a single device that converts sunlight directly into chemical energy stored in H2 [7,8,9]. Recent analyses of large-area devices and of their upscaling challenges indicate that the competitiveness of PEC hydrogen depends critically on inexpensive and abundant materials, on simple and scalable manufacturing routes and on device lifetimes well beyond the laboratory time scale [10,11].
In a PEC cell, photons absorbed by one or more semiconductor photoelectrodes create electron–hole pairs, which are used to drive the oxygen evolution reaction (OER) at the anode and the hydrogen evolution reaction (HER) at the cathode [12]. A single absorber must combine a band gap large enough to provide the photovoltage required for water splitting, i.e., well above the thermodynamic value of 1.23 eV once kinetic and ohmic losses are included, with band edges straddling the H+/H2 and O2/H2O redox levels; this combination strongly limits the fraction of the solar spectrum that can be harvested [7,13]. A promising solution is the tandem configuration [14], in which an n-type photoanode and a p-type photocathode with complementary band gaps are connected in series: the wide-band-gap absorber harvests the high-energy photons and drives the OER, whereas the narrow-band-gap absorber collects the transmitted light and drives the HER [15,16]. Bias-free (unassisted) operation becomes possible when the photocurrent–potential curves of the two photoelectrodes intersect at a non-zero current [14]. Since the pioneering work of Ohashi et al. [17], several all-oxide tandem configurations have been demonstrated, including p/n-Fe2O3 [18], TiO2/CaFe2O4 [19], BiVO4/Cu2O [20] and Fe2O3/CuBi2O4 [21], whereas solar-to-hydrogen (STH) efficiencies above 4% have been reached only with considerably more complex architectures [22].
Notably, most of these devices operate in neutral or alkaline electrolytes, which raise issues of buffering, carbonation and ohmic losses [23]. Acidic media are attractive in view of their high proton conductivity and of the possibility of coupling the photoelectrodes with proton-exchange membranes, but they are particularly demanding for the chemical stability of oxide photoelectrodes. In this context, Díaz-García and Gómez recently reported a WO3–CuCrO2 tandem cell that operated without bias in 0.1 M HClO4 for more than 3 h, showing that unprotected oxide photoelectrodes can split water in strongly acidic electrolytes [24].
Among n-type oxides, monoclinic WO3 is a particularly suitable photoanode for acidic environments, since it is chemically stable at low pH [25,26], shows good electron transport [27,28] and has a band gap of ≈2.6–2.8 eV, with a valence band lying well below the O2/H2O level that provides a large driving force for water oxidation [29,30,31]. Nevertheless, its photostability depends markedly on the electrolyte composition, because surface peroxo species and dissolution processes can develop during water oxidation [32]. On the photocathode side, the development of stable p-type oxides remains the main bottleneck: Cu2O and CuO are efficient absorbers but are prone to photocorrosion [33,34], and ternary oxides such as CuFeO2 [35], CaFe2O4 [36] and CuCrO2 [37] have therefore been investigated [38]. Copper ferrite (CuFe2O4) is a p-type spinel composed of abundant elements, with a narrow band gap that enables visible and near-infrared absorption and a photocurrent onset at rather positive potentials [39,40,41]. These features make CuFe2O4 a natural partner for WO3 in a tandem configuration: the photoanode absorbs the ultraviolet and blue part of the spectrum and transmits the remaining photons, which can be harvested by the underlying ferrite photocathode.
At the device level, our group has developed tandem photoelectrolysis cells in which a solid polymer electrolyte membrane is laminated between the photoanode and the photocathode in a zero-gap configuration. The membrane acts simultaneously as separator and ionic conductor, minimizes ohmic losses, avoids the handling of corrosive liquid electrolytes and enables the production of dry, separated gases [42]. This concept has been progressively scaled up to 10 cm2 [43] and 25 cm2 [44] devices based on critical raw material-free hematite and cupric oxide photoelectrodes and anion-exchange membranes, and the role of earth-abundant co-catalysts has been systematically investigated [45,46]. In these studies, electrochemical impedance spectroscopy (EIS) and the distribution of relaxation times (DRT) proved to be powerful tools to deconvolute ohmic, transport and interfacial contributions in membrane-based devices [47,48,49], and post-operando analyses identified the CuO photocathode, progressively reduced under operation, as the lifetime-limiting component of our 10 cm2 prototype. Proton-exchange membrane PEC cells have also been demonstrated with WO3 photoanodes coupled with Pt-based dark cathodes, e.g., for the splitting of water vapor [50,51]. Despite this progress, a zero-gap tandem cell in which an acid-stable WO3 photoanode is coupled with a CuFe2O4 photocathode through a proton-exchange membrane has not yet been reported, and the durability of such an all-oxide device in contact with a strongly acidic ionomer is unknown. In addition, studies linking the evolution of the device performance to specific structural, chemical and morphological changes in the photoelectrodes remain scarce.
Building on these premises, in the present work we design and characterize a 1 cm2 zero-gap tandem cell in which a Nafion 117 proton-exchange membrane is sandwiched between an electrodeposited nanostructured WO3 photoanode and a spray-coated nanostructured CuFe2O4 photocathode, both supported on fluorine-doped tin oxide (FTO) glass. The cell is operated without any external housing and fed only with deionized water, so that the membrane provides at the same time the acidic environment, the ionic path and the separation of the anodic and cathodic products. Within this framework, the explicit questions guiding the study are:
- (i)
- Can a zero-gap tandem cell based on nanostructured WO3 and CuFe2O4 photoelectrodes and a proton-exchange membrane operate without external bias, and how does its response evolve under a moderate assisting bias?
- (ii)
- How do the optical and electronic properties of the two photoelectrodes and the interfacial charge-transfer processes, as resolved by EIS and DRT, determine the device performance?
- (iii)
- Which structural, chemical and morphological changes occur in the photoelectrodes after 96 h of operation, as revealed by post-operando analyses, and which component limits the lifetime of the device?
2. Materials and Methods
This section describes the materials, the preparation of the photoelectrodes, the assembly of the zero-gap tandem cell and the characterization techniques.
2.1. Materials
The tungsten precursor for the WO3 photoanode was sodium tungstate dihydrate (Na2WO4·2H2O), while the CuFe2O4 photocathode was prepared from copper(II) nitrate trihydrate (Cu(NO3)2·3H2O) and iron(III) nitrate nonahydrate (Fe(NO3)3·9H2O). Hydrogen peroxide (H2O2, 40%), nitric acid (HNO3), absolute ethanol, isopropyl alcohol and perchloric acid (HClO4) were also employed. All chemicals were of analytical grade (Sigma-Aldrich, St. Louis, MO, USA) and were used as received. Both photoelectrodes were deposited on FTO-coated glass (Sigma-Aldrich). The solid polymer electrolyte was a commercial Nafion™ 117 proton-exchange membrane (nominal thickness 183 µm; Chemours, Wilmington, DE, USA), used as received without any pretreatment. Deionized water was used for all solutions and for feeding the cell.
2.2. Preparation of the WO3 Photoanode
The FTO substrate was first cleaned by sonication in ethanol and in distilled water (10 min each) and dried at room temperature. WO3 films were then grown by cathodic electrodeposition from an acidic peroxotungstate bath, following procedures previously reported in the literature [52,53]. In particular, the bath was prepared by dissolving 4.12 g of Na2WO4·2H2O (25 mM) in deionized water and adding 11.3 mL of 40% H2O2, which produced a yellow peroxotungstate solution; HNO3 was then added until pH 1.2 was reached, and the final volume was adjusted to 500 mL. Electrodeposition was performed with an Autolab PGSTAT302N potentiostat/galvanostat (Metrohm Autolab, Utrecht, The Netherlands) in a conventional three-electrode configuration, using the cleaned FTO glass as working electrode, a platinum wire as counter electrode and an Ag/AgCl reference electrode (both from AMEL, Milan, Italy), placed at equal distances in the bath. A constant potential of −0.27 V vs. Ag/AgCl was applied for 40 min (1 cm2 geometric area), in the dark and under gentle, constant stirring. The resulting films were rinsed thoroughly with doubly distilled water to remove residual ions, dried at room temperature and calcined in air at 450 °C for 1 h to convert the deposit into crystalline WO3.
2.3. Preparation of the CuFe2O4 Photocathode
CuFe2O4 films were deposited by spray coating on FTO glass cleaned as described above. The precursor solution was obtained by dissolving 4.61 mg of Cu(NO3)2·3H2O and 15.39 mg of Fe(NO3)3·9H2O (Cu:Fe molar ratio = 1:2) in a mixture of 1.8 mL of absolute ethanol and 0.2 mL of deionized water under magnetic stirring. A volume of 1 mL of this solution was sprayed onto the substrate (1 cm2 geometric area), kept at 60 °C, using a dual-action airbrush (Custom Micron CM-C2 Plus; ANEST IWATA Corporation, Yokohama, Japan) with compressed air at 2 bar as carrier gas and a nozzle-to-substrate distance of 0.5 cm, without intermediate drying steps. A final annealing at 600 °C for 2 h in air (heating rate 2 °C min−1) completed the transformation of the nitrate precursors into the CuFe2O4 spinel phase.
2.4. Assembly of the Zero-Gap Tandem Cell
The cell relies on a zero-gap architecture, in which a solid proton-exchange membrane acts both as separator and as ionic conductor, as in our previous tandem devices [42]. The components and the assembly of the cell are shown in Figure 1. The WO3 photoanode appears as a pale yellow film and the CuFe2O4 photocathode as a reddish-brown film, both with an active area of 1 cm2. The cell was built by superimposing the WO3/FTO photoanode, the Nafion 117 membrane and the CuFe2O4/FTO photocathode, with both oxide layers facing the membrane and the two active areas aligned, so that the membrane provided the only ionic path between the electrodes. No external housing was used. The membrane, larger than the electrode overlap, was wetted with deionized water by means of a micropipette at its edges protruding outside the cell, and water uptake by the ionomer kept the active region hydrated during operation. Electrical contacts were made on the uncoated FTO regions of the two electrodes. During all measurements, the cell was kept under a continuous N2 flow surrounding the cell; therefore, atmospheric O2 was excluded, and the only O2 and H2 present were those produced by the device.
Figure 1.
Components and assembly of the zero-gap tandem photoelectrochemical cell. Top left: photographs of the WO3/FTO photoanode, the Nafion 117 membrane and the CuFe2O4/FTO photocathode. Bottom left: sketch of the components with the active electrode areas (1 cm2). Right: schematic side view of the assembled cell, with both oxide layers facing the membrane. Illumination is provided through the FTO glass of the WO3 photoanode.
During operation, the n-type WO3 photoanode, illuminated through its FTO glass, absorbs the high-energy part of the incident spectrum; the photogenerated holes oxidize water to O2 at the WO3 surface, releasing protons, while the electrons are collected by the FTO and reach the photocathode through the external circuit. Since only the photons that are not absorbed by WO3 cross the membrane, the p-type CuFe2O4 layer is excited mainly by visible light of longer wavelength, and its photogenerated electrons reduce protons to H2. Charge neutrality is preserved by the migration of protons through the Nafion 117 membrane, which also acts as a physical barrier between the evolved gases.
2.5. Photoelectrochemical Characterization
All photoelectrochemical measurements were performed with an Autolab PGSTAT302N potentiostat/galvanostat equipped with a frequency response analyzer (FRA) module (Metrohm Autolab), using a solar simulator (Oriel Sol3A Class AAA, Newport, Irvine, CA, USA) calibrated to AM 1.5G (100 mW cm−2) with a calibrated reference cell (91150V, Newport). The tandem cell was measured in a two-electrode configuration, the cell voltage (V) being applied between the photoanode and the photocathode. Current density–voltage (J–V) curves were recorded at 20 mV s−1 from short circuit (0 V) to −1.3 V in the dark, under continuous illumination and under chopped illumination (5 s light/5 s dark). Data are reported using the photodiode convention, i.e., the hydrogen-evolution current is plotted as negative and an assisting (reverse) cell bias is reported as a negative voltage. The photocurrent density was calculated as jp = jlight − jdark. No smoothing, filtering or baseline correction was applied to the J–V and chronoamperometric data, which were only normalized to the 1 cm2 geometric area; jp and the derived efficiencies were calculated point by point from the continuous-light and dark curves. For graphical representation, consecutive experimental points of the J–V and chronoamperometric curves were connected using the smoothed-line option of the plotting software (Microsoft Excel for Microsoft 365; Microsoft Corporation, Redmond, WA, USA); this option affects only the display between adjacent data points, and all values reported in the text and tables were obtained from the original data.
The performance of the device under bias was evaluated in terms of throughput efficiency (ηtp), quantified by [13]:
In this expression, Etn = 1.48 V is the thermoneutral voltage of liquid water splitting, Vbias is the applied cell voltage and Pin = 100 mW cm−2 is the incident irradiance. Because Etn includes both the Gibbs free-energy and the entropic contributions, ηtp expresses, on a higher-heating-value basis, the share of the overall (optical plus electrical) input power that is converted into chemical energy of hydrogen. At zero bias, the solar-to-hydrogen efficiency was calculated as [13,54]:
where jsc is the current density at short circuit (0 V) under illumination and ηF is the Faradaic efficiency for H2 evolution, assumed to be unity.
Device stability was assessed by a 96 h potentiostatic protocol under continuous AM 1.5G illumination, consisting of 48 h at 0 V (bias-free operation) followed by 48 h at −0.7 V, with 30 min dark intervals every 12 h as internal reference conditions. J–V curves and impedance spectra were recorded on the fresh cell at the beginning of test (BoT) and at the end of the protocol (end of test, EoT) under identical conditions.
2.6. Electrochemical Impedance Spectroscopy and Distribution of Relaxation Times
EIS spectra were recorded in potentiostatic mode at cell voltages of 0, −0.7 and −1.3 V, in the dark and under AM 1.5G illumination, over the 100 kHz–10 mHz frequency range with a single-sine excitation of 10 mVrms, at both BoT and EoT. The spectra were processed with the NOVA 2.1.7 software (Metrohm Autolab) and fitted with an Rs(Rp1‖CPE1)(Rp2‖CPE2) equivalent circuit, in which Rs is the series (ohmic) resistance and each resistance Rp in parallel with a constant phase element (CPE) describes a relaxation process. The impedance of each CPE and the characteristic time constant of each R‖CPE element were calculated as:
where Y and n are the CPE parameters, ω is the angular frequency and j is the imaginary unit.
Selected spectra were also analyzed with the DRT method [48], which describes the impedance as:
where γ(τ) is the distribution function of the relaxation times. The function γ(τ) was obtained by Tikhonov regularization (ridge, λ = 1.0) [55,56,57], implemented in an in-house script written in Python 3.15 (Python Software Foundation, Beaverton, OR, USA), using a logarithmically spaced grid of relaxation times between 10−8 and 101 s; the regularization penalizes first-order differences in γ(τ), thus suppressing artificial oscillations, while leaving Rs unpenalized. The local maxima of γ(τ) were identified as the characteristic processes, and their amplitude and central relaxation time were compared between BoT and EoT. The aims of this analysis were (i) to separate the ohmic contribution from the interfacial processes without assuming an equivalent circuit, (ii) to identify the dominant relaxation times and their intensity, and (iii) to compare quantitatively the fresh and the aged device.
2.7. Mott–Schottky Measurements
Mott–Schottky measurements were carried out on individual WO3 and CuFe2O4 electrodes in a conventional three-electrode half-cell, with an Ag/AgCl (saturated KCl) reference electrode and a platinum wire counter electrode (both from AMEL), in N2-purged 0.1 M HClO4, using the Autolab PGSTAT302N potentiostat/galvanostat equipped with the FRA module. The space-charge capacitance (C) was measured in the dark at a fixed frequency of 1 kHz as a function of the applied potential (E). The conductivity type and the flat-band potential were derived from the sign of the slope and from the potential-axis intercept of the linear region of the 1/C2 vs. E plots, according to the Mott–Schottky relation [58]:
where e is the elementary charge, ε and ε0 are the relative permittivity of the semiconductor and the vacuum permittivity, N is the majority-carrier density, kB is the Boltzmann constant and T is the absolute temperature; the positive and negative signs apply to n-type and p-type semiconductors, respectively. The potentials of the Mott–Schottky measurements, measured vs. the Ag/AgCl reference electrode in the three-electrode configuration, were converted to the reversible hydrogen electrode (RHE) scale according to the Nernst equation:
where 0.197 V is the potential of the Ag/AgCl (saturated KCl) reference electrode vs. the standard hydrogen electrode at 25 °C and 0.059 V corresponds to 2.303RT/F at 25 °C; for 0.1 M HClO4 (pH 1), ERHE = EAg/AgCl + 0.256 V. All Mott–Schottky data are therefore reported vs. RHE (Figure S1c,d).
ERHE = EAg/AgCl + 0.197 V + 0.059 V × pH
The acidic electrolyte was deliberately selected to reproduce the strongly acidic environment experienced by both photoelectrodes in contact with the sulfonic acid groups of the Nafion ionomer in the zero-gap cell, so that the flat-band potentials could be used directly to construct the energy-level diagram of the device (Section 3.2). Moreover, the potential region used for the analysis corresponds to depletion conditions, in which the concentration of minority carriers in the dark, i.e., of electrons in p-type CuFe2O4 and of holes in n-type WO3, is negligible; under these conditions, the electrodes behave as nearly blocking interfaces, and faradaic processes, including the electrochemical self-reduction of Cu2+, are strongly suppressed. To verify the stability of CuFe2O4 in this electrolyte, the Mott–Schottky measurements on the photocathode in N2-purged 0.1 M HClO4 were repeated several times on the same electrode; the Mott–Schottky plots and the resulting flat-band potentials were reproducible, indicating that CuFe2O4 is stable in this acidic solution under the measurement conditions.
2.8. UV–Vis Spectroscopy and Optical Analysis
UV–Vis absorbance spectra of the individual cell components (WO3 on FTO, Nafion 117 membrane and CuFe2O4 on FTO) were recorded in the 300–900 nm range with a Cary 6000i UV–Vis–NIR spectrophotometer (Agilent Technologies, Santa Clara, CA, USA). The fraction of incident light transmitted by each layer was derived from the measured absorbance (A) using the Beer–Lambert law, and the spectral irradiance reaching the CuFe2O4 photocathode in the assembled tandem cell was estimated by cascading the transmittances of the overlying layers:
where FCFO(λ) is the fraction of the incident light absorbed by CuFe2O4, Ftot(λ) is the combined photoactive capture of the two photoelectrodes and the subscripts WO3, N and CFO refer to the WO3 photoanode, the Nafion 117 membrane and the CuFe2O4 photocathode, respectively. The fraction of the WO3-transmitted light captured by CuFe2O4 was calculated as FCFO(λ)/TWO3(λ). Losses due to reflection and scattering were neglected. The optical band gaps were determined by the Tauc method for direct allowed transitions [59,60,61]:
where A is taken as proportional to the absorption coefficient, hν is the photon energy and B is a constant; Eg was obtained by extrapolating the linear portion of the absorption edge to the photon-energy axis.
FCFO(λ) = TWO3(λ) TN(λ) [1 − TCFO(λ)]
Ftot(λ) = [1 − TWO3(λ)] + FCFO(λ)
(Ahν)2 = B(hν − Eg)
2.9. Structural, Morphological and Surface Characterization
X-ray diffraction (XRD), field-emission scanning electron microscopy (FE-SEM) coupled with energy-dispersive X-ray spectroscopy (EDS), transmission electron microscopy (TEM) and X-ray photoelectron spectroscopy (XPS) measurements were performed first on “fresh” electrodes (as prepared, before any electrochemical measurement) and then on “used” electrodes recovered from the tandem cell after the EoT characterization.
Crystallographic analysis was carried out directly on the electrodes supported on FTO glass with a Bruker D8 Advance diffractometer (Bruker AXS, Karlsruhe, Germany), using Ni-filtered Cu Kα radiation (λ = 1.5406 Å) at 40 kV and 40 mA, with an angular step of 0.03°. Phases were identified by comparison with the reference patterns of the Powder Diffraction File (PDF; International Centre for Diffraction Data, Newtown Square, PA, USA) for monoclinic WO3 (PDF 43-1035), tetragonal spinel CuFe2O4 (PDF 34-0425) and tetragonal SnO2 (PDF 72-1147).
The morphology and the elemental composition of the films were examined with a Thermo Scientific Helios 5 UC DualBeam FE-SEM (Thermo Fisher Scientific, Waltham, MA, USA) operated in high-resolution imaging mode and equipped with a Thermo Scientific UltraDry silicon drift detector (SDD) for EDS; EDS spectra were acquired and processed with the Thermo Scientific Pathfinder X-ray Microanalysis Software. Fresh and used electrodes were examined under identical imaging conditions, to enable a direct comparison of texture, grain size and possible operation-induced changes. TEM analysis was performed with a JEOL JEM-F200 microscope (JEOL Ltd., Tokyo, Japan) on material removed from the electrodes, ultrasonically dispersed in isopropyl alcohol and deposited on holey carbon-coated Cu grids (Agar Scientific, Stansted, UK).
XPS was employed to investigate the changes in surface composition and oxidation states of both photoelectrodes after operation. Measurements were carried out with a Physical Electronics PHI 5800-01 spectrometer (Physical Electronics, Chanhassen, MN, USA) equipped with a monochromatic Al Kα X-ray source. The binding-energy scale was referenced to the adventitious C 1s C–C/C–H component at 284.8 eV. High-resolution regions were processed with the MultiPak software (Physical Electronics) and an in-house Python 3.15 script, using a Shirley background and mixed Gaussian–Lorentzian line shapes. For the W 4f region, the W 4f7/2–4f5/2 separation and the doublet area ratio were constrained to 2.17 eV and 4:3, respectively, and the spectral window was extended to include the W 5p3/2 contribution near 41.6 eV. The Cu 2p region was described by the Cu2+ multiplet envelope and its shake-up satellites, and the Cu LMM Auger region was used to discriminate Cu+ from Cu0 [62]; the Fe 2p region was described by an Fe3+ multiplet model including both satellites near 719 and 733 eV [63,64]. For the used WO3, the C 1s, F 1s and S 2p regions were also acquired to verify the presence of residual ionomer [65].
2.10. Use of Generative Artificial Intelligence
Generative artificial intelligence tools were used to assist in structuring the manuscript, drafting and editing the text, formatting it according to the journal template and assembling multi-panel figures from the original graphs produced by the authors. No experimental data were generated or modified by these tools; all data, analyses and interpretations were produced and verified by the authors.
3. Results and Discussion
3.1. Optical Properties and Spectral Complementarity
Figure 2a reports the UV–Vis absorbance spectra of the individual components of the tandem cell. WO3 exhibits a steep absorption edge at ≈450–470 nm, with an absorbance close to 0.9 below 420 nm and of only ≈0.05 above 520 nm; the photoanode is therefore essentially transparent to visible light of longer wavelength. In contrast, CuFe2O4 absorbs strongly across the whole visible range, with an absorbance above 1 between ≈400 and ≈760 nm and a maximum of ≈1.15 at ≈560 nm, and its absorbance decreases only beyond ≈780 nm, reaching ≈0.23 at 900 nm. The Nafion 117 membrane is highly transparent, with an absorbance lower than 0.08 at 300 nm and of ≈0.02 above 400 nm.
Figure 2.
(a) UV–Vis absorbance spectra of the WO3/FTO photoanode, the Nafion 117 membrane and the CuFe2O4/FTO photocathode in the 300–900 nm range. (b) Spectral distribution of the incident light intensity in the assembled tandem cell, calculated from the absorbance spectra with the Beer–Lambert law: fraction transmitted by WO3, fraction transmitted by the WO3/Nafion 117 assembly, fraction of the incident light absorbed by CuFe2O4, combined photoactive capture of WO3 and CuFe2O4, and fraction of the WO3-transmitted light captured by CuFe2O4.
In this context, the optical budget of the assembled tandem cell was quantified from the absorbance spectra by means of the Beer–Lambert law (Section 2.8), as shown in Figure 2b. The WO3 photoanode acts as a long-pass optical filter: it transmits only ≈12% of the incident light below 420 nm, but ≈89% above 520 nm, while the membrane causes only a minor additional attenuation, so that ≈87% of the incident light above 520 nm reaches the photocathode. The CuFe2O4 layer absorbs ≈80% of the incident photons between ≈520 and 700 nm, i.e., ≈90% of the light transmitted by WO3, and still ≈36% at 900 nm. As a result, the combined photoactive capture of the two photoelectrodes is ≈97% between 300 and 420 nm and ≈90–91% between 500 and 720 nm, exceeding 90% over most of the 300–740 nm range. Since reflection and scattering were neglected, these values should be regarded as upper limits; nevertheless, they validate the spectral complementarity of the WO3/CuFe2O4 pair, in which the photoanode harvests the photons with λ < ≈460 nm and the photocathode collects most of the transmitted visible light, which is the basic requirement of the spectral-splitting tandem concept [14].
3.2. Band Gaps, Flat-Band Potentials and Energy-Level Alignment
Tauc analysis of the absorbance data (Figure S1a,b) yields optical band gaps of 2.75 eV for WO3 and 1.43 eV for CuFe2O4, corresponding to absorption onsets at ≈451 and ≈867 nm, respectively [59,60]. The value obtained for WO3 falls within the 2.6–2.8 eV range commonly reported for monoclinic WO3 films [24,29], whereas the narrow band gap of CuFe2O4 agrees with the visible–near-infrared absorption reported for copper ferrite photocathodes [39,40,41] and with the spectral distribution of Figure 2, confirming the spectral complementarity of the tandem architecture.
Furthermore, the Mott–Schottky plots recorded in N2-purged 0.1 M HClO4 (Figure S1c,d) provide experimental confirmation of the conductivity type of both photoelectrodes. For WO3, the 1/C2 vs. potential plot shows a positive slope, indicative of n-type conductivity, with a flat-band potential (Efb) of +0.38 V vs. RHE (+0.12 V vs. Ag/AgCl); the deviation from linearity at low potentials can be ascribed to the onset of accumulation conditions and to the contribution of surface states [58]. Conversely, the negative slope observed for CuFe2O4 confirms p-type conductivity (the conductivity type of copper ferrite is known to depend on its defect chemistry and preparation conditions [39,66]), with Efb = +0.82 V vs. RHE (+0.56 V vs. Ag/AgCl). The potentials measured vs. Ag/AgCl were converted to the RHE scale with the Nernst equation (pH 1, Equation (7)). Although flat-band potentials determined at a single frequency are approximate [58], the sign of the slopes unambiguously identifies the expected n-type and p-type character of the photoanode and of the photocathode. Since the surface of oxide semiconductors is in protonation equilibrium with the electrolyte, their flat-band potentials typically shift by ≈−59 mV per pH unit, so that the band-edge positions on the RHE scale, which are those relevant for water splitting, are expected to be largely independent of pH [12,58]; the values measured at pH 1 are therefore representative of the acidic environment provided by the ionomer in the device. The Mott–Schottky measurements on CuFe2O4, repeated several times in N2-purged 0.1 M HClO4, gave reproducible plots and flat-band potentials, confirming that the photocathode is stable in this electrolyte under the measurement conditions (Section 2.7). Consistently, the post-operando analyses (Section 3.8, Section 3.9 and Section 3.10) show that even 96 h of operation in contact with the acidic ionomer did not alter the bulk phase or the Cu/Fe ratio of the photocathode.
Based on these experimental values, the energy-level diagram of the tandem cell was constructed (Figure 3). For n-type WO3, the conduction band (CB) edge was placed slightly above Efb (+0.30 V vs. RHE), as commonly assumed for moderately doped n-type oxides, and the valence band (VB) edge was obtained by adding Eg (+3.05 V vs. RHE). For p-type CuFe2O4, the VB edge was approximated by Efb (+0.82 V vs. RHE), and the CB edge was obtained by subtracting Eg (−0.61 V vs. RHE). The VB of WO3 lies ≈1.8 V below the O2/H2O level, ensuring a large thermodynamic driving force for the OER, whereas the CB of CuFe2O4 lies ≈0.6 V above the H+/H2 level, so that photogenerated electrons can reduce protons. Majority carriers, i.e., electrons in WO3 and holes in CuFe2O4, recombine through the external circuit, while the protons released at the photoanode migrate through the Nafion 117 membrane towards the photocathode.
Figure 3.
Schematic operating principle and energy-level diagram of the zero-gap WO3/Nafion 117/CuFe2O4 tandem photoelectrochemical cell. Band-edge positions vs. RHE were derived from the optical band gaps and the flat-band potentials (Figure S1). Under illumination, photogenerated holes in WO3 oxidize water to O2, photogenerated electrons in CuFe2O4 reduce protons to H2, majority carriers recombine through the external circuit, and H+ ions migrate through the Nafion 117 membrane. Circled minus and plus signs denote photogenerated electrons and holes, respectively; grey arrows indicate their transfer to the back contacts and to the reactions at the photoelectrode surfaces, as well as the migration of H+ through the membrane; the arrow labeled e− indicates the electron flow in the external circuit; vertical double-headed arrows indicate the band gaps (Eg); dashed lines mark the H+/H2 and O2/H2O redox levels; the sun symbol indicates illumination through the WO3 photoanode.
Most importantly, the flat-band potential of the photocathode (+0.82 V vs. RHE) is more positive than that of the photoanode (+0.38 V vs. RHE). This defines a potential window of ≈0.4 V in which both photoelectrodes can, in principle, generate photocurrent simultaneously, which is the necessary condition for the bias-free operation of a tandem cell [14]. A similar situation was reported for the WO3–CuCrO2 tandem, whose photocurrent onsets were located at 0.63 and 0.81 V vs. RHE for the photoanode and the photocathode, respectively [24]. By contrast, in our hematite/CuO device the CB of CuO lay slightly below the H+/H2 level, and an external bias was required to reach technologically relevant current densities [43]. In practice, surface recombination and kinetic overpotentials shift the photocurrent onsets with respect to Efb, reducing the effective overlap window and, consequently, the current at the operating point.
3.3. Photoelectrochemical Performance at the Beginning of Test
Figure 4a shows the dark and illuminated J–V curves of the fresh tandem cell at BoT. In the dark, the current density remains below 0.06 mA cm−2 in absolute value over the whole voltage range (≈−0.01 mA cm−2 at 0 V and ≈−0.055 mA cm−2 at −1.3 V), indicating that no appreciable dark electrolysis takes place with these co-catalyst-free oxide electrodes, even at an assisting bias of 1.3 V. Under AM 1.5G illumination, the device exhibits a clear photocathodic response, with a current density of ≈−0.045 mA cm−2 already at 0 V, which demonstrates that the cell is able to operate without external bias, as anticipated by the energy-level diagram. Upon moving to more negative cell voltages, the current density increases steeply between −0.1 and −0.5 V and then levels off at ≈−0.51 to −0.53 mA cm−2 for cell voltages more negative than ≈−0.7 V. The chopped-light curve (5 s light/5 s dark) closely follows the dark and continuous-light curves, with sharp, nearly rectangular transients, indicating a fast photoresponse without pronounced transient spikes. It should be noted that, according to the photodiode convention adopted for the two-electrode measurements (Section 2.5), the assisting bias increases from right to left and the hydrogen-evolution current is negative; in this representation, the photocurrent onset at 0 V, the sigmoidal rise and the plateau are the expected features of a photon-limited tandem device, whose current is fixed by the absorbed photon flux once the applied bias compensates for the kinetic and recombination losses [14]. Consistently, the light and dark segments of the chopped-light curve coincide with the continuous-light and dark curves, respectively, which confirms the reproducibility of the measurements.
From a mechanistic standpoint, the saturation of the photocurrent indicates that, beyond ≈−0.6 V, the current is limited by the generation and separation of charge carriers in the photoelectrodes, i.e., by the absorbed photon flux and the internal quantum efficiency of the limiting absorber, rather than by the applied bias or by ohmic losses. This behavior differs markedly from that of our 10 cm2 hematite/CuO prototype with an anion-exchange membrane, in which the current density increased almost linearly with bias up to ≈−25 mA cm−2 at −1.3 V, i.e., in a predominantly bias-driven, ohmic-limited regime [43]. In the present WO3/CuFe2O4 device, the current is predominantly sustained by illumination, the dark current being only ≈10% of the total current even at −1.3 V, and the external bias mainly assists charge separation.
The photocurrent density (jp) and the throughput efficiency (ηtp, Equation (1)) are reported in Figure 4b as a function of the cell voltage. At −1.0 V, jp = −0.474 mA cm−2 and ηtp reaches 0.699%, with a plateau of ≈0.68–0.70% for cell voltages more negative than ≈−0.6 V, whereas ηtp decreases to ≈0.05% at 0 V. Because the electrical power supplied in the plateau region (|jpVbias| ≤ 0.62 mW cm−2) is lower than 1% of the incident optical power, ηtp is essentially determined by the saturated photocurrent. On this basis, −0.7 V, which corresponds to the onset of the photocurrent plateau, was selected as the bias-assisted operating point for the durability test, together with the bias-free condition (0 V).
3.4. Impedance Analysis at the Beginning of Test
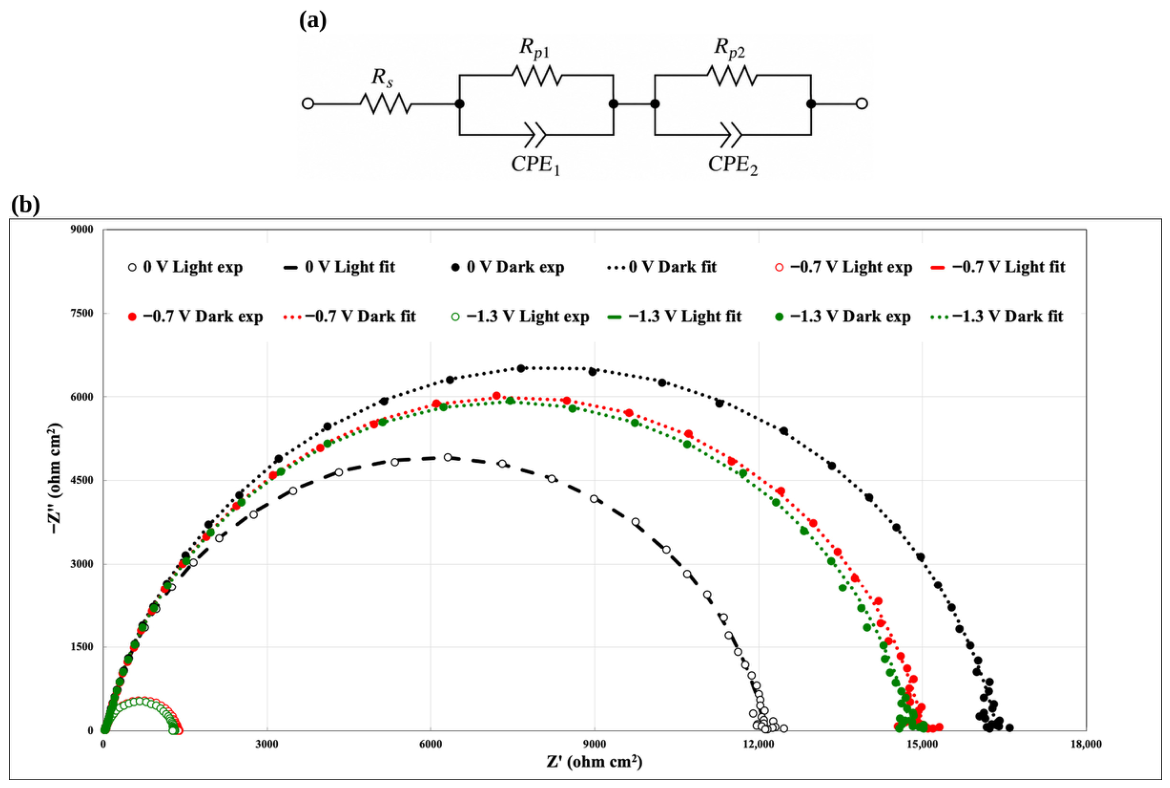
Figure 5b reports the Nyquist plots of the fresh cell recorded at 0, −0.7 and −1.3 V, both in the dark and under AM 1.5G illumination. All spectra consist of a small high-frequency arc followed by a large, moderately depressed low-frequency semicircle. Upon illumination, the diameter of the low-frequency semicircle decreases markedly, particularly at −0.7 and −1.3 V, reflecting the contribution of photogenerated carriers to the interfacial reactions. The spectra were fitted with the Rs(Rp1‖CPE1)(Rp2‖CPE2) equivalent circuit shown in Figure 5a, and the fitting curves closely reproduce the experimental data. The extracted parameters are listed in Table 1, and the characteristic time constants of the two R‖CPE elements, calculated with Equation (4), are reported in Table S1.
Figure 4.
(a) Current density–voltage (J–V) curves of the fresh WO3/Nafion 117/CuFe2O4 tandem cell at the beginning of test (BoT), recorded in the dark, under continuous AM 1.5G illumination (100 mW cm−2) and under chopped illumination (5 s light/5 s dark) at a scan rate of 20 mV s−1. (b) Photocurrent density (jp = jlight − jdark, left axis) and throughput efficiency (ηtp, right axis; Equation (1)) as a function of the cell voltage, derived from the curves in (a).
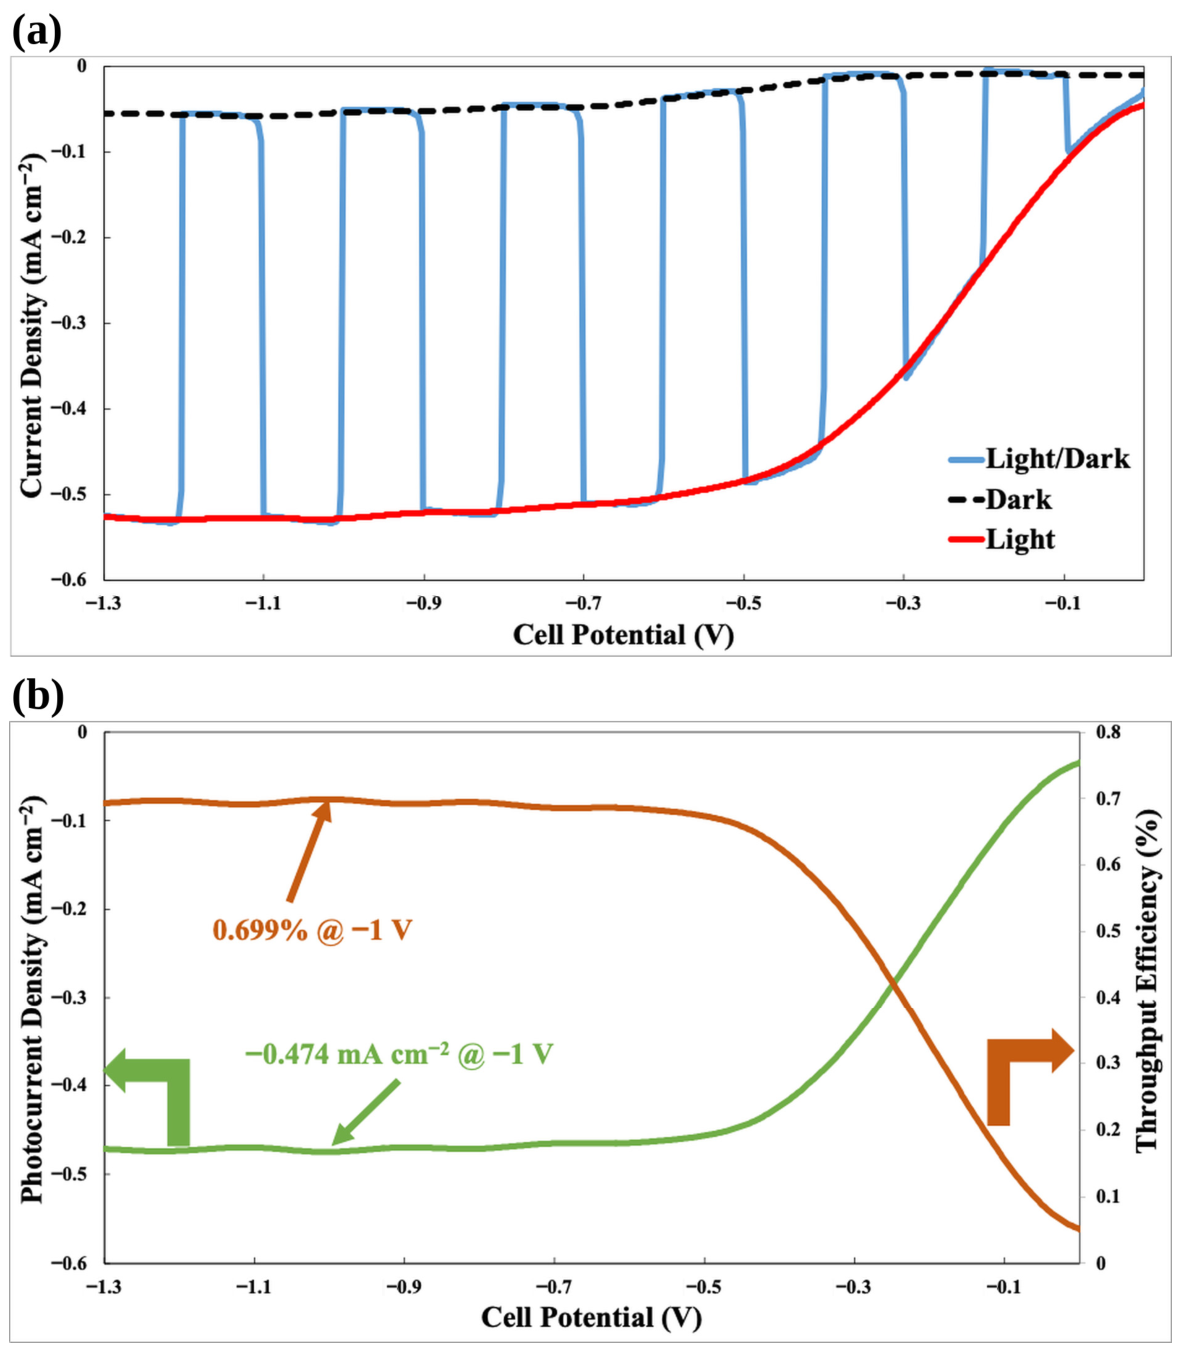
Table 1.
Equivalent-circuit parameters obtained by fitting the EIS spectra of the fresh tandem cell at the beginning of test (BoT) with the Rs(Rp1‖CPE1)(Rp2‖CPE2) circuit shown in Figure 5a.
Figure 5.
(a) Equivalent circuit, Rs(Rp1‖CPE1)(Rp2‖CPE2), used to fit the impedance spectra. (b) Nyquist plots of the fresh tandem cell at the beginning of test (BoT), recorded in the dark and under AM 1.5G illumination (100 mW cm−2) at cell voltages of 0, −0.7 and −1.3 V. Symbols represent experimental data and lines represent the equivalent-circuit fits. The spectra recorded under illumination at −0.7 and −1.3 V, which have a much smaller impedance, appear as the small arcs at Z′ < 1500 Ω cm2; the corresponding fits (red and green dashed lines) largely overlap with the symbols, and the same spectra are shown on an expanded scale in Figure 7b.
The series resistance Rs (14.7–15.2 Ω cm2) remains constant regardless of illumination and cell voltage. This resistance is largely determined by the protonic resistance of the hydrated membrane and by the electronic resistance of the FTO current collectors and contacts, and its value is comparable to that measured for the 10 cm2 anion-exchange membrane prototype (≈16 Ω cm2) [43]. However, at the low current densities of the present device, the associated ohmic drop is only ≈7–8 mV at the photocurrent plateau, confirming that ohmic losses are negligible in this regime, in agreement with the photo-limited shape of the J–V curves.
The high-frequency element (Rp1‖CPE1) shows small resistances (18–36 Ω cm2) and time constants in the microsecond range (τ1 ≈ 0.7–3.6 µs, Table S1), with Rp1 decreasing from 36.0 Ω cm2 (dark, 0 V) to 18.0 Ω cm2 (light, −1.3 V). This contribution is attributed to fast charge-transport processes within the oxide films and across the solid–solid contacts, namely the oxide/FTO and oxide/membrane interfaces. The low-frequency element (Rp2‖CPE2) accounts for more than 97% of the total resistance and governs the device response. In the dark, Rp2 is very large (14.8–16.3 kΩ cm2) and almost independent of the cell voltage, consistent with the negligible dark currents. Under illumination, Rp2 decreases by ≈26% at 0 V (12.1 kΩ cm2) and by ≈91% at −0.7 and −1.3 V (1.33 and 1.26 kΩ cm2, respectively), while the CPE2 parameter Y2 increases approximately 7-fold, from ≈0.27 to 1.92 and 1.80 µS cm−2 sn. The simultaneous decrease in Rp2 and increase in the associated capacitance under illumination is the typical signature of interfacial charge transfer mediated by photogenerated carriers accumulated in surface states, as described for hematite [67,68] and CaFe2O4 [36] photoelectrodes. Therefore, the low-frequency element is assigned to the interfacial charge-transfer processes, i.e., water oxidation at WO3 and proton reduction at CuFe2O4, with characteristic time constants of ≈1.6–1.8 ms in the dark and ≈1.0–1.1 ms under illumination at −0.7 and −1.3 V (Table S1). At 0 V under illumination, the limited decrease in Rp2 reflects the small driving force available at the bias-free operating point, where recombination competes effectively with interfacial charge transfer.
It should be noted that, because the two photoelectrodes are connected in series, the anodic and cathodic interfacial impedances add up, and each R‖CPE element may lump contributions from both electrodes. Overall, the impedance analysis complements the J–V data by quantifying the relative weight of the ohmic and kinetic contributions, and it identifies interfacial charge transfer, rather than series resistance, as the main loss mechanism of the device.
3.5. Durability Under Bias-Free and Bias-Assisted Operation
The long-term stability of the tandem cell was evaluated by chronoamperometry under continuous AM 1.5G illumination for 96 h, according to the two-stage protocol shown in Figure 6: 48 h at 0 V (bias-free operation) followed by 48 h at −0.7 V, i.e., at the onset of the photocurrent plateau (Figure 4a), where the device delivers almost its saturated photocurrent with a minimum assisting bias. Thirty-minute dark intervals were introduced every 12 h as internal reference conditions.
Figure 6.
Potentiostatic durability test of the tandem cell under AM 1.5G illumination (100 mW cm−2): 48 h at 0 V (bias-free operation) followed by 48 h at −0.7 V. Thirty-minute dark intervals were introduced every 12 h as internal reference conditions. The solar-to-hydrogen efficiency at 0 V (STH, Equation (2), calculated assuming a Faradaic efficiency for H2 evolution of 100%) and the throughput efficiency at the end of the −0.7 V stage (ηtp, Equation (1)) are indicated.
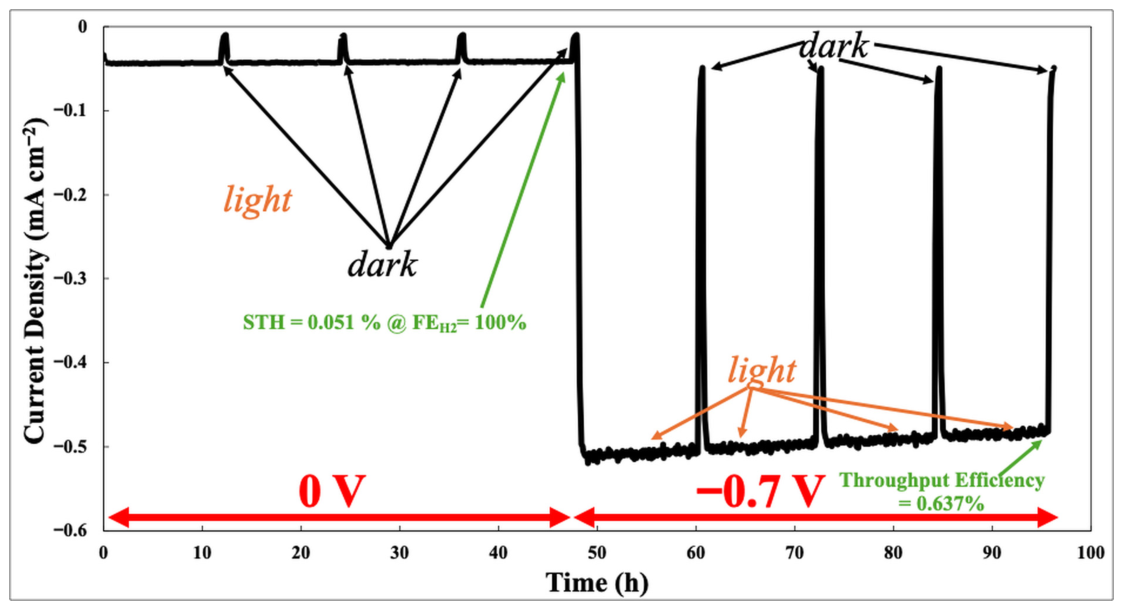
At 0 V, the current density decreases only slightly, from ≈−0.044 to ≈−0.042 mA cm−2 over 48 h. The dark intervals bring the current to ≈−0.011 mA cm−2, and the initial value is immediately recovered upon re-illumination, indicating that the light/dark cycles do not cause irreversible losses. Since the cell was continuously surrounded by flowing N2, the reduction of atmospheric O2 can be excluded; the small cathodic current recorded in the dark at 0 V, which cannot originate from water splitting, is ascribed to the discharge of the charge accumulated in WO3 under illumination (W5+/HxWO3 centers, Section 3.9) and/or to the reduction of traces of photogenerated O2 retained in the hydrated membrane. Its contribution is, however, marginal on the time scale of the test: the charge passed during each 30 min dark interval (≈0.02 C cm−2) is negligible compared with the ≈7.3 C cm−2 passed at 0 V over 48 h and with the ≈93 C cm−2 passed over the whole protocol.
Because the photocurrent of oxide photocathodes may also originate from their photoinduced self-reduction [33,34,39], a charge balance was performed to assess the possible contribution of photocorrosion to the measured current. The CuFe2O4 film contains at most ≈9.5 µmol of Cu and ≈19 µmol of Fe, i.e., the amounts contained in the 1 mL of precursor solution sprayed (Section 2.3). The complete Cu2+→Cu+ reduction in the film would therefore require ≈0.92 C cm−2, and even the complete reduction of all Cu2+ and Fe3+ cations to the metallic state, which is not observed (Section 3.8 and Section 3.9), would require at most ≈7.4 C cm−2, i.e., less than 8% of the ≈93 C cm−2 passed during the whole protocol. At −0.7 V, the Cu2+ → Cu+ reduction capacity of the film would be exhausted in about 30 min, and its complete reduction to the metallic state in about 4 h, whereas the current was sustained at ≈0.5 mA cm−2 for 48 h with a decrease of only ≈6%. In addition, since the two photoelectrodes are connected in series, the same charge must flow through the WO3 photoanode, in which tungsten is already in its highest oxidation state (W6+); the anodic charge therefore cannot be sustained by the self-oxidation of the photoanode and must be associated with the oxidation of water to O2 and, possibly, to peroxo species [32]. Hence, photocorrosion can account for only a minor fraction of the charge passed, and the current must be sustained predominantly by faradaic reactions involving water. Nevertheless, photocorrosion does occur to a limited extent, as shown by the partial Cu2+ → Cu+ reduction detected by XPS (Section 3.9), and it contributes to the slow degradation of the photocathode.
The corresponding STH efficiency (Equation (2)), calculated assuming a Faradaic efficiency of 100% [54], is 0.051%; if only the light-induced component of the current (jlight − jdark ≈ 31 µA cm−2) is considered, a conservative STH value of ≈0.04% is obtained. Although modest in absolute terms, this bias-free current density is about four times higher than that reported for the WO3–CuCrO2 tandem operated in a two-compartment cell with liquid 0.1 M HClO4 (≈10 µA cm−2), and it was sustained for a 16-fold longer time (48 h vs. 3 h) without any liquid electrolyte [24]. It should be noted that the H2 production was not quantified by gas chromatography in this study; therefore, the STH values must be regarded as upper estimates. The crossover of photogenerated O2 through the hydrated membrane and the formation of peroxide species at WO3 in acidic media, which lowered the O2 Faradaic efficiency of a WO3/Nafion photoelectrochemical cell to 47–80% [50,51], may indeed reduce the Faradaic efficiency. In the present 1 cm2 configuration without housing, the gases evolved at the two electrodes are released at the edges of the photoelectrolysis cell into the surrounding N2 atmosphere and can be neither separated nor collected quantitatively; moreover, the expected production rates are very small (≈0.8 µmol h−1 of H2 at 0 V and ≈9 µmol h−1 at −0.7 V, assuming unit Faradaic efficiency), and the H2 produced under bias-free conditions, continuously diluted in the surrounding N2 flow, falls below the detection limit of the available gas-chromatographic set-up. The direct quantification of the Faradaic efficiency is therefore deferred to the scaled-up, housed version of the device (active area of at least 10 cm2), as previously done for our alkaline prototype, for which a H2 purity of 99.95% was measured at the cathode outlet [43].
At −0.7 V, the current density decreases gradually from ≈−0.514 to ≈−0.482 mA cm−2 over 48 h (≈6%, i.e., ≈0.13% h−1), while the dark current remains at ≈−0.05 mA cm−2. At the end of the test, jp ≈ −0.43 mA cm−2 and ηtp = 0.637%. The trace shows no sudden drops, spikes or irreversible losses, which excludes catastrophic failure modes such as membrane dehydration, loss of electrical contact or gas-induced separation of the cell components. Importantly, the smooth decay points to slow, spatially distributed degradation processes rather than to localized failures. From an engineering perspective, this is an encouraging indication, since slow materials-related degradation can be tackled by electrode and interface optimization without changing the cell concept. Such stability is noteworthy, considering that the cell was operated without housing, with water supplied only by periodic wetting of the membrane edges, and is consistent with the unchanged series resistance at EoT (Section 3.6).
3.6. End-of-Test Performance and Impedance Evolution
After the 96 h protocol, the cell was characterized again under the same conditions used at BoT (Figure 7 and Figure S2). The saturated current density under illumination decreased from ≈−0.53 to ≈−0.50 mA cm−2 at −1.3 V (Figure 7a); at −1.0 V, jp decreased from −0.474 to −0.448 mA cm−2 (−5.5%) and ηtp from 0.699% to 0.66% (−5.6%). Conversely, the BoT and EoT curves are almost superimposed in the low-bias region (0 to −0.3 V), and the dark current is unaffected. The degradation therefore mainly affected the saturated photocurrent rather than the photocurrent onset, which is consistent with a partial loss of photoactive area or of light-harvesting capability of the limiting photoelectrode, rather than with a shift in the band-edge energetics.
Figure 7.
Comparison between the beginning of test (BoT) and the end of test (EoT, after the 96 h durability protocol): (a) chopped-light J–V curves under AM 1.5G illumination (100 mW cm−2; scan rate 20 mV s−1); (b) Nyquist plots recorded under illumination at −0.7 and −1.3 V. In (b), symbols represent experimental data and dashed lines represent the equivalent-circuit fits.
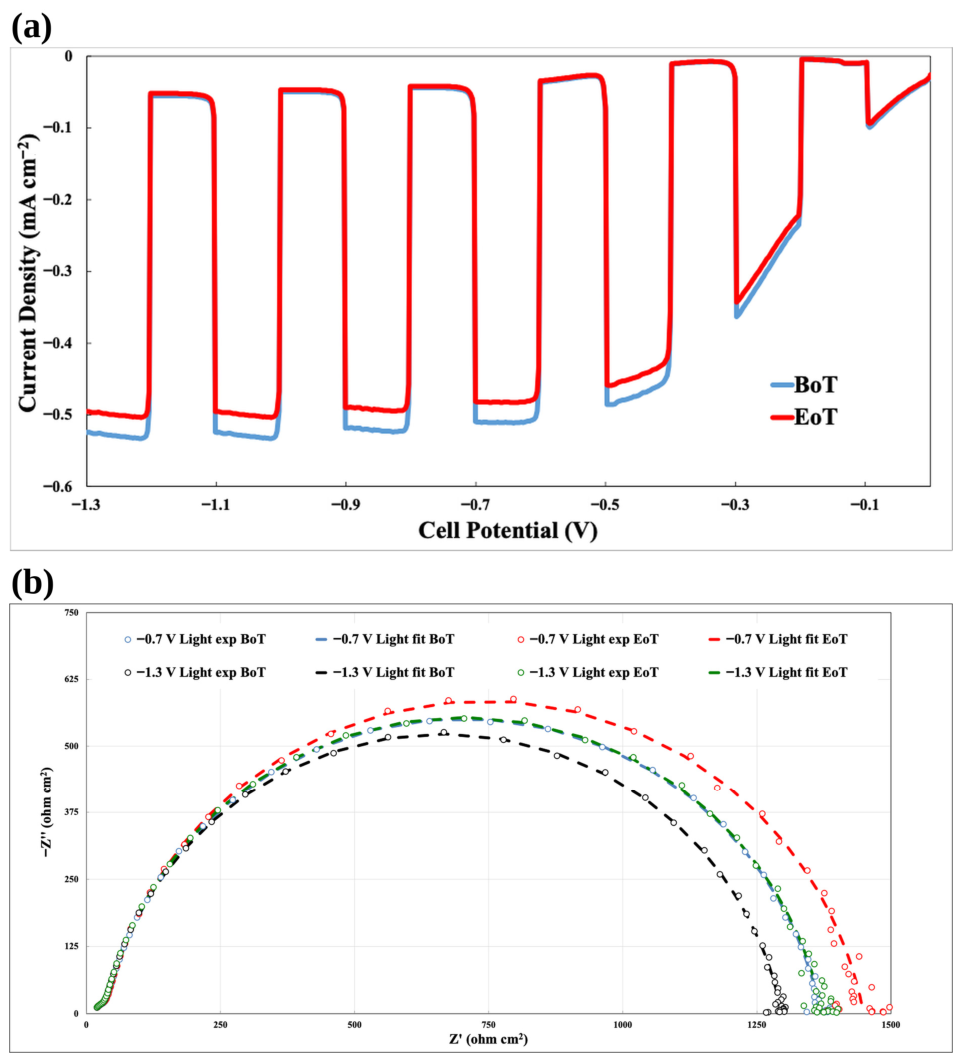
The impedance spectra at EoT (Figure 7b and Figure S3) were fitted with the same equivalent circuit, and the resulting parameters are listed in Table 2. Rs remains unchanged (14.9–15.3 Ω cm2), confirming that the hydration of the membrane and the quality of the contacts were preserved throughout the test, while Rp1 increases only slightly (+3–5%). Under illumination, Rp2 increases by ≈6% at both −0.7 V (from 1333.9 to 1418.9 Ω cm2) and −1.3 V (from 1263.3 to 1343.1 Ω cm2), in close agreement with the ≈5.5% decrease in the saturated photocurrent. In the dark, on the other hand, Rp2 decreases by ≈3% at all cell voltages. The CPE parameters Y1 and Y2 increase in all conditions (+8–10% and +18–26%, respectively), indicating a larger electrochemically active interface and/or a higher density of surface states, in agreement with the surface hydroxylation and the formation of reduced W5+ and Cu+ species revealed by XPS (Section 3.9). The light-induced decrease in Rp2 at −0.7 and −1.3 V remains ≈90% at EoT (vs. ≈91% at BoT), showing that the photoactive charge-transfer mechanism is preserved, whereas the slight decrease in the dark Rp2 suggests the formation of additional parallel pathways, such as recombination through surface states, which do not contribute to the photocurrent. The main performance and impedance descriptors at BoT and EoT are summarized in Table 3.
Table 2.
Equivalent-circuit parameters obtained by fitting the EIS spectra of the tandem cell at the end of test (EoT, after the 96 h durability protocol) with the circuit shown in Figure 5a.
Table 3.
Key performance and impedance descriptors of the tandem cell at the beginning (BoT) and at the end (EoT) of the 96 h durability protocol.
3.7. Distribution of Relaxation Times
Figure 8 compares the DRT profiles extracted from the spectra recorded under illumination at −1.3 V, i.e., at the operating condition with the highest photocurrent. At both BoT and EoT, the distribution is dominated by a single, well-defined peak in the millisecond domain, centered at τ ≈ 9.9 × 10⁻⁴ s and attributed to interfacial charge-transfer and double-layer dynamics. After the durability test, the amplitude of this peak increases from ≈1.06 × 10³ to ≈1.12 × 10³ Ω cm2 (+6%), whereas its position remains essentially unchanged. Minor high-frequency contributions, with amplitudes below 50 Ω cm2, appear at ≈0.8 µs at BoT and at ≈3 µs at EoT.
Figure 8.
Distribution of relaxation times (DRT) profiles extracted from the EIS spectra recorded under AM 1.5G illumination at −1.3 V at the beginning of test (BoT) and at the end of test (EoT, after 96 h). The dominant relaxation process is centered at ≈9.9 × 10⁻⁴ s, with minor high-frequency contributions in the microsecond range.
These features are fully consistent with the equivalent-circuit analysis: the time constants calculated from the fitted parameters with Equation (4) are τ2 = 0.99 and 1.28 ms and τ1 = 0.72 and 3.2 µs at BoT and EoT, respectively (Table S1). The small difference between the τ2 values obtained by the two methods is within the uncertainty arising from the correlation of the CPE parameters and from the smoothing introduced by the regularization [56]. Collectively, these results show that the device response is governed by a millisecond-scale interfacial charge-transfer process, while the microsecond process is associated with the high-frequency Rp1‖CPE1 element. The shift in the latter towards longer relaxation times at EoT is consistent with the increase in Y1 and n1 (Table 1 and Table 2) and may reflect the modification of the solid–solid contacts, namely the ionomer residue on WO3 and the local detachment of CuFe2O4 discussed in Section 3.9 and Section 3.10. Notably, the dominant relaxation of the present device is about one order of magnitude faster than that observed for the hematite/CuO prototype (τ ≈ 10−2 s) [43].
It is worth noting that the smoothing imposed by the Tikhonov regularization can merge closely spaced relaxations; hence, as for the equivalent-circuit analysis, the main peak may comprise partially overlapping contributions of the photoanode and photocathode interfaces [48]. Nevertheless, the agreement between the model-free DRT and the model-based equivalent-circuit approach supports the robustness of the assignment.
3.8. Structural Analysis by X-Ray Diffraction
The XRD patterns of the as-prepared (fresh) and used photoelectrodes are shown in Figure S4. The fresh WO3 film shows the expected reflections of monoclinic WO3 (PDF 43-1035), namely the (002), (020) and (200) triplet at ≈23.1°, 23.6° and 24.4°, the (112) reflection at ≈28.3° and the (140) reflection at ≈50.0°, while the (120) and (202)/(122) reflections overlap with the (110) and (101) reflections of the tetragonal SnO2 of the FTO substrate (PDF 72-1147). The fresh CuFe2O4 film exhibits weak and broad reflections at ≈31.0° and ≈36.4°, indexed to the (200) and (211) planes of tetragonal spinel CuFe2O4 (PDF 34-0425), together with the SnO2 reflections of the substrate. The low intensity of the spinel reflections is consistent with the small thickness and the nanocrystalline nature of the film (Section 3.10), and no reflections of CuO, Cu2O or iron oxides are detected.
After the durability test (Figure S4a), the WO3 reflections are strongly attenuated and broadened: the (002)/(020)/(200) triplet merges into a broad feature between ≈23.5° and 25°, and the (112) and (140) reflections are barely detectable, whereas the SnO2 reflections are retained. All reflections, including those of the substrate, are shifted by ≈+0.3–0.4°, which is attributed to a sample-height displacement rather than to a change in the lattice parameters. These changes indicate a loss of long-range crystalline order in the WO3 film, most plausibly induced by proton insertion and hydration in contact with the strongly acidic ionomer, which can reduce the lattice distortion and generate nanocrystalline disorder [25,29], in agreement with the increase in W5+ species detected by XPS (Section 3.9). Since the W signals in EDS are essentially retained (Figure S5) and the film coverage is preserved (Section 3.10), the attenuation of the reflections cannot be ascribed to a substantial loss of material.
For the used CuFe2O4 (Figure S4b), the (200) reflection is no longer visible, while the (211) reflection is still detectable, and no new reflections of metallic Cu, Cu2O, CuO or iron oxides appear. Hence, no bulk phase transformation of the photocathode occurred within the detection limit of XRD, and the weakening of the spinel reflections is consistent with the partial detachment of the film observed by SEM and/or with a near-surface loss of crystallinity. In short, the XRD comparison reveals a loss of long-range order in WO3 but no bulk phase transformation in either photoelectrode, in sharp contrast with the behavior of CuO in our anion-exchange membrane device, whose reflections almost disappeared after 240 h because of electro-reduction to Cu2O/Cu [43].
3.9. Surface Chemistry by X-Ray Photoelectron Spectroscopy
To complement the bulk-sensitive XRD analysis, surface-sensitive XPS measurements were performed on both photoelectrodes. The high-resolution spectra of the WO3 photoanode before and after the durability test are shown in Figure S6. The surface of the fresh electrode is dominated by W6+, with W 4f7/2 and W 4f5/2 components at 35.6 and 37.7 eV; a minor W5+ doublet at lower binding energy (≈34.5 and ≈36.7 eV) indicates a small concentration of reduced tungsten and oxygen-deficient surface sites, and the W 5p3/2 contribution appears at ≈41.6 eV. After 96 h of operation, W6+ remains dominant, while the W5+ contribution increases moderately. The O 1s region is resolved into lattice oxygen (≈530.2 eV), hydroxyl/oxygen-vacancy-related oxygen (OH/Ov, ≈531.5 eV) and higher-binding-energy adsorbed species (≈532.8 eV); after testing, the lattice-oxygen fraction decreases and both the OH/Ov and the adsorbed-species contributions increase. Overall, these changes are compatible with a mild surface reduction and hydration rather than with a wholesale transformation of the WO3 phase.
Because the used WO3 electrode was in direct contact with Nafion, the high-binding-energy O 1s contribution cannot be assigned exclusively to adsorbed water or intrinsic WO3 defects. The C 1s, F 1s and S 2p regions (Figure S7) reveal, on the used WO3 surface, a CF2-related C 1s component at 292.1 eV, an F 1s peak at ≈688.8 eV (C–Fx) and an S 2p doublet with the 2p3/2 component at ≈168.6 eV (SO3−), which provide an internally consistent signature of residual ionomer [65]; accordingly, the F Kα line is also detected by EDS on the used WO3 (Figure S5). The sulfonate and ether oxygens of the ionomer therefore contribute to the high-binding-energy O 1s intensity of the used electrode. Since Nafion is prone to X-ray-induced degradation during XPS acquisition [65], the ionomer-related signals were evaluated only qualitatively. Notably, the presence of an ionomer layer firmly adhered to WO3 testifies to the intimate contact established at the photoanode/membrane interface in the zero-gap configuration.
The XPS spectra of the CuFe2O4 photocathode (Figure 9) provide direct evidence of the evolution of its surface chemical state after operation. The Cu 2p region is described by the intrinsically broad Cu2+ multiplet envelope (Cu 2p3/2 at ≈933.7 eV) and its intense shake-up satellites at ≈940–945 eV, rather than by unrealistically narrow single components [62,69]. A lower-binding-energy reduced-Cu contribution (≈932.6 eV) is present; however, Cu 2p alone cannot discriminate Cu+ from Cu0. The Cu LMM Auger region was therefore analyzed: the reduced-Cu signal appears at a kinetic energy of ≈917.0 eV and is modeled as Cu+-like, whereas no separate Cu0 component (expected at ≈918.6 eV) is required [62]. The increase in the reduced-copper fraction from the fresh to the used electrode is accompanied by a decrease in the satellite-to-principal-line ratio, as expected when part of the Cu2+ population is reduced. The Fe 2p region is described by an Fe3+ multiplet envelope (Fe 2p3/2 at ≈711 eV) with the characteristic satellites at ≈719 and ≈733 eV; the low-binding-energy component at ≈709.8–710 eV lies within the normal Fe3+ multiplet structure and is therefore not assigned to Fe2+ [63,64]. The fresh and used Fe 2p envelopes remain very similar, supporting the retention of a predominantly Fe3+ surface chemistry during operation. The O 1s spectra corroborate this picture, showing a decrease in lattice oxygen (≈529.9 eV) and an increase in hydroxyl/defect-related oxygen (≈531.3 eV) after testing. In all cases, the fit residuals are comparable to the noise level.
Figure 9.
High-resolution XPS spectra and peak deconvolution of the CuFe2O4/FTO photocathode before electrochemical testing (fresh, left) and after the 96 h durability test (used, right): (a,b) Cu 2p region, fitted with the broad Cu2+ multiplet envelope and shake-up satellites together with a lower-binding-energy reduced-Cu contribution; (c,d) Fe 2p region, described by an Fe3+ multiplet model including the characteristic satellites near 719 and 733 eV, without assigning the low-binding-energy multiplet intensity to a separate Fe2+ species; (e,f) Cu LMM Auger region, used to distinguish Cu+-like from Cu0-like reduced copper; (g,h) O 1s region. Open circles: experimental data; red line: total fit; grey line: Shirley background; shaded areas: fitted components (blue: Cu2+ multiplet in (a,b,e,f) and lattice O in (g,h); green: reduced Cu in (a,b), Cu+-like/Cu(OH)2-like component in (e,f) and OH/defect-related O in (g,h); red: Fe3+ multiplet in (c,d); purple: shake-up and Fe satellites; orange: adsorbed H2O/COx in (g,h)); the residuals (×3) are shown at the bottom of each panel.
Taken together, the modest increase in the Cu+-like component, the preserved Fe3+ multiplet, the unchanged Cu/Fe ratio indicated by EDS (Section 3.10) and the absence of new crystalline copper phases in XRD point to a limited near-surface reduction and hydroxylation of the photocathode rather than to its bulk decomposition. The partial reduction of Cu2+ is ascribed to photogenerated electrons that, instead of being transferred to protons, reduce lattice copper, a self-reduction pathway well known for copper-based photocathodes [33,34].
3.10. Morphology and Composition by SEM-EDS and TEM
FE-SEM images of the fresh and used photoelectrodes are shown in Figure 10. In the fresh WO3 film (Figure 10a), the surface is characterized by a porous network of nanoparticles of a few tens of nanometers, interspersed with platelet-like grains of a few hundred nanometers, which uniformly cover the FTO substrate; the cross-sectional view (inset) shows a continuous layer well adhered to the substrate. After 96 h of operation (Figure 10b), the WO3 layer preserves a continuous coverage of the substrate, highlighting its robust adhesion; however, subtle modifications are evident. The film appears more compact, with coalesced grains, smoother surfaces and fewer platelet-like features, consistent with the surface hydration and the loss of long-range order discussed above.
Figure 10.
Field-emission scanning electron microscopy (FE-SEM) images of the photoelectrodes before electrochemical testing (fresh) and after the 96 h durability test (used): (a) fresh WO3/FTO; (b) used WO3/FTO; (c) fresh CuFe2O4/FTO; (d) used CuFe2O4/FTO. Insets show representative cross-sectional views of the corresponding films on the FTO glass.
In contrast, the fresh CuFe2O4 film (Figure 10c) displays a highly porous morphology formed by agglomerated nanoparticles, which assemble into cauliflower-like clusters of a few hundred nanometers. This open structure is advantageous for the contact with the ionomer and for light harvesting. After extended testing, however, the used CuFe2O4 (Figure 10d) reveals extended regions in which the film has detached and the smooth FTO substrate is exposed, together with compacted agglomerates; the cross-sectional view (inset) shows lifted flakes of the active layer. Because the photocathode film was in intimate contact with the membrane, it cannot be excluded that part of the detachment occurred during the disassembly of the cell; nevertheless, the weak adhesion of CuFe2O4 to FTO is in itself a durability issue for zero-gap operation.
The EDS analysis (Figure S5) provides complementary information on the chemical composition of the films. The fresh WO3 shows the O Kα, W M and W L lines together with the Sn L lines of the substrate; after the test, an additional F Kα signal appears, confirming the presence of the ionomer residue detected by XPS, whereas the W signals are essentially retained. For CuFe2O4, the O, Fe and Cu lines are observed in both fresh and used electrodes, with an almost identical Cu Kα/Fe Kα intensity ratio (≈0.72), indicating that the Cu/Fe stoichiometry within the probed volume was not altered by operation.
TEM images (Figure S8) show that the fresh WO3 consists of nanocrystals of ≈10–20 nm, partly elongated or platelet-like, with well-defined lattice fringes (Figure S8a). After the test (Figure S8b), the WO3 particles appear more rounded and agglomerated (≈8–15 nm) and their edges are less defined, while lattice fringes are still visible in many particles, indicating that crystalline cores are retained beneath a more disordered surface, in agreement with the XRD broadening. The fresh CuFe2O4 consists of rounded nanoparticles of ≈5–15 nm forming aggregates, with visible lattice fringes (Figure S8c), whereas the used material shows denser aggregates with less distinct particle boundaries (Figure S8d). Overall, the combined SEM, EDS and TEM analysis demonstrates that WO3 preserves its coverage, composition and crystalline cores, with only surface modifications, whereas CuFe2O4 retains its stoichiometry but suffers from a local loss of adhesion to the substrate.
Because the photocathode operated in contact with a strongly acidic ionomer, its possible chemical corrosion, i.e., the leaching of Cu and Fe, deserves specific attention. Within the probed volume, EDS indicates an unchanged Cu/Fe intensity ratio, XPS shows a preserved Fe3+ multiplet, and XRD reveals no new crystalline phases; together with the charge balance discussed in Section 3.5, these results indicate that the preferential leaching of either cation, if any, was limited. In the zero-gap configuration, the absence of a circulating liquid electrolyte also limits the transport of dissolved species away from the electrode surface, and any Cu2+ or Fe3+ ions released would be retained by ion exchange at the sulfonic acid groups of the membrane. However, neither the membrane nor the feed water was analyzed for dissolved metals in this study; therefore, a minor leaching, which may contribute to the local loss of adhesion of the film, cannot be excluded. Its quantification by inductively coupled plasma mass spectrometry of the membrane and of the water will be included in future durability studies.
3.11. Degradation Pathways and Implications for Device Design
The combination of electrochemical and post-operando analyses provides a consistent link between device performance and materials stability. At the device level, the invariant series resistance, the smooth current decay and the full recovery after each dark interval show that the cell, although assembled without any housing and fed only by wetting the membrane edges, preserved its ionic and electronic continuity for 96 h. The ≈5–6% decrease in the saturated photocurrent is mirrored by an equivalent increase in the photo-induced charge-transfer resistance and of the amplitude of the dominant DRT peak, while the low-bias response and the time scale of the interfacial process are essentially unchanged.
From a mechanistic perspective, WO3 undergoes a mild surface reduction (increase in W5+ and oxygen-vacancy-related species), hydration and a partial loss of long-range order. In the strongly acidic environment provided by the ionomer, photogenerated electrons that are not promptly extracted, particularly under bias-free conditions, can be charge-compensated by proton insertion, generating W5+ centers and disordered domains; in addition, peroxo species formed during water oxidation in acidic media may contribute to surface corrosion [32]. Nevertheless, the retention of crystalline cores, film coverage and tungsten content shows that WO3 is structurally robust in the zero-gap acidic configuration, and the ionomer residue on its surface testifies to an intimate photoanode/membrane contact. Conversely, CuFe2O4 retains its Fe3+ framework and bulk stoichiometry, but it undergoes a partial Cu2+ → Cu+ reduction and hydroxylation at the surface and, above all, a local loss of adhesion to the FTO substrate. Such detachment reduces the photoactive area and, consequently, the saturated photocurrent without affecting the photocurrent onset, which is exactly what is observed in the J–V curves. Therefore, the CuFe2O4 photocathode, and in particular its adhesion and surface stability in contact with the acidic ionomer, is identified as the lifetime-limiting component of the device, in analogy with the role of CuO in our alkaline hematite/CuO prototype; however, the spinel ferrite proved considerably more robust than CuO, which underwent bulk electro-reduction to Cu2O/Cu after 240 h of operation (Section 3.8).
The relatively high durability of the unprotected CuFe2O4 photocathode deserves comment, since p-type oxide photocathodes are generally susceptible to photocorrosion, either through the reduction of lattice cations by photogenerated electrons or through their oxidation by photogenerated holes [33,34]. Signs of photoreduction have also been reported for CuFe2O4 photocathodes in alkaline media [39]. Several factors are expected to contribute to the stability observed in the present device. First, in the spinel lattice, the Fe3+–O framework, which was preserved during operation (Section 3.9), is expected to confine the reduction of Cu2+ to the near-surface region, whereas in CuO the reduction propagated into the bulk [43]. Second, in the tandem configuration, the photocathode is illuminated only by the photons transmitted by WO3 (λ > ≈460 nm, Section 3.1) and operates at low current densities (≤0.5 mA cm−2), which limits the rate of charge accumulation at its surface. Third, holes are the majority carriers in p-type CuFe2O4 and are continuously extracted through the FTO back contact, where they recombine with the electrons supplied by the photoanode through the external circuit; this efficient extraction limits the oxidative photocorrosion pathway. Fourth, the absence of a liquid electrolyte and the N2 atmosphere surrounding the cell exclude both the attack by atmospheric O2 and the continuous removal of dissolution products by a flowing electrolyte, as discussed in Section 3.10. Nevertheless, the partial Cu2+ → Cu+ reduction and the local delamination show that the photocathode remains the weak point of the device, and protective layers and co-catalysts will be required for operation over thousands of hours.
The different stability of the two photoelectrodes highlights the importance of stabilization strategies for the photocathode. Potential solutions include: (i) the enhancement of the adhesion of CuFe2O4 through optimized spray and annealing parameters or compact interlayers; (ii) thin protective overlayers, such as TiO2 deposited by atomic layer deposition [70,71,72]; (iii) earth-abundant co-catalysts that accelerate the OER at WO3 and the HER at CuFe2O4 and suppress the self-reduction of Cu2+ [46]; (iv) the integration of the optimized WO3/CuFe2O4 pair into the modular, scalable zero-gap platforms already developed for larger active areas [44]; and (v) the replacement of water oxidation at the acid-stable WO3 photoanode with value-added anodic reactions, such as the photoelectrochemical production of peroxydisulfate in bisulfate-containing anolytes, which can be coupled with solar H2 evolution at the photocathode [26].
3.12. Comparison with Other Tandem Cells and Practical Considerations
To place the present results in context, Table 4 compares the main figures of merit of the zero-gap WO3/CuFe2O4 cell with those of representative oxide-based tandem PEC cells and of our previous membrane-based devices. In terms of bias-free efficiency, the present device (STH ≈ 0.05%) remains well below the best all-oxide tandems, such as BiVO4–Cu2O cells, which reached ≈0.5% [20] and ≈3% [73], and below multimediator-modulated cells exceeding 4% [22]. However, these higher efficiencies were obtained in liquid electrolytes at near-neutral or weakly alkaline pH, with co-catalysts (e.g., Co-Pi, RuOx and NiMo) and, for Cu2O, with buried junctions and protective overlayers deposited by atomic layer deposition [20,73]; moreover, the photocurrent of the BiVO4–Cu2O tandem of ref. [20] decayed within minutes because of catalyst detachment. The most directly comparable system is the unprotected, co-catalyst-free WO3–CuCrO2 tandem operated in 0.1 M HClO4 [24]: with respect to that device, the present cell delivers an approximately four-fold higher bias-free current density (≈42 vs. ≈10 µA cm−2) and an approximately eight-fold higher STH efficiency (≈0.05% vs. 0.006%), and it operated for 48 h at 0 V (96 h in total) instead of 3 h, without any liquid electrolyte. In addition, unlike our previous membrane-based devices with hematite and CuO photoelectrodes, which were evaluated under an assisting bias [42,43,74], the present cell operates without any external bias and, under bias, in a photo-limited rather than bias-driven regime.
Table 4.
Comparison of the zero-gap WO3/Nafion 117/CuFe2O4 tandem cell with representative oxide-based tandem photoelectrochemical cells and with our previous membrane-based devices.
Beyond the absolute efficiency, the merits of the present configuration lie in its materials and architecture. (i) Both photoelectrodes consist of earth-abundant, non-critical elements and are prepared by simple, scalable solution-based routes (electrodeposition and spray coating) without co-catalysts or protective layers, so that the intrinsic performance and degradation of the oxide pair can be assessed without the contribution of additional components. (ii) The spectral complementarity of the pair is very favorable: the band gap of CuFe2O4 (1.43 eV) is considerably narrower than those of the photocathodes commonly paired with wide-band-gap photoanodes, such as Cu2O (≈2.0 eV), CaFe2O4 (≈1.9 eV) or CuCrO2 (≈3.1 eV) [19,24,33], so that the photocathode harvests the visible and near-infrared photons transmitted by WO3 up to ≈870 nm, with a combined photoactive capture above 90% over most of the 300–740 nm range (Section 3.1). (iii) The flat-band potential of CuFe2O4 is more positive than that of WO3, which provides the overlap window required for bias-free operation (Section 3.2). (iv) The zero-gap membrane architecture eliminates the liquid electrolyte, keeps ohmic losses negligible (the series resistance of ≈15 Ω cm2 corresponds to an ohmic drop below 10 mV at the plateau current), separates the evolved gases and is directly compatible with the components and manufacturing methods of mature proton-exchange membrane electrolyzers and fuel cells [1], which is a significant advantage in view of scale-up [10,44]. (v) WO3 is one of the few oxide photoanodes that are stable in strongly acidic media [25,26], which makes the combination of WO3 with a proton-exchange membrane a natural choice for acidic operation.
Finally, the choice between acidic (proton-exchange membrane) and alkaline (anion-exchange membrane) tandem cells involves trade-offs that are relevant for practical applications. Acidic devices benefit from the high proton conductivity and the chemical and mechanical robustness of perfluorosulfonic acid membranes, from the fast kinetics of the HER in acidic media and from the maturity of proton-exchange membrane electrolysis, which delivers high-purity hydrogen and allows operation at elevated pressure [1]; moreover, they are not affected by the carbonation issues of alkaline electrolytes [23]. Their main drawbacks are the limited number of photoelectrode materials and earth-abundant catalysts that are stable at low pH, which essentially restricts the choice of oxide photoanodes to WO3 and makes the stability of the photocathode critical, as shown in this work, together with the cost of perfluorinated ionomers and the environmental concerns associated with fluorinated polymers. Conversely, alkaline devices based on anion-exchange membranes allow the use of a wider range of earth-abundant oxides, such as hematite and CuO, and of inexpensive Ni- and Fe-based co-catalysts [3,45,46], and our 10 cm2 hematite/CuO prototype produced H2 with a purity of 99.95% [43]; however, anion-exchange membranes still exhibit lower ionic conductivity and chemical durability than proton-exchange membranes and are sensitive to CO2 uptake [3]. In our alkaline devices, the current was mainly bias-driven and the CuO photocathode underwent bulk electro-reduction after 240 h [43], whereas the present acidic WO3/CuFe2O4 device operates in a photo-limited regime and its photocathode degrades mainly through loss of adhesion. Overall, both approaches remain viable: the acidic route offers mature membrane technology and intrinsically separated, high-purity products, whereas the alkaline route offers a broader choice of materials. For acidic tandem cells, the development of acid-stable photocathodes and of low-cost proton conductors will be key to practical deployment.
4. Conclusions
This work demonstrates a 1 cm2 zero-gap tandem photoelectrochemical cell that relies exclusively on earth-abundant, unprotected and co-catalyst-free oxide photoelectrodes, namely an electrodeposited nanostructured WO3 photoanode and a spray-coated nanostructured CuFe2O4 photocathode, combined with a Nafion 117 proton-exchange membrane acting as solid electrolyte and separator. The cell was assembled without any external housing and operated with deionized water only, showing that a proton-exchange membrane assembly, a well-established component of electrolyzers and fuel cells, can also serve as the core of an all-oxide PEC tandem operating in an acidic environment.
UV–Vis spectroscopy and Tauc analysis confirm band gaps of 2.75 eV (WO3) and 1.43 eV (CuFe2O4), with a combined photoactive capture above 90% over most of the 300–740 nm range, while Mott–Schottky measurements in N2-purged 0.1 M HClO4 establish the n-type and p-type character of the photoanode and of the photocathode, with flat-band potentials of ≈+0.38 and ≈+0.82 V vs. RHE, respectively. With respect to the three questions posed in the Introduction, the following answers can be given:
- (i)
- The zero-gap WO3/Nafion 117/CuFe2O4 tandem cell can indeed operate without external bias, delivering ≈42 µA cm−2 at 0 V (STH ≈ 0.05%, assuming unity Faradaic efficiency) for 48 h with only a minor decrease. Under a moderate assisting bias, the photocurrent saturates at ≈0.5 mA cm−2 for cell voltages more negative than ≈−0.7 V, with a maximum throughput efficiency of 0.70% at −1.0 V, while dark currents remain low (≤0.055 mA cm−2), indicating that the device operates in a photo-limited regime. Charge-balance considerations show that photocorrosion can account for only a minor fraction of the charge passed, and the bias-free current density is about four times higher than that of the unprotected WO3–CuCrO2 tandem operated in liquid 0.1 M HClO4, for a much longer operation time.
- (ii)
- The energy-level alignment, with the flat-band potential of the photocathode more positive than that of the photoanode, accounts for the bias-free operation. The combination of EIS and DRT reveals that the device response is governed by a millisecond-scale interfacial charge-transfer process (τ ≈ 1 ms), whose resistance decreases by ≈91% under illumination at −0.7 and −1.3 V, whereas the ohmic resistance (≈15 Ω cm2) is small and invariant, and a minor microsecond process is associated with charge transport across the solid–solid contacts.
- (iii)
- After 96 h of operation, the saturated photocurrent decreases by only ≈5–6%, in agreement with a ≈6% increase in the photo-induced charge-transfer resistance, while the ohmic resistance and the low-bias response are unchanged. Post-operando analyses show that WO3 undergoes mild surface reduction (W5+), hydration and a partial loss of long-range order, and retains a residual ionomer layer, but preserves its crystalline cores, coverage and composition. CuFe2O4 retains its Fe3+ framework and Cu/Fe stoichiometry, but shows a partial surface Cu2+ → Cu+ reduction and, above all, a local delamination from the FTO substrate, which identifies the photocathode as the lifetime-limiting component of the device.
Overall, these results demonstrate that unprotected, co-catalyst-free oxide photoelectrodes prepared by simple solution-based routes can be integrated into a compact proton-exchange membrane tandem cell capable of stable bias-free photoelectrochemical operation. Future work will focus on improving the adhesion and the surface stability of the CuFe2O4 photocathode, on the integration of earth-abundant co-catalysts and protective overlayers, and on the scale-up of the optimized WO3/CuFe2O4 pair to housed zero-gap devices with active areas of at least 10 cm2, which will also enable the gas-chromatographic quantification of the Faradaic efficiency, as previously done for our alkaline prototype, and the analysis of possible metal leaching from the photocathode.
Supplementary Materials
The following supporting information can be downloaded at https://www.mdpi.com/article/10.3390/nano16211415/s1: Figure S1: Tauc and Mott–Schottky plots of the WO3/FTO photoanode and CuFe2O4/FTO photocathode; Figure S2: J–V curves, photocurrent density and throughput efficiency of the tandem cell at the end of test; Figure S3: Nyquist plots of the tandem cell at the end of test; Figure S4: XRD patterns of the fresh and used WO3/FTO photoanode and CuFe2O4/FTO photocathode; Figure S5: EDS spectra of the fresh and used photoelectrodes; Figure S6: W 4f and O 1s XPS spectra of the fresh and used WO3 photoanode; Figure S7: C 1s, F 1s and S 2p XPS spectra of the fresh and used WO3 photoanode; Figure S8: TEM images of the fresh and used photoelectrode materials; Table S1: Characteristic time constants of the equivalent-circuit elements at the beginning and at the end of test and comparison with the DRT peaks.
Author Contributions
Conceptualization, S.T.; data curation, R.G. and C.A.; formal analysis, R.G.; investigation, R.G. and C.A.; writing—original draft preparation, R.G. and S.T.; writing—review and editing, S.T.; supervision, S.T.; funding acquisition, S.T. All authors have read and agreed to the published version of the manuscript.
Funding
This research was funded by the European Union—NextGenerationEU through the Italian Ministry of Environment and Energy Security, POR H2 AdP MMES/ENEA with the involvement of CNR and RSE, PNRR—Mission 2, Component 2, Investment 3.5 “Ricerca e sviluppo sull’idrogeno”, CUP: B93C22000630006.
Data Availability Statement
The raw data supporting the conclusions of this article will be made available by the authors on request.
Acknowledgments
During preparation of this manuscript, the authors used Microsoft 365 Copilot (web version, September–October 2026; Microsoft Corporation, Redmond, WA, USA) to structure the manuscript, draft and refine the text, format it according to the journal template, and assemble multi-panel figures from the authors’ original graphs. The authors have reviewed and edited the output and take full responsibility for the content of this publication.
Conflicts of Interest
The authors declare no conflicts of interest. The funders had no role in the design of the study; in the collection, analyses, or interpretation of data; in the writing of the manuscript; or in the decision to publish the results.
Abbreviations
The following abbreviations are used in this manuscript:
| AM 1.5G | Air mass 1.5 global solar spectrum |
| BoT | Beginning of test |
| CB | Conduction band |
| CPE | Constant phase element |
| DRT | Distribution of relaxation times |
| EDS | Energy-dispersive X-ray spectroscopy |
| EIS | Electrochemical impedance spectroscopy |
| EoT | End of test |
| FE-SEM | Field-emission scanning electron microscopy |
| FTO | Fluorine-doped tin oxide |
| HER | Hydrogen evolution reaction |
| J–V | Current density–voltage |
| OER | Oxygen evolution reaction |
| Powder Diffraction File | |
| PEC | Photoelectrochemical |
| RHE | Reversible hydrogen electrode |
| STH | Solar-to-hydrogen |
| TEM | Transmission electron microscopy |
| VB | Valence band |
| XPS | X-ray photoelectron spectroscopy |
| XRD | X-ray diffraction |
References
- Carmo, M.; Fritz, D.L.; Mergel, J.; Stolten, D. A Comprehensive Review on PEM Water Electrolysis. Int. J. Hydrogen Energy 2013, 38, 4901–4934. [Google Scholar] [CrossRef] [Scilit]
- Liu, R.-T.; Xu, Z.-L.; Li, F.-M.; Chen, F.-Y.; Yu, J.-Y.; Yan, Y.; Chen, Y.; Xia, B.Y. Recent Advances in Proton Exchange Membrane Water Electrolysis. Chem. Soc. Rev. 2023, 52, 5652–5683. [Google Scholar] [CrossRef] [Scilit] [PubMed]
- Miller, H.A.; Bouzek, K.; Hnat, J.; Loos, S.; Bernäcker, C.I.; Weißgärber, T.; Röntzsch, L.; Meier-Haack, J. Green Hydrogen from Anion Exchange Membrane Water Electrolysis: A Review of Recent Developments in Critical Materials and Operating Conditions. Sustain. Energy Fuels 2020, 4, 2114–2133. [Google Scholar] [CrossRef] [Scilit]
- Du, N.; Roy, C.; Peach, R.; Turnbull, M.; Thiele, S.; Bock, C. Anion-Exchange Membrane Water Electrolyzers. Chem. Rev. 2022, 122, 11830–11895. [Google Scholar] [CrossRef] [Scilit] [PubMed]
- Hauch, A.; Küngas, R.; Blennow, P.; Hansen, A.B.; Hansen, J.B.; Mathiesen, B.V.; Mogensen, M.B. Recent Advances in Solid Oxide Cell Technology for Electrolysis. Science 2020, 370, eaba6118. [Google Scholar] [CrossRef] [Scilit] [PubMed]
- Fujishima, A.; Honda, K. Electrochemical Photolysis of Water at a Semiconductor Electrode. Nature 1972, 238, 37–38. [Google Scholar] [CrossRef] [Scilit] [PubMed]
- Walter, M.G.; Warren, E.L.; McKone, J.R.; Boettcher, S.W.; Mi, Q.; Santori, E.A.; Lewis, N.S. Solar Water Splitting Cells. Chem. Rev. 2010, 110, 6446–6473. [Google Scholar] [CrossRef] [Scilit] [PubMed]
- Sivula, K.; van de Krol, R. Semiconducting Materials for Photoelectrochemical Energy Conversion. Nat. Rev. Mater. 2016, 1, 15010. [Google Scholar] [CrossRef] [Scilit]
- Zhao, Y.; Niu, Z.; Zhao, J.; Xue, L.; Fu, X.; Long, J. Recent Advancements in Photoelectrochemical Water Splitting for Hydrogen Production. Electrochem. Energy Rev. 2023, 6, 14. [Google Scholar] [CrossRef] [Scilit]
- Vilanova, A.; Dias, P.; Lopes, T.; Mendes, A. The Route for Commercial Photoelectrochemical Water Splitting: A Review of Large-Area Devices and Key Upscaling Challenges. Chem. Soc. Rev. 2024, 53, 2388–2434. [Google Scholar] [CrossRef] [PubMed]
- Maggio, G.; Vasta, S.; Nicita, A.; Trocino, S.; Giorgianni, M. Green Hydrogen Generation by Water Photoelectrolysis: Economic and Environmental Analysis. Energies 2025, 18, 1439. [Google Scholar] [CrossRef] [Scilit]
- van de Krol, R.; Grätzel, M. Photoelectrochemical Hydrogen Production; Springer: New York, NY, USA, 2012. [Google Scholar]
- Murphy, A.B.; Barnes, P.R.F.; Randeniya, L.K.; Plumb, I.C.; Grey, I.E.; Horne, M.D.; Glasscock, J.A. Efficiency of Solar Water Splitting Using Semiconductor Electrodes. Int. J. Hydrogen Energy 2006, 31, 1999–2017. [Google Scholar] [CrossRef] [Scilit]
- Prévot, M.S.; Sivula, K. Photoelectrochemical Tandem Cells for Solar Water Splitting. J. Phys. Chem. C 2013, 117, 17879–17893. [Google Scholar] [CrossRef] [Scilit]
- Liu, B.; Wang, S.; Zhang, G.; Gong, Z.; Wu, B.; Wang, T.; Gong, J. Tandem Cells for Unbiased Photoelectrochemical Water Splitting. Chem. Soc. Rev. 2023, 52, 4644–4671. [Google Scholar] [CrossRef] [Scilit] [PubMed]
- Moon, C.; Jung, G.; Min, J.; Shin, B. Earth-Abundant Metal Oxides for Monolithic Tandem Photoelectrochemical Water Splitting Devices: Current Trends and Perspectives. ACS Mater. Lett. 2024, 6, 2919–2940. [Google Scholar] [CrossRef] [Scilit]
- Ohashi, K.; McCann, J.; Bockris, J.O. Stable Photoelectrochemical Cells for the Splitting of Water. Nature 1977, 266, 610–611. [Google Scholar] [CrossRef] [Scilit]
- Ingler, W.B., Jr.; Khan, S.U.M. A Self-Driven p/n-Fe2O3 Tandem Photoelectrochemical Cell for Water Splitting. Electrochem. Solid-State Lett. 2006, 9, G144–G146. [Google Scholar] [CrossRef] [Scilit]
- Ida, S.; Yamada, K.; Matsunaga, T.; Hagiwara, H.; Matsumoto, Y.; Ishihara, T. Preparation of p-Type CaFe2O4 Photocathodes for Producing Hydrogen from Water. J. Am. Chem. Soc. 2010, 132, 17343–17345. [Google Scholar] [CrossRef] [Scilit] [PubMed]
- Bornoz, P.; Abdi, F.F.; Tilley, S.D.; Dam, B.; van de Krol, R.; Grätzel, M.; Sivula, K. A Bismuth Vanadate–Cuprous Oxide Tandem Cell for Overall Solar Water Splitting. J. Phys. Chem. C 2014, 118, 16959–16966. [Google Scholar] [CrossRef] [Scilit]
- Du, C.; Yang, J.; Yang, J.; Zhao, Y.; Chen, R.; Shan, B. An Iron Oxide–Copper Bismuth Oxide Photoelectrochemical Cell for Spontaneous Water Splitting. Int. J. Hydrogen Energy 2018, 43, 22807–22814. [Google Scholar] [CrossRef] [Scilit]
- Ye, S.; Shi, W.; Liu, Y.; Li, D.; Yin, H.; Chi, H.; Luo, Y.; Ta, N.; Fan, F.; Wang, X.; et al. Unassisted Photoelectrochemical Cell with Multimediator Modulation for Solar Water Splitting Exceeding 4% Solar-to-Hydrogen Efficiency. J. Am. Chem. Soc. 2021, 143, 12499–12508. [Google Scholar] [CrossRef] [Scilit] [PubMed]
- Singh, M.R.; Papadantonakis, K.; Xiang, C.; Lewis, N.S. An Electrochemical Engineering Assessment of the Operational Conditions and Constraints for Solar-Driven Water-Splitting Systems at Near-Neutral pH. Energy Environ. Sci. 2015, 8, 2760–2767. [Google Scholar] [CrossRef] [Scilit]
- Díaz-García, A.K.; Gómez, R. A WO3–CuCrO2 Tandem Photoelectrochemical Cell for Green Hydrogen Production under Simulated Sunlight. Molecules 2024, 29, 4462. [Google Scholar] [CrossRef] [Scilit] [PubMed]
- Zheng, G.; Wang, J.; Liu, H.; Murugadoss, V.; Zu, G.; Che, H.; Lai, C.; Li, H.; Ding, T.; Gao, Q.; et al. Tungsten Oxide Nanostructures and Nanocomposites for Photoelectrochemical Water Splitting. Nanoscale 2019, 11, 18968–18994. [Google Scholar] [CrossRef] [Scilit] [PubMed]
- Haider, Z.; Imran, M.; Muhmood, T. Photoelectrochemical Production of Peroxydisulfate (PDS), a Clean Oxidant: Recent Development and Challenges. Int. J. Mol. Sci. 2026, 27, 3066. [Google Scholar] [CrossRef] [Scilit] [PubMed]
- Tacca, A.; Meda, L.; Marra, G.; Savoini, A.; Caramori, S.; Cristino, V.; Bignozzi, C.A.; Gonzalez-Pedro, V.; Boix, P.P.; Gimenez, S.; et al. Photoanodes Based on Nanostructured WO3 for Water Splitting. ChemPhysChem 2012, 13, 3025–3034. [Google Scholar] [CrossRef] [Scilit] [PubMed]
- Zhao, Y.; Balasubramanyam, S.; Sinha, R.; Lavrijsen, R.; Verheijen, M.A.; Bol, A.A.; Bieberle-Hütter, A. Physical and Chemical Defects in WO3 Thin Films and Their Impact on Photoelectrochemical Water Splitting. ACS Appl. Energy Mater. 2018, 1, 5887–5895. [Google Scholar] [CrossRef] [Scilit]
- Costa, M.B.; de Araújo, M.A.; Tinoco, M.V.L.; Brito, J.F.; Mascaro, L.H. Current Trending and Beyond for Solar-Driven Water Splitting Reaction on WO3 Photoanodes. J. Energy Chem. 2022, 73, 88–113. [Google Scholar] [CrossRef] [Scilit]
- Monllor-Satoca, D.; Borja, L.; Rodes, A.; Gómez, R.; Salvador, P. Photoelectrochemical Behavior of Nanostructured WO3 Thin-Film Electrodes: The Oxidation of Formic Acid. ChemPhysChem 2006, 7, 2540–2551. [Google Scholar] [CrossRef] [Scilit] [PubMed]
- Mohd Raub, A.A.; Bahru, R.; Mohd Nashruddin, S.N.A.; Yunas, J. Advances of Nanostructured Metal Oxide as Photoanode in Photoelectrochemical (PEC) Water Splitting Application. Heliyon 2024, 10, e39079. [Google Scholar] [CrossRef] [Scilit] [PubMed]
- Knöppel, J.; Kormányos, A.; Mayerhöfer, B.; Hofer, A.; Bierling, M.; Bachmann, J.; Thiele, S.; Cherevko, S. Photocorrosion of WO3 Photoanodes in Different Electrolytes. ACS Phys. Chem. Au 2021, 1, 6–13. [Google Scholar] [CrossRef] [Scilit] [PubMed]
- Paracchino, A.; Laporte, V.; Sivula, K.; Grätzel, M.; Thimsen, E. Highly Active Oxide Photocathode for Photoelectrochemical Water Reduction. Nat. Mater. 2011, 10, 456–461. [Google Scholar] [CrossRef] [Scilit] [PubMed]
- Siavash Moakhar, R.; Hosseini-Hosseinabad, S.M.; Masudy-Panah, S.; Seza, A.; Jalali, M.; Fallah-Arani, H.; Dabir, F.; Gholipour, S.; Abdi, Y.; Bagheri-Hariri, M.; et al. Photoelectrochemical Water-Splitting Using CuO-Based Electrodes for Hydrogen Production: A Review. Adv. Mater. 2021, 33, 2007285. [Google Scholar] [CrossRef] [Scilit] [PubMed]
- Prévot, M.S.; Guijarro, N.; Sivula, K. Enhancing the Performance of a Robust Sol–Gel-Processed p-Type Delafossite CuFeO2 Photocathode for Solar Water Reduction. ChemSusChem 2015, 8, 1359–1367. [Google Scholar] [CrossRef] [Scilit] [PubMed]
- Díez-García, M.I.; Gómez, R. Investigating Water Splitting with CaFe2O4 Photocathodes by Electrochemical Impedance Spectroscopy. ACS Appl. Mater. Interfaces 2016, 8, 21387–21397. [Google Scholar] [CrossRef] [Scilit] [PubMed]
- Díaz-García, A.K.; Lana-Villarreal, T.; Gómez, R. Sol–Gel Copper Chromium Delafossite Thin Films as Stable Oxide Photocathodes for Water Splitting. J. Mater. Chem. A 2015, 3, 19683–19687. [Google Scholar] [CrossRef] [Scilit]
- Díez-García, M.I.; Gómez, R. Progress in Ternary Metal Oxides as Photocathodes for Water Splitting Cells: Optimization Strategies. Sol. RRL 2022, 6, 2100871. [Google Scholar] [CrossRef] [Scilit]
- Díez-García, M.I.; Lana-Villarreal, T.; Gómez, R. Study of Copper Ferrite as a Novel Photocathode for Water Reduction: Improving Its Photoactivity by Electrochemical Pretreatment. ChemSusChem 2016, 9, 1504–1512. [Google Scholar] [CrossRef] [Scilit] [PubMed]
- Park, S.; Baek, J.H.; Zhang, L.; Lee, J.M.; Stone, K.H.; Cho, I.S.; Guo, J.; Jung, H.S.; Zheng, X. Rapid Flame-Annealed CuFe2O4 as Efficient Photocathode for Photoelectrochemical Hydrogen Production. ACS Sustain. Chem. Eng. 2019, 7, 5867–5874. [Google Scholar] [CrossRef] [Scilit]
- Lin, Z.; Hao, S.; Li, Z.; Hu, J.; Song, A. Elucidation of the Optical, Electronic, and Photoelectrochemical Properties of p-Type CuFe2O4 Photocathodes. Int. J. Hydrogen Energy 2024, 77, 511–519. [Google Scholar] [CrossRef] [Scilit]
- Trocino, S.; Lo Vecchio, C.; Campagna Zignani, S.; Carbone, A.; Saccà, A.; Baglio, V.; Gómez, R.; Aricò, A.S. Dry Hydrogen Production in a Tandem Critical Raw Material-Free Water Photoelectrolysis Cell Using a Hydrophobic Gas-Diffusion Backing Layer. Catalysts 2020, 10, 1319. [Google Scholar] [CrossRef] [Scilit]
- Giaquinta, R.; Giacoppo, G.; Barbera, O.; Arnese, C.; Trocino, S. An Innovative 10 cm2 Tandem Photoelectrochemical Prototype for Water Splitting Based on Non-Critical Raw Materials. Int. J. Hydrogen Energy 2026, 242, 155652. [Google Scholar] [CrossRef] [Scilit]
- Barbera, O.; Lo Vecchio, C.; Trocino, S.; Carbone, A.; Aricò, A.S.; Baglio, V.; Giacoppo, G. Solar to Hydrogen Conversion by a 25 cm2-Photoelectrochemical Cell with Upscaled Components. Renew. Energy 2024, 224, 120154. [Google Scholar] [CrossRef] [Scilit]
- Lo Vecchio, C.; Trocino, S.; Campagna Zignani, S.; Baglio, V.; Carbone, A.; Díez-García, M.I.; Contreras, M.; Gómez, R.; Aricò, A.S. Enhanced Photoelectrochemical Water Splitting at Hematite Photoanodes by Effect of a NiFe-Oxide Co-Catalyst. Catalysts 2020, 10, 525. [Google Scholar] [CrossRef] [Scilit]
- Mancuso, M.A.; Giaquinta, R.; Arnese, C.; Frontera, P.; Macario, A.; Malara, A.; Trocino, S. Experimental Investigation of Nickel-Based Co-Catalysts for Photoelectrochemical Water Splitting Using Hematite and Cupric Oxide Nanostructured Electrodes. Nanomaterials 2025, 15, 1551. [Google Scholar] [CrossRef] [Scilit] [PubMed]
- Siracusano, S.; Trocino, S.; Briguglio, N.; Baglio, V.; Aricò, A.S. Electrochemical Impedance Spectroscopy as a Diagnostic Tool in Polymer Electrolyte Membrane Electrolysis. Materials 2018, 11, 1368. [Google Scholar] [CrossRef] [Scilit] [PubMed]
- Medvedev, D. Distribution of Relaxation Time Analysis for Solid State Electrochemistry. Electrochim. Acta 2020, 360, 137034. [Google Scholar] [CrossRef] [Scilit]
- Sumi, H.; Momai, M.; Fujioka, M.; Yamaguchi, Y.; Hirano, T. Distribution of Relaxation Times Analysis for Electrochemical Impedance Spectroscopy in Proton Exchange Membrane Electrolysis Cells. Electrochemistry 2026, 94, 027008. [Google Scholar] [CrossRef] [Scilit]
- Amano, F.; Shintani, A.; Mukohara, H.; Hwang, Y.-M.; Tsurui, K. Photoelectrochemical Gas–Electrolyte–Solid Phase Boundary for Hydrogen Production from Water Vapor. Front. Chem. 2018, 6, 598. [Google Scholar] [CrossRef] [Scilit] [PubMed]
- Amano, F.; Tsushiro, K. Proton Exchange Membrane Photoelectrochemical Cell for Water Splitting under Vapor Feeding. Energy Mater. 2024, 4, 400006. [Google Scholar] [CrossRef] [Scilit]
- Luo, J.; Hepel, M. Photoelectrochemical Degradation of Naphthol Blue Black Diazo Dye on WO3 Film Electrode. Electrochim. Acta 2001, 46, 2913–2922. [Google Scholar] [CrossRef] [Scilit]
- Zeng, Q.; Li, J.; Bai, J.; Li, X.; Xia, L.; Zhou, B. Preparation of Vertically Aligned WO3 Nanoplate Array Films Based on Peroxotungstate Reduction Reaction and Their Excellent Photoelectrocatalytic Performance. Appl. Catal. B Environ. 2017, 202, 388–396. [Google Scholar] [CrossRef] [Scilit]
- Dotan, H.; Mathews, N.; Hisatomi, T.; Grätzel, M.; Rothschild, A. On the Solar to Hydrogen Conversion Efficiency of Photoelectrodes for Water Splitting. J. Phys. Chem. Lett. 2014, 5, 3330–3334. [Google Scholar] [CrossRef] [Scilit] [PubMed]
- Tikhonov, A.N.; Arsenin, V.Y. Solutions of Ill-Posed Problems; V.H. Winston & Sons: Washington, DC, USA, 1977. [Google Scholar]
- Wan, T.H.; Saccoccio, M.; Chen, C.; Ciucci, F. Influence of the Discretization Methods on the Distribution of Relaxation Times Deconvolution: Implementing Radial Basis Functions with DRTtools. Electrochim. Acta 2015, 184, 483–499. [Google Scholar] [CrossRef] [Scilit]
- Wang, Z.; Wang, Y.; Py, B.; Maradesa, A.; Liu, J.; Wan, T.H.; Saccoccio, M.; Ciucci, F. DRTtools: Freely Accessible Distribution of Relaxation Times Analysis for Electrochemical Impedance Spectroscopy. ACS Electrochem. 2025, 1, 2680–2689. [Google Scholar] [CrossRef] [Scilit]
- Hankin, A.; Bedoya-Lora, F.E.; Alexander, J.C.; Regoutz, A.; Kelsall, G.H. Flat Band Potential Determination: Avoiding the Pitfalls. J. Mater. Chem. A 2019, 7, 26162–26176. [Google Scholar] [CrossRef] [Scilit]
- Tauc, J.; Grigorovici, R.; Vancu, A. Optical Properties and Electronic Structure of Amorphous Germanium. Phys. Status Solidi B 1966, 15, 627–637. [Google Scholar] [CrossRef] [Scilit]
- Makuła, P.; Pacia, M.; Macyk, W. How To Correctly Determine the Band Gap Energy of Modified Semiconductor Photocatalysts Based on UV–Vis Spectra. J. Phys. Chem. Lett. 2018, 9, 6814–6817. [Google Scholar] [CrossRef] [Scilit] [PubMed]
- Klein, J.; Kampermann, L.; Mockenhaupt, B.; Behrens, M.; Strunk, J.; Bacher, G. Limitations of the Tauc Plot Method. Adv. Funct. Mater. 2023, 33, 2304523. [Google Scholar] [CrossRef] [Scilit]
- Biesinger, M.C. Advanced Analysis of Copper X-ray Photoelectron Spectra. Surf. Interface Anal. 2017, 49, 1325–1334. [Google Scholar] [CrossRef] [Scilit]
- Grosvenor, A.P.; Kobe, B.A.; Biesinger, M.C.; McIntyre, N.S. Investigation of Multiplet Splitting of Fe 2p XPS Spectra and Bonding in Iron Compounds. Surf. Interface Anal. 2004, 36, 1564–1574. [Google Scholar] [CrossRef] [Scilit]
- Biesinger, M.C.; Payne, B.P.; Grosvenor, A.P.; Lau, L.W.M.; Gerson, A.R.; Smart, R.S.C. Resolving Surface Chemical States in XPS Analysis of First Row Transition Metals, Oxides and Hydroxides: Cr, Mn, Fe, Co and Ni. Appl. Surf. Sci. 2011, 257, 2717–2730. [Google Scholar] [CrossRef] [Scilit]
- Dzara, M.J.; Artyushkova, K.; Foster, J.; Eskandari, H.; Chen, Y.; Mauger, S.A.; Atanassov, P.; Karan, K.; Pylypenko, S. X-ray Photoelectron Spectroscopy Analysis of Nafion-Containing Samples: Pitfalls, Protocols, and Perceptions of Physicochemical Properties. J. Phys. Chem. C 2024, 128, 8467–8482. [Google Scholar] [CrossRef] [Scilit] [PubMed]
- Huang, Y.-C.; Mohanta, M.K.; Fong, J.-L.; Reyes, A.M.; Reyes-Lillo, S.E.; Jiang, C.-M. Unraveling Defect-Dependent Conductivity-Type Switching in CuFe2O4 for Enhanced Photoelectrocatalytic Reduction of Benzaldehyde. ACS Appl. Mater. Interfaces 2026, 18, 12759–12769. [Google Scholar] [CrossRef] [Scilit] [PubMed]
- Klahr, B.; Gimenez, S.; Fabregat-Santiago, F.; Bisquert, J.; Hamann, T.W. Electrochemical and Photoelectrochemical Investigation of Water Oxidation with Hematite Electrodes. Energy Environ. Sci. 2012, 5, 7626–7636. [Google Scholar] [CrossRef] [Scilit]
- Lopes, T.; Andrade, L.; Le Formal, F.; Grätzel, M.; Sivula, K.; Mendes, A. Hematite Photoelectrodes for Water Splitting: Evaluation of the Role of Film Thickness by Impedance Spectroscopy. Phys. Chem. Chem. Phys. 2014, 16, 16515–16523. [Google Scholar] [CrossRef] [Scilit] [PubMed]
- Biesinger, M.C.; Lau, L.W.M.; Gerson, A.R.; Smart, R.S.C. Resolving Surface Chemical States in XPS Analysis of First Row Transition Metals, Oxides and Hydroxides: Sc, Ti, V, Cu and Zn. Appl. Surf. Sci. 2010, 257, 887–898. [Google Scholar] [CrossRef] [Scilit]
- Hu, S.; Shaner, M.R.; Beardslee, J.A.; Lichterman, M.; Brunschwig, B.S.; Lewis, N.S. Amorphous TiO2 Coatings Stabilize Si, GaAs, and GaP Photoanodes for Efficient Water Oxidation. Science 2014, 344, 1005–1009. [Google Scholar] [CrossRef] [Scilit] [PubMed]
- Lichterman, M.F.; Sun, K.; Hu, S.; Zhou, X.; McDowell, M.T.; Shaner, M.R.; Richter, M.H.; Crumlin, E.J.; Carim, A.I.; Saadi, F.H.; et al. Protection of Inorganic Semiconductors for Sustained, Efficient Photoelectrochemical Water Oxidation. Catal. Today 2016, 262, 11–23. [Google Scholar] [CrossRef] [Scilit]
- Burns, C.; Woodford, O.; Stephens, S.L.; Rishan, M.; Fuller, L.; Kalathil, S.; Gibson, E.A. Interfacing CuO, CuBi2O4, and Protective Metal Oxide Layers to Boost Solar-Driven Photoelectrochemical Hydrogen Evolution. Dalton Trans. 2025, 54, 920–933. [Google Scholar] [CrossRef] [Scilit] [PubMed]
- Pan, L.; Kim, J.H.; Mayer, M.T.; Son, M.-K.; Ummadisingu, A.; Lee, J.S.; Hagfeldt, A.; Luo, J.; Grätzel, M. Boosting the Performance of Cu2O Photocathodes for Unassisted Solar Water Splitting Devices. Nat. Catal. 2018, 1, 412–420. [Google Scholar] [CrossRef] [Scilit]
- Lo Vecchio, C.; Giacoppo, G.; Barbera, O.; Carbone, A.; Baglio, V.; Aricò, A.S.; Monforte, G.; Trocino, S. Scalability and Investigation of the Geometrical Features and Shapes of a Tandem Photo-Electrolysis Cell Based on Non-Critical Raw Materials. Catalysts 2024, 14, 98. [Google Scholar] [CrossRef] [Scilit]
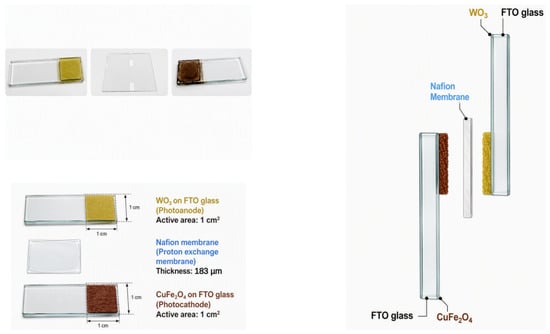
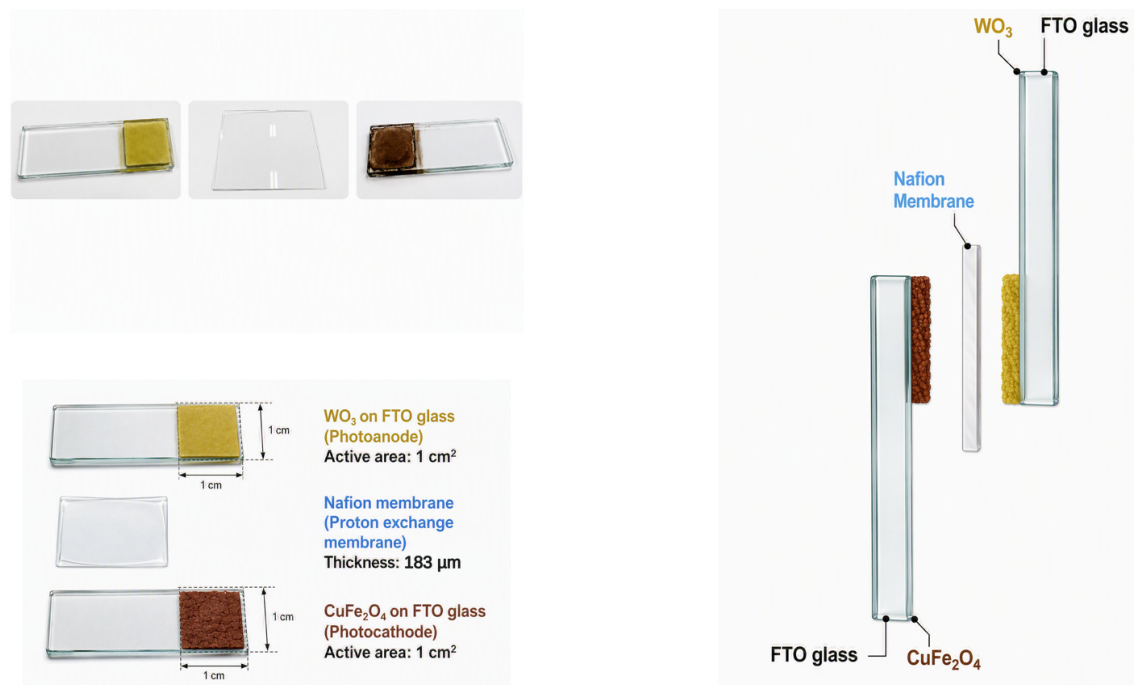
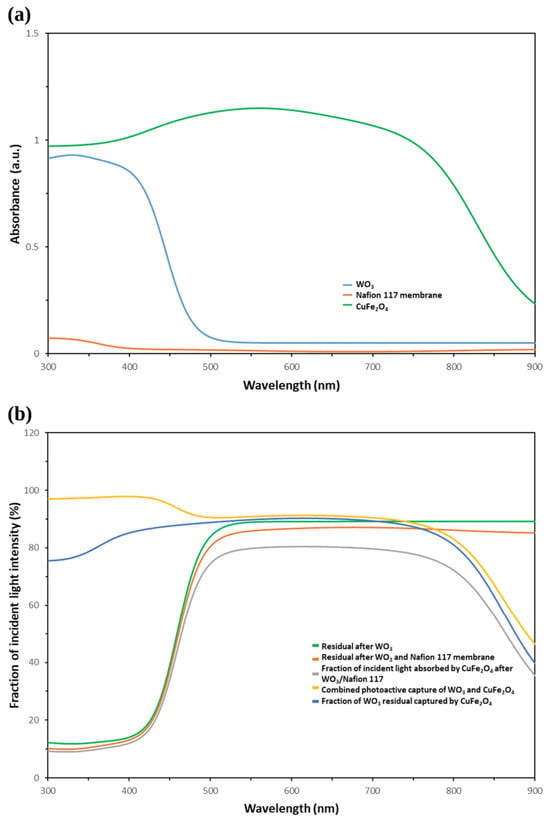
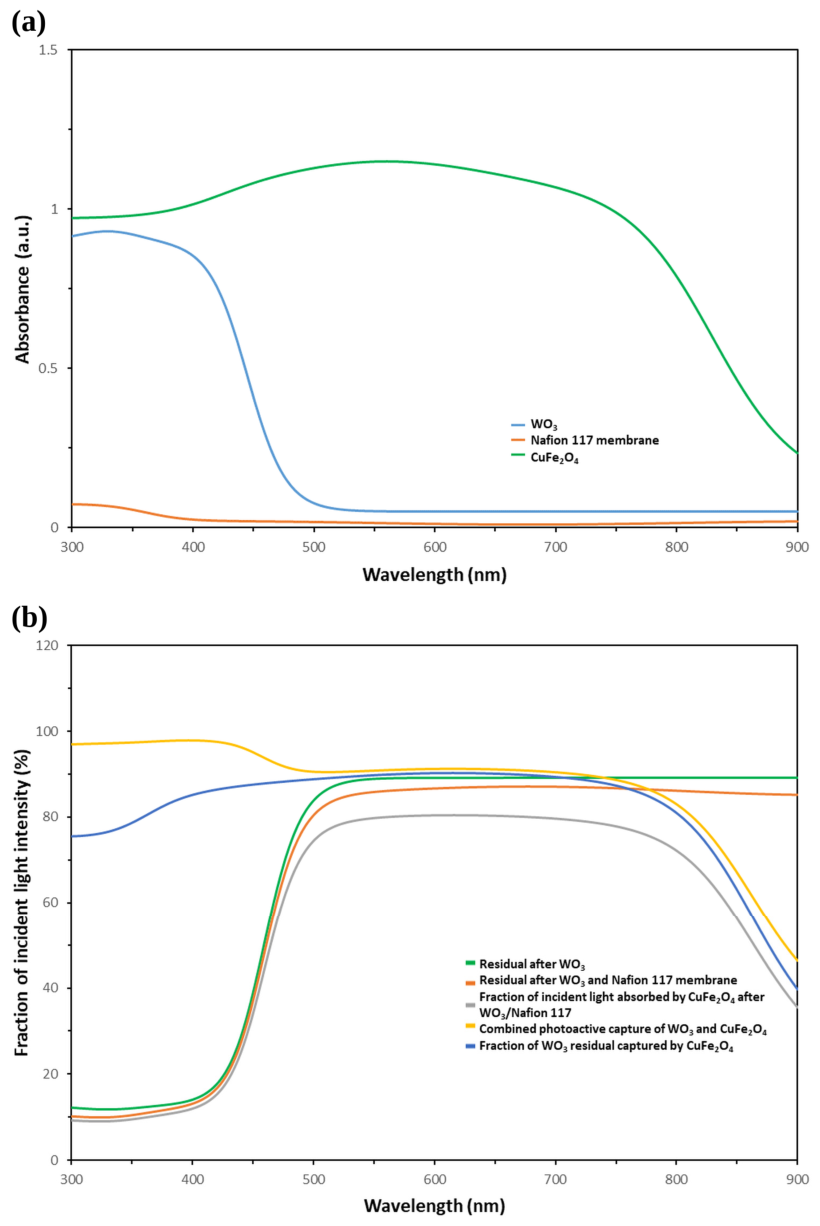
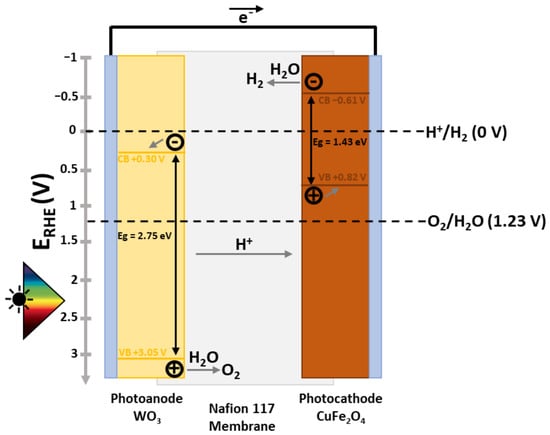
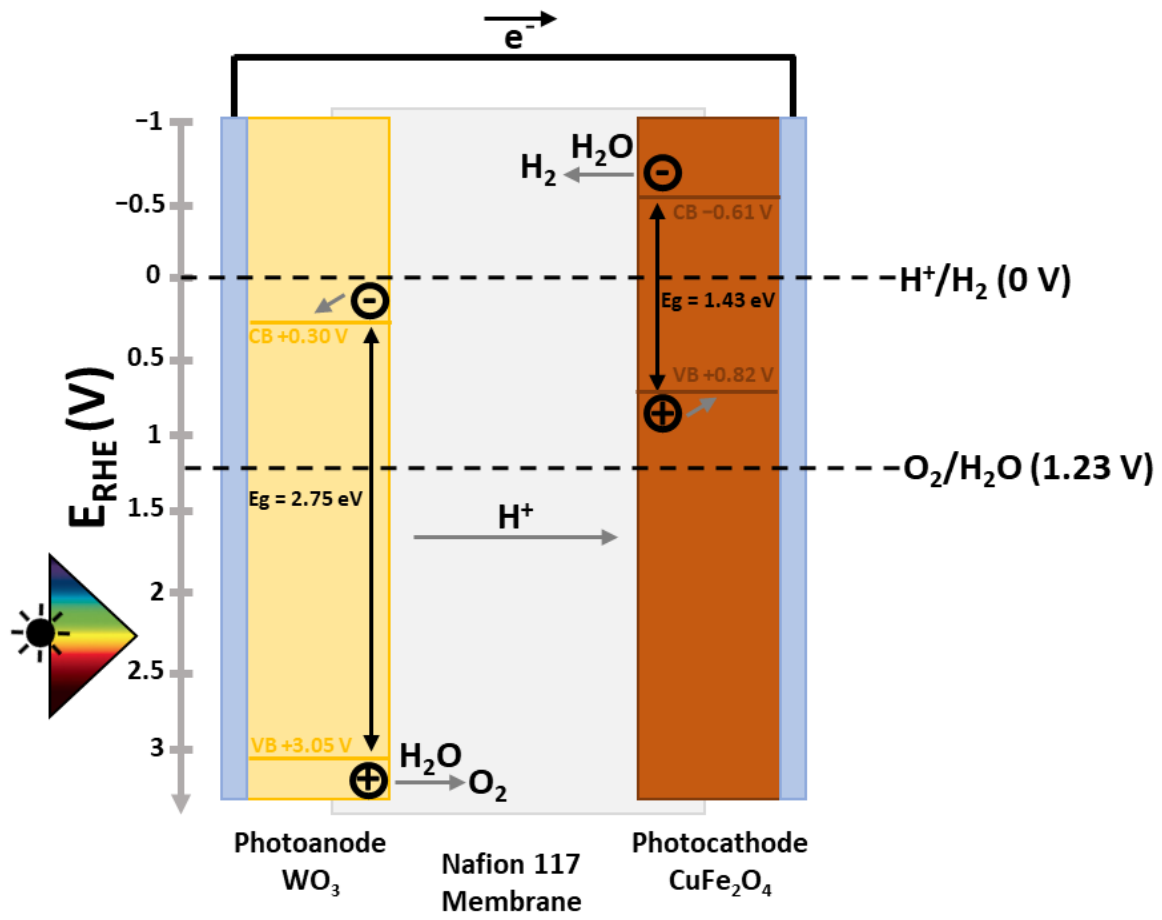
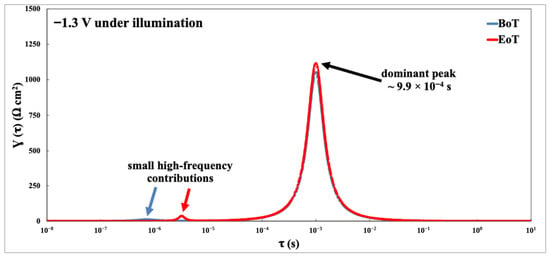
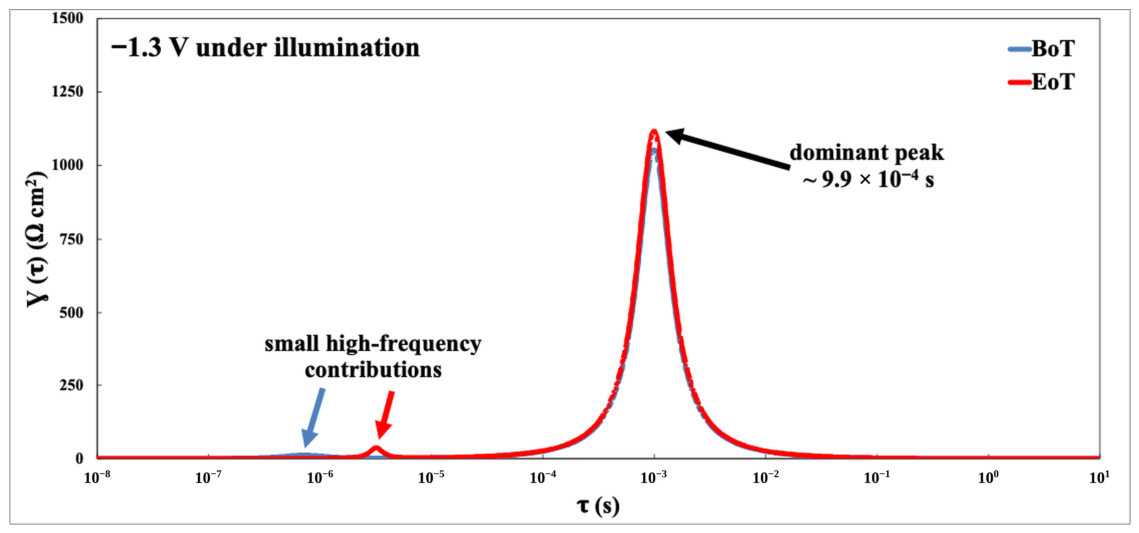
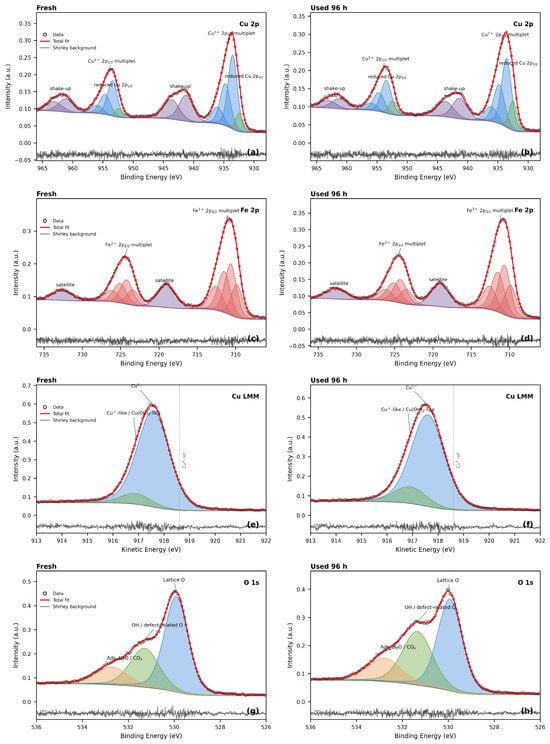
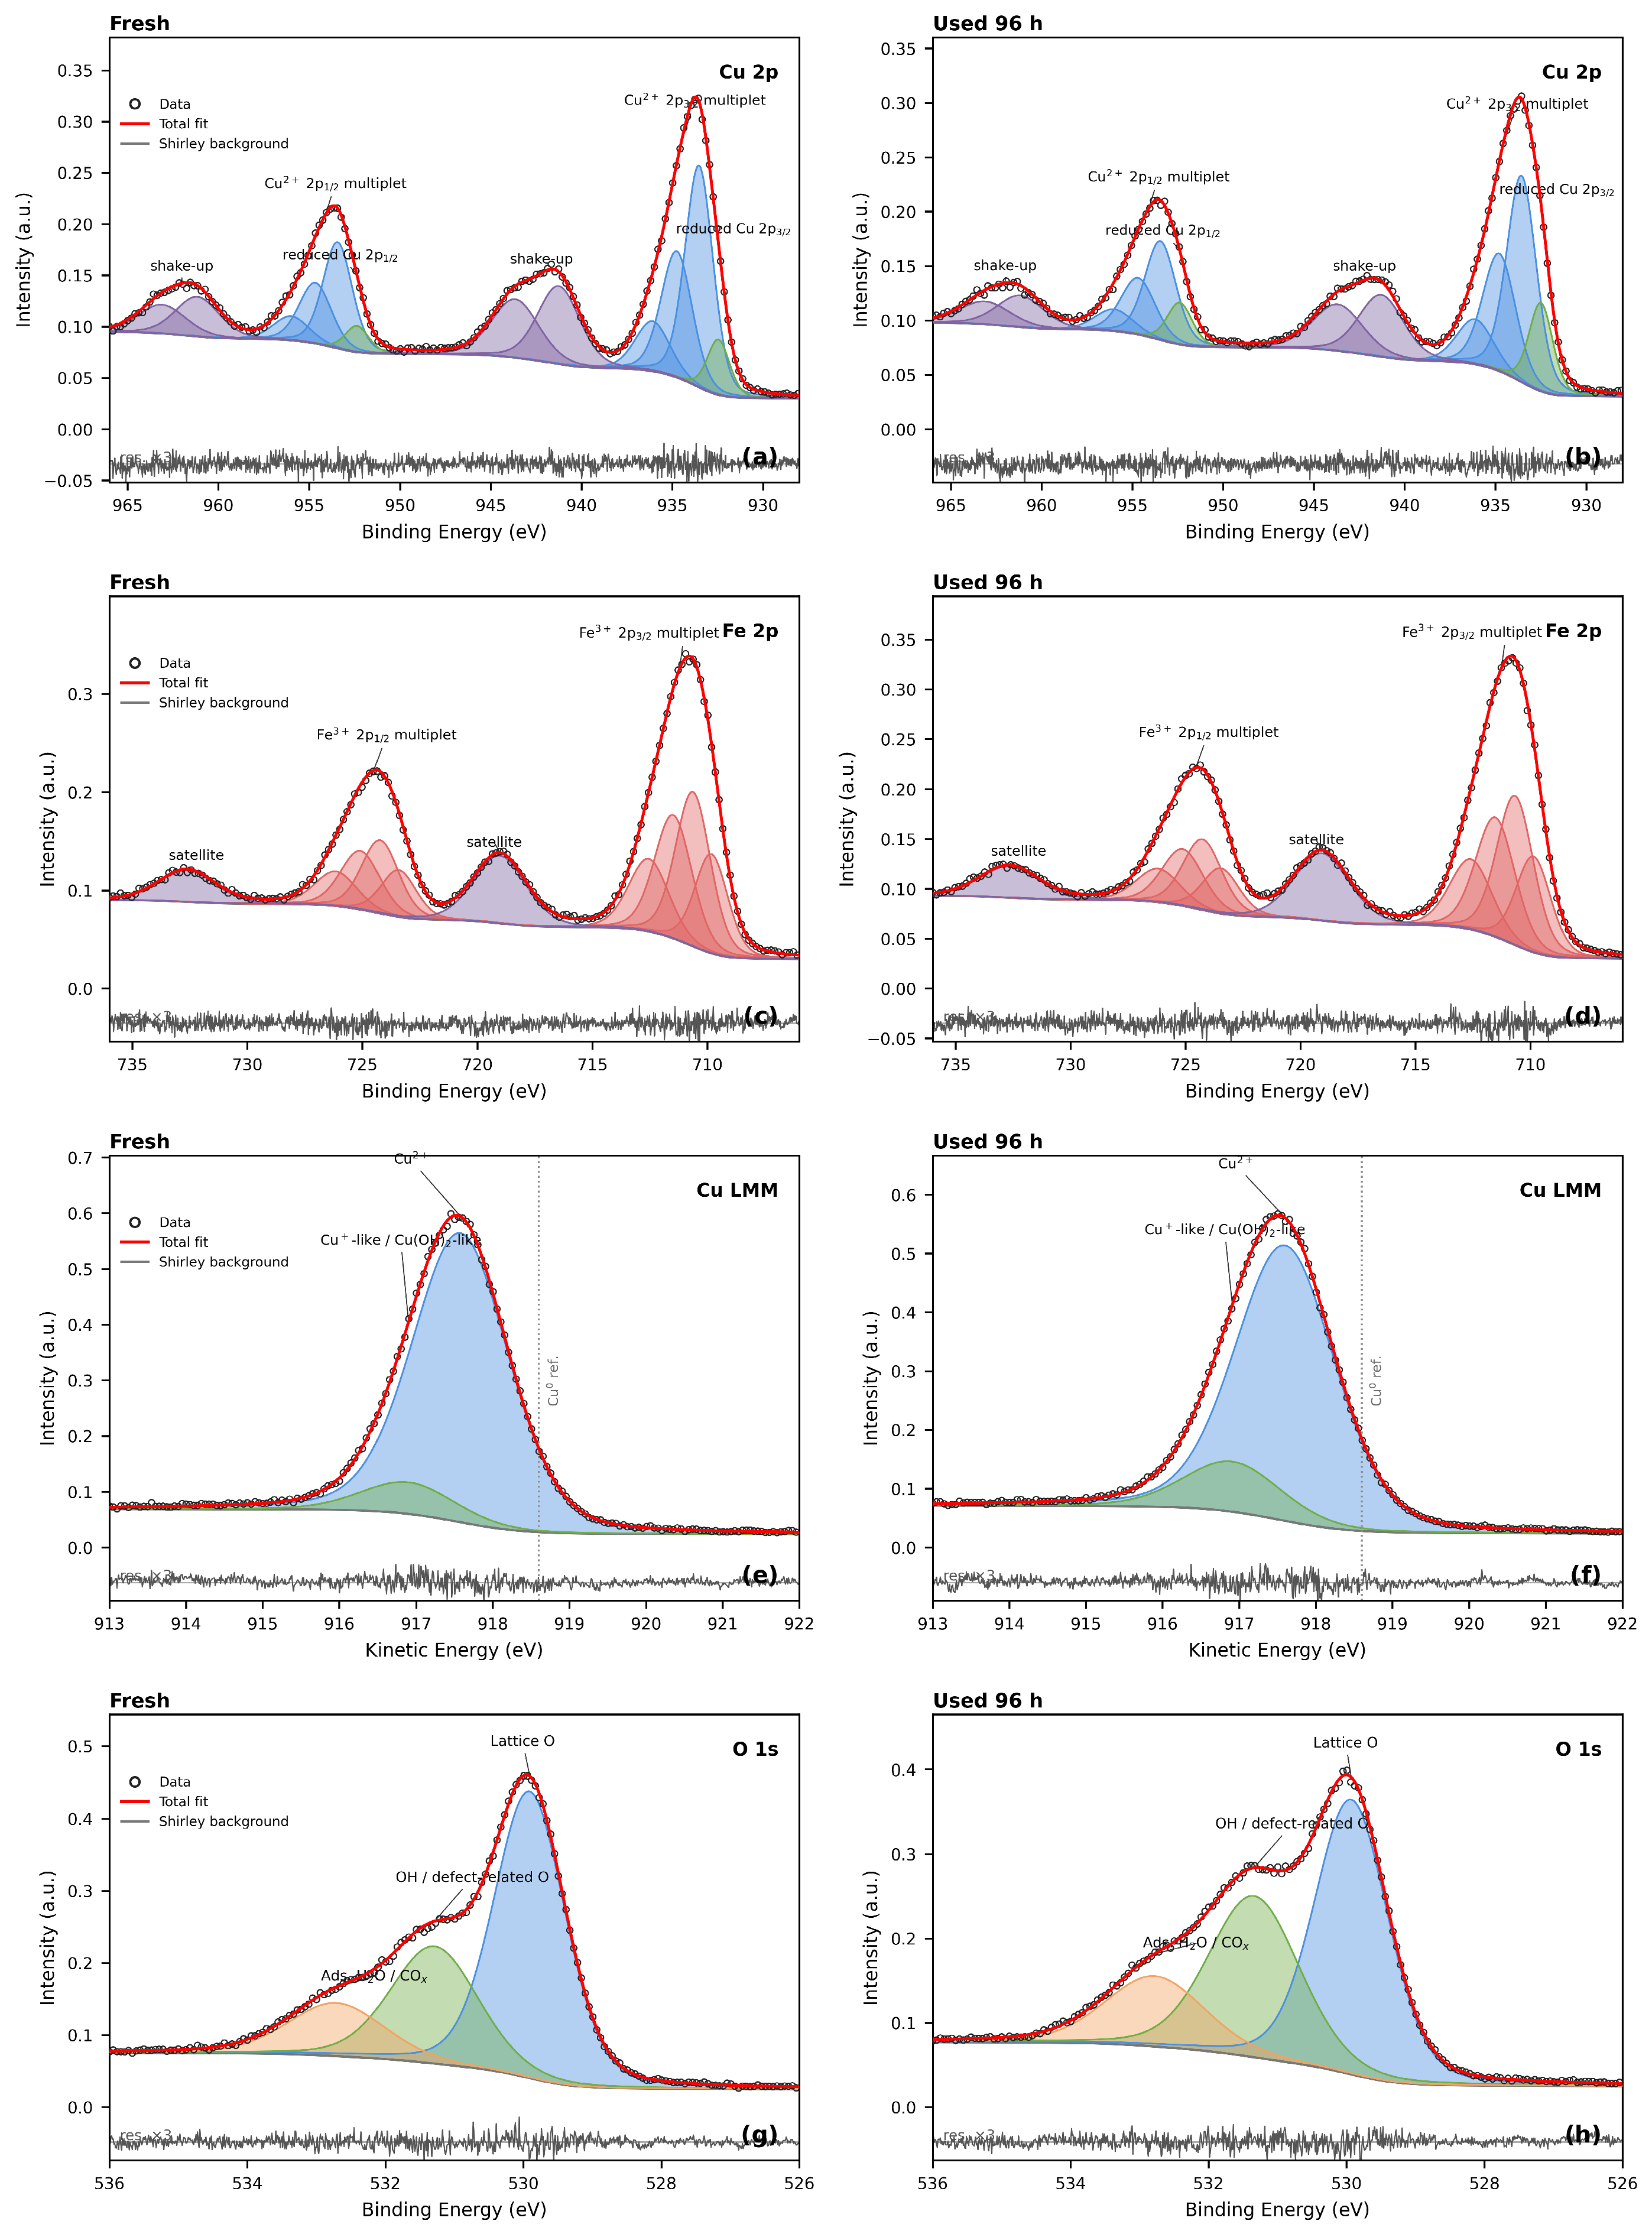
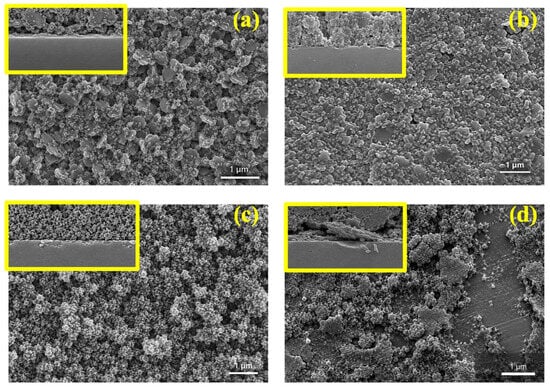
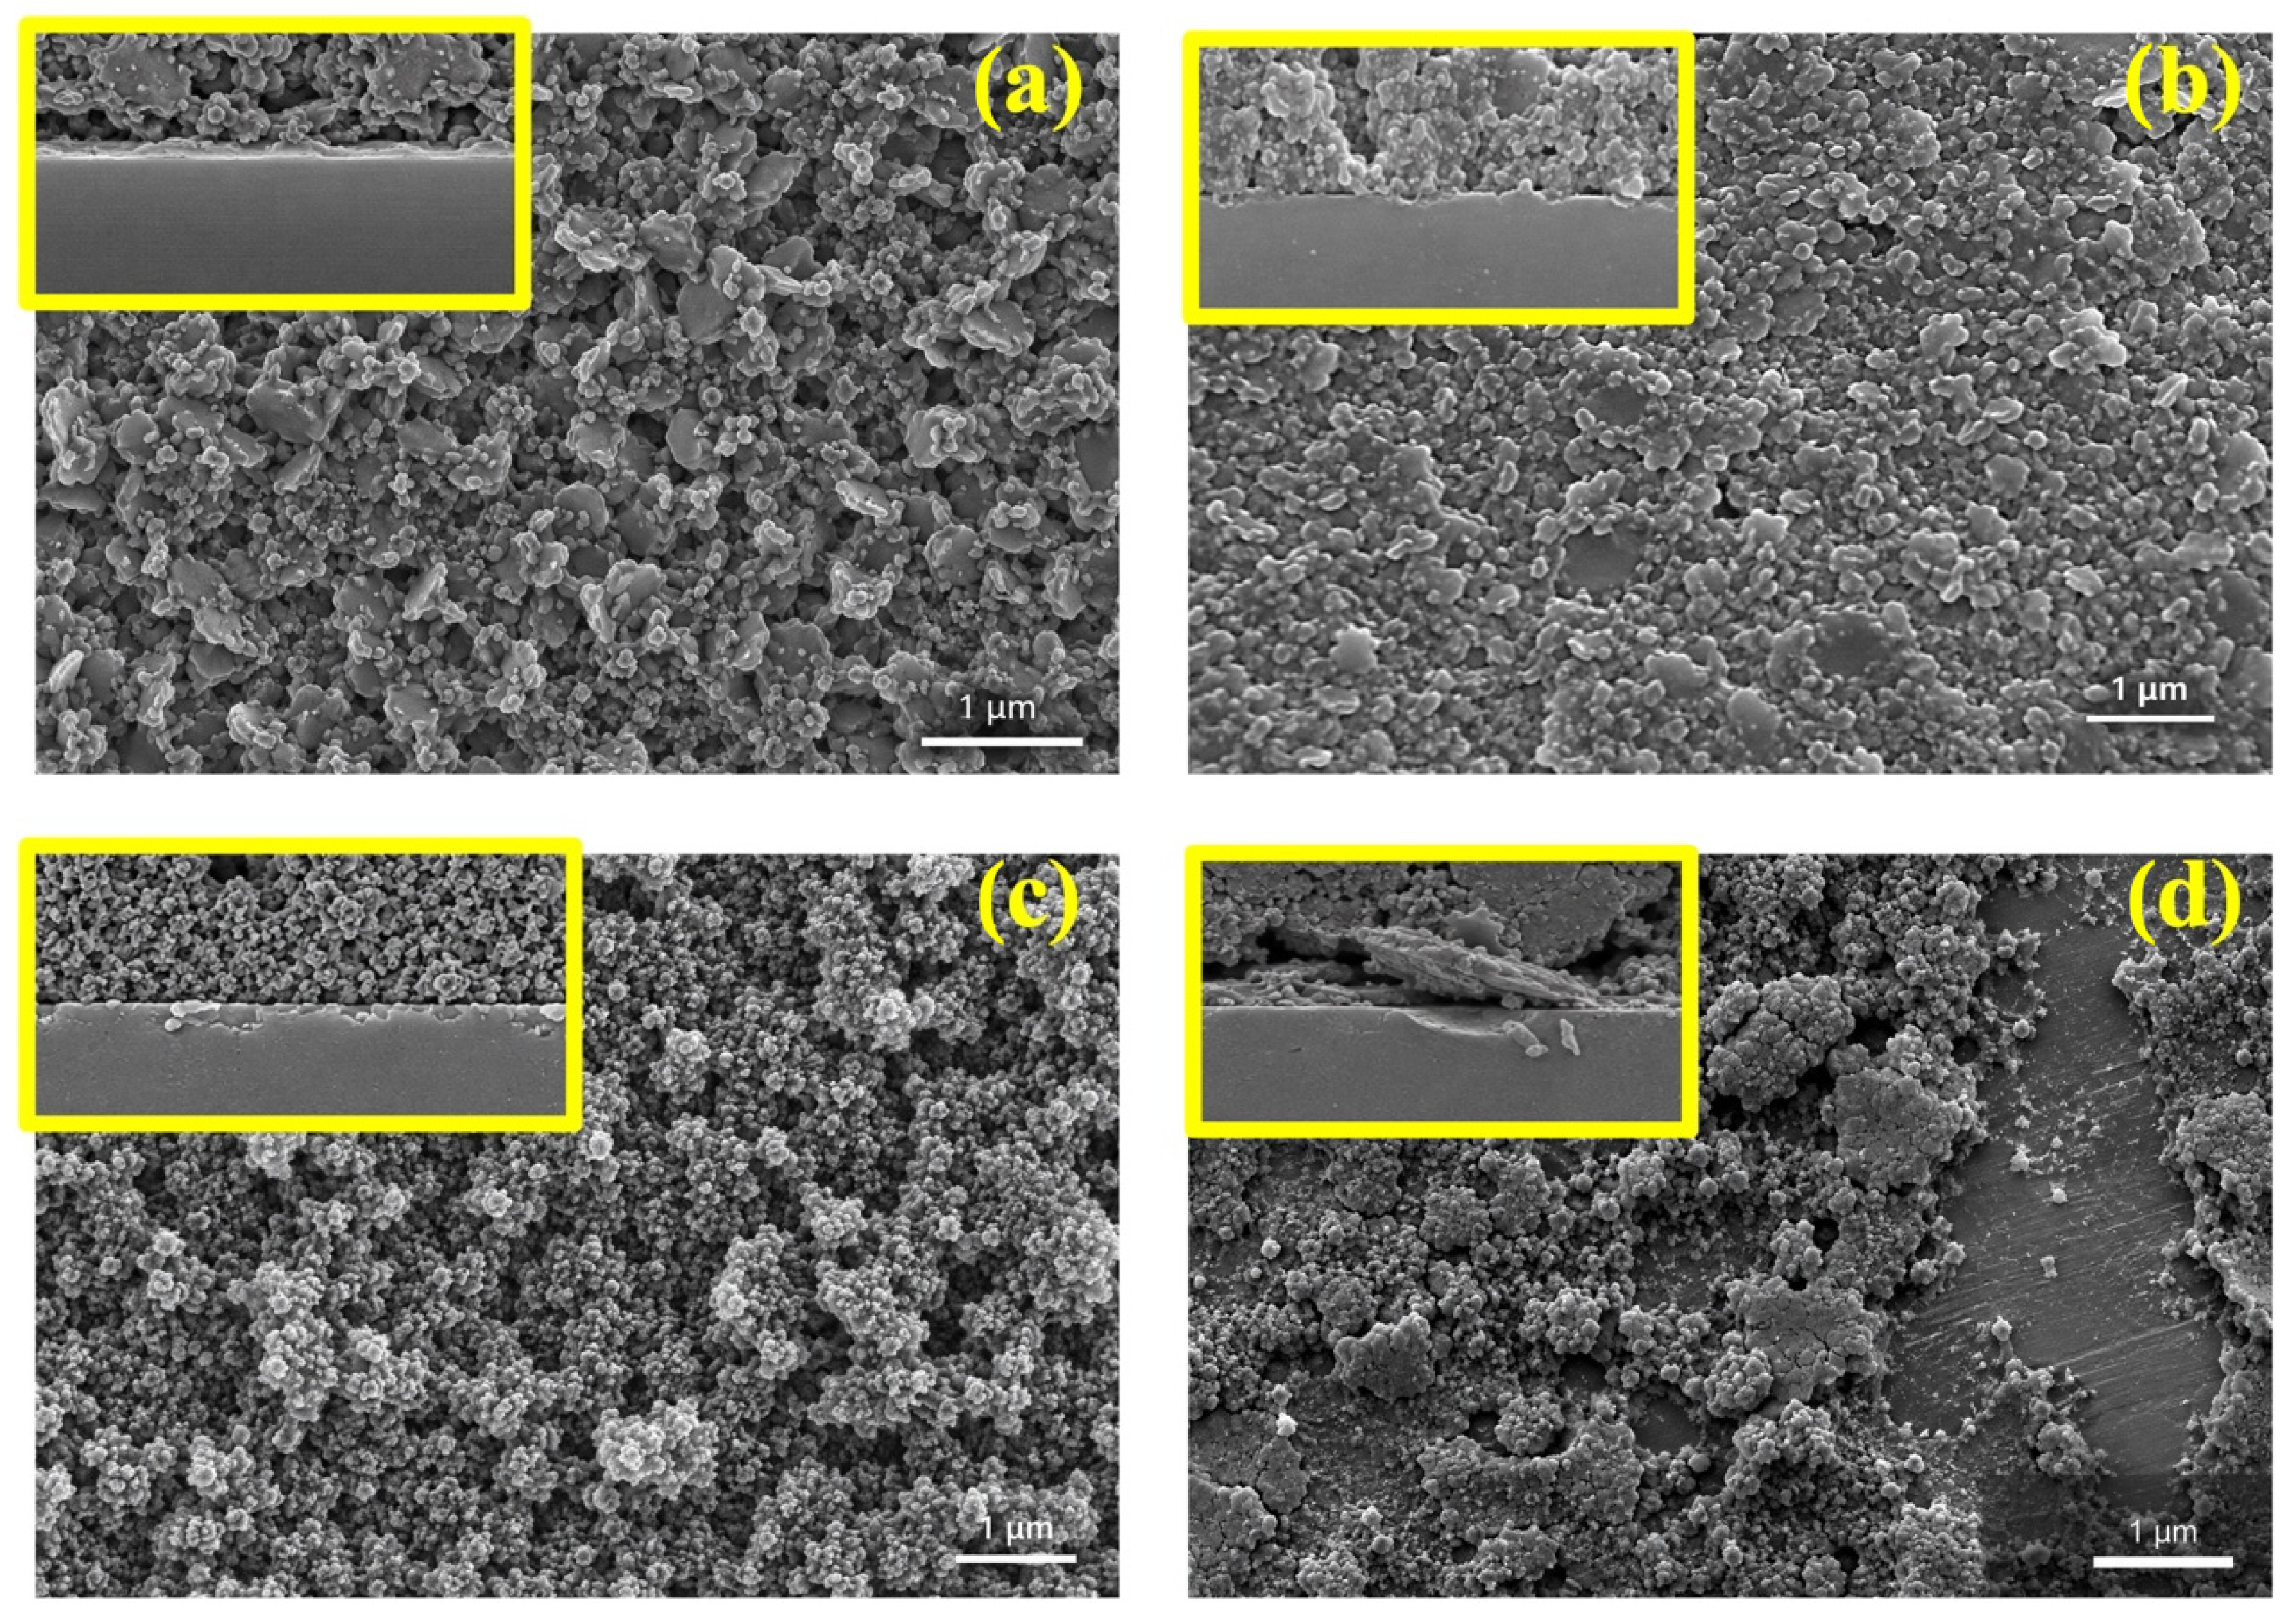

Disclaimer/Publisher’s Note: The statements, opinions and data contained in all publications are solely those of the individual author(s) and contributor(s) and not of MDPI and/or the editor(s). MDPI and/or the editor(s) disclaim responsibility for any injury to people or property resulting from any ideas, methods, instructions or products referred to in the content. |
© 2026 by the authors. Licensee MDPI, Basel, Switzerland. This article is an open access article distributed under the terms and conditions of the Creative Commons Attribution (CC BY) license.