Abstract
Off-stoichiometric NixFe3−xO4 ultrathin films (x < 2.1) with varying Ni content x and thickness 16 (±2) nm were grown on MgO(001) by reactive molecular beam epitaxy. Synchrotron-based high-resolution X-ray diffraction measurements reveal vertical compressive strain for all films, resulting from a lateral pseudomorphic adaption of the film to the substrate lattice without any strain relaxation. Complete crystallinity with smooth interfaces and surfaces is obtained independent of the Ni content x. For x < 1 an expected successive conversion from Fe3O4 to NiFe2O4 is observed, whereas local transformation into NiO structures is observed for films with Ni content x > 1. However, angle-resolved hard X-ray photoelectron spectroscopy measurements indicate homogeneous cationic distributions without strictly separated phases independent of the Ni content, while X-ray absorption spectroscopy shows that also for x > 1, not all cations are substituted by cations. The ferrimagnetic behavior, as observed by superconducting quantum interference device magnetometry, is characterized by decreasing saturation magnetization due to the formation of antiferromagnetic NiO parts.
1. Introduction
Transition metal ferrites with a (inverse) spinel structure represent a promising class of oxide-based materials for applications in, for example, spincaloritronics or spintronics [1,2,3,4] due to several intriguing properties, like significant magnetic saturation moments and high Curie temperatures [5]. In the field of spintronics, inverse spinel ferrites like NiFe2O4 and CoFe2O4 are suitable for application as a spin filter [6,7,8,9], where highly spin-polarized tunneling currents are generated. The insulating and ferrimagnetic properties of nickel and cobalt ferrite with an exchange splitting of the energy levels in the conduction band result in different tunneling probabilities for the two spin orientations, which make these ferrites highly suited as spin filters [4]. However, the spin-filter efficiency is crucially determined by the structural quality of the tunneling barrier [8] and its interfaces [10]. Thus, ferrites have to be prepared as thin films with low defect densities to obtain a high transmission of spin-polarized tunneling currents.
Here, MgO(001) is well suited as a substrate for NiFe2O4 films since both materials show a cubic crystalline structure and their lattice mismatch is small. Comparing the lattice constant = 833.9 pm of NiFe2O4 (inverse spinel structure) with twice the lattice constant = 421.2 pm of MgO (rocksalt structure), the lattice mismatch is only −1.0%. Hence, only small-strain and low-defect densities are expected when depositing ultrathin NiFe2O4 films on MgO(001). However, due to the almost doubled ferrite (inverse) spinel lattice constant compared to the one of the rocksalt lattice constant of MgO(001), antiphase boundaries (APBs) are likely to emerge and represent a small drawback in the use of substrates with an almost half-sized lattice constant.
Here, we like to study ultrathin films of Ni ferrite (NFO = NixFe3−xO4) with variable Ni content x. Thus, lattice matching of magnetite Fe3O4 (NFO with x = 0, inverse spinel) and NiO (NFO in the limit of no Fe content, rocksalt) have to be considered, too. Compared to MgO, the lattice mismatch of Fe3O4 ( = 839.6 pm) and NiO ( = 419.5 pm) is only −0.3% and −0.4%, respectively. Thus, it is expected that MgO(001) substrates are also well suited for epitaxy of such oxide films.
For the inverse spinel structure of NiFe2O4, on the one hand, Ni cations are in oxidation state 2+ and are octahedrally coordinated (occupation of B-sublattice sites). On the other hand, Fe cations are in oxidation state 3+. Half of them are octahedrally coordinated (occupation of B-sublattice sites), while the other half is tetrahedrally coordinated (occupation of A-sublattice sites). Due to the super exchange and double exchange between the different cations, the magnetization is effectively produced by cations. Neglecting orbital contributions due to orbital quenching, the magnetic moment of is 2 . Similar statements are also valid for Fe3O4 (magnetite) in which the role of cations is adopted by cations with magnetic moment of 4 . In NiO, Ni cations are also octahedrally coordinated, but the magnetic order is antiferromagnetic.
Thus, for the Ni ferrite NixFe3−xO4 with varying Ni content x, the chemical composition, i.e., the cationic ratio, as well as lattice site occupation can have a significant impact on their structural, chemical, magnetic, and electronic properties [11,12,13,14]. However, in contrast to investigations focusing on the cationic Co:Fe ratio within CoxFe3−xO4 films [12,13], a systematic study on the influence of the cationic stoichiometry in NixFe3−xO4 films is still lacking. Therefore, we report on our preparation of NixFe3−xO4 thin films on MgO(001) via reactive molecular beam epitaxy (RMBE) and investigate the influence of the cationic stoichiometry on the structural, chemical, and magnetic properties.
The chemical composition and structure of the NixFe3−xO4 film surfaces were characterized in-situ by means of laboratory-based X-ray photoelectron spectroscopy (XPS) and low-energy electron diffraction (LEED), respectively. Further, the bulk structure was analyzed by synchrotron-based high-resolution X-ray diffraction (HR-XRD), whereas film thicknesses were determined by analysis of X-ray reflectivity (XRR) measurements. The chemical composition and cationic valence states in deeper layers were investigated by hard X-ray photoelectron spectroscopy (HAXPES). In addition, angle-resolved HAXPES (AR-HAXPES) measurements reveal information about the depth-dependent cationic stoichiometry. X-ray absorption spectroscopy (XAS) measurements were complementarily conducted to obtain information about the cationic valence states and site occupancies by comparing the data to charge-transfer multiplet (CTM) calculations. Magnetic properties were studied by means of a superconducting quantum interference device (SQUID).
2. Experimental Details
A considerable number of NixFe3−xO4 film with film thicknesses 16 nm and varying Ni content x (0 ≤ x ≤ 2.07) were prepared on MgO(001) substrates via RMBE in an ultra high vacuum (UHV) chamber. Prior to film growth, the substrates were annealed at 400 °C for 1 h in a molecular oxygen atmosphere of 1 × 10⁻⁴ mbar to obtain clean and well-ordered substrate surfaces. The chemical purity and surface structure were controlled after substrate annealing by means of laboratory-based in situ XPS and LEED, respectively. Ultrathin NixFe3−xO4 films were deposited on the cleaned substrates via thermal co-evaporation of Ni and Fe via electron bombardment of the respective pure metal rods in a molecular oxygen atmosphere of 5 × 10⁻⁶ mbar, while the substrate temperature was controlled to 250 °C during film growth. The Ni:Fe ratio in the ferrite films was varied by tuning individually the flux from each evaporation source in a way that the total flux from both sources was kept constant. We obtained a deposition rate of 1.2 () nm/min by this procedure. The chemical composition, i.e., the Ni:Fe ratio in the ferrite films as well as the surface structure were again controlled in situ by means of surface sensitive XPS and LEED, respectively. For XPS measurements, Mg radiation with a photon energy of = 1253.6 eV was used.
After film preparation and in situ surface characterization (XPS, LEED), film thicknesses were determined ex situ by means of X-ray reflectivity (XRR) in a Philips X’Pert Pro diffractometer at Bielefeld University. Here, Cu radiation with a photon energy of = 8048.0 eV was used. XRR data were analyzed using an in-house-developed fitting tool, which is based on the Parratt algorithm [15] and the Névot–Croce roughness model [16].
Additionally, the ferrite ultrathin film structure was characterized by high resolution X-ray diffraction (HR-XRD) measurements at beamline P08 of PETRA III at the Deutsches Elektronen-Synchrotron (DESY), Germany. Here, a photon energy of = 18 keV was used. The sample and detector were positioned with respect to the incident beam by using a six-circle (4S+2D-type) diffractometer (KOHZU NZD-3), while data acquisition was conducted by using a two-dimensional detector (PILATUS 100k or DECTRIS EIGER 1M). The HR-XRD measurements were conducted in - geometry to perform out-of-plane scans along the (00L) crystal truncation rod (CTR) across the MgO(002) and NFO(004) Bragg reflections. Analysis of HR-XRD data was performed by using an in-house-developed fitting tool, which employs full kinematic diffraction theory.
Complementary to laboratory-based surface sensitive XPS, HAXPES measurements were conducted at beamline P09 of PETRA III at DESY. In contrast to XPS, the higher used photon energy of = 6 keV for HAXPES measurements excites photoelectrons with higher kinetic energy and, thus, higher inelastic mean free paths (IMFPs) and consequently higher information depths . Thus, HAXPES is used to determine the chemical composition and cationic valencies not only in the near-surface region (as probed by XPS) but also in deeper subsurface layers. The endstation is equipped with a SPECS Phoibos 225 HV hemispherical analyzer with a delay line detector to record HAXPES spectra at beamline P09.
Additionally, a wide-angle lens with ±30° angular acceptance was used to record angle-resolved HAXPES (AR-HAXPES) spectra of photoelectrons with different off-normal emission angles . The angular-dependent information depth , from which 95% of photoelectrons (detected at the off-normal emission angle ) originate, is given by
with as the IMFP of the respective photoelectrons as determined by the Tanuma, Powell, and Penn (TPP-2M) algorithm [17]. As a consequence, varying the detection angle in AR-HAXPES measurements allows for depth-dependent photoelectron detection (cf. Table 1). For this purpose, the incident angle between the incident beam and surface plane was kept constant, and the data detected within the acceptance angle sections of were integrated for better statistics.
Table 1.
Values for the IMFP and information depth in HAXPES measurements ( = 6 keV) for photoelectrons originating from Fe 2p and Ni 2p orbitals passing through NiFe2O4 at emission angles and with respect to the surface normal.
Complementarily, XAS measurements were performed to probe the cationic valence states and the lattice site occupancies within the film lattice. These measurements were performed at the Superconducting Vector Magnet Endstation at beamline 4.0.2 of the Advanced Light Source (ALS). All samples were measured at room temperature with an incident angle of towards the [100] direction of the ferrite films. The XAS spectra were measured across the Fe (690–750 eV) and Ni (835–890 eV) absorption edges in the total electron yield (TEY) mode, which is surface sensitive with a probing depth of ∼5 nm in, e.g., Fe3O4 [18,19].
In order to quantify the cationic lattice site occupancies in the ferrite film, XAS measurements were analyzed by comparing the data to spectra obtained by charge transfer multiplet (CTM) calculations. In these calculations, a molecule complex composed of the respective cation in a given ligand crystal field is taken as a basis, and charge transfer is considered between the cation and ligand. The total CTM calculated spectrum is obtained by a weighted linear superposition of the individual spectra of each cation. By comparing the calculation with the experimental XAS spectra, quantitative information about the site occupancies of each cation is determined. In addition to crystal field effects and the charge transfer interaction, the CTM models include 100% spin–orbit coupling. Further, the Slater integrals , , and , which account for d-d and p-d Coulomb and exchange interactions [20], were each reduced to 80%, which is consistent within ±10% with previous studies on Fe3O4 [21,22,23,24,25]. Charge transfer is considered by setting the O 2p-Fe 3d charge transfer energies and of the initial and final states, respectively. The best results for these parameters as well as for the crystal field energies 10Dq were obtained for the values listed in Table 2 for the respective cations in a given ligand field, which are similar to the values used in former studies on Fe3O4 [25,26].
Table 2.
Crystal field energies 10Dq, initial, and final charge transfer energies and for the respective cations in a given ligand field used for the CTM calculations to analyze XAS data.
Additionally, the CTM calculated spectra were compared to the data by assuming a Gaussian instrumental broadening of 0.25 eV and a Lorentzian lifetime broadening of 0.3 eV (0.6 eV) for () edges.
Magnetic properties of the NixFe3−xO4 films were characterized by using a SQUID of type S700X from CRYOGENIC. Here, the magnetization M was recorded at room temperature as a function of applied magnetic field H, which was tuned from +7 T to −7 T and back again to obtain M vs. H curves, which show hysteretic behavior for ferrimagnetic or ferromagnetic material.
3. Results
3.1. Surface Characterization: XPS and LEED
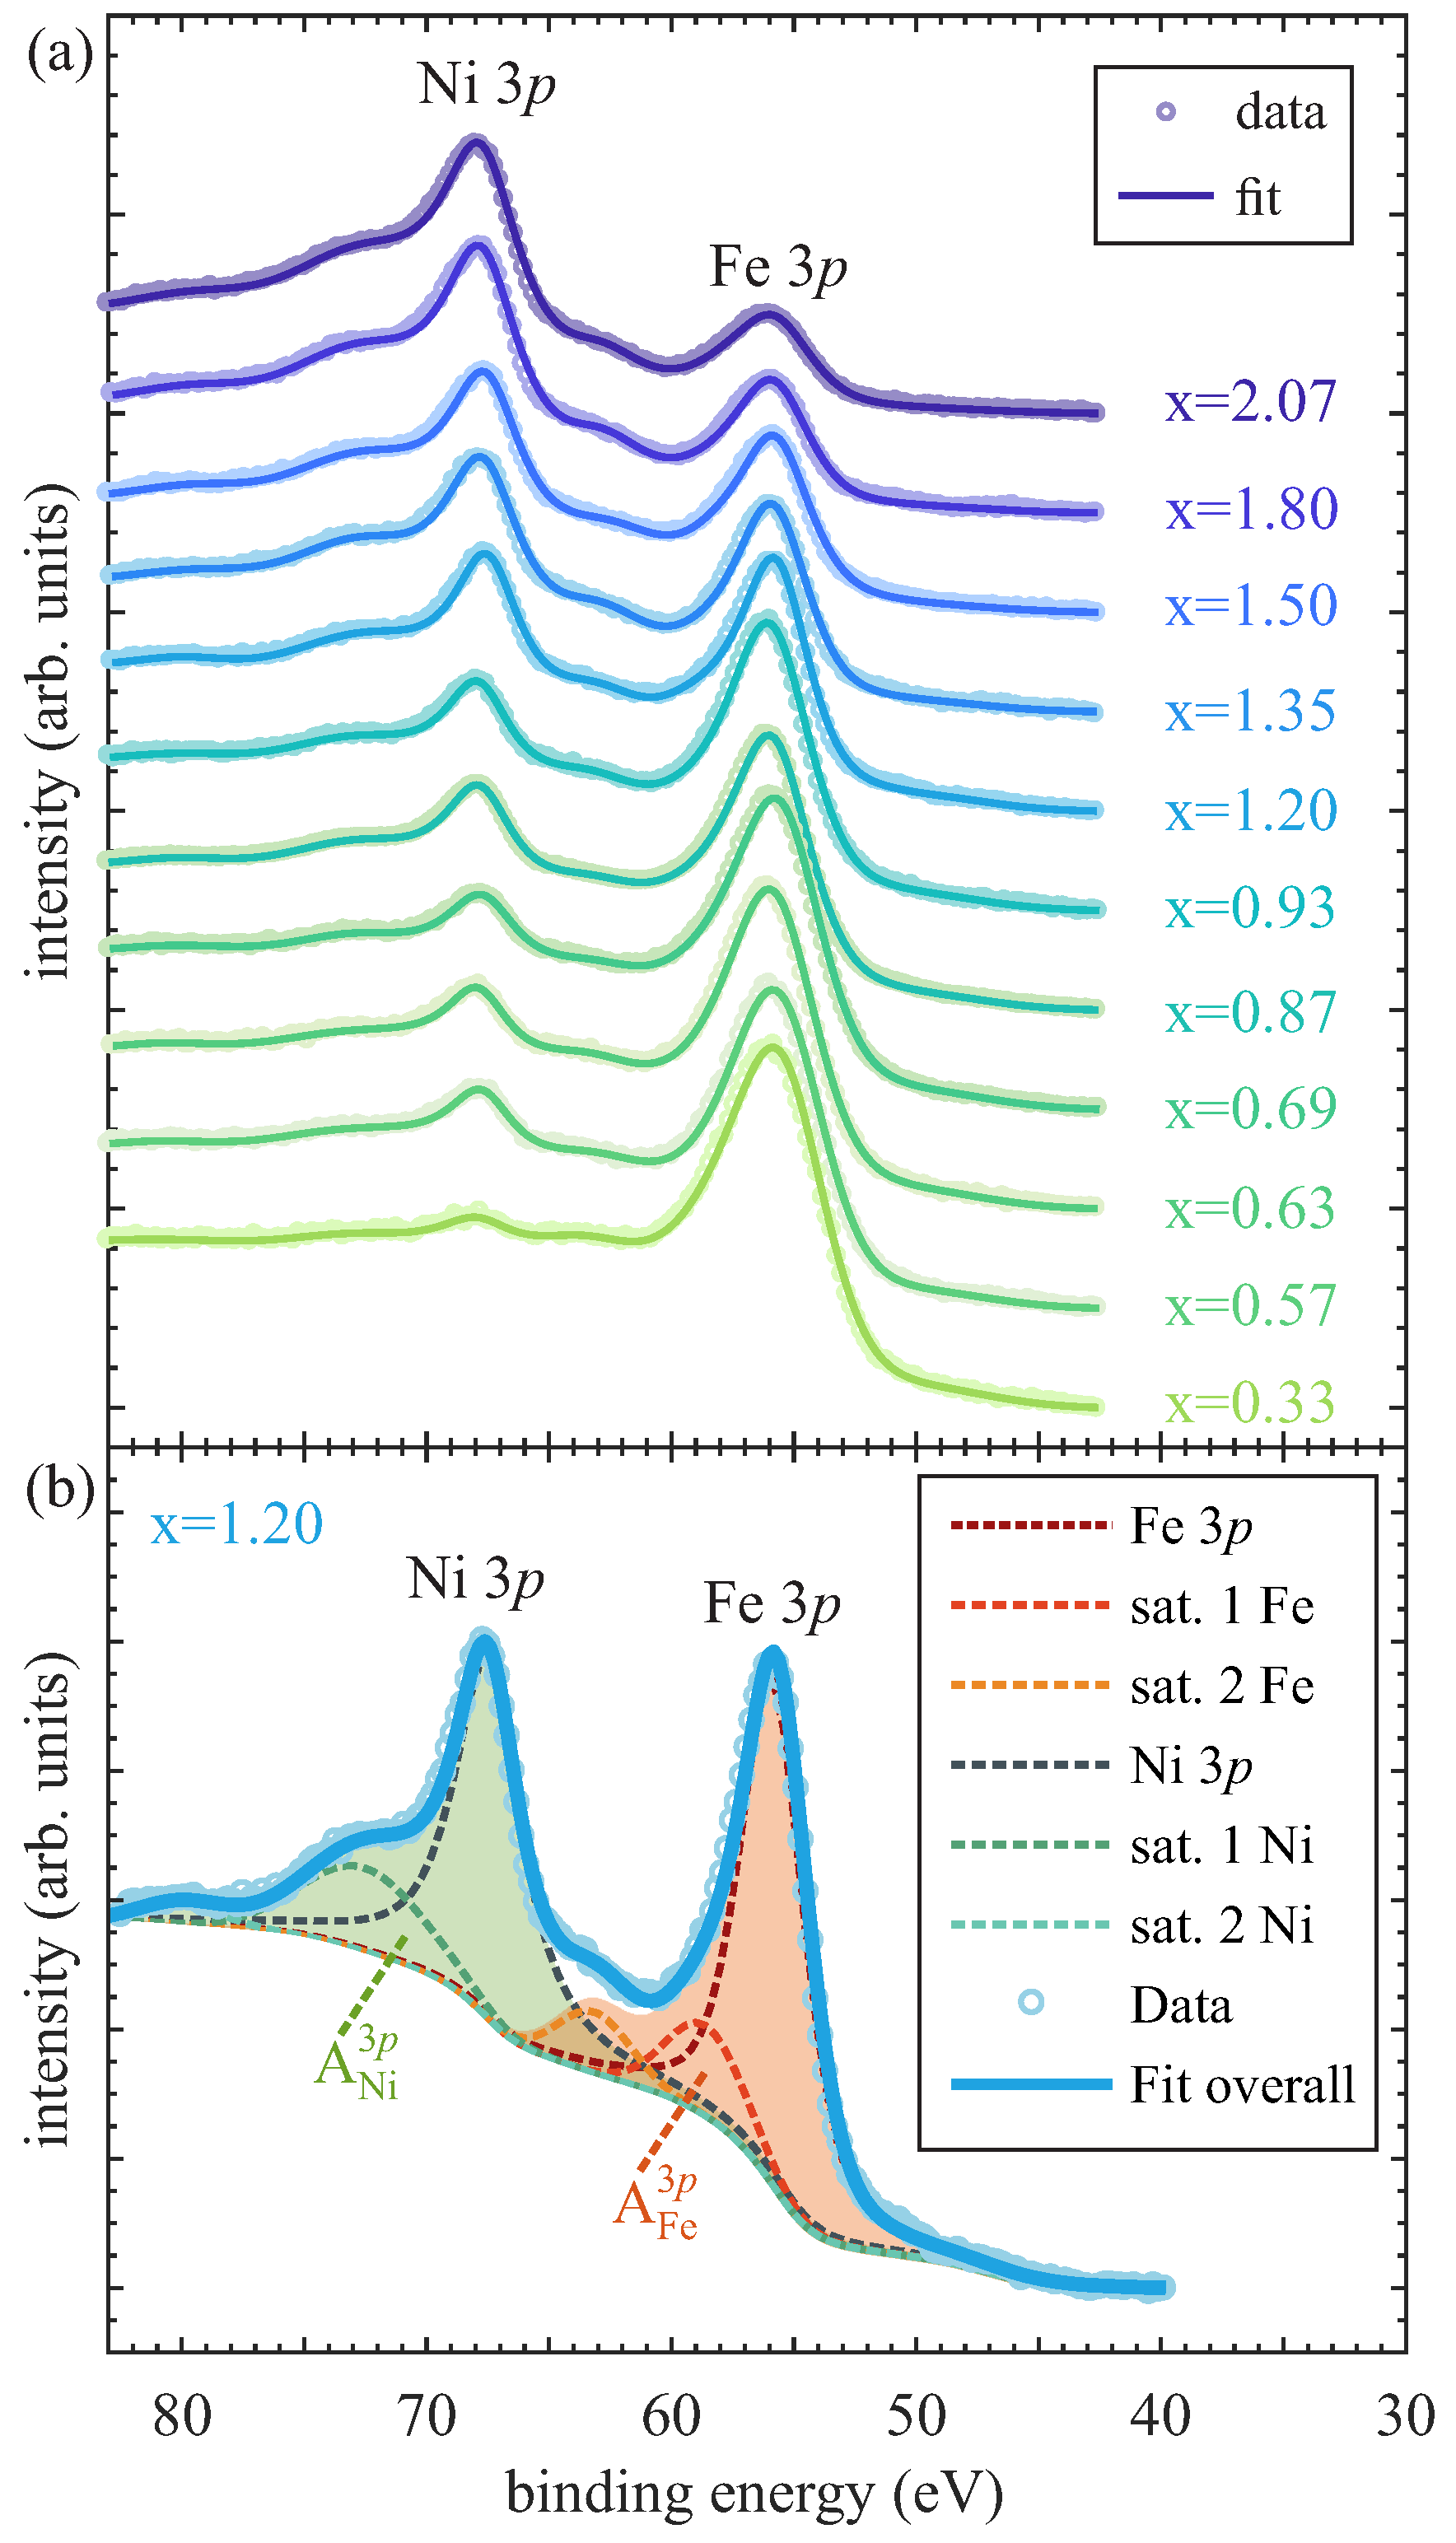
The chemical composition, i.e., the ratio between Ni and Fe of the NixFe3−xO4 films, was determined by analyzing the Ni 3p and Fe 3p spectra measured in situ by surface sensitive XPS.
The corresponding spectra are depicted in Figure 1a. We assumed that the O 1 s photoelectron peaks are located at 530 eV binding energy to calibrate the energy scale of all spectra. For increasing Ni content x within the ferrite films, the intensity of the Ni 3p spectrum increases as compared to the decreasing Fe 3p intensity. To determine the Ni:Fe ratio, the areas below the Ni 3p and Fe 3p spectra were determined after subtracting a Shirley background and deconvoluting each 3p spectrum into one main 3p photoemission line and two satellites located at the higher binding energy sides of each 3p spectrum [cf. Figure 1b]. The main photoemission lines and satellites were each fitted by a convolution of a Lorentzian and a Gaussian. The sum of all fitted peaks results in the overall fits, which completely match with the measured data of each ferrite film, is shown in Figure 1a. As the binding energies of Ni 3p and Fe 3p spectra only differ by a few eV (∼12 eV) from each other, the energy-dependent IMFPs = 2.3 nm ( = 6.9 nm) and the transmission function of the spectrometer are also very similar for these photoelectrons. As a consequence, the Ni content of the prepared ferrite films is determined via the relative photoelectron yield
with as the areas below the background subtracted Ni and Fe 3p spectra [including satellites, cf. Figure 1b] and as the respective photoelectric cross sections [27]. The resulting Ni content x for the presented XPS spectra are given next to the respective measurements in Figure 1a. However, due to the variable contributions of the satellites in the 3p spectra, an experimental error of x = ±0.08 has to be considered.
Figure 1.
(a) Ni 3p and Fe 3p spectra of NixFe3−xO4 ultrathin films with varying Ni amount x measured by XPS. (b) Exemplary analysis of both Ni 3p and Fe 3p spectra for Ni content x = 1.20. Both main lines are accompanied by two satellites at their high binding energy sides. The Ni content x is determined by taking the background subtracted areas and (filled regions) into account.
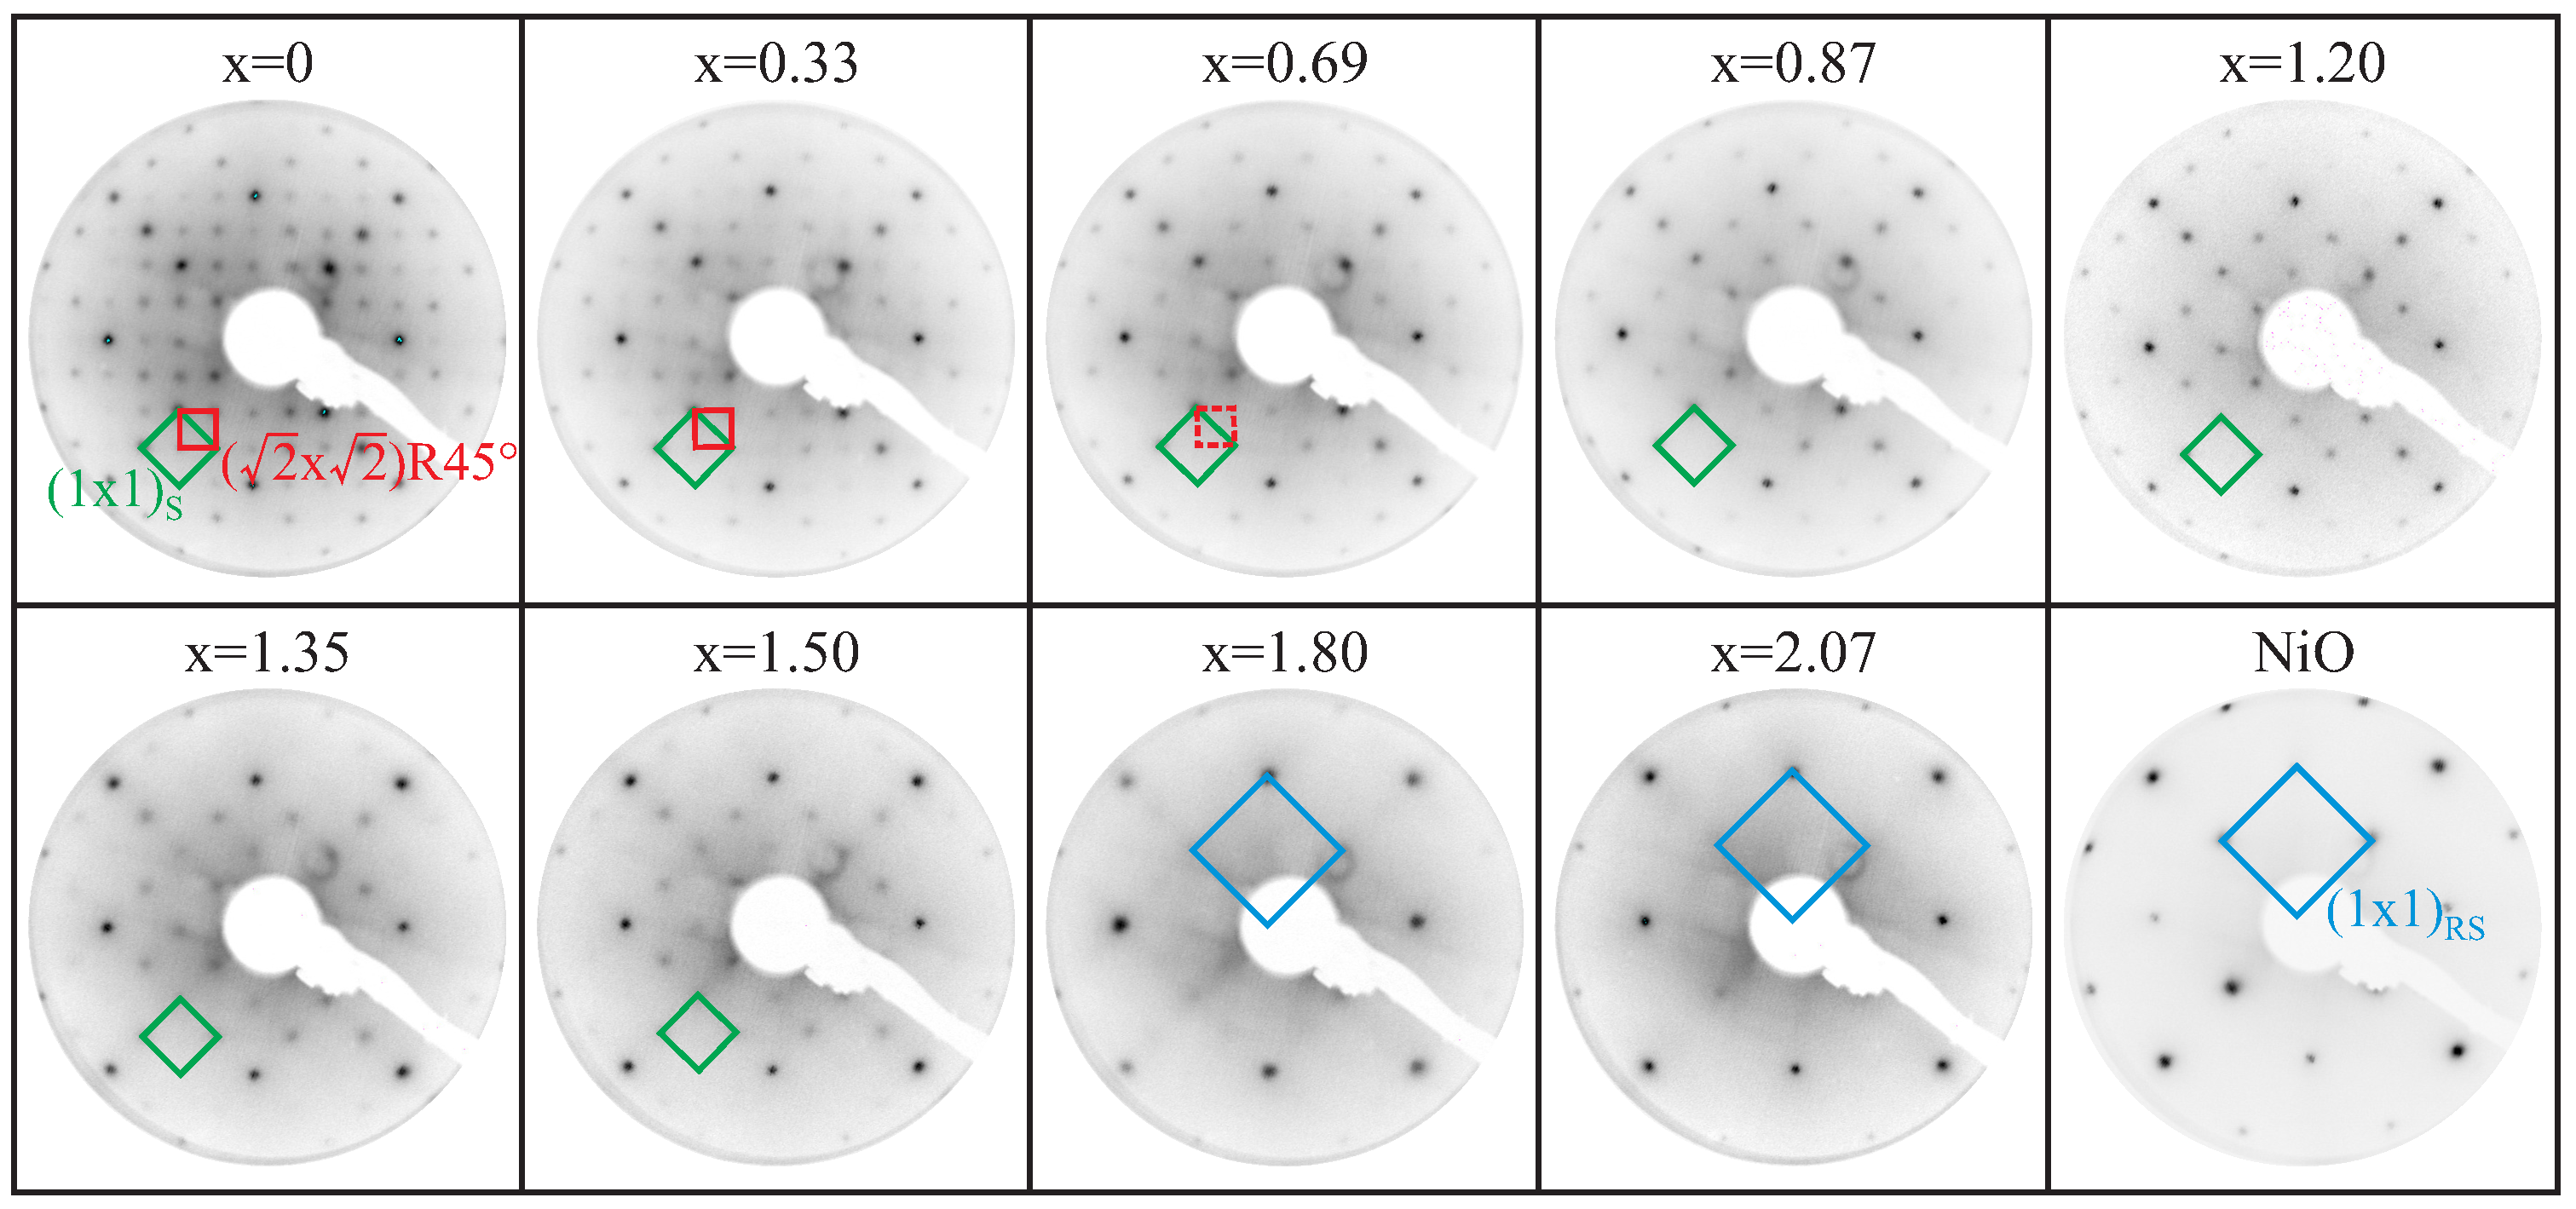
In addition to the determination of the chemical composition by means of surface sensitive XPS, the surface structure of the prepared ferrite films is determined via in situ LEED measurements. Figure 2 shows an exemplary selection of the representative LEED pattern for varying Ni amounts in the ferrite films. For better comparison, the electron energy of 162 eV is the same for all depicted diffraction patterns.
Figure 2.
LEED pattern at an electron energy of 162 eV for several exemplary NixFe3−xO4 ultrathin films on MgO(001) with varying Ni content x. The superstructure (red square), characteristic for an Fe3O4(001) surface (x = 0), vanishes for Ni contents of x ≥ 0.69, whereas the spinel type surface structure (green square) stays visible up to x = 1.50. For x ≥ 1.80 solely, a square structure (blue square) is obtained, which exhibits twice-as-large reciprocal lattice constants than the reciprocal unit cell of the spinel type structure and corresponds to the rock-salt-type surface unit cell as seen by comparison to a LEED pattern recorded from a NiO film.
For the Fe3O4 film (x = 0), a clear superstructure in addition to the spinel type (index S) square surface structure is visible. This superstructure is characteristic for Fe3O4(001) surfaces and vanishes for Ni contents x ≥ 0.69, whereas the spinel-type surface structure stays visible up to x = 1.50. For even larger Ni contents x ≥ 1.80, solely a square surface structure is visible, which exhibits reciprocal surface lattice constants that are twice as large as the spinel-type reciprocal lattice constants in the unit cell. This larger reciprocal unit cell corresponds to the surface unit cell of a rock salt type surface (index RS), as it is obtained for LEED at, for example, NiO surfaces.
These observations indicate the formation of merely spinel-type structures for low Ni content x, while the sole presence of a surface structure as obtained for x ≥ 1.80 with twice as large reciprocal surface lattice vectors (meaning half the surface lattice vectors in real space) compared to the unit cell of the spinel-type structure points to a major formation of rock-salt-type structures at the surface. However, the coexistence of a spinel structure and rock salt structure with a superposed diffraction pattern is assumed for intermediate Ni content x. Here, we like to emphasize that the deviation between the LEED reflex intensities for the film with x = 2.07 compared to the reflex intensities obtained for the NiO surface (although the electron energy is the same in both measurements) indicates a different rock-salt-type structure, e.g., an Fe-doped NiO phase, pointing at the surface for x = 2.07.
3.2. XRR
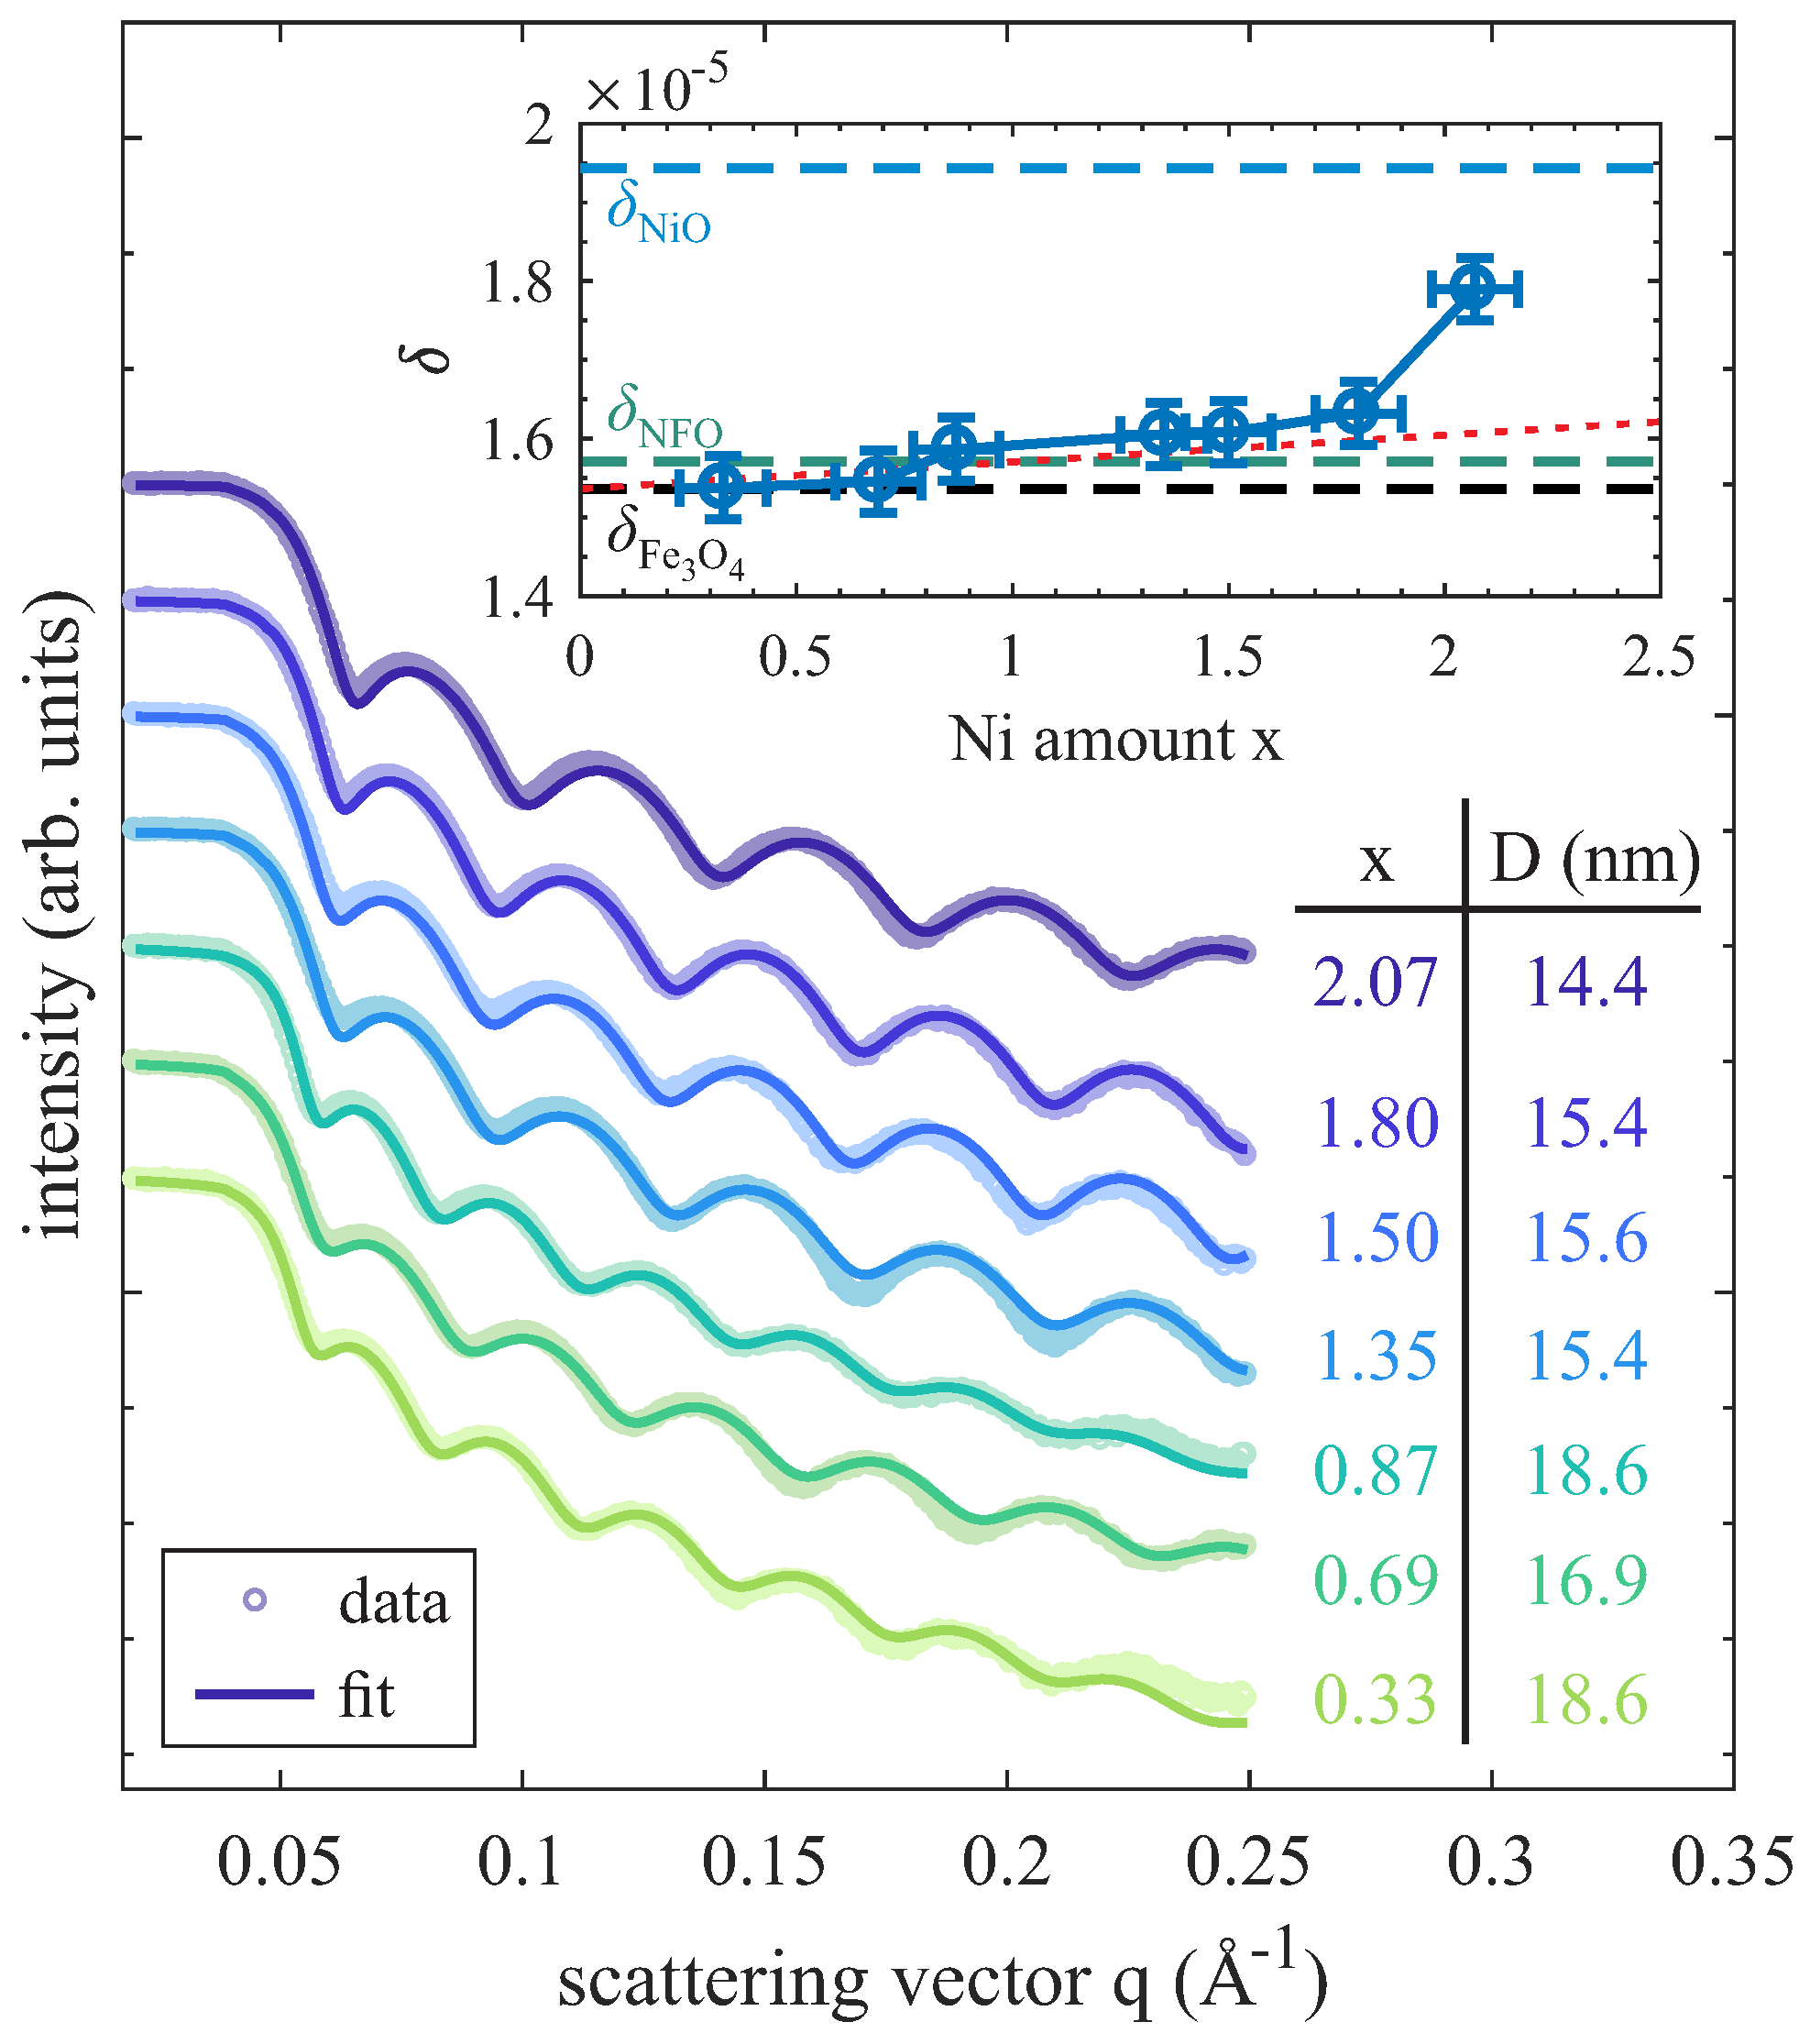
In addition to the in situ surface characterization by means of XPS and LEED, XRR measurements were conducted ex situ after transport under ambient conditions. Representative measurements of some NixFe3−xO4 films with varying Ni content x and the corresponding calculated XRR curves are shown in Figure 3. XRR data for all films show clear Kiessig fringes. They result from the interference of X-rays reflected at the film surface and at the interface between the film and substrate and point to the low interface and surface roughness independent of the Ni content x. For the detailed analysis of XRR curves, the refractive index of the MgO substrate at the used X-ray energy of = 8048.0 eV was kept fixed [28]. In contrast, the thickness, interface/surface roughness, and refractive index of the film were used as free fit parameters. As seen in Figure 3, the calculated XRR curves are in excellent agreement with the measured data, pointing to single homogeneous films for all Ni contents x. The resulting film thicknesses range from 14.0 to 18.6 nm. More remarkably, the obtained dispersions ( with as the electron density) are increasing for an increasing Ni amount x in the ferrite film (cf. inset of Figure 3), as it is expected considering the literature values of stoichiometric Fe3O4 (), NiFe2O4 (), and NiO () [28]. For Ni amounts x ≤ 1.50, only a slight increase in is observed with increasing Ni content x, matching the linear evolution obtained theoretically if Ni and Fe cations solely occupy spinel-type lattice sites (red dotted line) according to the slight increase in the literature values of Fe3O4 and NiFe2O4. In contrast, for x ≥ 1.80 (in particular for x = 2.07), the dispersions are clearly exceeding these values and are approaching the dispersion expected for NiO, which enforces the assumption that spinel O4 coexists with rock salt NiO (probably with Fe doping) and that the NiO fraction increases Ni content x.
Figure 3.
XRR measurements for NixFe3−xO4 ultrathin films of film thickness D with varying Ni content x. The calculated XRR curves are in excellent agreement with the measured data. Clear Kiessig fringes point to low surface and interface roughness for all films. The dispersion is increasing for increasing Ni amount x (shown in the inset). The dispersion values for stoichiometric Fe3O4, NiFe2O4 (NFO), and NiO at the used X-ray energy of 8048.0 eV (Cu K) are depicted for comparison (dashed lines). The red dotted line represents the (linear) evolution of if Ni cations were solely incorporated on spinel-type lattice sites with increasing x.
3.3. HR-XRD
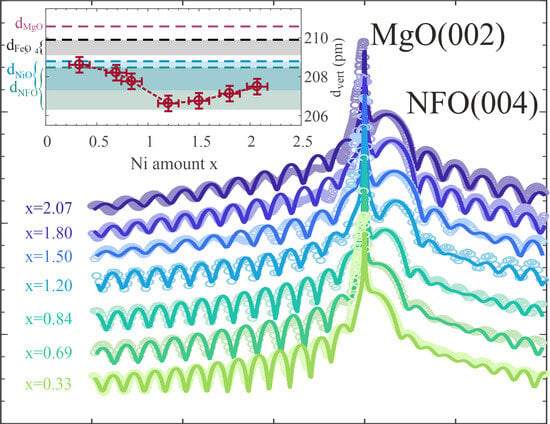
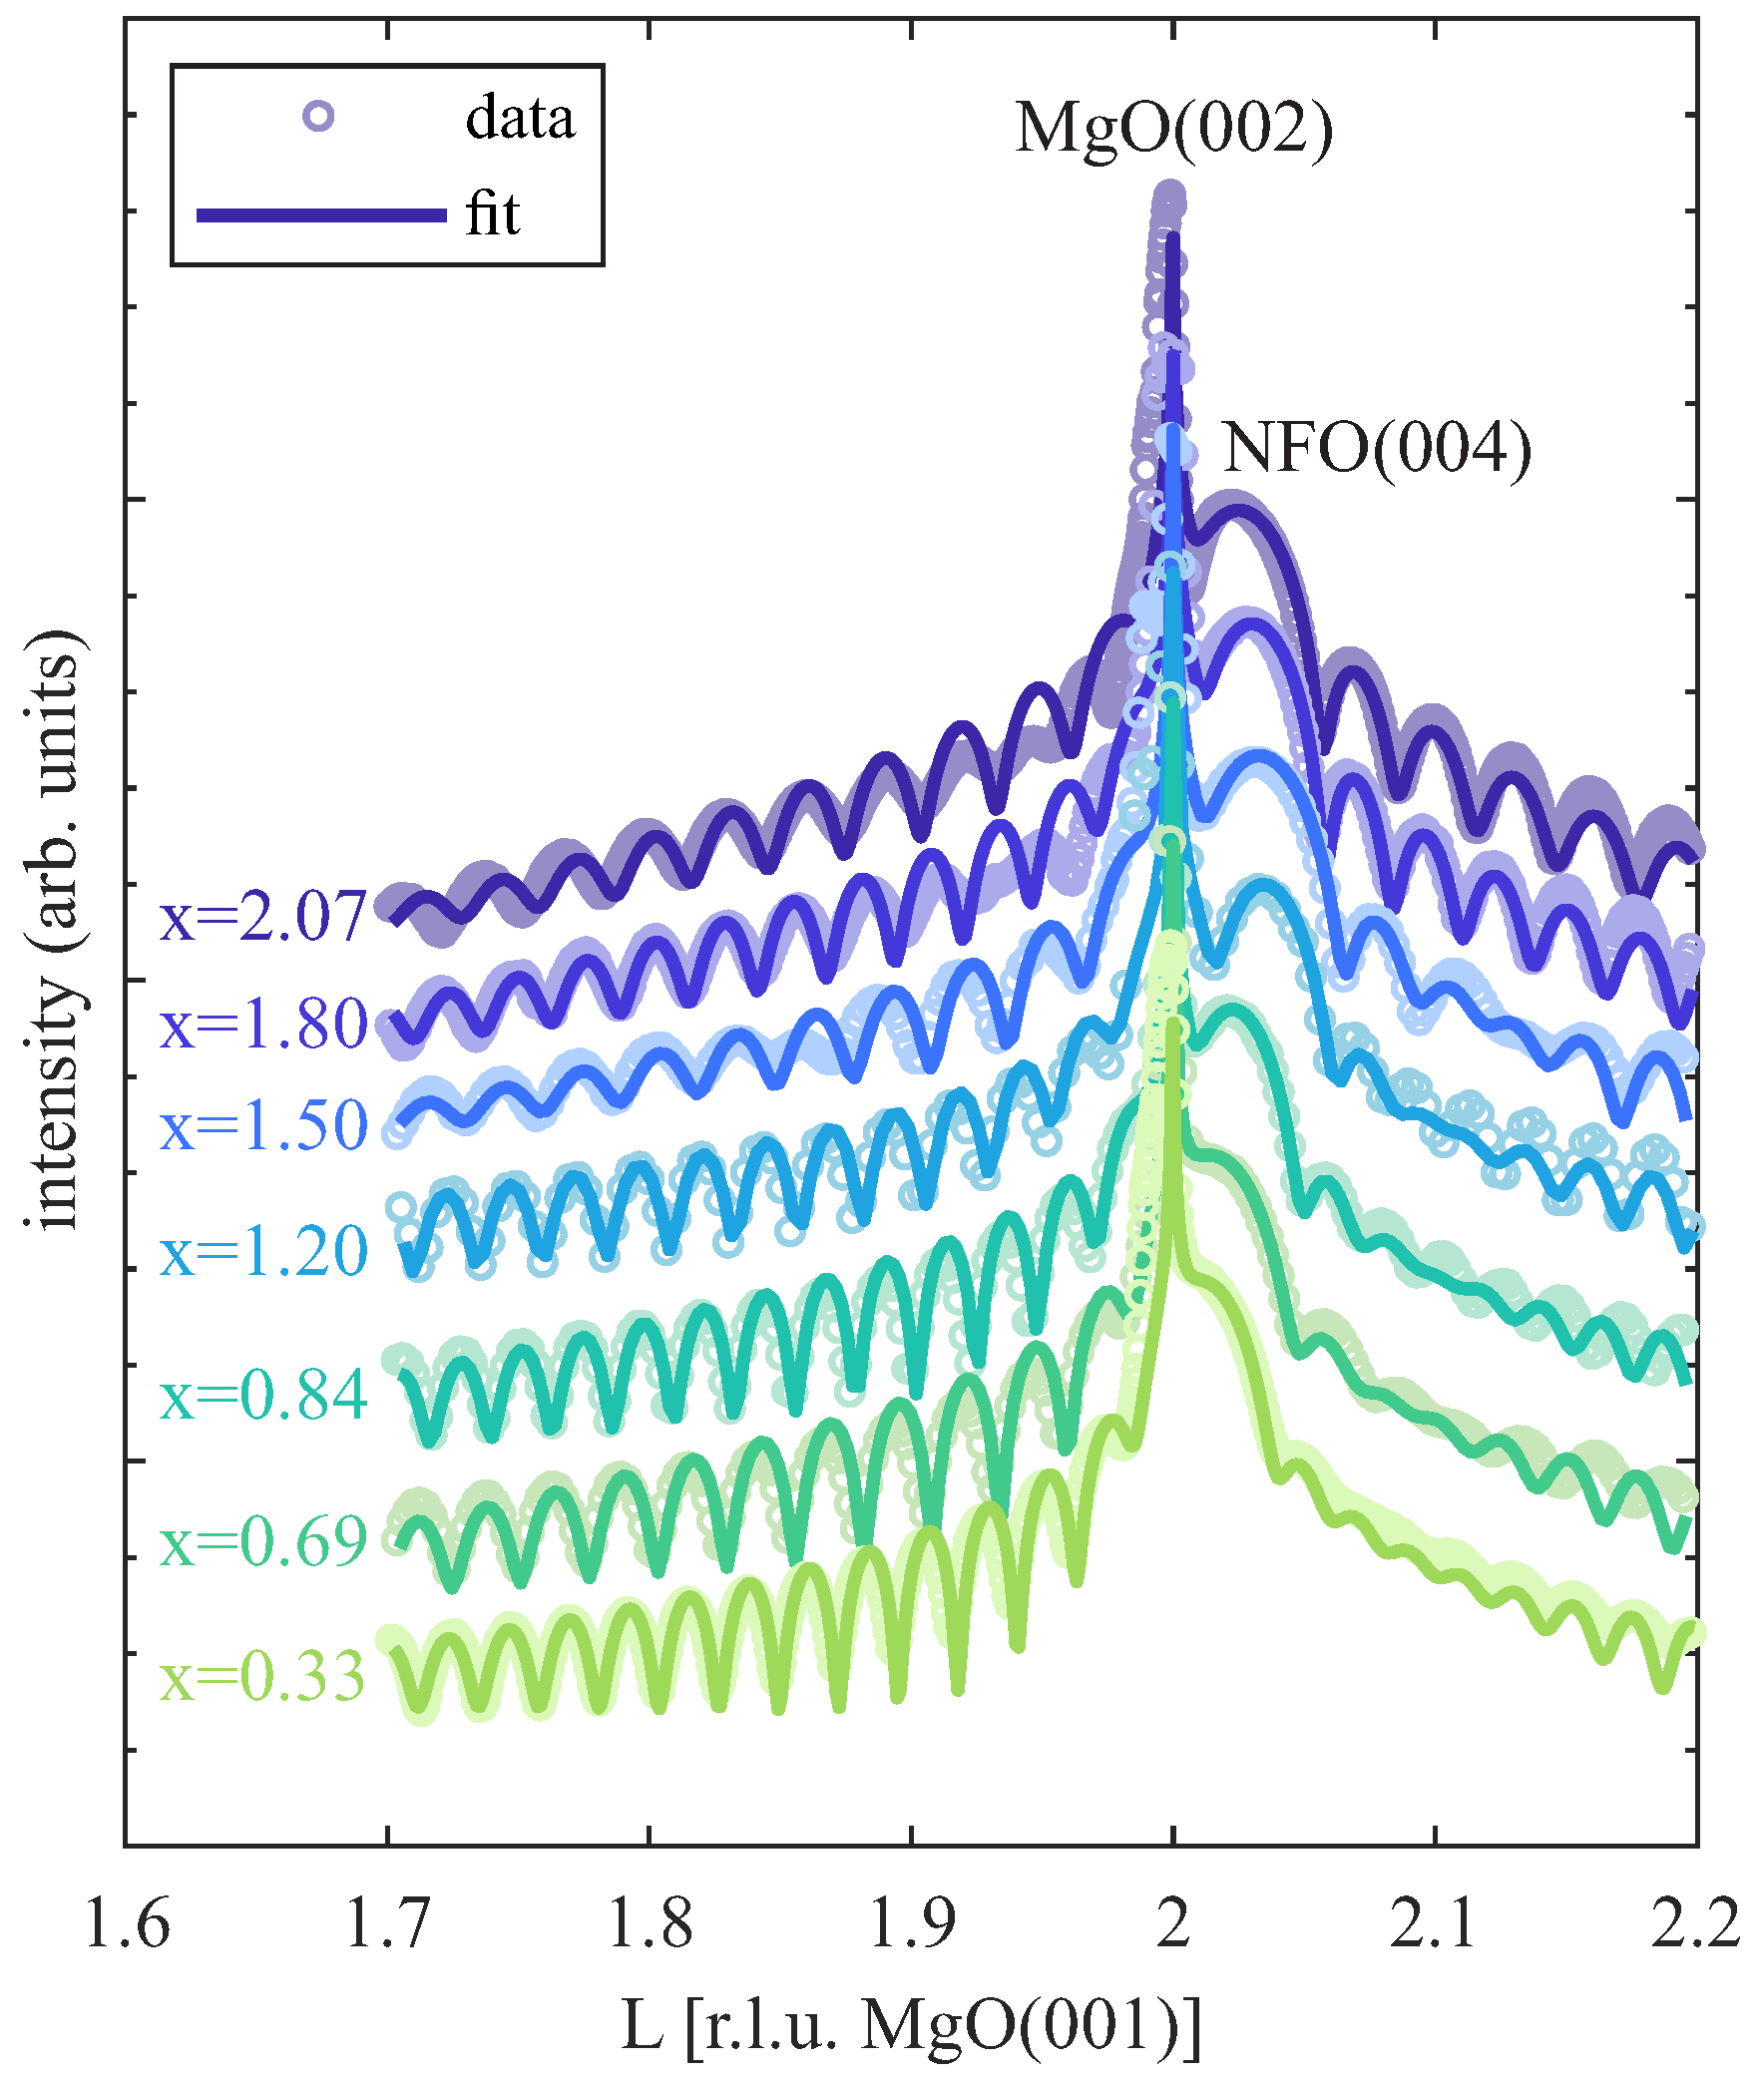
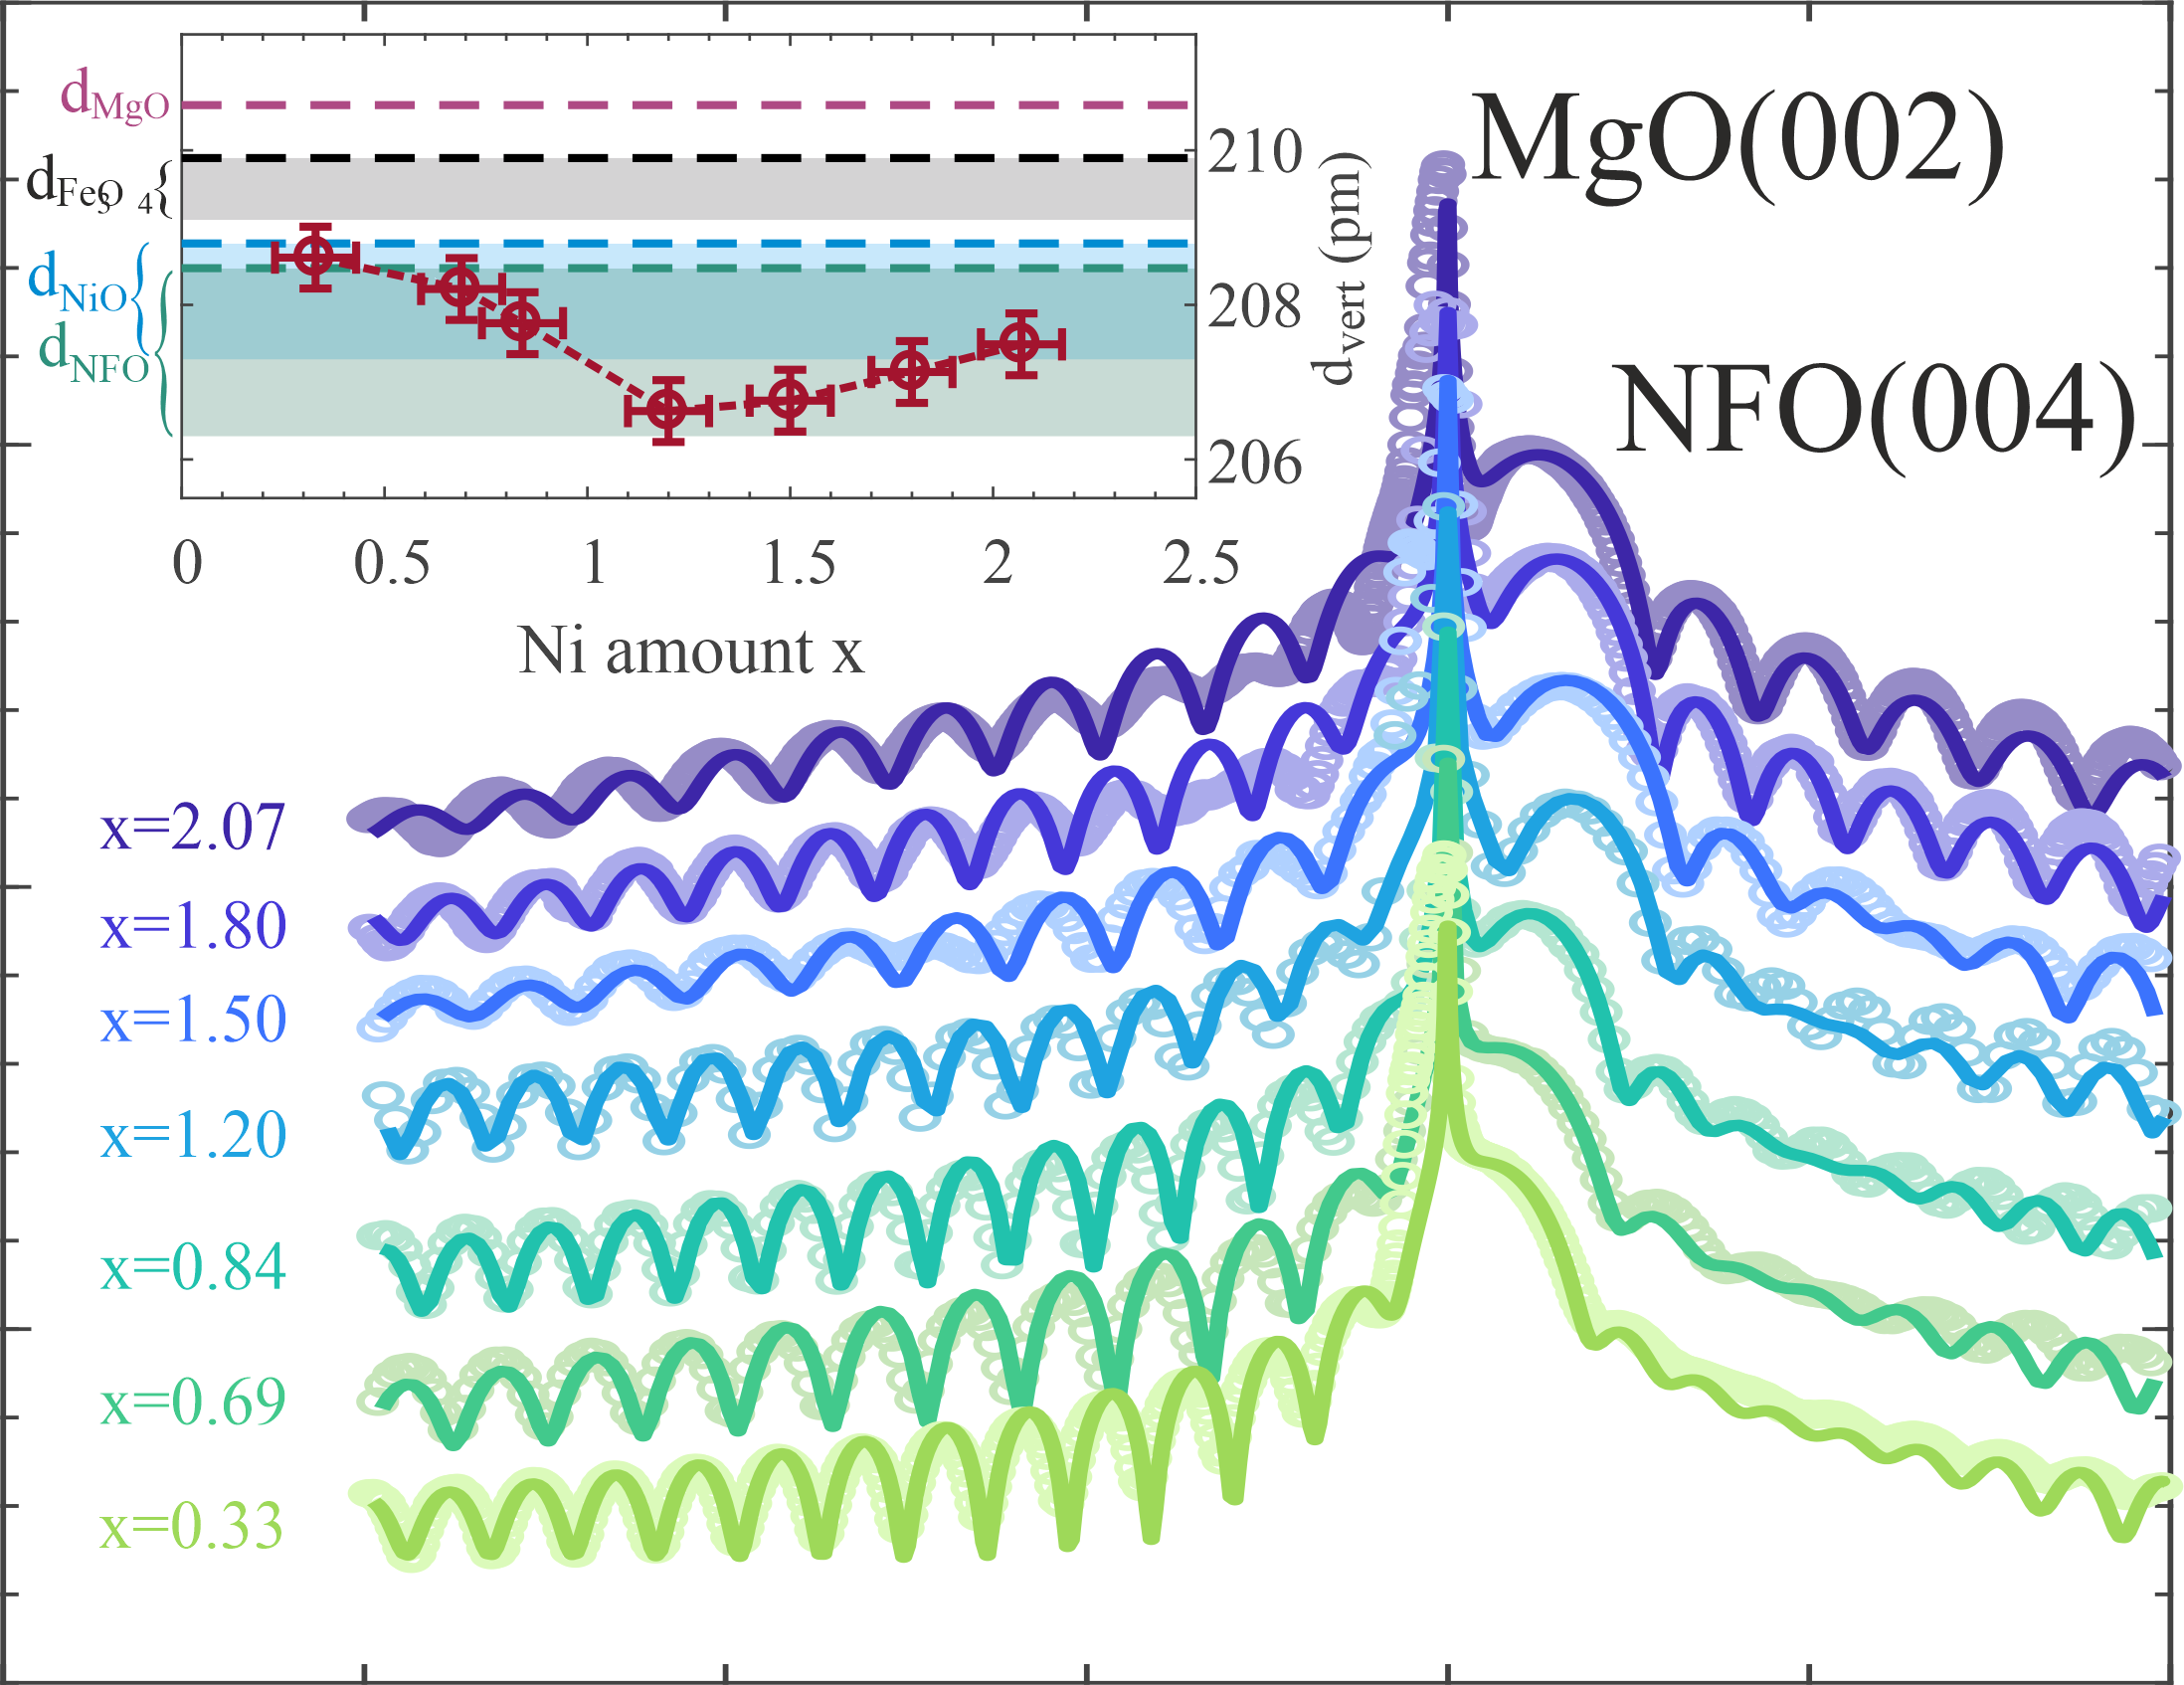
HR-XRD measurements were performed ex situ at the PETRA III P08 beamline at DESY to characterize the structure of the NFO films. The recorded data along the (00L) CTR close to the MgO(002) Bragg condition for several representative NFO films with varying Ni amount are depicted in Figure 4. For all measurements, a clear NFO(004) Bragg peak is visible, which is located at slightly higher L values than for the MgO(002) reflection due to the slightly lower layer distance of the ferrite film compared to the layer distance of the MgO substrate. Moreover, the measured (00L) CTRs exhibit clear Laue fringes, pointing to smooth interfaces and high crystalline film quality, which is in accordance with the XRR results.
Figure 4.
HR-XRD out-of-plane measurements along the (00L) CTR across the MgO(002) and NFO(004) Bragg conditions with corresponding calculations based on full kinematic diffraction theory for NFO films with different Ni content x. The calculated diffractograms show very good agreement with the measured data. Clear Laue fringes point to smooth interfaces and high crystalline quality.
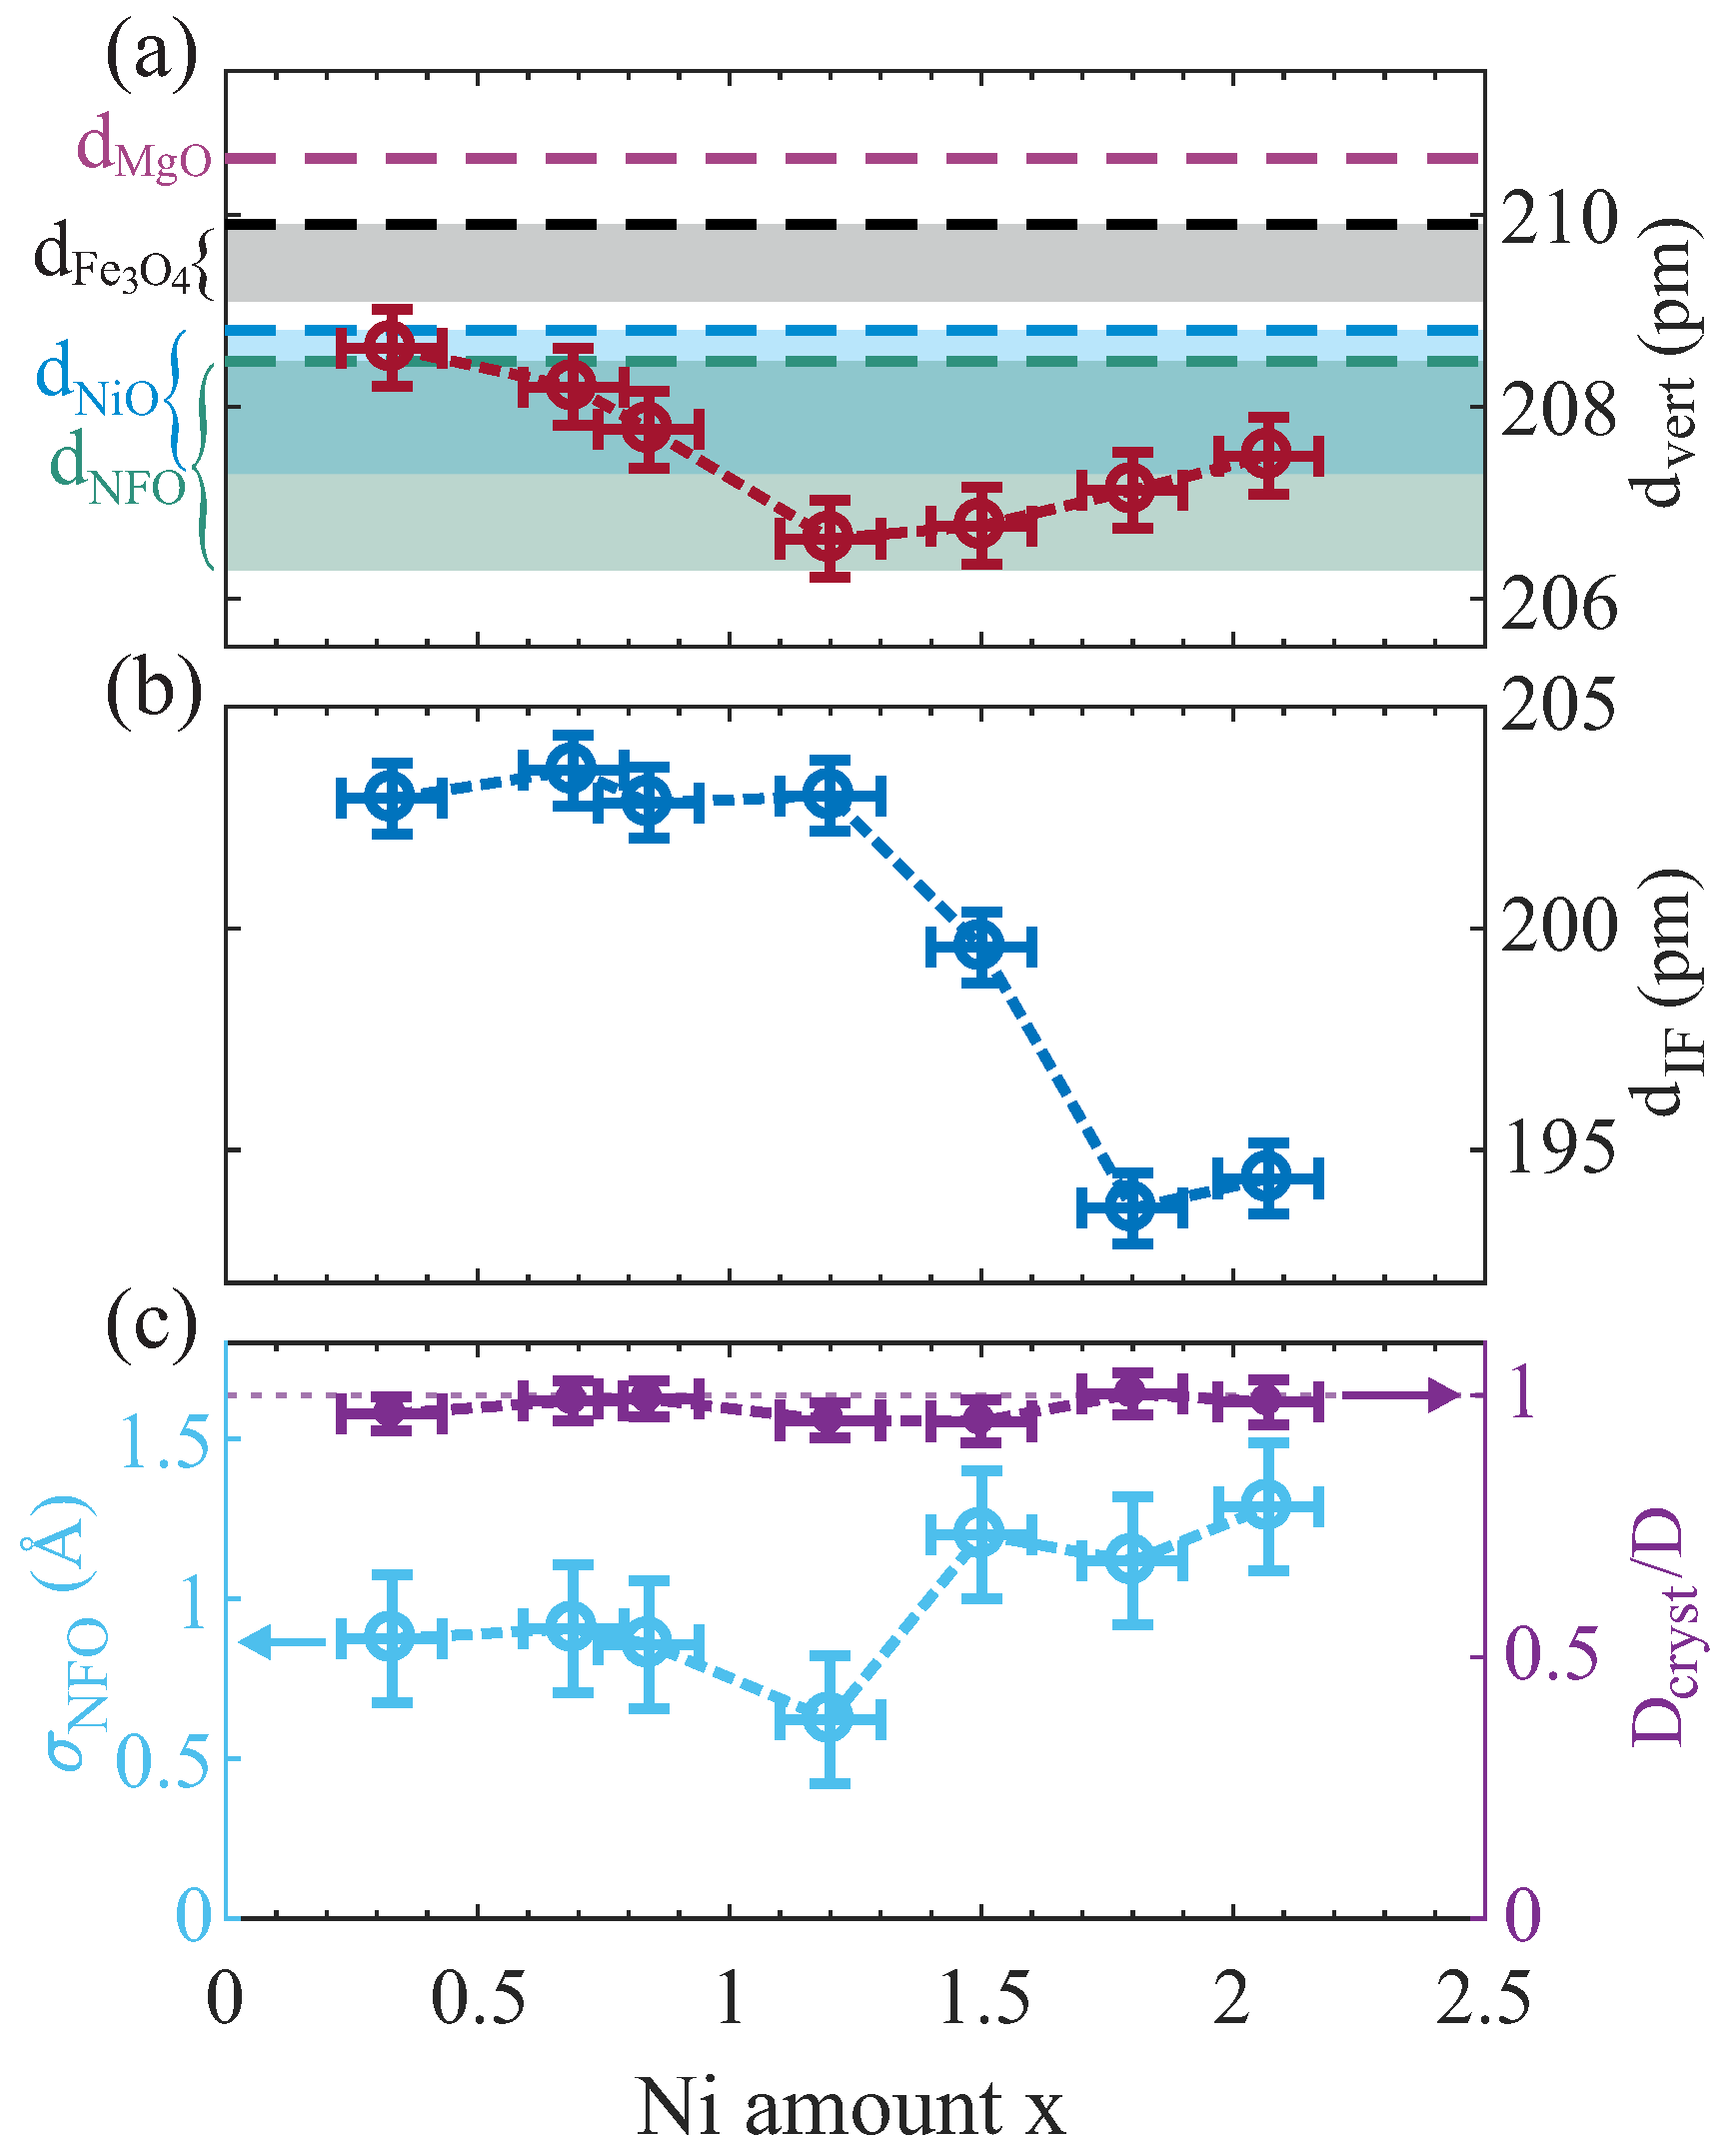
Further, the recorded HR-XRD data were analyzed using calculations based on full kinematic diffraction theory. The resulting models show very good agreement with the measured diffraction data as shown in Figure 4. From these calculations, parameters like the vertical layer distance , the interface distance , and the number of film monolayers (ML) , as well as the ferrite film surface roughness , are extracted. From the number of monolayers and the vertical layer distance , the crystalline film thickness = can be determined and compared to the total film thickness D (as determined by XRR; see above). The resulting values of and , as well as and the scaled crystalline film thickness /D independent of the Ni amount x within the ferrite films, are depicted in Figure 5a–c, respectively.
Figure 5.
(a) Vertical layer distance compared to bulk layer distances of MgO, Fe3O4, NiFe2O4, and NiO (dashed horizontal lines). The filled regions cover the range between completely relaxed (upper boundary) and fully compressed layer distances due to pseudomorphic growth (lower boundary). (b) Interface distance , and (c) film surface roughness and scaled crystalline film thickness /D as resulting from the calculated models for varying Ni content x.
The vertical layer spacing within the NFO films decreases up to a Ni content of x = 1.20 and increases for higher Ni content up to x = 2.07 [see Figure 5a], which can be followed by tracing the position of the NFO(004) Bragg peak, which is increasing in L up to x = 1.20 and decreasing again for higher x (see Figure 4), meaning decreasing/increasing layer distances, respectively. This behavior can be understood qualitatively by comparing this trend with the bulk layer distances of stoichiometric Fe3O4, NiFe2O4, and NiO [cf. dashed lines within Figure 5a]. Here, Fe3O4 (x = 0) exhibits the largest layer distance of = 209.9 pm, whereas for stoichiometric NiFe2O4 (x = 1), the smallest bulk layer distance of = 208.5 pm is obtained, which can explain the decrease in for increasing x between 0 ≤ x ≤ 1.2. In contrast, bulk NiO exhibits again a slightly larger layer distance of = 208.8 pm compared to NiFe2O4. Thus, a further increase in the Ni amount above the stoichiometric value of x = 1 should also result in an increase in the layer distance if further Ni cations result in (Fe-doped) NiO-type formations. In fact, this behavior is observed here for x > 1.20 and is therefore consistent with the obtained results if saturation of the spinel-type lattice sites is assumed for x ≥ 1.20. In accordance with the LEED and XRR results, such a saturation of the spinel-type lattice sites can be assumed for the range 1.20 ≤ x ≤ 1.50.
However, as seen in Figure 5a, all films are compressively strained in the vertical direction since the absolute values of are clearly below the bulk values of Fe3O4, NiFe2O4, and NiO for stoichiometries of x < 1, x ≈ 1, and x > 1, respectively. This observation can be understood by assuming a lateral adaption of the ferrite film to the substrate lattice (pseudomorphic growth) and, consequently, the presence of lateral tensile strain, which results in vertical compression within the ferrite films. A more detailed (quantitative) analysis of this assumption is given in Section 4.
Furthermore, the interface distance is smaller than the determined layer distances and almost constant for Ni amounts x ≤ 1.20, whereas it is significantly decreasing when further increasing the Ni content [see Figure 5b]. Complementary to the LEED results (cf. Figure 2), which indicate the emergence of an almost single rock-salt-like structure at the surface for x > 1.50, the observed trend of the interface distance also points to the formation of another structural phase (at the interface) for a Ni content 1.20 ≤ x ≤ 1.50.
The film surface roughness , as determined from HR-XRD analysis [cf. Figure 5c], is very low ( Å) and constant for x ≤ 1.20, whereas it is only slightly increased but constant for x ≥ 1.50 ( Å). In fact, these very low values for all films indicate smooth surfaces, which is in accordance with the observations in XRR and the sharp reflexes obtained in the LEED pattern (see Figure 2), and comes along with complete crystallinity = D independent of the Ni content x [cf. Figure 5c].
3.4. HAXPES
Complementary to surface sensitive XPS, HAXPES measurements were conducted at P09 of PETRA III at DESY to determine the chemical composition and the cationic valencies also in deeper subsurface layers. While for laboratory based (soft) XPS the maximum information depth ( = 0) [cf. Equation (1)] of the analyzed Ni 2p and Fe 2p photoelectrons passing through NiFe2O4 is about 3–4 nm, it is crucially enhanced to about 22 nm for HAXPES with an X-ray energy of 6 keV. Hence, the performed HAXPES measurements completely probe the prepared NFO films in vertical direction, as the thicknesses of all films are still well below the maximum information depths. This determination is supported by the fact that the Mg 1s photoemission signal originating from the substrate is still visible in all HAXPES measurements.
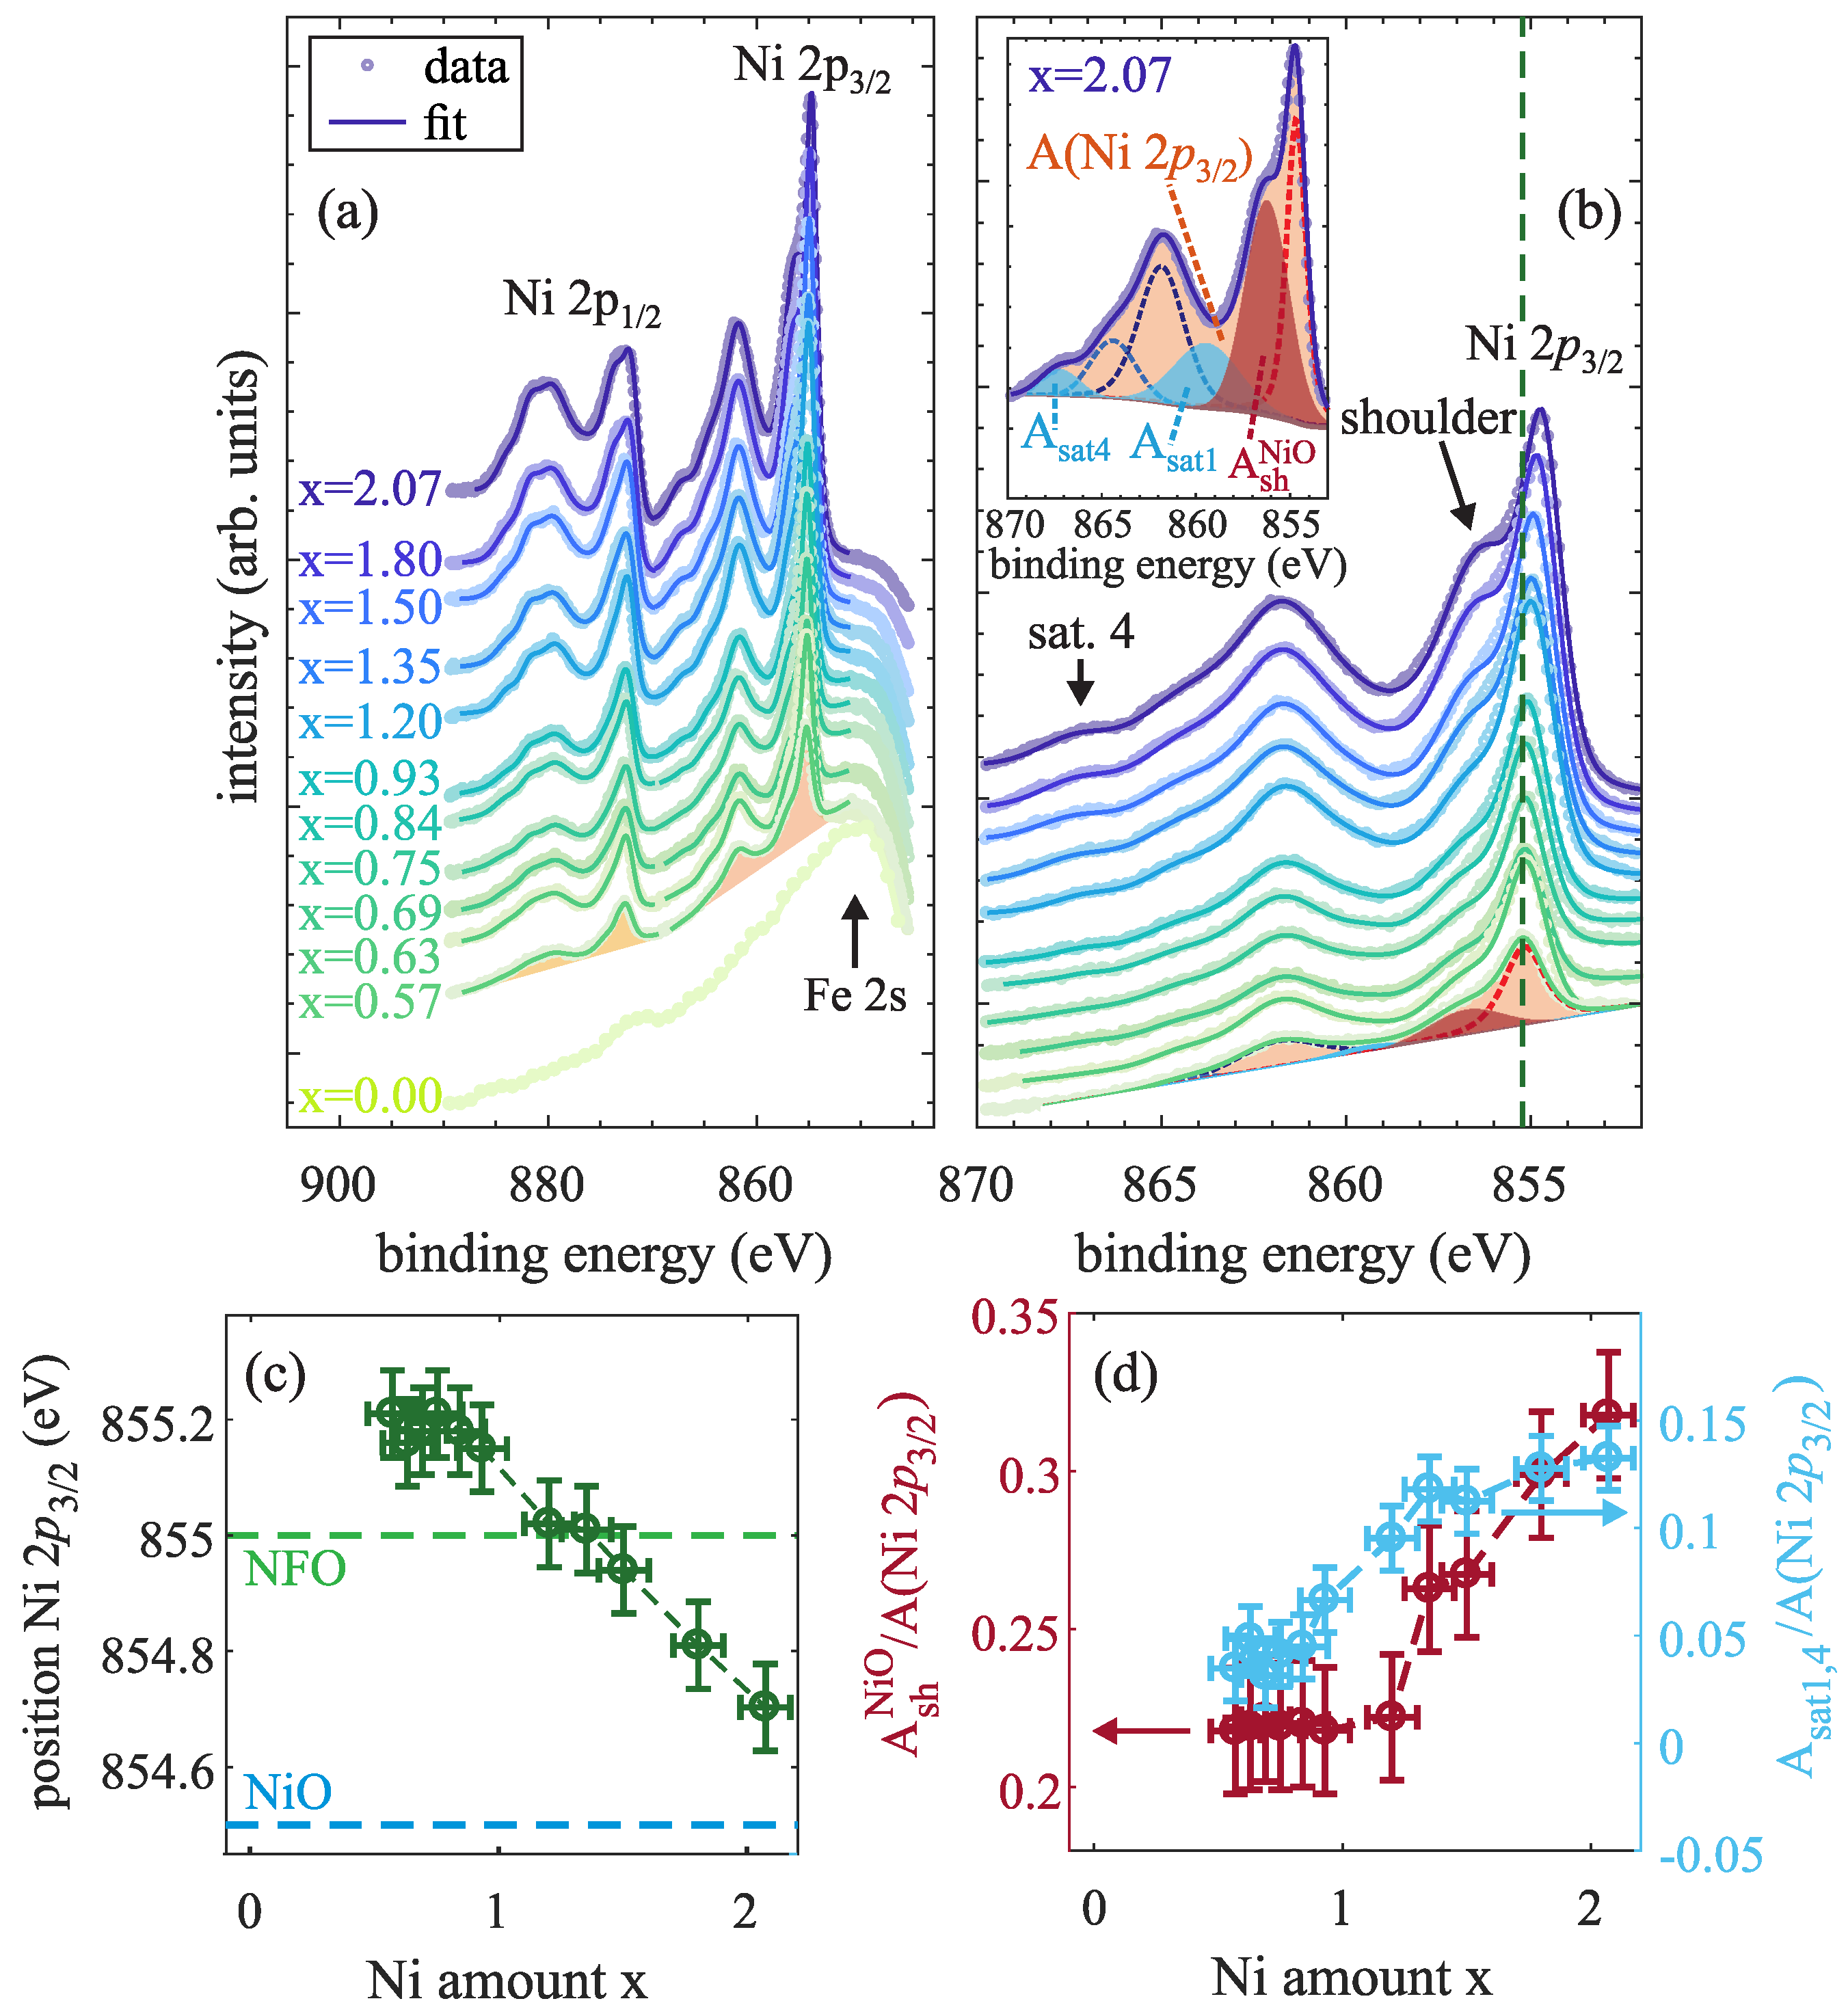
The recorded Ni 2p spectra for NixFe3−xO4 films with varying Ni content x are depicted in Figure 6a. All spectra exhibit the main spin–orbit split 2 and 2 photoemission peaks accompanied by satellites with ∼7 eV larger apparent binding energies. These spectra are characteristic for present in several oxides as, e.g., NiO or NiFe2O4 [29,30,31].
Figure 6.
(a) Ni 2p spectra of several prepared NixFe3−xO4 films with varying Ni content x measured by HAXPES along with overall fits (solid lines). (b) Enlarged section of the Ni 2 region with an emerging high binding energy shoulder of the Ni 2 main line for increasing Ni content x. The deconvoluted peaks for the overall fits are depicted in the inset exemplarily for x = 2.07. (c) Position of the maximum intensity of the Ni 2 main line. (d) Background subtracted areas of the high binding energy shoulder (red circles) and of the emerging satellites = + (blue circles) both compared to the area below the entire Ni 2 spectrum A(Ni 2).
For a more detailed analysis, the Ni 2 spectra were fitted by several peaks [cf. inset of Figure 6b], each one described by a convolution of a Lorentzian and a Gaussian. The number and positions of individual peaks were based on the theoretical description of Ni 2p spectra by Veenendaal and Sawatzky [31], resulting in one peak for the main photoemission line in addition to one peak describing the high binding energy shoulder, as well as four contributions to the satellite structure located ∼7 eV above the main Ni 2 line [cf. Figure 6b].
As seen in Figure 6a,b, the Ni 2p spectra undergo several changes when varying the Ni content x within the ferrite films. First, the binding energy position of the Ni 2 main photoemission line (determined as the position of the maximum overall intensity) for Ni contents x < 1.0 remains constant at ∼855.2(1) eV, while it is significantly decreasing for further increasing Ni content x > 1.0 [cf. Figure 6b,c]. For Ni contents x close to the stoichiometric NiFe2O4 value of x = 1 the Ni 2 position is comparable to the value of 855.0(2) eV for Ni 2 in NiFe2O4 as reported by Kuschel et al. [32]. Since the Ni 2 position of ∼854.5 eV as reported for NiO [33] is significantly lower than the Ni 2 position in NiFe2O4, the observed subsequent decrease in the binding energy down to ∼854.7 eV for x = 2.07 is a behavior to be expected if the NiO content of the oxide film increases with increasing the Ni content x.
In addition to the decreasing Ni 2 position, the high binding energy shoulder ∼1.5 eV apart from the main line is significantly enhanced [and visibly distinguishable from the main line, cf. Figure 6b] for x > 1.35 compared to lower Ni contents x. In particular, the background subtracted area of this shoulder in relation to the total area A(Ni 2) of the Ni 2 spectrum is steadily increasing for increasing Ni content x ≥ 1.35 [cf. Figure 6d]. This shoulder can be theoretically described as a result of a screening process by electrons not originating from the oxygen orbitals around the respective Ni atom, but from neighboring clusters (with cations occupying octahedral sites) [31]. Hence, the appearance and enhancement of this shoulder can be ascribed to the presence and increasing content of NiO within the ferrite films with increasing x.
Furthermore, the satellite structure ∼7 eV above the main Ni 2 line slightly changes during variation of the Ni content x. In particular, the intensities of the two satellites at ∼859.2 (sat. 1) and ∼866.9 eV [sat. 4, cf. inset of Figure 6b] change for varying Ni content x. Figure 6d shows the summed up intensities areas = + (after background subtraction) in relation to the overall intensity A(Ni 2) of the Ni 2 spectrum. While the combined intensity of both satellites almost vanishes for low Ni contents x < 1.0, it increases with further increasing x above the stoichiometric value (x > 1.0). According to Veenendaal and Sawatzky, these satellites also result from the presence of neighboring clusters. Hence, the observed increasing intensities of both high binding energy shoulder and the mentioned satellites correspond to the enhanced formation of NiO within the ferrite films with increasing Ni amount x.
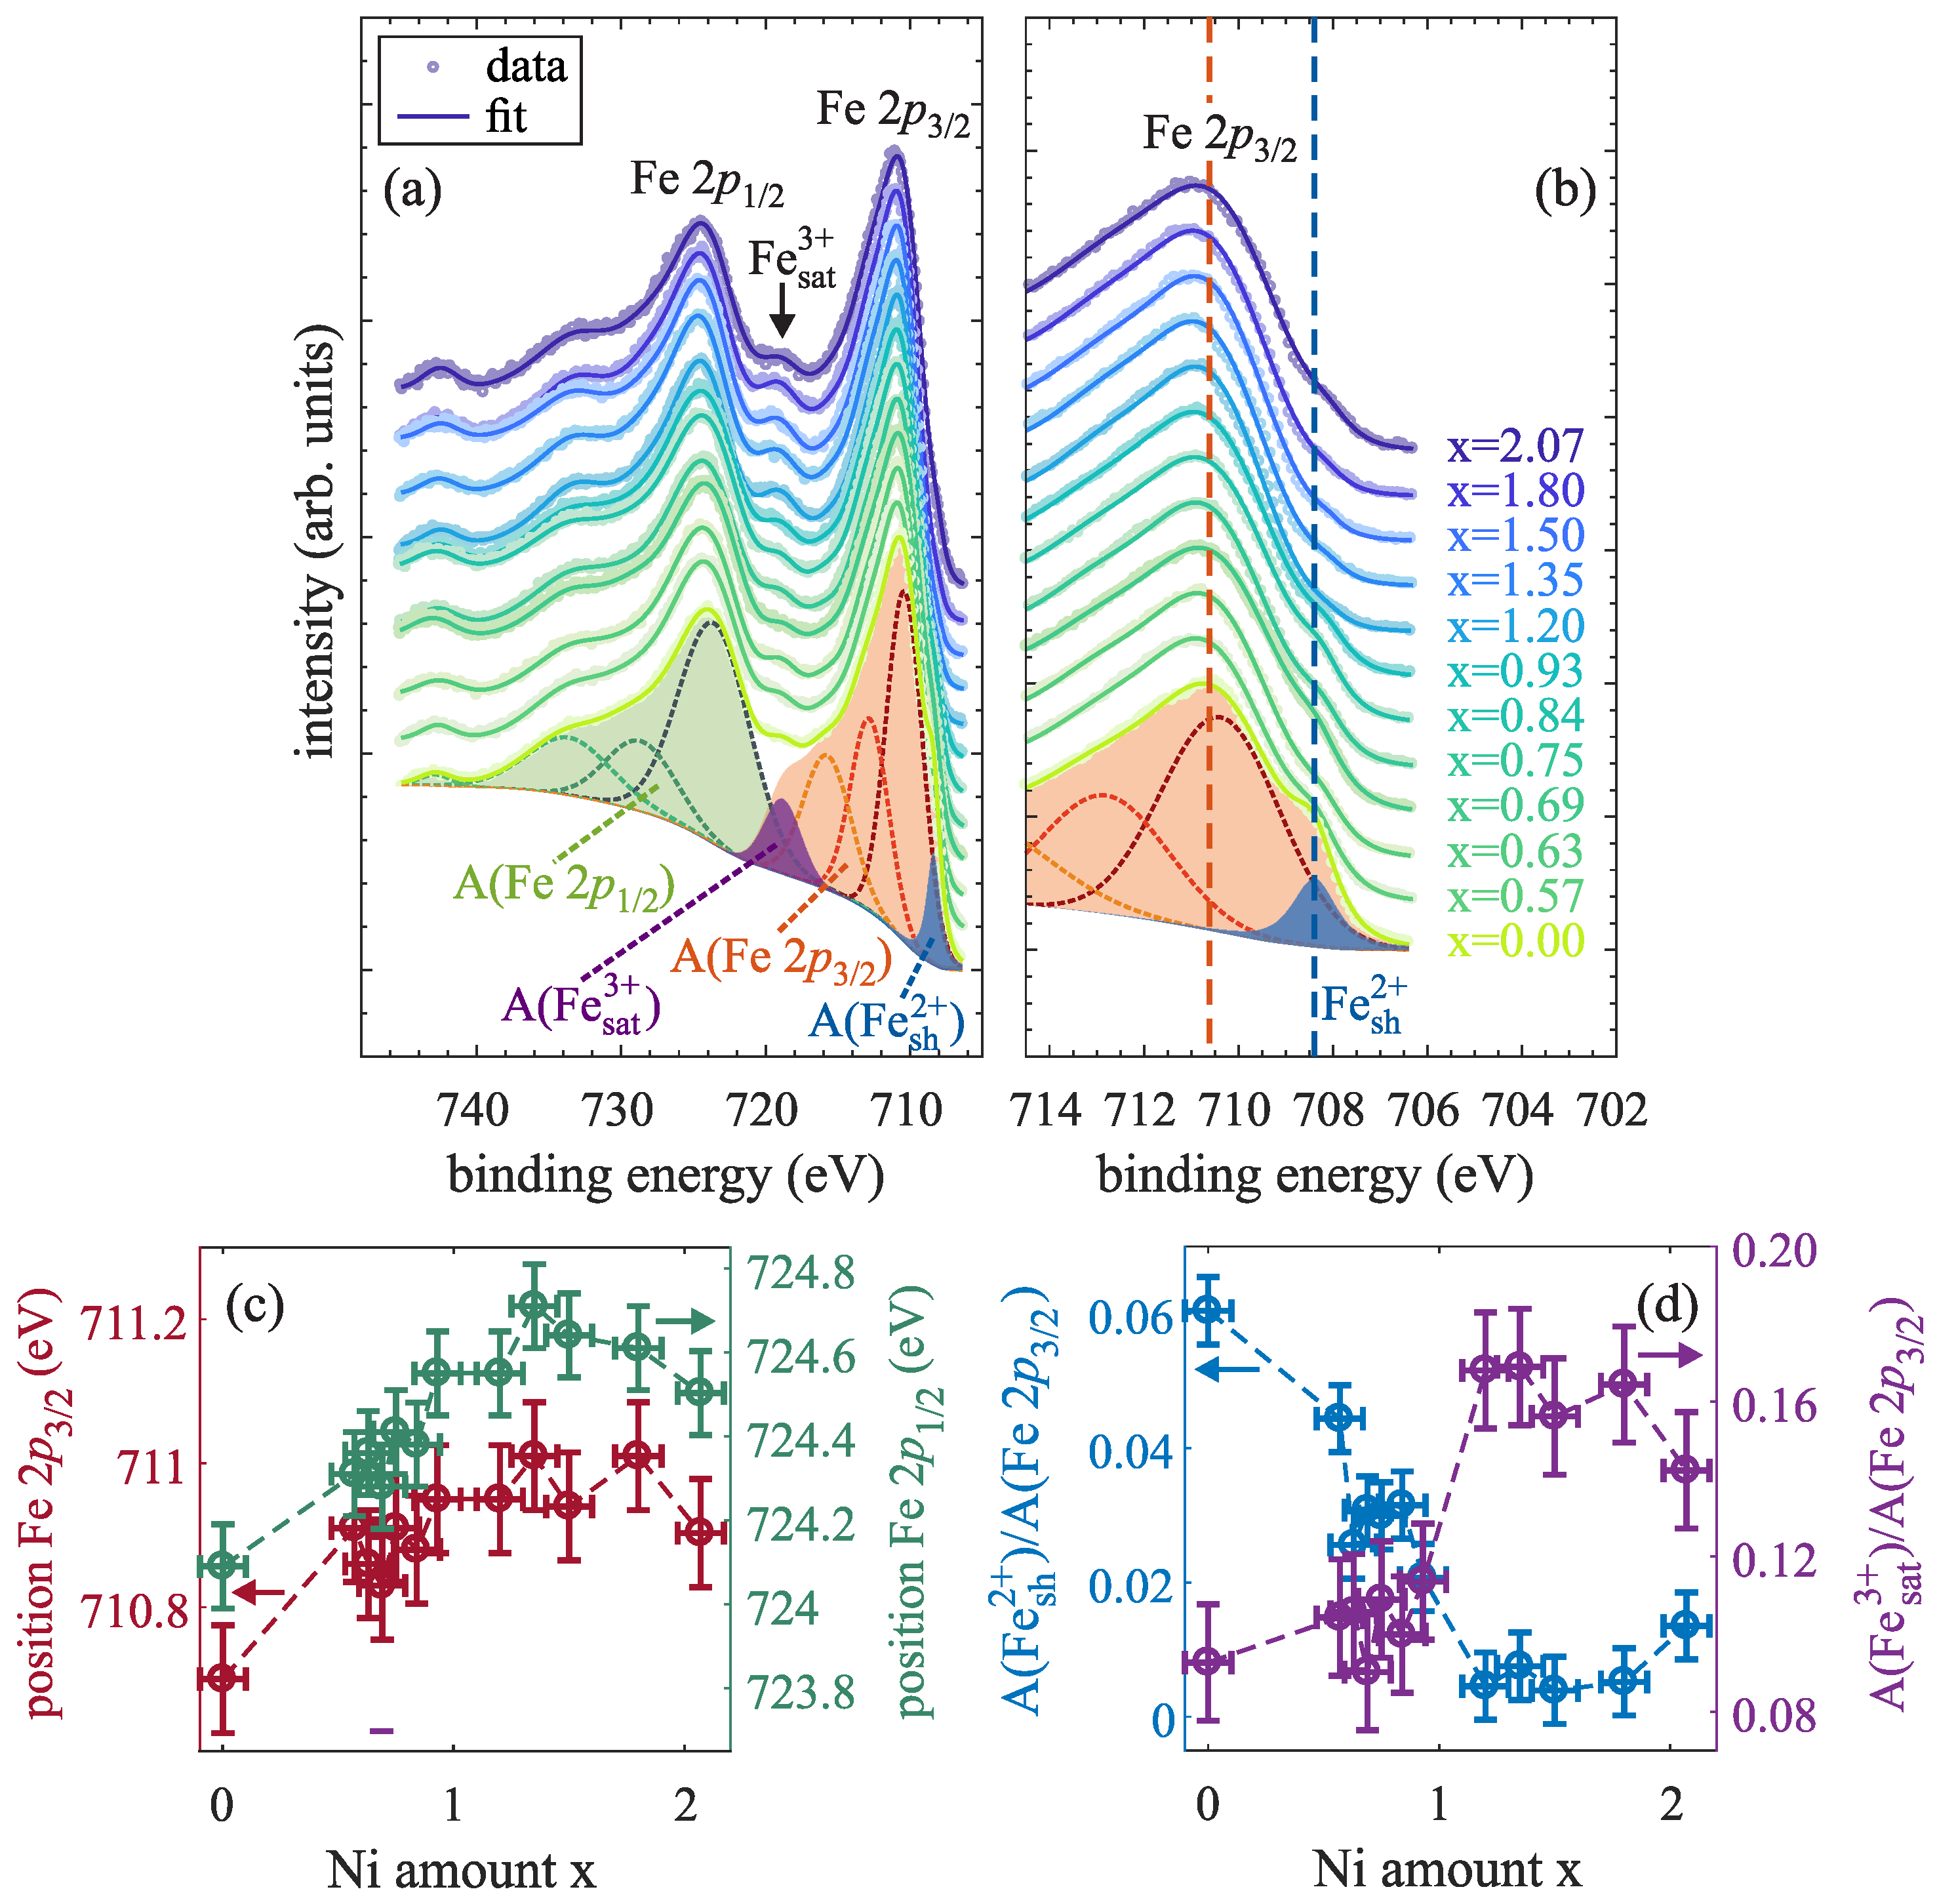
In addition, Fe 2p HAXPES spectra were recorded to determine the existent valence states of Fe cations within the ferrite films with varying Ni:Fe ratios, as depicted in Figure 7a. For analysis, both spin–orbit split Fe 2 and Fe 2 background subtracted spectra were fitted by several functions, which are each described by a convolution of a Lorentzian and a Gaussian. Also here, the Fe 2 region is analyzed in more detail. It generally consists of two peaks forming the main photoemission line as well as of two charge-transfer satellites at ∼715.6 and ∼718.8 eV, which can be assigned to the presence of and , respectively [34]. Moreover, a shoulder at the low binding energy side of the main line at ∼708.4 eV [cf. enlarged region of the Fe 2 region in Figure 7b] results from the presence of cations [30].
Figure 7.
(a) Fe 2p spectra of several prepared NixFe3−xO4 films with varying Ni content x measured by HAXPES along with overall fits (solid lines). The deconvoluted peaks for the overall fit are depicted exemplarily for the Fe3O4 film (x = 0) with filled background subtracted areas of the Fe 2 (red) and the Fe 2 spectrum (green). (b) Enlarged section of the Fe 2 region with a low binding energy shoulder of the Fe 2 main line with slightly increasing binding energy from 710.7 eV for x = 0 to 711.0 eV for x ≥ 1 (see below). Additionally, the position of the Fe 2 maximum as reported in literature for the case of Fe3O4 is marked by a (red) dashed line. (c) Positions of the maximum intensity of the Fe 2 and Fe 2 main lines. (d) Background subtracted areas of the low binding energy shoulder A() and of the satellite A() compared to the area below the whole Fe 2 spectrum A(Fe 2).
First, the binding energies of the main Fe 2 and Fe 2 lines can serve as an indication for the major Fe valency. Both values were determined as the positions of the maximum intensity of the overall fit in each region and are depicted in Figure 7c in dependence of the Ni amount x. For the Fe3O4 film (x = 0), binding energies of 710.7(1) and 724.1(1) eV are obtained for the Fe 2 and Fe 2 line, respectively, which both are in accordance with the values of stoichiometric Fe3O4 reported in literature [34]. Both positions shift to higher values for increasing Ni content in the regime x < 1. If x is further increased (x > 1), both Fe 2 and Fe 2 positions approximately remain constant at 711.0(1) and 724.6(1) eV, respectively, which agree with reported values obtained for Fe2O3, where only cations are present [34]. Thus, it seems that there are no cations but solely cations in the oxide film.
Second, the intensity peak areas A() and A() (after background subtraction) of the respective charge-transfer satellite at ∼718.8 eV and the low binding energy shoulder at ∼708.4 eV are determined in dependence of Ni content x in relation to the total area of the Fe 2 spectrum A(Fe 2) [cf. Figure 7d]. The intensity of the satellite is only slightly increasing for low but increasing Ni contents x, whereas its intensity is significantly increasing when surpassing the stoichiometric Ni content of x = 1 and almost constant for further increased Ni content x. In contrast, the intensity of the low binding energy shoulder is continuously decreasing for an increasing Ni content up to x ≈ 1, while it almost vanishes for even higher Ni content. Both observations therefore constitute a decreasing relative amount of cations when increasing the Ni content up to x = 1 in the ferrite films, whereas the relative amount is increased and constant for x > 1. Further, this behavior is in accordance with the shift to higher binding energies of the Fe 2 and Fe 2 spectra, as demonstrated above.
3.5. AR-HAXPES
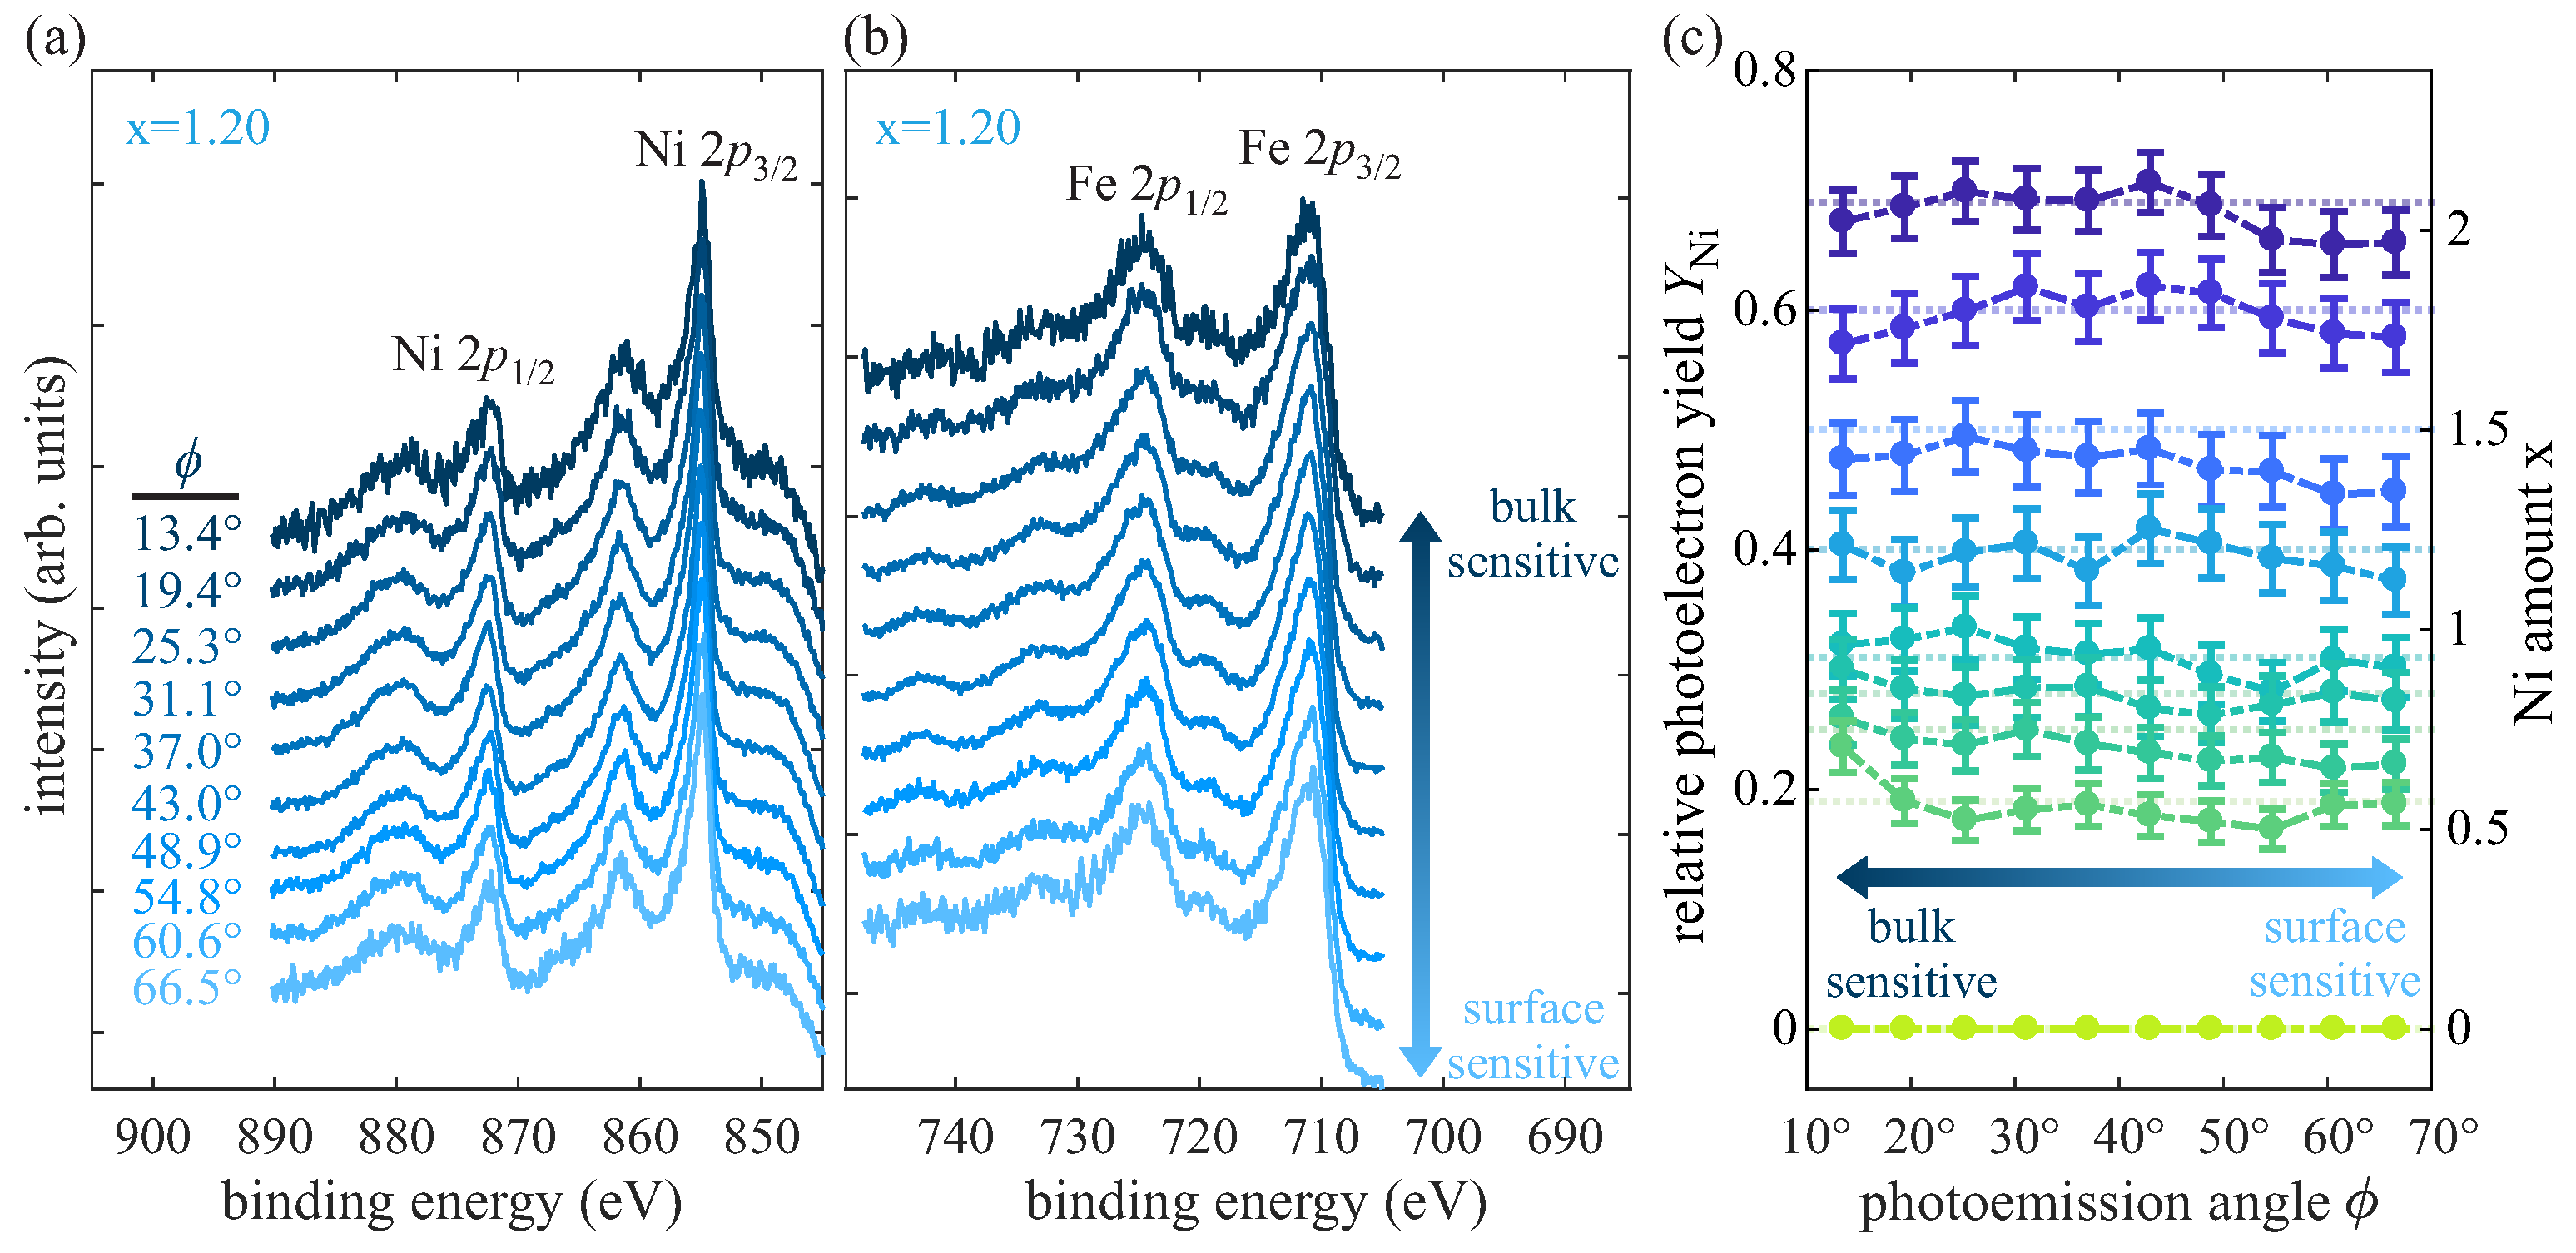
In addition to the investigation of the cationic valencies within the prepared NixFe3−xO4 films, a depth-dependent determination of the cationic stoichiometry is conducted by means of angle resolved detection of Ni 2p and Fe 2p spectra. Figure 8a,b show the respective AR-HAXPES Ni 2p and Fe 2p spectra detected at different photoelectron emission angles exemplarily for the ferrite film with x = 1.20. Lower angles of photoelectron emission correspond to a more bulk-like sensitivity, whereas higher photoelectron emission angles mean higher surface sensitivity. All Ni and Fe 2p spectra exhibit no significant deviations in shape and position among each other in dependence of the detection angle. Thus, the cationic valencies (as described above) do not change with depth. This finding points to a uniform distribution of the determined cationic oxidation states in vertical direction.
Figure 8.
(a) Ni 2p spectra and (b) Fe 2p spectra recorded at different off-normal photoemission angles for the sample with x = 1.20. Low photoelectron emission angles correspond to more bulk-like sensitivity, whereas higher photoelectron emission angles mean higher surface sensitivity. (c) Relative photoelectron yields and Ni contents x = in dependence of the photoelectron emission angle for films with varying Ni content. For comparison, the respective Ni amounts x as determined by surface sensitive XPS are indicated by dotted lines.
Further, a depth-dependent determination of the Ni amount x is performed by calculating the relative photoelectron yield [cf. Equation (2)] with the numerically integrated areas and taking into account the differential photoelectric cross sections from Trzhaskovskaya et al. under consideration of non-dipole parameters of the photoelectron angular distribution [35,36]. Prior to this, a Shirley background has been subtracted from the Ni 2p and Fe 2p spectra.
With this, the Ni content x = for each sample is determined in dependence of the photoelectron emission angle probing different depths. The results are depicted in Figure 8c along with the calculated values obtained from surface sensitive XPS (dotted lines). The Ni amount as determined by AR-HAXPES analysis shows no significant variations in dependence of the photoemission angle , indicating uniform vertical distributions of Ni and Fe cations within the films independent of the Ni content x. Further, within the experimental uncertainties the Ni amount x as determined by AR-HAXPES agrees well with the values obtained by surface sensitive XPS for all films. Hence, all films can be considered as exhibiting homogeneous cationic distributions in vertical direction without indicating the existence of layers with separated phases within the films or at the interface/surface.
3.6. XAS
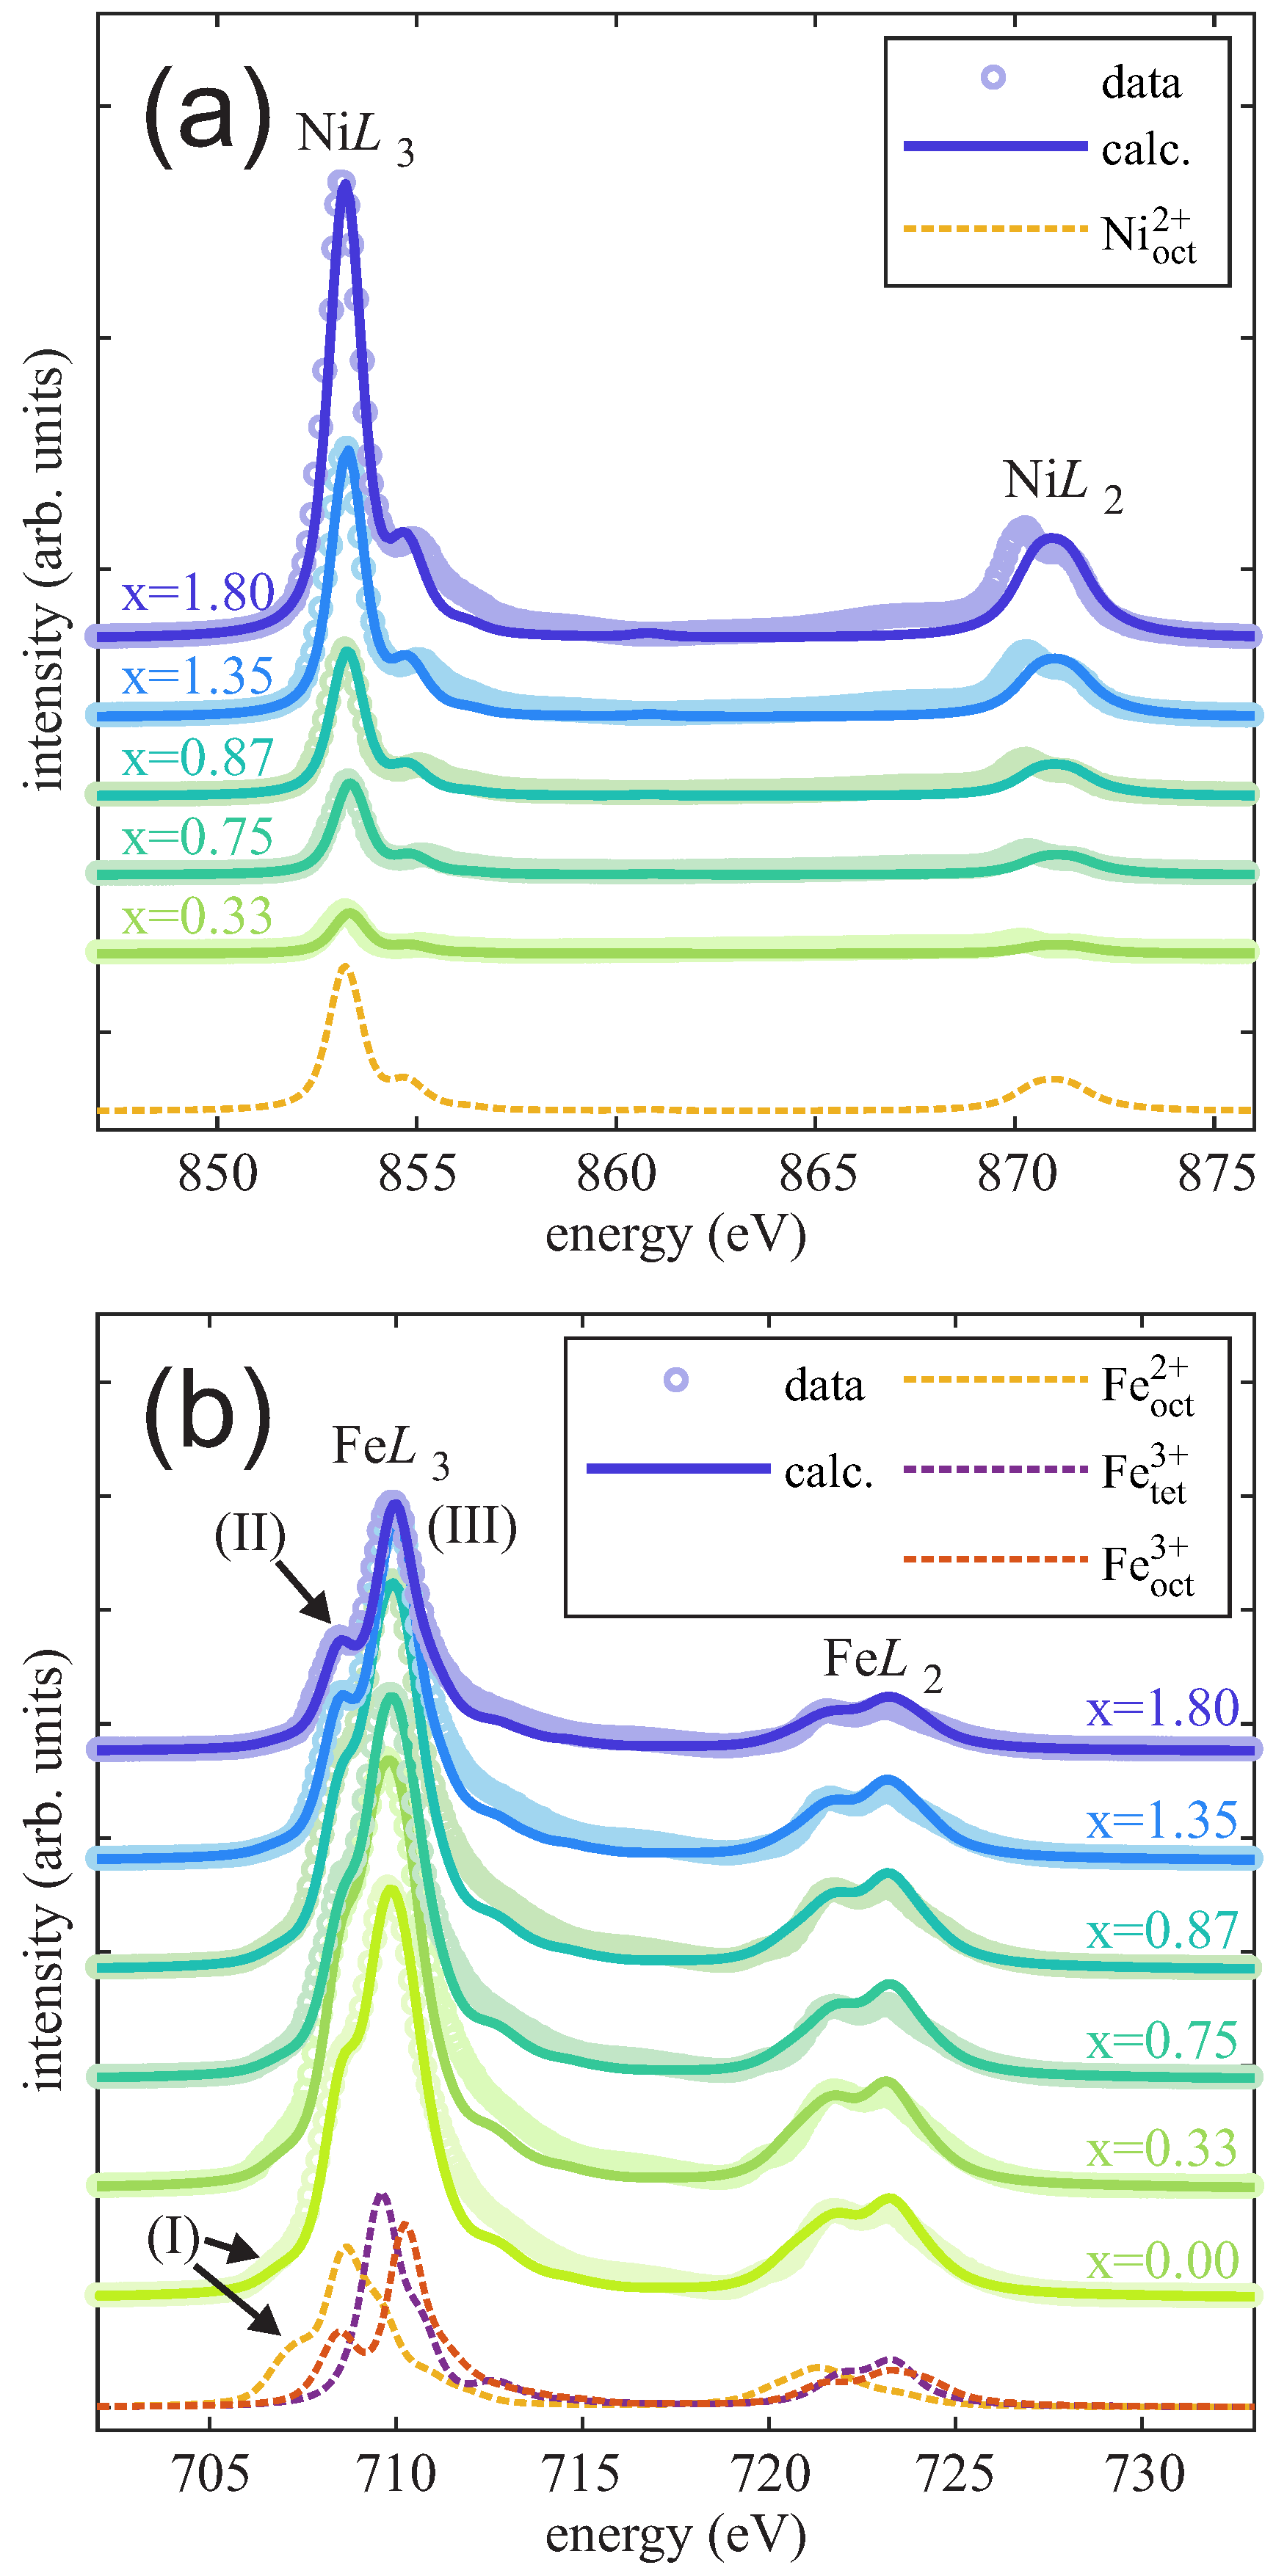
Complementary to the HAXPES measurements, XAS measurements were performed to probe the cationic valence states of Ni and Fe cations as well as their lattice site occupancies within the ferrite films. The spectra recorded at the Ni and Fe absorption edges for varying Ni content x are shown in Figure 9a and Figure 9b, respectively.
Figure 9.
XAS spectra of the ferrite films with varying Ni content x at (a) Ni edges and (b) Fe edges. Dashed lines show single contributions to the XAS spectra using CTM calculations.
As shown in Figure 9a, the overall intensity of the Ni XAS spectra increases with increasing Ni content x. However, the shapes of the spectra are independent of the Ni content x and closely resemble reported NiO and NiFe2O4 X-ray absorption spectra where cations are located on B-sublattice sites with octahedral coordination [8,29,37,38,39]. In fact, the measured spectra can be described very well by the sole CTM spectrum calculated for cations. Thus, a major presence of only cations within the films without any significant variation in the valence state or site occupancy with varying x can be assumed.
In contrast to the intensity increase of the Ni absorption spectra, the overall intensity of the total Fe XAS signal decreases with increasing Ni content x due to the decreasing relative Fe content 3−x. Similar to the Ni -edge spectra, all Fe -edge spectra agree very well with the CTM calculations. In addition to the intensity decrease, some variations in the shape of the spectra are observed. First, the pre-edge feature (I) (cf. Figure 9b) at the low energy side of the Fe edge (∼707.0 eV) is present for x < 1 but decreases and vanishes for increasing Ni content x > 1. Comparison with the CTM calculated Fe -edge spectra, this feature (I) can be attributed to the presence of octahedrally coordinated . Its decrease in intensity can therefore be assigned to the decreasing content, which is in excellent agreement with the HAXPES results (cf. Section 3.4). Second, with increasing Ni content x, a more distinct feature (II) at ∼708.5 eV becomes distinguishable from the main Fe -absorption line (III) at ∼709.9 eV. The fact that this feature (II) is clearly visible for x > 1 and not smeared out with the main Fe line also indicates the loss of , as the absorption spectrum would add significant intensity between lines (II) and (III) and result in a broader smeared out main Fe absorption line (cf. spectra presented above for Ni content x < 1) as demonstrated by the calculated CTM spectra shown in Figure 9b (dashed lines).
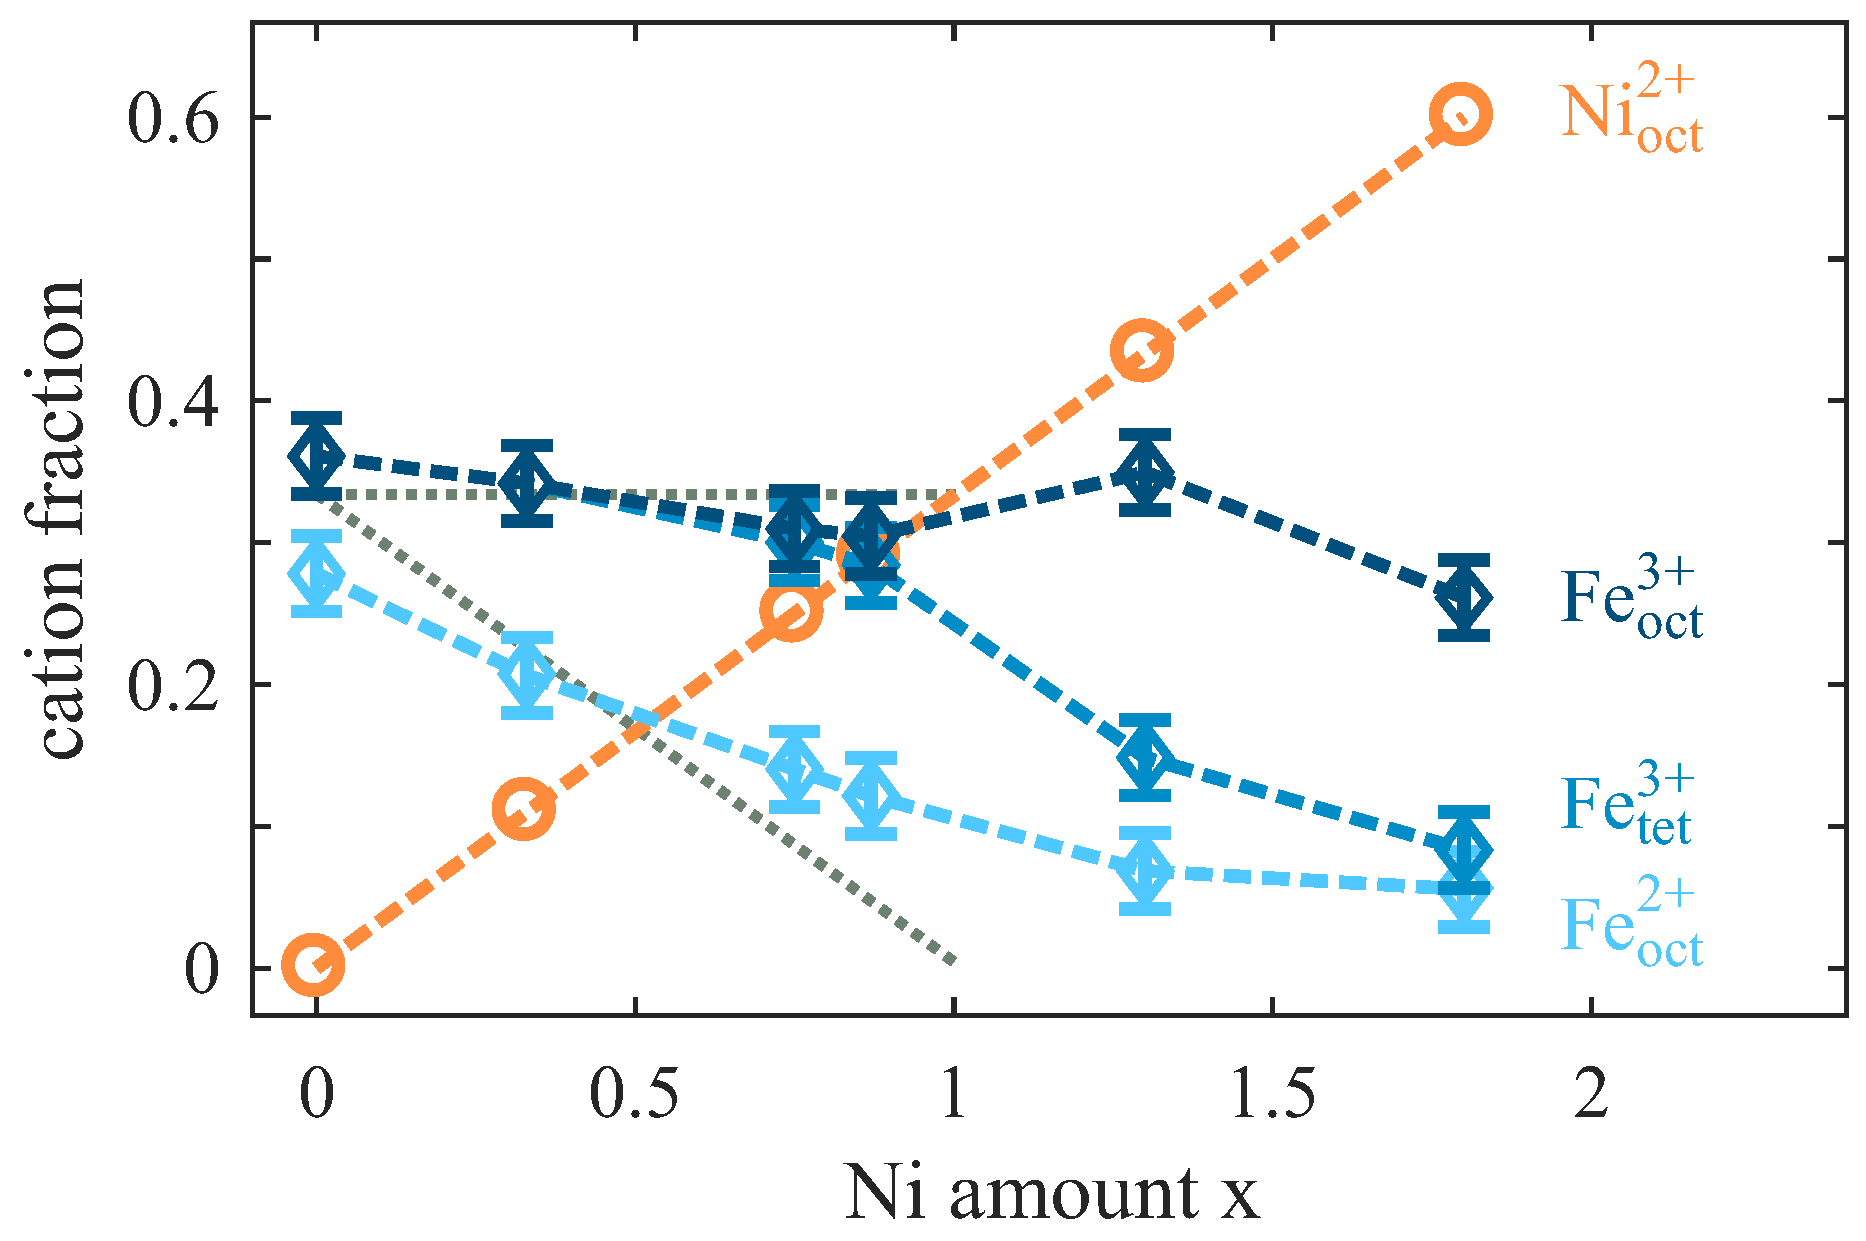
The ratio of the resulting single cationic CTM calculated spectra contributing to the experimental spectra provide the relative fraction of each cation considering oxidation state and coordination in the respective to lattice site occupancy as shown in Figure 10. For the magnetite film (x = 0), a slightly lower content in relation to the similar and contributions is observed, which at first sight contradicts stoichiometric and complete inverse spinel Fe3O4. However, as indicated by the surface cation vacancy (SCV) model for the reconstructed Fe3O4(001) surface, well-ordered Fe3O4(001) exhibits a slight excess of in the topmost layers followed by stoichiometric : ratios in the layers lying underneath [40,41]. As the XAS measurements were conducted in surface sensitive TEY mode, topmost layers contribute more to the XAS signal than to deeper layers. Thus, the observed enrichment of in the XAS data of the magnetite film is still consistent with stoichiometric Fe3O4, taking into account the SCV model for the reconstructed Fe3O4(001) surface.
Figure 10.
Fraction of the different cations for varying Ni content x in the ferrite films. The Ni fraction and the gross Fe fraction are obtained from XPS while additional CTM calculation based analysis of the XA Fe -edge spectra is used to obtain the fraction of the individual Fe cations with different oxidation state and coordination. The grey dotted lines show the expected fractions of the different Fe cations assuming that are gradually substituted by in NixFe3−xO4 for increasing Ni content x.
With increasing Ni content x, the fraction of cations continuously decreases for x < 1, whereas the number of cations almost remains constant with about one cation/f.u. (fraction 1/3) on tetra- and octehedral sites, respectively. This behavior is consistent with the successive replacement of with cations for x ≤ 1 as depicted by dotted lines in Figure 10. For x > 1, the amount of cations attains its minimum with ∼0.17 cations/f.u. (fraction 0.06) at x = 1.80. Moreover, the crucially decreases after passing the stoichiometric Ni content of x = 1, while the content almost remains constant with only a slight decrease for x = 1.80. This observation indicates the decreasing contribution of inverse spinel-type structures within the NFO films with x > 1 due to the decreasing occupancy of tetrahedral sites.
3.7. SQUID
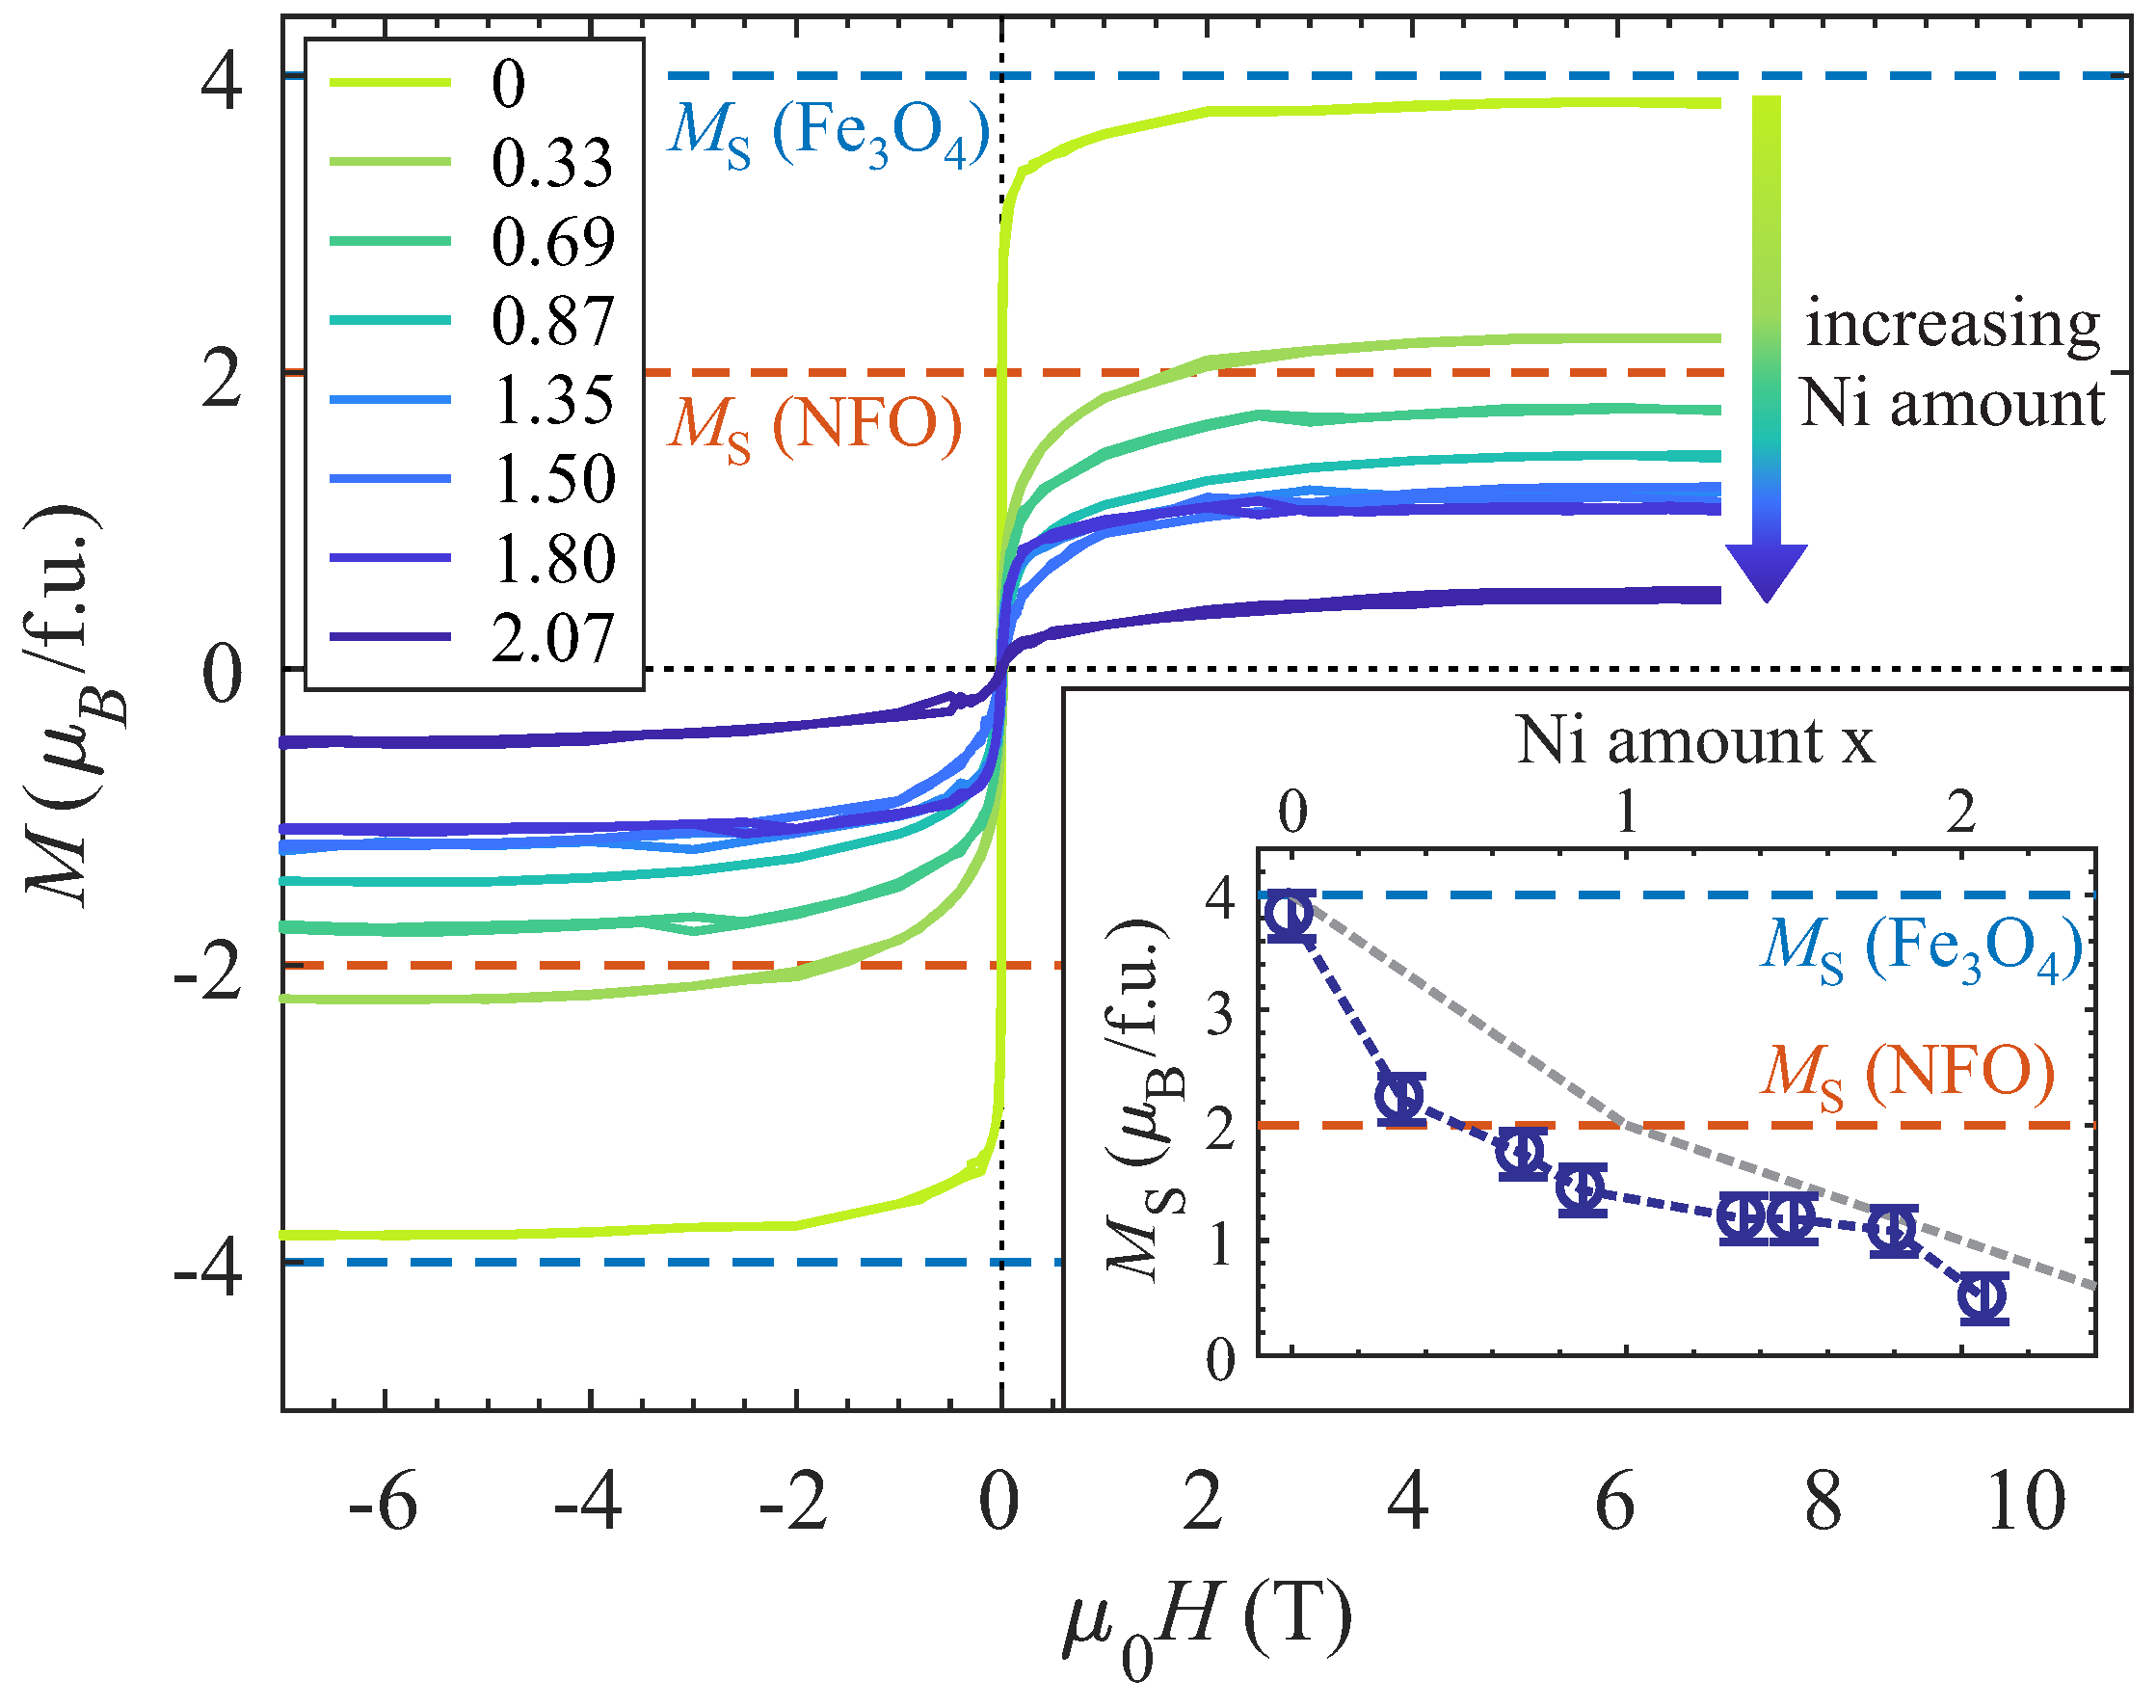
Magnetic characterization of the NixFe3−xO4 films with varying Ni content x was performed by applying SQUID magnetometry. Therefore, M vs. H measurements with a maximum applied magnetic field of ±7 T oriented parallel to the sample surface in [100] direction (according to the magnetic easy axis of Fe3O4 and NiFe2O4) of substrate and film (in-plane geometry) were conducted at 300 K sample temperature. To determine the magnetic response solely of the NixFe3−xO4 film, a linear background stemming from the MgO substrate and sampel holder was subtracted from the data. The resulting M vs. H curves are depicted in Figure 11.
Figure 11.
M vs. H measurements for NixFe3−xO4 ultrathin films with varying Ni content x measured by SQUID magnetometry. The saturation magnetization is decreasing for increasing Ni content (see inset). The values for stoichiometric Fe3O4 and NiFe2O4 (NFO) are depicted for comparison (dashed horizontal lines). If cations ideally substitute for x ≤ 1 on octahedral sites and further cations in the overstoichiometric regime x > 1 also solely occupy octahedral sites, some decrease is expected as indicated by the grey dashed line in the inset.
All magnetization curves exhibit hysteretic behavior, which is characteristic for ferro-/ferrimagnetic material, with magnetic saturation reached at an applied magnetic field above ∼5 T. However, the coercive fields (where the magnetization vanishes) is very small with values between 5 ± 2 and 20 ± 2 mT without showing any trend in dependence of the Ni content x.
In contrast, the saturation magnetization of the ferrite films exhibits a continuous decrease with increasing Ni content x (cf. inset of Figure 11). For the Fe3O4 film (x = 0), the saturation magnetization almost matches the bulk magnetization of stoichiometric Fe3O4 of 4 /f.u. (if only spin magnetic moments are considered and small orbital magnetic moments are neglected due to orbital quenching). However, already for x ≥ 0.87, the saturation magnetization drops below the expected value of 2 /f.u. for stoichiometric bulk and complete inverse spinel NiFe2O4. A further increase of Ni content x also results in a further decrease in the saturation magnetization down to a value of 0.5 /f.u. for the film with x = 2.07. If ideal substitution of by cations on octahedral sites is considered within the understoichiometric regime (x ≤ 1) a linear decrease from 4 /f.u. for x = 0 to 2 /f.u. for x = 1 would be expected (grey dashed line in the inset of Figure 11). If further incorporation of cations in the overstoichiometric regime (x > 1) solely takes place on octahedral sites, which would give rise to the formation of rock salt like coordination, and assuming only antiferromagnetic coupling in these rock salt type structures, a further decrease with a vanishing saturation magnetization should be expected (grey dashed line in the inset of Figure 11). Though, the determined values within both regimes remain below these theoretical predictions and point to some degree of disorder.
4. Discussion
As revealed by HAXPES, the overstoichiometric NixFe3−xO4 films with x > 1 exhibit almost only cations, while spectra obtained from understoichiometric films with x < 1 also show contributions due to cations. On the one hand, this result agrees well with the assumption that cations are gradually substituted by cations for increasing Ni content. On the other hand, the rising high binding energy shoulder as well as the altered satellite structure and the shift to lower binding energies of the Ni 2 photoemission spectrum for overstoichiometric films with x > 1 show that an increasing fraction of the cations is located in the NiO rocksalt configuration instead of the NFO inverse spinel configuration.
This (qualitative) result can be quantified better analyzing XAS data by CTM calculations. The analysis provides an enhanced : ratio compared to the understoichiometric regime. However, a small amount of octahedrally coordinated is still observed. More remarkably, also a crucial decrease in tetrahedrally coordinated is determined for x > 1, which can be assigned to a decreasing amount of inverse spinel-type structures in the overstoichiometric NFO films.
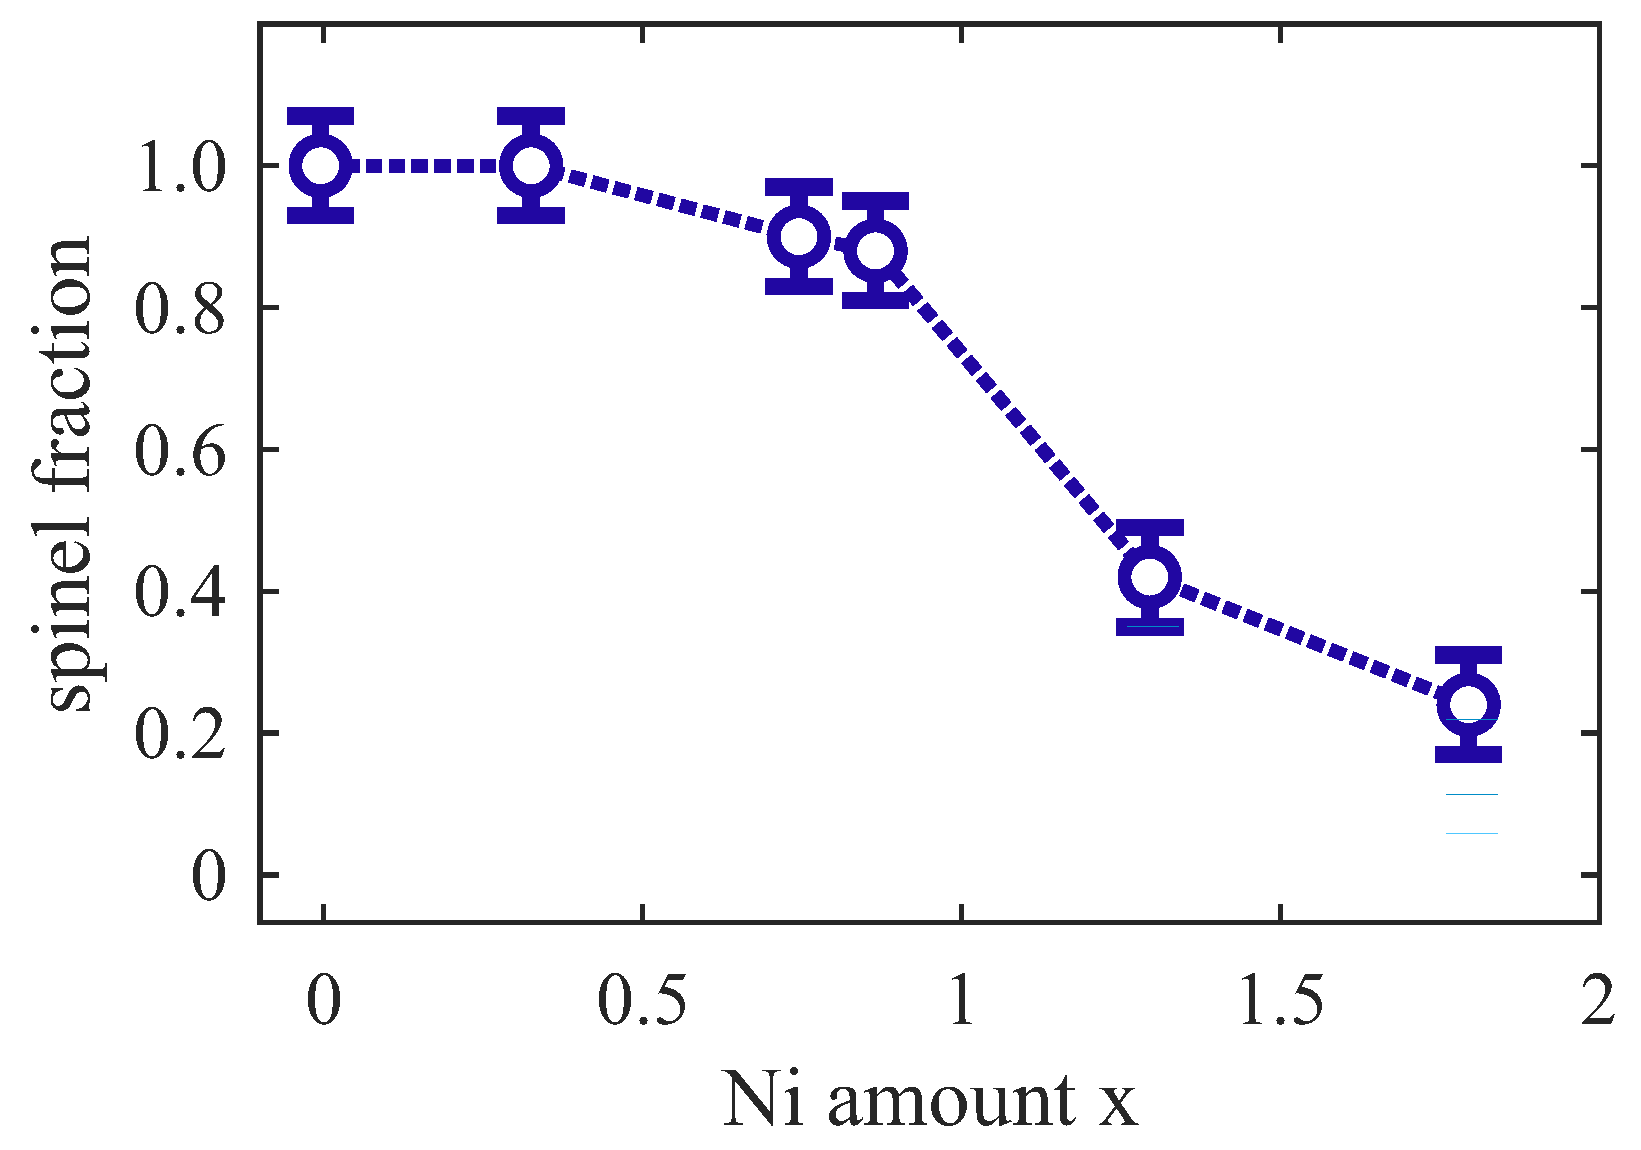
Figure 12 shows the fraction of the oxide film assuming that can be identified with the film fraction with an inverse spinel structure. Obviously, films have an inverse spinel structure for low Ni contents x≪1. For x≲1, however, there is an excess of octahedrally coordinated cations that cannot all be incorporated into the inverse spinel part of the film. Since these cations are octahedrally coordinated, it can be concluded that they are incorporated in some rocksalt-like structure, which may be of the type O (Fe-doped NiO). It has to be emphasized that the fraction of cations and cations incorporated in the inverse spinel structure or in the rocksalt structure cannot be determined.
Figure 12.
Spinel fraction of Ni-Fe oxide film identified by the fraction of tetrahedrally coordinated cations.
For x > 1, the major parts of the films have a rocksalt structure and the inverse spinel part is strongly suppressed. In addition, there is also an excess of octahedrally coordinated cations compared to the fraction of tetrahedrally coordinated (cf. Figure 10). Thus, there have to be cation vacancies in the rocksalt part of the film due to charge neutrality. Therefore, this deficient rocksalt structure may be denoted by with oxygen excess as discussed for cation ordering in Fe3O4 [42].
XRR and AR-HAXPES studies, however, give no indications of layers of additional or separated phases neither in the conversion from Fe3O4 to NiFe2O4 for x < 1 nor from NiFe2O4 to an NiO-like rocksalt phase for x > 1. In fact, both measurement techniques point to single crystalline films with homogeneous cation and valence state depth distributions. Thus, in particular, both inverse spinel parts as well as rocksalt parts are randomly distributed within the ferrite film without forming distinctly separated layers. The latter has been reported by Kuschel et al., where NiFe2O4 films were prepared by the interdiffusion of Fe3O4/NiO bilayers on (001) induced by post-deposition annealing (PDA) [32]. The final film stack of the PDA treatment exhibits a segregated NiO layer on top of the NiFe2O4 film, when the initial Ni:Fe ratio exceeds the stoichiometric ratio of 1:2. Note that the same behavior is noticed for similar PDA treatment of Fe3O4/CoO bilayers, where an ultrathin CoO layer segregates to the top of the formed CoFe2O4 film [43]. As a consequence, the co-evaporation method as performed in this study suppresses the NiO segregation to the surface due to the significantly lower sample temperature of 250 °C during film growth compared to at least 600 °C for the alternate PDA preparation method.
The finding of single crystalline films with homogeneous cationic distributions throughout the whole range of Ni content x is confirmed by the observation of only single diffraction peaks in HR-XRD measurements. Two strictly separated but coexisting phases, e.g., agglomeration in inverse spinel and rocksalt clusters with different lattice constants, would also result in different (vertical) layer distances and, therefore, in the observation of separated diffraction peaks, if the crystalline regions of each phase are sufficiently large. Finally, the Ni-Fe oxide film has an alloy-like structure mixing the locally inverse spinel and rocksalt structures without long-range order. In addition, the cation distribution in these different local structures is undetermined, and the overall structure may be denoted by [NixFe3−xO4]1−z []z.
The in situ LEED measurements on the surface structure of the ultrathin NixFe3−xO4 films reveal structural changes with varying Ni content x of the films. First, the diffraction pattern of an inverse spinel surface with a superstructure is observed for Ni content x ≪ 1. This superstructure is characteristic for Fe3O4(001) surfaces and can be observed up to a Ni contents x ≤ 0.7.
For intermediate Ni contents x ≲ 1, the superstructure vanishes, but the fundamental (1×1)S spinel pattern remains. This pattern is characteristic for NiFe2O4(001). This behavior comes along with a decreasing vertical layer distance as determined by HR-XRD analysis, which is also expected considering the decrease in bulk layer distances from Fe3O4 to NiFe2O4. These observations made in LEED and XRD therefore indicate a subsequent conversion from Fe3O4 to NiFe2O4 when increasing the Ni content x fro, x = 0 to x = 1. Further, within this conversion for x < 1, HAXPES measurements reveal a decrease in the relative content accompanied by an increase in the relative amount within the Fe cations. However, the valency remains unchanged, which indicates that the increase in the Ni content can be associated with the expected (but incomplete) exchange of by cations. This replacement with increasing x is reinforced by the quantitative analysis of XAS spectra by means of CTM calculations (see above).
For intermediate Ni contents x ≳ 1, the apparent fundamental (1×1)S spinel pattern can be observed although XAS analysis points to an increasing fraction of local rocksalt structures. However, the existing rocksalt-related LEED pattern may be hidden by the spinel-related LEED pattern since the reciprocal surface unit cell of the latter has half the size of the reciprocal rocksalt unit cell. Clear conversion of the surface structure from inverse spinel to rocksalt is observed for x > 1.5.
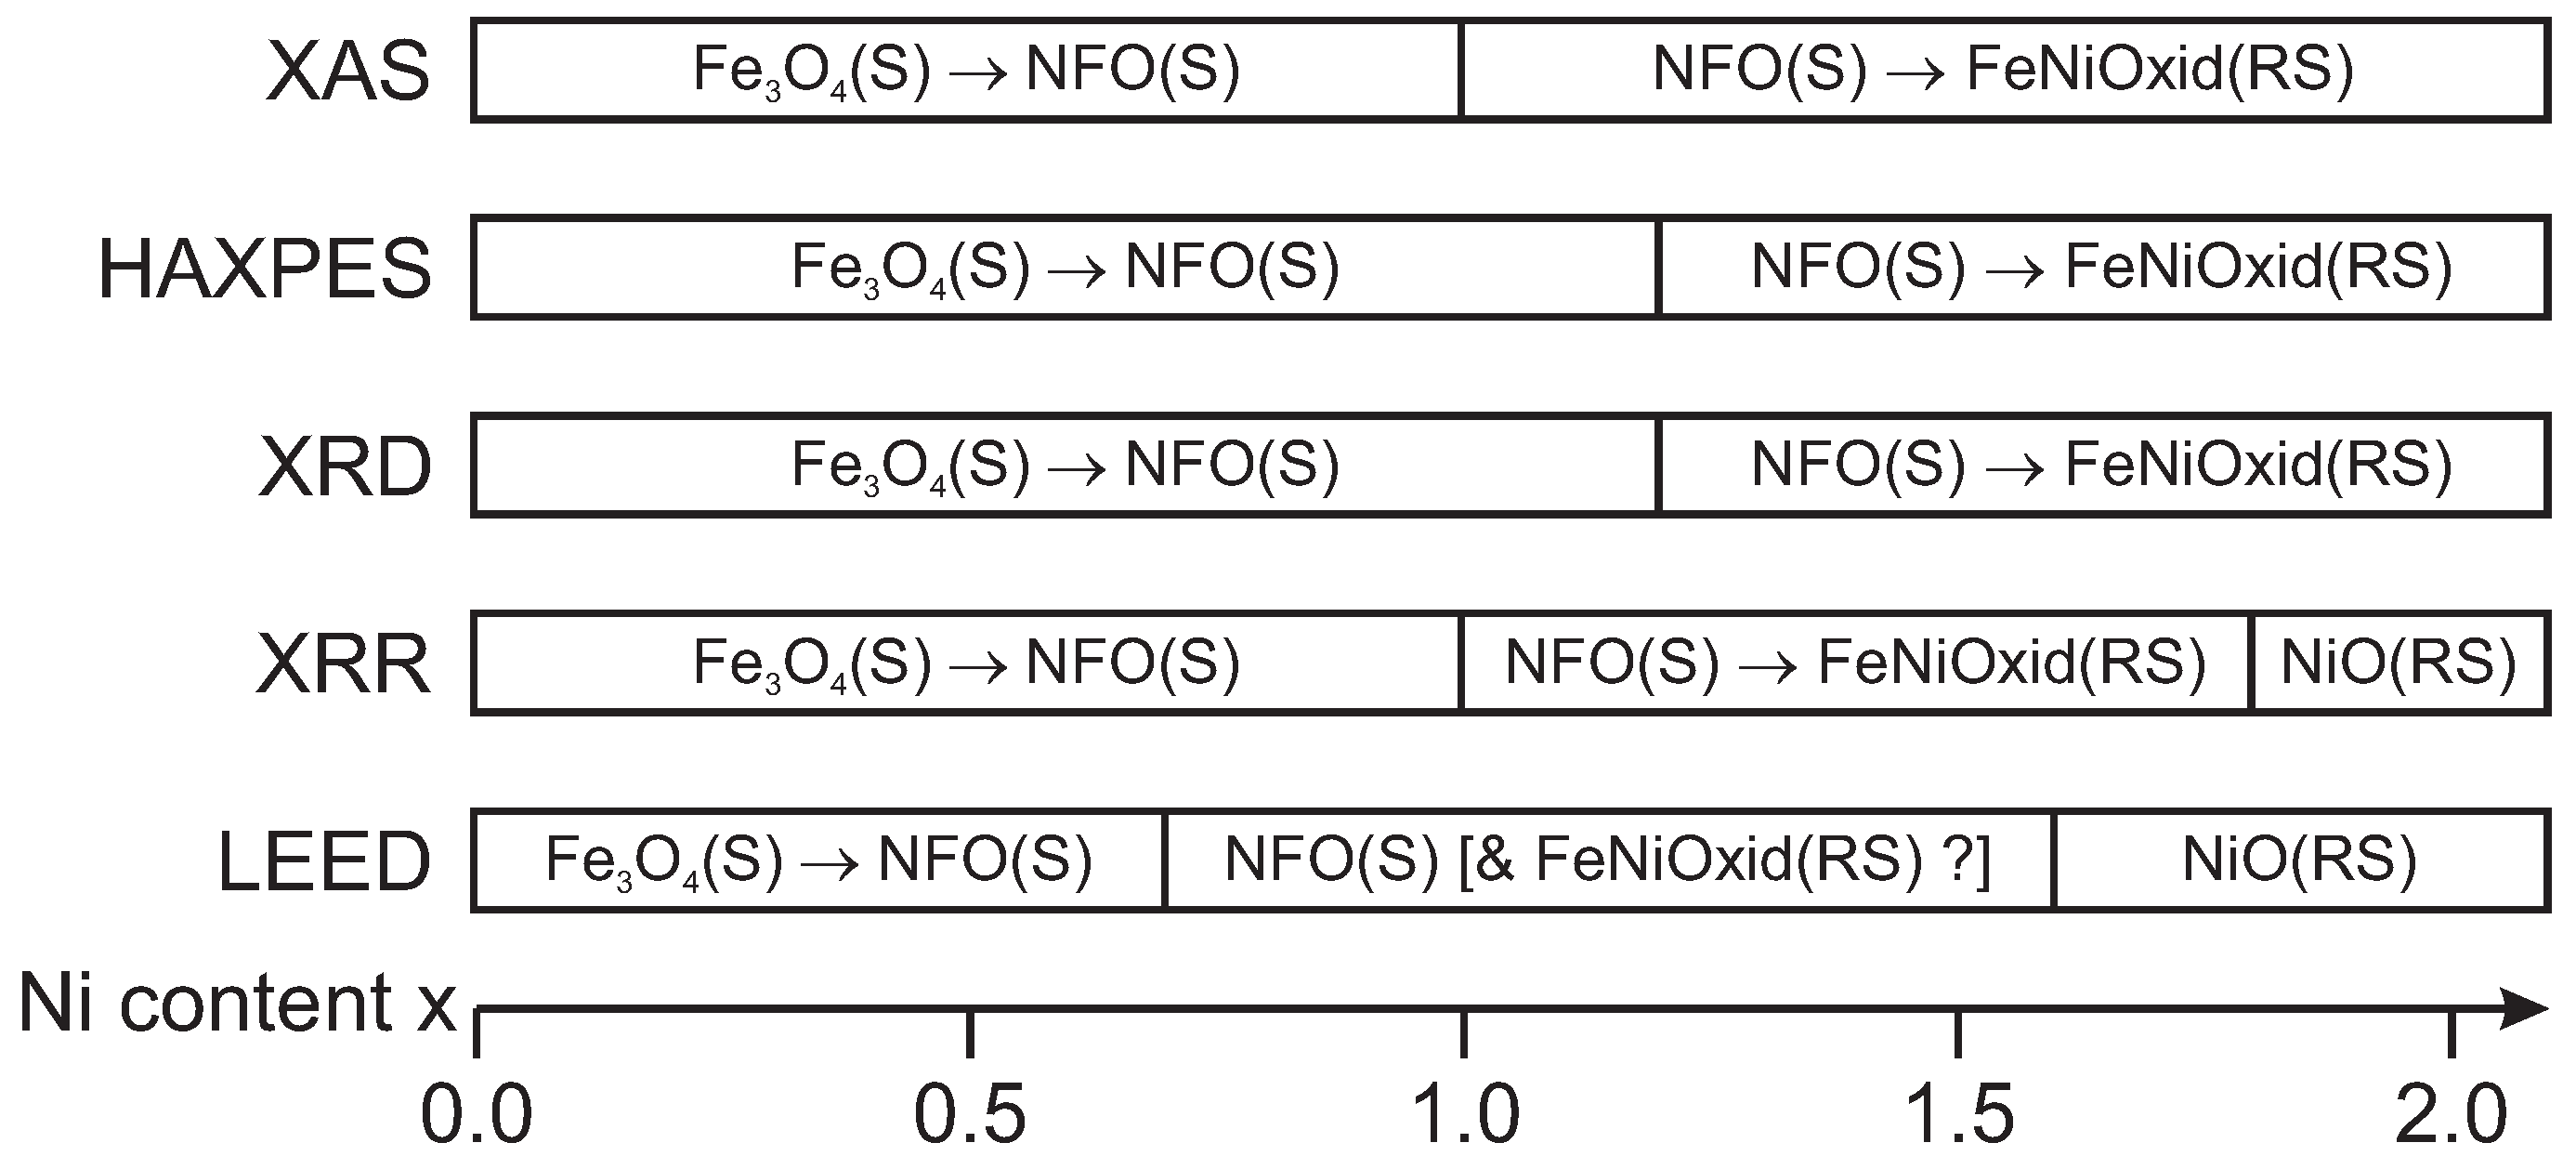
Depending on Ni content x, Figure 13 presents an overview of different phases of ultrathin NixFe3−xO4 films as determined by different experimental techniques.
Figure 13.
Overview of different phases of ultrathin NixFe3−xO4 film as determined by different experimental techniques depending on Ni content x.
This transition is in accordance with the subsequent increase in the vertical layer distance when increasing x in the overstoichiometric regime as determined by HR-XRD. This is also according to the slight increase when comparing the bulk layer distances of NiFe2O4 and NiO. In addition, due to the larger bulk NiO layer distance compared to the one of NiFe2O4, NiO exhibits a smaller lattice mismatch to the MgO substrate. This should also result in smaller vertical compressive strain, which could further explain the increased layer distances for increasing x in the overstoichiometric regime. Moreover, a significant decrease in the interface distance for x > 1.20 as determined by HR-XRD analysis also points to the formation of a different structure at the interface. However, the oxide film surface is still extremely smooth, and its roughness is only slightly increased for the overstoichiometric films compared to the understoichiometric regime.
The out-of-plane lattice constants obtained by HR-XRD are all compressively strained as can be explained by an at least partial adaption of the film to the substrate lattice (pseudomorphic growth mode) resulting in lateral expansion and vertical compression. Based on elastic theory for the continuum and implying a homogeneous tetragonally strained film structure due to in-plane tensile stress, the expected vertical layer distance can be estimated by
with as the Poisson ratio of the film material [44]. Here, c and a are the bulk vertical and lateral lattice constants, whereas and denote the respective differences between strained and bulk lattice constants. Following Equation (3) and taking the Poisson ratios for the stoichiometric cases of Fe3O4 ( = 0.356 [45]), NiFe2O4 ( = 0.338 [45]), and NiO ( = 0.297 [45]) into account, compressed vertical layer distances of = 209.1 pm, = 206.3 pm, and = 207.3 pm are obtained for the three respective stoichiometric oxides, assuming complete pseudomorphic adaption of the lateral lattice constants to the lattice constant of the MgO substrate. These estimated values [according to the lower limits of the filled regions in Figure 5a] match very well with the evolution of the measured strained vertical layer distances, which in turn confirms complete adaption of the film to the substrate lattice without any hint of strain relaxation. As a consequence thereof, all prepared ferrite films are assumed to exhibit negligible amounts of defects like misfit dislocations, which would release the applied strain. This assumption is confirmed by the complete vertical crystallinity and high crystalline quality of the ferrite films with very smooth interfaces/surfaces independent of the Ni content as determined by HR-XRD analysis.
Further, the assumed absence of strain releasing defects can be followed by estimating the theoretical critical thickness D above which misfit dislocations are incorporated into the film to release strain. Using the model of Matthews and Blakeslee [46], the critical thickness for the initial cooperation of dislocations is given by
Here, b is the magnitude of the Burgers vector, f is the modulus of the lattice mismatch, = 90° is the angle between the Burgers vector and the dislocation line, and = 45° is the angle between the Burgers vector and the direction normal to the dislocation line and within the plane of the interface. For Fe3O4 and NiFe2O4, the magnitudes of the Burgers vectors for the different involved oxides are /4 = 296.8 pm and /4 = 294.8 pm (: cubic bulk lattice constants) [47]. For NiO, the magnitude of the Burgers vector is given by /2 = 295.3 pm. Taking the respective Poisson ratios into account (see above), critical thicknesses of 103.9 nm, 27.4 nm, and 34.8 nm are obtained for Fe3O4, NiFe2O4, and NiO, respectively. All values are significantly larger than the prepared film thicknesses within this study (up to 18.6 nm) and are therefore consistent with the observed homogeneous strain. Moreover, this observation agrees with the results obtained for the off-stoichiometric NFO films in a former study [48].
Apart from the structural and electronic characterization, magnetization M vs. H measurements reveal a decrease in saturation magnetizations as it is expected for increasing Ni content x. For x = 0 (Fe3O4), the measured saturation magnetization matches the expected value of 4 /f.u. with only a slight deviation to a lower value. The subsequent decrease in for increasing x is stronger than expected for the gradual substitution of cations by cations, causing the magnetization of 2 /f.u. for stoichiometric bulk NiFe2O4 (x = 1). Here, the saturation magnetization drops below the value of 2 /f.u. already for Ni content x ≥ 0.87.
Partly, this low saturation magnetization may be due to the coexistence of a ferrimagnetic NFO spinel structure with antiferromagnetic rocksalt structures. However, major parts of this deviation could be ascribed to the presence of APBs in the ferrite films [49], which are typically formed during the film growth of the ferrite with a double-sized lattice constant compared to the one of the MgO substrate. This discrepancy forces that the islands or layers formed during film growth with nucleation centers that are non-integer multiples of the ferrite lattice constant apart from each other are out-of-phase upon merging and, thus, form APBs. Strong antiferromagnetic coupling across the APBs as it is known for, for example, Fe3O4 on MgO(001) [50], could consequently result in a lower saturation magnetization as it is observed here for all prepared ferrite films.
Further, the observed discrepancy to lower values for x > 1 could be ascribed to the decreasing : ratio and the consequently decreasing content of inverse spinel-type structures. The relative excess compared to the spinel-type structures could possibly couple antiferromagnetically in the rock-salt-like structures and would therefore not give a ferromagnetic contribution to the magnetization and give rise to an enhanced discrepancy of to lower values.
5. Conclusions
Within this study, a structural, chemical, and magnetic characterization was conducted on NixFe3−xO4 ultrathin films with thickness 16 ± 2 nm and varying Ni content x. The films were prepared by RMBE on lattice-matched MgO(001). All films are compressively strained in the vertical direction due to lateral tensile strain, resulting from an adaption of the film to the substrate lattice. As a consequence, the films are assumed to exhibit very low defect densities (except for APBs, see below) as the results and theoretical predictions show no evidence of released strain by defects like, for example, misfit dislocations. The films are completely crystalline from the interface to the surface with extremely low interface and surface roughnesses, independent of the cationic stoichiometry.
On the one hand, for understoichiometric Ni content x < 1, a successive conversion from Fe3O4 to (almost) stoichiometric NiFe2O4 with increasing x is observed while conserving the inverse spinel structure. Within this regime, octahedrally coordinated cations are replaced by cations, according to the decreasing : ratio and a constant valency as observed in HAXPES and XAS. On the other hand, for the overstoichiometric regime x > 1, a crucial decrease in tetrahedrally coordinated cations (attributed to the inverse spinel structure of NFO) is noticed and mostly and cations are present within the films, indicating a decrease in inverse spinel-type structures. Parts of the films show a local rocksalt structure for mixed Fe-Ni monoxide. However, these parts are homogeneously distributed within the films and not strictly separated from the ferrite-like NFO parts.
The saturation magnetization of the films decreases, converting Fe3O4 to NiFe2O4. However, the decrease is stronger than expected for this conversion. This result can be related to the presence of APBs, whereas the discrepancy in the overstoichiometric regime (x > 1) can be related to the presence of antiferromagnetic rocksalt structures.
Apart from the presence of APBs, all films exhibit high crystalline quality with low defect densities and sharp interfaces and surfaces, which is crucial for the implementation in spin filter applications [8,10]. Hence, from the results in the presented study, high applicability in spintronics not only for stoichiometric NiFe2O4 but also for NFO films with off-stoichiometric cationic ratios could be expected.

Author Contributions
Conceptualization, J.W., K.K. and J.R.; formal analysis, J.R.; investigation, J.R., J.T., K.R., T.P., M.H., J.S., K.K. and J.W.; data curation, J.R.; writing—original draft preparation, J.R., writing—review and editing, J.W.; visualization, J.R.; supervision, J.W.; project administration, J.W.; funding acquisition, K.K. and J.W. All authors have read and agreed to the published version of the manuscript.
Funding
This research was funded by Deutsche Forschungsgemeinschaft (DFG) grant Nos. KU2321/6-1 and WO533/20-1.
Data Availability Statement
The data presented in this study are available on reasonable request from the corresponding author.
Acknowledgments
We acknowledge DESY (Hamburg, Germany), a member of the Helmholtz Association HGF, for the provision of experimental facilities. Parts of this research were carried out at PETRA III and we would like to thank Florian Bertram and Andrei Gloskovskii for assistance in using beamlines P08 and P09, respectively. This research used resources of the Advanced Light Source, a U.S. DOE Office of Science User Facility under contract no. DE-AC02-05CH11231 and we acknowledge support by Elke Arenholz. Furthermore, financial support from the Deutsche Forschungsgemeinschaft as well as from the Open Access Publishing Fund of Osnabrück University is gratefully acknowledged. Additionally, we gratefully acknowledge A. Becker, T. Peters, T. Kuschel and G. Reiss from Bielefeld University for providing measurement time at the X-ray diffractometer to perform XRR measurements.
Conflicts of Interest
The authors declare no conflicts of interest. The funders had no role in the design of the study; in the collection, analyses, or interpretation of data; in the writing of the manuscript; or in the decision to publish the results.
References
- Bauer, G.E.W.; Saitoh, E.; van Wees, B.J. Spin caloritronics. Nat. Mater. 2012, 11, 391. [Google Scholar] [CrossRef] [Scilit] [PubMed]
- Hoffmann, A.; Bader, S.D. Opportunities at the frontiers of spintronics. Phys. Rev. Appl. 2015, 4, 047001. [Google Scholar] [CrossRef] [Scilit]
- Cibert, J.; Bobo, J.-F.; Lüders, U. Development of new materials for spintronics. C. R. Phys. 2005, 6, 977. [Google Scholar] [CrossRef] [Scilit]
- Moussy, J.-B. From epitaxial growth of ferrite thin films to spin-polarized tunnelling. J. Phys. D Appl. Phys. 2013, 46, 143001. [Google Scholar] [CrossRef] [Scilit]
- Brabers, V.A.M. Progress in spinel ferrite research. In Handbook of Magnetic Materials, Vol.8; Buschow, K.H.J., Ed.; Elsevier: Amsterdam, The Netherlands, 1995; pp. 189–324. [Google Scholar] [CrossRef] [Scilit]
- Lüders, U.; Barthélémy, A.; Bibes, M.; Bouzehouane, K.; Fusil, S.; Jacquet, E.; Contour, J.-P.; Bobo, J.-F.; Fontcuberta, J.; Fert, A. NiFe2O4: A versatile spinel material brings new opportunities for spintronics. Adv. Mater. 2006, 18, 1733. [Google Scholar] [CrossRef] [Scilit]
- Matzen, S.; Moussy, J.-B.; Mattana, R.; Bouzehouane, K.; Deranlot, C.; Petroff, F. Nanomagnetism of cobalt ferrite-based spin filters probed by spin-polarized tunneling. Appl. Phys. Lett. 2012, 101, 042409. [Google Scholar] [CrossRef] [Scilit]
- Matzen, S.; Moussy, J.-B.; Wei, P.; Gatel, C.; Cezar, J.C.; Arrio, M.A. Structure, magnetic ordering, and spin filtering efficiency of NiFe2O4(111) ultrathin films. Appl. Phys. Lett. 2014, 104, 182404. [Google Scholar] [CrossRef] [Scilit]
- Ramos, A.V.; Guittet, M.-J.; Moussy, J.-B.; Mattana, R.; Deranlot, C.; Petroff, F.; Gatel, C. Room temperature spin filtering in epitaxial cobalt-ferrite tunnel barriers. Appl. Phys. Lett. 2007, 91, 122107. [Google Scholar] [CrossRef] [Scilit]
- Miller, C.W.; Beleya, D.D. Impact of interfacial roughness on spin filter tunneling. Appl. Phys. Lett. 2010, 96, 022511. [Google Scholar] [CrossRef] [Scilit]
- Lenglet, M.; D’Huysser, A.; Jørgensen, C.K. Optical spectra, X-ray photoelectron spectra and XANES of divalent nickel in mixed spinels NiFe2−xCrxO4. Inorg. Chim. Acta 1987, 133, 61. [Google Scholar] [CrossRef] [Scilit]
- Moyer, J.A.M.; Vaz, C.A.F.; Negusse, E.; Arena, D.A.; Henrich, V.E. Controlling the electronic structure of Co1−xFe2+xO4 thin films through iron doping. Phys. Rev. B 2011, 83, 035121. [Google Scholar] [CrossRef] [Scilit]
- Moyer, J.A.M.; Kumah, D.P.; Vaz, C.A.F.; Arena, D.A.; Henrich, V.E. Epitaxial strain-induced changes in the cation distribution and resistivity of Fe-doped CoFe2O4. Appl. Phys. Lett. 2012, 101, 021907. [Google Scholar] [CrossRef] [Scilit]
- de Biasi, R.S.; dos Santos, H.F. Cation distribution, saturation magnetization and magnetocrystalline anisotropy of mixed ferrite NiAlxFe2−xO4 nanoparticles. Ceram. Int. 2017, 43, 4557. [Google Scholar] [CrossRef] [Scilit]
- Parratt, L.G. Surface studies of solids by total reflection of X-rays. Phys. Rev. 1954, 95, 359. [Google Scholar] [CrossRef] [Scilit]
- Névot, L.; Croce, P. Caractérisation des surfaces par réflexion rasante de rayons X. Application à l’étude du polissage de quelques verres silicates. Revue Phys. Appliquée 1980, 15, 761. [Google Scholar] [CrossRef] [Scilit]
- Tanuma, S.; Powell, C.J.; Penn, D.R. Calculations of electron inelastic mean free paths. V. Data for 14 organic compounds over the 50–2000eV range. Surf. Interface Anal. 1994, 21, 165. [Google Scholar] [CrossRef] [Scilit]
- Gota, S.; Gautier-Soyer, M.; Sacchi, M. Fe 2p absorption in magnetic oxides: Quantifying angular-dependent saturation effects. Phys. Rev. B 2000, 62, 4187. [Google Scholar] [CrossRef] [Scilit]
- Kallmayer, M.; Hild, K.; Elmers, H.J.; Arora, S.K.; Wu, H.-C.; Sofin, R.G.S.; Shvets, I.V. Magnetic moment investigations of epitaxial magnetite thin films. J. Appl. Phys. 2008, 103, 07D715. [Google Scholar] [CrossRef] [Scilit]
- Cowan, R.D. The Theory of Atomic Structure and Spectra, 1st ed.; University of California Press: Oakland, CA, USA, 1981. [Google Scholar]
- Crocombette, J.P.; Pollak, M.; Jollet, F.; Thromat, N.; Gautier-Soyer, M. X-ray absorption spectroscopy at the Fe L2,3 threshold in iron oxides. Phys. Rev. B 1995, 52, 3143. [Google Scholar] [CrossRef] [Scilit]
- Kuiper, P.; Searle, B.G.; Duda, L.-C.; Wolf, R.M.; van der Zaag, P.J. Fe L2,3 linear and circular magnetic dichroism of Fe3O4. J. Electron Spectrosc. Relat. Phenom. 1997, 86, 107. [Google Scholar] [CrossRef] [Scilit]
- Arenholz, E.; van der Laan, G.; Chopdekar, R.V.; Suzuki, Y. Anisotropic X-ray magnetic linear dichroism at the Fe L2,3 edges in Fe3O4. Phys. Rev. B 2006, 74, 094407. [Google Scholar] [CrossRef] [Scilit]
- Miedema, P.S.; de Groot, F.M.F. The iron L edges: Fe 2p X-ray absorption and electron energy loss spectroscopy. J. Electron. Spectrosc. Relat. Phenom. 2013, 187, 32. [Google Scholar] [CrossRef] [Scilit]
- Kuepper, K.; Kuschel, O.; Pathé, N.; Schemme, T.; Schmalhorst, J.; Thomas, A.; Arenholz, E.; Gorgoi, M.; Ovsyannikov, R.; Bartkowski, S.; et al. Electronic and magnetic structure of epitaxial Fe3O4(001)/NiO heterostructures grown on MgO(001) and Nb-doped SrTiO3(001). Phys. Rev. B 2016, 94, 024401. [Google Scholar] [CrossRef] [Scilit]
- Chen, J.; Huang, D.J.; Tanaka, A.; Chang, C.F.; Chung, S.C.; Wu, W.B.; Chen, C.T. Magnetic circular dichroism in Fe 2p resonant photoemission of magnetite. Phys. Rev. B 2004, 69, 085107. [Google Scholar] [CrossRef] [Scilit]
- Scofield, J.H. Hartree-Slater subshell photoionization cross-sections at 1254 and 1487 eV. J. Electron Spectrosc. Relat. Phenom. 1976, 8, 129. [Google Scholar] [CrossRef] [Scilit]
- Henke, B.L.; Gullikson, E.M.; Davis, J.C. X-ray interactions: Photoabsorption, scattering, transmission, and reflection at E = 50–30,000 eV, Z = 1–92. At. Data Nucl. Data Tables 1993, 54, 181. [Google Scholar] [CrossRef] [Scilit]
- Alders, D.; Voogt, F.C.; Hibma, T.; Sawatzky, G.A. Nonlocal screening effects in 2p X-ray photoemission spectroscopy of NiO(100). Phys. Rev. B 1996, 54, 7716. [Google Scholar] [CrossRef] [Scilit]
- Biesinger, M.C.; Payne, B.P.; Grosvenor, A.P.; Lau, L.W.M.; Gerson, A.R.; Smart, R.S.C. Resolving surface chemical states in XPS analysis of first row transition metals, oxides and hydroxides: Cr, Mn, Fe, Co and Ni. Appl. Surf. Sci. 2011, 257, 2717. [Google Scholar] [CrossRef] [Scilit]
- van Veenendaal, M.A.; Sawatzky, G.A. Nonlocal screening effects in 2p X-ray photoemission spectroscopy core-level line shapes of transition metal compounds. Phys. Rev. Lett. 1993, 70, 2459. [Google Scholar] [CrossRef] [Scilit]
- Kuschel, O.; Buß, R.; Spiess, W.; Schemme, T.; Wöllermann, J.; Balinski, K.; N’Diaye, A.T.; Kuschel, T.; Wollschläger, J.; Kuepper, K. From Fe3O4/NiO bilayers to NiFe2O4-like thin films through Ni interdiffusion. Phys. Rev. B 2016, 94, 094423. [Google Scholar] [CrossRef] [Scilit]
- Carley, A.F.; Jackson, S.D.; O’Shea, J.N.; Roberts, M.W. The formation and characterisation of Ni3+—An X-ray photoelectron spectroscopic investigation of potassium-doped Ni(110)-O. Surf. Sci. 1999, 440, L868. [Google Scholar] [CrossRef] [Scilit]
- Yamashita, T.; Hayes, P. Analysis of XPS spectra of Fe2+ and Fe3+ ions in oxide materials. Appl. Surf. Sci. 2008, 59, 3195. [Google Scholar] [CrossRef] [Scilit]
- Trzhaskovskaya, M.B.; Nefedov, V.I.; Yarzhemsky, V.G. Photoelectron angular distribution parameters for elements Z = 1 to Z = 54 in the photoelectron energy range 100–5000 eV. At. Data Nucl. Data Tables 2001, 77, 97. [Google Scholar] [CrossRef] [Scilit]
- Trzhaskovskaya, M.B.; Nikulin, V.K.; Nefedov, V.I.; Yarzhemsky, V.G. Non-dipole second order parameters of the photoelectron angular distribution for elements Z = 1–100 in the photoelectron energy range 1–10 keV. At. Data Nucl. Data Tables 2006, 92, 245. [Google Scholar] [CrossRef] [Scilit]
- Regan, T.J.; Ohldag, H.; Stamm, C.; Nolting, F.; Lüning, J.; Stöhr, J.; White, R.L. Chemical effects at metal/oxide interfaces studied by X-ray-absorption spectroscopy. Phys. Rev. B 2001, 64, 214422. [Google Scholar] [CrossRef] [Scilit]
- van der Laan, G.; Henderson, C.M.B.; Pattrick, R.A.D.; Dhesi, S.S.; Schofield, P.F.; Dudzik, E.; Vaughan, D.J. Orbital polarization in NiFe2O4 measured by Ni 2p X-ray magnetic circular dichroism. Phys. Rev. B 1999, 59, 4314. [Google Scholar] [CrossRef] [Scilit]
- Wakabayashi, Y.K.; Nonaka, Y.; Takeda, Y.; Sakamoto, S.; Ikeda, K.; Chi, Z.; Shibata, G.; Tanaka, A.; Saitoh, Y.; Yamagami, H.; et al. Cation distribution and magnetic properties in ultrathin Ni1−xCoxFe2O4 (x = 0–1) layers on Si(111) studied by soft X-ray magnetic circular dichroism. Phys. Rev. Mater. 2018, 2, 104416. [Google Scholar] [CrossRef] [Scilit]
- Bliem, R.; McDermott, E.; Ferstl, P.; Setvin, M.; Gamba, O.; Pavelec, J.; Schneider, M.A.; Schmid, M.; Diebold, U.; Blaha, P.; et al. Subsurface cation vacancy stabilization of the magnetite (001) surface. Science 2014, 346, 1215. [Google Scholar] [CrossRef] [Scilit] [PubMed]
- Parkinson, G.S. Iron oxide surfaces. Surf. Sci. Rep. 2016, 71, 272. [Google Scholar] [CrossRef] [Scilit]
- Bertram, F.; Deiter, C.; Schemme, T.; Jentsch, S.; Wollschläger, J. Reordering between tetrahedral and octahedral sites in ultrathin magnetite films grown on MgO(001). J. Appl. Phys. 2013, 113, 184103. [Google Scholar] [CrossRef] [Scilit]
- Rodewald, J.; Thien, J.; Pohlmann, T.; Hoppe, M.; Timmer, F.; Bertram, F.; Kuepper, K.; Wollschläger, J. Formation of ultrathin cobalt ferrite films by interdiffusion of Fe3O4 bilayers. Phys. Rev. B 2019, 100, 155418. [Google Scholar] [CrossRef] [Scilit]
- Hashimoto, S.; Peng, J.-L.; Gibson, W.M.; Schowalter, L.J.; Fathauer, R.W. Strain measurement of epitaxial CaF2 on Si(111) by MeV ion channeling. Appl. Phys. Lett. 1985, 47, 1071. [Google Scholar] [CrossRef] [Scilit]
- Every, A.G.; McCurdy, A.K. Second and higher order elastic constants. In Landolt-Börnstein-Group III Condensed Matter, Vol. 29A; Nelson, D.F., Ed.; Springer: Berlin/Heidelberg, Germany, 1992. [Google Scholar] [CrossRef] [Scilit]
- Matthews, J.W.; Blakeslee, A.E. Defects in epitaxial multilayers: I. Misfit dislocations. J. Cryst. Growth 1974, 11, 264. [Google Scholar] [CrossRef] [Scilit]
- Mitchell, T.E.; Hwang, L.; Heuer, A.H. Deformation in spinel. J. Mater. Sci. 1976, 27, 118. [Google Scholar] [CrossRef] [Scilit]
- Rodewald, J.; Thien, J.; Pohlmann, T.; Hoppe, M.; Bertram, F.; Kuepper, K.; Wollschläger, J. Real-time monitoring the growth of strained off-stoichiometric NixFe3−xO4 ultrathin films on MgO(001). Appl. Phys. Lett. 2020, 117, 011601. [Google Scholar] [CrossRef] [Scilit]
- Ikeuchi, A.; Hiura, S.; Mizuno, T.; Kaji, E.; Subagyo, A.; Sueoka, K. Atomically resolved observations of antiphase domain boundaries in epitaxial Fe3O4 films on MgO(001) by scanning tunneling microscopy. Jpn. J. Appl. Phys. 2012, 51, 08KB02. [Google Scholar] [CrossRef] [Scilit]
- Margulies, D.T.; Parker, F.T.; Rudee, M.L.; Spada, F.E.; Chapman, J.N.; Aitchison, P.R.; Berkowitz, A.E. Origin of the anomalous magnetic behavior in single crystal Fe3O4 films. Phys. Rev. Lett. 1997, 79, 5162. [Google Scholar] [CrossRef] [Scilit]
Disclaimer/Publisher’s Note: The statements, opinions and data contained in all publications are solely those of the individual author(s) and contributor(s) and not of MDPI and/or the editor(s). MDPI and/or the editor(s) disclaim responsibility for any injury to people or property resulting from any ideas, methods, instructions or products referred to in the content. |
© 2024 by the authors. Licensee MDPI, Basel, Switzerland. This article is an open access article distributed under the terms and conditions of the Creative Commons Attribution (CC BY) license (https://creativecommons.org/licenses/by/4.0/).