


Abstract
The digital revolution has transformed the face of mass media from a one-way channel to an interactive space that dynamically shapes public opinion. In Indonesia, this dynamic is increasingly crucial as the media oversees law enforcement amid a surge of scandals involving officials. This paper investigated how YouTube shapes public perceptions of the crisis of trust in law enforcement. Unlike previous qualitative research, we employed a quantitative approach grounded in data science and social computing. Using zero-shot prompt engineering techniques in large language models (LLMs), we analyzed the relationship between editorial stance and audience response. This paper utilized media stance detection to identify editorial positions, sentiment analysis to dissect opinion polarity, named entity recognition (NER) to map the targets of these sentiments, and pseudo-labeling techniques for the morality dimension. Our findings revealed an interesting pattern: while the model classified the stance as neutral, on the contrary, the model captured predominantly negative sentiment with a strong focus on individual actors and moral framing in digital discourse.
1. Introduction
The digital revolution fundamentally reconfigures the global communications landscape, forcing conventional mass media to shift toward digital convergence. Media platforms now serve as interactive spaces that actively construct social reality and shape public perception [1] rather than merely acting as passive conduits of one-way information. Within this sophisticated ecosystem, they not only reflect the world but also selectively frame narratives to influence public opinion, acquire institutional trust, or conversely, expose systemic opacity [2].
The media inevitably exhibits bias in its news coverage, whether intentional or not. This is normal, as the media emphasize certain aspects of the news, leading to less objective and more biased reporting. This bias manifests through selective news framing and polarization across various stages of content production [3]. Empirical evidence suggests that news narratives implicitly embed the author’s stance, whether supportive, oppositional, or impartial toward a specific target [4]. In academic discourse, this textual stance serves as a critical barometer for measuring media bias, verifiability, framing strategies, and diachronic shifts in public rhetoric [4,5,6].
Recently, mainstream media have increasingly disseminated and updated news through platforms like YouTube to maximize audience reach and foster interactivity. However, this shift has had a negative impact: recommendation engines inadvertently create echo chambers, filter bubbles, and user homophily. These algorithmic architectures accelerate opinion polarization, catalyzing socio-political friction and eroding democratic consensus [7].
In developing democracies like Indonesia, the relationship between algorithms and media critically intersects with a deepening institutional crisis. Over the past decade, Indonesian law enforcement has faced intense public cynicism driven by high-profile scandals involving law enforcement officials. The judiciary is widely perceived not as an arbiter of justice but rather as an instrument of power that protects elite interests while marginalizing the underprivileged (an incongruity expressed by the popular adage, “the law is sharp downward but blunt upward”) [8,9]. This has also become a focus for media outlets, which strive to inform and disseminate news quickly and in a balanced manner.
This pervasive crisis of institutional trust has culminated in the digital space known as “No Viral No Justice” or “Viral for Justice” phenomenon [10]. When formal legal channels fail due to opacity and corruption, the public increasingly utilizes digital platforms to demand accountability, shifting the locus of law enforcement from institutional frameworks to the volatile public sphere. To this end, existing studies conducted from legal and sociological perspectives have revealed institutional weaknesses. However, this phenomenon has also attracted attention from a computer science perspective, particularly in natural language processing (NLP). This domain offers automated, quantitative capabilities and large-scale data rather than subjective or qualitative methods. Several studies show that sentiment analysis enables a systematic understanding of public opinion across social, economic, and political contexts, making it useful for governments and organizations to gauge public perception and inform public policy decisions [11]. However, the semantic meaning of sentiment remains unclear and requires further clarification.
Therefore, this paper investigates how to address this gap using techniques from large language models (LLMs). Specifically, to examine how the media’s stance influences opinion and perception, this paper leverages LLMs to analyze opinion polarization by employing sentiment classification, extracting entities via named entity recognition (NER), and attributing moral responsibility via pseudo-labeling.
To systematically bridge the empirical gap between mainstream media editorial positioning and public sentiment dynamics, this paper formulates three interconnected research questions. These questions govern the entire computational pipeline, including data curation, text preprocessing, feature engineering, statistical analysis, and data visualization:
- RQ.1: To what extent do media outlets’ editorial stances associate with the sentiment polarity and moral-responsibility frameworks articulated within user-generated comments?
- RQ.2: How are public sentiments distributed across specific entities within the discourse, and how do these distributions reflect public attributions of responsibility?
- RQ.3: Is there a significant association between media stance and the distribution of moral-responsibility values in public discourse?
In addressing these research inquiries, this paper offers three primary methodological and empirical contributions:
- We compile a novel, domain-specific text dataset harvested from YouTube, capturing video metadata, descriptions, and user comments for landmark legal cases associated with the socio-legal movements #NoViralNoJustice and #Viral4Justice in Indonesia. This dataset serves as the empirical foundation for entity-level patterns of public sentiment and the attribution of moral responsibility in criminal discourse.
- This paper deploys a state-of-the-art multi-model framework for granular text processing. Specifically, we leverage the gpt-5 architecture to detect media stance in video descriptions, utilize a fine-tuned Indonesian BERT-Base Sentiment Classifier to analyze audience polarity, and implement gpt-4.1-mini for robust entity extraction to map how specific actors and institutions are targeted in public attributions of moral responsibility alongside gpt-4o-mini for surrogate labeling of morality-responsibility dimensions.
- This paper presents a careful quantitative analysis using descriptive statistics and statistical tests to examine the distributional patterns of public sentiment across identified entities and to reveal systematic structures of moral-responsibility attribution within public discourse. These empirical findings are further validated through multidimensional visualizations to ensure interpretative robustness and facilitate cross-case comparison.
The remainder of this paper is organized as follows: the Section 2 contextualizes this paper within the current state of the art in computational sentiment analysis and media framing studies. Data collection explains the boundary criteria for data harvesting and the initial parsing workflows. The Section 3 provides a comprehensive technical exposition of text preprocessing, feature-extraction architectures, and LLM-driven surrogate labeling techniques. The Section 4 evaluate the dataset empirically through descriptive metrics, formal statistical testing, and visual analytics. Section 5 theorizes the broader sociological and computational implications of our findings. The Section 6 synthesizes this paper’s core contributions and outlines prospective trajectories for future research.
2. Related Works
Mass media is not simply a conduit of information but rather a social architect that actively shapes how a community thinks, feels, and acts. Agenda-setting theory posits that the media do not dictate what the public thinks but rather direct it by cultivating certain cognitive and affective attributes [12]. This process operates through framing, the systematic selection and highlighting of aspects of reality that guide audiences in interpreting complex events [13].
To address the complexity of media narratives in the public sphere, CSS has emerged as a new interdisciplinary paradigm. By combining social science, statistics, and computing, CSS can systematically process big data to generate massive quantitative insights [14,15]. However, this approach still requires qualitative validation (ground truth) to ensure the accuracy of data-mining outputs [16]. Because most social data are unstructured text, CSS requires a robust tool for meaning extraction, making NLP a crucial methodology. Compared to manual methods, which are slow and prone to human error, automated NLP offers scalability, efficiency, and cross-context validity for extracting text data [17,18]. This technological leap is further emphasized by the advent of LLMs, which shift the focus of analysis from keyword matching to deep contextual understanding.
The LLM’s ability to simulate complex social phenomena and economic systems opens new horizons for understanding human behavior and policy impacts [19,20]. By leveraging this technical sophistication, this research aims to clarify how the media constructs social reality, particularly in the context of the #NoViralNoJustice phenomenon in Indonesia. By integrating NLP and LLMs, this paper can accurately unravel the dynamics of meaning making behind the flurry of digital data both quantitatively and computationally.
2.1. Stance Detection
Mass media is not simply a technical communication instrument but rather a sociological actor that actively constructs collective perceptions of social reality. In journalistic practice, content production is always driven by editorial orientations that reflect particular ideological tendencies. This media stance reflects the institution’s strategic position in framing an event, which influences how audiences interpret that specific issue.
In the NLP domain, this framing phenomenon is known as stance detection, identifying a text’s evaluative position toward a specific target [4]. This technique initially relies on conventional architectures and transformer models such as DistilBERT combined with NER preprocessing techniques to improve accuracy [21]. However, this approach often encounters limitations when faced with subjective narratives, ambiguous reasoning, and satire.
To address these limitations, recent research has shifted toward optimizing public behavior through frameworks such as KEprompt [22] and the use of LLM model like gpt-3.5 as instructable zero-shot classifiers [23]. Studies have shown that LLM can match supervised models’ performance without extensive data annotation. However, issues of algorithm transparency in commercial models and limited context in short texts remain persistent challenges in zero-shot stance detection (ZSSD) studies.
Ultimately, stance detection is a crucial tool for analyzing opinion dynamics in the digital public sphere. By mapping media stance, researchers can evaluate the relationship between news institutions’ editorial agendas and societal polarization. Through this methodological bridge, this paper not only offers a technical contribution to the NLP domain but also provides sociological insights into the media’s role as an architect of opinion in a fragmented information ecosystem.
2.2. Sentiment Analysis
Sentiment analysis, or opinion mining, is a crucial domain of NLP that extracts subjective information from textual data [24]. This technique provides an analytical framework for examining human perspectives by transforming text into discrete polarities (positive, negative, or neutral). Through this conversion, researchers can accurately quantify collective attitudes in digital spaces.
In the Indonesian context, the effectiveness of this analysis depends heavily on the availability of linguistic resources that understand local characteristics. Willie addressed this challenge by developing a pre-trained IndoBERT model that outperformed multilingual models, though its implementation required substantial computational resources and careful batch-size management [25]. Recent research has begun exploring hybrid architectures that integrate BERT and DistilBERT with long short-term memory (LSTM) and temporal convolutional network (TCN) to enhance semantic understanding and temporal context [26]. Despite offering metric advantages, this hybrid model still leaves gaps. Using a unidirectional LSTM is suboptimal for capturing bidirectional contextual features, and simply integrating text outputs has not improved overall classification performance.
Regardless of its architecture, implementing sentiment analysis of public opinion is crucial for mapping sociopolitical dynamics in real time. This technique can reveal shifts in collective attitudes triggered by discursive interactions on digital platforms by linking public emotions to specific events. Detecting sudden spikes in sentiment serves as an early indicator of shifts in social norms and potential conflict. Therefore, sentiment analysis is an instrument for understanding mass psychology and maintaining democratic stability in a dynamic digital ecosystem.
2.3. Named Entity Recognition
NER extracts information by identifying and classifying lexical units into predefined entity categories, including Person (Per) for individuals, Organization (Org) for institutions, Location (Loc) for geographic locations, and Time (Time) for time. In media analysis, NER is a crucial tool for identifying actors repeatedly featured across entities, which are then quantitatively mapped (personal or institutional).
A study explored residual connections and feedback loops in a Bi-LSTM framework to improve precision [27]. However, the model still struggles to mitigate ambiguity between individual and organizational entities. Liu proposed using a pre-trained language model (BART) with a 12-layer encoder–decoder architecture to automatically generate prompts [28]. The automated prompting framework for zero-shot NER outperformed the knowledge-enhanced approach while reducing computational costs. However, this model’s effectiveness depends heavily on the availability of high-quality labeled data, and annotating professional domains requires in-depth, specialized knowledge.
Integrating NER into media analysis is key to understanding social dynamics and emotional fluctuations by identifying the specific entities (such as political figures or organizations) consistently associated with emotional narratives. Researchers have mapped how public sentiment is distributed and polarized around these actors. The relationship between the frequency of entity appearances and fluctuations in public emotions provides a precise picture of how media agendas can trigger collective reactions. Therefore, NER is not only an identification tool but also an instrument for the early detection of shifts in public perception and potential social tensions triggered by the representation of key actors in the discursive space.
2.4. Morality Responsibility Pseudo-Labeling
The pseudo-labeling technique (sometimes called surrogate labeling) is a semi-supervised learning method that simultaneously integrates labeled and unlabeled data [29]. This technique derives the maximum predicted class probability from unlabeled data to minimize class overlap and encourage separation in low-density regions. However, the study emphasized the importance of balancing coefficients, as imbalances can risk instability during training.
Arazo highlighted the risk of overfitting in naive pseudo-labeling due to confirmation bias, noting that mixup alone does not guarantee robustness against confirmation bias when the number of labeled samples is drastically reduced [30]. Park proposed an advanced mixup-based augmentation approach using the transformer architecture (BERT) to optimize the pseudo-labeling process [31]. The results showed that this method improved the quality of text data augmentation compared with conventional methods. However, the study noted that the proportion of manipulated words was often neutral, which could, in turn, reduce the efficiency of pseudo-label derivation.
Public opinion results from normative construction mediated by media framing, carrying broad sociopolitical implications as an instrument of social pressure and a basis for policy legitimacy. Media bias influences how society evaluates moral dichotomies and assigns responsibility. Consistent with Yahya’s findings [32], public opinion contains implicit moral evaluations articulated through two main frames:
- Morality Frame: acts as a normative appeal that connects social issues to universal values.
- Responsibility Frame: a causal attribution that identifies actors causing problems to emphasize moral accountability.
The relationship between the development of pseudo-labeling techniques on moral frame analysis provides a crucial bridge in computational communication studies. Integrating moral and responsibility concepts into opinion analysis is fundamental because these views not only reflect personal preferences but also shape sociopolitical stability. Failures of computational models (such as confirmation bias in pseudo-labeling or the inability to capture neutral contexts) in identifying moral responsibility can have devastating consequences, including reinforcing stereotypes, discrimination, and intergroup conflict. Therefore, developing context-aware, precise models for detecting moral stances has become crucial to maintaining social cohesion amid the flow of digital misinformation.
This paper addresses this critical gap by introducing a multidimensional pipeline that synthesizes media stance detection and sentiment analysis to mathematically chart the ideological coordinates of corporate media institutions alongside public reactions. To operationalize this text-mining framework, we leverage NER to isolate and track the specific individual and institutional actors targeted for blame or praise within these polarized streams. Furthermore, to overcome the severe limitations of training data availability in highly complex social domains, this research deploys an innovative LLM-driven pseudo-labeling framework focused specifically on the Moral-Responsibility axis. This computational synthesis is vital, since ideological polarization does not operate merely as a binary affective state (like versus dislike); rather, it hardens at the deeper level of moral evaluation and the legal-causal attribution of responsibility for societal crises.
3. Materials and Methods
This paper used a quantitative approach by comparing LLM-based large-scale data annotation with examples of human-generated annotations. Figure 1 outlines the research design, which is broadly categorized into computational annotation and human annotation components. The machine-based annotation process encompassed data collection, preprocessing, and dataset exploration; feature engineering and annotation; and modeling and visualization. In contrast, the human annotation component involved annotating dataset samples to serve as a golden truth for labeling accuracy. Methodologically, this process evaluates inter-rater reliability. Furthermore, the study used Cohen’s Kappa to assess agreement between the human annotators and the model. This method measures how well the model replicated human reasoning in text comprehension. The specific details of the methodology are described in the following subsection.
Figure 1.
Research methodology framework. The proposed methodology pipeline, comprising (1) data collection, (2) preprocessing and EDA, (3) human validation and evaluation metrics, (4) multi-model automated annotation, (5) statistical test and visualization.
3.1. Data Collections
We systematically collected data from media outlets’ YouTube videos in text format, including metadata describing the videos and the audience’s comments. We collected the data via the YouTube Data API; it included high-profile cases related to the hashtags #NoViralNoJustice or #Viral4Justice on social media, namely Ferdy Sambo, Mario Dandy, Vina Cirebon, and Kopi Sianida. These four cases had distinct characteristics. Ferdy Sambo’s case was a murder case; he was convicted as the main perpetrator and the mastermind of obstruction of justice. Mario Dandy’s case was an adolescent assault case that spilled over into other cases. The Kopi Sianida case was a revival of a murder case, where she was charged as the perpetrator, but it still sparked public debate. The Vina Cirebon case involved a murder victim, but it left a strange impression in the legal process among netizens due to a mistaken arrest. Therefore, we applied specific keywords during data collection to ensure relevance to these high-profile cases that garnered widespread public attention, including the hashtags #NoViralNoJustice, #Viral4Justice, #FerdySambo, #MarioDandy, #VinaCirebon, and #KopiSianida. This method was crucial for filtering out irrelevant content and excluding all others.
During data collection, video attributes and audience comments were downloaded and stored to the database, and the data were publicly accessible via a GitHub repository to support future research and replication. Table 1 shows the collected video metadata attributes, including video id, channel id, title, description, published time, video duration, view count, like count, favorite count, and comment count. Meanwhile, Table 2 shows the collected comment attributes, included video id, channel id, author, publish time, update time, like count, display, text, reply and public. When crawling data from the YouTube Data API via the search menu, we found 3967 videos relevant to the filtered keyword; after removing duplicates, the dataset contained 2084 unique videos. Furthermore, when downloading comments by their unique id (the video_id column), we found 2031 files remained, totaling 671,872 rows of comments.
Table 1.
Example of raw collected video metadata. This table shows the details of video metadata and was stored in CSV format. The description column was stored originally in Indonesian; however, the translated description is for further explanation.
Table 2.
Example of raw collected comments’ metadata. Comments’ metadata were stored originally in Indonesian; the translated column is for further explanation.
3.2. Preprocessing and Data Exploration
The collected dataset was unstructured, so we applied preprocessing and text analysis techniques for exploratory data analysis (EDA). We used these techniques to transform raw texts into cleaner, more consistent, and more structured text that computers can process. The specific cleaning and curation procedures were executed as follows:
- Cleaning techniques were applied to remove elements that did not have significant meaning to the text analysis. However, video metadata and comments differed in character, so we handled them accordingly. The video’s descriptions column was written by media outlets in a structured, formal, and informative manner, while the comments were more informal and casual, serving as personal expression. Therefore, we preprocessed video descriptions to remove whitespace and special characters, such as HTML tags, mentions, and HTML links. In contrast, we processed the comment files by removing whitespace, numbers, emojis, and HTML tags.
- To ensure the dataset was sourced from Indonesian mass media (online, television, or investigative journalism), we conducted news curation. We pruned the dataset by removing data not sourced from these media, and we made the list of Indonesian media available in the attached GitHub repository. We applied this filter to video metadata and comment files for each media outlet, ensuring that irrelevant information was not processed in subsequent stages. This technique yielded 1351 unique relevant video_ids, indicating that about 33% of video_ids had no media affiliation. Furthermore, we removed duplicate and empty data to maintain data quality and validity and avoid errors during computation.
- In this paper, the primary unit of analysis for the inferential statistical tests is the individual user comments (N = 489,790). The data possess a hierarchical structure: media stance was classified at the video’s description level (N = 1351) and mapped to all comments nested within each video. Meanwhile, we analyzed audience sentiment, entities, and morality-responsibility attributions at the comment level. We used statistical modeling as a macroscopic descriptive heuristic. These tests were designed to capture and validate the structural associations within the massive aggregate of digital discourse.
3.3. Evaluation Metrics
To evaluate the performance of the automated zero-shot LLM approaches, we established a ground-truth dataset through manual human annotation. We randomly sampled 25 instances from each of the four selected cases, resulting in an evaluation dataset of 100 items. We applied this sample size () across all comparative evaluation tasks: Media Stance Detection, Sentiment Analysis, Named Entity Recognition, and Moral-Responsibility Labeling. One independent human annotator with a professional background in journalism and Indonesian literature conducted the manual annotation. To ensure consistency, we guided both the model and the human annotator with a standard coding protocol that clearly defined the boundaries and definitions for each category. They independently coded the same 100 observations, and we calculated inter-rater reliability using Cohen’s Kappa to measure agreement before conflict resolution.
To assess the models’ predictions against the human ground truth, we constructed a confusion matrix to identify discrepancies. We calculated accuracy to determine the overall proportion of correct classifications, which was followed by precision, recall, and the F1-score to evaluate how effectively specific classes were identified while mitigating errors. Finally, we calculated Cohen’s Kappa to measure agreement between the human labels and model outputs. Appendix A shows the detailed formulas for these evaluation metrics.
3.4. Feature Engineering and Multi-Model Annotation
In this stage, we transformed the cleaned text fragments into data frames and then subjected them to multi-annotation. Moreover, we applied zero-shot prompt engineering to the multi-annotation process. Therefore, we implemented a novel multi-annotation computational workflow to derive semantic features from the corpus as follows:
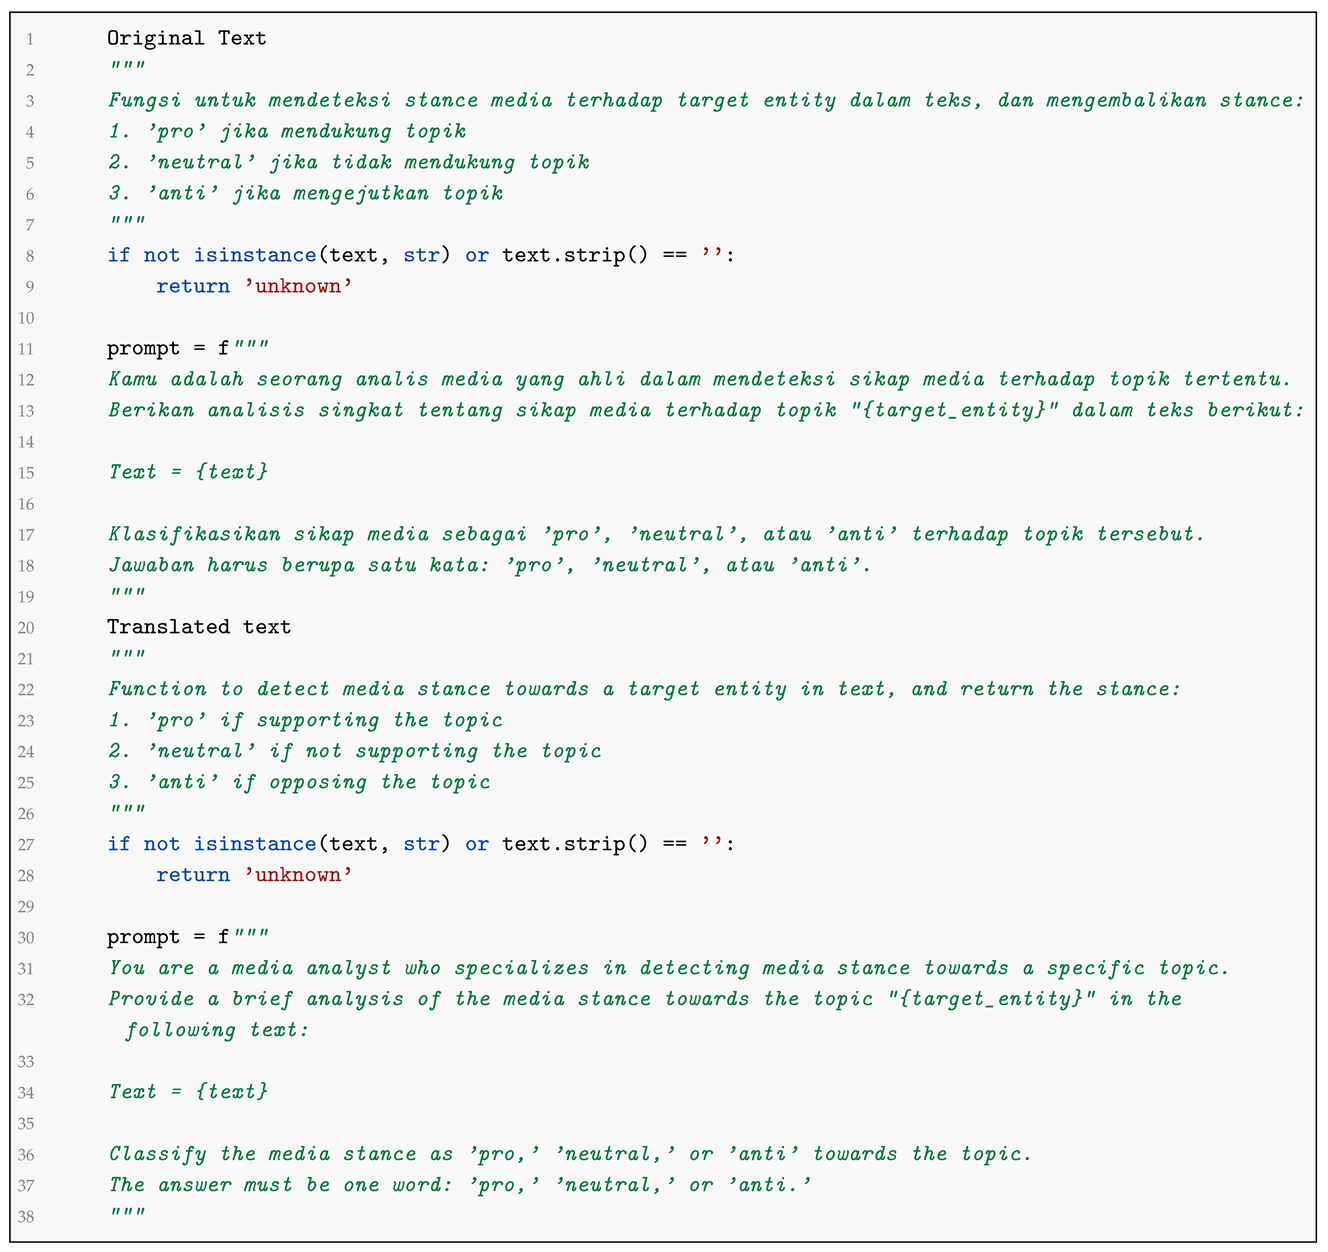
- The gpt-5 model was employed to identify editorial stance tendencies by using the OpenAI platform (accessed on 21 February 2026). We chose this model because its reasoning capabilities distinguish it from its predecessors. Rather than searching for keywords, the model can detect bias in tone, word choice, and even omissions. Therefore, using this model with zero-shot prompt engineering was well suited to determining editorial stance. When we applied the zero-shot prompt (depicted in Listing 1), we set the temperature to 0.0 to ensure consistent results. The output was a pro, anti, or neutral label on the law enforcement process in Indonesia, based on the video description text fed into the prompt, as shown in Table 3.Table 3. Media stance detection output example. The gpt-5 model processes the input text and appends a stance classification column populated with the corresponding valence labels (pro, neutral, or anti).
- The Indonesian-BERT-Sentiment-Classification model was utilized to identify sentiment polarity in the comments dataset. Unlike the other process, this process did not utilize prompt engineering. Instead, we computed locally and determined the sentiment polarity, which was classified into three classes, namely positive, negative, or neutral, along with their probabilities. This model was originally based on the IndoBERT-Base-Model, which was pre-trained on the Prosa sentiment dataset. Table 4 describes the model’s output, and the model is publicly available at https://huggingface.co/mdhugol/indonesia-bert-sentiment-classification (accessed on 21 February 2026).Table 4. Sentiment analysis output example. The Indonesia-BERT-sentiment-classifier model returns the output in three key variables: positive, negative, or neutral; the associated prediction probability; and a score that converts probabilities into an evaluation score.
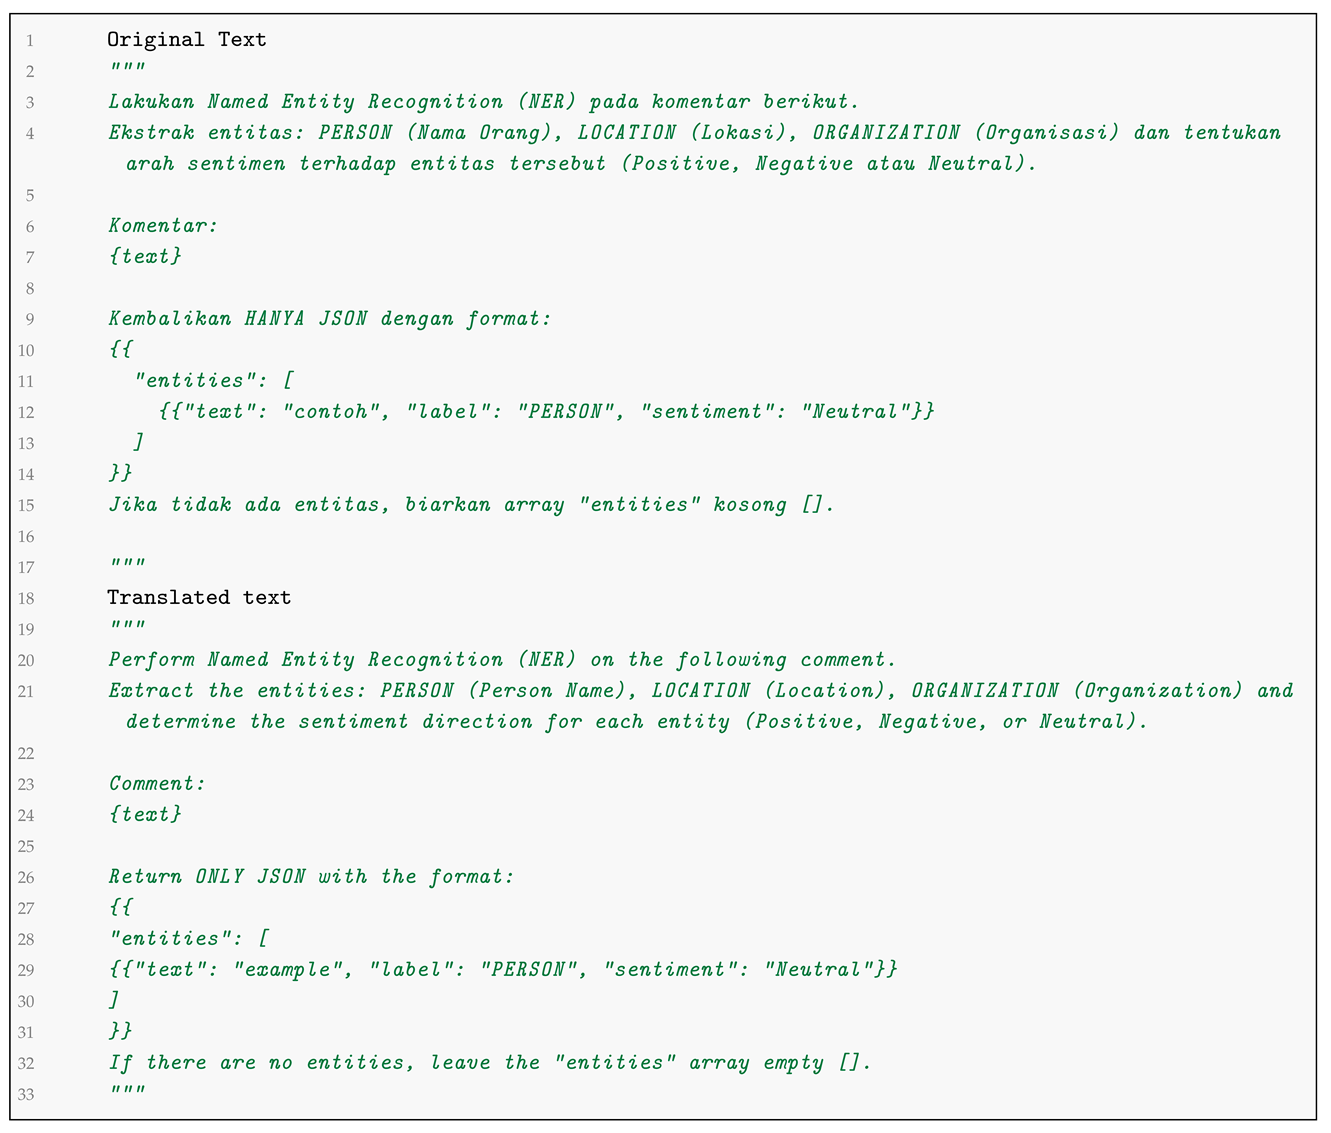
- The NER technique used the gpt-4.1-mini model to extract entities from comments (accessed on 26 February 2026). We used this technique to clarify sentiment and identify the target entity, yielding more precise information. We used a zero-shot prompt as shown in Listing 2 to identify the subjects and objects associated with the sentiment values. Additionally, the model provided flexible JSON output, supporting multiple extraction results, and could understand complex language structures without retraining, as depicted in Table 5.Table 5. Entity extraction output example. The gpt-4.1-mini model generates a structured JSON output comprising an entities array, which details the extracted named entities, their respective entity types, and their associated sentiment orientations.
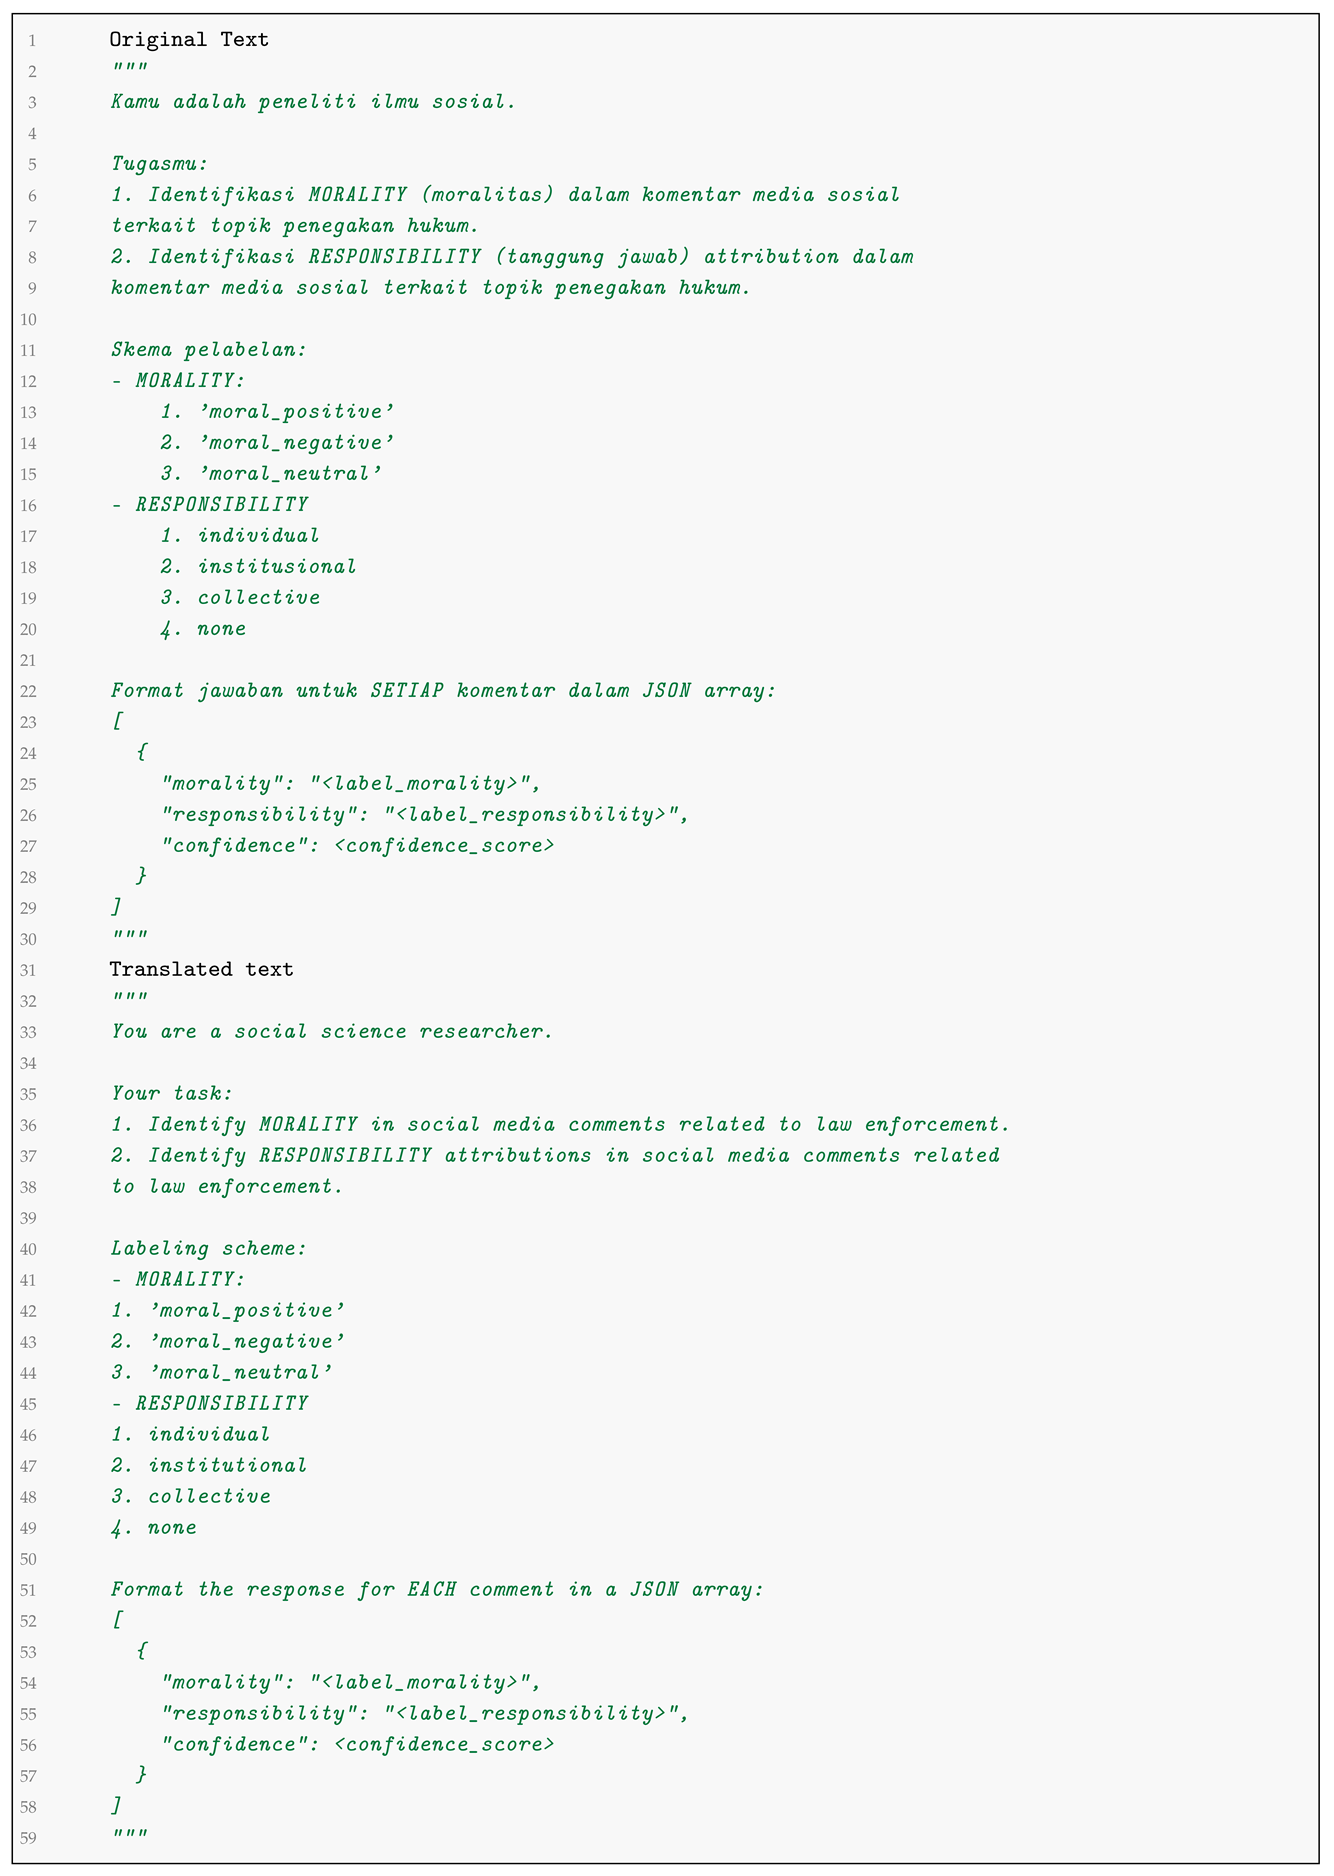
- To analyze comments in the moral-responsibility framing, the gpt-4o-mini model was used (accessed on 28 February 2026). This model supports zero-shot prompt engineering and can understand rich language contexts to handle language noise, such as the sarcasm, metaphors, slang, and mixed language commonly found in social media comments. Therefore, this model was well suited for applying pseudo-labeling (surrogate-labeling) techniques under moral-responsibility framing. To ensure consistent results, we set the temperature to 0.0 when applying a zero-shot prompt, as shown in Listing 3. Furthermore, the moral-responsibility labels were designed to yield morality outputs (positive, negative, neutral) and responsibility (individual, institutional, collective, none) along with confidence values, as shown in Table 6.Table 6. Pseudo-labeling output example. The gpt-4o-mini model outputs a structured JSON schema comprising a label array, which incorporates a morality classification (positive, negative, or neutral), a responsibility attribution (individual, institutional, collective, or none), and an associated confidence score.
| Listing 1. Code snippet for zero-shot prompting template for media stance detection, presented in the original Indonesian text alongside an English translation for clarity. |
 |
The multi-annotation results from the LLM technique used different data formats; however, we combined them into a single DataFrame. During merging, the media stance file served as the master data, which was combined with sentiment analysis, entities recognition, and moral-responsibility pseudo-labeling. The video_id was a unique identifier; therefore, we used it as the anchor during the merge. To ensure a seamless merge of the multi-annotation outputs, each file underwent custom preprocessing tailored to its type: recapitulating sentiment polarity, normalizing recognized entities, and pseudo-labeling. We combined media stance and sentiment analysis to analyze the relationship between media attitude variables and sentiment result variables. Furthermore, we combined media stance with entities to analyze media stance toward the targeted entity. Additionally, we combined media stance with pseudo-labeling to analyze media stance toward moral responsibility attribution.
| Listing 2. Code snippet for zero-shot prompting template for named entity extraction, presented in the original Indonesian text alongside an English translation for clarity. |
 |
| Listing 3. Code snippet for zero-shot prompting template for moral-responsibility pseudo-labeling, presented in the original Indonesian text alongside an English translation for clarity. |
 |
3.5. Inferential Statistical Modeling and Visual Analytics
For this analysis, descriptive statistics were used to determine the basic characteristics during the baseline phase. This approach summarized the data, facilitating a clear understanding of its distribution while revealing patterns of dominance or imbalance. Furthermore, the data visualization complemented and strengthened these descriptive insights, translating complex data into easily understandable sociological insights. Following this, this paper employed inferential statistical models to determine the association between the independent variable (media stance) toward the dependent variables (sentiment, entities, and moral responsibility).
Chi-square tests were conducted to test the research hypotheses and ensure the findings were grounded in robust statistical tests. The outputs enabled us to draw valid conclusions about the influence of editorial attitudes specifically by demonstrating the association between media stance and public response within the frameworks of sentiment analysis, entity extraction, and pseudo-labeling for moral-responsibility attribution.
4. Analysis and Results
This section presents a comprehensive analysis of media framing dynamics and public opinion responses in Indonesia’s digital space. This approach used inferential statistical methods and data visualization techniques. The dataset was extracted and analyzed quantitatively to identify association patterns, distributions, and the significance of relationships among the research variables. Hypothesis testing used association tests (chi-square test) to validate the representational stance of mass media vis-à-vis public opinion, questioning its empirical basis. Furthermore, this section integrates temporal graphs and descriptive visualizations to translate complex numerical data into intuitive sociological insights, enabling a clear mapping of public opinion fluctuations and shifts in media framing over time.
4.1. Media Stance Detection
This paper applied media stance detection to capture media editorial attitudes toward law enforcement in Indonesia. This step was crucial because mass media have discursive authority in shaping public interpretations, which in turn drives public opinion dynamics. Computational analysis enabled us to identify media stance patterns through large-scale textual data processing. This analysis examined news video descriptions to map media stance on the law enforcement process. We categorized the results into three main valence positions: pro, anti, and neutral.
Temporal visualization was used to identify patterns in media coverage highlighting law enforcement issues from July 2022 to September 2025. Figure 2 presents the monthly media stance distribution of four high-profile legal cases in Indonesia: Ferdy Sambo, Kopi Sianida, Mario Dandy, and Vina Cirebon. The Ferdy Sambo case showed gradual persistence in coverage with high activity at the beginning followed by a gradual decline. This pattern implies that cases involving high-ranking officials tend to receive long-term media attention. Meanwhile, the Mario Dandy case saw an early spike in scandal coverage, which was followed by a sharp decline (spike and decay) several months later. This pattern implies that cases with explicit social inequality can trigger a surge in coverage, but that momentum does not sustain once the coverage subsides.
Figure 2.
Monthly temporal distribution of video coverage volume across high-profile cases. Stacked bar charts illustrate monthly aggregated video counts per case. The time series highlights distinct, sequential attention spikes corresponding to key legal developments and media events for each case.
In contrast, the Kopi Sianida case showed a multi-peak pattern, reflecting the revitalization of coverage in its earlier cases, which followed a wave-like pattern. This phenomenon shows that renewed media coverage of legal events (judicial review hearings, statements from convicts, and new journalistic investigations) can revive cases that have passed in time. The Vina Cirebon case resurfaced because the legal process was incomplete. A film inspired by it, produced by non-conventional media outlets, helped revive it by framing the legal issues as unresolved.
A comparison of stance values for cases is shown in Table 7, which consistently shows that the model predominantly classifies media coverage as neutral (more than 86% of total volume). This dominance trait indicates that news journalism practices across the channels studied generally prioritized factual reporting. However, this method has a volume bias, since it can only show statistical summaries; it cannot map variances or outliers. Therefore, we used another method to clarify the data and improve its accuracy.
Table 7.
Statistical description of media stance across high-profile cases. Values under Stance(Pro, Neutral, Anti) indicate counts and row percentages, representing the stance media distribution within each case (summing horizontally to 100%). Values under Total indicate counts and column percentages, representing articles contributed by each case to the overall dataset (summing vertically to 100%.
Meanwhile, the violin plot model has the advantage of presenting data effectively, since it can show the distribution’s breadth. The violin shape reflected the data’s variance, while the tails showed outliers. We normalized the data and visualized them as a violin plot; each stance value was converted to a proportion (range 0 to 1). Figure 3 shows a violin plot of media stances across all cases, revealing a predominance of neutrality, with proportions ranging from 0.6 to 1.0. However, pro and anti stances have very short shapes with medians approaching 0, reflecting low variance in these stances.
Figure 3.
Violin plot of stance distribution across high-profile cases. Proportional distribution of media stance across high-profile cases. Violins show the Kernel Density Estimate (KDE) of stance proportion per outlet with lines marking the median (dashed) and interquartile range (solid). Proportions are bounded within [0,1]; density beyond these bounds is a Gaussian KDE smoothing artifact; it is not observed data.
The violin plot of the Ferdy Sambo case shows a solid–thick violin shape for the neutral stance at the top, while the pro and anti stances are solid–thick at the bottom. This indicates that media editorials were very careful to maintain objectivity and provide consistent factual reporting throughout the case. In the Kopi Sianida, the graph shows a widening of the neutral and anti categories. This pattern reflects some media outlets maintaining factual reporting, while others accommodated critical narratives (anti stances) toward the previous event. The violin shape in Mario Dandy’s case is concentrated in each category, but the anti and pro positions were narrower, more contorted, and flatter. This indicates that none of the media outlets took extreme positions either in defense or in offense. The Vina Cirebon case shows the violin shape with a long tail in the neutral and anti positions, indicating significant outliers; from a sociological perspective, the case was fluid and unstable.
An analysis of the media stance detection annotation results reveals a significant class imbalance in the predictions generated by the gpt-5 model with the neutral category predominating the distribution. Standard evaluation metrics, specifically (accuracy, precision, and recall), are insufficient for evaluating performance on imbalanced datasets, as they can obscure poor class-specific performance. Consequently, we used the macro F1-score to balance precision and recall and provide an objective evaluation across all categories. Additionally, we calculated Cohen’s Kappa coefficient to assess the inter-rater agreement between the model’s predictions and human annotations, adjusting for chance agreement. By utilizing a zero-shot prompt, the model achieved a macro F1-score of 0.72 and a Cohen’s Kappa coefficient of 0.58 (Appendix B, Table A2).
4.2. Sentiment Analysis on Media Stance
This stage investigates media attitudes and public sentiment to gauge public perception of media narratives in the digital space. Technically, the sentiment calculation yielded three categories: positive, negative, and neutral. This method allows researchers to quantify the intensity of public reactions to social issues, identify potential opinion polarization, and track the dynamics of changes in public opinion temporally (in time sequence). We used comparative testing to show empirically how the stance variable (independent) influences sentiment (dependent).
We combined the media stance annotation as the master data with the sentiment recapitulation and performed further analysis. This process yielded 489,790 comments from netizens. Therefore, during the media curation pruning process, more than 27% of these comments were removed as unaffiliated with the media outlet’s coverage. Additionally, the combined file was investigated using descriptive statistics depicted in Table 8; sentiment polarity was dominated by negative values, with more than 68% in each case, while positive sentiment ranged from 17% to 21%, and neutral sentiment ranged from 8% to 18%.
Table 8.
Statistical distribution of sentiment polarity across high-profile cases. Values under Sentiment (Positive, Neutral, Negative) indicate absolute counts and row percentages (summing horizontally to 100%). Values under Total represent absolute counts and column percentages (summing vertically to 100%).
The descriptive analysis cannot yet determine the polarity of sentiment toward editorial stances; therefore, a Sankey diagram was used to clarify the issue. A Sankey diagram groups the data into eight semesters from 2022-S2 to 2025-S1. Figure 4 shows that public sentiment toward legal cases in Indonesia exhibits sentiment spikes. In early coverage, strong sentiment emerged, but law enforcement coverage declined (2023-S1), which was followed by a gradual decline in the final phase. Negative sentiment consistently dominated throughout the observation period, which was followed by other sentiments.
Figure 4.
Sankey diagram mapping half-year temporal distribution through media stance categories to audience sentiment orientations. Flow width indicates relative volume density across stages. Left-to-center flows depict temporal volume per half-year transitioning into media stance categories (neutral, pro, anti). Center-to-right flows illustrate the mapping from media stance to public sentiment outcomes. The colors gray, red, green, and blue represent comment volume, negative sentiment, positive sentiment, and neutral sentiment, respectively.
We refer to the previous temporal graph of media stance (Figure 2); the Ferdy Sambo case emerged in the second semester of 2022. In the first semester of 2023, coverage of the Ferdy Sambo case overlapped with the new Mario Dandy case. In the second semester of the same year, coverage of the Kopi Sianida case was revived, overlapping with the Mario Dandy case. In the first half of 2024, the Vina Cirebon case dominated, which was fueled by a documentary. In the next semester, coverage patterns overlapped between the Vina Cirebon and Kopi Sianida cases. Meanwhile, in 2025, coverage patterns varied across both the first and second halves. Analyzing the visualizations of media stance distribution (Figure 2) and public sentiment distribution (Figure 4), the initial phases show a positive association between coverage volume and generated sentiment, though this pattern differs slightly in the Mario Dandy case (2023-S1). The final phases show massive coverage, but they did not attract audience interaction through comments.
The sentiment distribution for each case is shown in Figure 5 as a violin plot, and the overall sentiment was normalized to a ratio (scale of 0 to 1). The violin plot depicted in Figure 5 shows that sentiment distributions vary across cases, indicating that sentiment was not uniform and ranged widely, while negative sentiment remained dominant across cases.
Figure 5.
Violin plot of sentiment distribution. Proportional distribution of sentiment across high-profile cases. Violins show the Kernel Density Estimate (KDE) of sentiment proportion on comments with lines marking the median (dashed) and interquartile range (solid). Proportions are bounded within [0,1]; density beyond these bounds is a Gaussian KDE smoothing artifact; it is not observed data.
Negative sentiment dominated the Ferdy Sambo case with a wide violin spanning 0.6–0.9. This indicates that most of the news coverage consistently generated high negative sentiment in the public sphere. Conversely, positive and neutral sentiment were narrower and more concentrated with low values (starting at 0.1). Meanwhile, in the Mario Dandy case, negative sentiment dominated, concentrated in the range 0.6–1.0, while positive and neutral sentiment showed a narrow distribution, tending to cluster at low values (close to 0.1). In Vina Cirebon’s case, sentiment varied more with negative sentiment ranging from 0.6 to 0.8. Positive and neutral sentiment again showed a narrow distribution at 0.1. For Kopi Sianida, the sentiment distribution was relatively balanced across the three sentiment classes, but negative sentiment had a wider distribution, ranging from 0.4 to 0.8. Positive sentiment was more concentrated around low to medium values, with a more tapered violin tail, indicating a high proportion of positive content but not dominance, while neutral sentiment had a narrow, concentrated distribution.
The overall visualization shows a structural dominance of negative sentiment, significantly greater than neutral and positive sentiment. This distribution is not incidental but occurs consistently across time, cases, and news coverage intensity. Descriptive analysis shows an unbalanced sentiment distribution with negative sentiment dominating across all stance categories. The violin plot visualizes that negative sentiment has the highest median and the largest variance across all stance categories.
Additionally, to determine whether media stance was significantly associated with opinion sentiment, we performed an association test and formulated a hypothesis. A chi-square test was performed based on Appendix G, indicated no significant relationship between media stance and the sentiments; , conversely, indicated a significant relationship between these two variables. Table 9 shows the results of the chi-square test with a calculated = 1532.747; p-value with degrees of freedom (df) = 4. This indicates that there is a significant relationship between media stance and generated sentiments, rejecting and accepting . This indicates a relationship between media stance and generated sentiments and explains that editorial media is associated with audience sentiment. Furthermore, Table A12 shows an extreme value: the high point occurs in the combination of neutral stance with negative sentiment, yielding 253,728 (51.8%). Furthermore, the low point occurs in the combination of anti stance with neutral sentiment, yielding 7482 (1.5%).
Table 9.
Chi-square test sentiment polarity on media stance to confirm the statistical relationship.
The sentiment annotation results generated by the Indonesia-BERT-sentiment-classifier model revealed a marked class imbalance with the negative class predominating in the dataset. Unlike conventional annotation approaches, this process used local inference with a transformer model fine-tuned for Indonesian sentiment classification. To address the skewed class distribution and ensure robust evaluation, we selected the macro F1-score and Cohen’s Kappa coefficient as primary metrics. The model achieved a macro F1-score of 0.56 and a Cohen’s Kappa coefficient of 0.35 (attached in Appendix C, Table A5).
4.3. Entity Extraction on Media Stance
Sentiment analysis captures only the temporal development of emotions; to obtain clearer information, we need to extract entities to identify the actors or institutions that are the targets of those emotions. This method helps detect entities that trigger emotional responses in society. When stance detection was combined with entity extraction (NER), it can be used to analyze the association between news framing strategies and the actors that evolved in the public perceptions they seek to shape.
The entity extraction process requires the model’s high flexibility in labeling, since comments may contain multiple entities or none at all. To accommodate output flexibility, annotation results were stored in JSON format and normalized before being combined with the media stance files. After normalization, the media stance detection files were combined with the NER results. The media stance detection files were treated as a master table (based on video IDs). This process yielded 426,432 recognized entities across all comments, as shown in Table 10. Each case accounted for a nearly equal proportion of entities except for the Mario Dandy case.
Table 10.
Statistical distribution of extracted entities across high-profile cases. Values under Entity (Person, Organization, Location) indicate absolute counts and row percentages, representing the entity distribution within each respective case (summing horizontally to 100%). Values under Total represent absolute counts and column percentages, indicating the relative proportion of total entities contributed to each case in the overall dataset.
The Sankey diagram shown in Figure 6 maps the temporal distribution over the observation period. The analysis shows that the person entity dominates the other entities. This dominance indicates that public discourse centers heavily on figures, whether victims, perpetrators, or institutional actors (actor-centric narrative construction). This demonstrates that individual figures are highlighted more dominantly than other entities in the public sphere. Regarding prior media coverage patterns (Figure 2), the person entity dominated in the second half of 2022, the second half of 2023, and the first half of 2024. Coverage of the Ferdy Sambo, Kopi Sianida, and Vina Cirebon cases peaked during this period, while Mario Dandy’s coverage contributed relatively few entities. The person entity showed nearly equal distribution across all sentiment categories, but the strongest visual flow points toward negative sentiment, indicating that the representation of human entities is primarily implied in the context of negatively charged discourse.
Figure 6.
Sankey diagram mapping half-year temporal distribution through entity type to audience sentiment orientation. Flow width indicates relative volume density across stages. Left-to-center flows depict temporal volume per half-year transitioning into entity type (person, organization, location, events). Center-to-right flows illustrate the mapping from entity type to audience sentiment outcomes. The colors gray, red, green, and blue represent comment volume, negative sentiment, positive sentiment, and neutral sentiment, respectively.
To deepen the analysis beyond the primary descriptive flows, an interaction plot was used to separate the stance variable and map the entity frequency and sentiment simultaneously, as shown in Figure 7. The neutral stance panel shows that the person entity with negative sentiment recorded the highest absolute value, which was followed by the organizational entity with the same sentiment. This reveals that despite being neutral, it actually generated the largest negative volume, implying that the neutral stance is not associated with neutral sentiment. Meanwhile, the other panels anti and pro) show a moderate pattern with relatively low overall entity frequency.
Figure 7.
Three-way interaction plot illustrating the relationship between media stance, entity type, and public sentiment frequency. Facets represent distinct media stance categories (anti, neutral, pro). The x-axis categories represent extracted entity types (location, organization, person, event), while the y-axis displays raw frequency counts. Colored lines depict sentiment polarities (positive, neutral, negative). Variations in line trajectories across facets highlight a significant multi-variable interaction between media framing, entity target, and sentiment distribution.
Additionally, to determine the association between media stance and entity variables, we conducted a chi-square test based on cross-tabulation, as shown in Appendix H. We formulated the hypotheses: states that there is no significant relationship between media stance and entity type, and states that there is a significant relationship between media stance and entity type. The chi-square test yielded a highly significant value, = 1197.150 and p-value < 0.0001 (as shown in the Table 11), thus rejecting and accepting . This test indicates an association between media stance and entities and explains that media position co-occurs with generated entities. Furthermore, the cross-tabulation in Appendix H shows the highest point in the combination of neutral stance and person, yielding 227,894 (53.4%), indicating that the person entity dominates across classes. Meanwhile, the low point occurs in the combination of pro stance and location, yielding 4620 (1.1%).
Table 11.
Chi-square test of entity extraction by media stance to confirm the statistical relationship.
Applying the gpt-4.1-mini model to extract entities and sentiment targets from user comments revealed a pronounced class imbalance with person entities dominating the overall distribution. To account for this skew, we used the macro F1-score and Cohen’s Kappa coefficient to evaluate model performance. Utilizing a zero-shot prompting strategy, the model achieved a macro F1-score of 0.56 and a Cohen’s Kappa coefficient of 0.36 (attached in Appendix D, Table A7).
4.4. Morality-Responsibility Labeling on Media Stance
Since public opinion has socio-political implications, attributing morality and responsibility can help us understand how society constructs justice, assigns blame, and develops solutions to a case. Attributing responsibility leads the public to see blame as resting solely on the individuals involved or as stemming from systemic failures, weak institutional oversight, or the erosion of group culture. Meanwhile, the moral dimension of opinion serves as a compass for societal values. We used pseudo-labeling techniques for morality-responsibility attributions to identify both dimensions, enabling us to propose solution types for these cases. The statistical distribution of morality attributions using pseudo-labeling techniques is shown in Table 12, while Table 13 is for responsibility attributions. Negative morality dominates across all cases, with values ranging from 49% to 60%, while other valences average 21.5% for positive and 24.26% for neutral. Meanwhile, responsibility attributions are dominated by the label none, which is followed by individual, institutional, and collective. Although the labels for morality and responsibility were derived from the same output, the total volumes in Table 12 and Table 13 differ because three entities belonging to the family and parental categories were excluded.
Table 12.
Statistical description of morality labeling across high-profile cases. Values under Morality (Positive, Neutral, Negative) indicate counts and row percentages, representing the morality attribution distribution within each case (summing horizontally to 100%). Values under Total indicate counts and column percentages, representing articles contributed by each case to the overall dataset (summing vertically to 100%).
Table 13.
Statistical description of responsibility labeling. Values under Responsibility (Individual, Institutional, Collective, None) indicate counts and row percentages, representing the responsibility attribution distribution within each case (summing horizontally to 100%). Values under Total indicate counts and column percentages, representing articles contributed by each case to the overall dataset (summing vertically to 100%).
The radar chart in Figure 8 presents descriptive statistics to support the analysis of each label. The graph shows the dominance of negative morality across all cases with the highest scores (0.5–0.6). However, positive and neutral morality scores are relatively low (0.2–0.3). The Vina Cirebon case was an exception with more positive moral judgments than in other cases, which is likely driven by strong public sympathy for the victim.
Figure 8.
Comparative radar chart of pseudo-labeling on morality-responsibility attribution across high-profile cases. Radial axes denote continuous proportions [0,1] across seven evaluated dimensions: three morality categories (negative, neutral, positive) and four responsibility attribution categories (individual, institutional, collective, none). Overlayed polygons compare framing distributions across the high-profile cases.
Regarding responsibility, the none label dominates (range 0.4–0.5), indicating that public opinion does not assign specific responsibility. The individual label yielded moderate scores (0.2–0.3), implying that the fault lies with the individuals involved. Meanwhile, the collective and institutional labels have scores close to 0. Although several policemen were involved in the Ferdy Sambo case, the institutional responsibility remains low.
The dominance of negative moral aspects and the unclear attribution of responsibility imply that in public discourse, these cases are seen as serious individual moral violations with a minimal attribution of institutional or collective responsibility. In other words, the absence of an institutional dimension indicates the absence of a discourse on structural accountability; the public and media do not question institutions’ role as entities that share responsibility for producing and preventing these crimes. In aggregate, the chart reveals a structural gap between the high intensity of moral framing and the low intensity of responsibility framing.
Furthermore, Table 14 and Table 15 present the chi-square test for the association between media stance and attributions of morality and responsibility, respectively. The formulated hypotheses were : there is no significant association between media stance and moral and responsibility attributions, and : there is a significant association between media stance and moral and responsibility attributions. The results for the morality label yielded = 2190.846 with p-value < 0.0001, while those for the responsibility label yielded = 369.040 with p-value < 0.0001; we rejected and accepted . The test shows a significant relationship between stance and morality–responsibility, implying that media stance co-occurs with moral and responsibility attributions in the public sphere.
Table 14.
Chi-square test of morality attribution on media stance to confirm the statistical relationship.
Table 15.
Chi-square test of responsibility attribution on media stance to confirm the statistical relationship.
The chi-square test reveals a significant association between stance and morality and responsibility attributions; the cross-tabulation, as shown in Appendix I and Appendix J, shows that the neutral stance dominates across classes in both morality and responsibility attributions. In morality attributions, the highest value occurs for the combination of neutral stance and moral negative, yielding 201,709 (77.58%). Meanwhile, the lowest point occurs with a pro stance and moral positive, yielding 9944 (9.65%). Furthermore, for responsibility attributions, the highest point occurs with a neutral stance and individual responsibility, yielding 113,153 (23.6%). In contrast, the lowest point occurs with a pro stance and institutional responsibility, yielding 4142 (0.08%).
The gpt-4o-mini model annotated morality and responsibility attributions in user comments, yielding a highly imbalanced class distribution characterized by a predominance of negative morality attributions and a majority of none labels for responsibility attributions. To mitigate evaluation bias from this imbalance, we used macro F1-score and Cohen’s Kappa coefficient as primary performance metrics. Evaluated under a zero-shot prompting framework, the model achieved macro F1-scores of 0.63 and 0.55, along with Cohen’s Kappa coefficients of 0.46 and 0.48, for morality and responsibility attributions, respectively (see Appendix E, Table A9; Appendix F, Table A11).
5. Discussion
The empirical findings provide critical insights into the interaction between media stance and shifts in public opinion in digital discourse on law enforcement in Indonesia. By synthesizing computational approaches (stance detection, sentiment analysis, Named Entity Recognition (NER), and morality-responsibility attribution), this paper reveals a fundamental structural association between journalistic products and democratic digital discourse. Empirically, the model’s classified neutral stance dominated the dataset (>85%). However, public response was skewed toward negative sentiment (>68%) and actor-centric narratives (>72%).
The entity and moral-responsibility findings clarify this process. Public discourse was predominantly actor-centered, while explicit institutional attribution remained limited. This pattern is consistent with episodic framing, in which legal controversies are understood primarily through individual victims, perpetrators, and officials rather than institutional structures. However, it does not establish that the public is unaware of structural problems, because personal-name frequency and model classification tendencies may also contribute to the observed pattern.
Public discourse has shifted from hierarchical mass communication to decentralized digital networks where citizens actively shape the agenda. This phenomenon aligns with the Hybrid Media System framework, in which old and new media coexist and infuse rather than replacing one another [33]. This discourse emerges through interactions among journalistic coverage, platform dynamics, case-specific developments, and audience participation. Neutral reporting may establish the informational context, but users actively reinterpret that context through emotion, moral judgment, and responsibility attribution.
This research contributes a statistical test of the relationship between the media and public discourse; indicated media stance was associated with sentiment, entity selection, morality, and responsibility attribution. The tests revealed that media neutrality did not dictate public emotions; on the contrary, the public expressed negative sentiment and moral judgment on social media platforms. Nevertheless, these associations should not be interpreted as causal inference. Meanwhile, the evaluation of the machine-based annotation process revealed a limitation. Specifically, the Cohen’s Kappa results indicated that the computational labels had varying levels of agreement with human annotation (ranging from fair to moderate); therefore, they should be treated as model-assisted measurement rather than ground truth.
Future research should develop a human-validated benchmark that better represents informal Indonesian language (slang), sarcasm, code-switching, and multilingualism. Qualitative triangulation is also required to determine how media attention becomes public evaluation over time. More broadly, computational discourse research should move beyond separate classification tasks toward an integrated framework connecting affective evaluation, actor identification, moral judgment, and responsibility attribution.
6. Conclusions
This paper examined how the Indonesian public responds to law enforcement issues in digital spaces by synthesizing media stance, public sentiment, named entities, and moral-responsibility attributions. The findings confirmed a structural gap between media reporting and public reaction. While the model’s classified media stance remained highly neutral, public discourse was overwhelmingly negative and focused on individual actors rather than institutional responsibility. Empirically, the public narrative focused heavily on individual perpetrators while institutional accountability remained unaddressed.
However, this paper had important limitations due to the massive scale of the dataset. We acknowledge that our models’ performance metrics indicated a moderate alignment with the human annotator, which was primarily due to the zero-shot technique and the informality of social media text (e.g., slang and sarcasm). These outputs served as pseudo-labels rather than absolute ground truth. Additionally, this performance was sufficient for our macro-sociological approach. Across a massive corpus, micro-level classification noise is statistically smoothed out, functioning as a macroscopic that reliably captures aggregate structural trends and broad discourse patterns.
The findings of this paper underscore the importance of integrating quantitative and qualitative research to generate ground truth (as a form of fact checking and verification). This is necessary to ensure research fits the social context and to mitigate machine-generated algorithmic bias (derived from statistical calculations) that could arise from NLP’s limitations in capturing satire, polysemy, sarcasm, irony, cross-referencing, code-switching, and multilingualism.
Author Contributions
Conceptualization, M.A.S. and F.A.; methodology, M.A.S., F.A. and K.Y.; software, M.A.S.; validation, M.A.S. and F.A.; formal analysis, M.A.S. and K.Y.; investigation, M.A.S. and K.Y.; resources, M.A.S.; data curation, M.A.S.; writing—original draft preparation, M.A.S.; writing—review and editing, K.Y. and S.M.; visualization, M.A.S.; supervision, K.Y. and S.M.; project administration, M.A.S.; funding acquisition, M.A.S. All authors have read and agreed to the published version of the manuscript.
Funding
This APC was funded by the Research and Community Services Institute of Sebelas Maret University under grant number 460/UN27.22/PT.01.03/2026.
Institutional Review Board Statement
Regarding the research described in this paper, it has been confirmed that the details declared by the Principal Investigator—based on the submitted application documents—do not meet the review criteria stipulated in Article 2 of the *Guidelines on Review Criteria for the Review Committee for General Research Involving Human Subjects*. Accordingly, on the premise that the declared information is accurate and that all relevant internal pledges and requirements are observed, review by the Review Committee for General Research Involving Human Subjects at Yamaguchi University is not required.
Informed Consent Statement
Not applicable. This study utilized only publicly available online comments and does not involve direct interaction with human participants, experimental interventions, or the collection of personally identifiable or sensitive information. We analyzed them in aggregate and did not disclose identities or personal data.
Data Availability Statement
The data that supports the finding of this study are openly available at https://github.com/safiie99-dev/NoViralNoJustice/ accessed on 7 August 2026.
Acknowledgments
We would like to express our gratitude to the Rectorate and Research and Community Service Institute of Sebelas Maret University, who have provided a grant for this research.
Conflicts of Interest
The author declares there are no conflicts of interest.
Appendix A. Evaluation Metrics
The evaluation metrics consist of several evaluation as follows.
Appendix A.1. Accuracy
Accuracy measures the percentage of correct guesses or classifications from the total data. This provides a quick overview of the model’s overall performance when the data classes are balanced.
Appendix A.2. Precision
Precision measures the accuracy of the model’s positive predictions relative to the total number of positive predictions, which is useful for reducing false positives.
Appendix A.3. Recall
Recall measures the model’s ability to retrieve or detect all samples that should be labeled positive, which is useful for reducing false negative errors.
Appendix A.4. F1-Score
F1-score is a metric for finding the best balance between precision and recall especially when the data distribution is imbalanced.
Appendix A.5. Cohen’s Kappa
A statistical technique ideal for measuring inter-rater reliability when grouping data into specific categories. This method accounts for chance factors and corrects for them to maintain objective evaluation. Kappa values range from 0 to 1 and can be interpreted using Landis and Koch’s statistical standards, as shown in Table A1.
Table A1.
Kappa interpretation [34].
Appendix B. Media Stance Evaluation Metrics
The labeling results for media stance detection indicate that the dataset was imbalanced, with a predominance of neutral stances, as shown in Table A2. In imbalanced data, accuracy, precision, and recall are no longer relevant; however, the most relevant metrics to present are the macro F1-score and Cohen’s Kappa, as shown in Table A3. The macro F1-score of 0.72 and the Kappa of 0.58 indicate that the gpt-5 model performed well with a moderate level of agreement.
Table A2.
Media stance confusion matrix.
Table A3.
Media stance detection evaluation metrics.
Appendix C. Sentiment Analysis Evaluation Metrics
The sentiment analysis labeling using the Indonesia-BERT-sentiment-classifier model yielded imbalanced results, with the negative class dominating, as shown in Table A4. Therefore, the significant metrics to present are the macro F1-score of 0.56 and the Kappa of 0.35, indicating unsatisfactory performance with fair agreement, as shown in Table A5.
Table A4.
Sentiment analysis confusion matrix.
Table A5.
Sentiment analysis evaluation metrics.
Appendix D. Named Entity Recognition Evaluation Metrics
Using the gpt-4.1-mini model to extract entities from comments resulted in the person class dominating the entire dataset, as shown in Table A6. Therefore, the relevant metrics to present are the macro F1-score of 0.56 and the Kappa value of 0.36, indicating that the model’s performance was unsatisfactory and shows a fair level of agreement, as shown in Table A7.
Table A6.
Entity extraction confusion matrix.
Table A7.
Entity extraction evaluation metrics.
Appendix E. Moral Labeling Evaluation Metrics
The gpt-4o-mini model used for morality labeling also produced an imbalanced dataset, with negative morality classes dominating, as shown in Table A8. The relevant metrics to present are the macro F1-score and Cohen’s Kappa. For the morality class, the macro F1-score was 0.63, and the Kappa was 0.46, indicating unsatisfactory model performance and moderate agreement, as shown in Table A9.
Table A8.
Moral labeling confusion matrix.
Table A9.
Moral labeling evaluation metrics.
Appendix F. Responsibility Labeling Evaluation Metrics
The gpt-4o-mini model used for responsibility labels also produced an imbalanced dataset, with individual responsibility classes dominating, as shown in Table A10. The relevant metrics to present are the macro F1-score and Cohen’s Kappa. In the responsibility class, the macro F1-score was 0.55, and Cohen’s Kappa was 0.48, indicating unsatisfactory model performance and moderate agreement, as shown in Table A11.
Table A10.
Responsibility labeling confusion matrix.
Table A11.
Responsibility labeling evaluation metrics.
Appendix G. Cross-Tabulation Between Media Stance and Sentiment Analysis
Table A12.
Sentiment on media stance.
Appendix H. Cross-Tabulation Between Media Stance and Entity Extraction
Table A13.
Entity extraction on media stance.
Appendix I. Cross-Tabulation Between Media Stance and Morality Labeling
Table A14.
Morality labeling on media stance.
Appendix J. Cross-Tabulation Between Media Stance and Responsibility Labeling
Table A15.
Responsibility labeling on media stance.
References
- Ibrahim, M.; Wang, B.; Xu, M.; Xu, H. A multidimensional analysis of media framing in the Russia-Ukraine war. J. Comput. Soc. Sci. 2025, 8, 34. [Google Scholar] [CrossRef] [Scilit]
- Jeganathan, K.; Szymkowiak, A. Social Media Content Headlinesand Their Impact on Attracting Attention. J. Mark. Consum. Behav. Emerg. Mark. 2020, 1, 49–59. [Google Scholar] [CrossRef] [Scilit]
- Spinde, T.; Hinterreiter, S.M.I.; Haak, F.; Ruas, T.; Giese, H.; Meuschke, N.; Gipp, B. The Media Bias Taxonomy: A Systematic Literature Review on the Forms and Automated Detection of Media Bias. arXiv 2023, arXiv:2312.16148v3. [Google Scholar]
- Alturayeif, N.; Luqman, H. A systematic review of machine learning techniques for stance detection and its applications. Neural Comput. Appl. 2023, 35, 5113–5144. [Google Scholar] [CrossRef] [Scilit] [PubMed]
- Hardalov, M.; Arora, A.; Nakov, P.; Augenstein, I. A Survey on Stance Detection for Mis- and Disinformation Identification. arXiv 2022, arXiv:2103.00242v3. [Google Scholar]
- Yuan, L.; Shen, H.; Shi, L.; Cheng, N.; Jiang, H. An Explainable Fake News Analysis Method with Stance Information. Electronics 2023, 12, 3367. [Google Scholar] [CrossRef] [Scilit]
- Nagura, T.; Akiyama, E. Effect of Network Homophily and Partisanship on Social Media to “Oil Spill” Polarizations. J. Artif. Soc. Soc. Simul. 2026, 29, 1. [Google Scholar] [CrossRef] [Scilit]
- Sujana, I.G.; Mustika, I.P.B. The Implementation of Punishment from the Perspective on Human Rights. In Proceedings of the International Conference on Multi-Disciplines Approaches for The Sustainable Development; Dwijendra Univeristy: Denpasar, Indonesia, 2023; pp. 679–686. Available online: https://eproceeding.undwi.ac.id/index.php/mdasd/article/view/351 (accessed on 23 June 2026).
- Sujana, I.G.; Kandia, I.W. Indikator Lemahnya Penegakan Hukum di Indonesia. IJOLARES Indones. J. Law Res. 2024, 2, 56–62. [Google Scholar] [CrossRef] [Scilit]
- Anandya, D.; Ramdhana, K. Laporan Hasil Pemantauan Tren Korupsi Tahun 2023 Indonesia Corruption Watch; ICW: Hong Kong, China, 2024; pp. 3–50. [Google Scholar]
- Oyebode, O.; Ndulue, C.; Mulchandani, D.; Suruliraj, B.; Adib, A.; Orji, F.A.; Milios, E.; Matwin, S.; Orji, R. COVID-19 Pandemic: Identifying Key Issues Using Social Media and Natural Language Processing. J. Healthc. Inform. Res. 2022, 6, 174–207. [Google Scholar] [CrossRef] [Scilit] [PubMed]
- McCombs, M.; Shaw, D. The Agenda-Setting function of mass media. In Agenda Setting: Readings on Media, Public Opinion, and Policymaking; Routledge: New York, NY, USA, 1972; Volume 36, pp. 17–26. [Google Scholar] [CrossRef] [Scilit]
- Entman, R.M. Framing: Toward Clarification of a Fractured Paradigm. J. Commun. 1993, 43, 51–58. [Google Scholar] [CrossRef] [Scilit]
- Cioffi-Revilla, C. Computational social science. Wiley Interdiscip. Rev. Comput. Stat. 2010, 2, 259–271. [Google Scholar] [CrossRef] [Scilit]
- Zhang, J.; Wang, W.; Xia, F.; Lin, Y.R.; Tong, H. Data-Driven Computational Social Science: A Survey. Big Data Res. 2020, 21, 100145. [Google Scholar] [CrossRef] [Scilit]
- Luo, J.D.; Liu, J.; Yang, K.; Fu, X. Big data research guided by sociological theory: A triadic dialogue among big data analysis, theory, and predictive models. J. Chin. Sociol. 2019, 6, 11. [Google Scholar] [CrossRef] [Scilit]
- Sawicki, J.; Ganzha, M.; Paprzycki, M. The State of the Art of Natural Language Processing—A Systematic Automated Review of NLP Literature Using NLP Techniques. Data Intell. 2023, 5, 707–749. [Google Scholar] [CrossRef] [Scilit]
- Supriyono; Wibawa, A.P.; Suyono; Kurniawan, F. Advancements in natural language processing: Implications, challenges, and future directions. Telemat. Inform. Rep. 2024, 16, 100173. [Google Scholar] [CrossRef] [Scilit]
- Aoki, G. Large Language Models in Politics and Democracy: A Comprehensive Survey. arXiv 2024, arXiv:2412.04498. [Google Scholar]
- Thapa, S.; Shiwakoti, S.; Shah, S.B.; Adhikari, S.; Veeramani, H.; Nasim, M.; Naseem, U. Large language models (LLM) in computational social science: Prospects, current state, and challenges. Soc. Netw. Anal. Min. 2025, 15, 4. [Google Scholar] [CrossRef] [Scilit]
- Hoti, M.H.; Qorrolli, F.; Spahija, F. Enhancing Fake News Detection via Stance Analysis. Int. J. Interact. Mob. Technol. 2025, 19, 39–50. [Google Scholar] [CrossRef] [Scilit]
- Huang, H.; Zhang, B.; Li, Y.; Zhang, B.; Sun, Y.; Luo, C.; Peng, C. Knowledge-enhanced Prompt-tuning for Stance Detection. ACM Trans. Asian Low-Resour. Lang. Inf. Process. 2023, 22, 159. [Google Scholar] [CrossRef] [Scilit]
- Mets, M.; Karjus, A.; Ibrus, I.; Schich, M. Automated stance detection in complex topics and small languages: The challenging case of immigration in polarizing news media. PLoS ONE 2024, 19, e0302380. [Google Scholar] [CrossRef] [Scilit] [PubMed]
- Aftab, F.; Bazai, S.U.; Marjan, S.; Baloch, L.; Aslam, S. A Comprehensive Survey on Sentiment Analysis Techniques. Int. J. Technol. 2023, 14, 1288–1298. [Google Scholar] [CrossRef] [Scilit]
- Wilie, B.; Vincentio, K.; Indra Winata, G.; Cahyawijaya, S.; Li, X.; Lim, Z.Y.; Soleman, S.; Mahendra, R.; Fung, P.; Bahar, S.; et al. IndoNLU: Benchmark and Resources for Evaluating Indonesian Natural Language Understanding. arXiv 2020, arXiv:2009.05387. [Google Scholar] [CrossRef] [Scilit]
- Lin, C.H.; Nuha, U. Sentiment analysis of Indonesian datasets based on a hybrid deep-learning strategy. J. Big Data 2023, 10, 88. [Google Scholar] [CrossRef] [Scilit] [PubMed]
- Lavingia, K.; Mehta, P.; Koringa, Y.; Lavingia, A.; Patel, V. Parallel learning based Bi-LSTM model for Named Entity Recognition. Int. J. Syst. Assur. Eng. Manag. 2025, 16, 3126–3133. [Google Scholar] [CrossRef] [Scilit]
- Liu, Z.; Qin, T.; Liu, B.; Sun, Q.; Li, S. Knowledge enhanced prompting for few-shot named entity recognition. Int. J. Mach. Learn. Cybern. 2026, 17, 60. [Google Scholar] [CrossRef] [Scilit]
- Lee, D.H. Pseudo-label: The simple and efficient semi-supervised learning method for deep neural networks. In Proceedings of the ICML 2013 Workshop: Challenges in Representation Learning, Atlanta, GA, USA, 16–21 June 2013; pp. 1–6. Available online: https://openreview.net/pdf?id=3iGjh_NmoG (accessed on 23 June 2026).
- Arazo, E.; Ortego, D.; Albert, P.; O’Connor, N.E.; McGuinness, K. Pseudo-Labeling and Confirmation Bias in Deep Semi-Supervised Learning. arXiv 2020, arXiv:1908.02983. [Google Scholar]
- Park, J.; Lee, Y. Advanced pseudo-labeling approach in mixing-based text data augmentation method. Pattern Anal. Appl. 2024, 27, 129. [Google Scholar] [CrossRef] [Scilit]
- Habib, Y.A.; Gilalo, J.J. Social Justice Theory in Indonesia Reviewed from the Philosophy of Law. Int. J. Bus. Law Educ. 2025, 6, 238–247. [Google Scholar] [CrossRef] [Scilit]
- Chadwick, A. The Hybrid Media System: Politics and Power; Oxford University Press: Oxford, UK, 2013. [Google Scholar] [CrossRef] [Scilit]
- Landis, J.R.; Koch, G.G. The Measurement of Observer Agreement for Categorical Data. Biometrics 1977, 33, 159–174. [Google Scholar] [CrossRef] [Scilit]
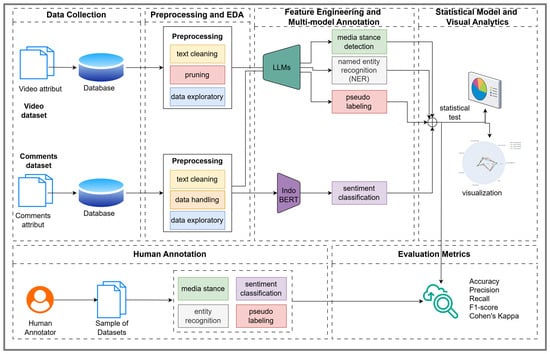
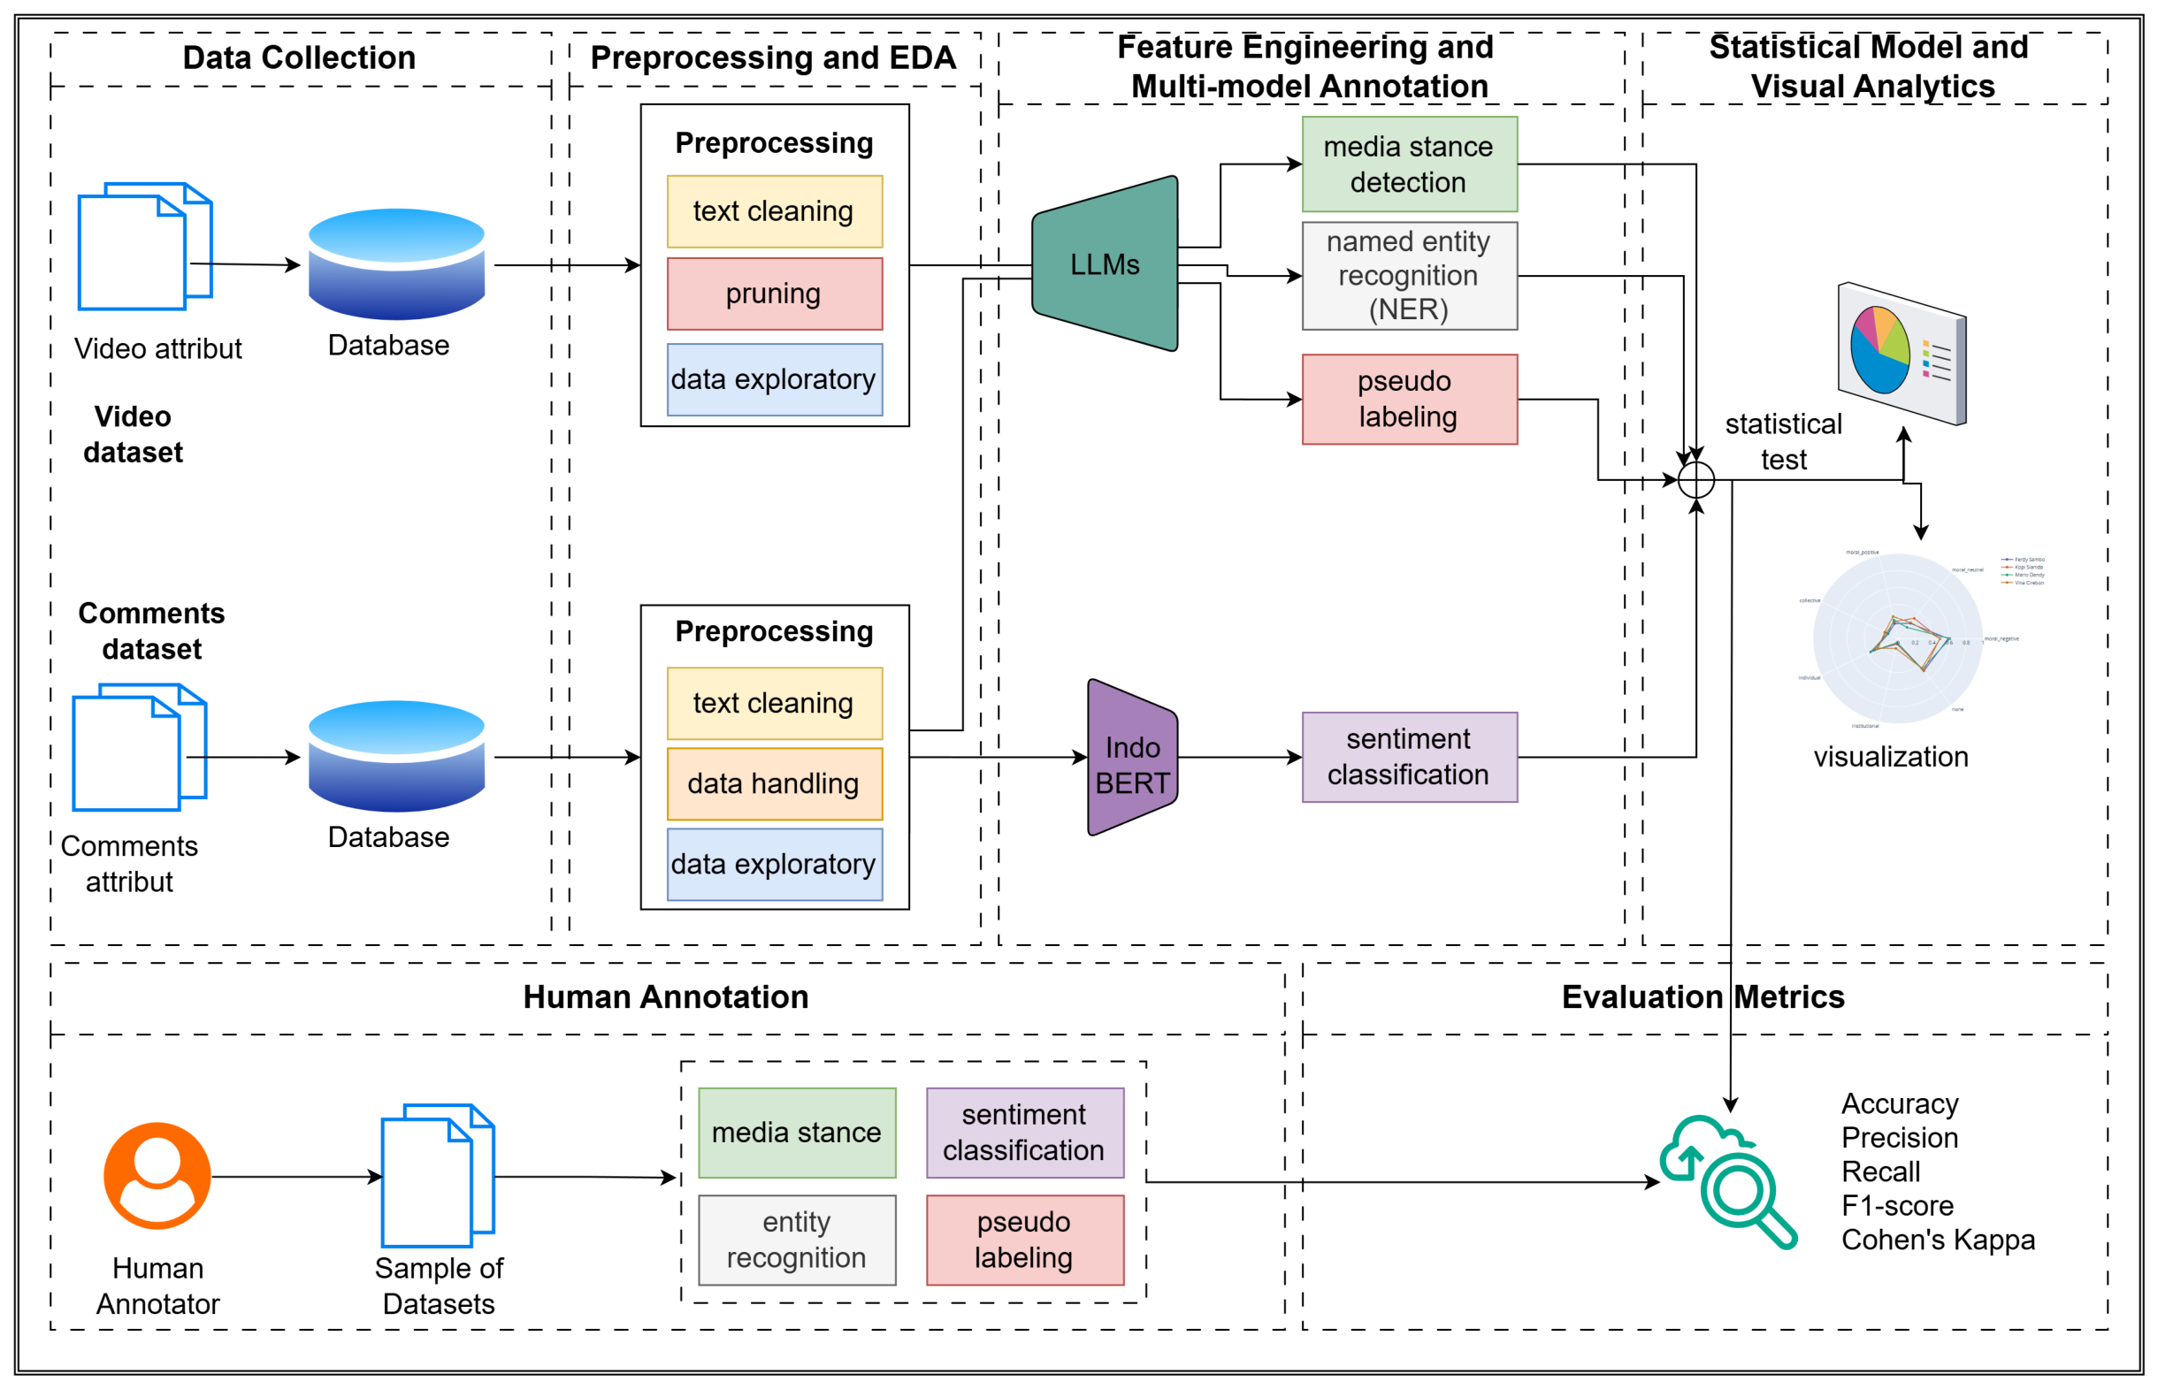
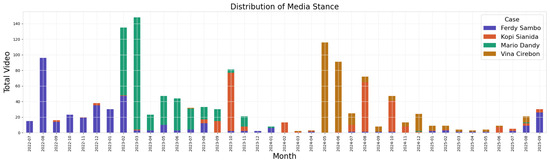
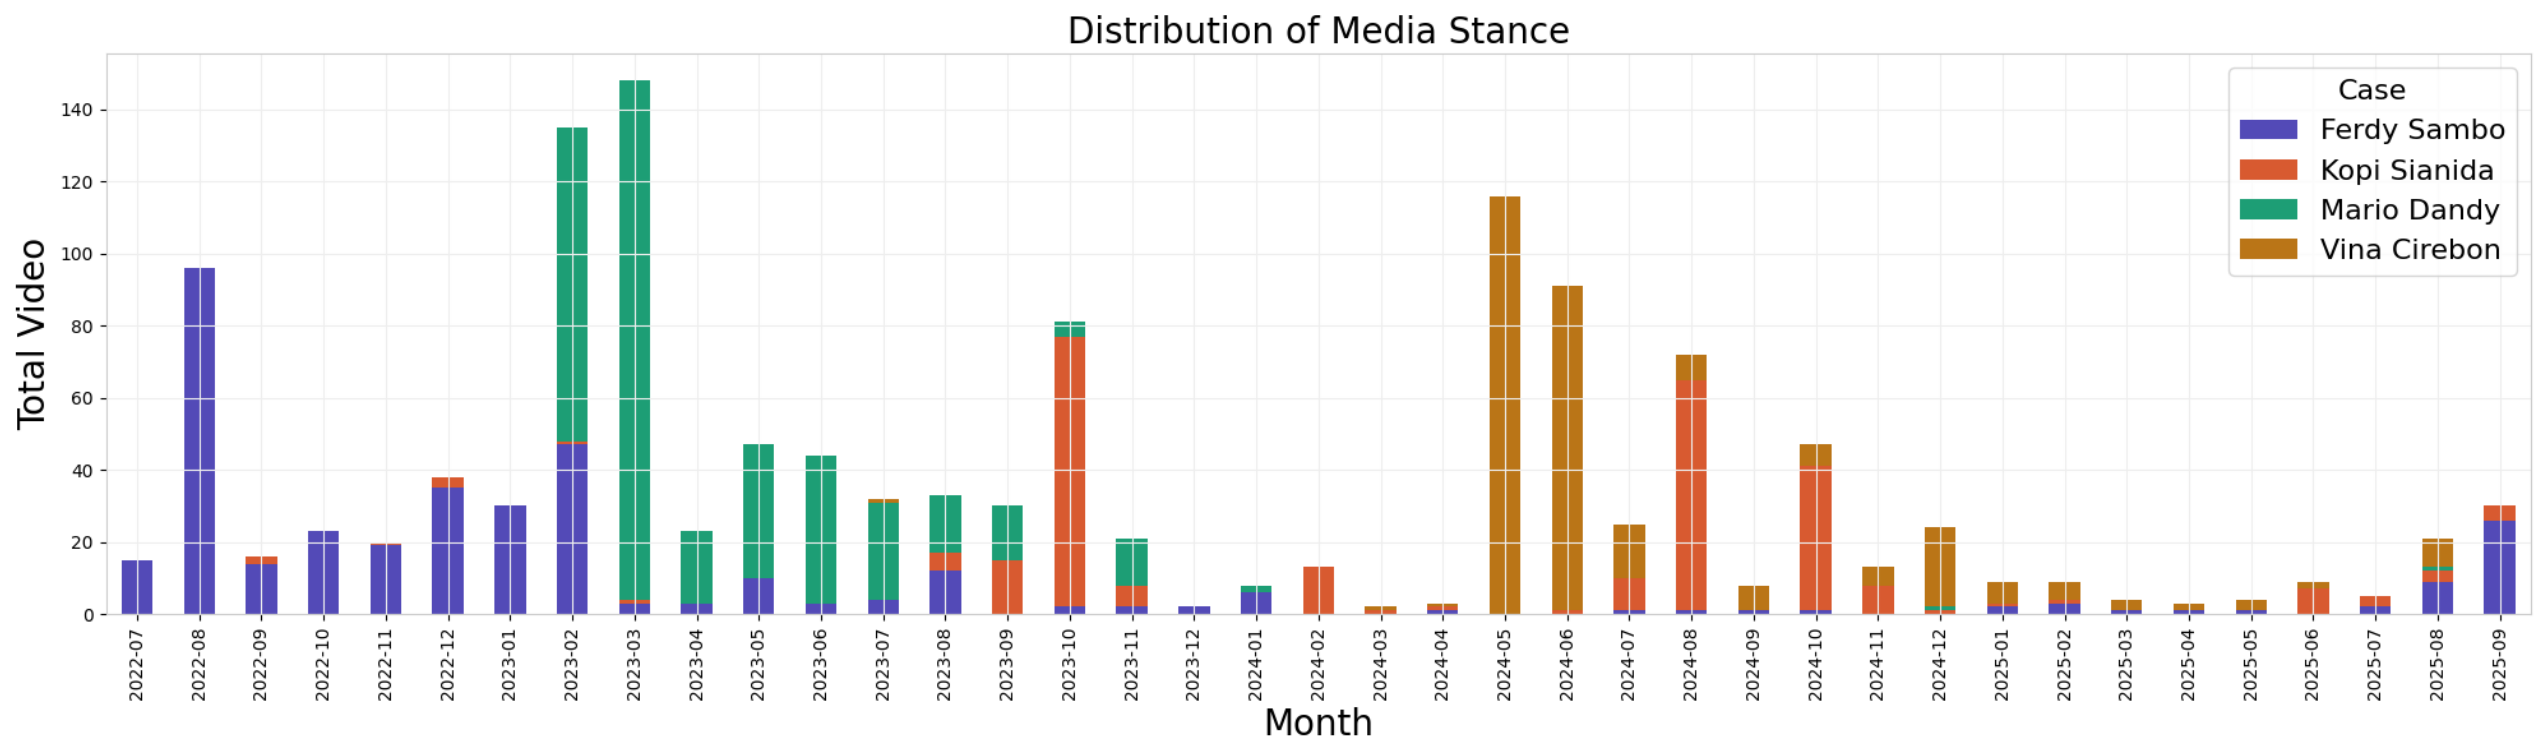
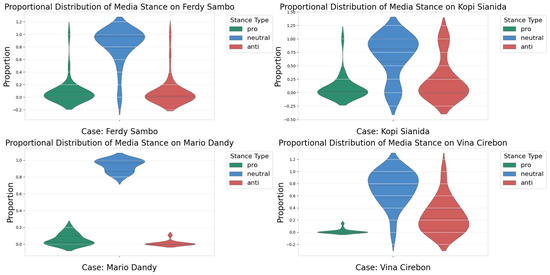
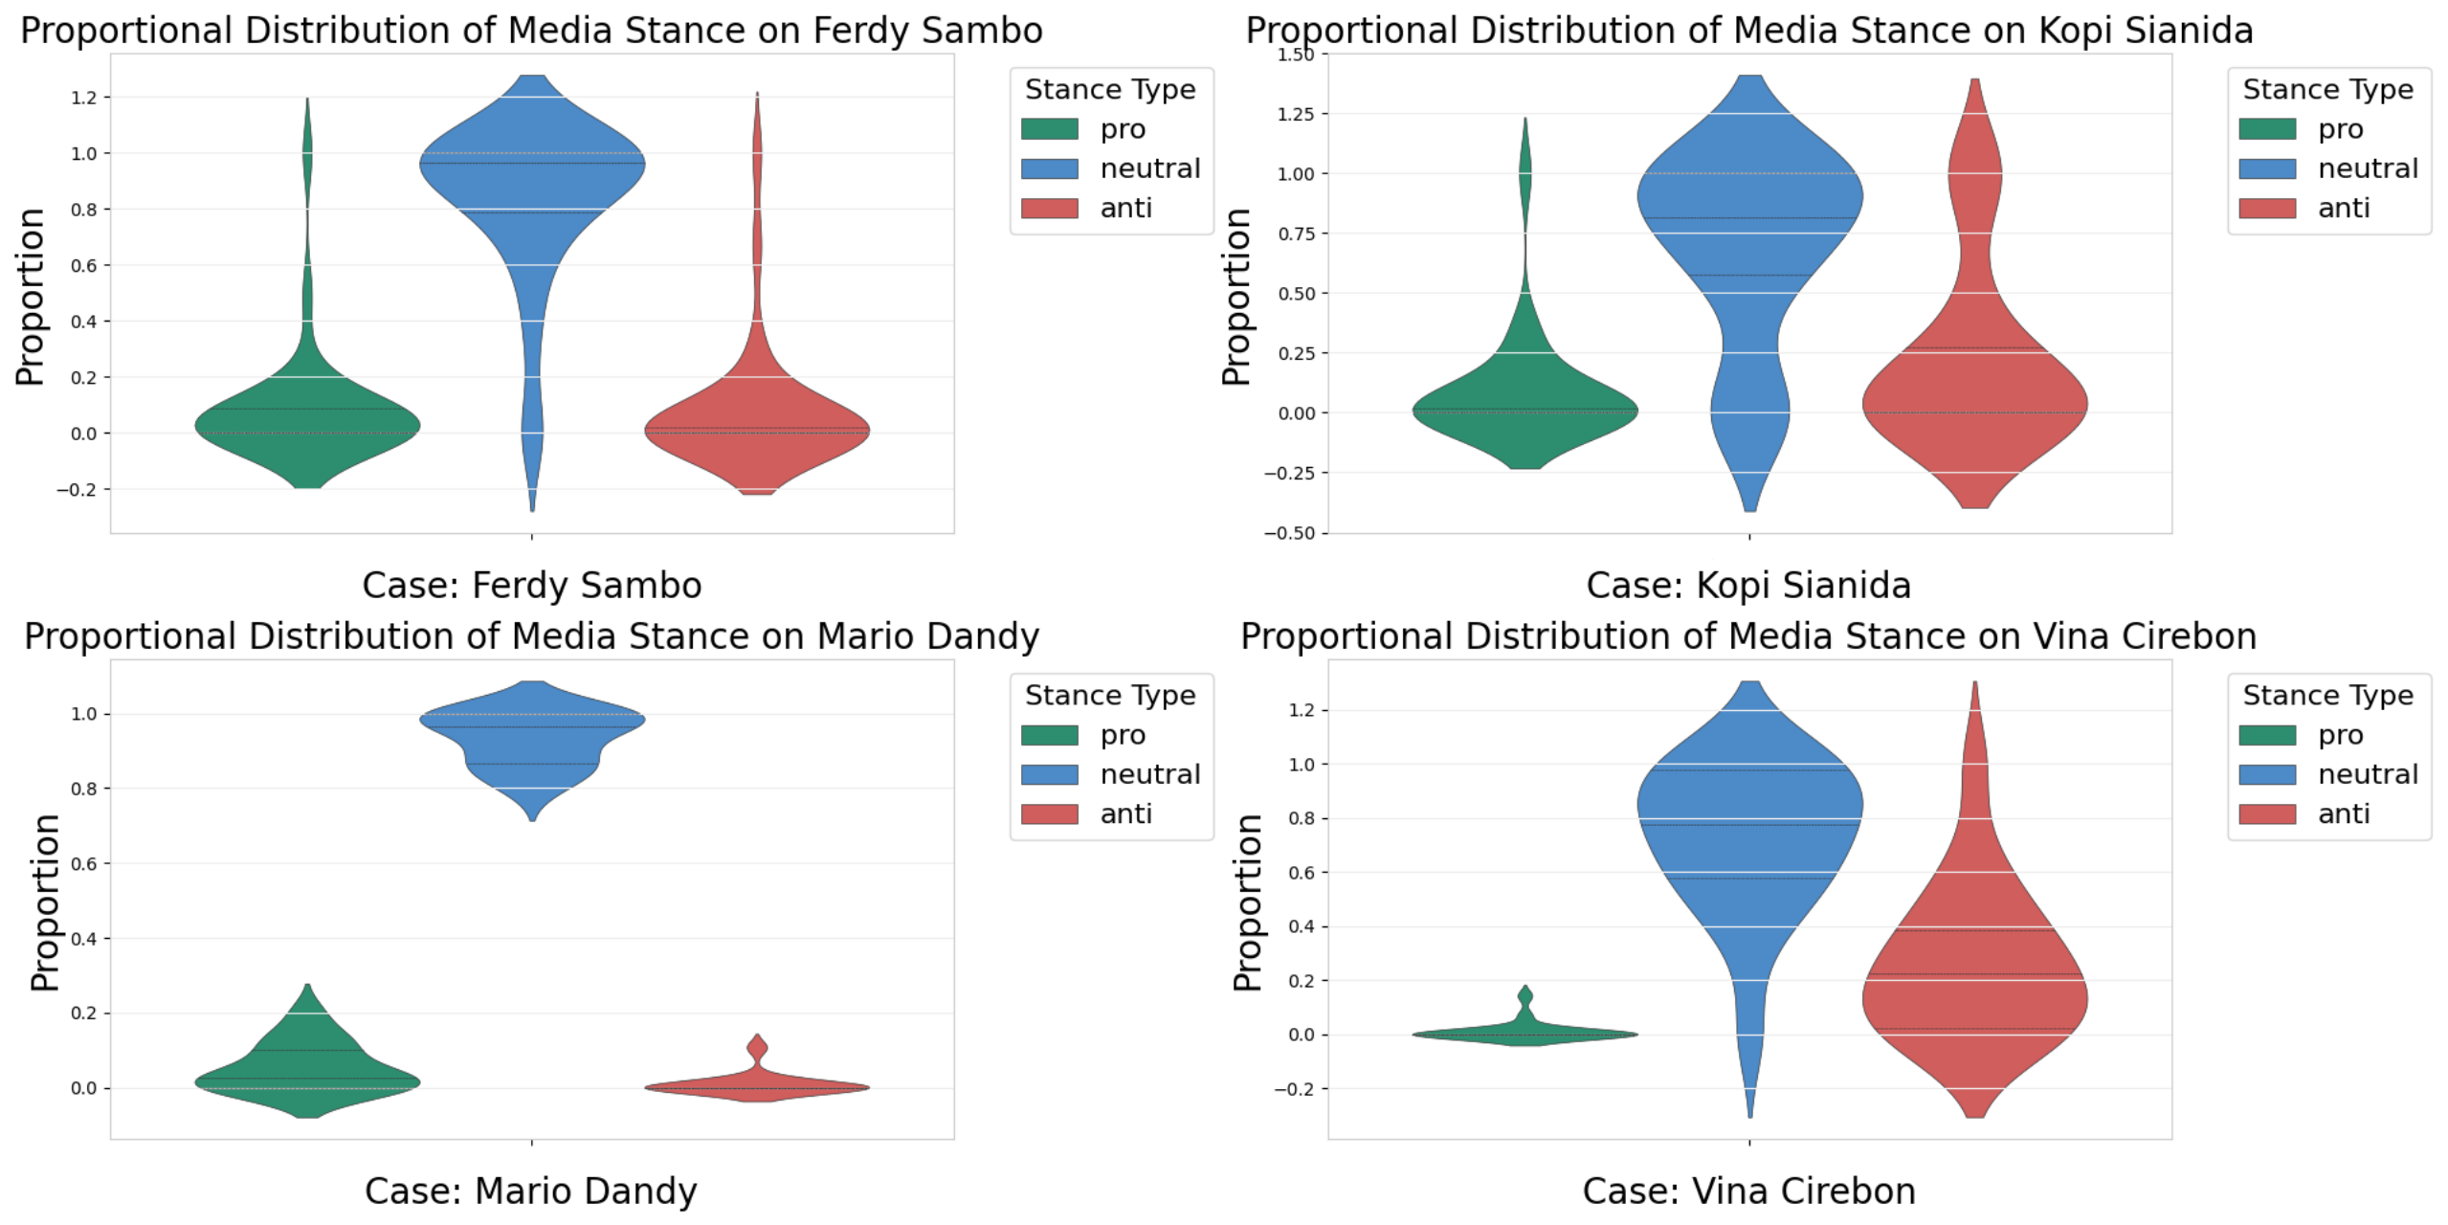
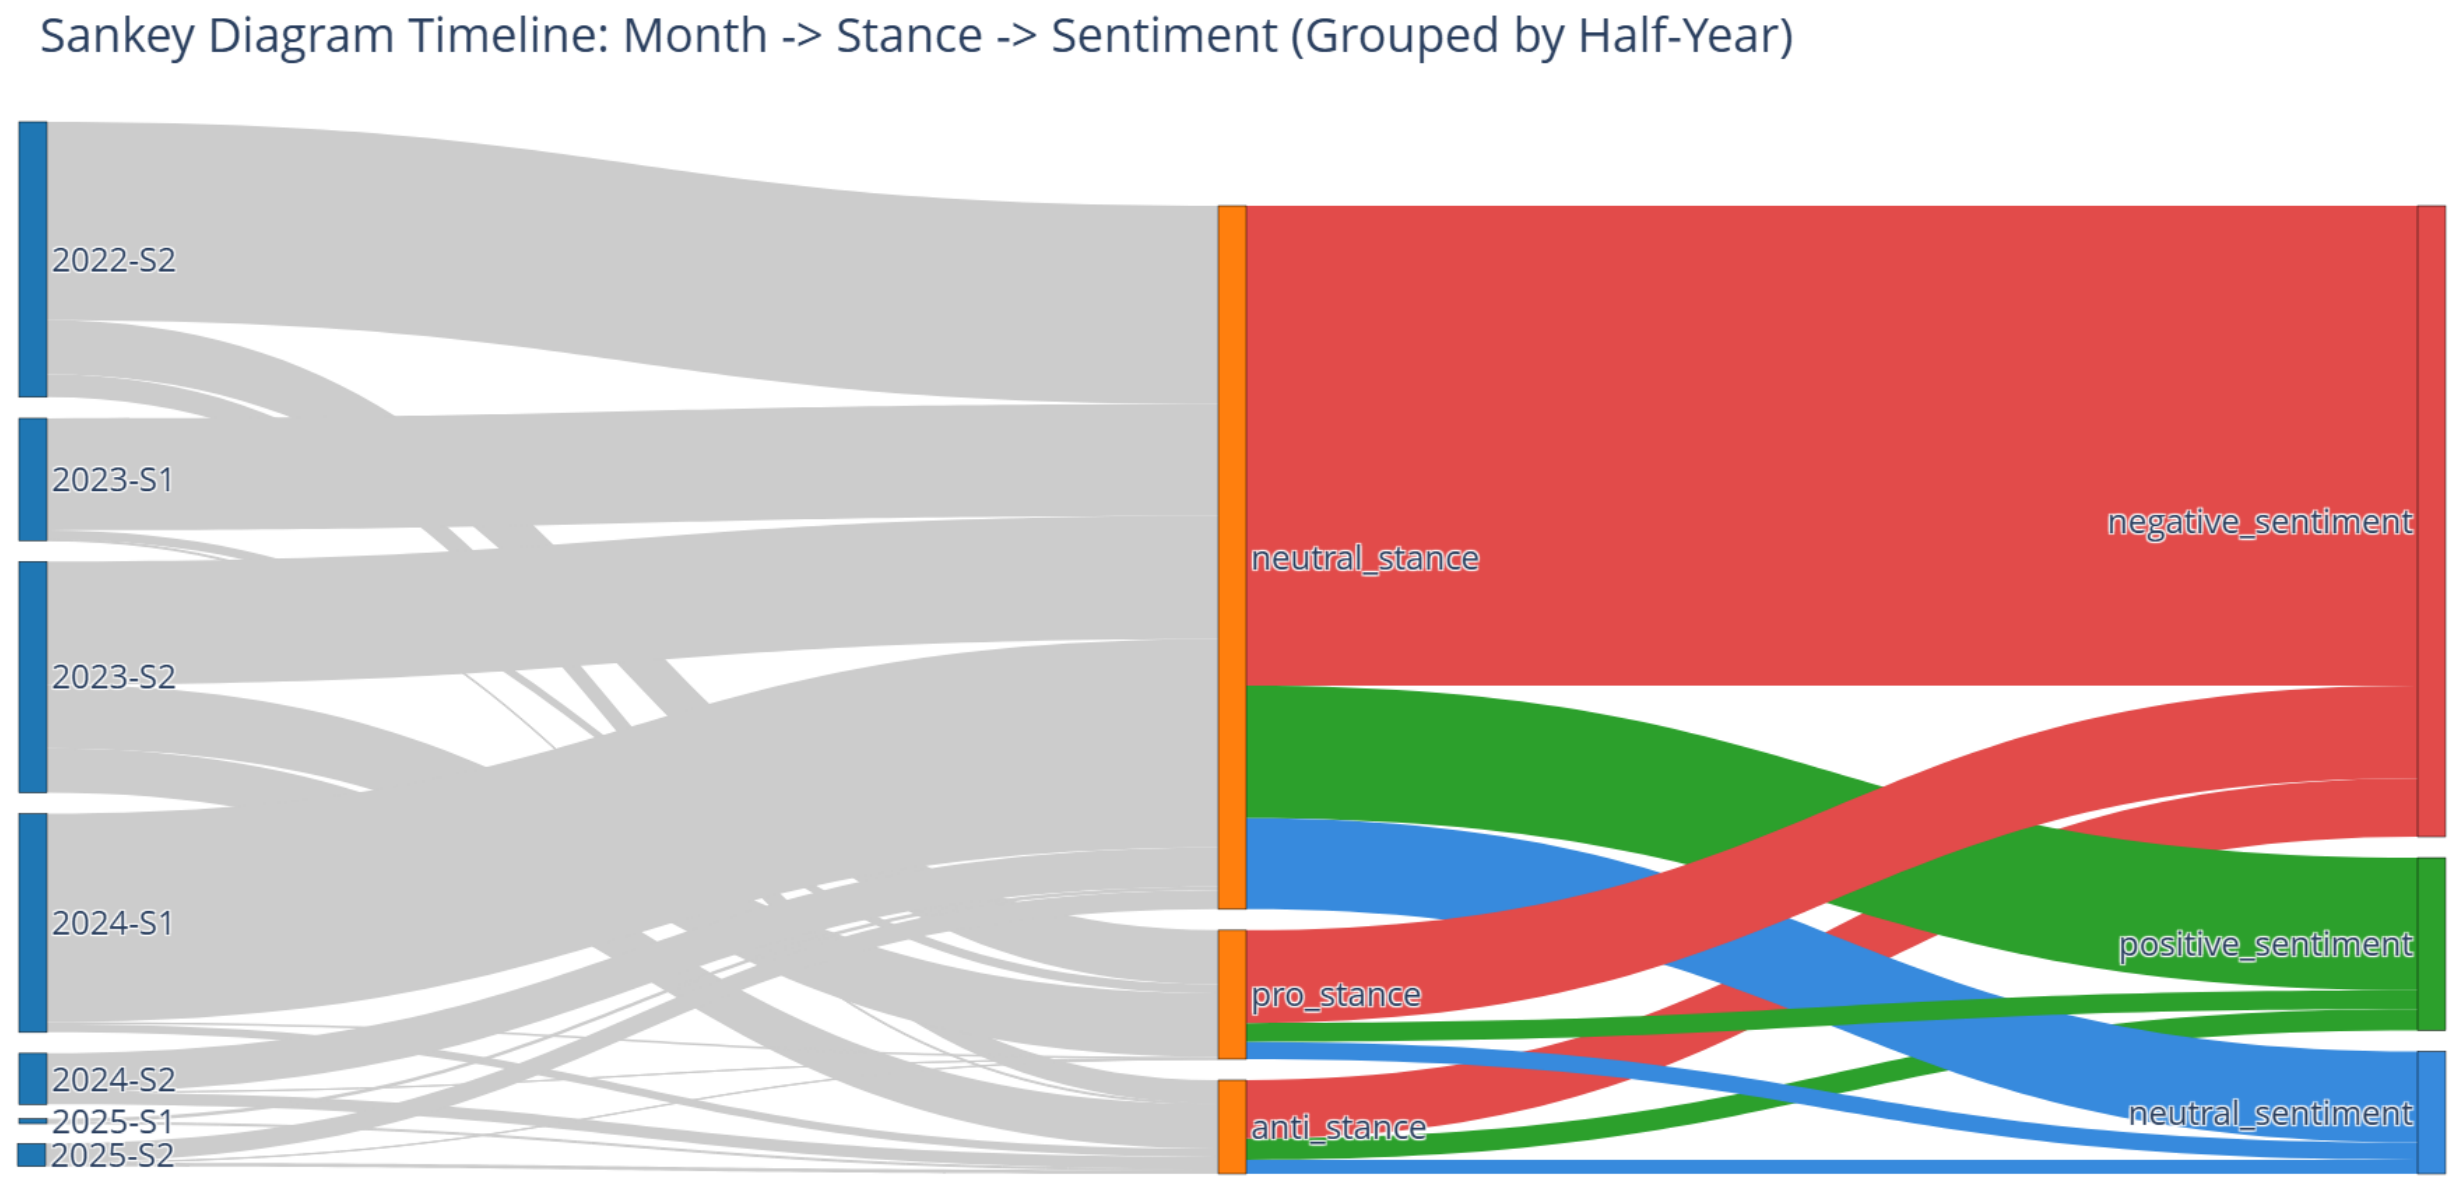
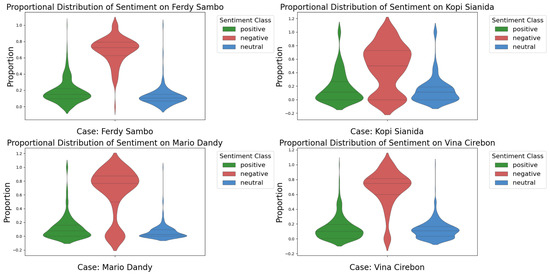
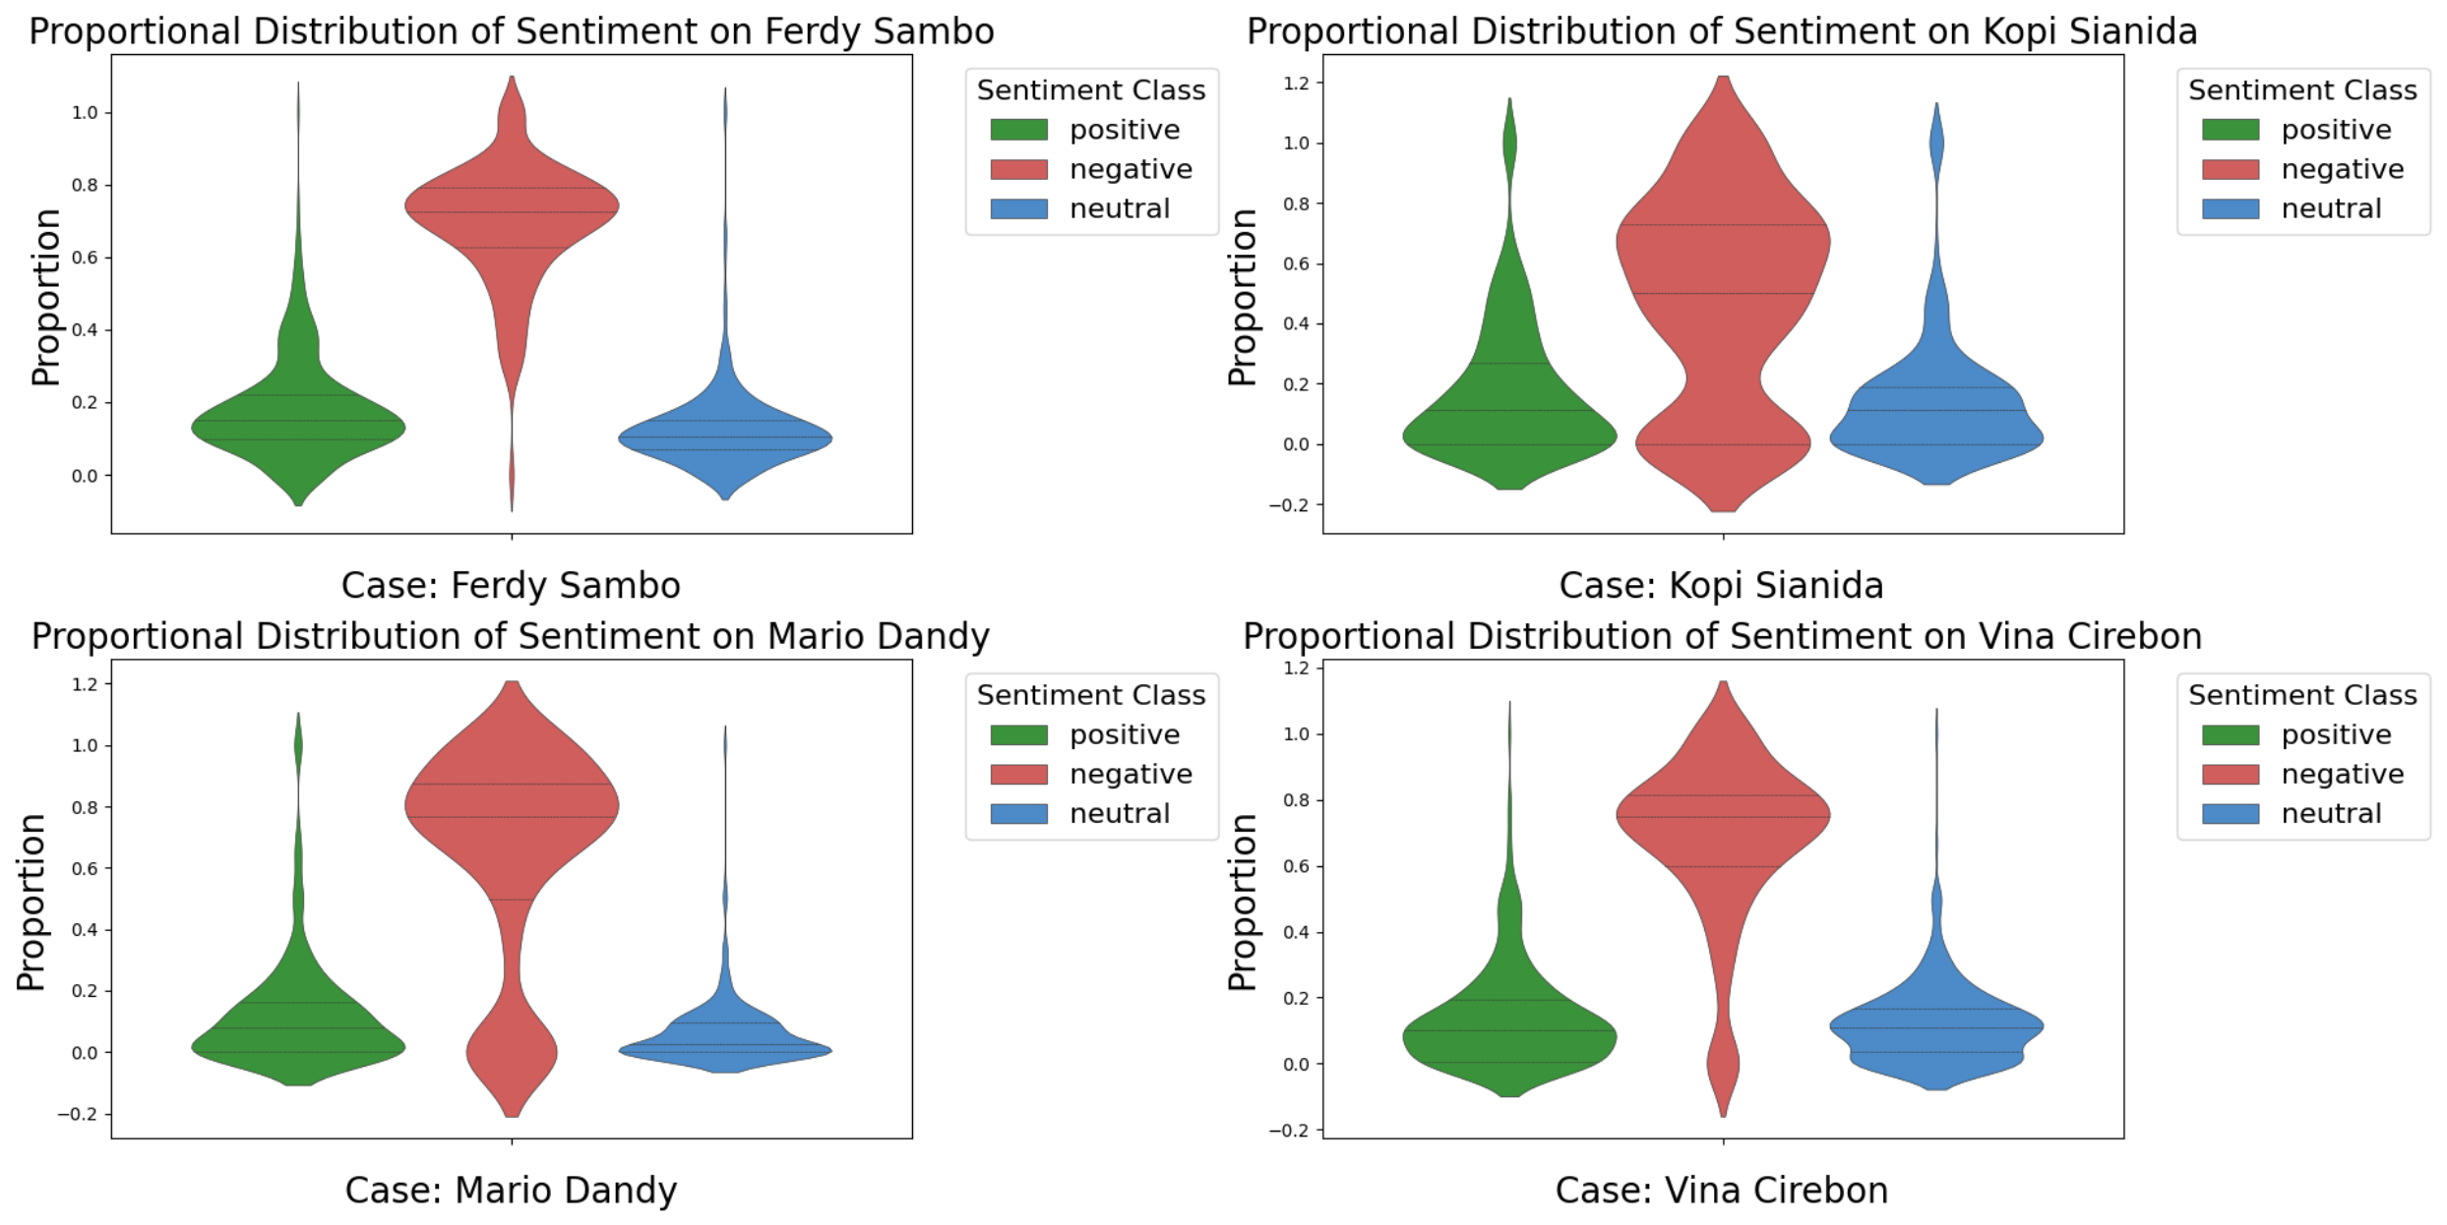
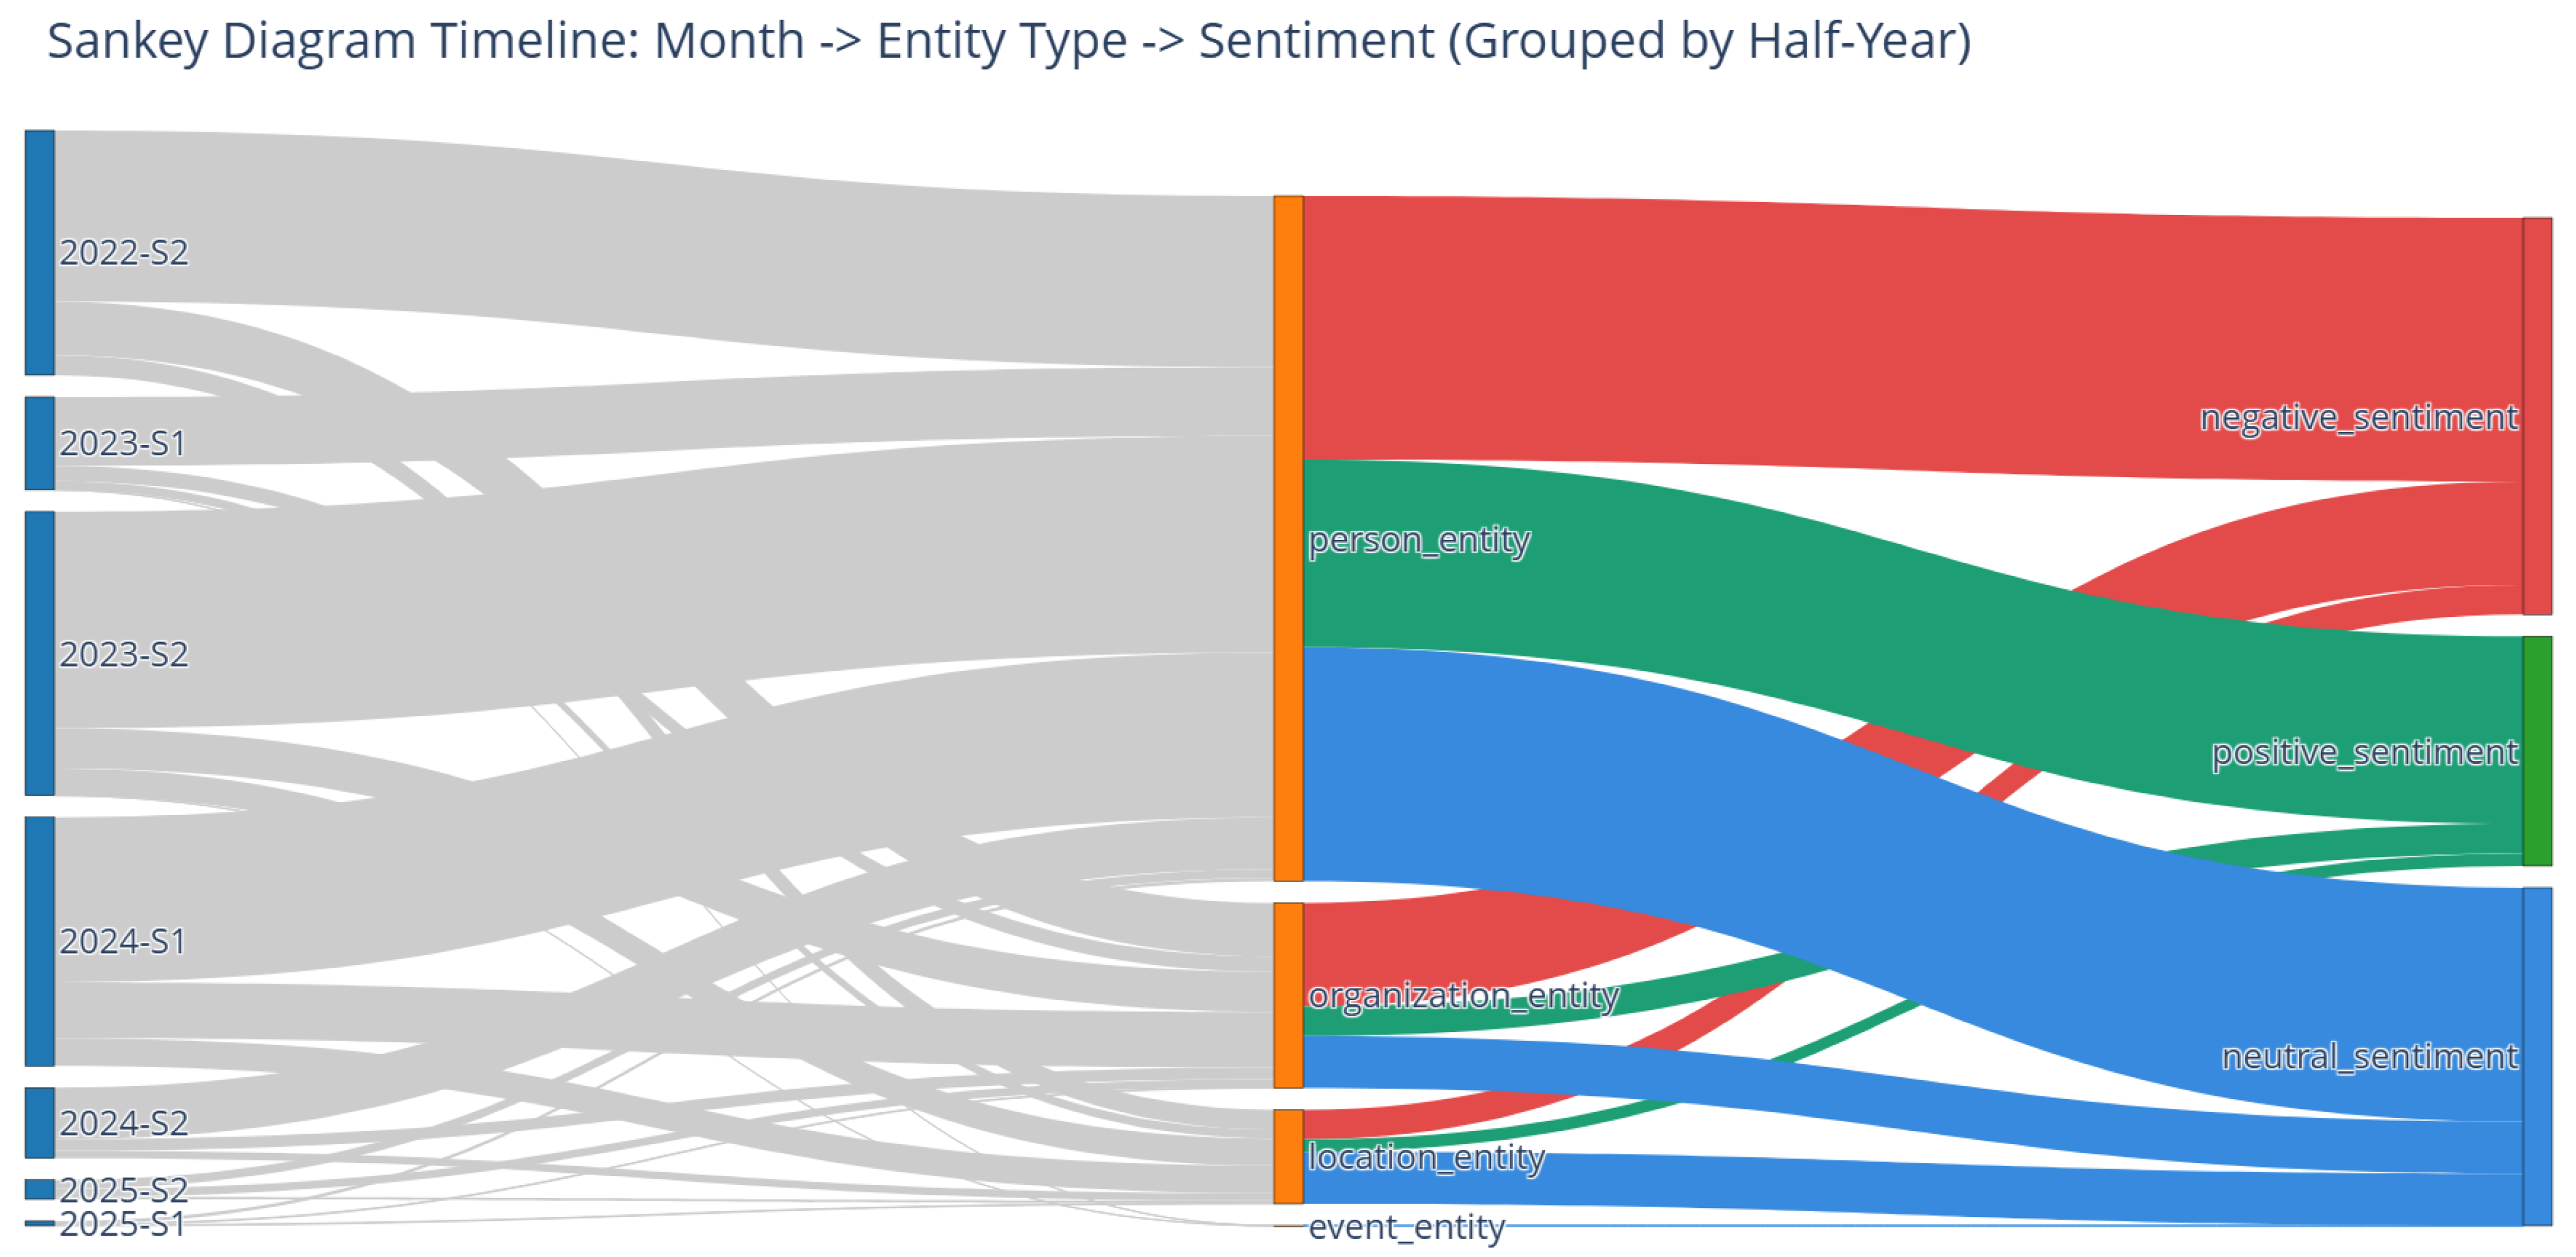
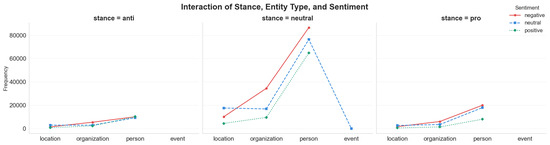
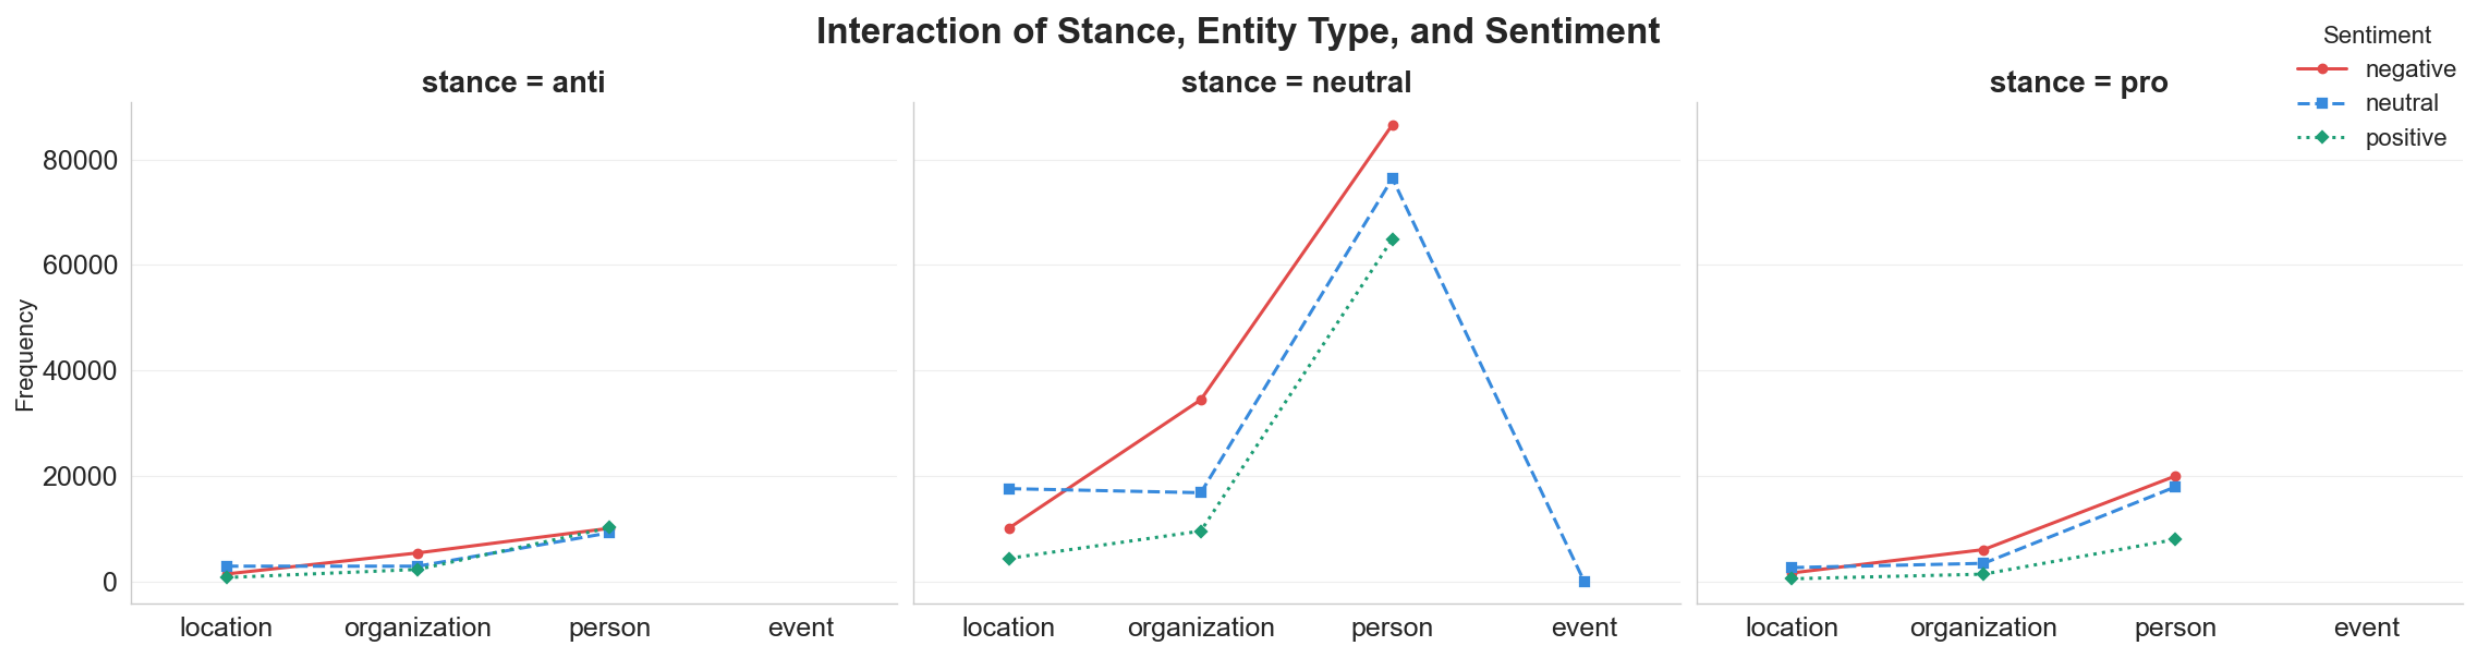
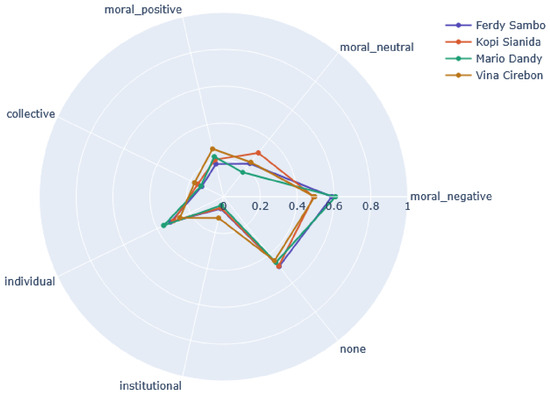
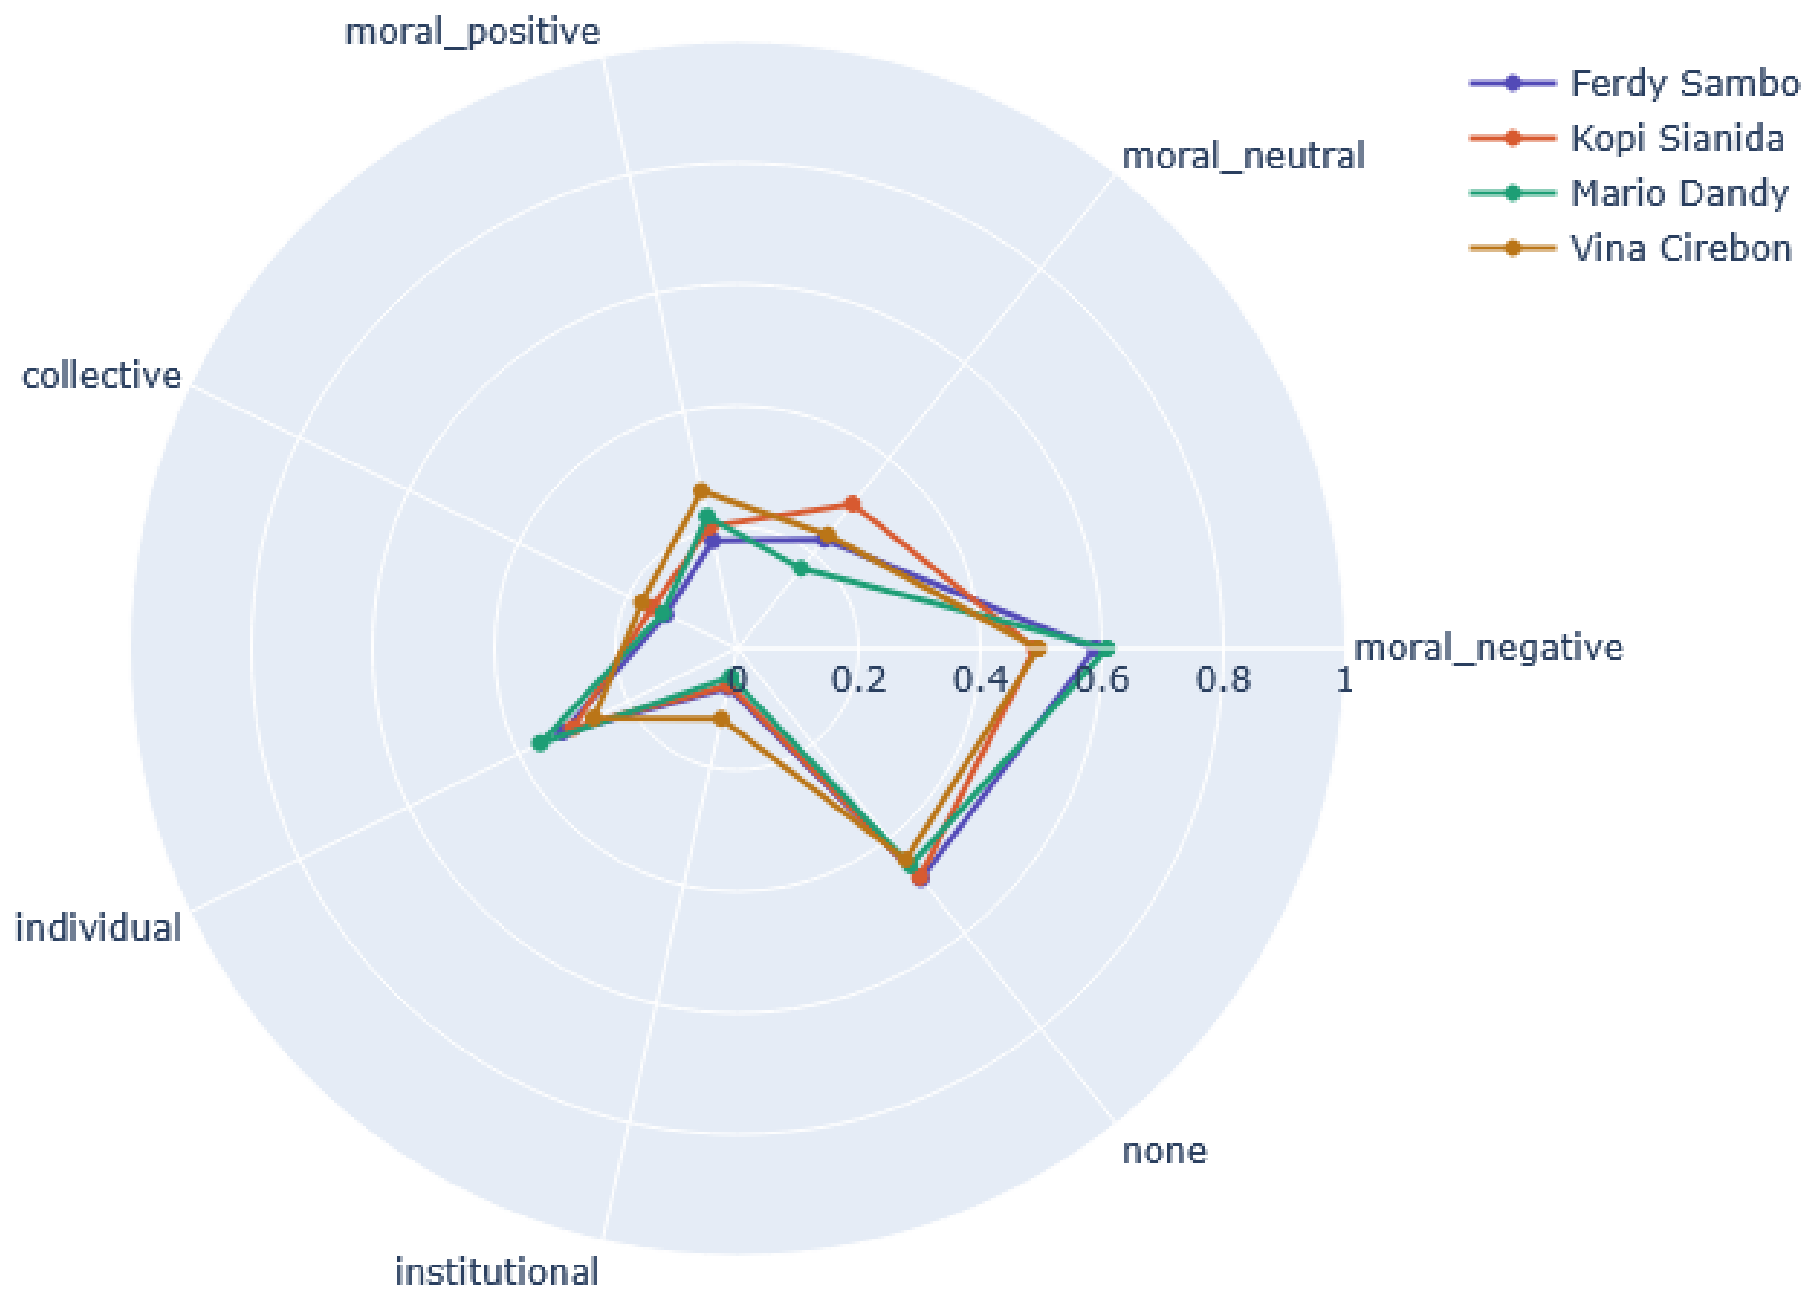

Disclaimer/Publisher’s Note: The statements, opinions and data contained in all publications are solely those of the individual author(s) and contributor(s) and not of MDPI and/or the editor(s). MDPI and/or the editor(s) disclaim responsibility for any injury to people or property resulting from any ideas, methods, instructions or products referred to in the content. |
© 2026 by the authors. Licensee MDPI, Basel, Switzerland. This article is an open access article distributed under the terms and conditions of the Creative Commons Attribution (CC BY) license.