


Abstract
Industrial diagnostic systems require a governance mechanism that determines whether heterogeneous evidence is admissible, mutually consistent, and sufficient for an automatic action. This paper presents the Diagnostic Evidence Governance Agent (DEGA), a deterministic governance layer built from explicit finite-state machine states, replaceable routing policies, an authoritative SafetyGuard, and hash-linked audit with deterministic replay. The bounded DUDU-BLDC case study retains diagnostic evidence from eight acquisitions and extends the evaluation to governance-profile sensitivity and state coverage. Across 15,360 retained real-evidence case-policy routes, no automatic recommendation was issued; 9216 routes reached Decision Check; and the mandatory-explanation rule triggered 7904 times. Under predeclared contract-satisfied simulated profiles, 2924 recommendations and 12,436 escalations were produced, with no recommended route violating the internal governance-consistency proxy. The results show that explanation availability is a binding governance condition and that recommendation-path reachability can be evaluated without weakening the remaining SafetyGuard gates; the simulation is restricted to explanation availability and admissibility metadata and does not validate feature attribution, recommendation correctness, or industrial deployment.
1. Introduction
The Industrial Internet of Things (IIoT) has expanded condition monitoring from isolated measurements to connected diagnostic pipelines that combine sensing, communication, edge or cloud computation, and maintenance decision support [1,2,3]. This development extends the established condition-based and e-maintenance literature, in which the measured equipment condition is converted into diagnostic or prognostic information for maintenance planning [4,5]. In rotating machinery and electrical drives, signal-processing and machine-learning methods now extract diagnostic information from current, vibration, speed, and other operating channels [6,7,8,9]. Predictive-maintenance studies consequently focus on increasingly capable classifiers, ensembles, and deep models [10,11,12].
Model performance is necessary, but it does not by itself define an operational diagnostic decision process. A deployed system must also establish whether the data are admissible, which model and reference versions produced the available outputs, whether heterogeneous evidence sources agree, and whether the evidence is sufficient for an automated recommendation. When these conditions are not met, a diagnostic workflow should abstain or transfer the case to human review rather than force an action. The reject-option literature formalizes abstention, uncertainty-quantification methods characterize predictive uncertainty, explainable-AI methods expose aspects of model behavior, and human-in-the-loop approaches define roles for expert intervention [13,14,15,16]. Data-provenance and machine-learning-assurance research further emphasize traceability across computational lifecycles [17,18,19].
These research strands address essential parts of trustworthy diagnostics, but they operate at different levels. A classifier score, a distribution-deviation measure, a spline descriptor, and a feature attribution have different assumptions and interpretation limits. A model-native probability may be uncalibrated; a deviation score may be only a relative surrogate; a spline derivative may describe geometric change in an ordered sequence without representing physical degradation time; and feature importance expresses model reliance rather than causal physical relevance [20,21,22]. Ethical and assurance principles call for transparency, accountability, and human oversight [18,23], but they do not specify how a concrete diagnostic workflow should admit, combine, route, veto, and audit heterogeneous evidence artifacts.
The resulting gap is architectural rather than algorithmic. The literature provides sophisticated evidence generators and several partial mechanisms for uncertainty, abstention, explanation, provenance, and human oversight, but it does not provide a single deterministic governance contract for a multi-stage industrial diagnostic workflow. In particular, a transparent mechanism is needed to keep evidence generation separate from final workflow authorization, preserve the provenance and interpretation boundary of each evidence item, make abstention and escalation explicit outcomes, permit higher-priority safety rules to override a routing policy, and reproduce the complete decision path after execution.
This paper addresses that gap through the Diagnostic Evidence Governance Agent (DEGA). A DEGA is a deterministic diagnostic agent that governs evidence produced by external analytical modules. It does not plan autonomously, learn online, generate unrestricted responses, or modify its own execution rules. Machine-learning and other AI methods may generate evidence consumed by DEGA, while the governance workflow remains explicit, reproducible, and independently inspectable. The proposed architecture separates four responsibilities: versioned evidence generation, immutable aggregation in an EvidenceBundle, deterministic routing under an external higher-priority SafetyGuard, and mandatory audit with deterministic replay.
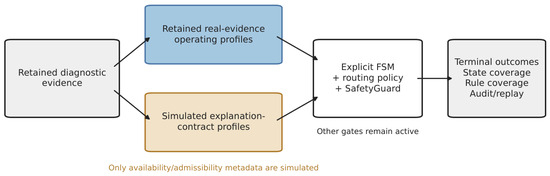
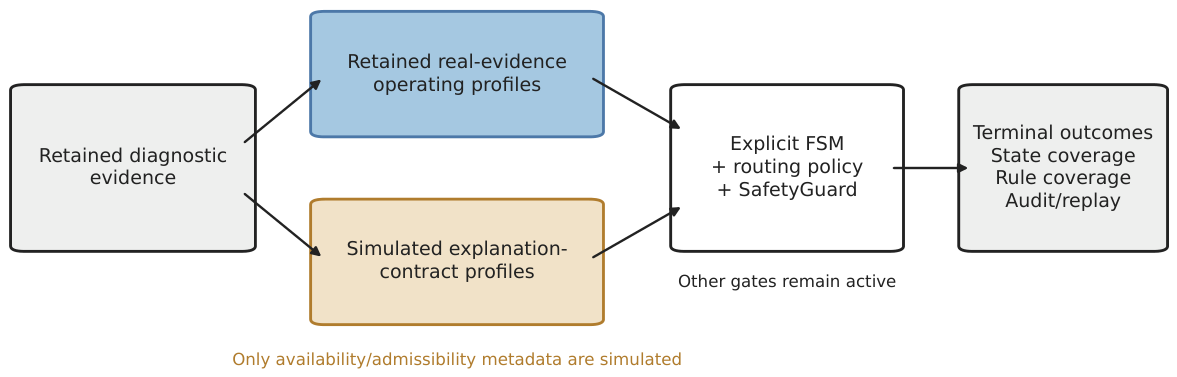
The architecture is demonstrated through an offline computational case study based on the public DUDU-BLDC dataset [24]. The diagnostic setting uses eight real acquisitions, 200 non-overlapping windows, acquisition-disjoint evaluation, three classifier families, and four spline representations. The extended governance evaluation distinguishes retained real-evidence operating profiles from simulated explanation-contract profiles. The latter change only contract-level explanation availability and admissibility metadata, leaving diagnostic evidence and all non-explanation SafetyGuard predicates unchanged. This separation supports governance-profile sensitivity, state-coverage analysis, and recommendation-path reachability without presenting simulated metadata as feature attribution or deployment validation.
The contributions are as follows:
- A formal definition of DEGA as a deterministic governance layer independent of the mechanisms that generate diagnostic evidence;
- An explicit 11-state workflow with distinct recommendation, escalation, no-decision, and mandatory audit states;
- A higher-priority SafetyGuard that can override policy-proposed transitions when evidence or integrity requirements are not met;
- A structured evidence representation that preserves traceability across data, models, configurations, reference profiles, and explanation outputs;
- Hash-linked audit records and deterministic replay of evidence and DEGA executions;
- A bounded DUDU-BLDC case study demonstrating operating-profile sensitivity, state and rule coverage, and the binding role of the explanation contract without claiming deployment calibration.
This study’s principal contribution is therefore governance rather than classifier novelty. Diagnostic models, spline descriptors, deviation evidence, and explanation artifacts remain modular evidence producers; DEGA determines whether their declared contracts permit recommendation, require escalation, or require no decision, and records that determination for audit and replay.
2. Background and Design Requirements
2.1. Diagnostic Signals and Domain-Grounded Interpretation
In the condition monitoring of electrical machines, a comprehensive diagnostic approach typically incorporates multiple physical modalities. Common sources include mechanical vibrations (the industry standard for detecting bearing defects and rotor unbalance), operating temperature (a critical safety parameter), electromagnetic torque, and phase currents. However, in this study, the interpretative examples and feature extraction pipelines are strictly limited to phase current and rotational speed, as these are the primary synchronized measurement channels available in the utilized DUDU-BLDC dataset [6,7].
In this framework, the phase current serves as the primary channel for evaluating the electrical load, inverter operation dynamics, and the physical consequences of partial rotor demagnetization. Conversely, the rotational speed channel is essential for assessing mechanical stability, speed ripple, and the impact of physical anomalies on the motor’s kinematic behavior.
To translate raw time-series data into actionable knowledge, the current and speed signals are transformed into an intermediate layer of diagnostic features. For the proposed diagnostic workflow, the following classical indicators form the core of the analysis: root mean square (RMS), standard deviation, kurtosis, crest factor, and the spectral center. RMS represents the effective value of current or speed and provides a baseline indicator of global signal level and electrical or mechanical load. Standard deviation quantifies signal variability. Kurtosis and crest factor describe impulsiveness and sensitivity to rare high-energy deviations, whereas the spectral center summarizes shifts in the distribution of frequency-domain energy.
While the primary analysis relies on static window features, the advanced modeling framework also utilizes derivative trend features, such as spline slope. These trend indicators are constructed sequentially across ordered records, functioning as an additional mathematical layer rather than requiring a complete recalculation of the raw waveforms.
The implemented extractor computes 28 case-local features rather than using a globally precomputed feature table. Harmonic amplitudes at 1×, 2×, and 3× were considered because of their established diagnostic value in electrical machines [25,26], but they were not included in the final feature vector: a defensible case-local rotational fundamental could not be established for every canonical window. This study therefore uses broad spectral energy, centroid, and bandwidth descriptors and explicitly records the harmonic features as unavailable rather than replacing them with arbitrary frequency bins.
Providing a robust, physically grounded explanation for a model’s decision is a prerequisite for trustworthy diagnostic support. For the Healthy class, RMS and standard-deviation features of current and speed are expected to remain comparatively stable. In the presence of mechanical damage, the diagnostic signature is expected to be dominated by kinematic instability, whereas partial rotor demagnetization can alter the required electrical effort. The combined mechanical–electrical condition may introduce simultaneous deviations across both domains and is therefore a useful case for examining evidence conflict.
Table 1 retains the domain interpretation proposed for the principal evidence groups while explicitly separating admissible interpretation from unsupported causal claims.
Table 1.
Implemented diagnostic evidence groups and their governance interpretation.
2.2. Spline-Based Temporal Evidence
Early and reliable fault detection in Brushless DC (BLDC) motors is critical for improving system reliability and reducing unplanned downtime in modern industrial applications. Unexpected failures in electrical machines on production lines lead not only to process halts but also to increased maintenance costs, reduced energy efficiency, and compromised product quality. Standard condition monitoring approaches typically rely on the segmentation of vibration and current signals into short measurement windows, followed by the extraction of discrete time- and frequency-domain features.
However, in real-world operational environments, traditional indicators such as RMS and crest factor can exhibit high variance. They may fluctuate between consecutive measurement windows because of sensor noise, inverter interference, and non-linear load variations. Basing diagnostic decisions solely on a single noisy reading introduces a risk of false alarms or missed early-stage faults. It is therefore useful to supplement isolated-window interpretation with a continuous representation of changes across ordered windows.
This paper integrates spline functions as a mathematical smoothing and data-preparation layer for an advanced diagnostic reasoning module [27,28]. Spline models enable the extraction of derivative indicators from the fitted trend, complementing feature-based motor diagnostics and prognosis-oriented trend representations [29]. The first derivative represents the local rate of change, whereas the second derivative represents the local change in slope.
In the present dataset, these derivatives are defined with respect to normalized window order, not physical degradation time. The wording “rate of degradation”, “damage acceleration”, “failure onset”, and “remaining useful life” is therefore intentionally avoided.
Global polynomial regression is unsuitable for local trend description because high-order fits may introduce unwanted oscillations across the measurement domain [27]. Spline functions provide a flexible alternative through their piecewise-polynomial structure. Smoothing splines balance fit and smoothness; B-splines represent the curve through local basis functions; P-splines add a penalty for excessive coefficient variation; and monotonic splines impose shape constraints that may be useful only when monotonicity is physically justified.
Special emphasis is placed on penalized B-splines because the complexity penalty controls excessive local variation. This can reduce the effect of isolated spikes and requires an explicit choice of the penalty parameter. A reference profile can additionally be constructed from Healthy data, allowing the current fitted sequence to be compared with a documented baseline.
The reference used here is assignment-specific and training-only, rather than a global profile constructed from the entire dataset. The four implemented representations are not ranked as universally optimal; each produces a versioned temporal evidence object with fit diagnostics, derivatives, curvature, reference identity, and input-window hashes.
2.3. Explainability as Diagnostic Evidence
To ensure that a diagnostic workflow remains transparent, raw classification outputs should be paired with interpretable justifications. Global feature-attribution techniques, such as permutation importance, describe the macroscopic behavior of a fitted model by measuring the decrease in predictive performance when a feature is shuffled.
For localized explanations, additive feature contributions can quantify how individual variables shift a model score. Methods such as LIME, SHAP, and partial-dependence profiles are relevant general-purpose tools for this task [15,22,30]; however, explanation methods must be distinguished from physical causal analysis.
Mathematical attributions may also be translated into rule-based statements for human operators. Explanation stability is an additional concern: if similar models or data partitions produce substantially different rankings, the explanation should be treated as assignment- or model-specific rather than universal.
The implemented study uses global permutation importance, an exact local Logistic Regression logit decomposition, and a descriptive cross-assignment stability analysis. It does not report SHAP or partial-dependence experiments. Explainability is consequently treated as another evidence source, never as independent authority to issue an action.
2.4. Requirements for Evidence Governance
The reviewed evidence sources motivate five requirements. First, every evidence item must preserve data, model, configuration, and reference provenance. Second, unavailable evidence must be explicit rather than fabricated. Third, evidence generation must remain separate from action authorization. Fourth, the workflow must support recommendation, escalation, and no-decision as distinct outcomes. Fifth, every execution must be auditable and reproducible. These requirements define the role of DEGA in Section 3 and Section 4.
3. Diagnostic Data and Evidence Representation
3.1. Data Units and Feature Representation
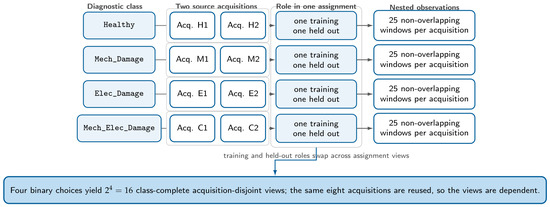
The DUDU-BLDC dataset provides synchronized phase-current and rotational-speed measurements under four conditions: Healthy, Mech_Damage, Elec_Damage, and Mech_Elec_Damage [24]. The case study uses eight raw acquisitions, two per class. Each acquisition is divided into 25 non-overlapping windows of s; at 50 kHz, each window contains 40000 samples. The resulting corpus contains windows. The acquisition, not the window, is the independent source unit. Window-level observations are nested within acquisitions and are reported descriptively. Figure 1 summarizes the data hierarchy and the acquisition-disjoint assignment rule.
Figure 1.
Acquisition-disjoint organization of the DUDU-BLDC case study. Each class contributes two acquisitions, yielding 16 dependent train/held-out assignment views.
A deterministic case-local extractor computes 14 features from each channel: mean, population standard deviation, population variance, RMS, maximum, minimum, absolute peak, peak-to-peak range, population skewness, population excess kurtosis, crest factor, mean-removed Hann-window spectral energy, power-weighted spectral centroid, and power-weighted spectral bandwidth. Thus, each window is represented by
where a identifies the acquisition, and identifies the window. Equation (1) defines the common input space for the classifier, reference, and temporal-evidence modules. Operations that require population fitting—scaling, imputation, model fitting, distribution-deviation fitting, or Healthy-reference construction—are applied only after the acquisition assignment is defined.
3.2. Temporal Spline Evidence
For each acquisition, the 25 feature vectors retain their original order. The independent variable for temporal modeling is the normalized window position
The coordinate in Equation (2) is dimensionless and records order only. Four implementations share a common interface: rolling smoothing spline, rolling B-spline, rolling P-spline, and rolling Healthy-relative spline. For a fitted sequence , the evidence object records the fitted value, first and second derivatives, curvature, fitting error, roughness, effective degrees of freedom, uncertainty surrogate, fit status, configuration hash, and source-window hashes. Curvature is defined as
The maximum of Equation (3) denotes the strongest geometric change in the ordered sequence. It is not interpreted as physical fault onset.
3.3. Training-Only References and Deviation Evidence
Each acquisition assignment contains exactly one Healthy acquisition in the training partition. Its windows define the assignment-specific Healthy reference; the held-out Healthy acquisition is excluded. A separate training-distribution deviation scorer standardizes the 28-dimensional vectors using training-only statistics and fits a Ledoit–Wolf covariance estimator. For a standardized held-out vector , the squared Mahalanobis distance is
where and the precision matrix are derived exclusively from the active training partition. The bounded score derived from Equation (4) is an uncalibrated out-of-distribution (OOD) surrogate that quantifies departure from the active training distribution.
3.4. Immutable Evidence Hierarchy
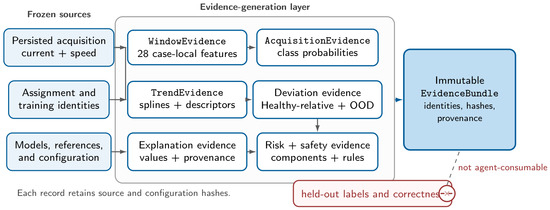
The evidence layer contains five nested record types. Window- and acquisition-level outputs are stored as WindowEvidence and AcquisitionEvidence; temporal, risk, and safety outputs are stored as TrendEvidence, RiskEvidence, and SafetyEvidence. These records are combined into an immutable EvidenceBundle containing the assignment, acquisition, classifier, source-window identities, feature schema, temporal model, Healthy reference, distribution-deviation scorer, explanation artifact, risk components, and scientific hashes. Ground-truth labels and correctness indicators are excluded from agent-consumable evidence. Figure 2 shows the resulting provenance-preserving hierarchy.
Figure 2.
Provenance-preserving evidence hierarchy from persisted measurements to the immutable EvidenceBundle.
3.5. Evidence Roles in Governance
The evidence hierarchy distinguishes the evidence needed to establish a diagnostic context from the evidence that authorizes an automatic recommendation. Data quality, classifier output, the applicable explanation contract, risk/OOD gates, and audit finalization are mandatory at their corresponding governance stages. Spline/trend evidence is corroborative: it can expose agreement or conflict but does not independently authorize action. Table 2 summarizes this hierarchy and its interpretation boundaries.
Table 2.
Evidence roles in the DEGA governance contract.
4. DEGA Architecture and Deterministic Workflow
4.1. Agent Definition
The diagnostic agent operates as a state-transition control mechanism that processes sensor data, evaluates data quality, models ordered diagnostic trends, extracts diagnostic features, and classifies the technical condition of the monitored object. It is formalized as a finite-state machine. This formulation represents a control mechanism for diagnostic workflow transitions. Dynamic modeling of the physical motor and stability analysis remain separate engineering tasks.
Furthermore, the agent does not function as an autonomous control system capable of independently stopping the motor. Instead, it is a condition-driven workflow designed to issue actionable recommendations, escalate uncertain or high-risk cases to a human operator, and maintain a fully auditable decision log. It evaluates measurable indicators at each stage to select the next processing step, following a fixed graph of states governed by data quality, classifier confidence, trend–classifier agreement, explanation availability, and risk thresholds. Every path through the automaton terminates in a mandatory audit state, producing a complete audit trail.
Formally, a DEGA implementation is represented as
where is the semantic state set, is the immutable evidence space, contains deterministic processing functions, is the routing-policy family, is the higher-priority SafetyGuard rule set, and is the audit log. Equation (5) separates the evidence-processing functions from the policy and governance constraints.
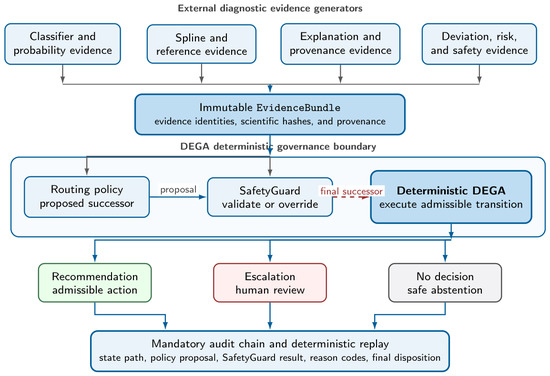
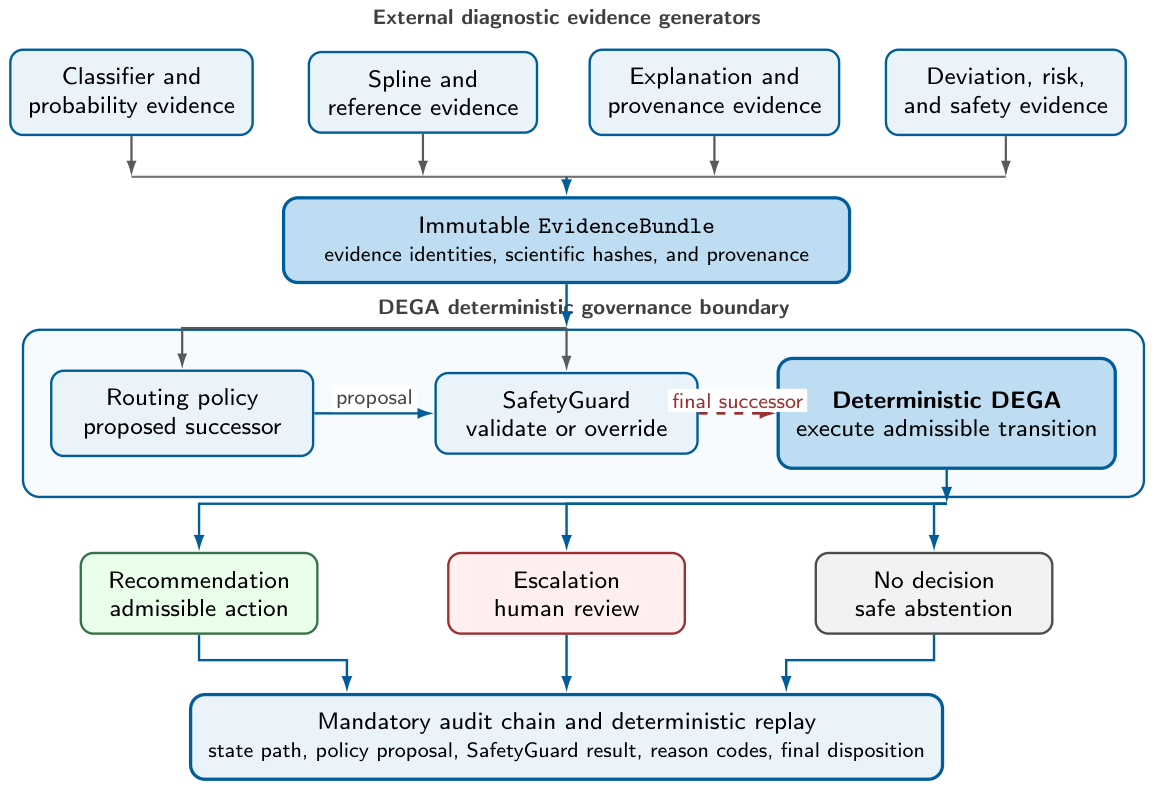
Figure 3 presents this separation as a layered architecture: analytical modules produce evidence, whereas DEGA controls admissibility, routing, terminal disposition, and audit.
Figure 3.
DEGA architecture separating external evidence generation from routing, SafetyGuard authorization, terminal disposition, and mandatory audit/replay.
4.2. Semantic State Model
The canonical state set contains 11 states (Table 3). The explicit state-machine representation follows established finite-state modeling principles, while its semantics are specific to diagnostic evidence governance [31]. The state names are semantic contracts rather than implementation labels.
Table 3.
Canonical DEGA states, admissible successors, policy and SafetyGuard roles, and audit implications.
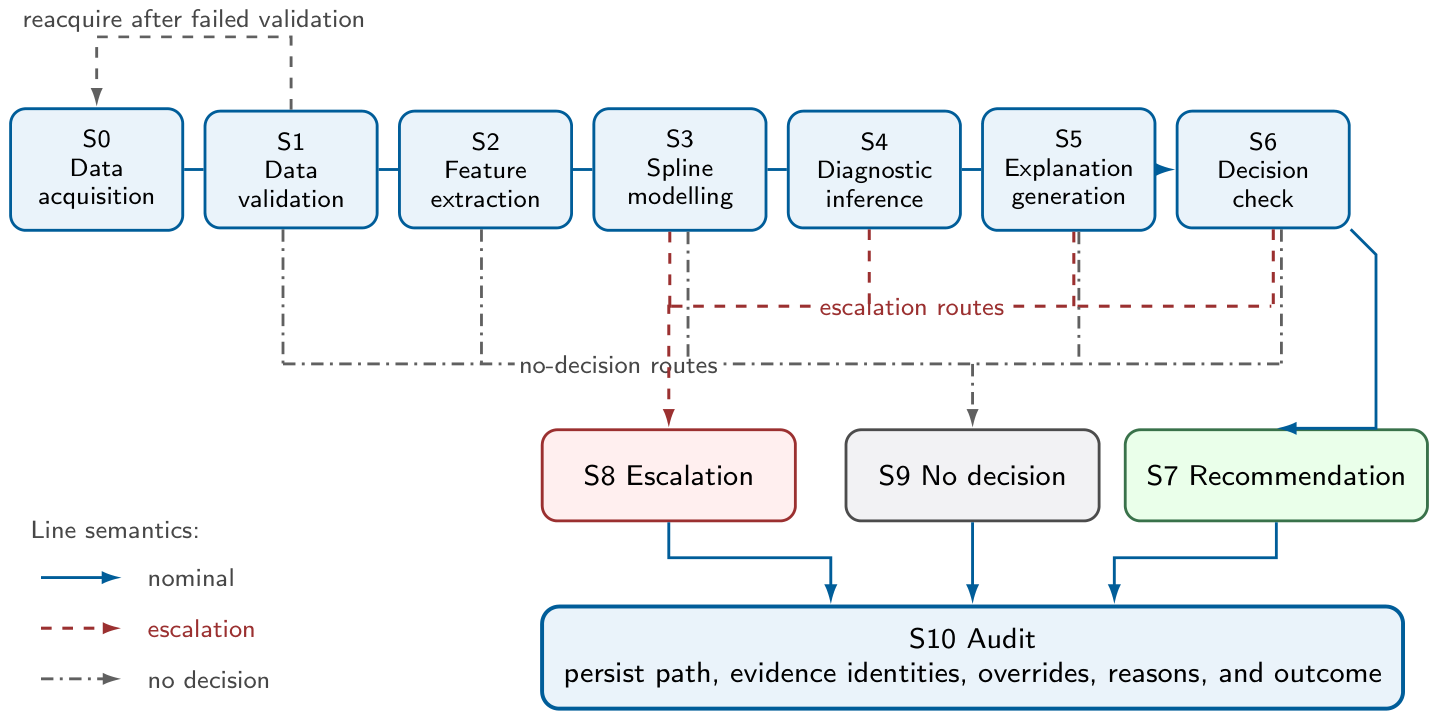
Each state performs a predefined processing step and produces outputs that serve as inputs to subsequent states. Data validation checks the required channels, feature ranges, completeness, and integrity. Trend modeling attaches the fitted spline and its derivative descriptors. Diagnostic inference consumes the classifier evidence, and explanation generation attaches the available feature-attribution evidence. The decision check evaluates confidence, model agreement, and compound risk. It routes the case to recommendation, escalation, or no decision. Every path unconditionally leads to the audit state, which records the structured decision trace and the justification for the final action.
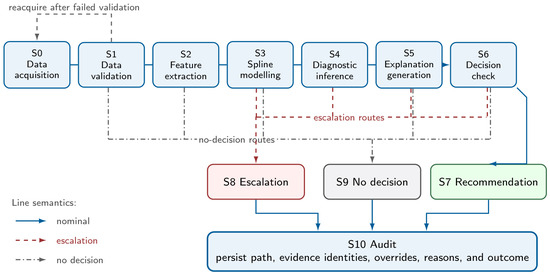
Figure 4 visualizes the nominal path and summarizes the fail-closed logic, while Table 3 provides the authoritative state semantics.
Figure 4.
Canonical 11-state DEGA finite-state machine. Line styles distinguish nominal, escalation, and no-decision transitions; every disposition reaches Audit.
4.3. Routing Policies and SafetyGuard
Four routing policies are evaluated: a static transition-matrix policy, a deterministic posterior approximation, a policy using persisted Bayesian MCMC evidence, and a hybrid policy. For current state and evidence summary , a policy maps the current context to a preference distribution over admissible successor states:
The quantities in Equation (6) are preferences over workflow states, not probabilities of physical motor degradation. All persisted inputs are frozen, and the proposed next state is selected deterministically with fixed tie handling.
Table 4 summarizes the practical distinction among the four evaluated policies, including their inputs, proposal mechanisms, consumed persisted evidence, and common deterministic tie handling.
Table 4.
Practical comparison of the four evaluated routing policies. Terminal counts are descriptive sums over all persisted extended-study profiles for each policy.
Despite different proposal calculations and evidence consumption, the persisted extended study recorded the same terminal totals for every policy: 731 recommendations, 8485 escalations, and 0 no-decision outcomes across 9216 routes per policy. Thus, policy choice did not materially change the observed terminal dispositions in these profiles, where the common SafetyGuard and profile gates dominated final authorization. This terminal agreement does not imply that the policies produced identical preference distributions or transition evidence.
The agent’s workflow is supervised by operational constraints to ensure safe and deterministic behavior. These constraints form a higher-level control layer that operates independently of the routing preference. A transition with high preference may therefore be blocked if it violates safety, data-integrity, or explainability requirements. The constraint layer prevents the agent from making decisions without sufficient evidence, bypassing validation procedures, or producing outputs that lack confidence estimation, traceability, and justification. It also ensures that uncertain or conflicting cases are escalated and that unreliable inputs cannot lead to automated recommendations.
If is the transition selected by the policy, the executed transition is
where G is the external SafetyGuard, and is the structured evidence available at the current state. Equation (7) formalizes policy precedence: the SafetyGuard evaluates the proposal but has authority over the executed transition. These overrides establish configured fail-closed routing in this software study; they do not prove real-world safety-risk reduction.
4.4. Audit and Deterministic Replay
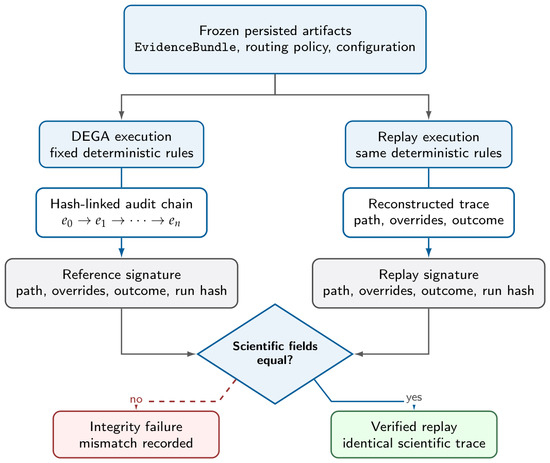
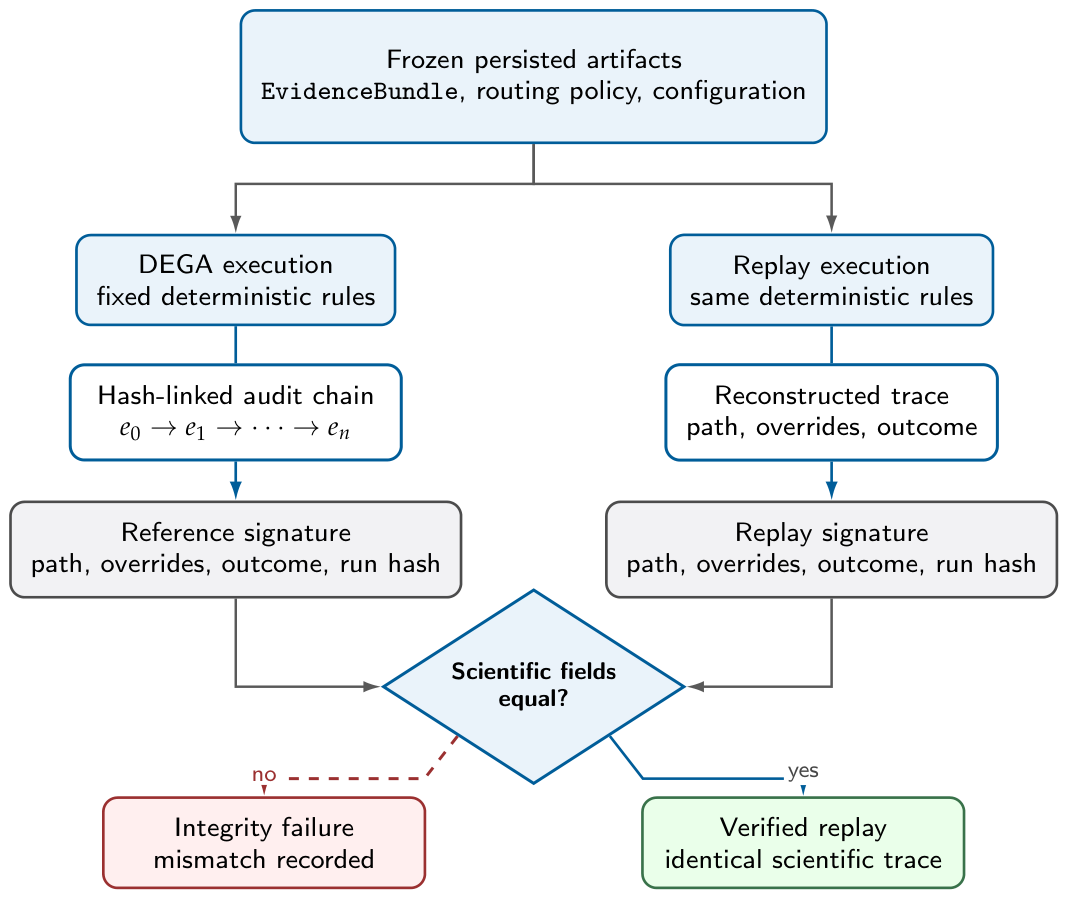
Every execution reaches S10. Audit events include the EvidenceBundle hash, policy and configuration hashes, ordered state path, transition proposals, SafetyGuard evaluations, overrides, reason codes, and terminal disposition. Events are chained through previous-event and current-event hashes. Deterministic replay uses the same stored evidence and policy configuration to reproduce and verify the workflow state sequence, SafetyGuard result, terminal disposition, and execution hash. This implementation operationalizes reproducibility recommendations by persisting the inputs and identities required to repeat the computational decision path [19]. Figure 5 summarizes the audit–replay contract.
Figure 5.
Audit and deterministic replay contract based on frozen artifacts, hash-linked events, and equality of the reproduced scientific trace.
5. Computational Case-Study Protocol
5.1. Acquisition-Disjoint Assignments
Because the dataset contains two source acquisitions per class, one acquisition from each class is assigned to training and the other to held-out evaluation. The complete Cartesian design contains class-complete assignment views. Each view contains four training and four held-out acquisitions, corresponding to 100 windows in each partition, with zero acquisition and window overlap. The views are exhaustive but dependent because they reuse the same eight acquisitions (Figure 1).
5.2. Classifier and Aggregation Protocol
Logistic Regression (LR), Random Forest (RF) [32], and Histogram Gradient Boosting (HGB) are evaluated under frozen hyperparameters. All preprocessing and fitting are restricted to the active training acquisitions. The protocol therefore contains model runs. Each persisted pipeline is reloaded and checked for exact equivalence before generating held-out evidence. The 25 window probability vectors for each held-out acquisition are aggregated by coordinate-wise mean, producing 192 acquisition-level predictions. Model outputs are explicitly labeled as model-native, uncalibrated probabilities.
5.3. Temporal, Reference, Risk, and Explanation Evidence
The four spline representations are fitted to the ordered windows of each held-out acquisition. Each of the 192 acquisition-level predictions was combined with each of the four spline/evidence representations, yielding 192 × 4 = 768 complete EvidenceBundle objects. Healthy references and training-distribution deviation scorers are fitted separately for every assignment using training data only. The risk object stores decomposed contributions for classifier uncertainty, temporal uncertainty, distribution deviation, Healthy-reference deviation, and conflict evidence. Its combined score is an experimental aggregate that supports workflow routing by combining the configured uncertainty, deviation, and conflict components.
Explainability is evaluated through three bounded analyses: global permutation importance for the preregistered A00 RF model; exact local additive contributions for one LR case; and top-10 feature-set stability across the 16 dependent assignment views.
These model-analysis artifacts and the explanation contract used by the governance workflow are distinct. In the retained real-evidence profiles, the agent context records the recommendation-level explanation contract as unavailable. The simulated explanation-contract profiles inject only the predeclared availability flag, admissibility score, method identifier, and provenance note. Feature-attribution values, rankings, diagnostic predictions, risk, OOD, confidence, conflict, audit, and replay evidence are not simulated or recomputed.
5.4. Governance Operating Profiles
The extended evaluation applies four routing policies to the retained evidence under five predeclared profile families: a conservative control, a retained-coverage comparison, a balanced illustrative profile, a safety stress test, and a coverage stress test. Profile parameters vary OOD aggregation and thresholds for OOD, risk, confidence, and explanation admissibility. They are illustrative operating profiles, not optimized or deployment-calibrated operating points. Table 5 lists the five profiles selected for the main comparison.
Table 5.
Illustrative governance operating profiles used in the main comparison.
Figure 6 summarizes the controlled comparison. Each profile–policy combination evaluates the same 768 retained case-level evidence objects. Terminal outcomes, state reachability, triggered rules, recommendation-gate decomposition, audit validity, and replay validity are recorded. The internal governance-consistency proxy checks whether a recommended route contradicts the declared profile gates; it is not a measure of real industrial safety.
Figure 6.
Evaluation protocol separating retained real-evidence profiles from simulations that modify only explanation-contract availability and admissibility metadata.
5.5. Evaluation Boundaries
Primary classifier metrics remain acquisition-level macro-F1 and balanced accuracy; window-level metrics remain descriptive. Governance-profile outcomes are route counts under explicit contracts, not independent statistical replications. This study reports no confidence intervals based on treating windows, assignment views, policies, or profile routes as independent. It does not support claims about run-to-failure degradation, remaining useful life, calibrated failure probability, validated feature attribution, recommendation correctness, open-world OOD detection, production readiness, industrial safety certification, or generalization beyond the eight source acquisitions.
6. Results
6.1. Diagnostic Evidence and Bounded Empirical Setting
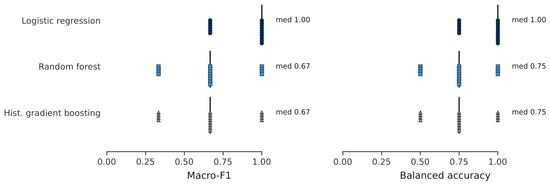
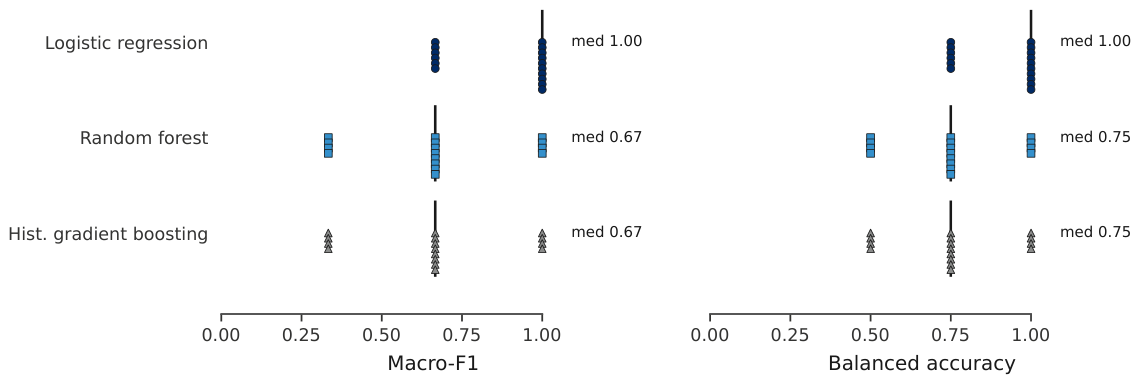
The retained diagnostic evidence establishes the bounded empirical setting on which the governance study operates. All 48 persisted classifier pipelines passed exact reload-equivalence verification. Across 16 dependent acquisition-disjoint views of the same 8 acquisitions, mean acquisition-level macro-F1 was 0.875 for Logistic Regression and 0.667 for Random Forest and Histogram Gradient Boosting. The evidence layer contains 4800 window records, 192 acquisition records, 768 risk records, 768 safety projections, and 768 complete EvidenceBundle objects. These descriptive results define the frozen diagnostic inputs consumed by DEGA.
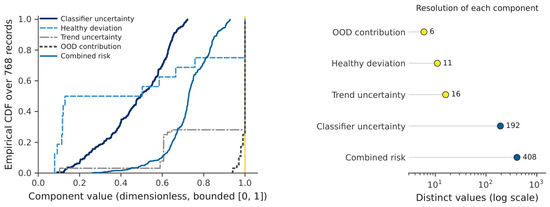
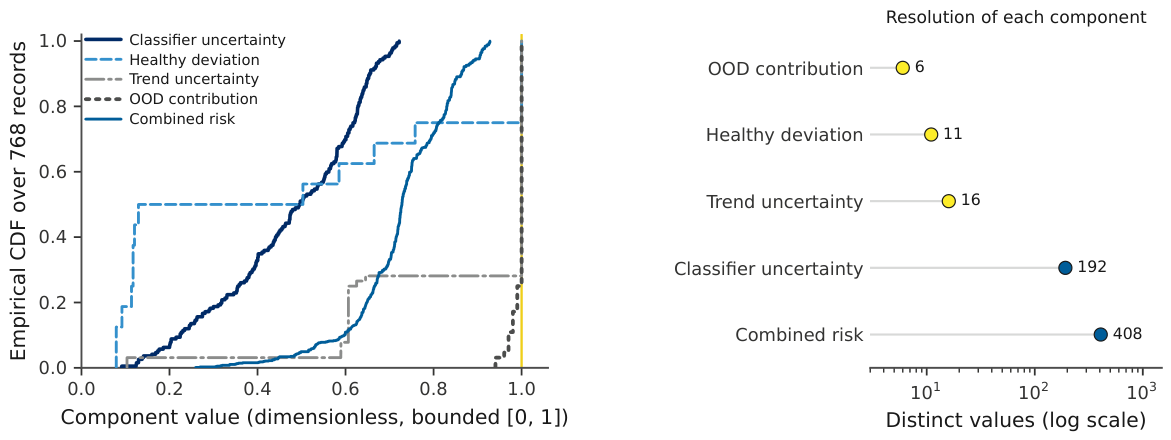
Two retained evidence-basis figures are kept in the main text to make the empirical substrate visible before the governance-profile results are interpreted. Figure 7 summarizes the acquisition-level classifier evidence used by the governance layer. Figure 8 summarizes the persisted risk components and shows why OOD and risk gates strongly influence downstream routing.
Figure 7.
Acquisition-level classifier evidence across the 16 dependent acquisition-disjoint assignment views.
Figure 8.
Persisted SafetyGuard risk components: empirical distributions and numbers of distinct component values across 768 records.
The retained spline descriptors refer to ordered window position rather than physical degradation time. Model probabilities are model-native and uncalibrated, and the OOD and combined-risk quantities are configured surrogates. Earlier model-analysis explanation artifacts remain bounded analyses of model reliance. They do not satisfy the recommendation-level explanation contract evaluated in the extended governance study.
6.2. Governance Operating Profiles
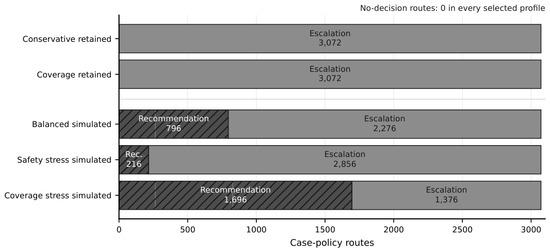
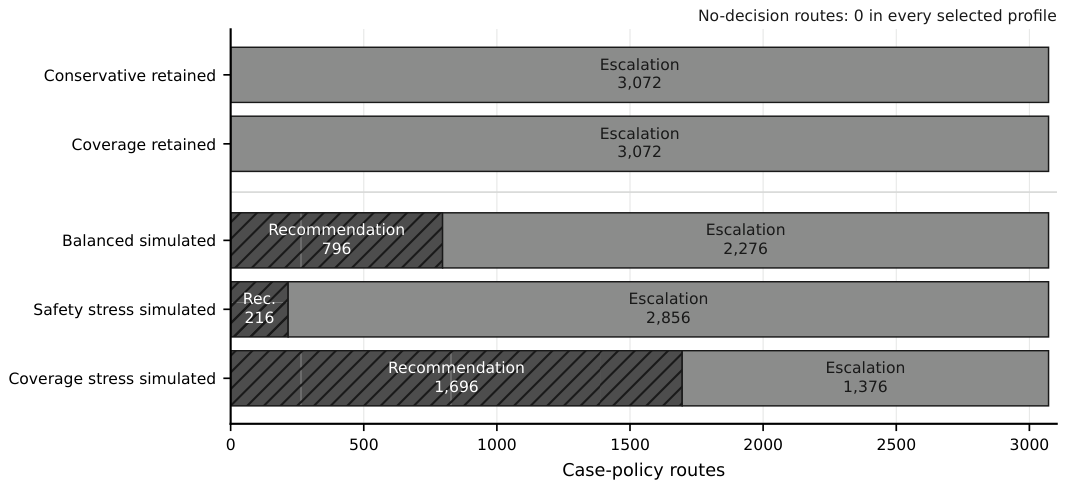
The extended study evaluates operating-profile sensitivity rather than selecting an optimal threshold set. The conservative retained control blocks all routes before Decision Check, whereas the retained-coverage profile relaxes OOD admissibility sufficiently for 2304 of 3072 case-policy routes to reach Decision Check. The balanced, safety-stress, and coverage-stress simulated profiles use predeclared contract-satisfied explanation metadata and progressively different non-explanation gates. Table 5 reports the profile definitions; Figure 9 and Table 6 report their outcomes.
Figure 9.
Terminal outcomes for five illustrative operating profiles, summed over the four routing policies.
Table 6.
Terminal outcomes for five illustrative profiles, summed over four routing policies.
6.3. Retained Real-Evidence Profile Behavior
The predicates, thresholds, forced transitions, decision dispositions, audit identities, and deterministic precedence of the SafetyGuard rules referenced below are listed in Table A1.
Across all retained real-evidence profiles, 15,360 case-policy routes produced 0 automatic recommendations and 15,360 escalations. Decision Check was reached 9216 times, demonstrating that later governance states are reachable when OOD admissibility is relaxed. Nevertheless, the mandatory-explanation rule R11 triggered 7904 times, and no retained route reached Recommendation. The zero-recommendation result is therefore informative: it identifies explanation availability as a binding governance condition rather than converting an unavailable mandatory evidence item into an action.
The conservative retained control produced 3072 escalations and no Decision Check arrivals, dominated by R10 OOD and R5 conflict triggers. The retained-coverage profile also produced 3072 escalations, but 2304 routes reached Decision Check; R11, R9 high risk, R15 low confidence, R5 conflict, and R19 combined-fault review remained active. Relaxing one admissibility condition can therefore increase state coverage without authorizing a recommendation when another mandatory contract remains unsatisfied.
Taken together, these results show that classifier-derived confidence and late-state reachability alone do not determine automation coverage. Once OOD admissibility is relaxed, the explanation contract becomes the most persistent late-stage constraint in the retained profiles, while risk, confidence, conflict, and combined-fault predicates continue to provide additional blocks. The experiment therefore exposes supporting-evidence admissibility, rather than classifier performance alone, as a determinant of recommendation reachability in the evaluated governance setting.
6.4. Simulated Explanation-Contract Profile Behaviour
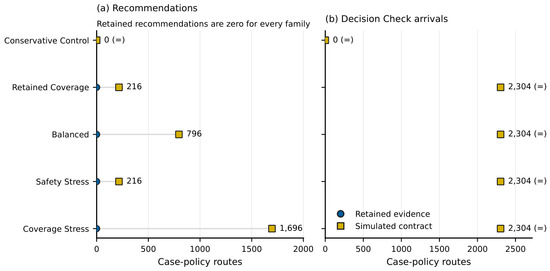
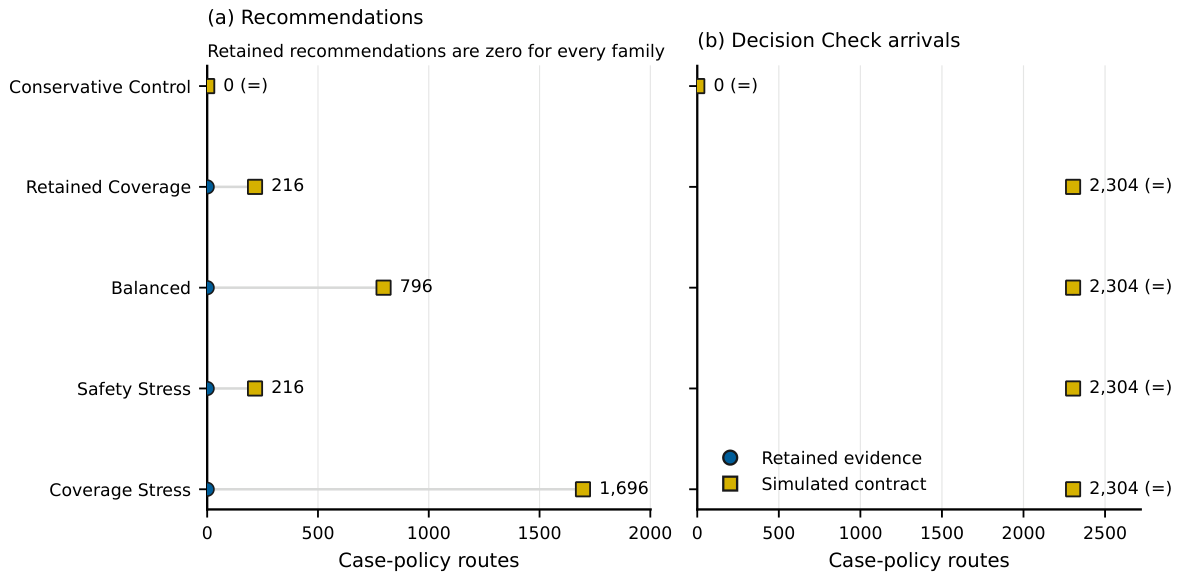
Under the predeclared contract-satisfied simulated profiles, 2924 recommendations and 12,436 escalations were produced. The simulation changes only explanation availability/admissibility metadata and removes R11 as a blocker in those matched profiles. Figure 10 and Table 7 report the matched retained-versus-simulated comparison. It does not simulate feature-attribution values or rankings, and it does not evaluate SHAP, LIME, explanation correctness, or recommendation correctness.
Figure 10.
Matched effect of satisfying the explanation contract on Recommendation and Decision Check reachability.
Table 7.
Matched retained-versus-simulated explanation-contract comparison by profile family.
The balanced simulated profile produced 796 recommendations and 2276 escalations, with 2304 Decision Check arrivals and 0 internal governance-consistency proxy flags. The safety-stress profile produced 216 recommendations and 2856 escalations, while the coverage-stress profile produced 1696 recommendations and 1376 escalations; both also recorded 0 proxy flags. These differences quantify recommendation-path sensitivity across the predeclared profiles.
6.5. SafetyGuard Gate, Rule, and State Coverage
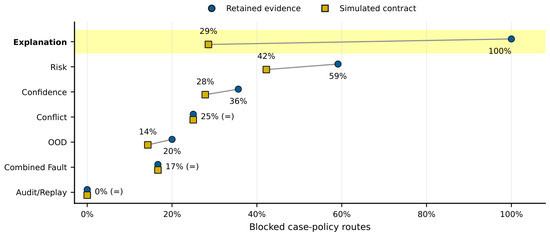
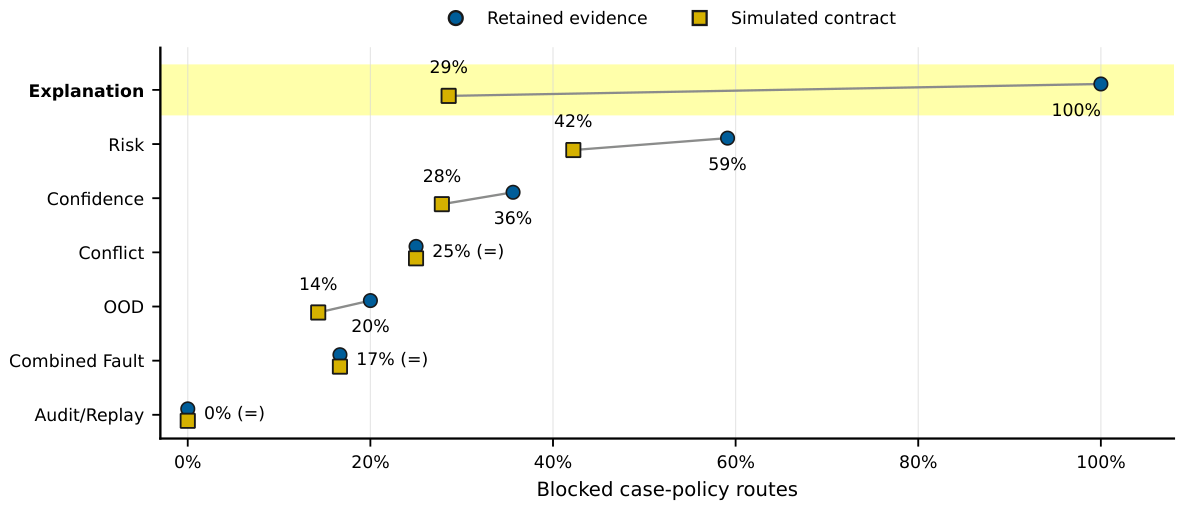
Satisfying the simulated explanation contract does not bypass the SafetyGuard. Figure 11 shows that risk, confidence, conflict, OOD, and combined-fault gates continue to block routes under simulated profiles. Because more simulated modes were evaluated, gate fractions use their own committed denominators and are not additive: several predicates may apply to one route. No audit/replay gate block was recorded in either evidence mode.
Figure 11.
Recommendation-gate prevalence for retained real evidence and simulated explanation-contract modes.
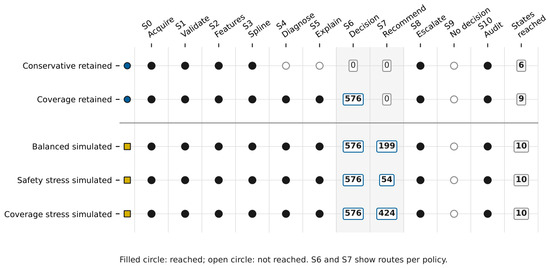
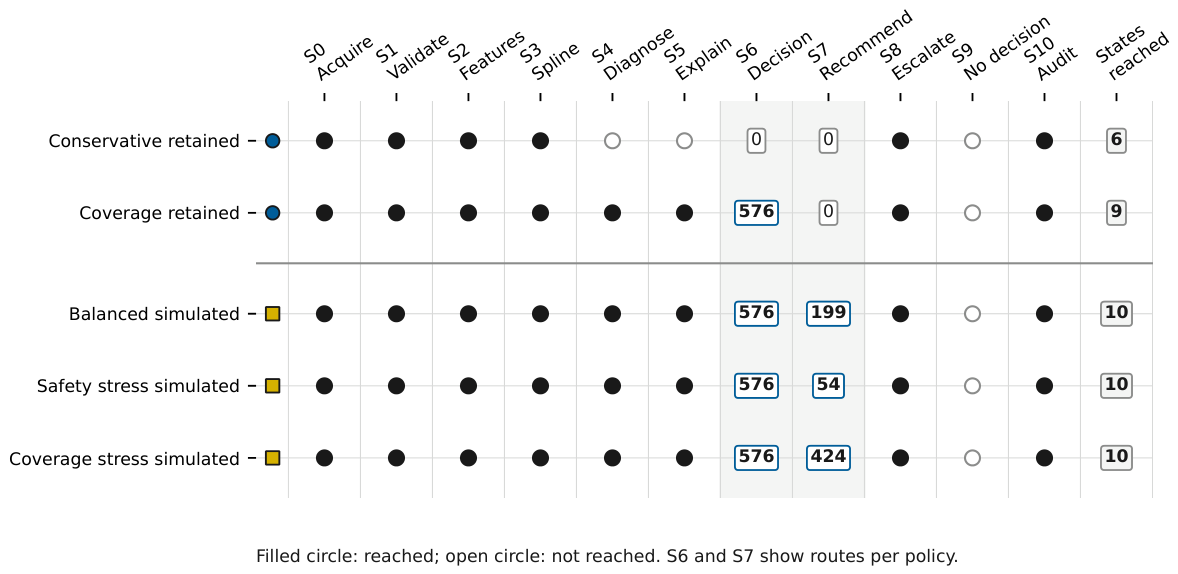
State coverage follows the same controlled progression (Figure 12). The conservative retained profile reaches six states and stops before Diagnostic Inference. The retained-coverage profile reaches nine states, including Decision Check but not Recommendation. Contract-satisfied simulated profiles reach 10 states, including Recommendation, while continuing to exercise Escalation and the mandatory Audit state. Per policy, the balanced, safety-stress, and coverage-stress profiles reach Recommendation for 199, 54, and 424 cases, respectively.
Figure 12.
FSM state coverage under the five illustrative operating profiles; S6 and S7 boxes report routes per routing policy.
6.6. Audit, Replay, and Reproducibility
All evaluated profile routes retained valid audit and replay evidence, and zero recommended routes violated the internal governance-consistency proxy. This verifies execution of the declared software-governance contract: explanation, OOD, risk, confidence, conflict, disagreement, combined-fault, audit, and replay predicates are checked before a recommendation is admitted. The claim is limited to contract execution and artifact provenance. Figure and table values in this section are generated directly from the committed revision CSV files, with source hashes recorded in the associated metadata.
7. Discussion
7.1. Governance Contribution
The extended results reinforce that DEGA’s contribution is evidence governance rather than a new diagnostic classifier. Classifiers, spline models, deviation scorers, and explanation methods produce evidence under different assumptions; none of them independently defines whether an automatic recommendation is admissible. DEGA exposes that authorization boundary through semantic FSM states, replaceable transition policies, a higher-priority SafetyGuard, machine-readable reason codes, and mandatory audit/replay. This complements work on predictive maintenance, selective classification, uncertainty, explainability, and human-in-the-loop systems [11,13,14,15,16].
Table 8 provides an architectural reference point against simpler governance patterns. A confidence-threshold rejection rule can be represented within DEGA as one admissibility predicate, while a conventional human-in-the-loop hand-off corresponds to one possible escalation mechanism. Rule-based diagnostic workflows likewise share DEGA’s use of explicit predicates. DEGA extends these patterns by placing heterogeneous evidence, provenance, routing proposals, an independently authoritative SafetyGuard, distinct escalation and no-decision outcomes, and deterministic replay within one explicit authorization contract. The comparison is therefore architectural rather than performance-based: quantitative superiority would require matched industrial workflows, calibrated costs, and deployment outcomes beyond the present case study.
Table 8.
Conceptual comparison of DEGA with simpler diagnostic-governance patterns.
7.2. Why Zero Retained Recommendations Are Informative
Zero recommendations under retained real-evidence profiles identify a precise governance boundary. OOD-relaxed profiles allow 9216 routes to reach Decision Check, yet automatic action remains blocked because the recommendation-level explanation contract is unavailable or another SafetyGuard predicate applies. The workflow therefore does not treat classifier confidence, late-state reachability, or a permissive routing preference as a substitute for mandatory evidence. Escalation remains an explicit, auditable outcome rather than an implementation failure.
The explanation contract is mandatory because an automatic recommendation should declare not only that a model produced a diagnosis but also that the explanation evidence required by the active governance profile is present, admissible, and traceable. The simulation isolates this contractual role; attribution quality remains outside the contract-level experiment and is addressed in Section 7.4.
A broader implication is that the active bottleneck in governed diagnostics can move away from predictive performance toward the completeness and admissibility of supporting evidence. In the retained profiles, classifier evidence and late-state reachability were already available for many routes, while the explanation contract remained binding. As diagnostic models improve, automation coverage may therefore depend increasingly on whether auxiliary evidence satisfies explicit governance contracts. In this study the observation concerns explanation availability and admissibility; explanation quality itself was not measured, so the result should not be generalized into a claim that explanation quality is universally the dominant bottleneck.
7.3. Operating-Profile and State-Coverage Interpretation
The simulated explanation-contract profiles show that Recommendation is reachable under explicit contract assumptions while the SafetyGuard remains active. Recommendation counts vary from 216 in the safety-stress profile to 1696 in the coverage-stress profile, and risk, confidence, conflict, OOD, and combined-fault gates continue to divert cases. This is the intended separation of concerns: modifying one evidence contract changes the routes for which that contract was binding, without suppressing independent governance constraints.
Explicit operating profiles are necessary because state coverage and terminal outcomes depend on declared OOD aggregation, risk, confidence, and explanation thresholds. A single profile cannot establish universal agent behavior. The profiles used here are illustrative controls and stress tests, not optimized operating points. Practical industrial use would require a documented process for choosing these parameters from independent operational evidence, costs, and acceptable human-review workload while preserving SafetyGuard precedence and auditability.
The same versioned-policy mechanism also provides an interface between organizational expertise and software governance. Expert and tacit knowledge can inform evidence-admissibility rules, thresholds, escalation criteria, and SafetyGuard predicates; audited escalations and operational experience can then motivate deliberate expert review of a subsequent policy version. Before activation, a candidate version can be evaluated by deterministic replay against historical EvidenceBundle objects and its consequences compared with the currently approved policy. DEGA therefore supports organizational learning through controlled, inspectable policy evolution while retaining fixed execution rules within each deployed version. This lifecycle is consistent with the broader view that AI-generated and human tacit knowledge can co-evolve within organizational decision processes [33].
7.4. Limitations and Future Work
The empirical base remains small: eight source acquisitions produce dependent assignment views and repeated case-policy routes, not independent deployments. This study does not establish generalization across motors, loads, sensors, laboratories, fault severities, or operator settings. Ordered windows are not run-to-failure trajectories. Model-native probabilities remain uncalibrated, and OOD and risk thresholds are illustrative governance parameters. Hardware integration, timing guarantees, cybersecurity, operator-interface evaluation, functional-safety compliance, and external deployment validation remain outside scope.
The simulated profiles inject contract-level explanation availability, score, method identity, and provenance metadata only. They do not generate feature contributions, validate feature rankings, assess explanation fidelity, or demonstrate that a recommendation is correct. Full domain-specific ExplanationEvidence implementation is future work, including attribution generation, fidelity and stability evaluation, domain review, explicit failure handling, and integration with the immutable evidence contract. Further work also requires calibrated OOD and threshold selection, broader independent acquisitions, larger longitudinal and multi-asset datasets, formal verification of state and SafetyGuard invariants, and external deployment validation.
Deployment readiness should therefore be established through a staged validation program. A first stage should reproduce the governance behavior on independent assets, multiple diagnostic domains, and broader operating regimes using domain-specific evidence contracts. A second stage should evaluate DEGA prospectively in a real industrial workflow, initially in shadow mode, so that recommendation coverage, expert-review workload, response time, disagreement patterns, and policy consequences can be measured without delegating maintenance authority to the software. A subsequent longitudinal deployment should examine drift, repeated policy revisions, operator interaction, and the stability of governance outcomes over time. In parallel, timing guarantees, system integration, cybersecurity, formal state and SafetyGuard invariants, and the applicable functional-safety or assurance requirements would need domain-specific validation. Evidence across these stages would provide the basis for an operational-readiness claim.
Auditability must likewise be interpreted narrowly. Hash-linked traces and deterministic replay establish that the declared computation and governance path can be inspected and reproduced; they do not prove physical correctness or industrial safety. Their value is to make evidence identities, contract assumptions, policy proposals, overrides, and terminal outcomes explicit enough for independent review.
8. Conclusions
DEGA provides deterministic diagnostic evidence governance through explicit FSM states, replaceable routing policies, an authoritative SafetyGuard, and mandatory hash-linked audit with replay. The revised evaluation shows that operating profiles materially affect state coverage and terminal outcomes while preserving the separation between evidence generation and action authorization.
Retained real-evidence profiles reached later governance states but produced no automatic recommendations because the recommendation-level explanation contract remained binding. Predeclared contract-satisfied simulated profiles made Recommendation reachable while independent risk, confidence, conflict, OOD, combined-fault, audit, and replay gates remained active.
Accordingly, this study supports DEGA as an auditable governance architecture in this bounded case study; deployment claims require domain-specific ExplanationEvidence, calibrated thresholds, broader independent data, and external evaluation.
Author Contributions
Conceptualization, W.B. (DEGA implementation concept and computational study design) and J.B. (diagnostic-evidence governance concept and overall research framing); methodology, W.B. (computational pipeline, evidence contracts, and audit and replay protocol), J.B. (governance architecture and methodological boundaries) and K.J. (spline-based evidence representation); software, W.B. (ArticleV1 pipeline and DEGA implementation); validation, W.B. (software, evidence, and audit and replay validation), K.J. (spline-method and descriptor validation), A.P. (domain interpretation of current- and speed-based diagnostic features), M.Z. (finite-state workflow, abstention, and escalation logic) and J.B. (overall methodological validation); formal analysis, W.B. and J.B.; investigation, W.B., K.J., A.P. and M.Z.; resources, K.J. (DUDU-BLDC data resources) and J.B.; data curation, W.B. and K.J.; writing—original draft preparation, W.B. (implementation, protocol, and results), K.J. (spline-based diagnostic evidence and trend representation), A.P. (BLDC diagnostic-signal interpretation and explainability background), M.Z. (deterministic workflow, finite-state logic, abstention, escalation, and audit mechanisms) and J.B. (conceptual framing, literature synthesis, discussion, and manuscript integration); writing—review and editing, W.B. and J.B.; visualization, W.B. and J.B.; supervision, J.B.; project administration, J.B. All authors have read and agreed to the published version of this manuscript.
Funding
This research received no external funding.
Institutional Review Board Statement
Not applicable.
Informed Consent Statement
Not applicable.
Data Availability Statement
The DUDU-BLDC dataset is publicly available at Zenodo (https://doi.org/10.5281/zenodo.15522163). Reproducibility of this study is supported by software provided in a public repository (https://doi.org/10.5281/zenodo.21374984).
Acknowledgments
The authors acknowledge the contributors who supported the preparation and curation of the DUDU-BLDC dataset. The authors also thank all reviewers for their valuable and constructive comments, which helped improve this manuscript. During preparation of this manuscript, the authors used ChatGPT 5.6 Sol (OpenAI) for language editing, structural drafting, and assistance with LaTeX and figure-integration workflows. All generated material was reviewed, verified, and edited by the authors, who take full responsibility for the content of this publication.
Conflicts of Interest
The authors declare no conflicts of interest.
Abbreviations
The following abbreviations are used in this manuscript:
| BLDC | Brushless direct-current motor |
| DEGA | Diagnostic Evidence Governance Agent |
| FSM | Finite-state machine |
| HGB | Histogram Gradient Boosting |
| IIoT | Industrial Internet of Things |
| LR | Logistic Regression |
| ML | Machine learning |
| OOD | Out-of-distribution |
| P-spline | Penalized B-spline |
| RF | Random Forest |
| RMS | Root mean square |
| XAI | Explainable artificial intelligence |
Appendix A. SafetyGuard Rule Catalog
Table A1 makes explicit the six SafetyGuard rules referenced in the Results. SafetyGuard evaluates the rule set for every proposed transition; the “States” column reports the states in which the listed predicate can be satisfied under the canonical transition topology. All thresholds shown are predeclared experimental governance defaults rather than validated operating limits.
Table A1.
SafetyGuard rules referenced in the Results, generated from the authoritative implementation and frozen governance configuration.
Rule precedence is deterministic and two-level. Action types are ordered as ALLOW < BLOCK < FORCE_ESCALATION < FORCE_NO_DECISION < FAIL_CLOSED; ties within one action type are resolved by rule priority. Because all six listed rules return FORCE_ESCALATION, their dominance order is R19 > R15 > R11 > R10 > R9 > R5. The audit stores the triggered rule_id separately from the common reason_code = FORCE_ESCALATION, so the specific trigger remains reconstructible without changing the frozen audit contract.
References
- Xu, L.D.; He, W.; Li, S. Internet of Things in Industries: A Survey. IEEE Trans. Ind. Inform. 2014, 10, 2233–2243. [Google Scholar] [CrossRef] [Scilit]
- Boyes, H.; Hallaq, B.; Cunningham, J.; Watson, T. The Industrial Internet of Things (IIoT): An Analysis Framework. Comput. Ind. 2018, 101, 1–12. [Google Scholar] [CrossRef] [Scilit]
- Sisinni, E.; Saifullah, A.; Han, S.; Jennehag, U.; Gidlund, M. Industrial Internet of Things: Challenges, Opportunities, and Directions. IEEE Trans. Ind. Inform. 2018, 14, 4724–4734. [Google Scholar] [CrossRef] [Scilit]
- Jardine, A.K.S.; Lin, D.; Banjevic, D. A Review on Machinery Diagnostics and Prognostics Implementing Condition-Based Maintenance. Mech. Syst. Signal Process. 2006, 20, 1483–1510. [Google Scholar] [CrossRef] [Scilit]
- Muller, A.; Marquez, A.C.; Iung, B. On the Concept of E-Maintenance: Review and Current Research. Reliab. Eng. Syst. Saf. 2008, 93, 1165–1187. [Google Scholar] [CrossRef] [Scilit][Green Version]
- Nandi, S.; Toliyat, H.A.; Li, X. Condition Monitoring and Fault Diagnosis of Electrical Motors—A Review. IEEE Trans. Energy Convers. 2005, 20, 719–729. [Google Scholar] [CrossRef] [Scilit]
- Henao, H.; Capolino, G.A.; Fernandez-Cabanas, M.; Filippetti, F.; Bruzzese, C.; Strangas, E.; Pusca, R.; Estima, J.; Riera-Guasp, M.; Hedayati-Kia, S.H. Trends in Fault Diagnosis for Electrical Machines: A Review of Diagnostic Techniques. IEEE Ind. Electron. Mag. 2014, 8, 31–42. [Google Scholar] [CrossRef] [Scilit]
- Liu, R.; Yang, B.; Zio, E.; Chen, X. Artificial Intelligence for Fault Diagnosis of Rotating Machinery: A Review. Mech. Syst. Signal Process. 2018, 108, 33–47. [Google Scholar] [CrossRef] [Scilit]
- Lei, Y.; Yang, B.; Jiang, X.; Jia, F.; Li, N.; Nandi, A.K. Applications of Machine Learning to Machine Fault Diagnosis: A Review and Roadmap. Mech. Syst. Signal Process. 2020, 138, 106587. [Google Scholar] [CrossRef] [Scilit]
- Susto, G.A.; Schirru, A.; Pampuri, S.; McLoone, S.; Beghi, A. Machine Learning for Predictive Maintenance: A Multiple Classifier Approach. IEEE Trans. Ind. Inform. 2015, 11, 812–820. [Google Scholar] [CrossRef] [Scilit]
- Carvalho, T.P.; Soares, F.A.A.M.N.; Vita, R.; Francisco, R.d.P.; Basto, J.P.; Alcala, S.G.S. A Systematic Literature Review of Machine Learning Methods Applied to Predictive Maintenance. Comput. Ind. Eng. 2019, 137, 106024. [Google Scholar] [CrossRef] [Scilit]
- Serradilla, O.; Zugasti, E.; Zurutuza, U. Deep Learning Models for Predictive Maintenance: A Survey, Comparison, Challenges and Prospects. Comput. Ind. 2020, 123, 103257. [Google Scholar] [CrossRef] [Scilit]
- Hendrickx, K.; Perini, L.; Van der Plas, D.; Meert, W.; Davis, J. Machine Learning with a Reject Option: A Survey. Inf. Fusion 2021, 69, 69–82. [Google Scholar] [CrossRef] [Scilit] [PubMed]
- Abdar, M.; Pourpanah, F.; Hussain, S.; Rezazadegan, D.; Liu, L.; Ghavamzadeh, M.; Fieguth, P.; Cao, X.; Khosravi, A.; Acharya, U.R.; et al. A Review of Uncertainty Quantification in Deep Learning: Techniques, Applications and Challenges. Inf. Fusion 2021, 76, 243–297. [Google Scholar] [CrossRef] [Scilit]
- Barredo Arrieta, A.; Diaz-Rodriguez, N.; Del Ser, J.; Bennetot, A.; Tabik, S.; Barbado, A.; Garcia, S.; Gil-Lopez, S.; Molina, D.; Benjamins, R.; et al. Explainable Artificial Intelligence (XAI): Concepts, Taxonomies, Opportunities and Challenges toward Responsible AI. Inf. Fusion 2020, 58, 82–115. [Google Scholar] [CrossRef] [Scilit]
- Mosqueira-Rey, E.; Hernandez-Pereira, E.; Alonso-Rios, D.; Bobes-Bascaran, J.; Fernandez-Leal, A. Human-in-the-Loop Machine Learning: A State of the Art. Artif. Intell. Rev. 2023, 56, 3005–3054. [Google Scholar] [CrossRef] [Scilit]
- Simmhan, Y.L.; Plale, B.; Gannon, D. A Survey of Data Provenance in E-Science. SIGMOD Rec. 2005, 34, 31–36. [Google Scholar] [CrossRef] [Scilit]
- Ashmore, R.; Calinescu, R.; Paterson, C. Assuring the Machine Learning Lifecycle: Desiderata, Methods, and Challenges. ACM Comput. Surv. 2021, 54, 1–39. [Google Scholar] [CrossRef] [Scilit]
- Sandve, G.K.; Nekrutenko, A.; Taylor, J.; Hovig, E. Ten Simple Rules for Reproducible Computational Research. PLoS Comput. Biol. 2013, 9, e1003285. [Google Scholar] [CrossRef] [Scilit] [PubMed]
- Altmann, A.; Tolosi, L.; Sander, O.; Lengauer, T. Permutation Importance: A Corrected Feature Importance Measure. Bioinformatics 2010, 26, 1340–1347. [Google Scholar] [CrossRef] [Scilit] [PubMed]
- Fisher, A.; Rudin, C.; Dominici, F. All Models Are Wrong, but Many Are Useful: Learning a Variable’s Importance by Studying an Entire Class of Prediction Models Simultaneously. J. Am. Stat. Assoc. 2019, 114, 1321–1338. [Google Scholar]
- Lundberg, S.M.; Erion, G.; Chen, H.; DeGrave, A.; Prutkin, J.M.; Nair, B.; Katz, R.; Himmelfarb, J.; Bansal, N.; Lee, S.I. From Local Explanations to Global Understanding with Explainable AI for Trees. Nat. Mach. Intell. 2020, 2, 56–67. [Google Scholar] [CrossRef] [Scilit] [PubMed]
- Jobin, A.; Ienca, M.; Vayena, E. The Global Landscape of AI Ethics Guidelines. Nat. Mach. Intell. 2019, 1, 389–399. [Google Scholar] [CrossRef] [Scilit]
- Baranowski, J.; Bauer, W.; Jarzyna, K.; Paweł, P. DUDU-BLDC: Data Set for Diagnostic of Brushless DC Motors with Degrading Magnets; Zenodo: Geneva, Switzerland, 2025. [Google Scholar] [CrossRef]
- Thomson, W.T.; Fenger, M. Current Signature Analysis to Detect Induction Motor Faults. IEEE Ind. Appl. Mag. 2001, 7, 26–34. [Google Scholar] [CrossRef] [Scilit]
- Riba Ruiz, J.R.; Rosero, J.A.; Garcia Espinosa, A.; Romeral, L. Detection of Demagnetization Faults in Permanent-Magnet Synchronous Motors under Nonstationary Conditions. IEEE Trans. Magn. 2009, 45, 2961–2969. [Google Scholar] [CrossRef] [Scilit]
- Eilers, P.H.C.; Marx, B.D. Flexible Smoothing with B-Splines and Penalties. Stat. Sci. 1996, 11, 89–121. [Google Scholar] [CrossRef] [Scilit]
- Bartoszewski, B.; Jarzyna, K.; Baranowski, J. Diagnosis of Mechanical Rotor Faults in Drones Using Functional Gaussian Mixture Classifier. Aerospace 2024, 11, 743. [Google Scholar] [CrossRef] [Scilit]
- Shifat, T.A.; Yasmin, R.; Hur, J.W. A Data-Driven RUL Estimation Framework of Electric Motor Using Deep Electrical Feature Learning from Current Harmonics and Apparent Power. Energies 2021, 14, 3156. [Google Scholar] [CrossRef] [Scilit]
- Ribeiro, M.T.; Singh, S.; Guestrin, C. Why Should I Trust You? Explaining the Predictions of Any Classifier. In Proceedings of the 22nd ACM SIGKDD International Conference on Knowledge Discovery and Data Mining, San Francisco, CA, USA, 13–17 August 2016; pp. 1135–1144. [Google Scholar] [CrossRef] [Scilit]
- Lee, D.; Yannakakis, M. Principles and Methods of Testing Finite State Machines—A Survey. Proc. IEEE 1996, 84, 1090–1123. [Google Scholar] [CrossRef] [Scilit]
- Breiman, L. Random Forests. Mach. Learn. 2001, 45, 5–32. [Google Scholar] [CrossRef] [Scilit]
- Khalili, N.; Jahanbakht, M. Unveiling the Unspoken: A Conceptual Framework for AI-Enabled Tacit Knowledge Co-Evolution. Knowledge 2026, 6, 1. [Google Scholar] [CrossRef] [Scilit]

Disclaimer/Publisher’s Note: The statements, opinions and data contained in all publications are solely those of the individual author(s) and contributor(s) and not of MDPI and/or the editor(s). MDPI and/or the editor(s) disclaim responsibility for any injury to people or property resulting from any ideas, methods, instructions or products referred to in the content. |
© 2026 by the authors. Licensee MDPI, Basel, Switzerland. This article is an open access article distributed under the terms and conditions of the Creative Commons Attribution (CC BY) license.