


Abstract
Accurate survival prediction in Liver Hepatocellular Carcinoma (LIHC) remains challenging because outcomes are shaped by clinical, molecular, and morphological heterogeneity. Although multimodal learning may improve prognosis, the contribution of each modality across clinically relevant survival horizons remains unclear, and many existing approaches provide limited interpretability. We present an interpretable multimodal framework for LIHC survival prediction using clinical variables, transcriptomic profiles, and histopathology whole-slide images from the TCGA-LIHC cohort. Survival prediction was formulated as horizon-specific classification at 1-, 3-, and 5-year endpoints. Histopathology patches were converted into morphology-focused textual descriptions using a vision–language captioning framework, aggregated into patient-level summaries, and embedded as predictive features. Caption quality was evaluated using automated semantic metrics and expert pathological review. Multimodal fusion was performed using a leakage-aware out-of-fold stacking strategy. The best fusion configurations achieved ROC-AUC values of 0.70, 0.74, and 0.66 for 1-, 3-, and 5-year prediction, respectively. Genomic features provided the strongest standalone signal at 1 and 3 years, while histopathology-derived captions contributed most clearly when combined with genomics at 3 years. These findings show that multimodal benefit is horizon-dependent and depends on modality complementarity rather than simply adding more data sources.
1. Introduction
Cancer remains one of the leading causes of mortality worldwide and is characterized by the uncontrolled proliferation of abnormal cells capable of invading surrounding tissues and metastasizing to distant organs [1]. According to the World Health Organization, cancer accounted for approximately 10 million deaths globally in 2022 [2]. Among solid malignancies, Liver Hepatocellular Carcinoma (LIHC) is the most common form of primary liver cancer and is associated with substantial morbidity and mortality [3]. Accurate survival prediction in LIHC remains clinically important but difficult because patient outcomes are shaped by heterogeneous interactions among tumor biology, disease stage, molecular alterations, tissue morphology, treatment response, and patient-level clinical factors. Reliable prognostic models can support risk stratification, treatment planning, patient monitoring, and personalized clinical decision-making.
Recent advances in biomedical data acquisition have enabled the collection of diverse patient-level information, including clinical characteristics, molecular profiles, and histopathological images [4]. These modalities capture different but potentially complementary aspects of disease biology. Clinical variables summarize patient- and disease-level characteristics, transcriptomic profiles reflect molecular mechanisms, and histopathology whole-slide images capture tissue architecture and cellular morphology. Multimodal learning refers to computational approaches that integrate two or more distinct data types from the same patient within a single predictive framework. In LIHC, this approach is relevant because clinical variables characterize patient and disease status, transcriptomic profiles capture tumor-associated molecular activity, and histopathology images reflect tissue architecture and cellular morphology. These sources may provide complementary prognostic information, although benefit depends on nonredundant signal rather than the number of modalities included.
However, multimodal survival prediction in LIHC remains limited by three important challenges. First, many studies emphasize a single modality, particularly gene-expression data, and therefore provide limited insight into how clinical, molecular, and morphological features jointly contribute to prognosis. Second, multimodal models often assume that adding more data sources will automatically improve performance, although modality complementarity may vary across clinically meaningful prediction horizons. Third, many deep learning-based fusion strategies rely on high-dimensional latent embeddings that are difficult to interpret, audit, or validate clinically. This limitation is especially important in computational pathology, where whole-slide images contain rich prognostic information but are often represented through opaque image embeddings that are disconnected from human-readable pathological descriptions [5].
The Cancer Genome Atlas Liver Hepatocellular Carcinoma (TCGA-LIHC) cohort is particularly suitable for this study because it provides patient-matched clinical records, RNA-sequencing profiles, and digitized histopathology slides within a common cohort [6]. This matching enables reproducible multimodal analysis and permits modality-specific contributions to be evaluated in the same patients. In this study, we use this cohort to investigate not only whether multimodal integration improves survival prediction, but also when and why different modalities contribute useful prognostic information. Survival prediction is formulated as a horizon-specific classification problem at 1-year, 3-year, and 5-year endpoints. This formulation is clinically interpretable because these endpoints correspond to short-, intermediate-, and long-term outcome horizons. At the same time, it is not intended to replace full time-to-event survival modeling; rather, it provides a controlled framework for evaluating modality-specific and multimodal discrimination at clinically meaningful decision points.
Prior LIHC survival prediction studies have demonstrated the strong prognostic value of molecular and genomic biomarkers. Ding et al. developed a T-cell-related prognostic risk model by integrating single-cell RNA sequencing and bulk RNA-seq data, highlighting the relevance of immune-related molecular features in LIHC progression [7]. Tang et al. constructed a prognostic model based on immunogenic cell death-related and cellular senescence-related genes, demonstrating strong short-term predictive performance but weaker long-term performance [8]. Zhu et al. used weighted gene co-expression network analysis and differential gene expression analysis to develop a four-gene prognostic signature [9], while An et al. proposed an autophagy-related prognostic model validated using TCGA and ICGC data [10]. Su et al. further demonstrated the value of molecular-level integration by combining multiple GEO cohorts with TCGA-LIHC and GTEx data to construct a five-gene prognostic signature [11].
Although these studies establish the importance of molecular features, they are primarily centered on genomic or gene-expression-based modeling. As a result, they do not fully address how clinical characteristics and tumor morphology contribute when analyzed jointly with transcriptomic data. In addition, many prior studies report predictive performance without systematically examining whether different modalities provide complementary information across multiple survival horizons. This distinction is important because a modality that is useful for short-term survival prediction may not provide the same incremental value for intermediate- or long-term prediction.
More recent multimodal work has begun to address this limitation by integrating heterogeneous patient data. Hou et al. proposed a multimodal deep learning framework that combines pathology images, genomic data, and clinical records using foundation-model embeddings and cross-attention-based fusion [12]. This work demonstrates the promise of multimodal integration and shows strong performance, particularly for 3-year survival prediction. However, such approaches often depend on high-dimensional latent representations and complex attention mechanisms, which can make it difficult to determine how individual modalities contribute to the final prediction or whether all included modalities provide meaningful incremental value.
To address these gaps, this study presents an interpretable multimodal framework for LIHC survival prediction that integrates clinical variables, transcriptomic features, and histopathology-derived textual representations. Instead of representing histopathology exclusively through latent image embeddings, whole-slide image patches are transformed into morphology-focused textual descriptions using a Large Language Model-based caption-generation pipeline. These caption-derived representations are designed to preserve observable morphological information in a human-readable form, enabling downstream predictive modeling while supporting qualitative inspection and expert assessment. Importantly, the caption-based representation is not proposed as a replacement for expert pathology review or direct image-based modeling; rather, it serves as an interpretable intermediate representation that can make image-derived information more transparent within a multimodal prediction framework.
To improve methodological robustness, the proposed framework uses a leakage-aware out-of-fold fusion strategy. Base models are trained separately for each modality, and out-of-fold predictions are used to construct fusion inputs for the training cohort, reducing the risk of overly optimistic performance estimates from stacking. This design enables direct comparison of unimodal and multimodal configurations while preserving a patient-level separation between training and held-out evaluation data. The framework therefore evaluates both predictive performance and modality contribution, rather than assuming that the full combination of clinical, genomic, and histopathological data will necessarily be optimal. The primary contributions of this work are fourfold:
- We develop an interpretable multimodal survival prediction framework that integrates clinical, genomic, and histopathology-derived information for LIHC prognosis.
- We introduce a caption-based histopathology representation strategy that converts whole-slide morphological patterns into human-readable textual descriptions suitable for downstream predictive modeling and expert review.
- We employ a leakage-aware out-of-fold fusion framework to support robust multimodal integration while reducing the risk of overly optimistic performance estimates.
- We systematically investigate unimodal and multimodal contributions across 1-year, 3-year, and 5-year survival horizons, providing insight into when multimodal integration is beneficial and when additional modalities provide limited incremental value.
Collectively, this work provides an interpretable and leakage-aware framework for evaluating prognostic signals across clinical, molecular, and morphological domains in LIHC. Rather than treating multimodal learning as a guaranteed path to higher performance, the study explicitly examines modality complementarity across clinically relevant survival horizons and highlights the potential role of caption-derived pathology representations in making histopathology information more transparent for multimodal survival prediction.
2. Materials and Methods
2.1. Study Design and Data Sources
This study used the Liver Hepatocellular Carcinoma (LIHC) cohort from The Cancer Genome Atlas (TCGA), a publicly available resource developed by the National Cancer Institute (NCI) and the National Human Genome Research Institute (NHGRI) [13,14,15]. TCGA-LIHC was selected because it provides patient-level clinical data, RNA-sequencing-based transcriptomic profiles, and hematoxylin and eosin-stained histopathology whole-slide images (WSIs), enabling multimodal survival prediction within a shared cancer cohort. The patient was used as the unit of analysis. Three data modalities were included: clinical, genomic, and histopathology data. Clinical data captured demographic characteristics, disease-related variables, and survival outcomes. Genomic data represented tumor molecular profiles through transcriptomic expression measurements. Histopathology data captured tissue architecture and cellular morphology through high-resolution WSIs.
Clinical data served as the reference modality because survival labels were derived from clinical outcome variables. Genomic and histopathology records were aligned to the clinical cohort using TCGA patient identifiers. Patients were retained for each analysis when they had valid survival information and the required modality-specific data. As shown in Figure 1, the overall workflow included patient-level cohort construction, horizon-specific survival label generation, modality-specific preprocessing, unimodal modeling, out-of-fold probability generation, multimodal fusion, and performance evaluation.
Figure 1.
Overall workflow of the proposed multimodal survival prediction framework. Clinical, genomic, and histopathology data from TCGA-LIHC were processed into horizon-specific cohorts for 1-, 3-, and 5-year survival prediction. Modality-specific models generated out-of-fold probabilities for leakage-aware multimodal fusion, followed by performance evaluation and interpretability analysis.
2.2. Clinical Data Preprocessing and Survival Label Construction
Clinical data from TCGA-LIHC were used for cohort construction and survival-label generation. The original clinical dataset contained 2977 records and 201 variables. Eight variables were selected based on clinical relevance, completeness, and suitability for survival prediction: age at diagnosis, gender, primary diagnosis, AJCC pathological stage, tumor grade, days to death, days to last follow-up, and the patient identifier used for grouping (Figure 1).
Because multiple clinical records may correspond to the same patient, records were aggregated into a single patient-level representation using cases.submitter_id. Age at diagnosis was aggregated using the minimum recorded value. AJCC pathological stage, tumor grade, days to death, and days to last follow-up were aggregated using maximum recorded values. Categorical variables, including gender and primary diagnosis, were retained using the first recorded occurrence. This aggregation produced 378 unique patients. The patient identifier was used only for grouping, modality alignment, and split construction, and was excluded from predictive modeling.
AJCC pathological stages were standardized into broader ordinal categories and encoded as Stage 0 = 0, Stage I = 1, Stage II = 2, Stage III = 3, and Stage IV = 4. Tumor grades were standardized by mapping G1–G4 to values 1–4. Survival-related variables, including days to death and days to last follow-up, were used only for label construction and were excluded from the predictive clinical feature matrix.
Survival prediction was formulated as three horizon-specific binary classification tasks corresponding to 1-year, 3-year, and 5-year outcomes. Thresholds of 365, 1095, and 1825 days were used for the 1-year, 3-year, and 5-year tasks, respectively. Patients who died before the target horizon were assigned to the non-survivor class for that horizon, whereas patients who survived beyond the target horizon were assigned to the survivor class. Patients without a recorded death event and with follow-up shorter than the target horizon were excluded from that horizon-specific task because their survival status beyond the prediction threshold could not be determined.
Fixed-horizon classification was selected to provide interpretable 1-, 3-, and 5-year endpoints and to compare modality contributions at common decision points. Patients without an observed event and with follow-up shorter than the relevant horizon were excluded to avoid uncertain binary labels.
2.3. Genomic Data Preprocessing and Feature Selection
Genomic data were obtained from the TCGA-LIHC cohort and consisted of RNA-sequencing-based gene-expression measurements. For each patient, multiple expression quantification formats were available, including raw counts, FPKM, FPKM-UQ, and TPM values. TPM values were selected for downstream analysis because they provide a normalized measure of transcript abundance suitable for cross-sample comparison.
Patient-level expression files were aggregated into a single gene-expression matrix. After preprocessing, each patient was represented by 60,660 gene-expression features, resulting in a matrix of 371 patients × 60,660 genes. Because the number of genomic features was substantially larger than the number of patients, dimensionality reduction was performed before predictive modeling. A two-stage feature-selection strategy was used. First, variance filtering removed low-variability genes, reducing the feature space to approximately 3000 genes. Second, Random Forest-based feature-importance ranking was applied to identify genes with higher predictive relevance for each survival task. Multiple feature subsets were evaluated using k = 10, 20, 50, 100, 200, and 500 selected genes.
To reduce information leakage, all data-driven preprocessing and feature-selection steps were performed within the training data of each experimental split. During out-of-fold procedures, variance filtering and Random Forest-based feature ranking were fitted only on the fold-training subset and then applied to the held-out validation fold. The held-out test set was not used for feature filtering, feature ranking, model fitting, oversampling, model selection, or fusion-model training.
Genomic records were aligned with the clinical cohort using TCGA patient identifiers. Only patients with corresponding horizon-specific survival labels were retained for genomic modeling and multimodal fusion.
2.4. Histopathology WSI Processing and Patch Selection
Histopathology WSIs were obtained from the TCGA-LIHC collection through the Genomic Data Commons infrastructure [16,17]. A dedicated WSI preprocessing pipeline was developed to convert image content into patient-level representations suitable for downstream modeling as illustrated in Figure 2. Each WSI was divided into image patches rather than resized as a whole slide. To prioritize tissue-containing regions, WSIs were converted to grayscale and thresholding was applied to distinguish foreground tissue from background. Threshold values were selected empirically to retain patches with sufficient tissue content. A fixed number of informative patches was extracted from each slide to maintain a consistent representation across patients.
Figure 2.
Caption-based histopathology representation workflow. Whole-slide images were filtered to identify tissue-containing regions, 20 informative patches were extracted, patch-level captions were generated using a vision–language model, and captions were aggregated into patient-level morphology summaries. The resulting summaries were aligned with clinical survival labels and converted into embedding features for downstream modeling.
Whole-slide images were processed using the OpenSlide library at resolution level 2. Each slide was divided into non-overlapping patches of 224 × 224 pixels using a stride of 224 pixels. To retain tissue-containing regions, grayscale thresholding was applied, where patches containing more than 60% white pixels (grayscale intensity > 200) were classified as background and excluded, while patches containing more than 1% black pixels (grayscale intensity < 10) were discarded to remove empty or artifact-dominated regions. Grayscale thresholds were used only to exclude background and artifact-dominated regions; they did not identify tumor. Up to 20 tissue-containing patches were retained per slide to standardize the number of captioning inputs across patients. Consequently, the selected patches could include both tumor and non-tumor tissue.
2.5. Caption-Based Histopathology Representation
Each selected histopathology patch was converted into a natural-language description using a vision–language model. The captioning prompt was designed to focus on visually observable morphology, including tissue architecture and cellular appearance, while discouraging unsupported diagnostic, prognostic, or mechanistic claims. Model temperature was fixed at zero to support deterministic generation. The caption-generation model was GPT-4o mini (gpt-4o-mini), accessed through the OpenAI API. The API was accessed in May 2026. The model was configured with a temperature of 0 to ensure deterministic caption generation. No explicit maximum output token limit or additional decoding parameters (e.g., top-p, frequency penalty, or presence penalty) were specified; therefore, the default API settings were used.
Available patient-level clinical information, including age, gender, diagnosis, stage, and grade, was included in the captioning prompt. Because age, sex, diagnosis, stage, and grade were included in the prompt, the generated text represents a clinically contextualized histopathology description rather than an image-only representation. Therefore, the resulting representation was treated as a morphology-focused, clinically contextualized histopathology representation. Survival outcome variables, survival labels, and follow-up duration were not included in the caption-generation or summarization prompts.
The exact patch-level captioning prompt was:
| System prompt: You are an expert assistant for histopathology patch description. Your task is to generate a short caption describing only the visible tissue characteristics in the patch. Important rules: focus only on visually observable morphology; use the clinical details only as supporting context; do not restate the known diagnosis unless it is visually obvious; do not infer survival risk or prognosis; avoid unsupported claims such as necrosis, mitotic activity, vascular invasion, or specific carcinoma type unless clearly visible; use cautious language such as “shows,” “appears,” or “suggestive of”; keep the caption concise and medically relevant. Output only the caption. |
| User prompt template: Patient Details: Age: {Age}; Gender: {Gender}; Diagnosis: {Diagnosis}; Stage: {Stage}; Grade: {Grade}. Task: Generate a short caption describing the visible histopathology characteristics in the given image patch. Focus primarily on the image and use the clinical details only as supporting context. |
Patch-level captions were aggregated into a patient-level histopathology summary using a guided summarization prompt. The summarization step identified recurring morphological patterns across patch-level captions, reduced redundancy, and restricted the summary to findings present in the input captions. The summarization template was structured around 20 patch captions per slide.
The exact global summarization prompt was:
| System prompt: You are a histopathology-aware summarization assistant. You are given multiple patch-level descriptions from a histopathology slide. Your task is to generate a concise global summary describing the overall tissue characteristics. Important rules: focus only on patterns that appear across multiple patches; do not introduce new findings that are not mentioned in the input captions; avoid making definitive diagnoses; avoid repetition; use clear and medically relevant language; keep the summary concise, 3–5 sentences. |
| User prompt template: Patch Captions: 1. {Caption_1}; 2. {Caption_2}; …; 20. {Caption_20}. Output only the final summary. |
The resulting patient-level textual summaries were used as histopathology-derived representations for downstream modeling.
2.6. Automated and Expert Evaluation of Histopathology Captions
Caption quality was evaluated using automated semantic-alignment metrics and expert pathological review. For automated evaluation, structured clinical variables were converted into standardized natural-language clinical descriptions. The alignment between clinical descriptions and histopathology-derived patient summaries was evaluated using BERTScore, BLEU, ROUGE-L, and an LLM-as-Judge framework [18,19,20,21]. Because automated metrics alone cannot fully assess the clinical relevance of generated summaries, an expert pathological review was conducted. Six WSIs were randomly selected, and each patient-level summary, generated from 20 representative image patches, was independently evaluated by an expert pathologist using a structured five-point Likert-scale rubric. The evaluation assessed Morphological Fidelity, Clinical Plausibility, Unsupported Claims (Hallucination Avoidance), Clinical Utility, and Clarity. The review form is shown in Figure 3.
Figure 3.
Clinical feature coefficients for the 3-year survival prediction model. Logistic Regression coefficients are shown for the selected clinical model, with positive values indicating features associated with higher predicted survival probability and negative values indicating features associated with lower predicted survival probability. Error bars represent variability across repeated runs.
The LLM-as-Judge framework was implemented using GPT-4o mini (gpt-4o-mini) accessed through the OpenAI API. The API was accessed in May 2026. The model was configured with a temperature of 0 to ensure deterministic evaluations. No additional decoding parameters (e.g., top-p, frequency penalty, or presence penalty) were explicitly specified, and the default API settings were used. The exact LLM-based clinical-alignment evaluation prompt was:
| System prompt: You are an expert evaluator of clinical-image text alignment in computational pathology. You will be given: 1. a clinical description derived from structured patient clinical data; 2. an image-derived global caption generated from histopathology patches. Both texts refer to the same patient. Evaluation criteria: disease consistency, morphology alignment, over-interpretation, and overall semantic alignment. Scoring: 1 = very poor alignment; 2 = weak alignment; 3 = partial alignment; 4 = strong alignment; 5 = excellent alignment. Output format: Alignment Score: <1–5>; Strengths; Concerns; Final Verdict. |
The quantitative semantic-alignment results are reported in Table 1.
Table 1.
Quantitative evaluation of semantic alignment between clinical descriptions and histopathology-derived captions using multiple metrics.
The expert pathological review showed consistently high ratings across all evaluation criteria. Mean scores ranged from 4.67 ± 0.52 to 4.83 ± 0.41. Clinical Plausibility and Clinical Utility achieved the highest mean scores (4.83 ± 0.41), whereas Morphological Fidelity, Hallucination Avoidance, and Clarity each achieved mean scores of 4.67 ± 0.52, indicating that the generated summaries were morphologically grounded, clinically plausible, and clearly written while introducing few unsupported observations.
The reviewing pathologist was blinded to the patient’s clinical variables, survival labels, and the identity of the caption-generation model. Captions were presented in a randomized order to minimize potential evaluation bias. The ratings provide preliminary evidence of plausibility within the reviewed cases and should not be extrapolated to all patients or patches.
2.7. Multimodal Cohort Construction and Train–Test Splitting
Clinical, genomic, and histopathology datasets were aligned at the patient level using cases.submitter_id. Because survival labels were derived from clinical outcomes, the clinical dataset served as the reference modality for cohort construction. Genomic and histopathology datasets were independently matched to the clinical cohort, and the intersection of patients with available data across all three modalities was used to construct the complete multimodal cohort. This alignment yielded a final multimodal cohort of 358 patients with corresponding clinical, genomic, and histopathological information. Using this common cohort, modality-specific datasets were reconstructed to ensure consistent patient representation across unimodal and multimodal analyses. Horizon-specific cohorts were then created using the survival-labeling procedure described in Section 3.2.
For each horizon, patient-level train–test splits were generated using stratification by the survival label to preserve class distributions. The same patient identifiers were used to define train–test partitions across clinical, genomic, and histopathology modalities, ensuring that modality comparisons were performed on identical patient splits. No patient appeared in both the training and held-out test sets. Experiments were repeated across multiple random seeds, and the corresponding patient splits were stored and reused across all modalities and fusion configurations. The horizon-specific cohort composition and train–test distributions are reported in Table 2.
Table 2.
Cohort composition and train–test partitioning for the 1-year, 3-year, and 5-year survival prediction tasks. Survivor and non-survivor counts correspond to the horizon-specific labels derived from clinical outcomes.
For each survival horizon, patients were divided using a stratified 80:20 train–test split to preserve the survivor/non-survivor distribution. Within each run, the same patient identifiers defined the training and held-out test sets across all clinical, genomic, histopathology, and fusion configurations, and no patient appeared in both partitions. The procedure was repeated using six random seeds (42, 100, 200, 300, 400, and 500) to assess sensitivity to data partitioning.
2.8. Unimodal Modeling
Separate unimodal models were developed for clinical, genomic, and histopathology-derived representations. All experiments were conducted independently for the 1-year, 3-year, and 5-year survival prediction tasks using the same patient-level train–test partitions for all modalities. Three supervised machine-learning algorithms were evaluated: Logistic Regression, Random Forest, and Gradient Boosting [22,23,24]. Logistic Regression was trained with max_iter = 1000, class_weight = balanced, and random_state = 42. Random Forest was trained with n_estimators = 100, class_weight = balanced, and random_state = 42. Gradient Boosting was trained with n_estimators = 100 and random_state = 42.
For clinical modeling, survival-related variables, including days to death and days to last follow-up, were removed from the predictive feature matrix. The patient identifier, cases.submitter_id, was also removed before modeling. Categorical variables were transformed using one-hot encoding. Because class imbalance was most pronounced in the 1-year and 5-year clinical prediction tasks, SMOTE was applied only to the training data for those clinical experiments [25]. SMOTE was not applied to validation folds or held-out test data.
For genomic modeling, each patient was initially represented by 60,660 gene-expression features. Variance filtering and Random Forest-based feature ranking were used to construct reduced feature subsets with k = 10, 20, 50, 100, 200, and 500 selected genes. Feature filtering and ranking were fitted only on training data within each split or fold and then applied to the corresponding validation or test data.
For histopathology modeling, patient-level histopathology summaries were converted into fixed-length numerical embeddings. Two sentence-embedding approaches were evaluated: the general-purpose all-MiniLM-L6-v2 model, producing 384-dimensional embeddings, and the domain-specific S-PubMedBERT-MS-MARCO model, producing 768-dimensional embeddings. Each patient was represented by a single embedding vector derived from the corresponding patient-level histopathology summary.
For each modality and survival horizon, candidate models were compared using the evaluation metrics described in Section 2.10. ROC-AUC was used as the primary model-selection metric. The selected unimodal models generated patient-level survival probabilities for multimodal fusion.
2.9. Out-of-Fold Multimodal Fusion
Multimodal fusion was performed using a leakage-aware out-of-fold (OOF) stacking strategy. Within each training set, patients were split into five folds. For each fold, a modality-specific base model was trained on the remaining four folds and used to generate survival-probability estimates for the held-out fold. This process was repeated until every training patient received one probability estimate from a model that had not been trained on that patient. The resulting OOF probabilities were aggregated to form modality-specific fusion features for the training cohort. For the held-out test cohort, each selected unimodal base model was retrained on the full training cohort and used to generate test-set probability estimates. Test-set probabilities were used only for final fusion evaluation.
Four fusion configurations were evaluated: Clinical + Genomics, Clinical + Histopathology, Genomics + Histopathology, and Clinical + Genomics + Histopathology. For each configuration, a Logistic Regression meta-model was trained using the corresponding OOF probability features. Logistic Regression was selected because the fusion input contained only two or three modality-level probabilities, allowing low-dimensional and interpretable fusion while reducing overfitting risk. The fusion model was trained exclusively on OOF predictions from the training cohort and evaluated only on probability estimates generated for the held-out test cohort.
2.10. Evaluation Metrics and Software
Model performance was evaluated using Accuracy, Precision, Recall, F1-score, and the Area Under the Receiver Operating Characteristic Curve (ROC-AUC) [26,27]. Because the survival prediction tasks exhibited varying degrees of class imbalance, ROC-AUC was selected as the primary evaluation metric due to its threshold-independent assessment of class discrimination. Accuracy, Precision, Recall, and F1-score were additionally reported to provide a comprehensive evaluation of classification performance. Results are reported as mean ± standard deviation across six repeated random seeds (42, 100, 200, 300, 400, and 500).
For histopathology-caption evaluation, BERTScore, BLEU, ROUGE-L, and an LLM-as-Judge framework were used to assess semantic and textual alignment between clinical descriptions and generated histopathology summaries [18,19,20,21]. Expert pathology evaluation scores are reported as mean ± standard deviation across the evaluated patient-level summaries.
All analyses were implemented using Python 3.12.13. The primary computational libraries included scikit-learn 1.6.1, imbalanced-learn 0.14.2, sentence-transformers 5.6.0, BERTScore 0.3.13, the NLTK implementation of BLEU, the rouge-score implementation of ROUGE-L, and OpenSlide 4.0.0.13 for whole-slide image processing.
2.11. Statistical Analysis for Significance
Statistical comparisons of the multimodal fusion configurations were based on the six unrounded run-level ROC-AUC values. Within each run, all four configurations were evaluated on the same held-out patients; therefore, the run was treated as a block and the observations were paired. For each survival horizon, an omnibus Friedman test was used to compare the four configurations, and Kendall’s W was reported as an effect-size measure. Holm correction was applied across the three horizon-level Friedman tests. When the adjusted omnibus test was significant, post hoc comparisons were conducted using two-sided paired t-tests to evaluate mean paired ROC-AUC differences and exact two-sided Wilcoxon signed-rank tests as a rank-based sensitivity analysis. Holm correction was applied across the six pairwise comparisons within each test family. Statistical significance was defined as an adjusted p-value below 0.05. Given the small number of repeated runs (n = 6), pairwise results were interpreted together with the omnibus test, effect size, and sensitivity analysis; nonsignificant findings were not interpreted as evidence of equivalence.
3. Experimental Results
All results are reported as mean ± standard deviation across repeated experimental runs and rounded to two decimal places. ROC-AUC was used as the primary measure of discrimination, while Accuracy, Precision, Recall, and F1-score were used to summarize threshold-dependent model performance. Formal statistical comparisons of the four fusion configurations are reported in Section 3.4.
The Results section is organized into seven parts. Section 3.1, Section 3.2 and Section 3.3 report unimodal performance for clinical, genomic, and histopathology-derived representations. Section 3.4 reports out-of-fold multimodal fusion results. Section 3.5 summarizes cross-horizon and cross-modality findings. Section 3.6 presents interpretability analyses for the 3-year task, which showed the most stable overall performance. Section 3.7 provides a contextual comparison with prior LIHC survival prediction studies.
3.1. Clinical Unimodal Modeling Results
Table 3 summarizes the performance of clinical models across the 1-year, 3-year, and 5-year survival prediction tasks. Overall, clinical variables provided modest prognostic discrimination, with performance varying across prediction horizons, model types, and use of SMOTE.
Table 3.
Clinical model performance across survival horizons. Values are mean ± standard deviation; SMOTE denotes training-set oversampling.
For the 1-year task, the highest clinical ROC-AUC was obtained by Gradient Boosting using the original data, with ROC-AUC = 0.69 ± 0.07. Random Forest using the original data achieved ROC-AUC = 0.68 ± 0.10, while Logistic Regression using the original data achieved ROC-AUC = 0.68 ± 0.11. Although several 1-year clinical models achieved relatively high Accuracy, the reported Recall and F1-score values were lower, indicating that Accuracy alone did not fully characterize model behavior under class imbalance.
For the 3-year task, Logistic Regression achieved the highest clinical ROC-AUC, with ROC-AUC = 0.59 ± 0.05. Gradient Boosting achieved ROC-AUC = 0.56 ± 0.06, and Random Forest achieved ROC-AUC = 0.53 ± 0.06. The threshold-dependent metrics were more balanced than in the 1-year task, but overall discrimination remained limited.
For the 5-year task, the highest clinical ROC-AUC values were obtained by Logistic Regression with SMOTE and Gradient Boosting with SMOTE, both reaching ROC-AUC = 0.67 after rounding. Logistic Regression with SMOTE achieved ROC-AUC = 0.67 ± 0.07, while Gradient Boosting with SMOTE achieved ROC-AUC = 0.67 ± 0.12. Random Forest showed high reported Recall but lower ROC-AUC, indicating that stronger threshold-dependent sensitivity did not correspond to stronger threshold-independent discrimination.
Across clinical experiments, SMOTE changed threshold-dependent behavior in several settings but did not consistently improve ROC-AUC. Logistic Regression was selected for downstream clinical fusion based on its overall consistency across horizons rather than because it achieved the highest ROC-AUC in every individual setting.
3.2. Genomic Unimodal Modeling Results
Table 4, Table 5 and Table 6 summarize the performance of Logistic Regression, Random Forest, and Gradient Boosting using transcriptomic features across the 1-year, 3-year, and 5-year survival prediction tasks. Genomic models generally produced stronger unimodal ROC-AUC values than clinical and histopathology-only models, especially at the 1-year and 3-year horizons.
Table 4.
Logistic Regression performance for unimodal genomic survival prediction across horizons and selected-gene counts. Values are mean ± standard deviation.
Table 5.
Random Forest performance for unimodal genomic survival prediction across horizons and selected-gene counts. Values are mean ± standard deviation.
Table 6.
Gradient Boosting performance for unimodal genomic survival prediction across horizons and selected-gene counts. Values are mean ± standard deviation.
For the 1-year task, Logistic Regression with k = 20 selected genes achieved the highest genomic ROC-AUC, with ROC-AUC = 0.72 ± 0.07. Logistic Regression with k = 10 achieved a similar ROC-AUC of 0.72 ± 0.10. Among Random Forest models, k = 20 and k = 500 both rounded to ROC-AUC = 0.71. Gradient Boosting produced lower ROC-AUC values across most feature subset sizes, with its best 1-year ROC-AUC rounding to 0.67. Despite relatively high Accuracy in several genomic configurations, reported Recall and F1-score values varied across models and feature subset sizes.
For the 3-year task, Logistic Regression with k = 500 selected genes achieved the strongest genomic performance, with ROC-AUC = 0.74 ± 0.04, Accuracy = 0.66 ± 0.05, Precision = 0.66 ± 0.05, Recall = 0.75 ± 0.11, and F1-score = 0.70 ± 0.05. Random Forest achieved its highest 3-year ROC-AUC at k = 100, with ROC-AUC = 0.69 ± 0.06, while Gradient Boosting achieved its highest 3-year ROC-AUC at k = 200, with ROC-AUC = 0.67 ± 0.08. These results show that genomic features produced their strongest unimodal discrimination at the intermediate 3-year horizon.
For the 5-year task, Random Forest with k = 200 achieved the highest genomic ROC-AUC, with ROC-AUC = 0.66 ± 0.09. Logistic Regression with k = 100 achieved ROC-AUC = 0.65 ± 0.07, and Gradient Boosting with k = 200 achieved ROC-AUC = 0.65 ± 0.06. The 5-year genomic models showed higher reported Recall and F1-score than many 1-year configurations, but ROC-AUC values remained moderate.
Overall, genomic features provided the strongest unimodal discrimination at the 1-year and 3-year horizons. At the 5-year horizon, genomic performance remained competitive but was numerically close to the strongest clinical models.
3.3. Histopathology Unimodal Modeling Results
Table 7 summarizes the performance of histopathology-derived textual representations across the 1-year, 3-year, and 5-year survival prediction tasks. Two embedding strategies were evaluated: general-purpose sentence embeddings and medical-domain sentence embeddings. Overall, histopathology-derived captions showed modest standalone discrimination, with the strongest ROC-AUC observed for the 3-year task.
Table 7.
Histopathology-derived caption-embedding performance across classifiers, embedding types, and survival horizons. Values are mean ± standard deviation.
For the 1-year task, histopathology-only models showed limited discrimination. The highest ROC-AUC values rounded to 0.56 and were observed for Random Forest with medical sentence embeddings and Logistic Regression with general-purpose sentence embeddings. However, the Random Forest configurations produced zero reported Precision, Recall, and F1-score, so their high Accuracy should be interpreted cautiously. Logistic Regression with general-purpose sentence embeddings achieved ROC-AUC = 0.56 ± 0.11 while maintaining non-zero reported threshold-dependent metrics.
For the 3-year task, Logistic Regression with general-purpose sentence embeddings achieved the highest histopathology ROC-AUC, with ROC-AUC = 0.65 ± 0.05, Accuracy = 0.61 ± 0.07, Precision = 0.63 ± 0.07, Recall = 0.66 ± 0.07, and F1-score = 0.64 ± 0.07. Random Forest with general-purpose embeddings achieved higher reported Recall, 0.73 ± 0.06, but lower ROC-AUC, 0.57 ± 0.06. These results indicate that caption-derived histopathology representations had their strongest standalone signal at the 3-year horizon.
For the 5-year task, Logistic Regression with general-purpose embeddings achieved the highest histopathology ROC-AUC, with ROC-AUC = 0.58 ± 0.11. Random Forest produced high reported Recall and F1-score across both embedding variants, but its ROC-AUC values remained lower than the best Logistic Regression configuration. This again shows that threshold-dependent performance and threshold-independent discrimination did not always move together.
Across embedding strategies, general-purpose sentence embeddings performed competitively and often exceeded the medical-domain embeddings in Logistic Regression configurations, particularly for the 3-year and 5-year tasks. However, performance varied by classifier and horizon, so embedding choice should be interpreted together with the downstream model rather than in isolation.
3.4. Multimodal Fusion Results
Table 8, Table 9 and Table 10 summarize the out-of-fold multimodal fusion results across the 1-year, 3-year, and 5-year survival prediction tasks. Four fusion configurations were evaluated: Clinical + Genomics, Clinical + Histopathology, Genomics + Histopathology, and Clinical + Genomics + Histopathology. The results show that the best fusion configuration varied by prediction horizon and that using all available modalities did not consistently produce the highest ROC-AUC.
Table 8.
One-year survival prediction performance of out-of-fold multimodal fusion configurations. Values are mean ± standard deviation.
Table 9.
Three-year survival prediction performance of out-of-fold multimodal fusion configurations. Values are mean ± standard deviation.
Table 10.
Five-year survival prediction performance of out-of-fold multimodal fusion configurations. Values are mean ± standard deviation.
For the 1-year task, Clinical + Genomics achieved the highest fusion ROC-AUC, with ROC-AUC = 0.70 ± 0.09. The full three-modality model achieved ROC-AUC = 0.68 ± 0.10, Genomics + Histopathology achieved ROC-AUC = 0.67 ± 0.08, and Clinical + Histopathology achieved ROC-AUC = 0.64 ± 0.11. Thus, within the fusion experiments, adding histopathology to Clinical + Genomics did not improve 1-year ROC-AUC.
For the 3-year task, Genomics + Histopathology achieved the highest fusion performance, with Accuracy = 0.71 ± 0.03, Precision = 0.71 ± 0.03, Recall = 0.77 ± 0.09, F1-score = 0.73 ± 0.04, and ROC-AUC = 0.74 ± 0.03. The full three-modality model achieved ROC-AUC = 0.66 ± 0.06, Clinical + Genomics achieved ROC-AUC = 0.66 ± 0.07, and Clinical + Histopathology achieved ROC-AUC = 0.60 ± 0.04. After rounding, the best 3-year fusion ROC-AUC was numerically comparable to the best 3-year genomic unimodal ROC-AUC.
For the 5-year task, Clinical + Genomics achieved the highest fusion ROC-AUC, with ROC-AUC = 0.66 ± 0.05. Clinical + Histopathology achieved ROC-AUC = 0.63 ± 0.12, the full three-modality model achieved ROC-AUC = 0.63 ± 0.07, and Genomics + Histopathology achieved ROC-AUC = 0.62 ± 0.08. The 5-year fusion results were numerically close across configurations, indicating that no fusion combination showed a large separation in discrimination at this horizon.
Across fusion experiments, the highest ROC-AUC values were 0.70 for 1-year prediction, 0.74 for 3-year prediction, and 0.66 for 5-year prediction. The 3-year Genomics + Histopathology model was the strongest fusion configuration overall. Importantly, the full three-modality model was not the highest-performing fusion strategy at any horizon. These findings indicate that multimodal fusion was horizon-dependent and that adding more modalities did not necessarily improve discrimination.
Formal comparison of the four fusion configurations showed no statistically detectable overall difference at the 1-year or 5-year horizons after correction across the three horizon-level tests. At the 3-year horizon, the configurations differed overall (Friedman Q = 13.00, Holm-adjusted p = 0.0138, Kendall’s W = 0.7222), indicating consistent differences in within-run rankings across the six repeated splits (Table 11). In post hoc mean comparisons, Genomics + Histopathology achieved a higher ROC-AUC than Clinical + Histopathology (mean paired difference = 0.1394, 95% CI 0.0971–0.1817, t(5) = 8.47, Holm-adjusted p = 0.0023) (Table 12). No pairwise comparison remained significant in the exact Wilcoxon signed-rank sensitivity analysis. Accordingly, the omnibus 3-year difference is supported, while the identification of a specific superior pair is interpreted cautiously because the pairwise conclusion depended on the statistical test and was based on six repeated runs.
Table 11.
Omnibus comparison of the four fusion configurations across six paired runs. Holm adjustment was applied across the three survival horizons.
Table 12.
Post hoc pairwise comparisons for the 3-year horizon. Differences are calculated as Model A minus Model B. Holm adjustment was applied across six comparisons separately for the paired t-test and Wilcoxon test families.
3.5. Cross-Horizon and Cross-Modality Performance Summary
Across unimodal and multimodal experiments, model performance showed a horizon-dependent pattern. The 3-year task produced the strongest overall results, while 1-year prediction remained challenging across modalities. The 5-year task showed moderate performance, with relatively small differences among the strongest clinical, genomic, and fusion models. At the 1-year horizon, the highest ROC-AUC across all evaluated models was achieved by genomic Logistic Regression with k = 20 selected genes, with ROC-AUC = 0.72 ± 0.07. The best fusion model at this horizon was Clinical + Genomics, with ROC-AUC = 0.70 ± 0.09. Therefore, fusion did not numerically exceed the best genomic unimodal model for 1-year prediction.
At the 3-year horizon, genomic Logistic Regression with k = 500 selected genes achieved ROC-AUC = 0.74 ± 0.04. The best fusion model, Genomics + Histopathology, achieved ROC-AUC = 0.74 ± 0.03 and the highest fusion F1-score, 0.73 ± 0.04. These results indicate that genomic features carried the strongest standalone signal at 3 years, while the combination of genomic and histopathology-derived representations produced the strongest fusion performance.
At the 5-year horizon, the highest clinical ROC-AUC was achieved by Logistic Regression with SMOTE, with ROC-AUC = 0.67 ± 0.07. The highest genomic ROC-AUC was achieved by Random Forest with k = 200, with ROC-AUC = 0.66 ± 0.09. The highest fusion ROC-AUC was achieved by Clinical + Genomics, with ROC-AUC = 0.66 ± 0.05. These values were numerically close, indicating that the 5-year task did not show a single dominant modality or fusion strategy.
Overall, genomic features provided the strongest unimodal performance at the 1-year and 3-year horizons. Histopathology-derived captions contributed most clearly at the 3-year horizon, particularly in the Genomics + Histopathology fusion configuration. Clinical variables showed modest standalone discrimination and contributed to the best 1-year and 5-year fusion configurations when combined with genomics. Across horizons, multimodal integration was not uniformly beneficial; its value depended on the prediction horizon and the specific modality combination.
3.6. Interpretability Analysis
Interpretability analyses were conducted for the 3-year survival prediction task because this horizon showed the strongest and most stable overall performance. Separate interpretability strategies were applied to clinical, genomic, and histopathology-derived representations according to the structure of each modality. For clinical data, interpretability was derived from the coefficients of the selected Logistic Regression model. Figure 3 presents the top clinical features ranked by coefficient magnitude. Features with larger absolute coefficients showed more stable directional effects across repeated runs, whereas smaller-magnitude coefficients showed greater variability. This pattern indicates that the clinical model relied on a limited subset of variables with more consistent influence on prediction.
For genomic data, interpretability focused on feature-selection stability and model coefficients. Following variance filtering and Random Forest-based feature ranking, the selected 3-year genomic model used 500 features. Across repeated runs, feature selection showed substantial variability, with many genes selected only once. To identify more reproducible genomic predictors, genes selected in more than one run were retained as recurrently selected features for descriptive interpretation (this threshold does not establish biological stability), resulting in 788 stable features. Figure 4 shows the distribution of genomic feature-selection frequency.
Figure 4.
Stability of genomic feature selection across repeated runs for the 3-year survival prediction task. The distribution shows how frequently genomic features were selected after variance filtering and Random Forest-based feature ranking. Genes selected in more than one run were retained as stable features for downstream interpretability analysis.
Figure 5 presents the top 20 stable genomic features ranked by mean feature importance. These features represent genes that were repeatedly selected across runs and therefore contributed more consistently to model prediction than genes selected only once.
Figure 5.
Top stable genomic features for the 3-year survival prediction task. The top 20 genomic features are ranked by mean Random Forest feature importance among genes selected in more than one repeated run. Error bars represent variability across runs, indicating the consistency of each feature’s contribution to genomic model prediction.
Figure 6 shows the Logistic Regression coefficients for stable genomic features in the 3-year survival prediction task. Positive coefficients indicate features associated with increased predicted survival likelihood, while negative coefficients indicate features associated with decreased predicted survival likelihood. The most influential genomic features showed lower coefficient variability across runs, supporting their more stable contribution to model behavior.
Figure 6.
Logistic Regression coefficients of stable genomic features for the 3-year survival prediction task. Coefficients are shown for reproducibly selected genomic features, with positive values indicating higher predicted survival likelihood and negative values indicating lower predicted survival likelihood. Error bars represent coefficient variability across repeated runs, highlighting the stability of each feature’s contribution to model behavior.
For histopathology, interpretability was provided by the caption-based representation itself. Instead of relying only on latent image embeddings, the model used patient-level textual summaries derived from histopathology patches. These summaries described observable morphological characteristics and provided a human-readable link between image-derived information and downstream survival prediction. Expert pathological evaluation further supported the clinical plausibility and morphological consistency of the generated captions.
Together, these analyses show that the framework provides feature-level interpretability for clinical and genomic models and representation-level interpretability for histopathology-derived captions.
3.7. Contextual Comparison with Existing LIHC Survival Prediction Studies
Table 13 provides a descriptive comparison between the proposed framework and existing LIHC survival prediction studies. The comparison includes data modalities, fusion strategy, reported AUC values across survival horizons, interpretability type, and model family. Because the studies differ in cohort construction, feature selection, modeling strategy, validation design, and endpoint definition, this comparison should be interpreted as contextual rather than as a direct ranking.
Table 13.
Contextual comparison of LIHC survival-prediction studies by publication year, development and validation datasets, cohort size, modality, fusion strategy, reported time-specific AUC, interpretability, and model type.
Source-specific clarification. Ding et al. reported 463 TCGA-LIHC samples but did not state the exact survival-model sample count; Tang et al. used GEO cohorts for feature discovery rather than independent survival validation; Hou et al. reported five-fold cross-validation rather than a fixed hold-out set.
Table 13 shows that most prior LIHC survival-prediction studies relied on transcriptomic signatures and Cox-based statistical models, whereas only Hou et al. and the present study integrated clinical, transcriptomic, and histopathological information. Within this heterogeneous evidence base, the present framework achieved competitive held-out ROC-AUC values of 0.70, 0.74, and 0.66 at the 1-, 3-, and 5-year horizons, respectively, with its strongest performance at 3 years. These values are comparable to the reported performance of both genomic-signature models and the multimodal cross-attention approach of Hou et al. However, the principal contribution of this study is not an assertion of numerical superiority, because cohort eligibility, endpoint definitions, censoring procedures, and validation designs differed across studies. Rather, the framework combines three features that are not jointly emphasized in the compared work: caption-based, human-readable histopathology representations; leakage-aware out-of-fold fusion; and explicit feature- and modality-level interpretation across multiple survival horizons. Several prior genomic studies also included external validation cohorts, whereas the present results are based on repeated held-out evaluations within TCGA-LIHC; independent external validation therefore remains an important next step. Overall, the comparison indicates that an interpretable multimodal framework can achieve competitive prognostic performance while providing clearer insight into when individual modalities contribute complementary information.
4. Discussion
This study investigated multimodal survival prediction in the TCGA-LIHC cohort using clinical variables, transcriptomic features, and histopathology-derived textual representations across 1-year, 3-year, and 5-year prediction horizons. Survival prediction was formulated as a horizon-specific classification task rather than a continuous time-to-event model, enabling direct comparison of modality-specific and multimodal discrimination at clinically interpretable decision points. Patients with insufficient follow-up were excluded from each horizon-specific task to avoid assigning uncertain outcome labels.
The results demonstrate that survival prediction performance was strongly dependent on the prediction horizon. Across unimodal and multimodal experiments, the 3-year task produced the strongest and most stable performance, whereas 1-year prediction remained challenging across modality combinations. The 5-year task showed moderate performance, with relatively small numerical differences among the strongest clinical, genomic, and fusion models. This pattern suggests that the available clinical, molecular, and histopathology-derived features were most informative for intermediate-term survival prediction in this cohort.
Genomic features provided the strongest standalone prognostic signal, particularly at the 1-year and 3-year horizons. This finding is consistent with prior LIHC survival studies emphasizing the prognostic relevance of transcriptomic signatures. However, the results also show that genomic performance varied by horizon and model configuration. Therefore, while transcriptomic features were the most informative unimodal data source overall, their predictive advantage was not uniform across all survival endpoints.
Clinical variables showed modest standalone discrimination; however, this should not be interpreted as evidence that clinical information has limited prognostic value in hepatocellular carcinoma. Rather, it reflects the restricted clinical feature set available in TCGA-LIHC, which primarily included age, sex, diagnosis, pathological stage, and tumor grade. Established HCC prognostic frameworks integrate three key domains: tumor burden, hepatic functional reserve, and patient performance status. For example, the Barcelona Clinic Liver Cancer (BCLC) strategy and AASLD guidance incorporate liver function, tumor extent, ECOG performance status, and treatment considerations for prognostic stratification and clinical decision-making [28,29]. Several clinically important variables were unavailable in our study, including validated liver-function measures (e.g., Child–Pugh, ALBI, and MELD scores), detailed tumor burden (e.g., lesion number, vascular invasion, and alpha-fetoprotein), treatment history and response, disease etiology, and ECOG performance status. In addition, broader patient health, including comorbidity burden and frailty, has been shown to independently influence HCC outcomes [30,31]. Consequently, the modest clinical ROC-AUC values are more appropriately interpreted as reflecting incomplete characterization of the clinical modality, rather than limited prognostic relevance of clinical factors. In contrast, histopathology-derived textual representations showed their clearest contribution at the 3-year horizon, particularly when combined with genomic features. Although the histopathology-only models achieved modest performance, the Genomics + Histopathology fusion configuration produced the strongest overall result (ROC-AUC = 0.74), suggesting that morphology-informed textual representations provide complementary prognostic information beyond transcriptomic features during the intermediate-term survival window.
A key finding is that multimodal fusion was not uniformly beneficial. The full Clinical + Genomics + Histopathology model was not the highest-performing fusion configuration at any horizon. Instead, the most effective modality combination depended on the prediction endpoint. This finding argues against the assumption that adding more data sources automatically improves survival prediction. In this study, fusion performance depended on modality complementarity rather than the number of modalities included. The statistical analysis reinforced the horizon-dependent nature of multimodal fusion. Differences among the four configurations were detected only at the 3-year horizon, with strong agreement in their rankings across repeated splits. A paired mean comparison identified higher ROC-AUC for Genomics + Histopathology than for Clinical + Histopathology; however, this difference was not confirmed by the exact rank-based sensitivity analysis. The pairwise finding should therefore be viewed as supportive rather than definitive. In addition, the six runs represent repeated partitions of the same TCGA-LIHC cohort rather than independent external cohorts, so the analysis quantifies sensitivity to data splitting and does not establish external generalizability.
The caption-based histopathology representation is a central interpretability contribution of this work. Instead of relying only on opaque latent image embeddings, histopathology patches were transformed into morphology-focused textual descriptions and aggregated into patient-level summaries. This created a human-readable intermediate representation linking image-derived information to downstream prediction. Automated semantic evaluation and expert pathological review supported the plausibility and clarity of the generated descriptions, with expert scores ranging from 4.67 to 4.83 across evaluated criteria. Because the captioning prompt used clinical details as supporting context, the resulting representations should be interpreted as morphology-focused and clinically contextualized rather than purely image-only features.
The interpretability analyses further showed that different modalities supported different forms of explanation. Clinical models were interpreted through Logistic Regression coefficients, genomic models through feature-selection stability and coefficient analysis, and histopathology through caption-derived textual summaries. For the 3-year task, genomic feature selection showed variability across runs, but a subset of repeatedly selected genes contributed more consistently to prediction. The histopathology pipeline complemented these feature-level analyses by providing representation-level interpretability grounded in visible tissue morphology.
Compared with prior LIHC survival prediction studies summarized in Table 11, this work differs in three main ways. First, it evaluates clinical, genomic, and histopathology-derived information within a unified framework. Second, it compares modality contributions across multiple clinically relevant prediction horizons rather than focusing on a single endpoint. Third, it combines leakage-aware probability-level fusion with interpretable histopathology representations. Because prior studies differ in cohort construction, endpoints, modeling strategies, and validation designs, this comparison should be interpreted as contextual rather than as a direct ranking.
Several limitations should be acknowledged. First, the study was conducted using a single TCGA-LIHC cohort, and external validation was not performed. Generalizability to independent LIHC cohorts, other institutions, or other cancer types remains to be established. In addition, threshold-based patch selection does not ensure enrichment for viable tumor and may admit benign parenchyma, stroma, inflammatory tissue, or necrosis. Future work should compare this strategy with pathologist-defined regions of interest, tumor-segmentation models, and attention-based MIL, and should quantify the sensitivity of patient-level summaries to patch-selection strategy.
Second, the horizon-specific sample sizes were limited, especially for the 3-year and 5-year tasks, which may increase variability in model estimates and make small numerical differences difficult to interpret.
Third, survival was modeled as horizon-specific binary classification rather than as a continuous time-to-event process. Although patients with insufficient follow-up were excluded to avoid uncertain labels, this approach does not explicitly model censoring dynamics. Future work should compare this framework with survival-specific approaches such as Cox-based models, random survival forests, or other time-to-event methods.
Fourth, the clinical modality was restricted to a small set of predominantly cross-sectional TCGA variables and did not capture several established determinants of HCC prognostic domains such as hepatic functional reserve (e.g., Child-Pugh, MELD, and ALBI), alpha-fetoprotein, detailed tumor burden, treatment selection and response, ECOG performance status, frailty, or comorbidity burden. This incomplete characterization likely constrained the discrimination of the clinical-only models and limits conclusions regarding the full incremental value of clinical information. Future validation should use richer longitudinal clinical datasets incorporating laboratory measurements, validated liver-function and comorbidity scores, functional-status assessments, and treatment trajectories.
Fifth, the histopathology representation depended on patch selection, caption generation, and summary aggregation. Future experiments should compare image-only captions, clinically contextualized captions, and direct image-embedding baselines to better isolate the contribution of visual morphology. Finally, expert caption evaluation was conducted by a single pathologist on a sampled subset of patch-caption pairs, and model comparisons were reported descriptively without formal statistical testing. Small differences in ROC-AUC should therefore be interpreted cautiously. Under class imbalance, ROC-AUC can obscure clinically important minority-class errors. The absence of non-survivor-class PR-AUC is a limitation; future evaluations should report class-specific PR-AUC, calibration, and clinically relevant operating points in addition to ROC-AUC. In addition, with n = 6 runs, the statistical tests have low power and exact rank-based p-values have limited resolution. One Holm-adjusted paired t-test contrast was significant, whereas no exact Wilcoxon contrast remained significant after correction, demonstrating sensitivity to test assumptions. Future work should use a larger prespecified repeated nested-cross-validation or patient-level bootstrap design, together with external validation.
Sixth, all model development and evaluation were conducted within TCGA-LIHC. Although patient-level separation and OOF stacking reduce internal leakage, they do not establish external transportability. Independent validation is required in multicenter cohorts with compatible clinical, transcriptomic, and histopathology data. Cohorts such as ICGC-LIRI-JP may support validation of clinical and transcriptomic components, whereas validation of the complete framework requires an independent cohort with matched WSIs.
Overall, this study supports a selective view of multimodal learning for LIHC survival prediction. Genomic features provided the strongest standalone signal, histopathology-derived captions contributed most clearly when paired with genomics at the 3-year horizon, and clinical variables were most useful in selected fusion settings. The main conclusion is not that more modalities are always better, but that effective multimodal survival prediction depends on the alignment between modality complementarity and the clinical prediction horizon.
5. Conclusions
This study presented an interpretable multimodal framework for LIHC survival prediction using clinical variables, transcriptomic features, and histopathology-derived textual representations from the TCGA-LIHC cohort. By transforming histopathology whole-slide image patches into morphology-focused captions and aggregating them into patient-level summaries, the framework introduced a human-readable representation of pathology information that could be integrated with clinical and genomic features. The results showed that survival prediction was strongly horizon-dependent. The 3-year task produced the strongest overall performance, while 1-year prediction remained more challenging and 5-year prediction showed smaller differences among modality combinations. Genomic features provided the strongest standalone signal overall, particularly at the 1-year and 3-year horizons. Histopathology-derived textual representations showed modest standalone performance but contributed most clearly when combined with genomic features in the 3-year fusion setting.
Importantly, multimodal fusion did not consistently outperform simpler modality combinations or the strongest unimodal models. The full Clinical + Genomics + Histopathology model was not the best-performing fusion configuration at any horizon, indicating that effective multimodal learning depends on modality complementarity rather than the number of modalities included. Overall, these findings support a selective and interpretable approach to multimodal LIHC survival prediction, in which modality choice is guided by the prediction horizon and the complementary information contributed by each data source.
Author Contributions
Conceptualization, M.K. and M.M.; Methodology, M.K. and M.M.; Software, M.K.; Validation, M.K. and M.M.; Formal analysis, M.K.; Investigation, M.K.; Data curation, M.K.; Writing—original draft preparation, M.K.; Writing—review and editing, M.M.; Visualization, M.K.; Supervision, M.M.; Project administration, M.M. All authors have read and agreed to the published version of the manuscript.
Funding
This research received no external funding.
Institutional Review Board Statement
Ethical review and approval were not required for this study because it used publicly available, de-identified TCGA-LIHC data obtained from the Genomic Data Commons and The Cancer Imaging Archive. No new human participant data were collected, and no identifiable private information was accessed.
Informed Consent Statement
Not applicable. This study used publicly available, de-identified TCGA-LIHC data from the Genomic Data Commons and The Cancer Imaging Archive, and no identifiable patient information was accessed or reported.
Data Availability Statement
The data analyzed in this study are publicly available. Clinical and transcriptomic data were obtained from the Genomic Data Commons Data Portal, and histopathology whole-slide images were obtained from The Cancer Imaging Archive through the TCGA-LIHC collection. Derived analysis files are available from the corresponding author upon reasonable request, subject to the data-use policies of the original repositories.
Acknowledgments
The authors thank Sarita Sharma for her valuable guidance and support during this research. The authors also acknowledge the expert pathologist who contributed to the evaluation of the generated histopathology captions. The authors are grateful to the Department of Applied Data Science at San José State University for providing academic support and computational resources for this study.
Conflicts of Interest
The authors declare no conflicts of interest.
References
- Brown, J.S.; Amend, S.R.; Austin, R.H.; Gatenby, R.A.; Hammarlund, E.U.; Pienta, K.J. Updating the definition of cancer. Mol. Cancer Res. 2023, 21, 1142–1147. [Google Scholar] [CrossRef] [Scilit] [PubMed]
- World Health Organization. Cancer; World Health Organization: Geneva, Switzerland, 2026; Available online: https://www.who.int/news-room/fact-sheets/detail/cancer (accessed on 13 June 2026).
- Gao, J.; Han, S.; Gu, J.; Wu, C.; Mu, X. The prognostic and therapeutic role of histone acetylation modification in LIHC development and progression. Medicina 2023, 59, 1682. [Google Scholar] [CrossRef] [Scilit] [PubMed]
- Hoffman, S.; Podgurski, A. The Use and Misuse of Biomedical Data: Is Bigger Really Better? Am. J. Law Med. 2013, 39, 497–538. [Google Scholar] [CrossRef] [Scilit] [PubMed]
- Xu, H.; Xu, Q.; Cong, F.; Kang, J.; Han, C.; Liu, Z.; Madabhushi, A.; Lu, C. Vision transformers for computational histopathology. IEEE Rev. Biomed. Eng. 2024, 17, 63–79. [Google Scholar] [CrossRef] [Scilit] [PubMed]
- Erickson, B.J.; Kirk, S.; Lee, Y.; Bathe, O.; Kearns, M.; Gerdes, C.; Rieger-Christ, K.; Lemmerman, J. The Cancer Genome Atlas Liver Hepatocellular Carcinoma Collection (TCGA-LIHC) (Version 5) [dataset]. Cancer Imaging Arch. 2016. [Google Scholar] [CrossRef] [Scilit]
- Ding, S.; Yi, X.; Gao, J.; Huang, C.; Zheng, S.; Wu, L.; Cai, Z. Prognostic risk model of LIHC T-cells based on scRNA-seq and RNA-seq and the regulation of the tumor immune microenvironment. Discov. Oncol. 2024, 15, 540. [Google Scholar] [CrossRef] [Scilit] [PubMed]
- Tang, K.; Liu, M.; Zhang, C. Construction of a prognostic model and identification of key genes in liver hepatocellular carcinoma based on multi-omics data. Sci. Rep. 2025, 15, 13393. [Google Scholar] [CrossRef] [Scilit] [PubMed]
- Zhu, W.; Ru, L.; Ma, Z. Identification of a novel four-gene signature correlated with the prognosis of patients with hepatocellular carcinoma: A comprehensive analysis. Front. Oncol. 2021, 11, 626654. [Google Scholar] [CrossRef] [Scilit] [PubMed]
- An, L.N.; Du, L.; Wang, L.L.; Chen, J.; Wang, X.R.; Duan, J.P. Comprehensive analysis of an autophagy-related prognostic model for predicting survival based on TCGA and ICGC database in hepatocellular carcinoma patients. J. Gastrointest. Oncol. 2022, 13, 3154–3168. [Google Scholar] [CrossRef] [Scilit] [PubMed]
- Su, L.; Zhang, G.; Kong, X. A novel five-gene signature for prognosis prediction in hepatocellular carcinoma. Front. Oncol. 2021, 11, 642563. [Google Scholar] [CrossRef] [Scilit] [PubMed]
- Hou, J.; Zhang, R.; Xie, Y.; Li, C.; Qin, W. Multimodal deep learning for cancer prognosis prediction with clinical information prompts integration. npj Digit. Med. 2026, 9, 76. [Google Scholar] [CrossRef] [Scilit] [PubMed]
- Tomczak, K.; Czerwińska, P.; Wiznerowicz, M. ReviewThe Cancer Genome Atlas (TCGA): An immeasurable source of knowledge. Contemp. Oncol. 2015, 19, A68–A77. [Google Scholar] [CrossRef] [Scilit] [PubMed]
- National Cancer Institute. Comprehensive Cancer Information; National Cancer InstituteL: Bethesda, MD, USA. Available online: https://www.cancer.gov (accessed on 13 June 2026).
- National Human Genome Research Institute. National Human Genome Research Institute Home; National Human Genome Research Institute: Bethesda, MD, USA. Available online: https://www.genome.gov (accessed on 13 June 2026).
- Zheng, Y.; Jiang, Z.; Zhang, H.; Xie, F.; Ma, Y.; Shi, H.; Zhao, Y. Histopathological whole slide image analysis using context-based CBIR. IEEE Trans. Med. Imaging 2018, 37, 1641–1652. [Google Scholar] [CrossRef] [Scilit] [PubMed]
- Heath, A.P.; Ferretti, V.; Agrawal, S.; An, M.; Angelakos, J.C.; Arya, R.; Bajari, R.; Baqar, B.; Barnowski, J.H.; Burt, J.; et al. The NCI Genomic Data Commons. Nat. Genet. 2021, 53, 257–262. [Google Scholar] [CrossRef] [Scilit] [PubMed]
- Zhang, T.; Kishore, V.; Wu, F.; Weinberger, K.Q.; Artzi, Y. BERTScore: Evaluating text generation with BERT. arXiv 2020, arXiv:1904.09675. [Google Scholar] [CrossRef] [Scilit]
- Papineni, K.; Roukos, S.; Ward, T.; Zhu, W.J. BLEU: A method for automatic evaluation of machine translation. In Proceedings of the 40th Annual Meeting of the Association for Computational Linguistics, Philadelphia, PA, USA, 6–12 July 2002; pp. 311–318. [Google Scholar] [CrossRef] [Scilit]
- Lin, C.Y. ROUGE: A package for automatic evaluation of summaries. In Text Summarization Branches Out: Proceedings of the ACL-04 Workshop, Barcelona, Spain, 25–26 July 2004; Association for Computational Linguistics: Barcelona, Spain, 2004; pp. 74–81. [Google Scholar]
- Gu, J.; Jiang, X.; Shi, Z.; Tan, H.; Zhai, X.; Xu, C.; Li, W.; Shen, Y.; Ma, S.; Liu, H.; et al. A survey on LLM-as-a-Judge. Innovation 2026, 7, 101253. [Google Scholar] [CrossRef] [Scilit] [PubMed]
- LaValley, M.P. Logistic regression. Circulation 2008, 117, 2395–2399. [Google Scholar] [CrossRef] [Scilit] [PubMed]
- Pal, M. Random forest classifier for remote sensing classification. Int. J. Remote Sens. 2005, 26, 217–222. [Google Scholar] [CrossRef] [Scilit]
- Friedman, J.H. Stochastic gradient boosting. Comput. Stat. Data Anal. 2002, 38, 367–378. [Google Scholar] [CrossRef] [Scilit]
- Blagus, R.; Lusa, L. SMOTE for high-dimensional class-imbalanced data. BMC Bioinform. 2013, 14, 106. [Google Scholar] [CrossRef] [Scilit] [PubMed]
- Hajian-Tilaki, K. Receiver operating characteristic (ROC) curve analysis for medical diagnostic test evaluation. Casp. J. Intern. Med. 2013, 4, 627–635. [Google Scholar] [CrossRef] [Scilit]
- Sokolova, M.; Lapalme, G. A systematic analysis of performance measures for classification tasks. Inf. Process Manag. 2009, 45, 427–437. [Google Scholar] [CrossRef] [Scilit]
- Reig, M.; Sanduzzi-Zamparelli, M.; Forner, A.; Rimola, J.; Ferrer-Fàbrega, J.; Burrel, M.; Garcia-Criado, Á.; Díaz, A.; Llarch, A.; Iserte, G.; et al. BCLC strategy for prognosis prediction and treatment recommendations: The 2026 update. J. Hepatol. 2026, 84, 631–654. [Google Scholar] [CrossRef] [Scilit] [PubMed]
- Singal, A.G.; Llovet, J.M.; Yarchoan, M.; Mehta, N.; Heimbach, J.K.; Dawson, L.A.; Jou, J.H.; Kulik, L.M.; Agopian, V.G.; Marrero, J.A.; et al. AASLD Practice Guidance on prevention, diagnosis, and treatment of hepatocellular carcinoma. Hepatology 2023, 78, 1922–1965. [Google Scholar] [CrossRef] [Scilit] [PubMed]
- Shinkawa, H.; Tanaka, S.; Takemura, S.; Amano, R.; Kimura, K.; Nishioka, T.; Miyazaki, T.; Kubo, S. Predictive value of the age-adjusted Charlson comorbidity index for outcomes after hepatic resection of hepatocellular carcinoma. World J. Surg. 2020, 44, 3901–3914. [Google Scholar] [CrossRef] [Scilit] [PubMed]
- Waller, K.M.J.; Prince, D.S.; Lai, E.H.Y.; Levy, M.T.; Strasser, S.I.; McCaughan, G.W.; Teng, M.L.P.; Huang, D.Q.; Liu, K. The Liver Frailty Index predicts survival in systemic therapy for hepatocellular carcinoma: A multicentre prospective cohort study. ESMO Gastrointest. Oncol. 2024, 3, 100043. [Google Scholar] [CrossRef] [Scilit] [PubMed]
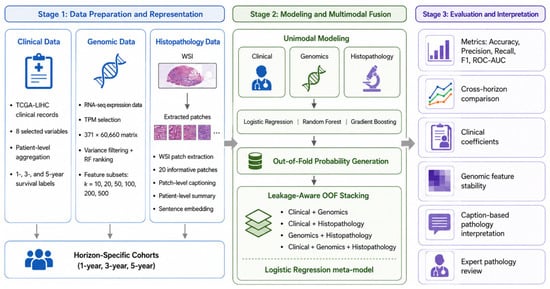
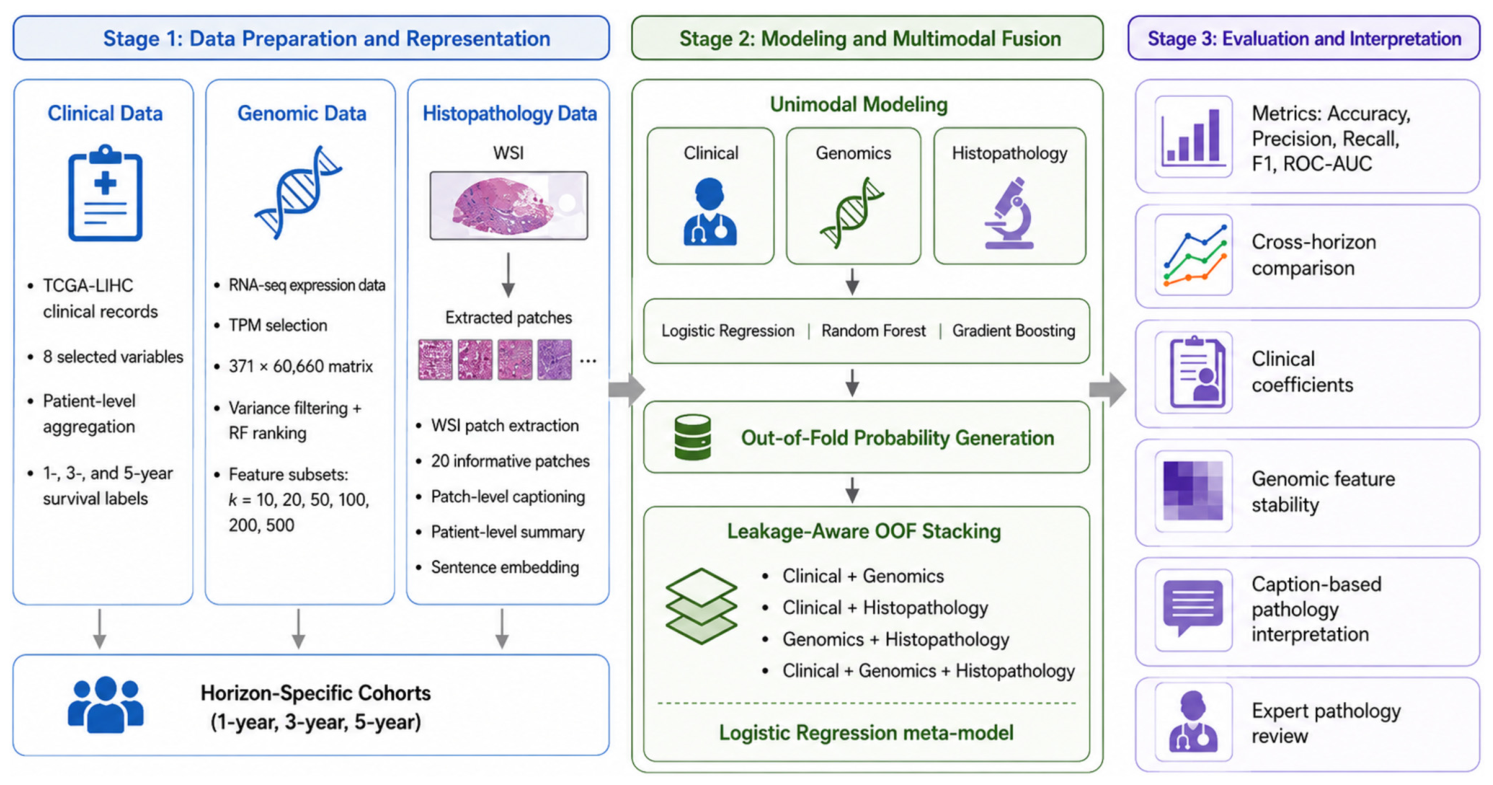
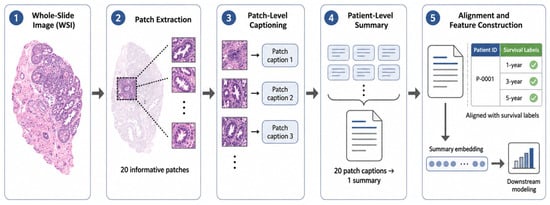
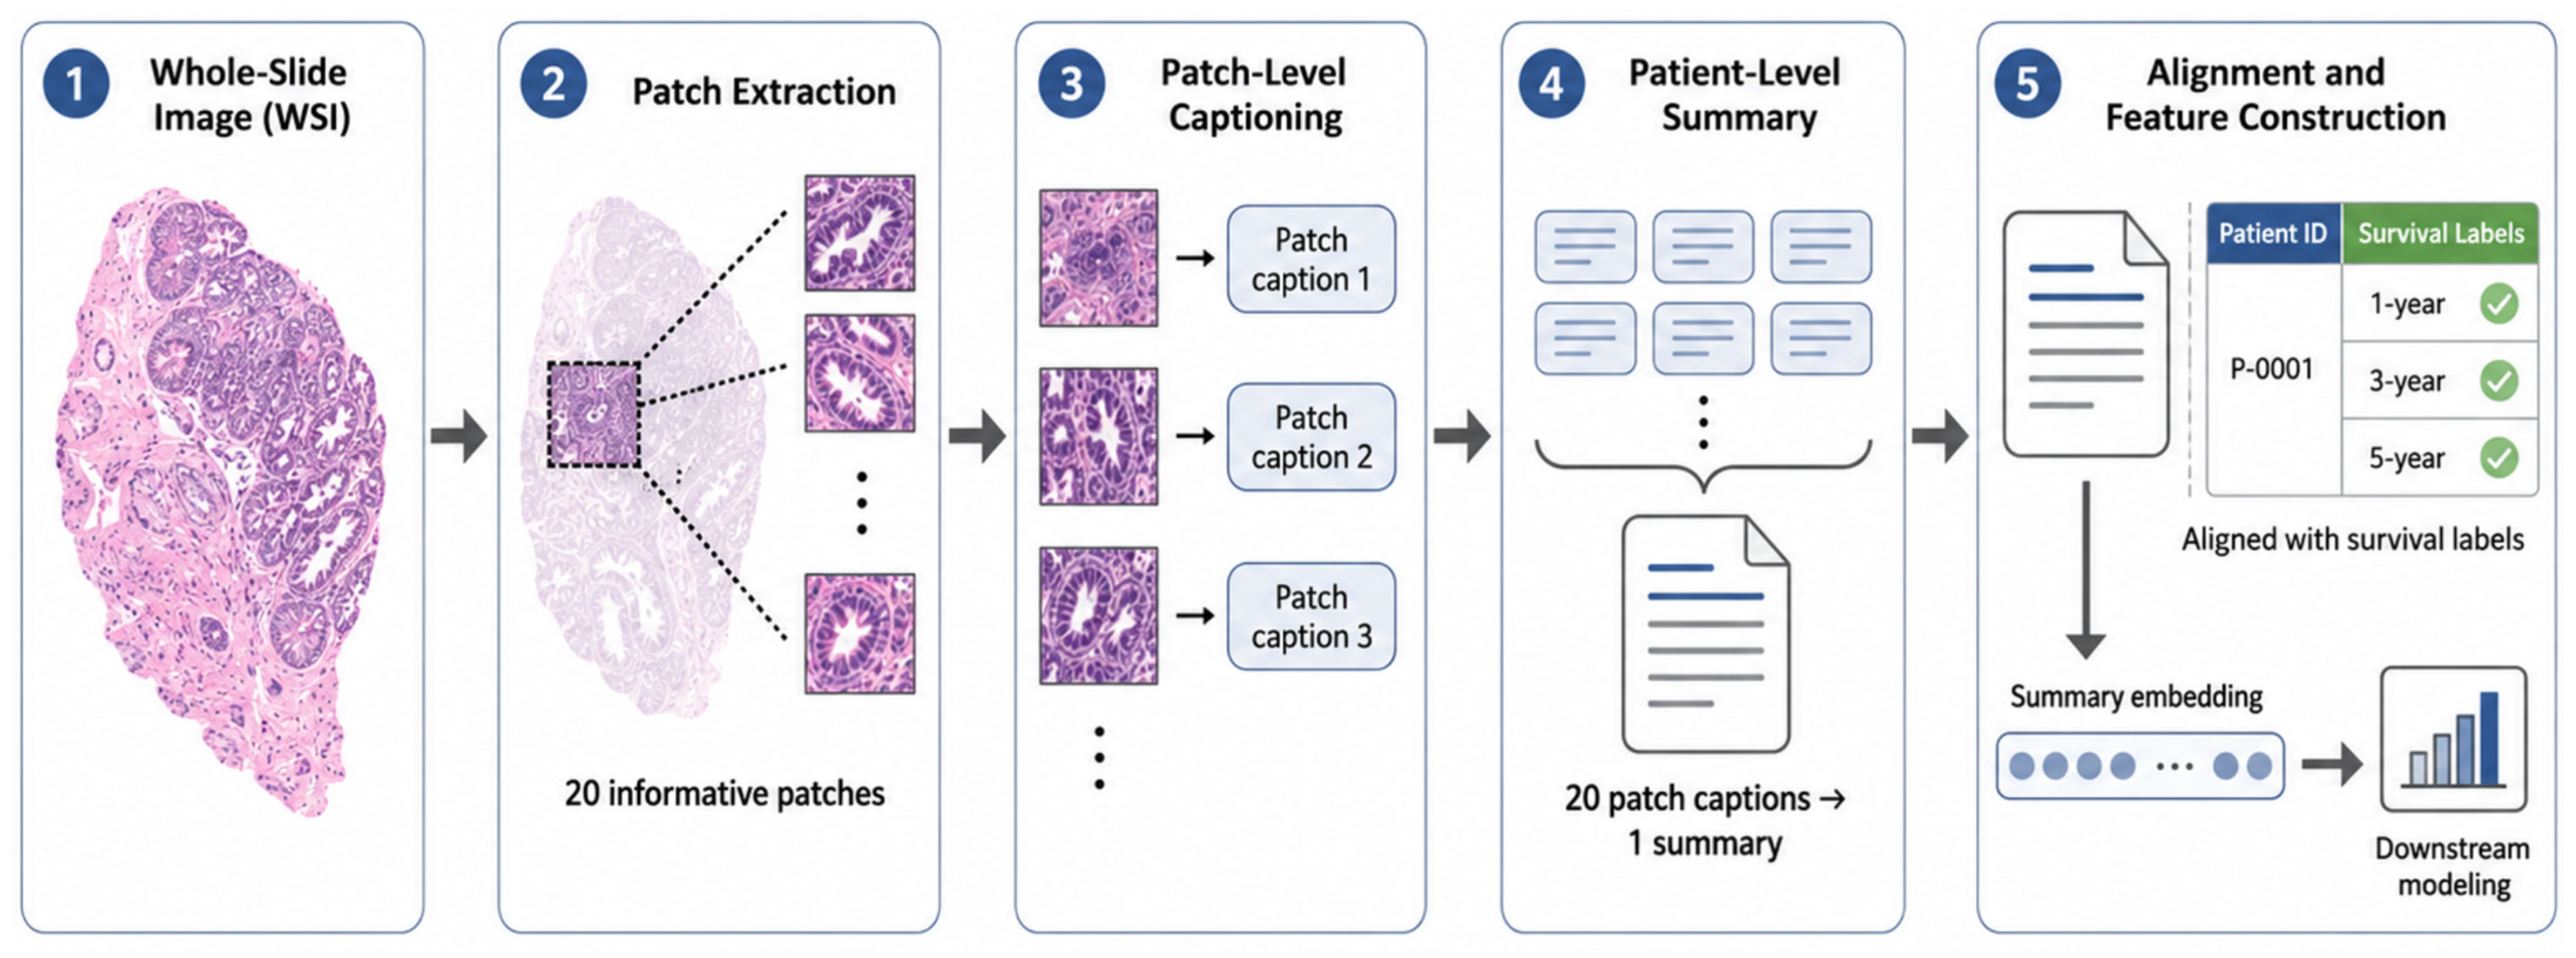
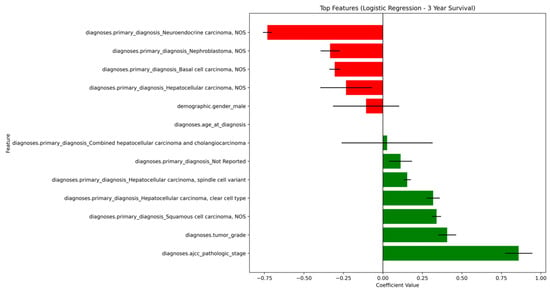
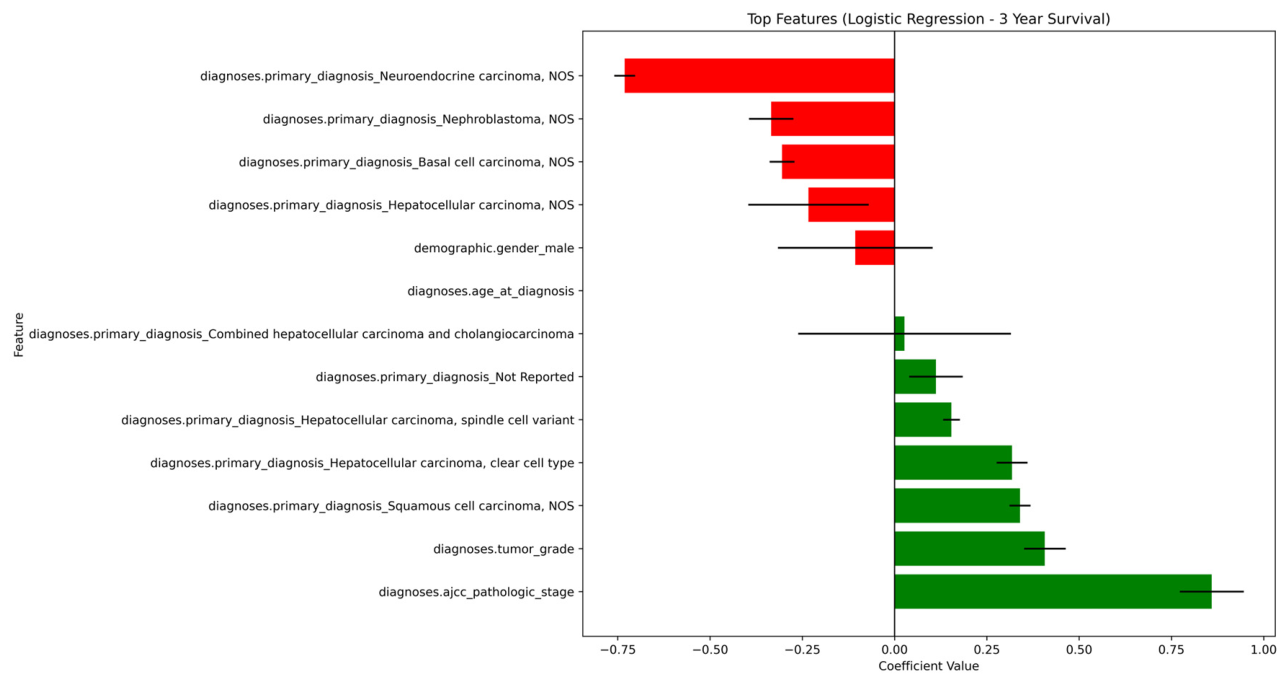
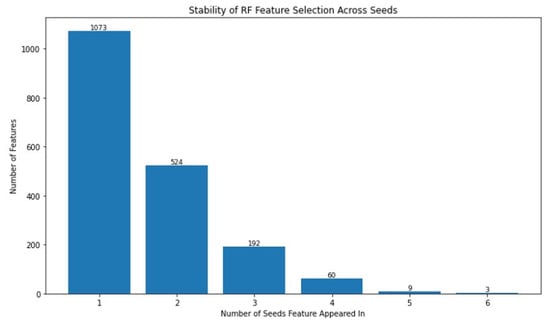
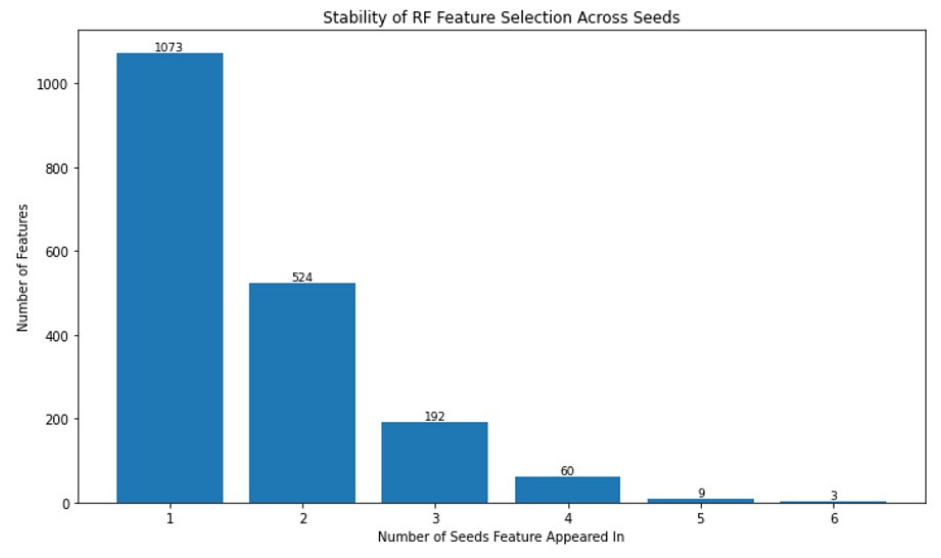
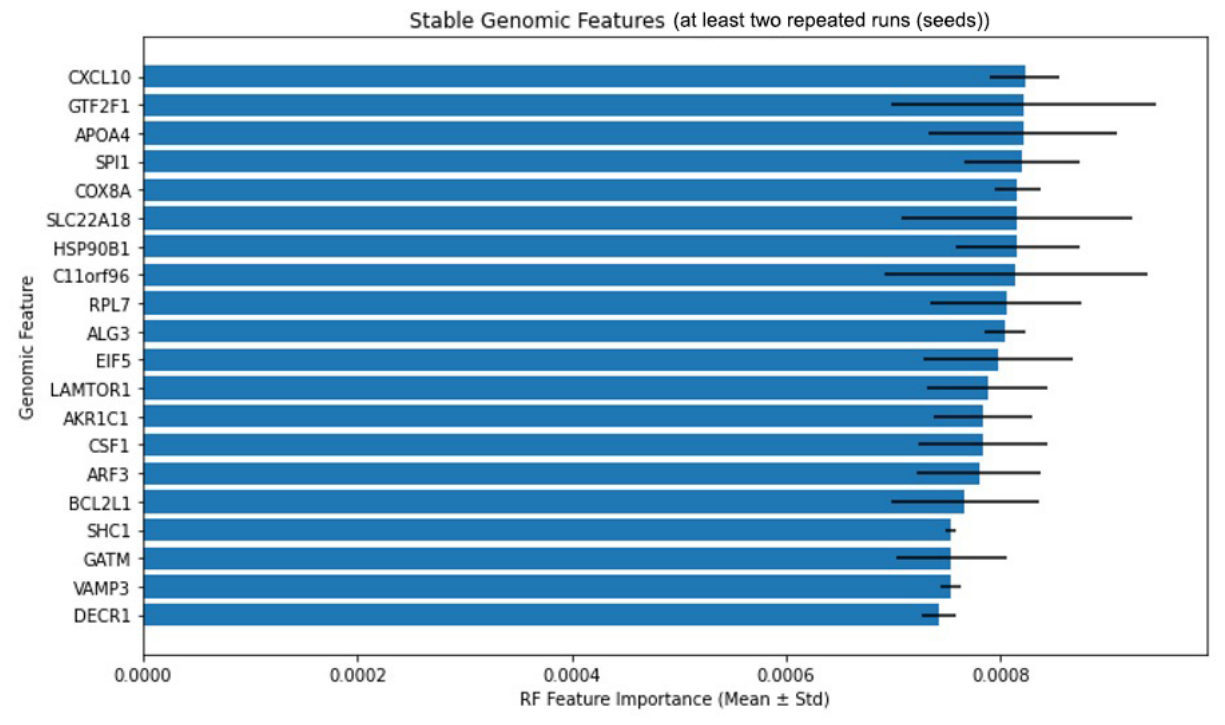
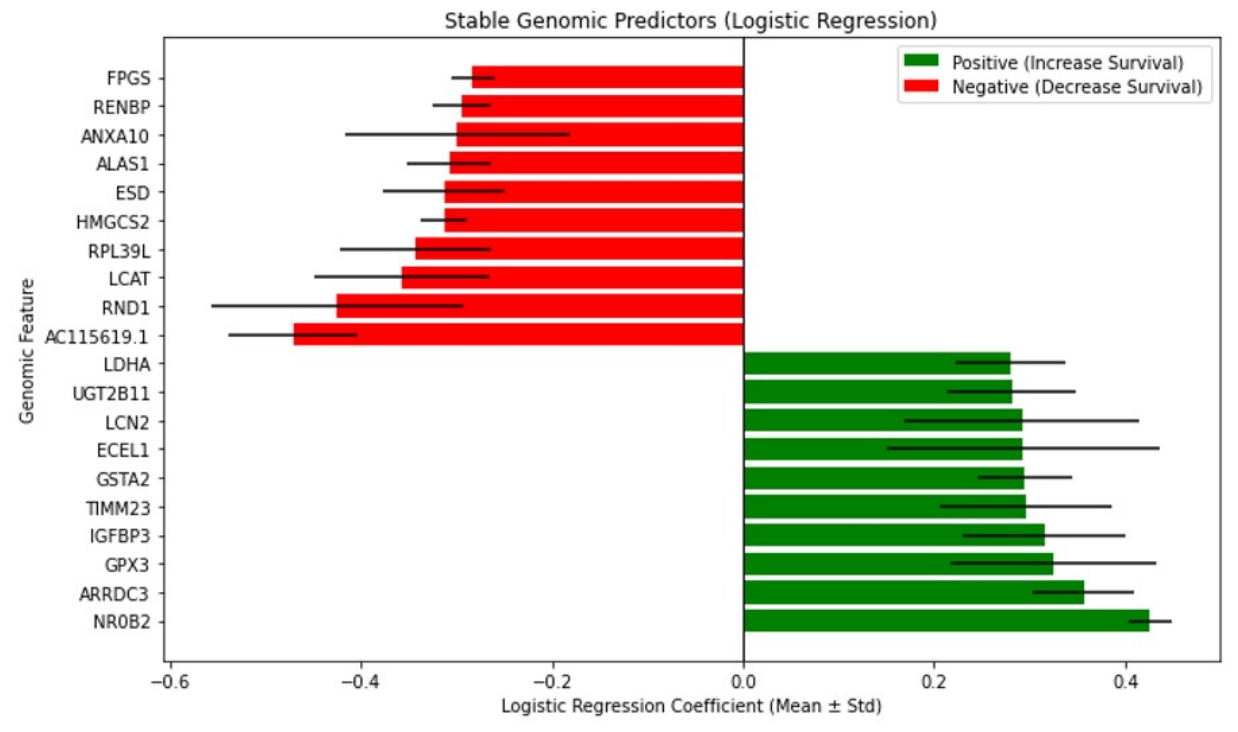

Disclaimer/Publisher’s Note: The statements, opinions and data contained in all publications are solely those of the individual author(s) and contributor(s) and not of MDPI and/or the editor(s). MDPI and/or the editor(s) disclaim responsibility for any injury to people or property resulting from any ideas, methods, instructions or products referred to in the content. |
© 2026 by the authors. Licensee MDPI, Basel, Switzerland. This article is an open access article distributed under the terms and conditions of the Creative Commons Attribution (CC BY) license.