


Abstract
Coordinated and bot-like activity on social media is usually studied with supervised detectors that need rich account data such as profiles, timelines, and follower networks, which is increasingly hard to obtain. We ask what can be established about a single account’s reply ecosystem from its publicly visible posts and replies alone, with no profiles, timelines, or follower data. In a case study of the reply ecosystem of an official political party account (23,953 replies by 1985 accounts, December 2025 to January 2026), we compute profile-free behavioral features covering text duplication, character-level entropy, timing regularity, reply latency, and post coverage, complemented by a co-commenting network analysis, and group active accounts with unsupervised density-based clustering. The clustering, combined with two transparent labeling rules, separates three behavioral tiers: templated amplifiers defined by text reuse, persistent responders with human-like text but extreme volume and coverage, and an organic remainder. The two non-organic tiers comprise 5.4% of accounts, yet produce 53.5% of all comments, a composition that is stable under resampling and threshold sensitivity analysis, with a failure mode that is only conservative, since over-strict settings leave a tier unassigned rather than reshaping it. The platform’s own spam flags, never used as input, rise steadily from organic accounts to templated amplifiers, consistent with the behavioral grouping.
1. Introduction
The reply threads beneath an official political account are among the most visible surfaces of online political communication, because every reader who opens a post also sees what appears to be the public’s reaction to it. These reply streams have become an object of study in their own right: engagement with them has been used to gauge the contentious reception of presidential posts [1], their design has been shown to obscure rather than reflect aggregate opinion [2], and they are the documented venue of coordinated reply attacks in state-linked influence operations [3]. That visibility makes reply ecosystems a prime target for coordinated amplification, in which a small set of accounts manufactures the impression of broad support or rejection, a manipulation pattern documented since early work on social bots and political astroturfing [4,5]; in the strongest cases, such operations break out of their platform of origin, reaching mainstream media and even triggering policy responses [6]. We therefore take the reply ecosystem itself, not the individual account, as the unit of analysis, and ask what one account’s posts and replies, gathered from the public web interface of X (formerly Twitter), can establish about its structure when no profile pages, timelines, or follower graphs are available.
The default instrument for such questions has been supervised bot detection of individual accounts, built on rich, platform-furnished data. Since the influential characterization of social bots as software agents that mimic humans and interact unnoticed with real users [4], the field’s most widely used tool, Botometer (https://botometer.osome.iu.edu, accessed on 23 June 2026), computes more than 1000 features spanning profile, friend, network, temporal, content, and sentiment classes, fetching each account’s recent timeline and mention stream through the platform’s application programming interface (API) [7]. Surveys find such feature-based methods the most widespread, leaning heavily on profile metadata such as account age and follower counts [8]; deep-learning systems draw on the same data, with account age and network centrality alone contributing nearly half of the feature importance in one recent model [9]; the largest graph-based benchmark at the time of its release rests on profile metadata, follow relations, and user timelines [10]. Still other approaches presuppose comparably generous access, from per-account timeline crawls [11] and repeated whole-network snapshots including follow relations [12] to tweeting-device metadata [13] and 233 GB of API downloads [14].
The paradigm is fragile by its own architects’ account. There is no agreed operational definition of a social bot [7,8], labels are proxies for ground truth, and labeled datasets contradict one another [7]. Detectors trained on different data disagree about the same accounts, and substantive conclusions can hinge on the choice of score cutoff [7,15]. These failures concentrate on the accounts that matter most. Human-mimicking bots degrade accuracy sharply for models and human annotators alike, exactly in the ambiguous mid-range where partially automated “cyborg” accounts plausibly fall [8,9,13,15]. A decade of adversarial evolution between bots and detectors has produced accounts that mix automated and human-driven behavior in ways that “cannot be accounted for with simple binary labels” [16]. We therefore make measurement claims, not detection claims, so that “bot-like” throughout names a behavioral signature rather than an assertion about who operates an account.
That same decade also taught a constructive lesson, namely a shift from scoring accounts in isolation to detecting coordination at the group level [16], a direction that recent surveys also document [8]. Coordination traces left in the message stream distinguish court-documented astroturfing accounts better than the individual account characteristics used in bot detection [5], a pattern that replicates across dozens of state-linked campaigns worldwide [17]. Coordination networks built from arbitrary shared behavioral traces uncover influence campaigns without supervision or account labels [18], coordination is better treated as a spectrum than as a binary property [19], and fused behavior-only similarity networks identify information-operation drivers with precision above 0.95 [20]. Operational measurement frameworks point the same way, since traffic-manipulation measurement built on three aggregate traffic indicators [21] and impact assessment built on observable, replicable indicators [6] both operate on minimal data. Behavior-only features also carry most of the discriminative signal, since a behavioral-sequence representation with no profile or follower features matches the 1000-feature Botometer set almost exactly (AUC 0.966 vs. 0.973) [15].
Meanwhile, the data regime that the supervised paradigm presumes no longer exists. More than 33,000 studies were built on Twitter’s free and academic APIs between 2006 and 2024; in 2023, the platform dismantled academic access and priced its Enterprise API at a reported USD 42,000 per month, with published output already declining [22]. Researchers name the paywall as an obstacle to bot research, even recent detection studies still train on labeled corpora collected in 2017–2019 [15], and public detection tools can stop working outright [8]. Methods that require only what any browser can display are now the reproducible path. Yet even the group-level coordination methods above presuppose richer access than that, relying on repost (retweet) and hashtag traces across many accounts, follower information, or labeled campaigns as anchors. The gap this study addresses is, to our knowledge, the absence of a worked demonstration of how far a strictly profile-free lens, applied to nothing but one account’s public reply threads, can go in characterizing the structure of its reply ecosystem, and of where that lens stops.
This article treats the minimal-data constraint as its contribution and is deliberately designed as a single-case study: one monitored account, one platform, one two-month window, with no claim that the structure we find generalizes beyond this setting. We study the reply ecosystem of the official account of a political party in a European multi-party democracy (the monitored account), with replies written in a Slavic language, and make three contributions. First, a profile-free behavioral feature set computable from an account’s posts and replies alone (text duplication and templating, character entropy, timing regularity, reply latency, and cross-post coverage), complemented by a co-commenting network analysis. Second, a three-tier behavioral map of a real political reply ecosystem comprising 23,953 comments by 1985 accounts, obtained with density-based clustering [23] and reported as graded tiers (templated amplifiers, persistent responders, and organic accounts, with a descriptively treated sporadic tail) rather than as bot/human labels. Third, an external comparison of the tiers with the platform’s own spam-moderation decisions, together with a reproducible end-to-end pipeline. Section 2 describes the data and methods, Section 3 reports the results, Section 4 discusses what the minimal-data lens can and cannot establish, and Section 5 concludes.
2. Materials and Methods
2.1. Data Collection and Ethics
We study the reply ecosystem of a single monitored account: the official account of a political party in a European multi-party democracy on X. All posts published by this account across December 2025 and January 2026 and all public replies to them were collected through the platform’s public web interface; no API access was used, and no profile pages, timelines, or follower information were retrieved at any point. Collection used an automated workflow that retrieved each post’s reply thread through the platform’s standard web interface, reading it exactly as it appears to a reader and expanding it in full, including the replies shown behind the Show more replies and Show probable spam controls. Replies that appear only behind the Show probable spam control were recorded as flagged, and all others as visible; all fields were taken from the displayed page at the moment of capture, and capture sessions were repeated across the observation window, so most threads were visited more than once. After deduplication of repeated captures (on the post link, author handle, timestamp, and comment text), the corpus comprises 704 root posts and 23,953 replies from 1985 unique commenting accounts. Each reply carries seven fields: the root-post identifier, the author handle, a UTC timestamp at minute resolution, the comment text, like and view counts, and the platform’s own moderation state at collection time (visible versus flagged as probable spam). Hour-of-day features and diurnal profiles are computed in the local time of the monitored account; the UTC offset is withheld as part of case anonymization.
Root-post timestamps were taken from the earliest captured row of the monitored account on each post; its own follow-up replies and rare comments timestamped before their root post were excluded. Because the earliest captured row only proxies the true publication time and can postdate it, measured latencies carry a downward bias for the affected posts. The bias is one-sided and bounded, because a proxy timestamp can only be later than the true publication time, so a reply’s measured latency can only understate its true delay, by at most the interval between the post’s publication and our first capture of it. Because capture sessions swept the recent posts of the single monitored account together, this interval is a property of the post, not of who replies to it, so it shifts the measured latencies of all commenting accounts on the same post equally and has no obvious mechanism for differentially distorting one behavioral tier. We nevertheless treat latency conservatively throughout: latency contrasts across tiers are read as ordinal rather than exact, neither tier-labeling rule uses any latency quantity, and Section 3.4 shows that the persistent-responder group remains co-located in a single cluster when all latency-derived features are removed from the clustering.
All collected content was publicly visible and no interaction with any user took place. Author handles were pseudonymized at ingestion. The monitored account maps to a fixed token (SEED) and every other handle, including handles that appear only inside mention text, is mapped to a sequential identifier (U0001, U0002, …); the handle-to-pseudonym map is stored separately and is never published. All downstream analysis operates exclusively on the pseudonymized event stream. No comment text is quoted or reproduced in this article, and results are reported only as aggregate statistics and per-account derived features. We deliberately withhold the identity of the party, the country, and the language (reported only as a Slavic language) because naming the case would politicize the findings and expose individual users, whose behavior, not identity or stance, is what we characterize. We note that this withholding guards against casual identification rather than against a determined adversary, since a reader willing to enumerate candidate accounts and match aggregate counts could conceivably re-identify the case. We have therefore limited the reported detail to what the analysis requires.
2.2. Behavioral Features
From the pseudonymized events, we compute 19 per-account features in six groups, all obtainable from posts and replies alone; Table A1 in Appendix A lists and defines every feature alongside its variable name in the analysis pipeline, and the accompanying text in the appendix specifies the operational details (text normalization, tokenization, duplicate detection, and the near-duplicate similarity settings) needed to reproduce each feature exactly. Automation/templating (5): exact-duplicate rate, near-duplicate rate, cross-account duplicate share (a time-unconstrained analogue of the “co-tweeting” signal of [5], in the platform’s current terms “co-posting”), a periodicity score on inter-comment intervals, and URL rate. Content complexity (3): the mean and standard deviation of character-level Shannon entropy [24] and the type–token ratio; character-level entropy is language-agnostic, which matters for a non-English corpus. Temporal (3): coefficient of variation in inter-arrival times, hour-of-day entropy, and mean inter-arrival time. Interaction/latency (3): mean reply latency, its interquartile range, and the early-boost rate. Persistence (4): comment volume, post coverage, active-days share, and comments per covered post. Targeting (1): mention rate.
The minimal-data constraint also dictates what we cannot measure. Three feature families that are standard in detection pipelines were degenerate on this corpus and excluded after inspection: reply-depth features (the collection does not capture thread structure, so every reply attaches to its root post), client-source concentration (posting-client metadata is not exposed by the web interface), and semantic lexicon features (built for English; they were near-constant on this Slavic-language text). The exclusion criterion was strict degeneracy, so a family was dropped only if it was structurally unmeasurable in this collection or near-constant across accounts. The early-boost rate, although small corpus-wide (Section 3.2), is well defined for every account and varies across them, and was therefore retained. The captured like and view counts are also deliberately excluded from the feature matrix for a different reason: they measure attention received rather than behavior produced, are shaped by the platform’s ranking and by other users’ actions, and grow with the interval between posting and capture, so including them would conflate an account’s own conduct with its audience and with capture timing. They are retained in the underlying event data for descriptive purposes only. Profile-dependent features such as account age, follower counts, and profile completeness are unavailable by design. One account property does travel with every comment, namely the handle itself. Handle composition (digit share, trailing digit runs of the kind produced by automatic handle suggestion, and length) is often associated with bulk account creation; we keep these properties out of the feature matrix and report them only as a descriptive check in Section 3.4.
2.3. Clustering and Tier Rules
The 668 accounts with at least five comments enter the clustering; the remaining 1317 accounts form the sporadic tail, which is reported only through aggregate descriptive statistics. The cutoff is a minimum-events requirement, because temporal, latency, and duplication features cannot be estimated meaningfully from fewer than a handful of comments. Features are z-standardized (median imputation for non-finite values), embedded with Uniform Manifold Approximation and Projection (UMAP), a nonlinear dimensionality-reduction method [25] (n_neighbors , min_dist , 5 components, Euclidean metric, fixed random seed), and clustered with HDBSCAN (min_cluster_size, min_samples ) [23]. We report these hyperparameters verbatim for reproducibility; min_cluster_size sets the smallest admissible cluster at roughly 5% of the clustered accounts, and n_neighbors matches that scale. We use a density-based algorithm precisely because it assigns weakly structured accounts to a noise label rather than coercing them into pseudo-coordinated groups. On this corpus, HDBSCAN finds seven clusters of 99, 89, 72, 71, 64, 45, and 39 accounts, and assigns 189 accounts (28% of the 668) to noise. A k-means baseline with on the standardized features is retained for comparison. All 19 features enter this clustering; the labeling rules below then name the tiers using a small, interpretable subset, while the full feature set serves to characterize each resulting tier (Table 1; Section 3.2) rather than to define it.
Table 1.
Behavioral tiers of the reply ecosystem. Account-level medians per tier; the flagged share is comment-weighted (share of the tier’s comments hidden by the platform as probable spam). Coverage is the share of the 704 monitored posts an account commented on.
In plain terms, the two non-organic tiers stand out in opposite ways. Templated amplifiers post the same or near-identical text repeatedly, often the very wording other accounts use; this copy-and-paste style amplifies a message and adds noise to the thread. Persistent responders, by contrast, write varied, human-looking text but appear under a large share of the channel’s posts and stay active on most days; the two also differ in reply timing, the persistent responders being the quickest to reply, with the templated amplifiers slowest in point estimate (Section 3.2). Two transparent rules make these intuitions precise and reproducible. At the cluster level, a cluster’s accounts become persistent responders if the cluster’s median post coverage exceeds 5× the corpus median and its median active-days share exceeds 0.5, i.e., its median member commented on more than half of the days in the window. In numbers, the median coverage over the 668 clustered accounts is 1.7%, so the coverage cutoff is 8.5%, about 60 of the 704 posts. Exactly one cluster, of 71 accounts, satisfied this rule. At the account level, any account, clustered or noise, with exact-duplicate rate , cross-account duplicate share , or near-duplicate rate , is labeled a templated amplifier, overriding cluster membership. Six of the 43 templated amplifiers sat inside the persistent-responder cluster and were reassigned; of the remainder, 30 come from two of the other clusters and seven from the noise set. All remaining accounts, including the 182 noise accounts not captured by the duplication rule, are labeled organic. Folding noise into the organic remainder is conservative with respect to the two non-organic tiers, since no account enters those tiers on the strength of a weak cluster assignment, only through the explicit coverage-and-persistence or duplication rules. Thresholds were fixed after inspecting the empirical feature distributions and before any of the robustness or consistency analyses. The duplication cutoffs sit in the sparse region separating the organic mass near zero (median exact-duplicate rate 0.00) from the templated mode far above it (median 0.41), and the coverage and active-days cutoffs demand persistence several times the typical engagement level. They remain descriptive choices for this corpus rather than calibrated constants, so Section 3.4 reports a sensitivity analysis that sweeps every threshold (each duplication cutoff over five values spanning ±0.10 of its base, all three jointly scaled from 0.6× to 1.4×, the coverage factor from 3× to 7×, and the active-days cutoff from 0.3 to 0.7) and re-derives the tier composition at each setting. The tiers are descriptive characterizations of behavior; they assert nothing about how the accounts are operated. The templated amplifier label names the observable effect of repeated, cross-posted text, not an intent, while persistent responders names a pattern of sustained presence and co-activity, not an inference of orchestration, since the rule that assigns it measures persistence only, and whether the accounts are jointly operated cannot be determined from these data (Section 4).
2.4. Robustness and External Consistency
Ground-truth labels are absent, since operator identity is not observable from public behavior alone, existing bot-label corpora contradict one another [7], and detectors trained on them disagree about the same accounts [15]. No claim of detection performance is therefore possible, and we make none; the analyses in this subsection instead probe how robust the exploratory behavioral map is and how it compares with one external signal. We probe along four axes. First, stability: 20 resamples each draw a random 80% of the clustered accounts without replacement, and the full procedure (standardization, UMAP re-embedding, HDBSCAN) is re-run from scratch with a fresh seed. Agreement with the reference partition is scored by adjusted mutual information (AMI, a chance-corrected measure of agreement between two clusterings that is 0 for random labelings and 1 for identical ones) over the resampled accounts, both on the raw HDBSCAN cluster labels and, because the manuscript’s conclusions concern the final tiers, on the tier labels after the rule layer is re-applied to each resample. Because each resample is re-embedded with a fresh seed, the reported variability conflates resampling variability with UMAP seed stochasticity. We also report the silhouette of non-noise points (a cohesion measure between and 1, with higher values indicating better-separated clusters), computed in the UMAP embedding space and therefore descriptive of the embedded geometry rather than of model-independent cluster quality. Second, sensitivity: every tier-rule threshold is swept over the ranges given in Section 2, and the clustering itself is re-run across a grid of UMAP settings (n_neighbors , components ) and five additional random seeds, directly on the standardized features without UMAP, and without the interaction/latency feature group; each variant is scored by where the persistent responders land and by agreement of the re-derived tiers with the reference tiers. Third, method dependence: a k-means () partition of the same standardized features is cross-tabulated against the tiers to ask whether an entirely different clustering paradigm recovers the same substantive grouping, and feature-group ablations remove each of the six groups in turn to quantify its contribution to the partition (AMI against the base partition). Fourth, external consistency: the platform’s per-comment moderation flag is cross-tabulated against the tiers. The flag is passed through ingestion for this purpose only and is deliberately excluded from the feature matrix, so the comparison is not circular. We stress that this is a consistency check, not validation against ground truth: the platform’s moderation decisions are proprietary, imperfect, and plausibly keyed to some of the same behavioral signals that we measure, most obviously text duplication, so agreement is informative mainly where the signals are least entangled (Section 4).
3. Results
3.1. Reply Activity Is Heavily Concentrated
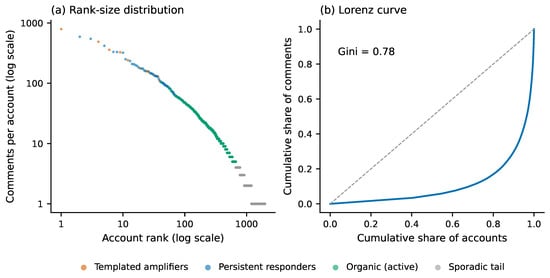
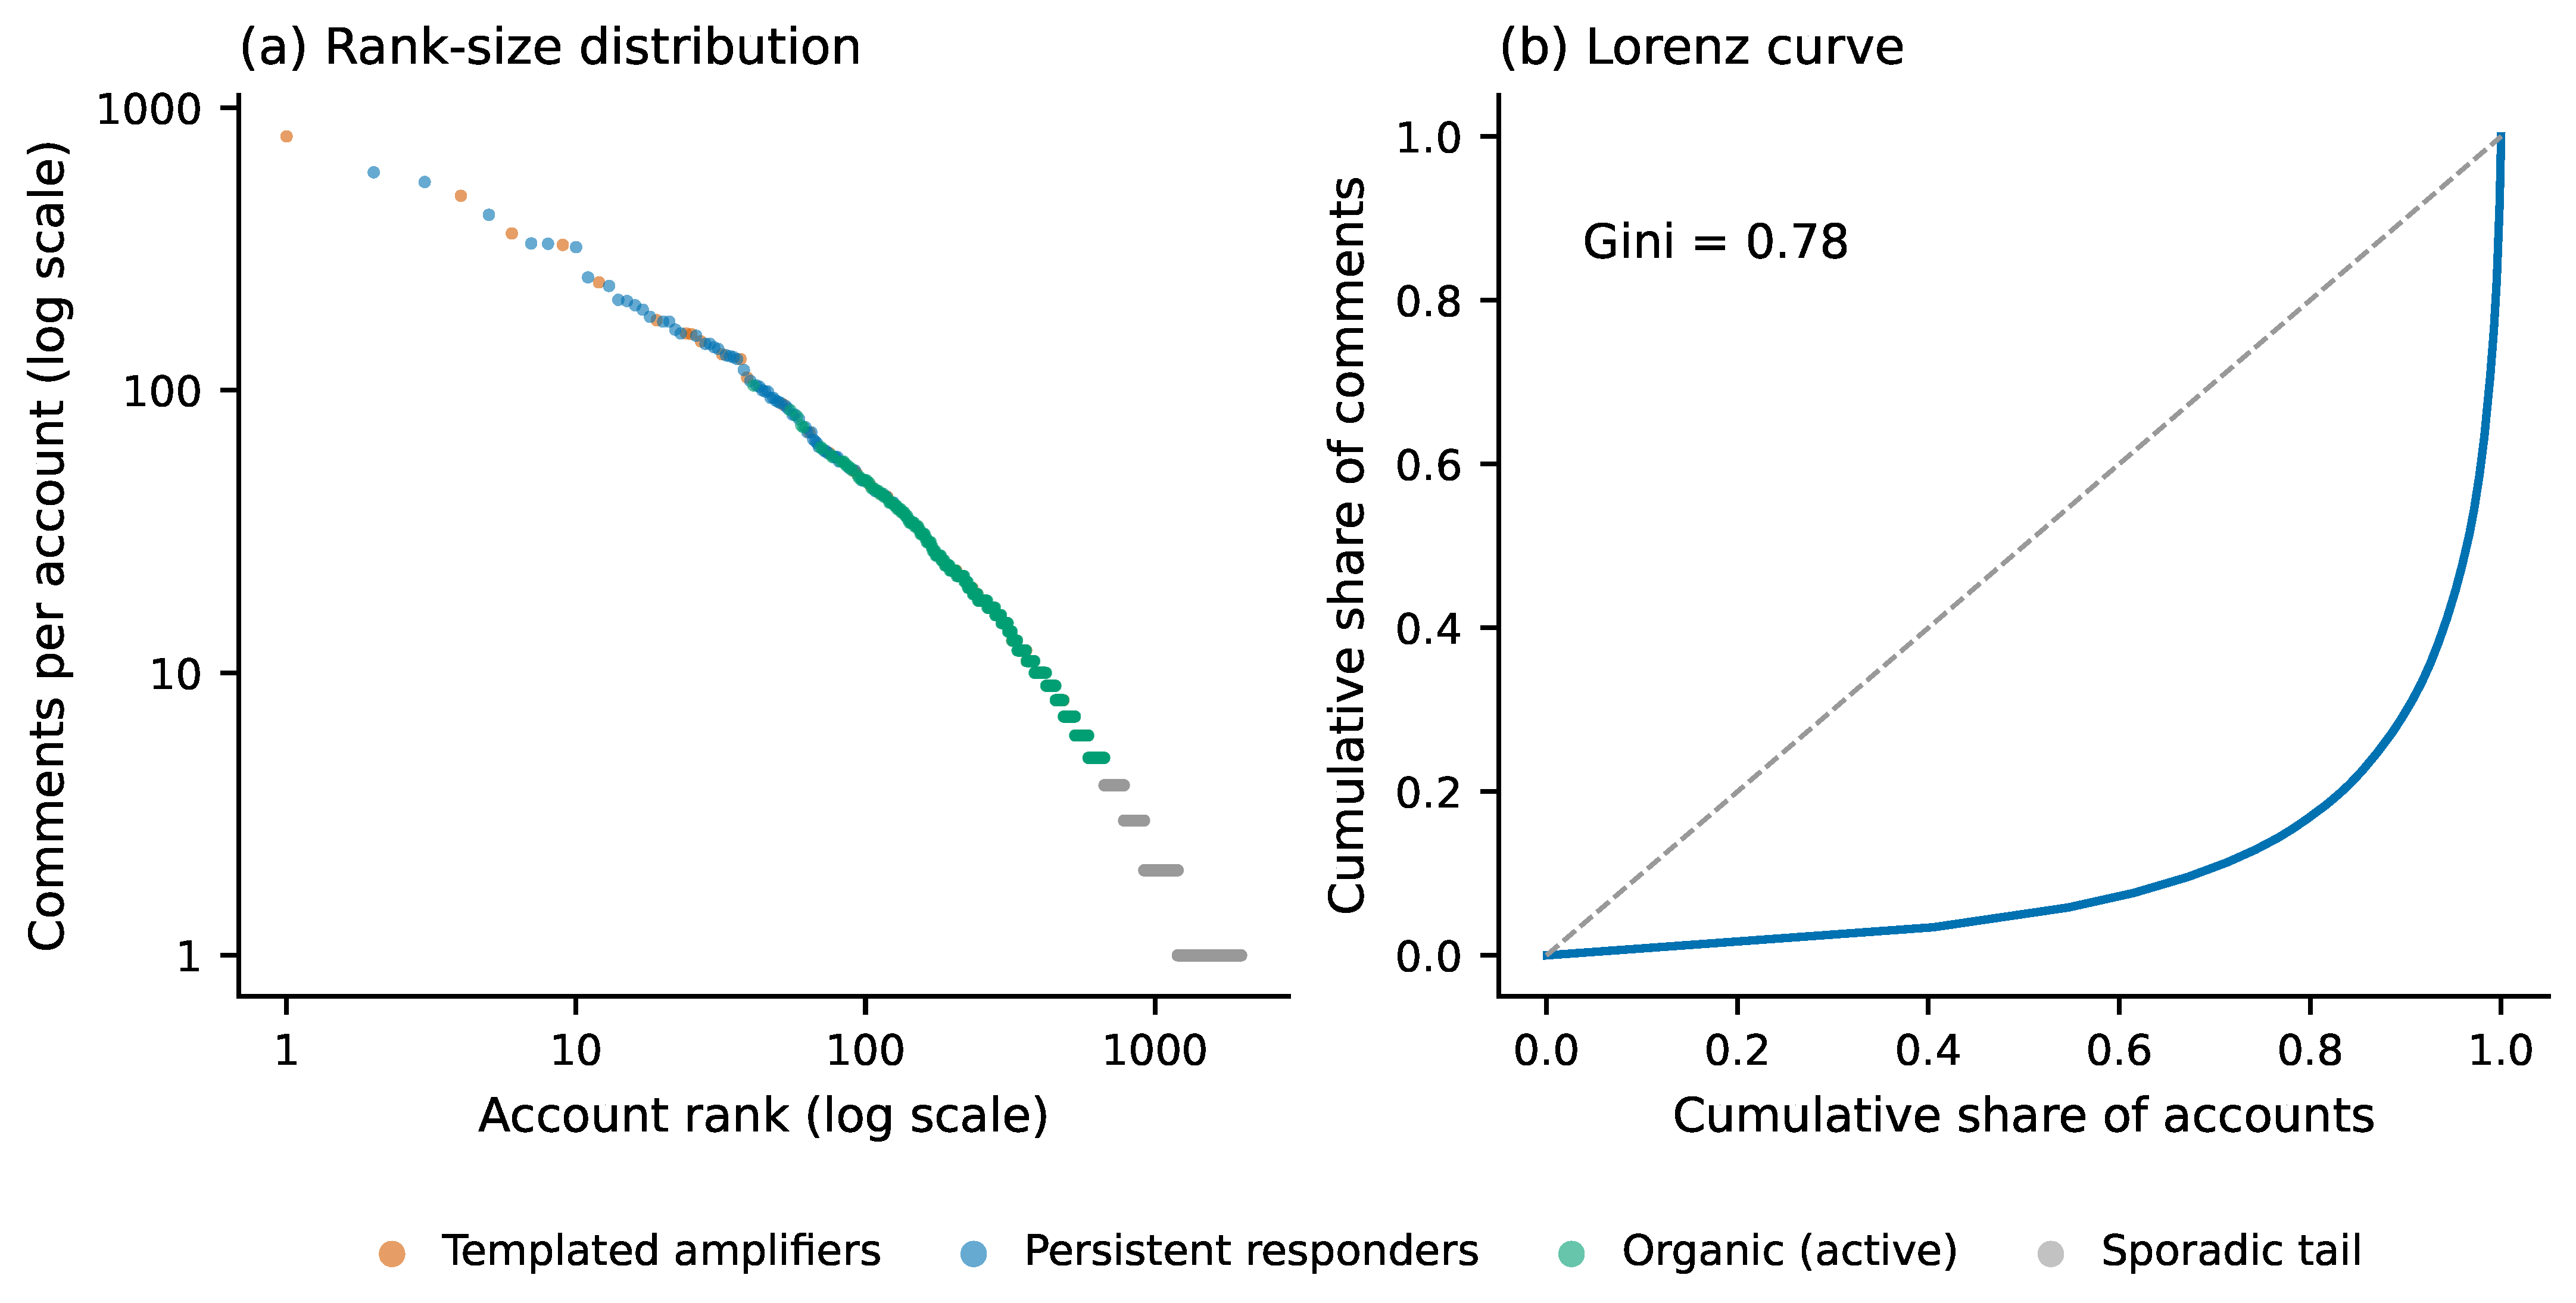
The 23,953 replies collected under the 704 monitored posts were written by 1985 unique accounts, but activity is distributed across them very unevenly (Figure 1). The Gini coefficient of comments per account (a standard concentration measure that runs from 0 for perfect equality to 1 for maximal inequality) is 0.78, and the top 10% of accounts contribute 70.2% of all comments. A discrete maximum-likelihood comparison of candidate distributions for the per-account comment counts prefers a lognormal over power-law, gamma, and exponential (geometric) alternatives by the Akaike information criterion, and a Vuong-type test confirms the preference over the power law (), so the tail is heavy but not scale-free, in line with activity distributions commonly reported for online platforms. In all, 234 accounts wrote at least 20 comments and 44 wrote at least 100; the single most active account produced nearly 800 comments, and one account replied under about 80% of all monitored posts (per-account extremes are reported as rounded to limit re-identifiability). Top-account concentration of this kind is itself an indicator used in traffic-manipulation measurement [21]. The rank-size curve in Figure 1a shows that the high-volume head is occupied almost entirely by accounts that the clustering below assigns to the two non-organic tiers; because the tier rules key on volume-linked quantities (coverage, active days, and duplication all rise with volume), this composition partly follows from the rules themselves rather than constituting an independent finding.
Figure 1.
Concentration of reply activity. (a) Rank-size distribution of comments per account (both axes logarithmic), colored by the behavioral tier assigned in Section 3.2; the high-volume head consists almost exclusively of templated amplifiers and persistent responders. (b) Lorenz curve, plotting the cumulative share of comments against the cumulative share of accounts, over the 1985 commenting accounts (Gini = 0.78); the top 10% of accounts produce 70.2% of all comments.
3.2. Three Behavioral Tiers
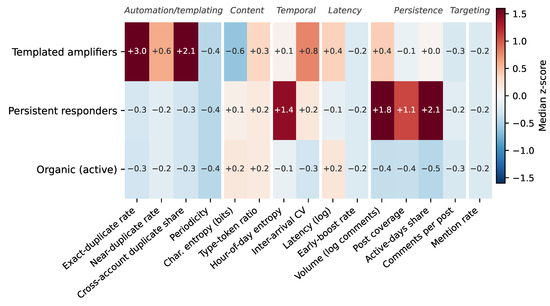
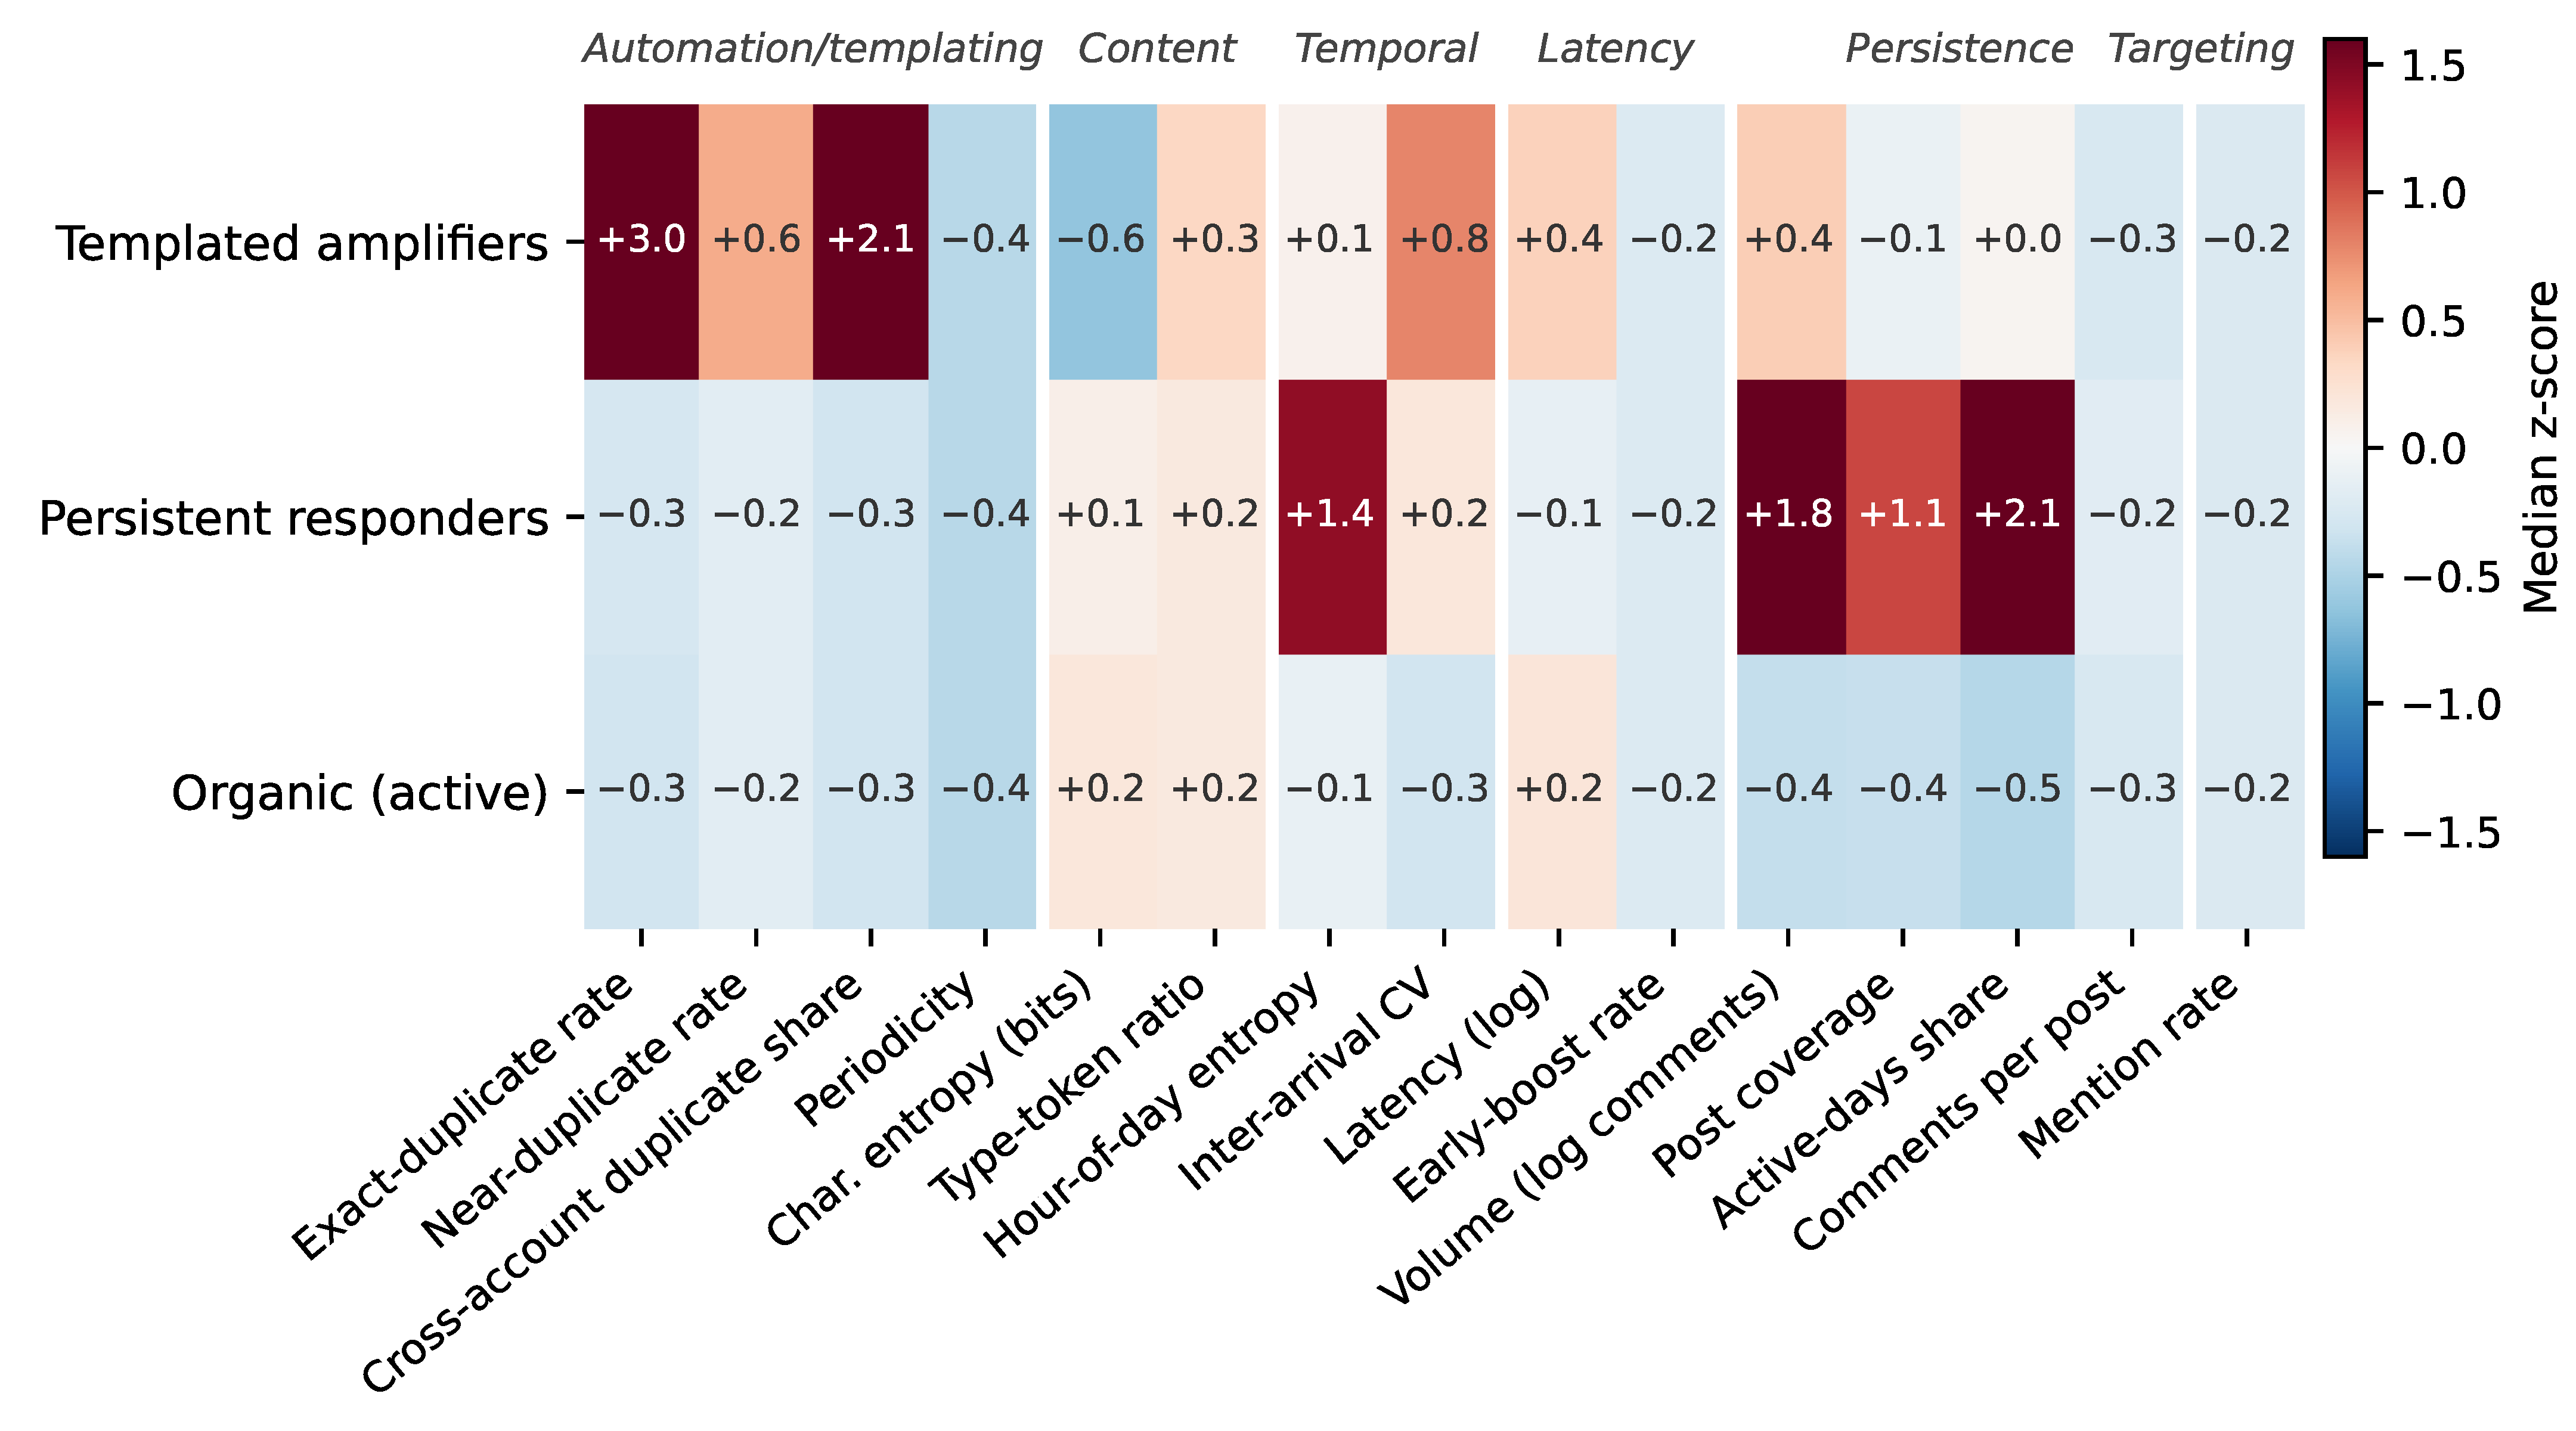
Clustering the 668 accounts with at least five comments, followed by the two labeling rules of Section 2, separates three interpretable behavioral tiers; the 1317 accounts below this threshold are reported descriptively as a sporadic tail. Table 1 summarizes the tiers, Figure 2 shows their feature signatures, and Table A2 in Appendix A reports bootstrap 95% confidence intervals for every estimated quantity in Table 1, together with hour-of-day entropy. In what follows, we distinguish properties that are entailed by the tier rules from those that emerge independently of them.
Figure 2.
Tier signatures: median z-scores of account-level behavioral features, computed over the 668 active accounts (a 15-feature subset of the 19 features is shown for legibility; columns are ordered and separated by the six feature groups of Section 2). Templated amplifiers deviate on the duplication features (exact-duplicate rate, cross-account duplicate share) with depressed character entropy; persistent responders deviate on volume, post coverage, active-days share, and hour-of-day entropy while remaining near the median on content features; organic accounts sit near or below the median throughout.
The templated amplifiers (43 accounts; 4012 comments; 16.7% of volume) are defined by text reuse: a median exact-duplicate rate of 0.41 and a median cross-account duplicate share of 0.26 (the same strings posted by different accounts). Those duplication rates are entailed by the rule that defines the tier; the emergent signature is the lowest character entropy of the three clustered tiers (3.41 bits), and the repeated, cross-posted text is a recognized coordination pattern: the same message posted by different accounts to manufacture the impression of independent support [5,21]. The persistent responders (65 accounts; 8809 comments; 36.8%) show the opposite profile. Their content and automation features are unremarkable, with no duplication enrichment and entropy comparable to organic accounts, but their persistence features are extreme. The median persistent responder wrote 99 comments, covered 12.6% of all monitored posts, and was active on 57% of the days in the window; coverage and active-days share are the criteria of the rule that defines this tier and are therefore extreme by construction. Their substantive signature lies in what the rule does not entail: near-zero duplication, organic-like entropy, the highest hour-of-day entropy of the three clustered tiers (3.78 bits, the flattest diurnal profile; Figure 2 and Figure 3b), and the fastest reply latency (below). Organic (active) accounts (560 accounts; 8923 comments; 37.3%) sit near or below the corpus median on essentially every feature, with a median of 11 comments and 1.4% post coverage. Together, the two non-organic tiers contain 108 accounts, 5.4% of all commenters, which produce 53.5% of all comments.
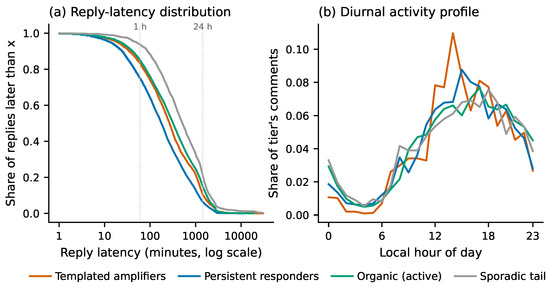
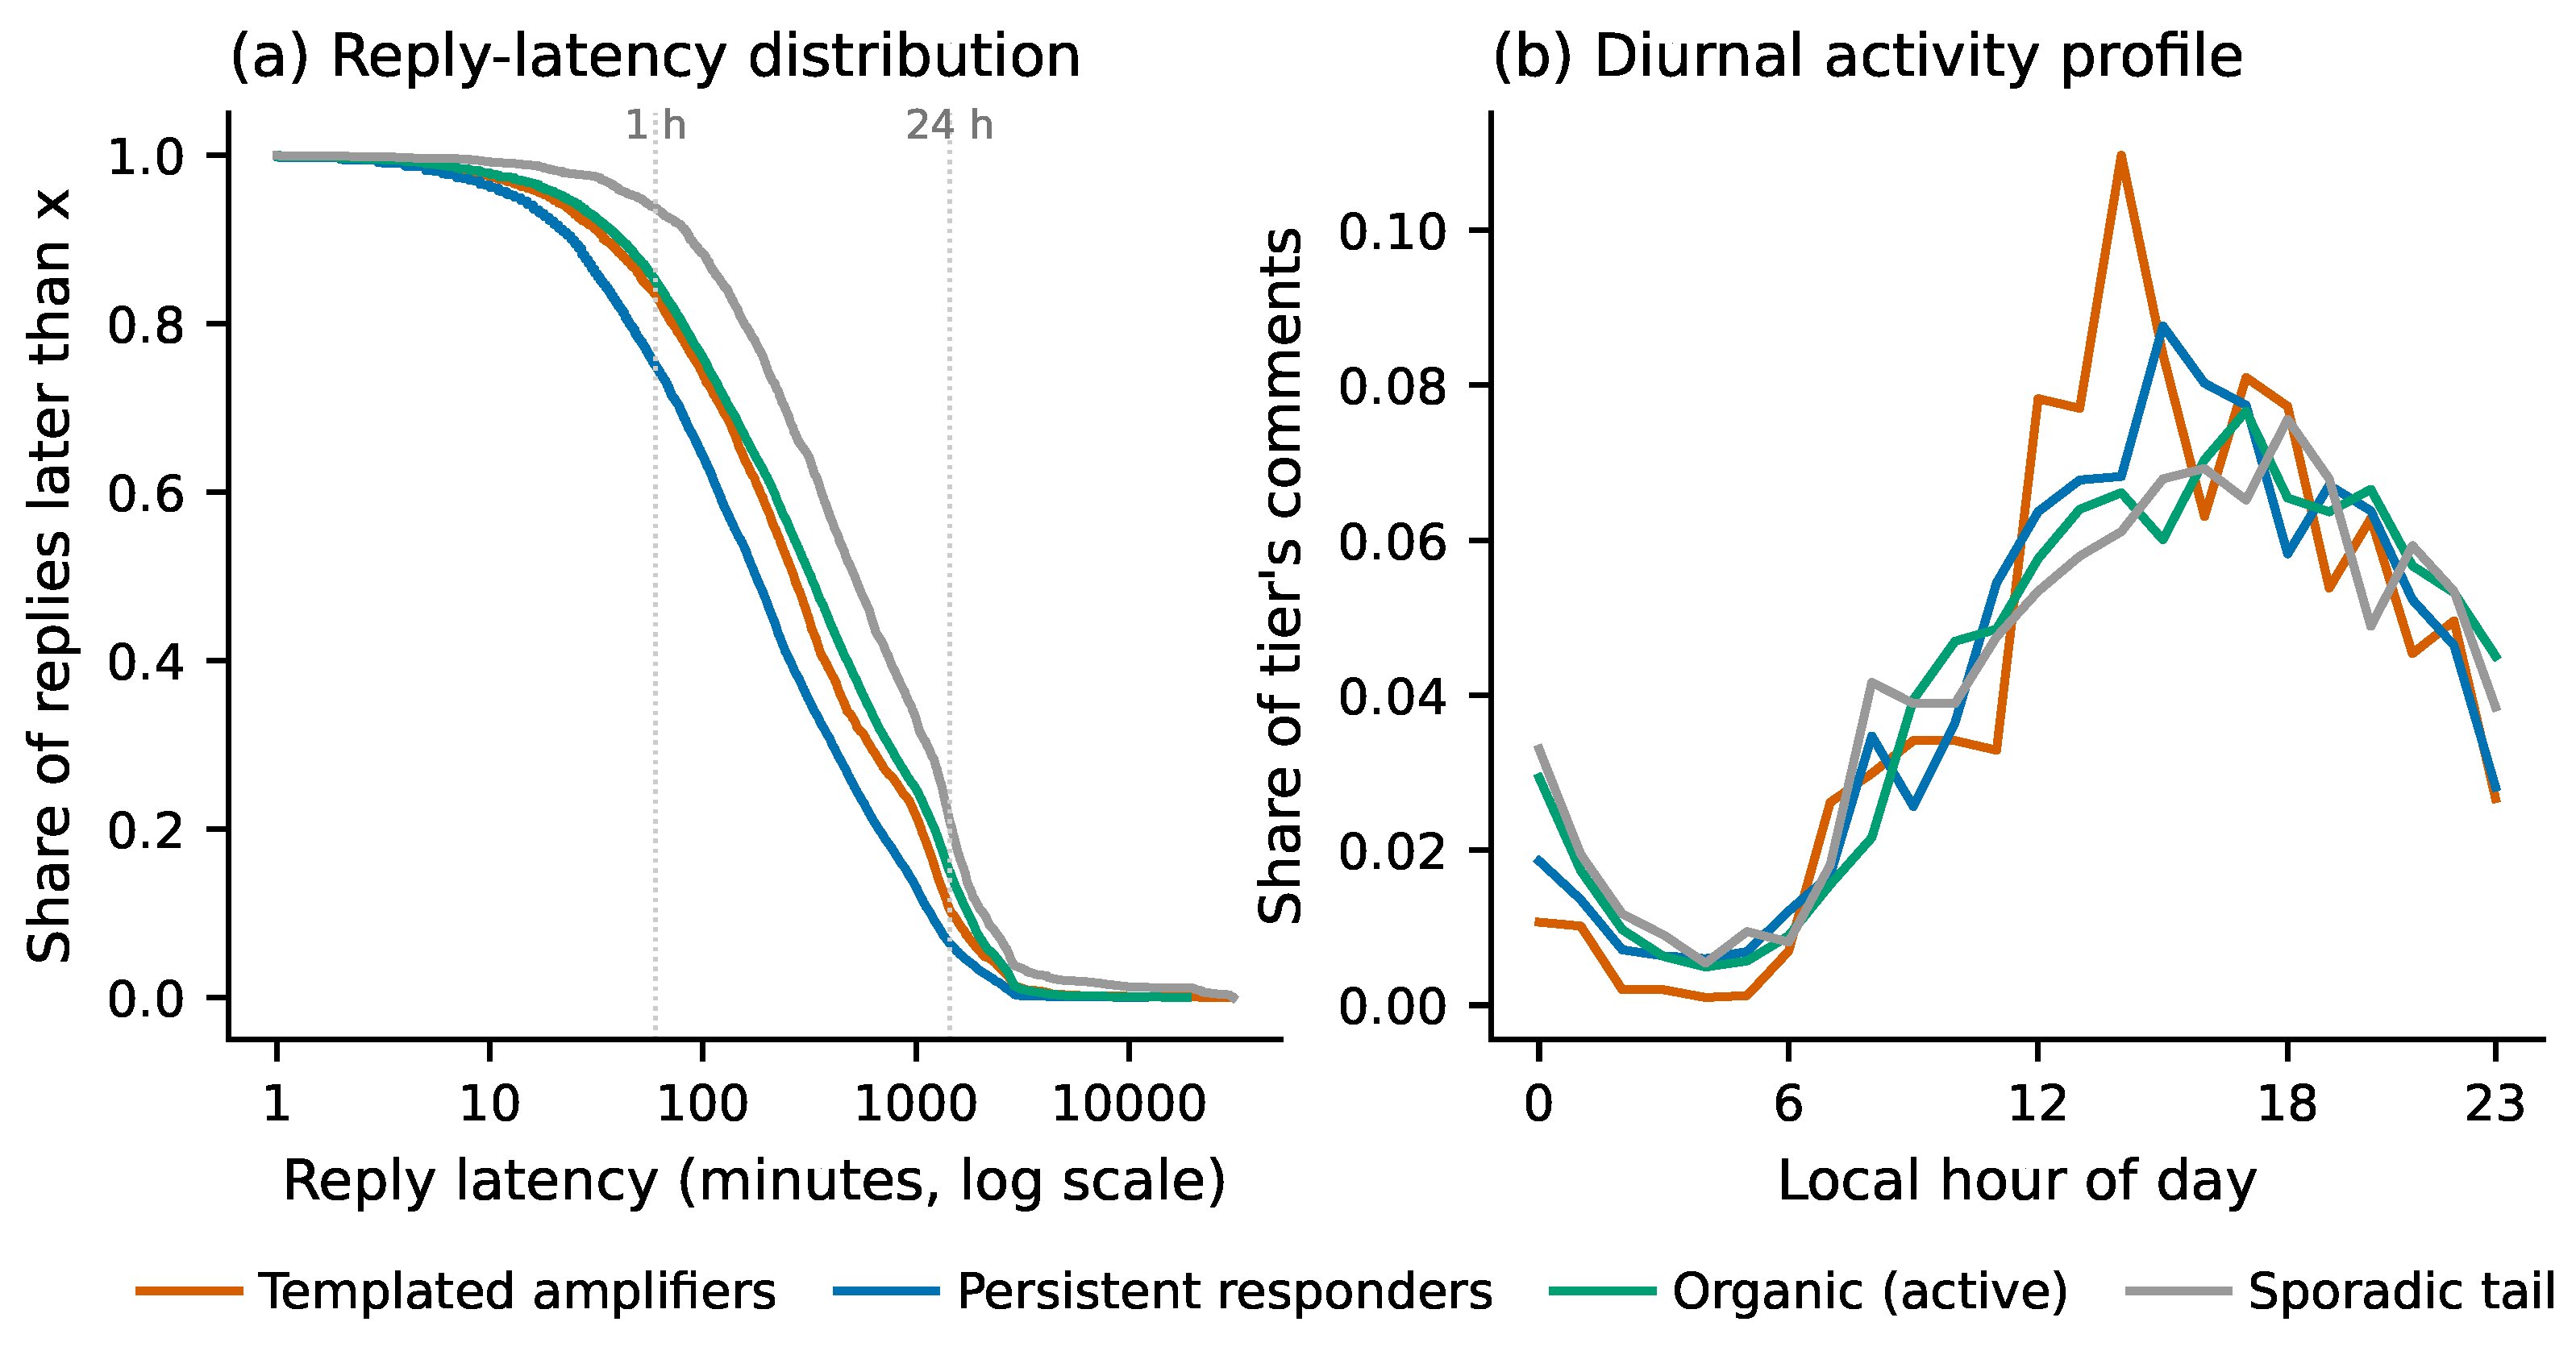
Figure 3.
Reply timing. (a) Distribution of reply latency by tier, plotted as the share of replies later than a given value (note the 1 h and 24 h reference lines); the corpus-wide median is 4 h 19 min, and only 1.0% of replies arrive within five minutes. (b) Diurnal activity profiles (share of each tier’s comments per local hour): all tiers follow a daytime cycle, with the persistent responders showing the flattest profile among the three clustered tiers.
Reply timing separates the tiers further (Figure 3). Across all replies, the median latency behind the root post is 4 h 19 min, and only 1.0% of replies arrive within five minutes. The ecosystem thus lacks the instant-response signature commonly attributed to automated amplification; its character is slow-burn persistence rather than early boosting. At the account level (Table 1), the persistent responders are nonetheless the fastest tier (median latency 8 h 31 min, versus 10 h 54 min for organic and 12 h 27 min for templated amplifiers) and, as noted above, spread their activity most evenly across the hours of the day. The bootstrap intervals in Table A2 qualify this ordering. The persistent responders’ latency interval (6 h 55 min to 9 h 16 min) is fully separated from the organic interval (10 h 03 min to 11 h 35 min), whereas the templated amplifiers’ interval is wide and overlaps the organic one, so of the two contrasts only persistent responders are fastest survives interval estimation; templated amplifiers are slowest holds for the point estimates but is not resolved at this sample size. Both contrasts additionally inherit the root-timestamp caveat of Section 2.1, which is why we read them as ordinal throughout. All tiers follow the same broad daytime cycle, consistent with human or human-supervised operation. That the templated amplifiers, the tier closest to classic automation heuristics, are also the slowest deserves comment. A plausible reading is batch-style posting that sweeps posts well after publication rather than real-time amplification, but the present data do not let us verify that burst structure, and we leave it as an open question. The periodicity score, included in the automation group to capture mechanical timing, fails to separate the tiers, with a median of zero in every tier, an honest negative worth recording.
A weekly rhythm is also present. Total reply volume falls at weekends, but this mostly tracks the monitored account’s own posting, which drops from about 13 posts on a typical weekday to 6 on a weekend day; daily post and comment counts correlate at , so much of the weekend dip simply reflects fewer posts to reply to. The tier composition nonetheless shifts: organic accounts keep a larger share of their activity at weekends, whereas the two non-organic tiers lean more heavily on weekday daytime hours (38% of their comments fall in the Monday-to-Friday 09:00–17:00 window, against 34% for organic accounts and 24% expected under a uniform spread), a modest concentration in conventional working hours.
3.3. Co-Commenting Structure
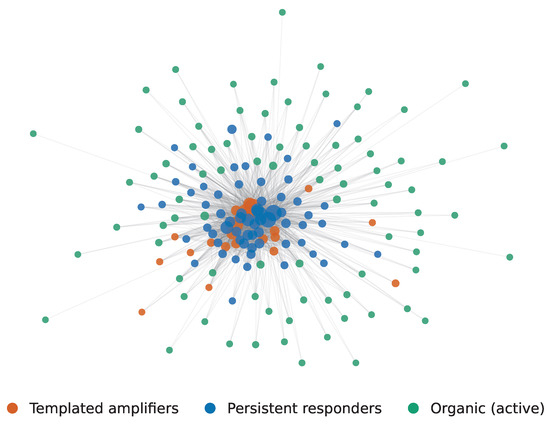
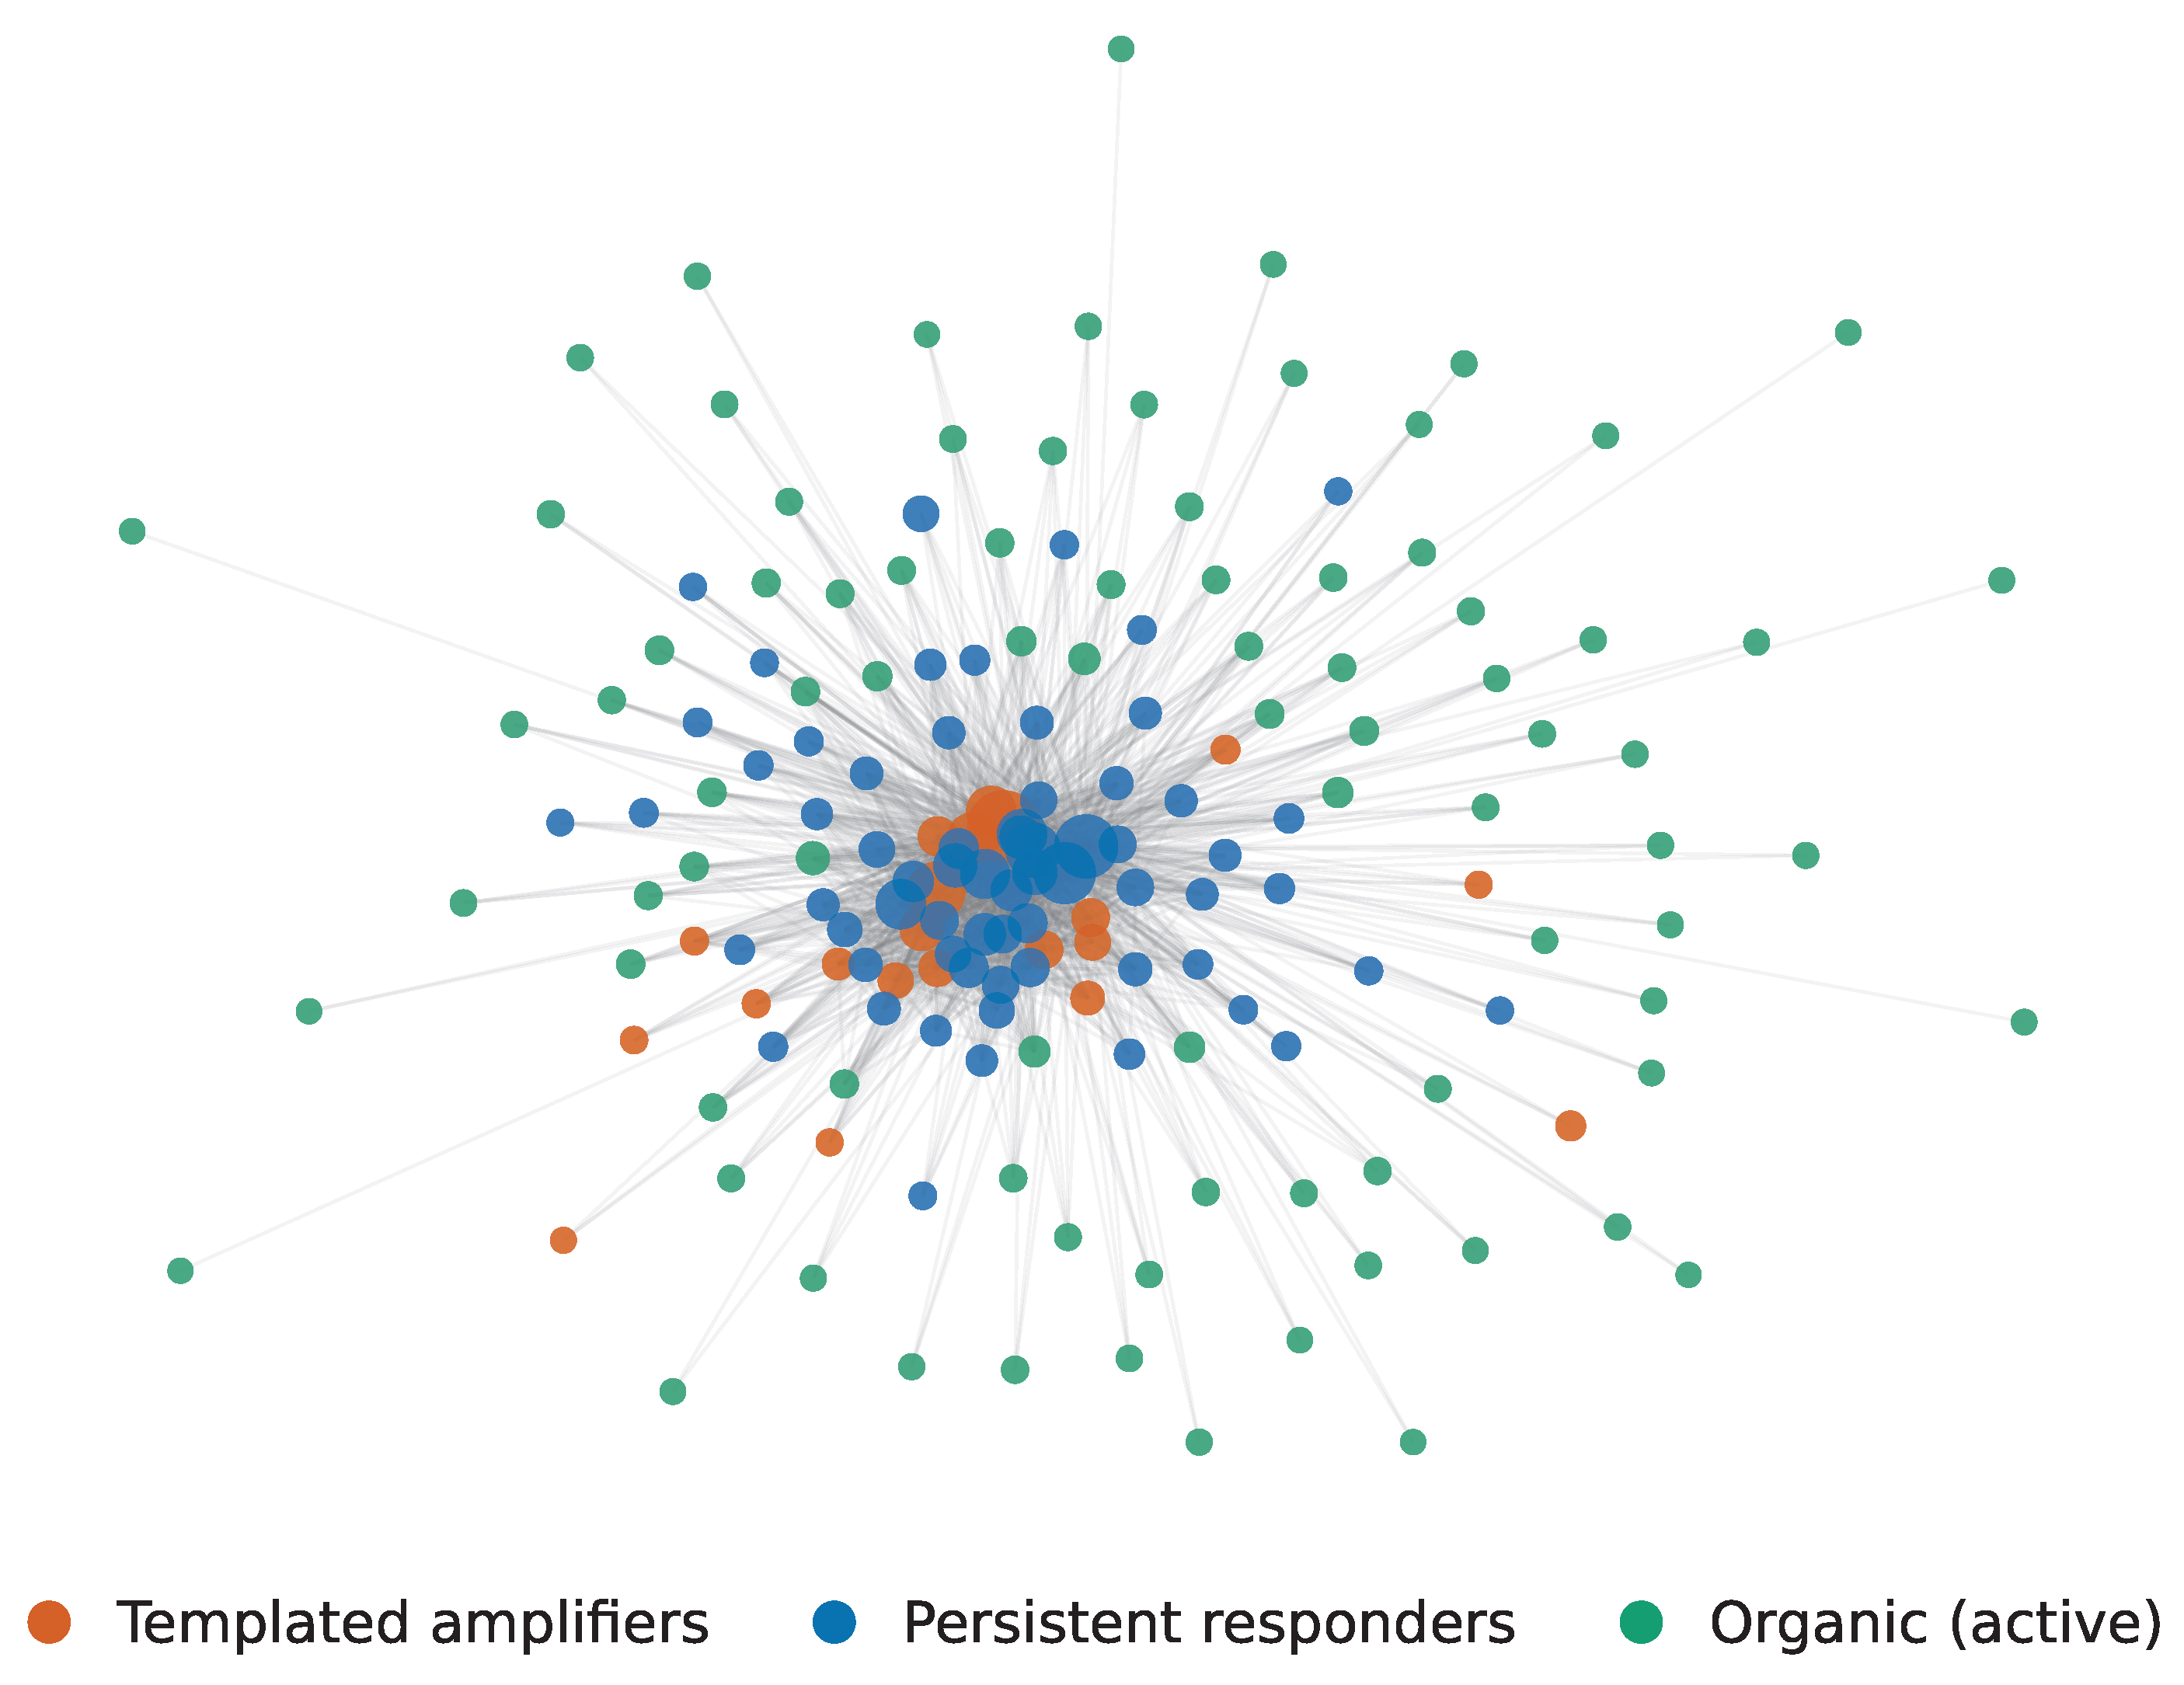
To describe how heavy commenters distribute their replies across the monitored posts, we link the 420 accounts with at least 10 comments by the number of monitored posts on which both commented, a co-activity trace of the kind used in coordination detection [5,18]. Even under a strict edge threshold of at least 25 shared posts, the graph does not fragment into separate groups but collapses to a single connected component of 172 of them that contains all 65 persistent responders, with the remaining 248 linking to no other account at this threshold (Figure 4). Templated amplifiers are embedded in the same dense center, whereas organic accounts attach only at the sparse periphery. The picture is insensitive to the two descriptive thresholds: across a grid varying the activity cutoff from 8 to 20 comments and the edge threshold from 15 to 35 shared posts, the graph always collapses to a single dominant component containing 64 or all 65 persistent responders.
Figure 4.
Co-commenting network over the 420 accounts with at least 10 comments; edges connect pairs that commented on at least 25 of the same monitored posts. The 172 accounts with at least one such edge form a single connected component whose dense center contains all 65 persistent responders (with templated amplifiers interspersed); organic accounts occupy the periphery, and the 248 accounts with no qualifying edge are omitted. The component’s size and connectivity match a coverage-preserving null model (Section 3.3), so the figure shows dense co-activity, not evidence of coordinated operation.
High connectivity among high-coverage accounts is, however, partly mechanical, since an account that replies under a large share of all posts necessarily shares many posts with any other such account. To test whether the observed structure exceeds what activity volumes alone produce, we compared it against a coverage-preserving null model: 500 degree-preserving randomizations of the account–post incidence matrix (curveball trades [26], preserving both each account’s number of covered posts and each post’s number of commenting accounts), with the co-commenting graph rebuilt at the same thresholds for each randomization. The observed structure shows no excess over this null. The largest component holds 172 accounts against expected under the null (); all 65 persistent responders fall in the largest component in every one of the 500 replicates; and the observed edge count, 1774, is in fact below the null expectation of . If anything, the observed graph is slightly sparser than the null predicts, so the co-commenting overlap is, if different at all, weaker than what independent commenting at these volumes would produce. The component therefore carries no evidence of coordination beyond volume, and we read it as a description of dense co-activity on the same posts, not as evidence that the accounts operate as one unit; the null model makes this reading quantitative rather than merely cautious.
3.4. Stability, Sensitivity, and External Consistency
Lacking ground-truth labels, we examine the tier structure along the four axes of Section 2. First, stability: over 20 resamples with full re-embedding, the clustering reproduces the full-data partition with an AMI of on the raw HDBSCAN labels. Because the manuscript’s conclusions concern the final tiers rather than the raw clusters, we also re-apply the rule layer to every resample: the re-derived tier labels agree with the reference tiers for of the resampled accounts (tier-level AMI ). The silhouette score of the non-noise solution is 0.48, computed in the UMAP embedding space and therefore descriptive of the embedded geometry only.
Second, sensitivity. Sweeping the tier-rule thresholds around their chosen values changes the tier composition only gradually. Across all 20 settings of the duplication cutoffs (each of the three cutoffs swept over five values spanning ±0.10 of its base, plus five joint scalings from 0.6× to 1.4×), the templated tier ranges from 31 to 79 accounts while the persistent-responder tier stays between 61 and 68, and the headline composition, a small non-organic minority carrying the majority of comments, holds throughout, with the non-organic comment share confined to 52.6–56.1%. The persistence rule is even less sensitive over its own sweep, because it compares cluster medians against cutoffs that the qualifying cluster passes with a wide margin, since the cluster’s median coverage of 13.4% is 7.8× the corpus median against the required 5×; any coverage factor between 3× and 7× therefore selects exactly the same single cluster, and no setting in the grid ever selects a second one. The one genuine cliff is the active-days cutoff: the qualifying cluster’s median active-days share is 0.57, so cutoffs of 0.6 and above turn the rule off entirely (no cluster qualifies, and the non-organic share falls to the templated tier alone) rather than reshaping the tier. Varying the clustering itself points the same way. Across a grid of UMAP settings (n_neighbors , components ), five further random seeds, and re-clustering without the interaction/latency feature group, the persistent responders are always recovered as one group, in one of two modes. In the settings where the persistence rule fires, the re-derived tier overlaps the reference 65 by 55–65 accounts and the re-derived tiers agree with the reference tiers for 97–99% of accounts. In the settings where under-resolution merges the group into a larger cluster whose median falls below the rule cutoff (including all four latency-ablated runs), the rule goes silent, with 63–65 of the 65 accounts nonetheless co-located in a single cluster, so the tier goes unassigned rather than being differently assigned. The failure mode of the rule layer is thus conservative: under-resolution silences a tier; it does not relabel accounts into it. Running HDBSCAN directly on the standardized 19-dimensional features, without UMAP, finds no clusters at all (all 668 accounts are labeled noise), the expected behavior of density estimation in high dimensions, which is why the embedding step is a prerequisite for density-based clustering here rather than an optional refinement.
Third, method dependence. A k-means partition with on the same standardized features recovers the same substantive grouping: all 65 persistent responders land in a single k-means cluster (together with 91 organic and 18 templated accounts), a second cluster is 97% organic (469 of 482), and the third contains only templated amplifiers. The raw-partition agreement is modest (AMI 0.22, reflecting the different cluster granularities), but the substantive point, that a distinct high-persistence group exists and is separable by an unrelated algorithm, is supported rather than contradicted. Feature-group ablations perturb the partition to varying degrees, with AMI against the full solution of 0.37 (content), 0.43 (interaction), 0.45 (automation), 0.47 (persistence), 0.55 (temporal), and 0.61 (targeting); the content and interaction groups matter most, and no single group determines the structure.
Fourth, external consistency with the platform’s own moderation state, which was recorded per comment at collection time but never used as a feature. The platform hid 25.9% of all collected replies (6210) as probable spam, and the comment-weighted flagged share falls monotonically across the tiers: 54.3% for templated amplifiers, 29.2% for persistent responders, and 13.4% for organic accounts, close to the 11.7% of the sporadic tail (Table 1; bootstrap 95% intervals in Table A2). We treat this as a consistency check rather than validation, for the reason given in Section 2: platform spam moderation plausibly keys on duplicated text, the same observable that defines the templated amplifiers, so high flagging there is partly expected by construction. The informative contrast is therefore the 29.2% flagged share of the non-duplicating persistent responders against the 13.4% of organic accounts, whose bootstrap intervals (16.9–41.0% versus 9.9–17.3%) barely touch. Within the persistent responders, the flags split sharply. Of the 65 accounts, 14 (22%) have at least half of their comments flagged, while 41 (63%) have at most 5% flagged. Per-comment moderation thus divides a population that the account-level features place in a single tier; whether this reflects inconsistent moderation of behaviorally similar accounts or residual heterogeneity within the tier cannot be decided from our data. Comments cluster within accounts, so all per-comment proportions here are interval-estimated by resampling accounts, not comments (Table A2).
A second descriptive check uses the one account property that travels with every comment: the handle itself. Handles containing digits, and in particular handles ending in a run of four or more digits of the kind produced by automatic handle suggestion, are more common in the two non-organic tiers: 62% of persistent responders and 60% of templated amplifiers carry digits, against 46% of organic accounts, and 32% and 37%, respectively, end in four or more digits, against 24% of organic accounts. Handle composition never entered the feature matrix, so this enrichment, although modest in size, is an independent signal pointing in the same direction as the tiers.
4. Discussion
The central empirical result is that the reply ecosystem of the monitored account is carried by a small, disproportionately active minority of 108 accounts (5.4%) producing 53.5% of all comments: a share that the volume-linked tier rules partly entail (Section 3.1), even though the concentration itself is rule-independent, and that, in this ecosystem at least, looks nothing like the “instant bot” that naive heuristics target. Replies within five minutes of the root post account for only 1.0% of comments; the persistent responders instead exhibit a slow-burn signature of sustained volume, broad post coverage, all-day activity, and lexically diverse, non-templated text (Section 3.2). These resemble the gray-area “cyborg” or human-operated accounts that the literature identifies as hardest for binary classifiers and where model uncertainty peaks [13,15,16], though our data cannot confirm human operation. A minimal-data lens cannot resolve that ambiguity, but it does not need to, because persistence, coverage, and co-occurrence suffice to delineate the group behaviorally (all 65 persistent responders fall in a single co-commenting component, one whose density the coverage-preserving null model explains by activity volumes alone; Section 3.3) without asserting what operates them, or whether they are operated jointly at all.
The obvious alternative explanation must be stated plainly. The persistent responders could be highly engaged partisan followers acting independently. That hypothesis is compatible with most of what we observe (high volume, broad coverage, human-like text, a daytime diurnal cycle, and low flag rates for the majority of the tier), and the analyses reported here do not discriminate against it. The coverage-preserving null model (Section 3.3) makes the point quantitative: the single co-commenting component is exactly what independent commenting at these activity levels would produce, so the network structure cannot discriminate either. The tier label should accordingly be read as naming a co-activity pattern, not as a finding of orchestration; deciding between devoted followership and coordinated operation would require evidence that this design deliberately forgoes.
The platform’s own moderation state offers an external consistency check. The comment-weighted flagged share declines monotonically across the tiers (Section 3.4, Table 1), the ordering an automation-to-organic gradient predicts, and no flag information entered the clustering. We deliberately do not call this validation: the platform’s moderation decisions are proprietary, imperfect, and plausibly keyed to some of the same behavioral signals that we measure. Part of the templated amplifiers’ enrichment is expected by construction, since spam moderation plausibly keys on the duplicated text that defines them, which is why the evidential weight falls on the non-duplicating persistent responders, whose flagged share still stands well above the organic rate. Those same per-comment flags also split the persistent responders into a heavily flagged minority and a largely unflagged majority (Section 3.4), a discrepancy that echoes evidence that evolved accounts largely evade platform countermeasures [16]. Account-level behavioral characterization and per-comment platform flags are therefore complements rather than substitutes, the former delineating a candidate group whose membership the latter confirms only in part.
These flags are not a black box of our making but the platform’s enforcement of a stated policy, under which X prohibits “bulk, aggressive, high-volume unsolicited replies” and content posted “in a bulk, duplicative, irrelevant or unsolicited manner” [27]. Read against that policy, the gradient is mechanistically unsurprising. The duplication that defines the templated amplifiers is exactly the “duplicative” signature the policy names, so their 54% flag rate reflects detection working as designed, whereas the persistent responders, whose text is varied and human-looking, present no such signature and are caught only in part. The same asymmetry appears in the platform’s structural defenses. In February 2026, shortly after our observation window, X restricted programmatic (API) replies unless the original author mentions or quotes the replying account, an intervention introduced expressly to curb automated reply spam [28]. Both measures target overt automation, and neither would catch a human-looking account that merely replies often, which is precisely the persistent-responder profile, the population most likely to slip through both the duplication filter and the reply restriction.
This composition aligns with what profile-rich methods report about political discourse. Botometer-style studies consistently find a small, disproportionately productive minority: accounts classified as likely bots made up 6% of a large sharing network yet spread 31% of its low-credibility content [29], bot shares among the followers of political parties rose from roughly 7% before to 10% during a national election campaign [30], bots generated roughly one fifth of the interactions in a polarized referendum debate while strategically targeting influential humans [31], and hyperactive accounts with elevated bot scores dominate political data streams more generally [32]. Our profile-free tiers recover the same concentration structure, 5.4% of accounts producing 53.5% of comments, without any of the profile, timeline, or network signals those methods require, and they add a distinction that the binary bot/human frame compresses: the minority splits into a small templated tier whose signature platform moderation already catches and a larger, human-looking persistent tier that it mostly does not, the same gray zone where profile-rich classifiers are least reliable [15,16]. Characterizations of coordinated reply attacks built on richer data likewise place politicians and state officials among the principal targets, alongside journalists and news media [3]; the political reply surface is the one studied here. These comparisons are qualitative by necessity: bot-score prevalence and behavioral tiers are different constructs, measured on different platforms and under different data-access regimes, so what carries across is the pattern, a small minority with outsized volume and a human-looking component that evades automation filters, rather than any particular magnitude.
The composition that we measure also matters for a second audience: the analytics layer built on top of the platform. X holds a particular position in that layer, because its formerly free and academic-friendly API made it the substrate for more than 33,000 studies [22] and, by extension, for much of the tooling that measures online sentiment and engagement. In this corpus, a quarter of all replies sit behind the platform’s probable-spam fold, which the interface collapses behind an additional click; few human readers will ever see them, yet they remain part of the page and of any automated collection of it. A sentiment or engagement pipeline that ingests replies without account-level weighting would read this volume as public opinion. Human readers face the inverse distortion, where a genuine commenter whose view is outnumbered in the visible thread may take the manufactured majority for a real one and conclude that their position is marginal. Both effects are hypotheses rather than demonstrated outcomes, and our data cannot quantify either. What the data do establish is the precondition, namely that a majority of the measurable reply volume in this ecosystem comes from a small, behaviorally distinct minority of accounts. Testing the measurement-distortion hypothesis directly would require instrumenting the sentiment tools themselves, which we leave to future work.
Several limitations bound these claims. The study covers a single case, the reply ecosystem of one official account of a political party in a European multi-party democracy, on a single platform, X, over a two-month window. The tier structure may not generalize beyond this setting, and we present it as a description of this case, not as a general taxonomy of reply ecosystems; whether comparable tiers recur elsewhere is an empirical question for replication. The collection captured root posts and replies but not thread structure, so reply-depth dynamics are unobserved. By design, no profile, timeline, or follower data were collected, so operator identity and the human-versus-automation boundary remain out of scope; we characterize bot-like behavior and deliberately do not assert that any account is a bot. Per-account features require a minimum activity level, so coordination distributed across many low-volume accounts (templated text spread thin across disposable accounts, for example) is structurally invisible to this design, and the sporadic tail should not be read as certified benign. Semantic and stance features were excluded because such features are language-dependent [7] and the available English-built lexicons performed degenerately on this Slavic corpus; future work should add language-specific models. Collection through the public web interface may miss content removed before capture, and pseudonymization precludes re-identification or longitudinal follow-up of individual accounts. Bootstrap 95% confidence intervals for the tier-level quantities are reported in Appendix A Table A2; comments cluster within accounts, so per-comment proportions are interval-estimated by resampling accounts, and several intervals are wide, notably the templated amplifiers’ flagged share, so individual contrasts should be read with the intervals in hand. Finally, platform spam flags are themselves an imperfect, opaque signal; they are right-censored by capture time (a comment’s chance of having been flagged grows with the interval between posting and the scrape that captured it, which may differ across tiers), and we use them as an external consistency check, never as ground truth.
5. Conclusions
A reply ecosystem can be mapped from public posts and replies alone, and the picture that emerges is transparent and straightforward to interpret. In this case study, a small behavioral minority, 5.4% of accounts, carries 53.5% of the reply volume, a composition that is stable across the sensitivity analysis and whose only failure mode is conservative (the most demanding settings silence a tier rather than reshape it), yet it bears little resemblance to the fast-acting automation that simple heuristics chase. Its signature is slow-burn persistence rather than early boosting, namely high sustained volume, broad post coverage, and all-day activity in lexically varied, human-looking text. This places the accounts that matter most in the gray zone that binary classifiers handle worst, and a profile-free design cannot, and does not try to, settle whether they are jointly operated or simply devoted independent partisans. Our contribution is to make that adjudication unnecessary, shifting from a binary verdict on whether an account is a bot to a graded characterization that delineates such a group behaviorally and names a co-activity pattern while leaving operator identity open. The platform’s own spam flags, declining monotonically from the most templated tier to the most organic without shaping the clustering, supply an external consistency check that complements account-level characterization rather than substituting for it.
The result also carries a warning for the measurement infrastructure that consumes this platform’s data. Where a small behavioral minority produces most of the reply volume under an account, sentiment and engagement metrics computed over that volume would reflect the activity of that minority rather than broad public opinion, and a quarter of the volume here was already hidden from human readers as probable spam while remaining visible to data pipelines. Whether and how strongly downstream tools are affected remains untested here. Account-level behavioral characterization of the kind developed in this paper is a low-cost precondition for keeping such instruments honest. Because it draws only on the public interface, it stays reproducible even where the costly API access that now gates this platform’s data is out of reach [22].
Several directions follow, the most immediate being whether this three-tier structure recurs across other accounts, cases, and platforms. The coverage-preserving null model applied here rules out volume artifacts in the co-commenting structure but not finer-grained coordination; null models that additionally preserve temporal structure could test whether the timing of replies within threads is more synchronized than independent commenting allows. The content axis that this design set aside could be restored with language-specific semantic and stance models, since English-built lexicons were degenerate on the Slavic corpus, opening signals such as sentiment that runs counter to a post’s context, for example, a supportive comment under a tragic one. Most directly, instrumenting downstream sentiment and engagement tools would turn the measurement-distortion precondition that this study establishes into a tested effect.
Author Contributions
Conceptualization, K.K. and T.A.; methodology, K.K.; software, K.K.; validation, K.K.; formal analysis, K.K.; investigation, K.K.; data curation, K.K.; visualization, K.K.; writing—original draft preparation, K.K.; writing—review and editing, T.A.; supervision, T.A. All authors have read and agreed to the published version of the manuscript.
Funding
The authors declare that no funds, grants, or other monetary support were received specifically for the preparation of this manuscript. The programme KII-06-H85/16 of the National Science Fund of Bulgaria, listed in the Acknowledgments, provided the broader institutional framework for the authors’ research.
Institutional Review Board Statement
This study is an observational analysis of content that account holders had made publicly available on X (formerly Twitter). It involved no intervention or interaction with any individual and collected no private or sensitive personal data, and therefore did not require Institutional Review Board or ethics-committee approval. All account identifiers were pseudonymized prior to analysis, no re-identification was attempted, and no personal data are published, with only aggregate statistics and per-account derived features reported. The processing complied with the EU General Data Protection Regulation (Regulation (EU) 2016/679), in particular Article 9(2)(e) (data manifestly made public by the data subject) and Article 89(1) (processing for scientific-research purposes).
Informed Consent Statement
This study involved no intervention or interaction with any individual and collected no private or sensitive personal data, and therefore did not require Institutional Review Board or ethics-committee approval. All account identifiers were pseudonymized prior to analysis, no re-identification was attempted, and no personal data are published, with only aggregate statistics and per-account derived features reported. Therefore, informed consent for participation is not required.
Data Availability Statement
The analysis pipeline code and the anonymized per-account derived feature tables supporting this study are available from the corresponding author on reasonable request. The underlying material is politically sensitive and concerns individual accounts, and the study’s protection of both rests on de-identification that uncontrolled redistribution could weaken (Section 2.1); access is therefore controlled, with requests assessed case by case so that anything shared preserves the anonymization of the case and of individual accounts. Raw comment text and original account identifiers are not released.
Acknowledgments
The authors acknowledge the support of the National Science Fund of Bulgaria under Contract No. KII-06-H85/16. During the preparation of this manuscript, the authors used a generative AI assistant (Anthropic Claude) and Grammarly to improve the language, clarity, and presentation of the text. All content was written, reviewed, and verified by the authors, who take full responsibility for the manuscript.
Conflicts of Interest
The authors declare no conflicts of interest. T.A. serves as Guest Editor of the Special Issue to which this manuscript is submitted; she had no role in the editorial handling or peer-review process of this manuscript, which were managed independently by the journal’s editorial office.
Abbreviations
The following abbreviations are used in this manuscript:
| AMI | Adjusted mutual information |
| API | Application programming interface |
| AUC | Area under the curve |
| CV | Coefficient of variation |
| HDBSCAN | Hierarchical density-based spatial clustering of applications with noise |
| TF–IDF | Term frequency–inverse document frequency |
| UMAP | Uniform Manifold Approximation and Projection |
| URL | Uniform resource locator |
| UTC | Coordinated Universal Time |
Appendix A. Feature Dictionary
Table A1 lists the 19 per-account features, grouped as in Section 2. Each is computed from the posts and replies alone; the variable names match the analysis pipeline and the derived feature tables, so every column of the shared data can be traced to its definition here.
For exact reproducibility, the operational settings are as follows. All text features operate on lightly normalized text: lower-casing and whitespace collapsing only, with no stemming, lemmatization, or other language-specific processing. Tokens for the type–token ratio are extracted with the Unicode regular expression [\w@#′]+. The exact-duplicate rate is one minus the share of distinct normalized texts among an account’s comments, and the cross-account duplicate share is the share of an account’s comments whose exact normalized text is also posted by at least one other account. Near-duplicate detection vectorizes comments with character 3–5-gram TF–IDF and counts a pair as near-duplicate when its cosine similarity exceeds 0.8; for accounts with many comments, the computation is capped at 80 sampled comments and 250 sampled pairs, with a fixed random seed. Character entropy is the Shannon entropy of the character distribution of each normalized comment, in bits per character. URLs are detected with a regular expression over the raw text (matching http(s)://, www., or a domain-like pattern), and mentions are parsed from the text as @-handles and pseudonymized together with author handles. The periodicity score is over an account’s inter-comment gaps. Repeated captures were deduplicated on the tuple (post link, author handle, timestamp, comment text).
Table A1.
The 19 profile-free per-account behavioral features and their definitions. Italic headings mark the six feature groups. Where a definition refers to a logarithm, it is the base-10 logarithm, applied to compress highly skewed counts and durations so that very active accounts do not dominate the scale. “Comments” here means an account’s replies to the monitored posts.
Table A2.
Bootstrap 95% confidence intervals for the tier-level medians and flagged shares of Table 1, together with hour-of-day entropy (2000 resamples of accounts within each tier; percentile intervals). The comment-weighted flagged share is interval-estimated by resampling accounts and reweighting by their comment counts, so the intervals respect the clustering of comments within accounts. Reply latency is shown as hours:minutes. Sporadic-tail feature medians are not reported, as in Table 1, because per-account features are unreliable below five comments.
References
- Minot, J.R.; Arnold, M.V.; Alshaabi, T.; Danforth, C.M.; Dodds, P.S. Ratioing the President: An exploration of public engagement with Obama and Trump on Twitter. PLoS ONE 2021, 16, e0248880. [Google Scholar] [CrossRef] [Scilit] [PubMed]
- Alaimo, K. Design of X’s platform masks discontent with presidential social media posts instead of reflecting public opinion. Commun. Democr. 2024, 58, 134–148. [Google Scholar] [CrossRef] [Scilit]
- Pote, M.; Elmas, T.; Flammini, A.; Menczer, F. Coordinated Reply Attacks in Influence Operations: Characterization and Detection. In Proceedings of the International AAAI Conference on Web and Social Media (ICWSM), Copenhagen, Denmark, 23–26 June 2025; Volume 19, pp. 1586–1598. [Google Scholar] [CrossRef] [Scilit]
- Ferrara, E.; Varol, O.; Davis, C.; Menczer, F.; Flammini, A. The Rise of Social Bots. Commun. ACM 2016, 59, 96–104. [Google Scholar] [CrossRef] [Scilit]
- Keller, F.B.; Schoch, D.; Stier, S.; Yang, J. Political Astroturfing on Twitter: How to Coordinate a Disinformation Campaign. Political Commun. 2020, 37, 256–280. [Google Scholar] [CrossRef] [Scilit]
- Nimmo, B. The Breakout Scale: Measuring the Impact of Influence Operations; Foreign Policy at Brookings Report; The Brookings Institution: Washington, DC, USA, 2020. [Google Scholar]
- Yang, K.C.; Ferrara, E.; Menczer, F. Botometer 101: Social bot practicum for computational social scientists. J. Comput. Soc. Sci. 2022, 5, 1511–1528. [Google Scholar] [CrossRef] [Scilit] [PubMed]
- Lopez-Joya, S.; Diaz-Garcia, J.A.; Ruiz, M.D.; Martin-Bautista, M.J. Bot Detection in Twitter: An Overview. In Proceedings of the Flexible Query Answering Systems (FQAS 2023); Larsen, H.L., Martin-Bautista, M.J., Ruiz, M.D., Andreasen, T., Bordogna, G., De Tré, G., Eds.; Lecture Notes in Artificial Intelligence; Springer: Cham, Switzerland, 2023; Volume 14113, pp. 131–144. [Google Scholar] [CrossRef] [Scilit] [PubMed]
- Alnahari, M. DeepBot: Bot Detection in Twitter Using Deep Learning Method for Social Media Security. In Proceedings of the Science, Engineering Management and Information Technology (SEMIT 2024); Mirzazadeh, A., Molamohamadi, Z., Erdebilli, B., Tirkolaee, E.B., Weber, G.-W., Dolgui, A., Eds.; Communications in Computer and Information Science; Springer: Cham, Switzerland, 2026; Volume 2444, pp. 308–323. [Google Scholar] [CrossRef] [Scilit]
- Feng, S.; Tan, Z.; Wan, H.; Wang, N.; Chen, Z.; Zhang, B.; Zheng, Q.; Zhang, W.; Lei, Z.; Yang, S.; et al. TwiBot-22: Towards Graph-Based Twitter Bot Detection. In Proceedings of the Advances in Neural Information Processing Systems 35 (NeurIPS 2022), Datasets and Benchmarks Track; Koyejo, S., Mohamed, S., Agarwal, A., Belgrave, D., Cho, K., Oh, A., Eds.; Curran Associates, Inc.: Red Hook, NY, USA, 2022; Volume 35, pp. 35254–35269. [Google Scholar] [CrossRef] [Scilit]
- Qi, S.; AlKulaib, L.; Broniatowski, D.A. Detecting and Characterizing Bot-Like Behavior on Twitter. In Proceedings of the Social, Cultural, and Behavioral Modeling (SBP-BRiMS 2018); Thomson, R., Dancy, C., Hyder, A., Bisgin, H., Eds.; Lecture Notes in Computer Science; Springer: Cham, Switzerland, 2018; Volume 10899, pp. 228–232. [Google Scholar] [CrossRef] [Scilit]
- Pedersen, M.Y.; Slavkovik, M.; Smets, S. Detecting Bots with Temporal Logic. Synthese 2023, 202, 79. [Google Scholar] [CrossRef] [Scilit]
- Chu, Z.; Gianvecchio, S.; Wang, H.; Jajodia, S. Detecting Automation of Twitter Accounts: Are You a Human, Bot, or Cyborg? IEEE Trans. Dependable Secur. Comput. 2012, 9, 811–824. [Google Scholar] [CrossRef] [Scilit]
- Mouronte-López, M.L.; Gómez Sánchez-Seco, J.; Benito, R.M. Patterns of human and bots behaviour on Twitter conversations about sustainability. Sci. Rep. 2024, 14, 3223. [Google Scholar] [CrossRef] [Scilit] [PubMed]
- Giroux, J.; Ariyarathne, G.; Nwala, A.C.; Fanelli, C. Unmasking social bots: How confident are we? EPJ Data Sci. 2025, 14, 18. [Google Scholar] [CrossRef] [Scilit]
- Cresci, S. A Decade of Social Bot Detection. Commun. ACM 2020, 63, 72–83. [Google Scholar] [CrossRef] [Scilit] [PubMed]
- Schoch, D.; Keller, F.B.; Stier, S.; Yang, J. Coordination Patterns Reveal Online Political Astroturfing across the World. Sci. Rep. 2022, 12, 4572. [Google Scholar] [CrossRef] [Scilit] [PubMed]
- Pacheco, D.; Hui, P.M.; Torres-Lugo, C.; Truong, B.T.; Flammini, A.; Menczer, F. Uncovering Coordinated Networks on Social Media: Methods and Case Studies. In Proceedings of the International AAAI Conference on Web and Social Media (ICWSM), Virtually, 7–10 June 2021; Volume 15, pp. 455–466. [Google Scholar] [CrossRef] [Scilit]
- Nizzoli, L.; Tardelli, S.; Avvenuti, M.; Cresci, S.; Tesconi, M. Coordinated Behavior on Social Media in 2019 UK General Election. In Proceedings of the International AAAI Conference on Web and Social Media (ICWSM 2021), Virtually, 7–10 June 2021; Volume 15, pp. 443–454. [Google Scholar] [CrossRef] [Scilit]
- Luceri, L.; Pantè, V.; Burghardt, K.; Ferrara, E. Unmasking the Web of Deceit: Uncovering Coordinated Activity to Expose Information Operations on Twitter. In Proceedings of the ACM Web Conference 2024 (WWW ’24), Singapore, 13–17 May 2024; pp. 2530–2541. [Google Scholar] [CrossRef] [Scilit]
- Nimmo, B. Measuring Traffic Manipulation on Twitter; Working Paper 2019.1, Project on Computational Propaganda; Oxford Internet Institute, University of Oxford: Oxford, UK, 2019. [Google Scholar]
- Murtfeldt, R.; Paik, S.; Alterman, N.; Kahveci, I.; West, J.D. RIP Twitter API: A eulogy to its vast research contributions. arXiv 2024, arXiv:2404.07340. [Google Scholar] [CrossRef] [Scilit]
- McInnes, L.; Healy, J.; Astels, S. hdbscan: Hierarchical density based clustering. J. Open Source Softw. 2017, 2, 205. [Google Scholar] [CrossRef] [Scilit]
- Shannon, C.E. A Mathematical Theory of Communication. Bell Syst. Tech. J. 1948, 27, 379–423. [Google Scholar] [CrossRef] [Scilit]
- McInnes, L.; Healy, J.; Melville, J. UMAP: Uniform Manifold Approximation and Projection for Dimension Reduction. arXiv 2018, arXiv:1802.03426. [Google Scholar] [CrossRef] [Scilit]
- Strona, G.; Nappo, D.; Boccacci, F.; Fattorini, S.; San-Miguel-Ayanz, J. A fast and unbiased procedure to randomize ecological binary matrices with fixed row and column totals. Nat. Commun. 2014, 5, 4114. [Google Scholar] [CrossRef] [Scilit] [PubMed]
- X Corp. Authenticity (Platform Manipulation and Spam Policy). X Help Center. 2026. Available online: https://help.x.com/en/rules-and-policies/authenticity (accessed on 13 June 2026).
- X Developers. Restricting Programmatic Replies to Combat Automated Reply Spam. X (@XDevelopers). 2026. Available online: https://x.com/XDevelopers/status/2026084506822730185 (accessed on 23 June 2026).
- Shao, C.; Ciampaglia, G.L.; Varol, O.; Yang, K.C.; Flammini, A.; Menczer, F. The Spread of Low-Credibility Content by Social Bots. Nat. Commun. 2018, 9, 4787. [Google Scholar] [CrossRef] [Scilit] [PubMed]
- Keller, T.R.; Klinger, U. Social Bots in Election Campaigns: Theoretical, Empirical, and Methodological Implications. Political Commun. 2019, 36, 171–189. [Google Scholar] [CrossRef] [Scilit]
- Stella, M.; Ferrara, E.; De Domenico, M. Bots Increase Exposure to Negative and Inflammatory Content in Online Social Systems. Proc. Natl. Acad. Sci. USA 2018, 115, 12435–12440. [Google Scholar] [CrossRef] [Scilit] [PubMed]
- Yang, K.C.; Hui, P.M.; Menczer, F. How Twitter Data Sampling Biases U.S. Voter Behavior Characterizations. PeerJ Comput. Sci. 2022, 8, e1025. [Google Scholar] [CrossRef] [Scilit] [PubMed]

Disclaimer/Publisher’s Note: The statements, opinions and data contained in all publications are solely those of the individual author(s) and contributor(s) and not of MDPI and/or the editor(s). MDPI and/or the editor(s) disclaim responsibility for any injury to people or property resulting from any ideas, methods, instructions or products referred to in the content. |
© 2026 by the authors. Licensee MDPI, Basel, Switzerland. This article is an open access article distributed under the terms and conditions of the Creative Commons Attribution (CC BY) license.