


Abstract
The in-service assessment of marine propulsion engines requires more than nominal rating comparison because operating severity is shaped by propeller demand, resistance growth, air-path response, and thermal state. This study develops a quantitative benchmarking method for the regime-dependent performance assessment of a low-speed two-stroke Wärtsilä 6RT-flex58T-D engine installed on a 31,000 DWT multi-purpose container vessel. The method integrates certified sea-trial measurements, endurance-test records, manufacturer load-diagram constraints, and a 15% service-margin projection within one reference framework. Three representative regimes are evaluated: a measured light-running baseline (SR1), a measured thermally stabilised sustained regime (SR2), and a projected heavy-running regime derived from the baseline using a 15% sea-margin assumption (R2). Comparison is performed using indicators of operating-point position, shaft torque, propeller-law consistency, selected air-path and thermal variables, load-diagram proximity, and corrected specific fuel oil consumption where available. The SR1 baseline followed the fitted propeller law with deviations not exceeding 1.18%, confirming a coherent light-running reference. In SR2, corrected SFOC decreased from 174.4 to 172.0 g/kWh, while the exhaust temperature before turbine increased from 359 °C to 435 °C, and the corresponding thermal margin decreased from 156 °C to 80 °C. Under the +15% service-margin projection, the required shaft power at the 100% trial point increased from 12,046.0 to 13,852.9 kW, exceeding the 13,560 kW installation MCR by 2.2%, with corresponding 15% increases in torque and BMEP. These results demonstrate that measured baseline operation, sustained-load severity, and projected heavy-running demand can be distinguished quantitatively within one installation-specific load-diagram-based benchmarking framework.
1. Introduction
The in-service assessment of marine propulsion engines cannot rely on nominal rating data alone, because the actual operating condition of a ship differs substantially from the controlled assumptions used for test-bed certification and design-point specification. In service, the engine operating point is determined by the coupled effects of hull resistance, propeller demand, loading condition, weather, draught variation, and the response of the air and control systems [1,2,3]. As a result, the same nominal load level may correspond to a different torque demand, thermal state, air-supply adequacy, and operating reserve. This issue is particularly important for low-speed two-stroke engines driving fixed-pitch propellers, where increased resistance tends to shift the operating point towards lower-speed, higher-torque regions associated with reduced scavenging margin and higher thermal severity [1,4,5]. This interpretation is consistent with standard low-speed two-stroke propulsion behaviour and with the fixed-pitch propeller operating guidance given by the manufacturer [3,6].
Manufacturer load diagrams provide the admissible operating envelope for a given engine installation and define the principal mechanical and thermodynamic constraints that govern continuous service, overload, and transient operation [3]. However, practical propulsion assessment requires more than identifying whether a measured point lies inside or outside that envelope. What is often needed in engineering practice is a quantitative basis for comparing how far an operating point has migrated from a validated baseline, how sustained service modifies thermal exposure and air-path behaviour, and how increased resistance or manoeuvring conditions reduce the available operating margin [5,7,8]. In this sense, the load diagram is most useful when combined with measurable regime-specific indicators rather than being treated only as a static compliance chart [8,9]. In the present case, the relevant manufacturer-defined constraints are the continuous operating region, the admissible low-speed torque boundary (Line 5), and the transient service boundary (Line 6), as defined in the Wärtsilä operating documentation [3]. These limits are operationally critical because the approach to Line 5 reflects rising low-speed torque demand and reduced scavenging-air adequacy, whereas the approach to Line 6 denotes a time-limited operating region with increased thermal load and less favourable cylinder flushing conditions.
Recent studies have examined marine propulsion performance from several complementary viewpoints. Off-design engine behaviour and altered propulsion operating windows have been analysed for containership applications, while integrated ship–engine–propeller matching under severe sea conditions has also been addressed in recent optimisation studies [4,10,11]. In parallel, hull and propeller degradation, including biofouling-related deterioration, have been investigated as service-related causes of additional resistance, speed loss, and increased propulsion demand under real operating conditions [12,13]. Additional work has also considered the influence of turbocharger performance decay on marine-engine behaviour and the use of data-driven methods for marine diesel engine performance assessment and early warning [14,15]. Recent full-scale studies have also examined the performance behaviour of low-speed two-stroke marine diesel engines under actual sea-operation conditions, confirming the continuing relevance of installation-specific performance interpretation [16].
Recent diagnostic work has also moved towards first-principles digital twins and experimental large-engine datasets, showing that engine-health interpretation increasingly relies on calibrated reference conditions and measured operating variables rather than rating data alone [17,18]. Long-term full-scale propulsion studies have further shown that hull and propeller fouling can increase required shaft power markedly, while biofouling assessment methods now explicitly link speed–power prediction to safety, fuel consumption, and emissions under service conditions [19,20]. Interpretable operational-data models have likewise been used to predict shaft power, fuel consumption, and speed under the combined influence of hull fouling and weather, while in-service resistance modelling has confirmed that wind, waves, currents, loading condition, and speed range can create measurable deviations from model-test or clean-condition behaviour [21,22]. On the engine side, recent two-stroke investigations have shown that scavenging-air pressure and temperature strongly affect power, mean effective pressure, thermal efficiency, and emission behaviour, while numerical exergy analysis has confirmed the sensitivity of two-stroke engine performance to scavenge-air temperature and injection-related operating parameters [23,24]. Data-driven and hybrid physics–machine-learning approaches have also been proposed for fuel-consumption and propulsion-efficiency prediction, reinforcing the need to combine measurable operating variables with physically interpretable performance indicators [25,26]. Recent propulsion-system modelling and shop-versus-sea comparisons further support the view that onboard or vessel-specific operating evidence is necessary when comparing engine performance under controlled and real service conditions [27,28].
Despite these advances, the recent literature does not yet provide a compact installation-specific comparison framework that places measured sea-trial baseline data, measured sustained-load data, and analytically projected heavy-running demand within one common manufacturer-referenced load-diagram basis. Most available studies focus on thermodynamic simulation, degradation modelling, or data-driven monitoring separately, whereas practical in-service propulsion assessment often requires a disciplined comparison between baseline condition, sustained-load severity, and projected off-design demand using documentary evidence from one specific installation.
The present study addresses this need by developing a quantitative benchmarking method for regime-dependent propulsion assessment of a low-speed two-stroke Wärtsilä 6RT-flex58T-D engine installed on a 31,000 DWT multi-purpose container vessel. The method integrates certified sea-trial measurements, endurance-test records, manufacturer load-diagram constraints, and a 15% service-margin projection within one common reference framework. Three representative regimes are evaluated: a measured light-running baseline (SR1), a measured thermally stabilised sustained regime (SR2), and a projected heavy-running regime derived from the validated baseline (R2). The comparison is performed using a compact set of derived indicators including normalised operating-point coordinates, shaft torque, brake mean effective pressure, propeller-law consistency, selected air-path and thermal variables, load-diagram proximity, and corrected specific fuel oil consumption where documented.
The novelty of the study lies in establishing an installation-specific benchmarking framework that integrates measured sea-trial baseline data, measured sustained-load endurance data, and analytically projected heavy-running demand within one common manufacturer-referenced load-diagram basis for quantitative regime comparison. By distinguishing measured, derived, and analytically projected evidence within a single analytical framework, the study aims to support a more disciplined comparison between baseline operation, sustained-load severity, and projected heavy running demand. Within this structure, baseline operation, sustained-load severity, and projected heavy running can be compared on the same reference basis using indicators that remain traceable to certified vessel documentation.
2. Materials and Methods
2.1. Case-Study Vessel and Propulsion System
The quantitative assessment is based on a 31,000 DWT multi-purpose container vessel equipped with a single right-hand fixed-pitch propeller arrangement. The principal particulars of the case-study vessel are summarised in Table 1. The vessel is powered by a low-speed two-stroke Wärtsilä 6RT-flex58T-D Tier II (Hudong Heavy Machinery Co., Ltd., Shanghai, China) main engine directly coupled to the shaft line [3]. This type of installation is suitable for quantitative propulsion benchmarking because shaft speed, propeller demand, and engine load remain directly coupled, allowing operating-point migration to be interpreted directly against the manufacturer load diagram [2,4].
Table 1.
Vessel particulars.
For the present study, the case vessel is used as an installation-specific rating basis for regime comparison. The installed engine rating adopted from the certified vessel documentation is 13,560 kW at 105 rpm for MCR, while the service reference used in the propulsion analysis is 8136 kW at 88.6 rpm for CSR. These values are only used as the vessel-specific normalisation basis, the interpretation of CSR, sea margin, and permissible operating regions follow the manufacturer’s load-diagram framework.
The propulsion arrangement is especially suitable for this analysis because the sea-trial documentation provides certified steady propulsion measurements, and endurance-load records for the same installation. This makes it possible to compare baseline, sustained, and projected heavy-running conditions within one vessel-specific reference framework rather than against nominal catalogue values alone.
The documentary source base used in this study comprises certified ship sea-trial records, endurance-test documentation, and manufacturer operating documentation. The sea-trial and endurance records provide the measured shaft speed, shaft power, ship speed, and selected thermal and air-path variables used in the quantitative regime comparison, whereas the manufacturer documentation is used only as a reference source for engine geometry, load-diagram boundaries, and alarm/reference values.
Accordingly, the present work is an installation-specific analytical assessment based on certified ship trial and endurance documentation, with manufacturer operating data used only as reference constraints for interpretation. This distinction is consistent with recent shop-versus-sea comparisons, which show that controlled test-cycle conditions and onboard sea-operation data may lead to different thermal, fuel-consumption, and engine-performance signatures [28].
2.2. Reference Operating Envelope and Indicator Basis
The propulsion plant is assessed using the manufacturer load diagram as the common reference frame for all representative regimes. In a directly coupled fixed-pitch propeller installation, shaft power demand follows the propeller characteristic as a function of rotational speed, while hull and environmental resistance determine the displacement of the operating point relative to the nominal trial curve [2,3,4]. Consequently, operating severity must be interpreted through the position of the working point in the power-speed field rather than from nominal load percentage alone.
For the present quantitative assessment, only those engine and propulsion characteristics that directly affect indicator definition are retained. First, the MCR point is used as the primary rated reference for normalised operating-point coordinates and for comparison with the admissible operating envelope. Second, the CSR point provides the practical service reference associated with sustained propulsion duty. Third, the manufacturer load-diagram boundaries define the engineering constraints used in the present comparison, specifically the recommended continuous operating region, the admissible low-speed torque boundary (Line 5), and the transient service boundary with operational time limit (Line 6) [3].
The selected engine is a low-speed crosshead two-stroke unit with exhaust-gas turbocharging, uniflow scavenging, and electronically controlled common-rail fuel injection and exhaust-valve actuation [1,3]. For the purposes of this article, these features are important mainly because they influence the relation between demanded torque, air-path adequacy, and thermal response under changing operating conditions. In steady operation, the air and exhaust system can be evaluated through stabilised indicators such as scavenge pressure, turbocharger speed, and exhaust-side temperature level [5,6,7].
Within this framework, the method focuses on operating-point position, shaft torque, derived brake mean effective pressure used here as a comparative normalised indicator, selected air-path and thermal indicators, and proximity to limiting load-diagram boundaries. The purpose of this section is therefore to define the installation-specific reference basis required for the regime-dependent calculations presented below.
It should be noted that the manufacturer load diagram and operating documentation are not treated here as substitutes for realised service measurements. Rather, they are used as installation-specific reference constraints against which the measured sea-trial and endurance operating points are interpreted. The actual measured points remain vessel-specific and reflect the documented sea-trials and endurance conditions rather than idealised engine-shop operating conditions. A similar distinction is made in recent in-service resistance modelling, where operational data have been used to identify deviations from model-test or clean-condition behaviour under varying environmental, loading, and speed conditions [22].
2.3. Operational Definition of Representative Regimes
The regime comparison developed in this study is based on the sea-trial documentation of the case vessel and uses the manufacturer load diagram as the common reference frame for all operating regimes. For the purposes of the present quantitative assessment, regime definition is based on the type of available evidence, the physical interpretation supported by that evidence, and the comparison role assigned to each operating state.
The available trial programme provides two primary data groups relevant to regime identification: steady propulsion measurements and endurance-load records. Only measurement systems and trial records directly related to the variables used in the quantitative analysis are reported here, namely shaft power, shaft speed, ship speed, corrected SFOC, scavenge pressure, turbocharger speed, and exhaust-gas temperatures. The steady propulsion measurements supply the baseline shaft-speed, shaft-power, and ship-speed data required to define the light-running reference condition. The endurance records provide sustained-load information together with selected air-path and thermal variables, including scavenge pressure, turbocharger speed, and exhaust-gas temperatures.
The measurement basis of the present study follows the certified ship trial documentation. Trial speed and manoeuvrability measurements were performed using a THALES 3011 DGPS system (Sercel Co., Carquefou, France), for which the trial report states a maximum dynamic location error of less than 5 m. Propeller-shaft power measurement was based on a CK-II steel-cord strain-gauge system with sleeve and afflux-ring transducer arrangement and steel-cord sensors mounted on the shafting. The ship-speed and shaft-power measurements were carried out simultaneously during the reciprocal speed-trial runs. According to the trial documentation, ten speed-trial runs were performed under five load conditions, with paired headings used to obtain the mean shaft-power and mean-speed values.
The environmental and trial conditions reported in the source documentation include the East China Sea as the sea area: sea state 3–4, sea water temperature 25 °C, water density 1.027 t/m3, and water depth of approximately 66 m. These details are reported here to clarify the documented measurement context. The present paper does not reprocess raw sensor signals or calibration files and it uses the certified reported values contained in the sea-trial and endurance records.
Complete calibration certificates and full uncertainty documentation for all measured quantities were not available to the authors. Therefore, the present analysis treats the sea-trial and endurance data as certified reported trial values and does not attempt to reconstruct a complete metrological uncertainty chain. Instead, the influence of measurement precision is considered in relation to the comparative purpose of the study and to the sensitivity of the derived indicators. Because operational datasets may contain sensor scatter, outliers, and environmental variability, recent ship-performance studies emphasise data preparation, physically interpretable variable selection, and careful separation of measured and derived quantities before drawing conclusions from shaft power, speed, and fuel-consumption trends [21,25].
This limitation has a restricted effect on the main interpretation because the study compares operating regimes rather than attempting to certify absolute engine performance. Shaft torque is proportional to shaft power and inversely proportional to rotational speed, while BMEP is derived from shaft torque and fixed engine geometry. Consequently, uncertainty in shaft power and speed propagates into torque and BMEP, but it does not change the evidential distinction between SR1 as the measured baseline, SR2 as the measured sustained-load regime, and R2 as an analytically projected +15% demand case. The projected exceedance of the installation MCR in R2 should therefore be interpreted as a nominal calculated demand based on the certified trial data, rather than as a directly measured overload condition. The broader regime comparison remains governed by the measured baseline relation, the sustained-load endurance records, and the imposed service-margin projection.
Accordingly, the representative regimes are defined so that the source of evidence remains explicit throughout the analysis, clearly distinguishing measured regimes from analytically projected.
Within the revised framework, three representative regimes are used:
- SR1 (Measured Light-Running Baseline): steady sea-trial speed-power measurements obtained under clean-hull and favourable trial conditions. SR1 provides the validated vessel-specific reference for operating-point coordinates, propeller-law fit, shaft torque, and derived BMEP.
- SR2 (Measured Sustained-Load Regime): endurance-test records at fixed load after sufficient holding time to establish thermal stabilisation. In the present dataset, SR2 is used to evaluate stabilised scavenge pressure, turbocharger speed, exhaust-gas temperatures, corrected SFOC, and derived brake efficiency where documented.
- R2 (Projected Heavy-Running Regime): analytically projected service condition obtained by applying a 15% sea-margin factor to the validated SR1 baseline at the same shaft speed. R2 is treated as an analytically projected off-design state used to quantify increased shaft-power demand, torque, BMEP, and proximity to the manufacturer-defined Line 5 and Line 6 boundaries.
The comparison role of each regime is therefore distinct. SR1 supplies the measured baseline from which operating-point migration is assessed. SR2 supplies the stabilised sustained-load reference needed for thermodynamic interpretation. R2 supplies the projected heavy-running condition needed to quantify service-related margin erosion relative to the baseline. This structure allows the subsequent methodology to distinguish consistently between measured, derived, and projected quantities, thereby reducing ambiguity in the treatment of off-design propulsion behaviour [4].
For clarity, the evidential status of the three regimes may be summarised as follows: SR1 and SR2 are based on measured trial documentation and support further derived indicators, while R2 is analytically projected from measured baseline data. In this way, the regime set functions as an operational comparison protocol rather than as a purely descriptive classification of engine behaviour. The evidential status and analytical role of the three representative regimes are summarised in Table 2.
Table 2.
Operational definition of representative regimes.
2.4. Methodology and Performance Indicators
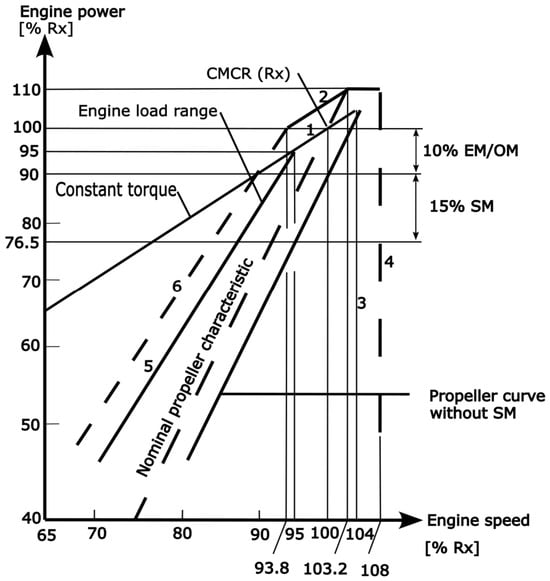
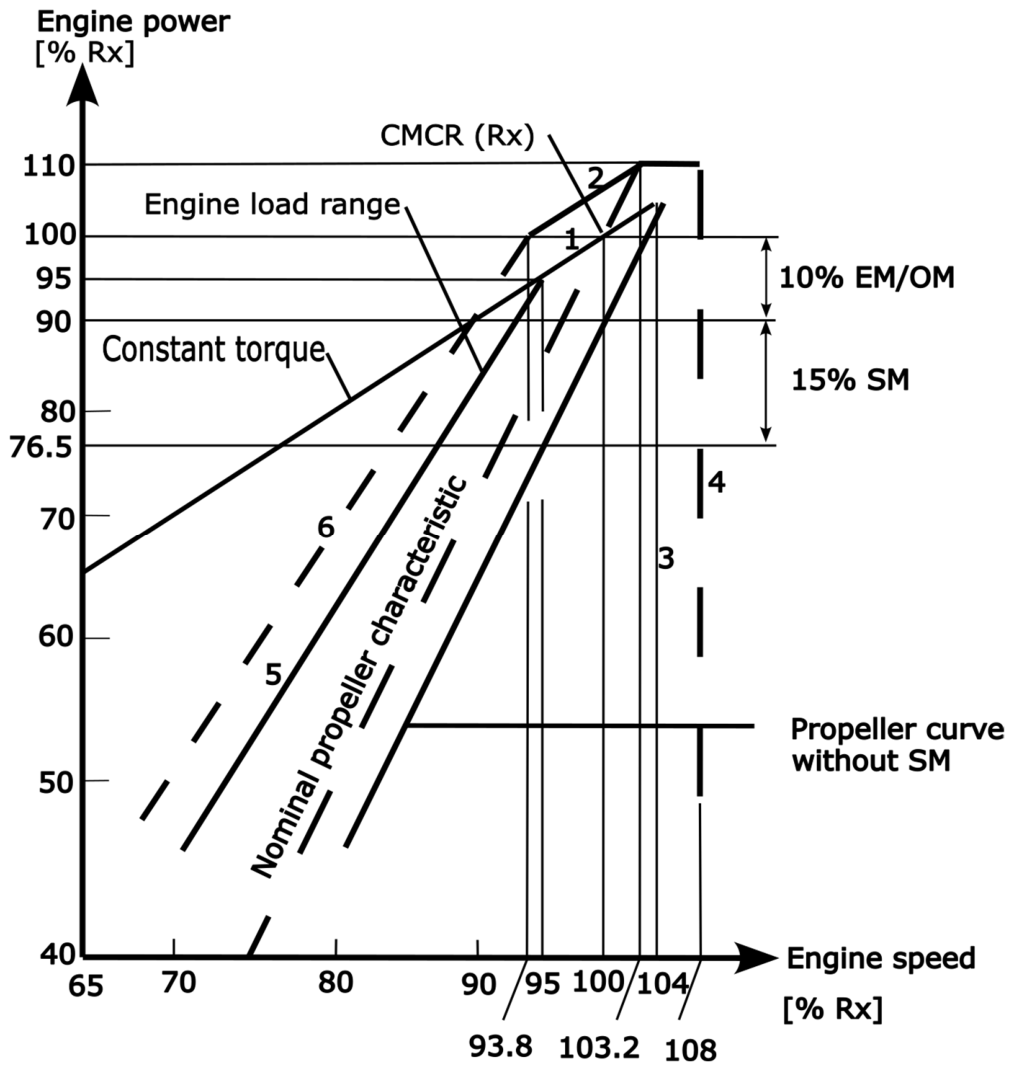
To assess regime-dependent engine behaviour within the manufacturer-defined operating envelope, the engine load diagram (Figure 1) is used as the common reference basis. Representative operating points derived from sea-trial and endurance documentation are interpreted relative to the recommended continuous operating region, the constant-mep/torque line through CMCR (Line 1), the overload limit (Line 2), the admissible low-speed torque boundary (Line 5), and the transient service range with operational time limit (Line 6). In this way, changes in operating regime are treated as measurable variations in operating-point position, mechanical loading, thermal state, and proximity to limiting conditions. Figure 1 serves as the benchmark grid where the migration of SR1 to R2 is quantified.
Figure 1.
Engine load diagram. Adapted from [3].
The methodology follows the three representative regimes defined in Section 2.3. For SR1, the purpose is to establish the validated baseline propulsion characteristic under light-running sea-trial conditions. For SR2, the purpose is to quantify stabilised sustained-load behaviour using thermal, air-path, and fuel-related indicators available from the sea-trial records. For R2, the purpose is to project the heavy-running service condition analytically from the SR1 baseline by applying a representative sea margin.
Within this framework, engine performance is evaluated in three interrelated domains: mechanical load, thermodynamic stability, and fuel-consumption. The selected indicators are intentionally restricted to quantities that can be obtained directly or derived consistently from the sea-trial documentation or during ship operations. This preserves a clear distinction between measured, calculated, and projected quantities. The use of torque, BMEP, air-path indicators, and fuel-consumption variables is also consistent with recent marine-engine health-assessment studies, where calibrated reference states and measured operating parameters are used to describe deviations across the operating envelope [17].
The performance assessment is executed within the manufacturer’s load-diagram coordinates (power versus speed), using the load diagram as a non-dimensional reference framework for the measured and analytically projected regimes considered in the present study. Within this framework, engine behaviour is evaluated across three principal performance domains: mechanical loading, thermodynamic/air-path response, and fuel consumption. In addition, boundary proximity is used as a regime-comparison measure to quantify how closely the operating point approaches manufacturer-defined operating limits. To quantify the migration of the operating point across the defined regimes (SR1, SR2, and R2), the following indicators are utilised:
- Mechanical loading: position of the operating point relative to the nominal propeller curve and the manufacturer-defined torque-related boundaries (Line 5 and Line 6). Brake Mean Effective Pressure (BMEP) is used as a normalised indicator of engine torque demand and load intensity.
- Thermodynamic and air-path response: evaluation of stabilised indicators from SR2 records, including scavenge air pressure (), turbocharger speed (), and exhaust gas temperatures (), which characterise air-supply response and thermal loading under sustained operation.
- Fuel consumption: corrected Specific Fuel Oil Consumption (SFOC), adjusted to ISO reference conditions to ensure comparability between documented trial measurements and in-service regime interpretation.
- Margin proximity: quantitative distance or proximity of projected operating points (R2) to the manufacturer-defined operating boundaries, used to assess operational safety, reserve reduction, and potential exposure to increased mechanical or thermal severity.
2.4.1. SR1 Baseline Indicators
In the SR1 regime, baseline light-running behaviour is quantified using the sea-trial propulsion characteristic. The reserve associated with light-running operation is expressed through the light running margin (LRM), defined as the relative difference between the measured light-running propeller-curve speed and the nominal propeller-characteristic speed at equal absorbed power:
A positive LRM indicates light-running behaviour, i.e., higher shaft speed than the nominal propeller characteristic at equal absorbed power.
The SR1 input data are summarised in Table 3.
Table 3.
Measured sea-trial baseline data 1 for SR1.
The percentage load labels in Table 3 follow the sea-trial documentation nomenclature and are retained only as point identifiers. They do not represent exact fractions of the installation MCR adopted for normalisation.
For a fixed-pitch propeller (FPP), the engine operating point is largely dictated by the propeller absorption characteristic. In calm-water/light-running conditions, the absorbed power can be approximated by the propeller law:
where
- is the shaft power.
- is the shaft rotational speed.
- is the propeller power coefficient obtained by least-squares regression of the SR1 dataset in Table 3.
This is consistent with the approximate cubic propeller characteristic used by the manufacturer for fixed-pitch propeller installations.
In SR1, engine performance is treated in the narrow but rigorous sense of propulsive capability under baseline matching, quantified by:
- Operating point coordinates (normalised). These allow direct placement on the engine load diagram and easy comparison across regimes.
- Delivered shaft torque (mechanical loading). Torque is the direct mechanical quantity behind “heavy running”: increased hull resistance pushes the propeller curve and raises torque demand.
- 3.
- Brake Mean Effective Pressure (BMEP) as a load intensity metric. BMEP is highly useful because it compares operating severity independently of speed, and it ties naturally to constant-MEP boundaries on the load diagram. In the present study, BMEP is used only as a derived comparative load-intensity indicator and not as a primary onboard measured variable. For a two-stroke engine, BMEP may be written equivalently as:
In the present calculations, the equivalent torque-based form, Equation (9), is used after shaft torque has been derived from the measured power and speed. First, compute total swept volume using engine geometry (number of cylinders i, bore , stroke ):
For the Wärtsilä 6RT-flex58T-D (i = 6, D = 0.58 m, S = 2.416 m), the resulting total swept volume is
Then:
- 4.
- Propeller-law fit quality (validation of baseline condition). Once is calibrated from a reference point, the other SR1 points should follow . Small deviations indicate measurement scatter and minor environmental effects, while large deviations would indicate either non-steady points or a mismatch in the assumed law.
2.4.2. SR2 Sustained-Load Indicators
For SR2, the methodology retains the same core mechanical indicators used in SR1, because the operating point is still defined by shaft power and shaft speed. The additional use of scavenge pressure and exhaust-side temperature is supported by recent two-stroke engine studies showing that scavenging-air pressure, scavenging-air temperature, and thermal boundary conditions influence mean effective pressure, thermal efficiency, combustion behaviour, and exergy-related performance [23,24]. However, SR2 extends the evaluation by adding thermal, air-path, and fuel-consumption indicators that are meaningful only under sustained and thermally stabilised conditions.
Thermodynamic stability is evaluated from the response of key process variables during sustained-load operation, notably scavenge pressure and exhaust-gas temperature , with deviations interpreted against the steady-state expectations specified in the engine documentation. The sustained-load input data used for SR2 are summarised in Table 4.
Table 4.
Input data table for SR2 1.
For SR2, the same normalised operating-point coordinates, and shaft torque definitions introduced in Equations (3)–(5) are used.
Torque is the most direct indicator of “how hard” the engine is being loaded mechanically for a given speed.
Using the total swept volume , BMEP, as defined in Equation (9), provides a robust comparison of operating severity between the 60% and 90% sustained-load points even if speeds differ. .
Corrected specific fuel oil consumption (SFOC) was taken directly from the documented sea-trial oil-consumption records after application of the trial correction procedure. In the present study, corrected SFOC is therefore treated as a reported trial quantity rather than being recalculated independently from interval fuel mass. The corresponding trial sheets provide the measured fuel-consumption interval, the lower-calorific-value correction factor, the ISO correction coefficient, and the final corrected SFOC used here for comparison. The trial-sheet correction procedure is acknowledged as the source of the reported corrected SFOC values, but it is not reproduced here as an independent calculation step.
Brake thermal efficiency
When corrected SFOC and fuel LCV are known, the brake thermal efficiency can be computed cleanly without fuel flow time-series:
with:
- in kg/kWh,
- in kJ/kg.
SR2 provides stabilised temperatures and turbocharger speed, allowing compliance margins to be quantified as follows:
Exhaust gas temperature margin (turbocharger inlet/before turbine):
with . The adopted reference value of 515 °C corresponds to the high alarm setting before each turbocharger in the engine operating data sheet.
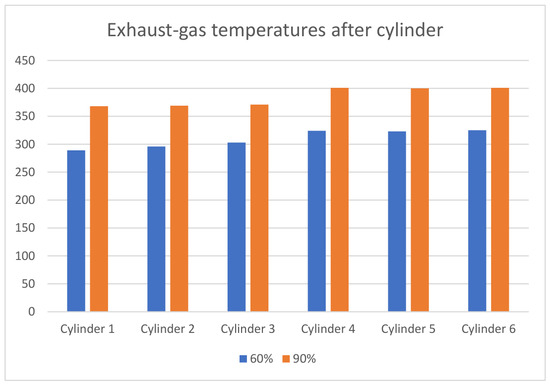
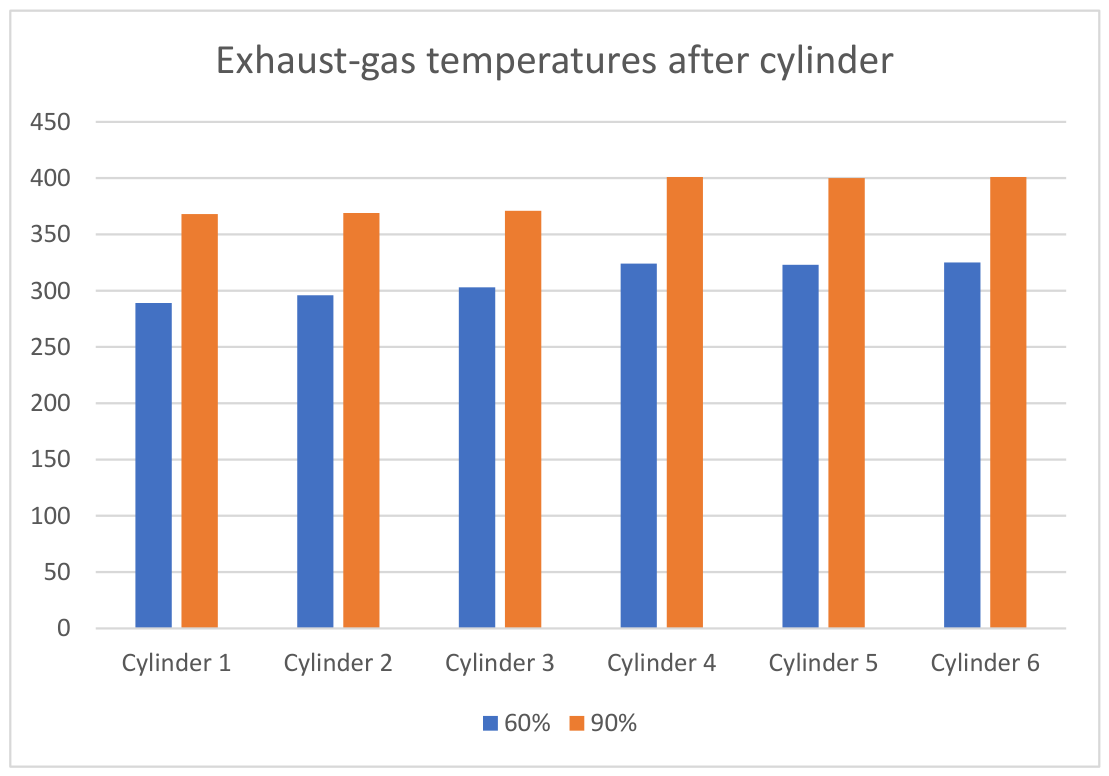
In addition to the averaged exhaust-temperature indicators, the cylinder-outlet exhaust-gas temperatures are examined as a supplementary indicator of thermal uniformity under sustained-load conditions. Figure 2 compares the per-cylinder exhaust-gas temperatures at the 60% and 90% SR2 reference points, thereby providing a more detailed view of the thermal distribution across the engine.
Figure 2.
Exhaust-gas outlet temperatures at the 60% and 90% SR2 sustained-load points per cylinder.
Turbocharger speed margin (overspeed alarm):
with rpm. The turbocharger speed margin was referenced to the documented overspeed alarm threshold. Where expressed in rpm, the threshold value was converted from the corresponding turbocharger alarm setting used in the trial documentation.
For SR2, the upper sustained-load point is particularly useful because it provides the most thermally severe stabilised condition in the available endurance dataset and includes documented corrected SFOC.
Reference rating constants: , , .
2.4.3. R2 Heavy-Running Projection
The R2 heavy-running regime is modelled by applying a 15% service sea margin to the sea-trial baseline, producing projected operating points on the engine load diagram. These points may then be examined relative to the manufacturer-defined limit lines, with particular attention to the admissible low-speed torque boundary.
A heavy-running condition behind a fixed-pitch propeller can be described in two complementary ways:
- Demand-increase view. For a given propeller speed, increased resistance requires more delivered shaft power and torque. This is directly represented by applying a sea margin factor to the SR1 power demand at each point.
- Power-limited response view. If the engine cannot supply the increased demanded power (governor limit, fuel index limit, smoke limit, and thermal limit), the rpm typically drops, and the operating point shifts towards the low-speed/high-torque area. This is why heavy running is associated with reduced scavenge air margin and higher thermal stress.
Comparable full-scale fouling and biofouling studies have shown that deterioration of hull and propeller condition can increase the shaft power required at a given operating condition, which supports using a demand-increase projection as a conservative service-margin scenario rather than as a directly measured heavy-running record [19,20].
R2 uses the SR1 mechanical indicators and extends them with limit-proximity metrics derived from the engine load diagram boundaries.
- (1)
- Sea margin projection of shaft power:
- (2)
- Projected torque at the same rpm
At constant rpm (same propeller speed), torque scales with power:
- (3)
- Projected BMEP
With constant engine geometry:
- (4)
- To express how close a projected operating point lies to the manufacturer-defined low-speed restriction region, the Line 5 and Line 6 boundary functions are used as reference curves in normalised load-diagram coordinates. Line 5 represents the admissible low-speed torque boundary for steady operation and is associated with progressively reduced scavenge-air adequacy as it is approached. Line 6 represents the upper transient service boundary and bounds the service range with the operational time limit, which the manufacturer restricts to short-duration operation. As a benchmark, overload operation is limited to a maximum of one hour [3]. The corresponding indices and are therefore not direct physical efficiencies or pressures. They are dimensionless boundary-proximity measures referenced to the manufacturer load diagram. In practical terms, each proximity index is calculated as the ratio between the projected R2 normalised power and the corresponding Line 5 or Line 6 reference-function value evaluated at the same normalised shaft speed.
Load-diagram boundary functions (Line 5 and Line 6) used as manufacturer-defined proximity references:
Line 5 is represented as a power law in the load diagram:
(at 95% speed, 95% power).
Line 6 (operational time-limit boundary/transient service boundary) is represented similarly:
(at 93.8% speed, 100% power).
- (5)
- Proximity indices (dimensionless and easy to interpret)
A load-diagram proximity index is defined:
Low-speed torque/scavenge-margin proximity (Line 5):
Transient service-range proximity (Line 6):
Values approaching 1 indicate increasing proximity to the corresponding manufacturer-defined boundary. Thus, expresses closeness to the admissible low-speed torque/reduced-scavenge-margin limit, whereas expresses closeness to the transient service boundary with operational time limit. Operation above Line 5 and up to Line 6 is permitted only for short periods under transient conditions.
Where the projected demand exceeds the installation MCR in the normalised load-diagram sense, the R2 point should be interpreted as a demanded quasi-steady operating state rather than a guaranteed realised steady operating condition.
2.4.4. Quantitative Workflow and Integration
The quantitative workflow is organised in three sequential analytical stages to ensure a disciplined comparison between baseline, sustained-load, and off-design operating conditions:
- Baseline characterisation (SR1): Establishes the benchmark propulsion characteristic from certified sea-trial data through the relation between shaft power and shaft speed under favourable trial conditions. This stage defines the baseline reference against which subsequent regime migration is evaluated.
- Sustained-load validation (SR2): Integrates endurance-test records to define the thermally stabilised operating condition of the engine. In this stage, the assessment incorporates air-path and thermal-response indicators, providing the basis for brake efficiency and SFOC assessment.
- Off-design evaluation (R2): Analytically projects the SR1 baseline using the adopted service-margin assumption in order to quantify the increase in required power, torque demand, BMEP, and proximity to the manufacturer-defined Line 5 and Line 6 boundaries.
This multi-stage integration allows the manufacturer load diagram to be used as a structured diagnostic framework for distinguishing between measured baseline behaviour, sustained-load response, and analytically projected heavy-running conditions.
3. Results
3.1. Regime Quantification
The following results present the calculated operating indicators for the representative regimes defined in Section 2. The calculations are organised regime by regime in order to quantify baseline light-running behaviour (SR1), thermally stabilised sustained operation (SR2), and projected heavy-running conditions (R2). All calculated values are interpreted within the common reference frame of the manufacturer load diagram, allowing direct comparison of operating-point migration, margin reduction, and changes in mechanical and thermodynamic behaviour across regimes.
3.1.1. SR1
Reference rating constants used for normalisation were and . For SR1 100% point (mean values): , , and .
Normalised coordinates:
Shaft torque:
Engine geometry: , ,
Using
The corresponding values are then computed as at the other SR1 points to evaluate the deviation. Small deviations confirm that SR1 is a consistent baseline propeller curve.
The derived SR1 baseline indicators are summarised in Table 5. The deviation is calculated as the absolute percentage difference between measured shaft power and propeller calculated power as .
Table 5.
Derived baseline indicators for SR1.
Table 5 confirms that SR1 forms a coherent light-running baseline. Over the analysed range, shaft torque increases from 644.0 to 1094.6 kN·m and BMEP from 10.56 to 17.96 bar, while the fitted propeller-law deviation remains within 0.00–1.18%. This small deviation band supports the use of SR1 as the validated baseline reference for subsequent comparison. From an engineering perspective, the most important result in Table 5 is not only the increase in shaft power with speed, but the consistency of the complete mechanical trend. Between the 45% and 100% trial points, shaft speed increases by about 31%, whereas shaft power increases by about 123%, which is consistent with the expected cubic character of fixed-pitch propeller absorption. Over the same interval, torque and BMEP increase by approximately 70%, showing that the baseline curve represents a progressive mechanical loading trend rather than a set of isolated trial measurements. The 100% sea-trial point is also significant because the measured speed is practically equal to the MCR reference speed, while the measured shaft power remains below the installation MCR. This confirms that SR1 represents a light-running clean-hull trial condition and provides a suitable reference from which later increases in torque demand, BMEP, and load-diagram proximity can be evaluated. Small deviations from the fitted propeller law, especially the maximum deviation of 1.18% at the 75% point, are therefore interpreted as normal trial scatter and environmental influence rather than as evidence of an inconsistent baseline. This low deviation is important because recent in-service resistance studies show that environmental effects, loading condition, and speed range can noticeably separate operational behaviour from clean or model-test references. Therefore, the small SR1 deviation band strengthens its role as a controlled baseline in the present dataset [22].
3.1.2. SR2
SR2 is evaluated using two documented sustained-load reference sets: the endurance-load record for mechanical, thermal, and air-path indicators, and the oil-consumption report for corrected SFOC and brake thermal efficiency.
For the upper sustained-load reference point, the endurance-load record gives the following mechanical and thermal indicators:
Brake thermal efficiency was derived directly from the reported corrected SFOC and fuel LCV. Using the reported corrected SFOC of and fuel lower calorific value of 40,185 , the brake thermal efficiency at the stabilised 90% oil-consumption point is:
Exhaust temperature margin (before turbine):
Turbocharger speed margin:
The full set of derived sustained-load indicators for SR2 is summarised in Table 6.
Table 6.
Derived sustained-load indicators for SR2 1.
Table 6 shows that the transition from the 60% to the 90% sustained-load point is accompanied by a clear tightening of thermal and air-path reserve. Shaft torque increases from 769 to 1069 kN·m and BMEP from 12.62 to 17.54 bar, while scavenge pressure, turbocharger speed, and exhaust temperature before turbine all increase. At the same time, the available thermal margin decreases from 156 °C to 80 °C, indicating a thermally more severe sustained-load condition despite the modest improvement in corrected SFOC. Table 6 therefore shows that the sustained-load response cannot be evaluated from corrected SFOC alone. From the 60% to the 90% sustained-load point, shaft power increases by about 59%, while shaft torque and BMEP increase by about 39%. This indicates a clear increase in mechanical load intensity, but the thermal and air-path indicators increase even more strongly in relative terms. Scavenge pressure rises from 1.75 bar to 3.10 bar, corresponding to an increase of about 77%, while turbocharger speed rises by about 23%. The exhaust temperature before the turbine increases by about 21%, and the turbine temperature drop increases from 132 °C to 186 °C, showing that a greater exhaust-energy flow is associated with the higher sustained-load point. At the same time, the thermal margin before the turbine is reduced by almost half, from 156 °C to 80 °C, and the turbocharger-speed margin decreases from 6572 rpm to 4202 rpm. These changes show that the 90% sustained-load point is more efficient in terms of corrected SFOC, but also operates with reduced thermal and air-path reserve. The modest improvement in corrected SFOC from 174.4 to 172.0 g/kWh should therefore be interpreted as a fuel-efficiency tendency under stabilised load, not as evidence of a less severe operating condition.
The simultaneous increase in scavenge pressure, turbocharger speed, exhaust temperature, torque, and BMEP should therefore be interpreted as a combined air-path and thermal-severity response, not only as a change in nominal load. This interpretation is consistent with recent two-stroke studies in which scavenging pressure and scavenge-air temperature influence mean effective pressure, thermal efficiency, and exergy-related performance indicators [23,24].
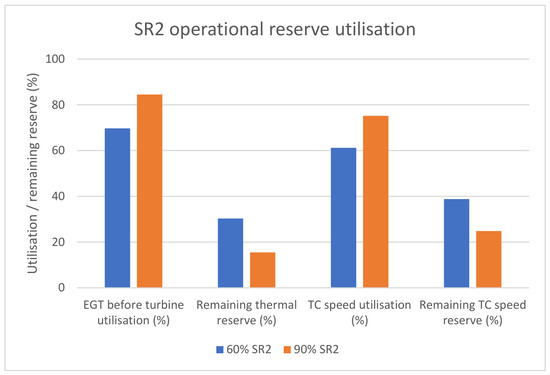
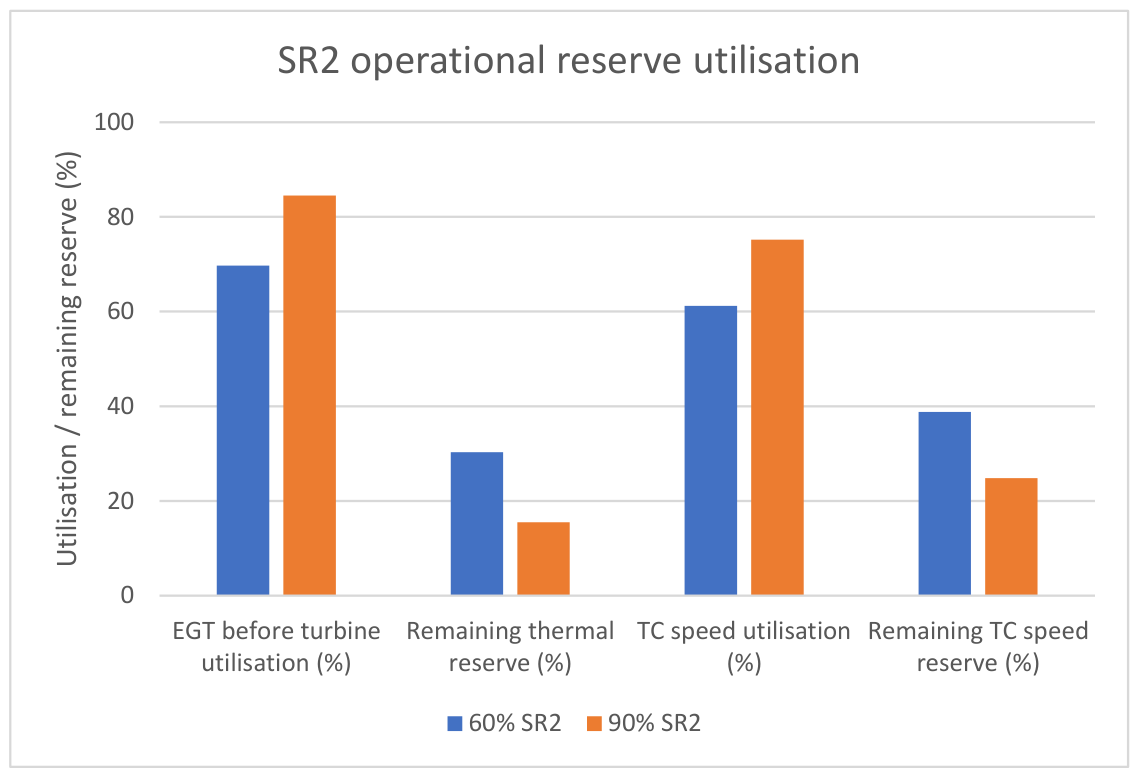
Figure 3 extends the interpretation of Table 6 by expressing the SR2 thermal and air-path indicators as utilisation of the available reserve rather than only as measured values. Exhaust temperature before turbine is normalised by the adopted 515 °C reference value, while turbocharger speed is normalised by the corresponding overspeed reference. This presentation shows how the transition from the 60% to the 90% sustained-load point compresses the available thermal and turbocharger-speed reserve.
Figure 3.
Operational reserve utilisation at the SR2 sustained-load points. Exhaust temperature before turbine is normalised by the 515 °C reference value, while turbocharger speed is normalised by the corresponding overspeed reference.
Figure 3 shows that the exhaust temperature before turbine increases from approximately 69.7% to 84.5% of the adopted reference value between the 60% and 90% sustained-load points, reducing the remaining thermal reserve from about 30.3% to 15.5%. Over the same interval, turbocharger-speed utilisation increases from approximately 61.2% to 75.2%, reducing the corresponding remaining reserve from about 38.8% to 24.8%. The figure therefore adds an operational-reserve interpretation to Table 6 and shows why the higher sustained-load point should be treated as a more severe condition even though the corrected SFOC improves slightly.
3.1.3. R2
Calculation
Baseline SR1 100% point.
- (1)
- Projected heavy-running power
- (2)
- Normalised coordinates
So, under the “same rpm + 15% demand” projection, the required power exceeds nominal 100% MCR power in the load-diagram sense. This exceedance should be interpreted as projected demanded load rather than proof of a sustainably achievable steady operating state at the same shaft speed.
- (3)
- Projected torque and BMEP
From SR1, the 100% point torque was:
Thus:
BMEP scales identically:
With :
- (4)
- Limit-line checks via Line 5 and Line 6 functions
Compute Line 5 limit at :
Compute Line 6 at the same speed:
Now proximity indices:
and
Under the +15% demand projection at the same rpm, the operating point remains below both boundary functions, but it moves significantly closer to the admissible torque boundary (Line 5). This is precisely the engineering meaning of “reduced air margin” in heavy running, even without a compressor map. The projected heavy-running indicators for all SR1 reference points are summarised in Table 7.
Table 7.
Projected heavy-running indicators for R2 1.
Table 7 quantifies the mechanical consequence of the +15% service-margin projection at constant shaft speed. Because the projection is applied multiplicatively to the validated SR1 baseline, projected torque and BMEP increase correspondingly across the load range. At the 100% SR1 point, the projected power rises to 13,852.9 kW, which exceeds the installation MCR and represents a demanded heavy-running condition rather than a guaranteed sustainable steady operating point. The practical importance of Table 7 is that it translates the service-margin assumption into mechanical consequences that can be compared directly with the measured SR1 baseline. Because the R2 projection is applied at constant shaft speed, the 15% increase in shaft power produces the same relative increase in shaft torque and BMEP at every reference point. This is a useful diagnostic simplification because it isolates the effect of increased resistance demand before considering the power-limited response of the engine. At the lower and medium trial points, the projected values remain within a mechanically plausible operating range, but the upper part of the curve shows a critical change in interpretation. At the 100% SR1 reference point, the projected demand increases from 12,046.0 kW to 13,852.9 kW, which is approximately 2.2% above the installation MCR of 13,560 kW. In real service, this does not mean that the engine would necessarily continue to operate steadily at the same speed and power. Rather, it indicates that the demanded propeller load would exceed the installed continuous power reference, so a realised operating response would normally involve speed reduction, governor/fuel limitation, or movement towards a more restricted load-diagram region. The value of Table 7 is therefore not only the numerical 15% increase, but the demonstration that a realistic service-margin projection can move the upper baseline point from a light-running trial condition into a demanded heavy-running condition with reduced operating reserve. This projected increase is physically consistent with recent fouling and biofouling studies, where deteriorated hull or propeller condition is associated with increased shaft-power demand. The difference is that the present study applies a prescribed 15% service-margin projection instead of using a directly measured degradation time series [19,20].
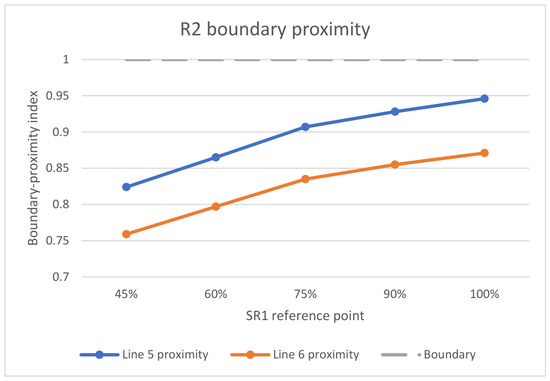
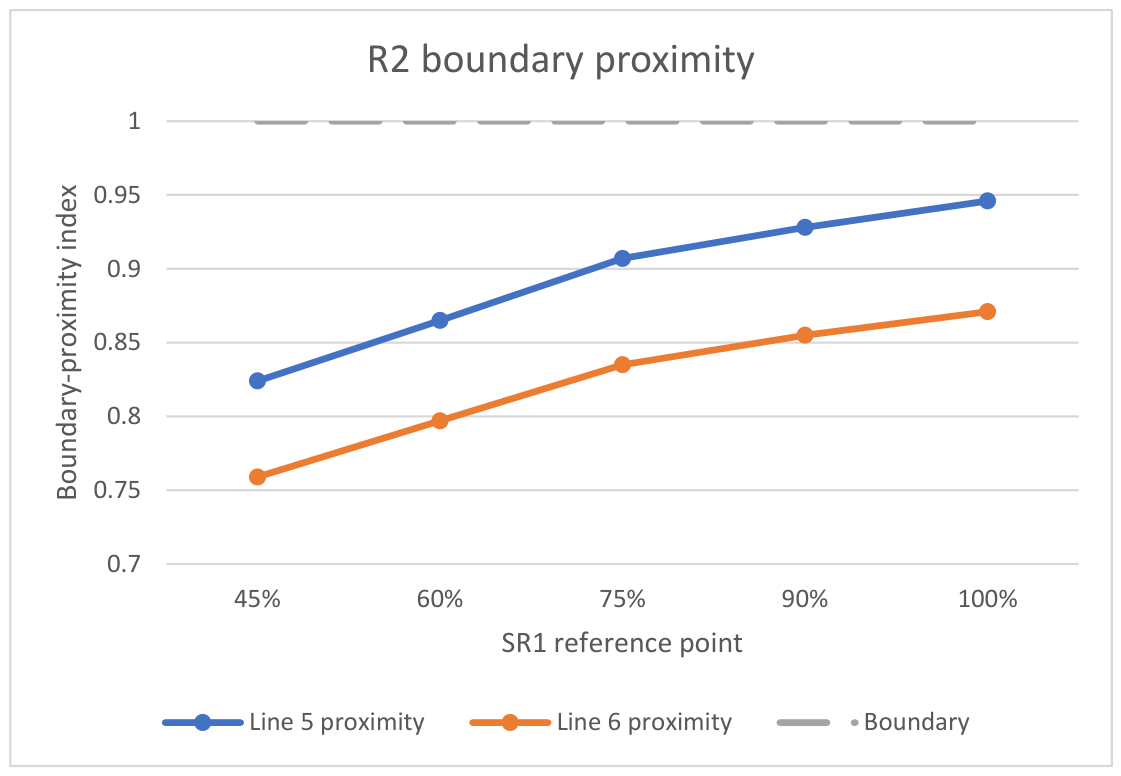
Figure 4 extends the interpretation of Table 7 by showing the boundary proximity of the projected R2 operating points relative to the manufacturer-defined Line 5 and Line 6 references. While Table 7 reports the projected power and torque increase, Figure 4 shows how this increase changes the position of the operating points relative to the limiting regions of the load diagram.
Figure 4.
Boundary-proximity indices of the R2 projected heavy-running points relative to the normalised Line 5 and Line 6 reference functions. Values approaching 1.0 indicate increasing proximity to the corresponding load-diagram reference boundary.
Figure 4 shows that the +15% service-margin projection does not have the same operational significance at all baseline points. At lower and medium load, the projected R2 points remain comparatively distant from the manufacturer-defined limiting boundaries. Towards the upper load range, however, the same proportional increase in shaft-power demand produces a more critical condition because the projected operating points move closer to the low-speed torque and transient-service boundaries. This boundary-based interpretation is not directly visible from Table 7 alone and supports the use of R2 as a projected heavy-running demand case rather than as a directly measured steady operating regime.
3.2. Comparative Assessment of Operating Regimes
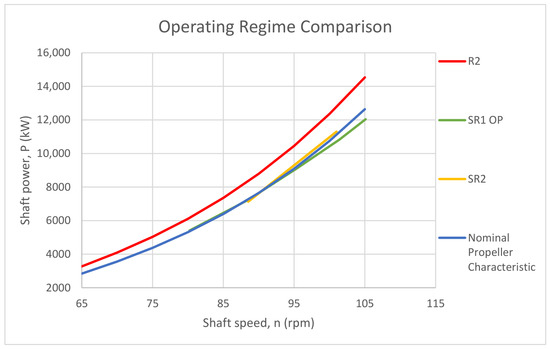
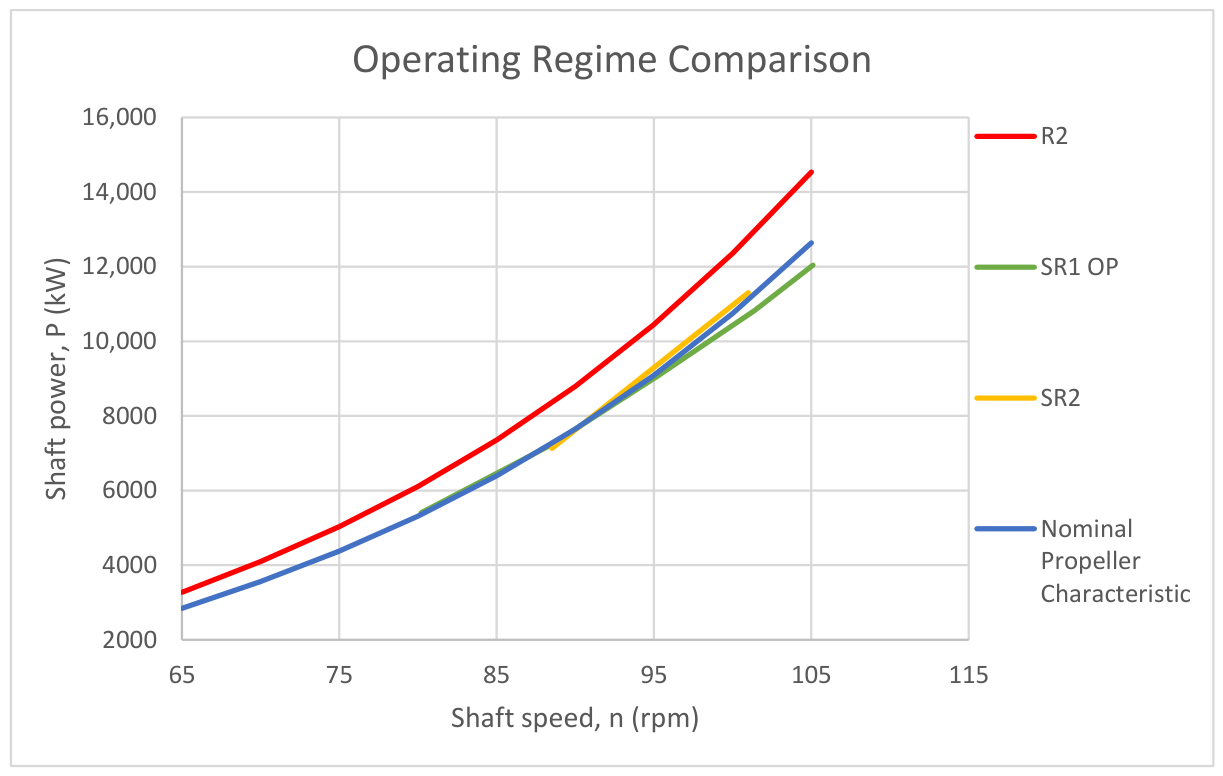
The three representative regimes can be compared within a common load-diagram reference frame by combining the calculated mechanical indicators, the sustained-load thermal and air-path variables, and the different evidence levels associated with each dataset. Figure 5 compares the SR1 baseline curve, the SR2 sustained-load reference, the R2 projected heavy-running curve, and the nominal propeller characteristic in the common shaft power–shaft speed plane.
Figure 5.
Comparison of operating regimes.
Unlike prediction-oriented studies that primarily estimate shaft power, fuel consumption, or speed as output variables, the present comparison keeps mechanical loading, thermal response, fuel-related behaviour, and boundary proximity visible at the same time [21,25].
The figure shows a clear progression from the light-running baseline towards increasingly demanding operating conditions. The SR1 operating points remain below the nominal propeller characteristic across the analysed range, which is consistent with clean-hull sea-trial behaviour and confirms that the baseline condition includes a measurable light-running reserve. By contrast, the SR2 curve lies above SR1 and close to, or slightly above, the nominal propeller characteristic in the upper load range, while the R2 projection is displaced further upward over the full speed range, indicating the additional power demand associated with the assumed 15% service margin.
The calculated SR1 indicators confirm that the sea-trial points form a coherent baseline characteristic. Shaft torque increases from about 644 kN·m at 45% MCR to about 1.095 MN·m at 100% MCR, while BMEP increases from 10.56 bar to 17.96 bar. The fitted propeller-law deviations remain small, which supports the use of SR1 as the reference condition for subsequent comparison. In practical terms, SR1 defines the measured propulsion state from which later shifts in torque demand, BMEP, and boundary proximity can be interpreted.
Relative to SR1, the SR2 results show what changes when the engine is examined under sustained and thermally stabilised operation rather than short-duration trial load. At 60% MCR, the calculated torque is approximately 769 kN·m and BMEP is 12.62 bar, at 90% MCR, torque rises to about 1.069 MN·m and BMEP to 17.54 bar. The associated thermal and air-path indicators also show the expected increase in sustained operating severity: scavenge pressure increases from 1.75 bar to 3.10 bar, turbocharger speed from 10,364 rpm to 12,734 rpm, and exhaust temperature before the turbine from 359 °C to 435 °C. At the same time, the available thermal margin decreases from 156 °C to 80 °C, and the turbocharger speed margin decreases from 6572 rpm to 4202 rpm. Corrected SFOC improves slightly from 174.4 g/kWh to 172.0 g/kWh, while brake efficiency rises from 51.4% to 52.1%. These values show that SR2 is not simply a higher-load version of SR1, but a stabilised sustained-load condition with clearly reduced reserve and a different thermal signature.
The largest separation is produced by the R2 curve. This is consistent with the projected heavy-running calculations, where each SR1 point is increased by 15% at constant shaft speed. As a result, projected shaft power rises from 6219 kW to 13,853 kW across the analysed range, while projected torque increases from about 741 kN·m to 1.258 MN·m. Because the projection is applied directly to the validated SR1 baseline, the R2 curve provides a quantitative estimate of how far service deterioration could move the operating state away from the trial condition. The practical significance of this shift can be described as the reduction in operating margin relative to the admissible low-speed torque region of the load diagram [4,5,6].
Taken together, the comparison shows a consistent progression in operating severity across the three regimes. SR1 provides the measured baseline and confirms the light-running reserve visible below the nominal propeller characteristic. SR2 introduces the sustained-load condition and shows how thermal and air-path indicators tighten under prolonged operation. R2 quantifies the effect of additional service demand through explicit increases in projected power, torque, and BMEP.
4. Discussion
The results show that the three representative regimes cannot be evaluated with a single undifferentiated set of descriptors. Their differences are visible in the calculated operating-point positions, in the derived mechanical indicators, and in the evidence level available for each regime. Earlier regime-based interpretation identified the physical meaning of baseline, sustained, and projected operation. The present analysis extends that framework by expressing the differences through quantified indicators referenced to the same vessel-specific load-diagram basis.
Compared with recent literature, the contribution of the present framework is not the independent modelling of hull fouling, engine combustion, fuel consumption, or propulsion efficiency alone. Recent studies have addressed these problems using operational-data models, digital twins, CFD/exergy models, and hybrid prediction approaches [17,21]. Other studies have focused on two-stroke combustion sensitivity, propulsion-efficiency prediction, or shop-versus-sea performance comparison [24,26,28]. The present analysis instead combines measured sea-trial baseline data, measured sustained-load endurance data, and a projected heavy-running scenario within a single manufacturer-referenced load-diagram framework. This provides a practical regime-comparison structure for installations where the available evidence is documentary and uneven rather than continuous and high-frequency.
SR1 is the most reliable reference condition because it is based on certified steady sea-trial measurements obtained under light-running conditions. The SR1 points follow a coherent propulsion trend and therefore support baseline normalisation of torque, BMEP, and operating-point position. This makes SR1 suitable as the reference against which later deviations can be assessed. In practical terms, the value of SR1 lies in defining a measured propulsion state rather than an assumed nominal condition.
SR2 adds information that cannot be obtained from the baseline trial points alone. Once the engine is examined under sustained and thermally stabilised operation, the comparison shifts from simple propulsion matching to the combined interpretation of load, air-path response, and thermal reserve. The endurance data show that higher sustained load is accompanied by higher torque and BMEP, together with increased scavenge pressure, turbocharger speed, and exhaust temperature level [5,6,14]. At the same time, the available thermal and turbocharger-speed margins become smaller. This pattern indicates that SR2 is characterised by a tighter operating reserve under prolonged service conditions, even though the engine remains within admissible steady operation [4,5,6]. From an assessment perspective, SR2 is therefore the most relevant regime for evaluating sustained thermal severity and fuel-related behaviour under stable conditions. This also explains why the modest improvement in corrected SFOC should not be interpreted as reduced operating severity. Recent fuel-consumption and propulsion-efficiency studies show that fuel-related indicators are useful, but they should be interpreted together with the mechanical operating state, environmental context, and physically meaningful performance variables [25,26].
R2 provides the clearest quantitative expression of service deterioration. By applying the 15% service-margin projection to the validated SR1 baseline, the analysis translates heavy running into explicit increases in projected shaft power, torque, and BMEP [4,9]. The corresponding movement of the operating point towards the low-speed torque boundary gives the concept of reduced air margin a measurable form [5,6]. This is an important step, because heavy running is often described qualitatively in operational terms, whereas the present method shows how the same condition can be represented numerically within the manufacturer load-diagram framework [4,7]. In this respect, R2 is useful as a practical estimate of how far the service condition may depart from the clean-hull trial state before direct onboard evidence of severe degradation is available. This interpretation is also consistent with recent shop-versus-sea comparisons, which show that engine-performance conclusions drawn from controlled test conditions cannot always be transferred directly to onboard operation without considering the actual vessel operating context [28].
Taken together, the results support a regime-specific approach to in-service propulsion assessment. Baseline sea-trial data are best suited to validation and normalisation. Endurance data are required for thermal- and fuel-related interpretation. Heavy-running projection is useful for estimating service-condition margin erosion. This separation improves the analytical discipline of the framework and reduces the risk of comparing unlike operating conditions on the same terms.
The study has several limitations. The heavy-running regime is projected rather than directly measured in heavy voyage conditions. Fuel-consumption analysis is restricted to operating points for which corrected SFOC is documented. Complete calibration certificates and full uncertainty documentation for all measured variables were not available, which limits the possibility of a full metrological uncertainty reconstruction. However, the uncertainty influence is considered in relation to the comparative regime structure and derived-indicator sensitivity. Transient manoeuvring documentation was reviewed qualitatively during the study, but it was not included in the quantitative regime comparison because the available records do not provide synchronised transient measurements of shaft torque, fuelling, scavenge pressure, turbocharger response, and instantaneous exhaust temperature on a common time base. These limits do not invalidate the framework, but they define its present scope. Future work would benefit from onboard measurements that combine shaft power, engine-state variables, and air-path response during both steady service and manoeuvring events, allowing the same benchmarking structure to be extended with stronger transient and degradation evidence. Such an extension would also align the proposed regime-comparison framework with recent digital-twin and operational-data approaches, where continuous measured data are used to update reference states and improve engine-condition interpretation over the full operating envelope [17,21].
From an engineering standpoint, the framework is useful because it links each operating regime to the indicators that remain valid for that regime. This makes the method suitable for practical propulsion assessment where the available evidence is uneven and where conclusions must remain consistent with both manufacturer operating limits and measured vessel behaviour.
5. Conclusions
This study developed a quantitative benchmarking framework for the regime-dependent assessment of a low-speed two-stroke marine propulsion engine using certified sea-trial measurements, endurance-test records, manufacturer load-diagram constraints, and a service-margin projection. The framework was applied to three representative regimes: the measured light-running baseline (SR1), the measured sustained-load regime (SR2), and the projected heavy-running regime (R2).
Quantitatively, the SR1 baseline remained coherent, with fitted propeller-law deviations not exceeding 1.18%, torque increasing from 644.0 to 1094.6 kN·m, and BMEP from 10.56 to 17.96 bar over the analysed range. In SR2, the transition from the 60% to the 90% sustained-load point increased torque from 769 to 1069 kN·m and BMEP from 12.62 to 17.54 bar, while corrected SFOC decreased from 174.4 to 172.0 g/kWh and the thermal margin before turbine decreased from 156 °C to 80 °C. In R2, the +15% service-margin projection increased the required power at the 100% reference point from 12,046.0 to 13,852.9 kW, thereby exceeding the 13,560 kW installation MCR and quantifying the erosion of operating reserve under heavy-running demand.
The practical value of the study lies in showing how regime-dependent propulsion behaviour can be compared through quantified mechanical, thermal, and boundary-related indicators referenced to the same validated baseline. This makes it possible to compare clean-hull trial operation, stabilised sustained service, and projected deterioration within one analytical structure without treating all regimes as if they had the same evidential basis.
The study also has clear limitations. The heavy-running regime was projected analytically rather than measured directly under degraded service conditions. Fuel-consumption analysis was limited to operating points for which corrected specific fuel oil consumption was documented. Transient manoeuvring documentation was reviewed qualitatively, but it was not included in the quantitative regime comparison because synchronised high-frequency measurements of shaft torque, fuelling, scavenge pressure, and instantaneous exhaust temperature were not available for robust load-diagram reconstruction.
Within these limits, the framework provides a practical basis for in-service propulsion assessment and for more disciplined comparison between baseline operation, sustained-load severity, and projected heavy running. Future work should extend the method using onboard measurements that combine shaft power, engine-state variables, and air-path response under both steady and transient service conditions.
Author Contributions
Conceptualisation, M.C. and N.A.; methodology, M.C.; validation, N.A.; formal analysis, M.C.; investigation, M.C. and N.A.; resources, M.C.; data curation, M.C. and N.A.; writing—original draft preparation, M.C.; writing—review and editing, N.A.; visualisation, M.C.; supervision, N.A.; project administration, M.C.; and funding acquisition, N.A. All authors have read and agreed to the published version of the manuscript.
Funding
This research was funded by Constanta Maritime University through the research funding programme. The APC was covered by Constanta Maritime University.
Data Availability Statement
The original contributions presented in this study are included in the article in processed and aggregated form. Restrictions apply to the availability of the underlying data. The source data, including sea-trial records, endurance-test documentation, manufacturer technical materials, and identifying vessel or operator information, were obtained from confidential and proprietary third-party sources and are not publicly available. No publicly archived dataset was generated for this study.
Acknowledgments
During the preparation of this manuscript, the authors used OpenAI (San Francisco, CA, USA)/ChatGPT, GPT-5.4, for the purposes of language polishing. The authors have reviewed and edited the output and take full responsibility for the content of this publication.
Conflicts of Interest
The authors declare no conflicts of interest.
Abbreviations
The following abbreviations are used in this manuscript:
| BMEP | Brake Mean Effective Pressure |
| CMCR | Contracted Maximum Continuous Rating |
| CSR | Continuous Service Rating |
| DWT | Deadweight Tonnage |
| EGT | Exhaust Gas Temperature |
| FPP | Fixed-Pitch Propeller |
| GT | Gross Tonnage |
| ISO | International Organization for Standardization |
| LCV | Lower Calorific Value |
| LRM | Light Running Margin |
| MCR | Maximum Continuous Rating |
| R2 | Projected Heavy-Running Regime |
| rpm | Revolutions per Minute |
| SFOC | Specific Fuel Oil Consumption |
| SR1 | Measured Light-Running Baseline Regime |
| SR2 | Measured Sustained-Load Regime |
| TEU | Twenty-Foot Equivalent Unit |
References
- Griffiths, D. Marine Low Speed Diesel Engines, updated ed.; MEP Series; Imarest: London, UK, 2000; ISBN 978-1-902536-33-9. [Google Scholar]
- Pounder, C.C.; Woodyard, D.F. Pounder’s Marine Diesel Engines and Gas Turbines, 8th ed.; Elsevier Butterworth Heinemann: Oxford/Burlington, MA, USA, 2004; ISBN 978-0-7506-5846-1. [Google Scholar]
- Wärtsilä Switzerland Ltd. RT-Flex58T-D Operating Manual (“Marine”, Version 2); Wärtsilä Switzerland Ltd.: Winterthur, Switzerland, 2013. [Google Scholar]
- Sjerić, M.; Tomić, R.; Martić, I.; Degiuli, N.; Grlj, C.G. Environmental and Economic Aspects of a Containership Engine Performance in Off-Design Conditions. Appl. Sci. 2024, 14, 4634. [Google Scholar] [CrossRef] [Scilit]
- Guan, C.; Theotokatos, G.; Chen, H. Analysis of Two Stroke Marine Diesel Engine Operation Including Turbocharger Cut-Out by Using a Zero-Dimensional Model. Energies 2015, 8, 5738–5764. [Google Scholar] [CrossRef] [Scilit]
- Zhu, S.; Gu, Y.; Yuan, H.; Ma, Z.; Deng, K. Thermodynamic analysis of the turbocharged marine two-stroke engine cycle with different scavenging air control technologies. Energy 2020, 191, 116533. [Google Scholar] [CrossRef] [Scilit]
- Zhang, D.; Shen, Z.; Xu, N.; Zhu, T.; Chang, L.; Song, H. Development of a Zero-Dimensional Model for a Low-Speed Two-Stroke Marine Diesel Engine with Exhaust Gas Bypass and Performance Evaluation. Processes 2023, 11, 936. [Google Scholar] [CrossRef] [Scilit]
- Feng, Y.; Wang, H.; Gao, R.; Zhu, Y. A Zero-Dimensional Mixing Controlled Combustion Model for Real Time Performance Simulation of Marine Two-Stroke Diesel Engines. Energies 2019, 12, 2000. [Google Scholar] [CrossRef] [Scilit]
- Mrzljak, V.; Žarković, B.; Prpić-Oršić, J. Marine slow speed two-stroke diesel engine—Numerical analysis of efficiencies and important operating parameters. Mach. Technol. Mater. 2017, 11, 481–484. [Google Scholar]
- Lalić, B.; Račić, N.; Radica, G. Two-stroke low speed diesel engine simulation model for NOx analysis. Trans. Marit. Sci. 2017, 6, 14–23. [Google Scholar] [CrossRef] [Scilit]
- Yang, Z.; Qu, W.; Zhuo, J. Optimization of Energy Consumption in Ship Propulsion Control under Severe Sea Conditions. J. Mar. Sci. Eng. 2024, 12, 1461. [Google Scholar] [CrossRef] [Scilit]
- Huang, G.; Liu, Y.; Xin, J.; Bao, T. Assessment of Hull and Propeller Performance Degradation Based on TSO-GA-LSTM. J. Mar. Sci. Eng. 2024, 12, 1263. [Google Scholar] [CrossRef] [Scilit]
- Themelis, N.; Nikolaidis, G.; Zagkas, V. Assessment of Hull and Propeller Degradation Due to Biofouling Using Tree-Based Models. Appl. Sci. 2024, 14, 9363. [Google Scholar] [CrossRef] [Scilit]
- Shen, H.; Yang, F.; Jiang, D.; Lu, D.; Jia, B.; Liu, Q.; Zhang, X. Parametric Investigation on the Influence of Turbocharger Performance Decay on the Performance and Emission Characteristics of a Marine Large Two-Stroke Dual Fuel Engine. J. Mar. Sci. Eng. 2024, 12, 1298. [Google Scholar] [CrossRef] [Scilit]
- Wang, H.; Wang, Z.; Shi, B. Research on Data-Driven Performance Assessment and Fault Early Warning of Marine Diesel Engine. Appl. Sci. 2025, 15, 6299. [Google Scholar] [CrossRef] [Scilit]
- Moon, J. Comparative Analysis of Performance and Emissions of a Two-Stroke Marine Diesel Engine According to CPP Modes. J. Mar. Sci. Eng. 2026, 14, 331. [Google Scholar] [CrossRef] [Scilit]
- Tsitsilonis, K.-M.; Theotokatos, G.; Patil, C.; Coraddu, A. Health assessment framework of marine engines enabled by digital twins. Int. J. Engine Res. 2023, 24, 3264–3281. [Google Scholar] [CrossRef] [Scilit]
- Hountalas, T.D.; Founti, M.; Zannis, T.C. Experimental Investigation to Assess the Performance Characteristics of a Marine Two-Stroke Dual Fuel Engine under Diesel and Natural Gas Mode. Energies 2023, 16, 3551. [Google Scholar] [CrossRef] [Scilit]
- Torii, H.; Kifune, H. Influence of propeller fouling on propulsion performance of an actual ship: A long-term analysis focusing on the power for keeping propeller’s rotation of a controllable pitch propeller. J. Mar. Sci. Technol. 2023, 28, 876–888. [Google Scholar] [CrossRef] [Scilit]
- Liu, S.; Kee, Y.H.; Shang, B. Assessment of the economic, environmental and safety impact of biofouling on a ship’s hull and propeller. Ocean Eng. 2023, 285, 115481. [Google Scholar] [CrossRef] [Scilit]
- Kim, H.; Noh, M.-I. Interpretable, data-driven models for predicting shaft power, fuel consumption, and speed considering the effects of hull fouling and weather conditions. Int. J. Nav. Archit. Ocean Eng. 2024, 16, 100592. [Google Scholar] [CrossRef] [Scilit]
- Kim, D.; Rhee, S.H. Data-driven modeling and regression analysis on ship resistance of in-service performance. Int. J. Nav. Archit. Ocean Eng. 2024, 16, 100623. [Google Scholar] [CrossRef] [Scilit]
- Yu, H.; Gao, J.; Zhang, P.; Han, F.J.; Yang, Q.; Cui, B. The impact of scavenging air state on the combustion and emission performance of marine two-stroke dual-fuel engine. Sci. Rep. 2024, 14, 15776. [Google Scholar] [CrossRef] [Scilit]
- Pehlivan, E.F.; Altın, İ. Exergy analysis under consideration of operational parameters by numerical approach in a two-stroke marine diesel engine. Fuel 2024, 368, 131650. [Google Scholar] [CrossRef] [Scilit]
- Zhou, T.; Wang, J.; Hu, Q.; Hu, Z. A Novel Approach to Enhancing the Accuracy of Prediction in Ship Fuel Consumption. J. Mar. Sci. Eng. 2024, 12, 1954. [Google Scholar] [CrossRef] [Scilit]
- Soltani Motlagh, H.R.; Issa-Zadeh, S.B.; Zoolfakar, M.R.; Garay-Rondero, C.L. Enhancing Ship Propulsion Efficiency Predictions with Integrated Physics and Machine Learning. J. Mar. Sci. Eng. 2025, 13, 1487. [Google Scholar] [CrossRef] [Scilit]
- Bondarenko, O.; Kitagawa, Y. A comprehensive propulsion system analysis: An integrated approach utilising engine simulation and free-running model experiments. J. Mar. Eng. Technol. 2025, 24, 339–350. [Google Scholar] [CrossRef] [Scilit]
- Moon, J. Combustion and Emission Trade-Offs in Tier-Regulated EGR Modes: Comparative Insights from Shop and Sea Operation Data of a CPP Marine Diesel Engine. J. Mar. Sci. Eng. 2025, 13, 1935. [Google Scholar] [CrossRef] [Scilit]

Disclaimer/Publisher’s Note: The statements, opinions and data contained in all publications are solely those of the individual author(s) and contributor(s) and not of MDPI and/or the editor(s). MDPI and/or the editor(s) disclaim responsibility for any injury to people or property resulting from any ideas, methods, instructions or products referred to in the content. |
© 2026 by the authors. Licensee MDPI, Basel, Switzerland. This article is an open access article distributed under the terms and conditions of the Creative Commons Attribution (CC BY) license.