


Abstract
Freshwater accumulation is one of the most striking observations in the Beaufort Gyre (BG) region in the Arctic Ocean. A 39-year simulation, using the validated high-resolution, geometrical-fitting, unstructured grid Finite-Volume Community Ocean Model for the Arctic Ocean, aimed to investigate the contributions of coastal currents and their interannual variability to this phenomenon. The model reasonably reproduced the interannual variability of freshwater content (FWC) in the BG region. Analysis revealed the constructive role of Ekman pumping in supplying FWC, while the lateral flux generally acts to remove FWC from the region. The disparity between Ekman pumping and lateral flux drives the interannual variability of total FWC, with accumulation occurring when the downward Ekman FWC flux surpasses the net outflow-induced lateral FWC flux. Since 2007, there has been a significant increase in downward Ekman pumping, accompanied by a rise in net outflow lateral flux, indicating heightened variability of FWC in the BG region. The model results suggested that the coastal flow over the Arctic continental shelf underwent dramatic changes, especially during summer, and these changes were partially due to increased freshwater and sea ice melting. Increased lateral FWC flux during summer has become a competitive source for unprecedented seasonal freshwater accumulation in the BG region. Flow intensification over the North American coast is influenced by increased freshwater runoff, including the Firth, Kobuk, and Mackenzie Rivers. Interannual FWC variation in the Beaufort Sea could be influenced by the changes in slope flow, with the water originating in part from the Barents and Kara Seas.
1. Introduction
The Beaufort Gyre (BG) is a regional anticyclonic circulation in the Arctic Ocean, primarily driven by atmospheric forcing and sea–ice interfacial internal stress that links directly with the Arctic and global climate system [1,2,3,4,5,6]. Over recent decades, sea ice extent and thickness have declined, accompanied by the freshwater accumulation in the BG region relative to the climatology of the 1970s [1,2,3,4,5,6,7]. Observations indicate that the freshwater content (FWC) in the Beaufort Gyre increased by approximately 6400 km3 between 2003 and 2018, representing a 40% increase relative to the 1970s baseline [8]. A critical concern is the potential release of this accumulated freshwater. A shift in atmospheric circulation patterns would weaken the anticyclonic Beaufort Gyre, allowing the accumulated freshwater to drain into the North Atlantic through the Canadian Arctic Archipelago (CAA) and Fram Strait, with potential downstream impacts on the Atlantic Meridional Overturning Circulation [9,10,11]. GSAs may cool the Northern Hemisphere climate by inhibiting deep wintertime convection, while increased freshening directly influences the North Atlantic thermohaline circulation by enhancing vertical stratification [9,12,13,14,15]. This can potentially weaken the ocean’s meridional overturning circulation [16,17]. Various modeling studies have elucidated mechanisms driving the variability of the meridional overturning circulation associated with spatiotemporal distributions of the North Atlantic salinity [18,19,20,21]. However, uncertainties persist regarding the future accumulation or release of freshwater in the BG region and the potential impact on freshwater transport through the Greenland Shelf and CAA. Such changes could intensify freshening over the northwestern Atlantic shelf, altering shelf marine ecosystems and fisheries resources [22].
Numerous studies have investigated various dynamic elements of the BG system in specific years and under diverse conditions. While these studies have yielded valuable insights into recent changes in the BG system, there is disagreement regarding the relative contributions of different physical sources. These sources include air–sea interactions with ice (Ekman pumping) [4,7,23], transports from the surrounding and other remote regions such as the Bering Strait and Eurasian Shelf [3,23], increased sea ice melting [24], and changes in river runoff [25]. Recent findings suggest that the BG circulation has stabilized, accompanied by the deepening of the surface mixed layer (ML) and an increase in salinity within the ML [26,27,28,29]. These observations contribute to a better understanding of the evolving dynamics within the BG system but underscore the complex interplay of various factors influencing its behavior.
Due to the limited observations in the Arctic, studies of physical processes in the Arctic Ocean have predominantly relied on mechanism-emphasized idealized and coupled ice–ocean, primitive-equation regional ocean models [6,30,31,32,33]. Both mechanism studies and model simulations suggest that the circulation is mainly driven by the wind- and ice-drifting-driven anticyclonic circulation in the Arctic Basin in the upper 50 m layer and a well-defined buoyancy-driven cyclonic slope flow in the lower layer beneath the 50 m depth [34], as depicted in the schematic of the circulation patterns shown in Figure 1. The cyclonic slope flow was delineated initially by the topostrophy theory [35] and subsequently confirmed through convergence numerical experiments that ensured the alignment of physical and numerical scales [30]. This flow pattern initiates its journey into the Arctic over the slope off Svalbard through Fram Strait, proceeding cyclonically along the continental shelf before eventually departing the Arctic along Greenland’s slope via the Fram Strait.
Figure 1.
Bathymetry and schematic of near-surface and sub-surface circulation in the Arctic Ocean. Light blue arrows: the near-surface currents. Red arrows: the sub-surface currents. Red dots: locations of river runoff. Black lines: the transects where the freshwater content fluxes and volume transports are estimated. The pentagon with a boundary line labeled from 1 to 5 is the Beaufort Sea region where the lateral advection flux is estimated.
Physical processes associated with the Arctic circulation have been extensively scrutinized by process-oriented idealized models [4,6,32,36,37,38,39]. However, different primitive equation models often exhibit significant disparities, particularly regarding the representation of cyclonic flow along steep topographic slopes and water transport through narrow straits and water passages [40]. The intricate geometry of Arctic coastlines, steep bottom topography along continental slopes and ridges, numerous islands, and narrow straits give rise to multi-scale shelf–basin interaction in the Arctic Ocean, which is challenging for modeling efforts [41]. Achieving an accurate representation of topographically controlled flow over the continental shelf and intensified currents in narrow straits and water passages necessitates a model resolution capable of resolving both geometric (the cross-shelf topography) and physical (baroclinic density fronts) scales [30]. To meet this criterion, model resolution over the slope and the CAA should be of an order of ~2–3 km or less [30,42].
The Arctic Ocean Finite-Volume Community Ocean Model (AO-FVCOM) represents an advancement in high-resolution, fully coupled ice–ocean modeling [30,43,44]. Leveraging topostrophy as a metric for assessing model performance, AO-FVCOM adeptly simulates cyclonic slope current within the Arctic domain without resorting to Neptune subgrid parameterization [40]. Initial validation efforts demonstrated AO-FVCOM’s fidelity in replicating observed tidal elevation, currents, sea ice dynamics, and subtidal flows under climatological conditions [30,41,45]. Subsequent validation studies included both hindcasts of current, sea ice, surface wave, temperature, and salinity from 1978 to 2016 [43,44,46,47,48,49,50,51,52] and forecasts of sea ice from 2019 to 2020 [53]. These validation initiatives collectively underscore AO-FVCOM’s prowess in capturing the multi-scale circulation patterns endemic to the Arctic realm. Leveraging AO-FVCOM’s success in emulating the interannual variability of freshwater in the BG region, our efforts utilize this 39-year hindcast simulation to identify the drivers of the mid-2000s freshwater transition, quantify the shifting balance between Ekman pumping and lateral advection over multidecadal scales, and clarify the role of extreme river runoff in reshaping coastal pathways, thereby providing new insights beyond the reach of previous short-term or climatological analyses. This temporal scope facilitates a deep exploration of how alteration in Arctic oceanic flow impinges upon freshwater accumulation, dispersion, and temporal vicissitudes within the BG region. Our principal inquiry focuses on unraveling the intricacies of freshwater accumulation mechanisms within the BG expanse and elucidating potential linkage between shifting coastal oceanic dynamics and regional freshwater changes, alongside discerning the relative contributions of crucial freshwater sources.
The subsequent sections of this paper are structured as follows. Section 2 briefly explains the model, methods employed, and pertinent datasets utilized in this study. Section 3 delineates the analysis outcomes derived from the comprehensive 39-year simulations. Section 4 delves into an examination of the impact of grid resolution on sub-annual freshwater fluxes, along with a discussion on the uncertainty stemming from closed-box selection. Finally, Section 5 encapsulates the essential findings and summarizes the conclusions drawn from this investigation.
2. Data and Methods
The study utilized the AO-FVCOM and Global-FVCOM nested model system, as detailed in prior research [30,43,44]. AO-FVCOM, operating within the spherical coordinate framework of FVCOM, constitutes a prognostic, unstructured-grid, finite-volume, free-surface, 3-D primitive equation community ocean model [30,41]. Global-FVCOM encompasses the entirety of the global ocean, incorporating all major rivers and featuring a horizontal resolution approximately ranging from 1 km in the coastal areas to 40 km in the interior regions. Both AO-FVCOM and Global-FVCOM are fully coupled with UG-CICE, an unstructured-grid adaptation of the widely utilized Los Alamos Community Ice CodE (CICE) [54]. Implementing the FVCOM algorithm facilitates the seamless conversion of the structured-grid CICE to an unstructured-grid ice module within the FVCOM framework [45].
The governing equations are formulated within a generalized terrain-following coordinate system with spatially variable distributions in the vertical and discretized using the non-overlapping triangular grid in the horizontal. The flexibility in grid configuration allows for accurate fitting of irregular coastal geometries and refined resolution in steep continental margins, ridges, islands, inlets, and narrow water passages. This study adopts two grids (Grid-II and Grid-III) as described in Chen et al. [30]. The 39-year simulation employs Grid-II (Figure 2), which is constructed with a horizontally varying resolution of 1.0–2.0 km in narrow channels of the CAA, approximately 5.0 km over the slope, and ~25.0 km in the interior. Grid-III, refined specifically over the Beaufort Sea slope, features approximately 0.5–1.0 km resolution in the slope region (Figure 2), and is used to investigate the sensitivity of lateral flux to numerical resolution and to assess the contribution of mesoscale eddies. A hybrid terrain-following coordinate is selected for the vertical domain, featuring 45 layers. The vertical resolution is sufficient to resolve the surface mixed and upper 400 m layers, where water properties exhibit rapid spatiotemporal variations.
Figure 2.
Distributions (lower panels) and percentages (upper panels) of the Grid-II (left) and Grid-III (right) mesh resolutions adopted from Chen et al. [30]. The Grid-II was used for the simulations over 1978–2016. The Grid-III was used for the case in 2012 to examine the impact of model resolution on the sub-annual FWC flux.
A comprehensive set of 766 rivers was integrated into the Global-FVCOM model, with 227 rivers encompassed within the AO-FVCOM computational domain. For the major Arctic rivers, daily or monthly real-time observations were sourced from the Arctic Great Rivers Observatory Project, the United States Geological Survey, and the Canada Water Agency. For rivers where real-time discharge records were unavailable, we employed climatological monthly mean data derived from the Global Navy Coastal Ocean Model to represent the seasonal cycle of freshwater input. The primary focus of our study is the interannual variability of FWC in the BG region. For our analysis, we utilized the daily averaged model output.
FWC is defined as
where S is the salinity, is the surface layer, and is the water depth where the reference salinity was defined. is taken as 34.8, representative of the North Atlantic Water inflow, to maintain consistency with previous observed studies such as Proshutinsky et al. [5]. The total freshwater content is defined as the FWC integrated throughout the water column from to over the closed areas. The equation is given as
Assuming the ocean is an incompressible fluid, the local change in the annually averaged can be derived by conducting a volume integration of the salinity equation over an annually averaged period. This integration can be expressed as
where represents vertical velocity due to Ekman pumping, denotes the horizontal velocity normal to lateral sections of the closed area, is the non-dimensional relative salinity, is the length of the lateral section, and overbar denotes the yearly mean. On the right side of Equation (3), the first term is defined as the so-called Ekman pumping-induced freshwater flux, while the last term comprises the lateral FWC advection flux. We decompose the lateral FWC flux into the annual-mean and sub-annual components as follows
where and primed variables are deviations from the annual mean.
The Ekman pumping velocity is calculated by
where f represents the Coriolis parameter, is the ocean density, and is the total stress exerted at the ocean surface. equals a sum of the ice–ocean interfacial stress ( in the ice-covered area and wind stress () in the ice-free area [55]. It can be expressed as
where c is the sea ice concentration ranging from 0 (ice-free) to 1 (ice-covered). is formulated as
where is the ice-ocean drag coefficient, is the sea ice velocity vector, and is the surface ocean current vector. is formulated as
where is the air–ocean drag coefficient, is the air density, and is the wind velocity vector.
The Ekman pumping term incorporates the contribution of salinity change from sea ice, snow, and net precipitation (precipitation minus evaporation). In AO-FVCOM, sea ice and snow salt flux are integrated into the model through diffused processes at the sea surface. The diffusive salt flux at the sea surface is defined as
Here, is the salt flux; is the seawater density; is the sea ice mass per unit area (); is the sea ice density; is the sea ice thickness; is the snow mass per unit area; is surface water salinity; is sea ice salinity ( PSU as default in CICE). This sea ice salinity is accounted for when estimating the FWC from sea ice melting.
The vertical velocity at the sea surface is defined as
where c is the sea ice concentration. When estimating the Ekman pumping term, the salinity in the mixed layer is utilized, accounting for the salinity changes due to the salt flux from the sea ice, snow, and precipitation minus evaporation. Both freshwater sources can also be estimated separately based on the change in sea ice volume from the sea ice model and net precipitation from the atmospheric model, consistent with other Arctic Ocean models such as McGeehan and Maslowski [56].
To investigate the origins and pathways of water masses contributing to the FWC in the BG region, we conducted two types of Lagrangian particle tracking experiments. The backward tracking experiment is designed to identify the potential source regions of water present in the BG. The particles inside the closed control volume (the BG region, shown in Figure 1) were released at three distinct depth layers (upper 50 m, 50–100 m, and 100–200 m) to capture the vertical structure of the flow. Their trajectories were integrated backward in time for 22 months. The tracking utilized daily mean, layer-averaged velocity fields. The forward tracking experiment is designed to corroborate the findings from the backward tracking and to examine the fate of specific freshwater sources. The particles were released from key locations identified as potential sources including the mouths of major rivers along the North American coast and the Eurasian coast, and the Russian coast of the Chukchi Sea, as well as the Barents and Kara Seas shelf region. The particles were released in the upper 50 m, as well as in the 50–100 m and 100–200 m layers for the Barents and Kara Seas releases. Each particle was tracked forward for a three-year period using the daily mean, layer-averaged velocity fields. Along each trajectory, the ambient salinity and temperature were recorded to analyze the water mass transformation during transit, particularly mixing with the high-salinity North Atlantic water.
The observed hydrographic data in the Beaufort Sea were from multiple sources including the Institute of Ocean Sciences (IOS), Fisheries and Oceans Canada, the National Snow and Ice Data Center (NSIDC), the National Oceanographic Data Center (NODC), and the Japan Agency for Marine-Earth Science and Technology (JAMSTEC). Specifically, the hydrographic data spanning 2003–2016 were available from the Beaufort Gyre Exploration Project [5,7], facilitated by the Woods Hole Oceanographic Institution website. These data were produced by the IOS. These datasets were collected during various cruises using CTD (conductivity, temperature, and depth) downcasts, covering different locations and periods (Table 1).
Table 1.
Duration and station number of the CTD survey in the Beaufort Gyre region.
3. Results
3.1. Validation of FWC in AO-FVCOM
The model-simulated FWC underwent initial validation against the observations that were averaged over monthly and yearly periods. To assess the FWC, we collected salinity data across the Arctic Ocean, enabling the estimation of monthly salinity fields encompassing the entire AO-FVCOM domain. The observed and simulated annual-mean FWCs, depicted in Figure 3, were derived using the observed and simulated salinity fields in the closed-box as illustrated in Figure 1. For the cases where observed FWC data were missing, an Optimal Interpolation (OI) method was employed to fill in the gaps from surrounding points or climatologically averaged salinity fields. Employing no data assimilation, AO-FVCOM generally replicated the interannual variability of observed FWC (Figure 3). Over the period 1978–2016, the correlation coefficient between the observed and simulated annual-mean FWC anomalies is 0.84 (p < 0.05), with a root-mean-square error (RMSE) of 0.77 m. All correlation coefficients reported in this study were calculated using the standard Pearson product-moment correlation coefficient. Both the observation and model results indicate sustained high FWC levels during the last decade of the study period, with approximately 20 m and 19 m over 2007–2016 compared to around 17 m and 15 m over 1997–2006 in the observations and AO-FVCOM, respectively. During the positive anomaly phase (2007–2016), the model exhibits a mean negative bias of −0.83 m relative to observations, which is larger than the −0.27 m bias during the negative anomaly phase (1997–2006).
Figure 3.
Comparison of observed and simulated FWC anomalies in the selected closed area of the BG system over 1978–2016. Both monthly averaged observed and simulated salinities were first interpolated to the central points of individual triangles, and then the FWC was calculated in individual triangular volumes. The anomaly was calculated based on the annually averaged dataset. The data sources for observed salinity fields are listed in the text.
Spatial distributions and quantities of simulated and observed FWCs during the CTD survey period spanning 2003–2016 were compared (Figure 4). While AO-FVCOM reasonably replicated FWC in the BG region, discrepancies were noted in the distribution of the maximum FWC compared to observations. This variance may be due to limited real-time river discharge data and inaccurate surface and boundary forcings, as only 20% of rivers had real-time records of freshwater runoff. Furthermore, observed FWC distribution was compiled from measurements taken at different times during the CTD surveys (Table 1), while simulated FWC distribution reflected averaged FWC over survey periods, typically spanning approximately one month or longer. Additionally, potential biases in simulated currents could influence the FWC flux into the BG region. Despite validation of simulated currents in the various areas such as the Bering Strait, Fram Strait, Barents Sea Opening, and the CAA [30,43,46,49], insufficient current data were available in the BG region for direct model validation.
Figure 4.
Distributions of observed (upper two rows) and model-simulated (lower two rows) FWC over the CTD survey period over 2003–2016. The observed FWC was first calculated by salinity at each station and gridded with a bound around the outmost CTD stations. The observed FWC was calculated at each station when salinity was measured. The simulated FWC was averaged over the survey period.
Both observational data and model results indicate that the transition to a positive phase in FWC anomaly occurred during 2006–2007, with the positive anomaly persisting from 2007 to 2016 (Figure 3). Meanwhile, the annual-mean sea ice extent in the Arctic has exhibited a decreased trend, declining at a rate of −5.51 × 10⁴ km2 per year over the 39-year period from 1978 to 2016. This trend aligns with findings reported by Comiso [57] and Zhang et al. [44]. September consistently marks the peak ice-melting month in the Arctic Ocean. In September 2007, the sea ice extent plummeted to 4.29 × 10⁶ km2, representing a loss rate of 36.5% compared with the climatological value of 6.72 × 10⁶ km2 in the same month of 1979–2006. This unusually significant sea ice loss led to an expansion of the ice-free area in the fall of 2007, thereby intensifying the BG and augmenting FWC in the BG region [55].
3.2. Ekman Pumping vs. Lateral Flux
Equation (3) indicates that the local change in FWC in the BG region is manipulated by the combined effects of Ekman salt pumping from the upper layer near the surface and the lateral FWC transports advected from surrounding regions. As previously mentioned, although Ekman pumping is a vertical velocity process, it governs freshwater redistribution because it moves water masses with distinct salinity characteristics. Specifically, the Ekman convergence drives downward pumping of the fresh surface layer (enriched by sea ice melt and precipitation minus evaporation) into the halocline. This vertical advection of low-salinity water constitutes a positive freshwater flux into the storage layer. Considering a closed control volume depicted in Figure 1, the simulations using AO-FVCOM suggest that both Ekman pumping and lateral freshwater fluxes are crucial in determining the freshwater accumulation of the BG region (Figure 5: upper panel). On an annually averaged scale, Ekman pumping contributes positively to the freshwater supply in the BG region, while the lateral flux generally removes the freshwater from the region. The interannual variability of total FWC is closely related to the disparity between these two processes. Accumulation occurs when the freshwater input associated with Ekman pumping exceeds the net lateral freshwater outflow. Notably, since 2007, there has been a significant increase in downward Ekman freshwater pumping, accompanied by a considerable rise in net outflow lateral freshwater flux. This suggests that the Beaufort Sea has entered a phase of heightened variability since 2007. The magnitudes of Ekman pumping and lateral freshwater fluxes were approximately 50 mSv from 1978 to 2006, escalating to about 100 mSv between 2007 and 2016. The variation in these two terms remained around 10–20 mSv from 1978 to 2006 but surged to 100 mSv or even more from 2007 to 2016. The local change in total FWC varied in a range from −34 to 37 mSv/year from 1978 to 2006 and from −30 to 51 mSv/year from 2007 to 2016. This implies that FWC variability in the BG region has intensified over the last decade of the study period.
Figure 5.
(Upper panel): yearly variations in FWC fluxes induced by Ekman pumping () and net lateral advection () and local change in the total FWC ( in the closed control volume shown in Figure 1. The dotted lines represent the mean values for the two time periods (1979–2006 and 2007–2016). (Lower panel): yearly variations in FWC fluxes through sections 1–3 and section 5 (FWCLF-1–3&5), section 4 (-4), and the sum of -1–3&5 and -4. The dotted lines represent the linear trends for the two time periods (1979–2006 and 2007–2016).
We have analyzed the inflow and outflow within the designated control volume in the BG region, revealing that sections 1–3 and section 5 were predominated by the influx from the Beaufort Sea shelf and Chukchi Plateau, while section 4 was characterized by an outflux (Figure 5: lower panel). The total inflow lateral FWC flux through sections 1–3 and 5 displayed a gradual increase, with a slight uptrend of approximately 0.2 mSv/yr during the period spanning from 1978 to 2006, followed by a sharp rise at a rate of 7.4 mSv/yr from 2007 to 2016. The substantial rise in lateral advection FWC flux over the past decade implies significant changes in the flow dynamics over the continental shelf of the Beaufort Sea since 2007. In contrast, the outflow of lateral FWC flux also experienced enhancement, with a magnitude increasing by −0.3 mSv/yr from 1978 to 2006 and by −6.3 mSv/yr over the period from 2007 to 2016. Due to the consistent superiority of FWC outflux over the FWC influx, the net annual-mean FWC flux remained negative throughout the entire 39 years. This suggests that the release of freshwater from the BG region has contributed to considerable freshening of the Arctic interior.
Ekman pumping in the selected control volume area was produced by combining ice–ocean interfacial stress in the ice-covered regions and wind stress in the ice-free areas [55]. Over the period from 1978 to 2016, the observed annual-mean ice coverage averaged 92.4%. However, since 2007, the ice-free area has significantly expanded in the BG region, fluctuating interannually, with a maximum deviation of −16.21% in 2012. Despite variations in annual-mean ice concentration, Ekman pumping generated by ice drifting (ice-ocean interfacial stress curl) significantly outweighed that resulting from surface wind stress curl by orders of magnitude (Figure 6: second row). Notably, in 2007, Ekman pumping reached −8.3 cm/day, with only 18% attributed to the surface wind stress, while a substantial 82% resulted from ice–ocean interfacial stress. Assuming no ice existed in the control volume in the past 39 years, Ekman pumping produced by surface wind stress would be half as much compared to the scenario with ice coverage (Figure 6: third row).
Figure 6.
Yearly variations in AO index (top), Ekman pumping under sea ice condition (second row), Ekman pumping under ice-free condition (third row), and sea ice coverage anomaly (bottom) over 1978–2016. The label “R” represents the correlation coefficient.
Additionally, we discovered that the annual variation in Ekman pumping did not exhibit a positive correlation with the Arctic Oscillation (AO) index over the past 39 years (Figure 6: first row). The correlation coefficient was 0.23. Furthermore, even when assuming that the Beaufort Sea is entirely open water, Ekman pumping generated under ice-free conditions demonstrated a low correlation coefficient of 0.24 with the AO index (Figure 6: third row). This outcome aligns with the finding from observations and process-oriented model studies [39].
While Ekman pumping-induced freshwater flux in the BG region accounted for contributions from sea ice melting and net precipitation, we also evaluated freshwater quantities derived by these processes using data from the UG-CICE model for ice and snow salt flux and the meteorological model output for precipitation. In the BG region, substantial ice melting occurred during summer through fall, peaking notably in late August and September. However, since the ice formed again from late fall through spring, the net annual-mean freshwater input solely due to ice melting was small. The annual-mean ice melting-induced freshwater flux exhibited significant interannual variability, with peaks occurring in 2007 and 2012 (Figure 7: upper panel). Even for these years, ice melting only contributed 17.2 and 14.1 mSv to the annual-mean freshwater flux, which is ten times smaller than the total annual-mean Ekman pumping. The annual-mean freshwater flux resulted from net precipitation was around 7–9 mSv between 1978 and 2006, and significantly increased to 16–21 mSv after 2010 (Figure 7: lower panel). Although its contribution exceeded that from ice melting, it remained 8–9 times smaller than the total annual Ekman pumping.
Figure 7.
Yearly variation in FWC fluxes induced by freshwater flux due to sea ice (upper panel) and precipitation minus evaporation (lower panel).
We analyzed the relative contributions of Ekman pumping and lateral advection to FWC in the BG region over a seasonal scale. In the period from 1978 to 2006 (Figure 8: left panel), the 29-year averaged monthly mean Ekman pumping-induced freshwater flux was high during winter and low during spring through summer, reaching a minimum of 12.8 mSv in August and a maximum of 83.1 mSv in October. In contrast, the net lateral FWC flux showed an outflow during spring, fall, and winter, but an inflow during summer, with a maximum outflow flux of −106.6 mSv in November and a maximum inflow of 45.8 mSv in August. This pattern indicates that the lateral flux contributed to freshwater accumulation during the summer, even though it removed freshwater over an annual average scale. Moreover, summers were conducive to freshwater accumulation in the BG region, as the freshwater influx from Ekman pumping was balanced or overweighed by the net outflow freshwater flux due to advection.
Figure 8.
Mean seasonal cycle of FWC fluxes induced by Ekman pumping () and net lateral advection (), as well as their difference, averaged over the periods from 1978 to 2006 (left panel) and from 2007 to 2016 (right panel).
In the period from 2007 to 2016 (Figure 8: right panel), the 10-year averaged monthly net lateral freshwater flux showed a significant increase during late summer, peaking at 86.4 mSv in August, representing a 47% increase compared with the period from 1978 to 2006. Meanwhile, the Ekman pumping-induced freshwater flux decreased significantly in August, even becoming negative. This small negative flux observed in the BG region arises from a seasonal imbalance where Ekman divergence slightly exceeds Ekman convergence, driven by the combination of sea ice melt dynamics and seasonal wind stress variations. The increase in lateral flux, coupled with the decrease in Ekman pumping, has made the lateral flux a more dominant factor in driving freshwater accumulation during summer.
It should be pointed out here that the amount of the advection-induced lateral FWC flux may vary depending on the selection of the closed control volume box. In designing the closed control volume box, we referred to the literature on BG. It is worth noting that the horizontal scale of BG varies from year to year [7,58]. AO-FVCOM shows that the Arctic slope is characterized by a cyclonic flow, primarily located at the shelf break around the 200 m isobath. As this flow enters the Beaufort Sea region, it interacts with the coastal flow originating from the Bering Strait inflow and river runoff around the North American coast.
3.3. Possible Freshwater Sources Detected by Backward Particle Tracking
Particles were released in the BG region across three distinct depth layers: upper 50 m, 50–100 m, and 100–200 m. Their origins were tracked inversely over a span of 22 months, from January 1, 2006 to November 1, 2007. Flow fields averaged in these three layers were utilized during particle tracking. The three-layer backward particle tracking results revealed a distinct spatial heterogeneity in the freshwater pathways entering the BG. A significant majority of particles (>70%) remained in the BG across all three layers, indicating its role as a relatively stable circulation system (Figure 9). The primary sources of water flowing into the BG region were identified as follows: 1) the Bering Strait and 2) the rivers along North American coast connected to the CAA, with a possible contribution from the Eurasian continental shelf. In the upper 50 m layer, inflow from the surrounding water comprised 29.9%, with 14.4% originating from the Bering Strait and 15.5% from the rivers connected to the CAA. It indicates that surface layer freshwater in the BG is a mixture of these two prominent sources. In the 50–100 m layer, the inflow contribution decreased to 10.4%, evenly split between the Barents and Kara Seas shelf and the Bering Strait/river region. The result suggests that this layer serves as a transition zone where Atlantic-derived and Pacific-derived waters converge. For the depths of 100–200 m, the inflow, accounting for 9.7%, consisted entirely of waters originating from the Barents and Kara Seas and the Fram Strait. These waters were driven towards the Beaufort Sea by the cyclonic slope flow, ultimately entering the BG region along the continental shelf. This vertical partitioning of source waters has important implications for understanding how different climate forcings may affect the BG system at different depths.
Figure 9.
The ending locations of particles after a 22-month backward tracking from 1 January 2006 to 1 November 2007. The vertically averaged velocities in the layers of upper 50, 50–100, and 100–200 m were used. In each panel, the upper corner figure shows initial particle locations, and light blue dots represent particles remaining in the BG region. A total of 6218 particles were released. In the left panel, blue: the particle ending locations, showing the water in the BG could come from Bering Strait and rivers connected to the Canadian Arctic Archipelago. In the middle panel, blue: particle trajectories traced back to the Chukchi Sea; dark red: particle trajectories with their origins from rivers connected to the Canadian Arctic Archipelago. In the middle and right panels, red: particle trajectories traced back to the Eurasian shelf connecting to the Barents and Kara Seas.
The backward particle trajectories suggested that, in addition to the Bering Strait and rivers along the North American coast, the Eurasian continental shelf was a possible water source contributing to the interannual variability of FWC in the BG region. This is consistent with the observations in the Kara Sea, where the large freshened surface layer formed by the Ob and Yenisei rivers undergoes significant seasonal transformation [59]. However, given that most of the continental shelf region over the Eurasian coast is shallower than 200 m, it raises questions about whether freshwater from the coast could flow into the slope, where the cyclonic slope current exists. To investigate this, we conducted forward particle tracking experiments by releasing particles near rivers on the North American and Eurasian coasts, the Russian coast of the Chukchi Sea near the Bering Strait, and the Barents and Kara Seas. In all the cases, particles were released on January 1 and June 1 each year from 2007 to 2013, and their trajectories marked by salinity and temperature were tracked for a three-year period. We selected specific particle trajectories to illustrate our exploration of possible water sources from the Eurasian coast.
On the North American coast, particle trajectories varied significantly from year to year, suggesting the striking interannual variability in the connectivity between North American rivers and the BG. For instance, most particles released in 2011 and 2012 followed coherent pathways into the BG region. Their salinity ranged from 28 to 35 PSU, indicating that their freshwater signature was preserved during transit (Figure 10). In 2010 and 2013, particle trajectories were more dispersed, and fewer particles successfully reached the BG. This variability likely reflects changes in the strength and direction of the coastal current along the Alaskan shelf, which may be modulated by local wind forcing and the regional sea level pressure gradient. This finding supports the findings from the backward particle tracking results, which indicated that rivers along the coast were one of the major freshwater sources to the BG region.
Figure 10.
Trajectories of particles over a 3-year period released in the upper 50 m layer near the rivers on the North American coast on 1 June, 2010, 2011, 2012, and 2013. In each figure, the T/S diagram represents the water properties of particles during the tracking period, and the lower-left corner subfigure shows initial particle locations. Only particles that enter the BG region are selected in these subfigures.
On the Eurasian coast, particles released near rivers in winter and summer, characterized by salinity ranging from 8 to 35 PSU, remained largely trapped nearshore, and only a few were able to enter the continental slope region where the cyclonic boundary current flows. Examples are shown in Figure 11 for scenarios with particle release in winter in 2007 and 2010. Despite a significant sea ice melting event in September 2007, the particles originating from the Eurasian rivers could not enter the Chukchi Plateau. For scenarios with particle release in 2010, particles from rivers along the Eurasian coast moved along the coast and arrived on the coast of the Chukchi Sea near the Bering Strait after three years. This indicates that Eurasian river runoff, despite its large volume, is not a direct source of freshwater to the BG due to the strong coastal current that retains it on the wide shelf.
Figure 11.
Trajectories of particles over a 3-year period released in the upper 50 m layer near the rivers on the Eurasian coast on 1 January, 2007 and 2010. In each figure, the T/S diagram represents the water properties of particles during the tracking period, and the upper-left corner subfigure shows initial particle locations.
Particles released along the Russian coast of the Chukchi Sea had salinity ranging from 28 to 34 PSU, confirming that they carry a significant freshwater signal (Figure 12). However, their trajectories exhibited significant interannual variability. For example, only a few particles moved to the Chukchi Plateau when released in 2010 and 2011, but a certain number of particles arrived in that area in 2012 and 2013. This suggests that freshwater along the Russian coast could combine with freshwater from the Bering Strait, contributing to the FWC in the BG region.
Figure 12.
Trajectories of particles over a 3-year period released in the upper 50 m layer along the Russian coast of the Chukchi Sea on 1 June, 2010, 2011, 2012, and 2013. In each figure, the T/S diagram represents the water properties of particles during the tracking period, and the lower-left corner subfigure shows initial particle locations. Only particles that enter the Chukchi Plateau area are selected in these subfigures.
The Barents and Kara Seas reveal the role of water mass transformation in freshwater signal during transit. Most particles released in the Barents and Kara Seas circulated locally in the region, with only a few entering the continental slope where the cyclonic slope current was present. The particles entering the slope varied from year to year. Examples were illustrated in Figure 13, where only particle trajectories entering the slope were displayed. In the 50–100 m depth range, particles, representing freshwater with salinity as low as 28 PSU at the release origin, became saltier after mixing with high-salinity North Atlantic water upon entering the slope. Therefore, even though some particles could reach the Chukchi Plateau, they transitioned to saltwater, thus becoming incapable of contributing to the FWC in the BG region. In the 100–200 m depth range, a lot of particles, with salinity as low as 32 PSU, left the Barents and Kara Seas, entered the slope, and eventually reached the BG region, especially for particles released in 2007. However, upon mixing with high-salinity North Atlantic water, by the time these waters arrived in the BG region, their salinities were aligned with those of the North Atlantic waters, thus negating any potential contribution to the FWC in the region.
Figure 13.
Trajectories of particles over a 3-year period released in the layers of 50–100 (upper panels) and 100–200 m (lower panels) in the Barents and Kara Seas on 1 January, 2007, and 2010. In each figure, the T/S diagram represents the water properties of particles during the tracking period, and the upper-left corner subfigure shows initial particle locations. Only particles entering the Arctic continental slope are selected.
The forward particle tracking experiments suggest that the Barents and Kara Seas were not the possible source of the FWC in the BG region. Although water masses in these regions can enter the slope and be transported to the BG region by the cyclonic slope current at depths of 100–200 m, their transitions to saltwater upon mixing with the North Atlantic waters significantly diminish their potential to enhance the FWC in the BG region. Consistent with the backward particle tracking experiments, the primary freshwater sources in the BG region were from the Bering Strait and rivers along the North American coast, with a possible contribution from freshwater along the Russian coast of the Chukchi Sea.
3.4. Interannual Variability in the Regional Circulation
The model suggests that significant interannual variabilities have been observed in sea ice concentration, circulation, and salinity in the Arctic since 2007. The 2007 annual-mean currents and salinity anomalies relative to the 1978–2006 climatological mean were calculated for the upper 100 m average (Figure 14). In 2007, currents over the continental shelf were intensified notably. Several regions, particularly over the Russian coast and in the Barents and Kara Seas, exhibited much fresher conditions. The outflow from the Barents and Kara Seas was strengthened, with a maximum difference up to ~3.0–5.0 cm/s, leading to the intensification of the cyclonic slope current towards the Beaufort Sea. The Russian coastal flow became more vigorous, transporting more water along the coast to merge with the inflow from the Bering Strait and move towards the slope where the cyclonic slope currents were located. Along the North American coast, the northward component of the coastal current originating from the Mackenzie and Firth Rivers was intensified. This flow enhancement increased the northward freshwater transport, consequently augmenting the inflow flux into the BG region. Although the inflow from the Bering Strait was strengthened, the salinity was also increased during its journey along the Alaska coast.
Figure 14.
Differences in currents and salinities averaged annually over 2007 and 1978–2006. The currents and salinities referred to the upper 100 m averages. The semi-transparent purple shadows are overlapped to illustrate the major intensified coastal and slope flows. Red vectors: current differences. Black lines: the transects labeled A–H where the volume transports are estimated.
The Arctic Basin, connected to the BG region, also experienced increased FWC. The notable increase in freshwater outflow through section 4 (Figure 5) suggested that this freshening was partly attributed to the freshwater release from the BG region into the interior Arctic Basin. Additionally, we analyzed the salinity anomaly relative to the annual-mean salinity averaged over 1978–2006 for subsequent years from 2007 to 2016. Our findings revealed significant temporal variability in the release of FWC from the BG region to the interior Arctic Basin. This interannual variability is directly correlated with fluctuations in the BG’s FWC and slope flows around the Chukchi Plateau. The possible freshwater release from the Arctic could augment downstream freshwater transport onto the northwestern Atlantic shelf, intensifying freshening and cooling in the shelf waters. Consequently, this could induce changes in the shelf marine ecosystems and fishery resources [22].
To assess the change in currents over the Arctic continental shelf since 2007, we initially verified a balance between inflows from the Bering Strait and the Barents Sea Opening, and outflows from the Fram Strait and Baffin Bay using model results (Figure 15). Subsequently, we computed volume transports through sections labeled A–H over the period 1978–2016 (Figure 16). Zhang et al. [43] previously investigated the inflow–outflow balance based on AO-FVCOM results from 1978 to 2013. Considering numerical uncertainties, they confirmed AO-FVCOM’s ability to conserve flux between inflows and outflows. In this study, we reassessed this balance with an extended simulation period up to 2016. Our findings indicate that AO-FVCOM maintains the balance between inflows and outflows without assimilation (Figure 15).
Figure 15.
Yearly variations in simulated volume flux anomalies through Bering Strait, Barents Sea Opening, Fram Strait, and the Baffin Bay over 1978–2016.
Figure 16.
Yearly variations in volume transports through sections labeled A–H over 1978–2016. Light blue color areas indicate the range of standard deviation relative to the yearly mean value. The red line indicates the linear trend and the number listed in each panel is the increase rate based on linear regression fitting. Note: different scales are used in each subfigure.
Transports through the selected sections have exhibited remarkable interannual variability in the last decade of the study period, with linear trends calculated using ordinary least squares linear regression showing an increasing trend from 1978 to 2016 (Figure 16). Notably, the positive and negative signs were defined based on current directions shown in Figure 10. A positive sign indicates concordant current direction, while a negative sign indicates discordant current direction. Segmenting the period in 1978–2006 and 2007–2016, we compared the transport changes across these two periods.
Section A traverses the shelf near the Mackenzie River. The annual-mean transports averaged over 1978–2006 and 2007–2016 were 0.02 and 0.09 Sv, respectively, representing a 4.5-fold increase between these two periods. In 2014, the annual-mean transport reached 0.16 Sv, approximately 2.3 times larger than the maximum annual-mean transport of 0.07 Sv during 1978–2006.
Section B lies in an area where inflow currents from the Bering Strait and coastal currents from section A converge. The annual-mean transports averaged over 1978–2006 and 2007–2016 were 0.18 and 0.21 Sv, respectively, indicating a 1.2-fold increase from the period 1978–2006 to 2007–2016.
Section C spans the Russian coast. The annual-mean transport through this section was −0.05 Sv over 1978–2006 and 0.01 Sv over 2007–2016, signifying a significant increase in transport toward the Bering Strait during 2007–2016.
The annual-mean transport was increased by 0.14 Sv on section D and 0.02 Sv on sections E and F, indicating intensified cyclonic slope currents during 2007–2016. A similar increasing trend was observed on sections G and H, although the rate of increase was lower than that on section A. Note that the rate of increase may vary depending on the chosen section length. However, the most crucial point is that the flow over the Arctic continental shelf has intensified since 2007.
The increasing contribution of the freshwater input from the lateral flux was consistent with the annual-mean salinity anomaly on sections 1–3 and section 5 of the selected closed region over the Beaufort Sea slope (Figure 17). On sections 1–3, the mean salinity anomaly has consistently remained negative since 2010, while on section 5, it has varied significantly from year to year due to the variability of the complex currents over the Chukchi Plateau. Since all these four sections were located roughly along the 200 m isobaths on the slope, the negative mean salinity anomalies suggest a freshening trend over the last decade.
Figure 17.
Changes in the annual-mean salinity anomalies throughout the water column from the surface to the reference salinity depth or bottom (if the salinity at the bottom is less than the reference salinity) on sections 1–3 and section 5 of the closed-box area shown in Figure 1.
The evidence for current intensification was also supported by the increase and large variability in the outflow FWC transport from the Barents and Kara Seas. In these two regions, the outflow FWC transport anomaly displayed the same yearly variation pattern as the anomaly of the lateral advection flux into the BG region (Figure 18: lower panel). The correlation coefficient of 0.69 indicates a strong positive correlation, exceeding the critical level of 0.32 at a 95% confidence level. When considering only the period from 2007 to 2016, the correlation coefficient remains high at 0.73. However, as highlighted in our forward particle tracking experiments, the water entering the Arctic continental slope from the Barents and Kara Seas becomes saltwater after mixing with the North Atlantic water. This evidence serves as a cautionary reminder against solely relying on the correlation coefficient value to establish a connection between the increased FWC inflow flux in the BG region and the enhanced outflow from the Barents and Kara Seas.
Figure 18.
Changes in the annual-mean FWC flux anomalies through Bering Strait (BS) and the Barents/Kara Seas (BKS) over 1978–2016. and are the correlation coefficients with the lateral FWC flux into the Beaufort Sea (BFS) bounded by the closed box (Figure 1), respectively.
The anomaly of the inflow FWC transport from the Bering Strait varied dramatically over the last decade, which was positive in 2007 and 2016 and over 2010–2011 but negative over 2008–2009 and 2012–2015. This variability was mainly due to the higher salinity anomaly around the strait area, despite consistent inflow characteristics. The correlation coefficient with the lateral advection FWC flux into the BG region was only 0.21, below the critical level of 0.32 at a 95% confidence level. Even considering only the period from 2007 to 2016, the coefficient increased slightly to 0.36 but remained below the critical significant level. This finding suggests that while the inflow from the Bering Strait serves as a freshwater source entering the Arctic, its contribution to the freshwater accumulation in the BG region fluctuates from year to year.
Furthermore, we examined river runoff anomalies observed at the North American and Eurasian coasts (Figure 19). Over the past 39 years, freshwater discharges from rivers around the Arctic have exhibited a linearly increasing trend. The yearly mean freshwater runoff showed varying rates of increase for different rivers: 35.58 m3/s for the total discharge from the Firth, Kobuk, and Mackenzie Rivers on the North American coast, 77.58 m3/s in the Lena River on the Russian coast, and 21.96 m3/s for the total discharge from the Yenisei and Ob Rivers on the Barents and Kara Seas’ coasts (Figure 19). Increased river discharges were correlated with the rise in Arctic temperature [25,60] and introduced additional freshwater into the coastal ocean, reducing local density and raising sea surface height. This along-shore pressure gradient can directly accelerate the coastal currents and enhance lateral advection FWC flux into the BG region. These phenomena reflect two correlative time-scale variabilities: one originating locally from the Firth, Kobuk, and Mackenzie Rivers on the North American coast, and the other remotely from rivers in the Barents and Kara Seas plus the Russian coast. These findings are consistent with the conceptual model results proposed by Morison et al. [3], who suggested that runoff significantly influences the Arctic Ocean and the Arctic Oscillation modulates the spatial and temporal manifestations of runoff pathways. In addition, the increase in coastal current intensity is also driven by changes in wind stress curl and along-shore wind components associated with shifting atmospheric patterns. These winds can directly force the geostrophic adjustment and Ekman transport that accelerate the boundary currents.
Figure 19.
Yearly variations in runoff anomalies observed at the Firth, Kobuk, and Mackenzie Rivers (upper), the Lena River (middle), and the Yenisei and Ob Rivers (bottom). Red-filled dot: anomaly. The black line displayed in each panel represents the increase rate of river discharge in a unit of /s.
4. Discussion
Our findings align with previous observed and modeling studies. Meneghello et al. [31] utilized four observed datasets, including sea ice concentration, sea ice velocity, geostrophic currents derived from dynamic ocean topography, and 10 m wind, to evaluate Ekman pumping in the BG region. They found that the mean Ekman downwelling during 2003–2014 was relatively weak due to pronounced seasonal and interannual variability. For this period, the estimated mean Ekman pumping velocity was 2.3 m yr−1 in a downward direction, with monthly and yearly averages ranging from 30 m yr−1 downward to 10 m yr−1 upward.
Under the consistent framework, the AO-FVCOM results showed a mean Ekman pumping velocity of 6.7 m yr−1 downward in the selected BG region over 2003–2014. Monthly averages varied from 24.6 m yr−1 downward to 6.0 m yr−1 upward, while yearly means spanned from 20.2 m yr−1 downward to 0.8 m yr−1 upward. These values fall within the range estimated by Meneghello et al. [28], indicating consistency between the AO-FVCOM results and their estimations. Discrepancies may arise from variations in the selected domain and the utilization of different datasets.
Kelly et al. [61] utilized the NEMO model and a Lagrangian backward tracking technique to investigate BG water sources. They released particles at five depths (1, 21, 44, 82, and 140 m) in the BG region, with monthly releases spanning from 1980 to 2013, and each particle tracking extended for ten years. AO-FVCOM released particles at three depth layers in the BG region: upper 50 m, 50–100 m, and 100–200 m, covering a 22-month backward tracking period from 1 January 2006 to 1 November 2007.
The AO-FVCOM findings agree with the particle tracking results of Kelly et al. [26], showing that over 70% of particles remained in the BG across all three layers, indicating the persistent particles within the gyre. Both NEMO and AO-FVCOM models suggest that the BG is a stable system, with the Pacific Ocean and Mackenzie River on the North American coast identified as dominant water sources to drive the BG variability. AO-FVCOM further indicated that inflow from surrounding waters accounted for 29.9% in the upper 50 m, with 14.4% from the Bering Strait and 15.5% from the Mackenzie River, which is consistent with the findings from Kelly et al. [61] in the upper 50 m.
However, discrepancies arose in deeper layers between the findings of Kelly et al. [61] and AO-FVCOM. While Kelly et al. [61] identified the Pacific Ocean and Mackenzie River as primary sources at depths of 82 m and 140 m releases, AO-FVCOM suggested additional sources from the shelf of the Barents and Kara Seas in 50–100 m and inflow from the Barents and Kara Seas and Fram Strait in 100–200 m depths. These disparities may stem from differences in model resolution, particle positions, and release depths. Further forward particle and water mass tracking experiments revealed that the water from the Barents and Kara Seas became salty after mixing with the North Atlantic water over the Arctic continental slope, thus making no contributions to freshwater accumulation in the BG region.
Physical processes associated with changes in shelf–basin water interactions have been intensively investigated through observations and modeling in the past [62,63,64,65,66,67,68,69]. Gao [64] utilized refined-grid (Grid-III) high-resolution AO-FVCOM to explore the ice–ocean interaction process in the marginal ice zone (MIZ) over the Beaufort Sea shelf. Two distinct mechanisms were identified as drivers of the ice–ocean interaction process in the MIZ: baroclinic instability of the current jet over the slope and dense water formation. These mechanisms were theoretically examined by idealized model studies [63,67]. The current jet over the slope exhibits high energy and baroclinic instability, while the MIZ features mesoscale eddies with a spatial scale of approximately 20 km. The presence of eddies alters the internal stress at the sea surface, resulting in sea ice velocity vortices as a response of sea ice to ocean currents. Under an upwelling-favorable wind condition, surface stress shear in the MIZ can generate multiple anticyclonic eddies over the slope. In addition, during the sea ice formation period, cold and salt water can be transported from the shelf to the slope along the bottom, forming a near-bottom intensified along-shelf buoyancy flow and mesoscale eddies in the deep slope region. The presence of sea ice velocity vortex was observed in the satellite images of Moderate-resolution Imaging Spectroradiometer, and the slope-bottom intensified flow was detected by moored current measurements [70,71]. It is evident that the mesoscale eddy flux is a crucial process contributing to the transport of freshwater to the BG region.
To estimate the contribution of mesoscale eddies to the FWC flux in the BG region, we decompose the total lateral FWC flux into annual-mean and sub-annual components. Our analysis revealed that the sub-annual FWC into the BG region was approximately one order of magnitude smaller than the annual-mean FWC flux. This finding was derived from an AO-FVCOM run with a Grid-II horizontal resolution.
Chen et al. [30] conducted a comparative study of AO-FVCOM-simulated currents over the Beaufort Sea continental shelf for both Grid-II and Grid-III cases. They concluded that to resolve eddy fluctuations over the slope accurately, the model resolution needed to be less than 2.0 km. According to their findings, the Grid-II horizontal resolution utilized in the 39-year AO-FVCOM simulation was insufficient to represent mesoscale eddies adequately. Consequently, the sub-annual lateral advection FWC flux may not be indicative of the eddy-induced FWC flux.
Due to limited computational resources, we were unable to conduct a new 39-year simulation with a refined grid over the slope of the BG region. Instead, we selected the year 2012 to address this question by re-running the AO-FVCOM simulation with Grid-III horizontal resolution specifically over the Beaufort Sea slope. The Grid-III AO-FVCOM is an eddy-resolving model known for its capability to resolve mesoscale eddies in the MIZ over the Beaufort Sea slope [30,64]. Our sensitivity study reveals distinct behaviors between grid resolutions. By comparing the annual-mean and sub-annual FWC fluxes obtained from model results using Grid-II and Grid-III, we found that the total FWC fluxes for both grid cases were similar. Although the sub-annual FWC flux in Grid-III exhibits pronounced high-frequency variability due to resolved mesoscale eddies, its mean value is lower than that in Grid-II (Figure 20). This indicates that the Grid-II simulation, used for the 39-year analysis, does not systematically underestimate the true long-term lateral FWC flux.
Figure 20.
The simulated sub-annual FWC fluxes into the BG region bounded by the closed box shown in Figure 1 for the Grid-II and Grid-III cases in 2012. Blue and red dashed lines: mean sub-annual FWC fluxes for the Grid-II and Grid-III cases, respectively.
While a comprehensive investigation into the role of eddy fluxes is beyond the scope of this paper, it is clear that both mean advection and eddy activity play critical roles in freshwater accumulation in the BG region, highlighting the significance of coastal and slope flows.
5. Conclusions
In the past decades, the Arctic Ocean has witnessed a notable accumulation of freshwater within the BG region. Utilizing the high-resolution AO-FVCOM, we simulated FWC spanning from 1978 to 2016. Subsequently, we conducted process studies to investigate the physical mechanisms driving freshwater accumulation and to delineate freshwater sources and pathways into the BG region.
The AO-FVCOM simulations successfully captured the interannual variability of FWC in the BG region. Both the observational data and model results indicate sustained high levels of FWC during the last decade of the study period. Specifically, FWC remained approximately 20 m and 19 m over 2007–2016, compared to around 17 m and 15 m over 1997–2006 in observations and AO-FVCOM simulation, respectively.
The 39-year simulation reveals a notable increase in freshwater accumulation within the BG region, particularly commencing in 2007 coinciding with a substantial rise in Ekman pumping. On an annually average scale, Ekman pumping contributes positively to the freshwater supply in the BG region, whereas the lateral flux generally removes freshwater from the region. The interannual variability of total FWC is closely linked to the disparity between these two processes. Accumulation occurs when the downward freshwater flux induced by Ekman pumping surpasses the net outflow-induced lateral freshwater flux.
On a seasonal scale, the monthly mean net lateral freshwater flux exhibits a significant increase during late summer in the period from 2007 to 2016, peaking at 86.4 mSv in August, indicating a 47% increase compared with the period from 1978 to 2006. Meanwhile, due to enhanced sea ice melting during the summer, the Ekman pumping-induced freshwater flux experiences a significant decrease in August, occasionally becoming negative. The escalating lateral flux and diminishing Ekman pumping have elevated the significance of lateral flux as a driving process behind freshwater accumulation during the summer season.
The results from backward particle tracking experiments have identified the primary sources of water flowing into the BG region, including the Bering Strait and the rivers on the North American coast, with a potential contribution from the Eurasian continental shelf. However, further forward particle tracking experiments suggest that the Barents and Kara Seas are not significant sources of FWC in the BG region. Although water masses in these regions can enter the slope and be transported to the BG region by the cyclonic slope current at depths of 100–200 m, they became saltwater after mixing with the North Atlantic water, thus not contributing to the FWC in the BG region.
Additionally, the 39-year AO-FVCOM simulations have revealed significant interannual variability in currents over the Arctic continental shelf, particularly in the last decade, leading to an increased linear trend from 1978 to 2016. This increase in flow intensity, primarily observed during the summer seasons, is attributed to the high variability of sea ice melting. Moreover, the intensification in coastal currents is influenced by both the increase in freshwater discharges from rivers on the North American and Eurasian coasts and changes in wind-driven atmospheric forcing.
Several limitations regarding our forcing datasets should be acknowledged. River runoff forcing is a key source of uncertainty wherein only some rivers have real-time discharge records with daily or monthly resolution, while the remainder rely on monthly climatological means. Although the major Arctic rivers are included in the real-time dataset, the exclusion of smaller coastal rivers may lead to an underrepresentation of local freshwater variability and its specific impact on near-shore dynamics. Uncertainties in atmospheric forcing datasets also remain a challenge, as the model is driven by reanalysis products with inherent biases, especially in regions with sparse observational coverage. Additionally, the use of fixed air–sea and ice–ocean drag coefficients, rather than variable coefficients that depend on ice roughness and surface conditions, may affect the accuracy of stress calculations. Discrepancies among different reanalysis models could introduce biases in the magnitude of wind stress curl and its temporal trends, potentially affecting the precise quantification of wind-driven contributions. Future studies integrating expanded river runoff monitoring and multi-model atmospheric ensembles will be essential to refine these estimates.
Author Contributions
Conceptualization, Y.Z. and C.C.; methodology, Y.Z. and C.C.; software, Y.Z., M.W. and D.W.; validation, Y.Z. and D.W.; formal analysis, Y.Z. and C.C.; resources, M.W.; data curation, Y.Z. and M.W.; writing—original draft preparation, Y.Z. and C.C.; writing—review and editing, M.W. and D.W.; visualization, Y.Z. and M.W.; supervision, C.C. All authors have read and agreed to the published version of the manuscript.
Funding
This research is supported by the National Natural Science Foundation of China (42376231 and 42130402), the National Key Research and Development Program of China (2019YFA0607001), and the Natural Science Foundation of Shanghai (22ZR1427400) for Yu Zhang, and the US National Science Foundation (PLR-1603000) for Changsheng Chen.
Data Availability Statement
The hydrographic (CTD) data used to calculate the freshwater content are available from the Beaufort Gyre Exploration Project at https://www2.whoi.edu/site/beaufortgyre/data/ctd-and-geochemistry/ (accessed on 3 January 2026). The major rivers data are available from https://arcticgreatrivers.org/discharge/ (accessed on 3 January 2026). The AO-FVCOM data during 1978–2016 are available from the corresponding author upon reasonable request.
Acknowledgments
We would like to thank the editors and the anonymous reviewers for their constructive comments and advice. We sincerely thank Andrey Proshutinsky and Kenneth H. Brink for their valuable comments and suggestions.
Conflicts of Interest
The authors declare no conflicts of interest relevant to this study.
References
- Giles, K.A.; Laxon, S.W.; Ridout, A.L.; Wingham, D.J.; Bacon, S. Western Arctic Ocean freshwater storage increased by wind-driven spin-up of the Beaufort Gyre. Nat. Geosci. 2012, 5, 194–197. [Google Scholar] [CrossRef] [Scilit]
- Krishfield, R.A.; Proshutinsky, A.; Tateyama, K.; Williams, W.J.; Carmack, E.C.; McLaughlin, F.A.; Timmermans, M.L. Deterioration of perennial sea ice in the Beaufort Gyre from 2003 to 2012 and its impact on the oceanic freshwater cycle. J. Geophys. Res. Ocean. 2014, 119, 1271–1305. [Google Scholar] [CrossRef] [Scilit]
- Morison, J.; Kwok, R.; Peralta-Ferriz, C.; Alkire, M.; Rigor, I.; Steele, M. Changing arctic ocean freshwater pathways. Nature 2012, 481, 66–70. [Google Scholar] [CrossRef] [Scilit] [PubMed]
- Proshutinsky, A.; Bourke, R.H.; McLaughlin, F.A. The role of the Beaufort Gyre in Arctic climate variability: Seasonal to decadal climate scales. Geophys. Res. Lett. 2002, 29, 2100. [Google Scholar] [CrossRef] [Scilit]
- Proshutinsky, A.; Krishfield, R.; Barber, D. Preface to special section on Beaufort Gyre Climate System Exploration Studies: Documenting key parameters to understand environmental variability. J. Geophys. Res. Ocean. 2009, 114, C00A08. [Google Scholar] [CrossRef] [Scilit]
- Proshutinsky, A.; Timmermans, M.L.; Ashik, I.; Beszczynska-Moeller, A.; Carmack, E.; Zimmermann, S.; Bidegain, M.; Bissolli, P.; Bryden, H.L.; Dohan, K.; et al. The Arctic Ocean [in “State of the Climate in 2010”]. Bull. Am. Meteorol. Soc. 2011, 92, S145–S148. [Google Scholar]
- Proshutinsky, A.; Krishfield, R.; Timmermans, M.L.; Toole, J.; Carmack, E.; McLaughlin, F.; Williams, W.J.; Zimmermann, S.; Itoh, M.; Shimada, K. Beaufort Gyre freshwater reservoir: State and variability from observations. J. Geophys. Res. Ocean. 2009, 114, C00A10. [Google Scholar] [CrossRef] [Scilit]
- Proshutinsky, A.; Krishfield, R.; Toole, J.M.; Timmermans, M.L.; Williams, W.; Zimmermann, S.; Yamamoto-Kawai, M.; Armitage, T.W.K.; Dukhovskoy, D.; Golubeva, E.; et al. Analysis of the Beaufort Gyre freshwater content in 2003–2018. J. Geophys. Res. Ocean. 2019, 124, 9658–9689. [Google Scholar] [CrossRef] [Scilit]
- Dickson, R.R.; Meincke, J.; Malmberg, S.A.; Lee, A.J. The “great salinity anomaly” in the northern North Atlantic 1968–1982. Prog. Oceanogr. 1988, 20, 103–151. [Google Scholar] [CrossRef] [Scilit]
- Häkkinen, S. An Arctic source for the great salinity anomaly: A simulation of the Arctic ice-ocean system for 1955–1975. J. Geophys. Res. Ocean. 1993, 98, 16397–16410. [Google Scholar] [CrossRef] [Scilit]
- Walsh, J.E.; Chapman, W.L. Arctic contribution to upper-ocean variability in the North Atlantic. J. Clim. 1990, 3, 1462–1473. [Google Scholar] [CrossRef] [Scilit]
- Curry, B.; Lee, C.M.; Petrie, B.; Moritz, R.E.; Kwok, R. Multiyear volume, liquid freshwater, and sea ice transports through Davis Strait, 2004–2010. J. Phys. Oceanogr. 2014, 44, 1244–1266. [Google Scholar] [CrossRef] [Scilit]
- Curry, R.; Dickson, B.; Yashayaev, I. A change in the freshwater balance of the Atlantic Ocean over the past four decades. Nature 2003, 426, 826–829. [Google Scholar] [CrossRef] [Scilit] [PubMed]
- Curry, R.; Mauritzen, C. Dilution of the northern North Atlantic Ocean in recent decades. Science 2005, 308, 1772–1774. [Google Scholar] [CrossRef] [Scilit] [PubMed]
- Peterson, B.J.; McClelland, J.; Curry, R.; Holmes, R.M.; Walsh, J.E.; Aagaard, K. Trajectory shifts in the Arctic and subarctic freshwater cycle. Science 2006, 313, 1061–1066. [Google Scholar] [CrossRef] [Scilit]
- Häkkinen, S. Variability of the simulated meridional heat transport in the North Atlantic for the period 1951–1993. J. Geophys. Res. Ocean. 1999, 104, 10991–11007. [Google Scholar] [CrossRef] [Scilit]
- Zhang, J.; Steele, M. Effect of vertical mixing on the Atlantic Water layer circulation in the Arctic Ocean. J. Geophys. Res. Ocean. 2007, 112, C04S04. [Google Scholar] [CrossRef] [Scilit]
- Marotzke, J. Abrupt climate change and thermohaline circulation: Mechanisms and predictability. Proc. Natl. Acad. Sci. USA 2000, 97, 1347–1350. [Google Scholar] [CrossRef] [Scilit]
- Rahmstorf, S. On the freshwater forcing and transport of the Atlantic thermohaline circulation. Clim. Dyn. 1996, 12, 799–811. [Google Scholar] [CrossRef] [Scilit]
- Vellinga, M.; Dickson, B.; Curry, R. The Changing view on how freshwater impacts the Atlantic meridional overturning circulation. In Arctic-Subarctic Ocean Fluxes: Defining the Role of the Northern Seas in Climate; Dickson, R.R., Meincke, J., Rhines, P., Eds.; Springer: New York, NY, USA, 2008; pp. 289–314. [Google Scholar]
- Wu, P.; Wood, R.; Stott, P. Does the recent freshening trend in the North Atlantic indicate a weakening thermohaline circulation? Geophys. Res. Lett. 2004, 31, L02301. [Google Scholar] [CrossRef] [Scilit]
- Greene, C.H.; Meyer-Gutbrod, E.; Monger, B.C.; McGarry, L.P.; Pershing, A.J.; Belkin, I.M.; Fratantoni, P.S.; Mountain, D.G.; Pickart, R.S.; Proshutinsky, A.; et al. Remote climate forcing of decadal-scale regime shifts in Northwest Atlantic shelf ecosystems. Limnol. Oceanogr. 2013, 58, 803–816. [Google Scholar] [CrossRef] [Scilit]
- Rabe, B.; Karcher, M.; Kauker, F.; Schauer, U.; Toole, J.M.; Krishfield, R.A.; Pisarev, S.; Kikuchi, T.; Su, J. Arctic Ocean basin liquid freshwater storage trend 1992–2012. Geophys. Res. Lett. 2014, 41, 961–968. [Google Scholar] [CrossRef] [Scilit]
- Wang, Q.; Wekerle, C.; Danilov, S.; Koldunov, N.; Sidorenko, D.; Sein, D.; Rabe, B.; Jung, T. Arctic sea ice decline significantly contributed to the unprecedented liquid freshwater accumulation in the Beaufort Gyre of the Arctic Ocean. Geophys. Res. Lett. 2018, 45, 4956–4964. [Google Scholar] [CrossRef] [Scilit]
- Peterson, B.J.; Holmes, R.M.; McClelland, J.W.; Vörösmarty, C.J.; Lammers, R.B.; Shiklomanov, A.I.; Shiklomanov, I.A.; Rahmstorf, S. Increasing river discharge to the Arctic Ocean. Science 2002, 298, 2171–2173. [Google Scholar] [CrossRef] [Scilit]
- Cole, S.T.; Stadler, J. Deepening of the winter mixed layer in the Canada basin, Arctic Ocean over 2006–2017. J. Geophys. Res. Ocean. 2019, 124, 4618–4630. [Google Scholar] [CrossRef] [Scilit]
- Dewey, S.; Morison, J.; Kwok, R.; Dickinson, S.; Morison, D.; Andersen, R. Arctic Ice-Ocean Coupling and Gyre Equilibration Observed with Remote Sensing. Geophys. Res. Lett. 2018, 45, 1499–1508. [Google Scholar] [CrossRef] [Scilit]
- Meneghello, G.; Marshall, J.; Campin, J.M.; Doddridge, E.; Timmermans, M.L. The ice-ocean governor: Ice-ocean stress feedback limits Beaufort Gyre spin-up. Geophys. Res. Lett. 2018, 45, 11–293. [Google Scholar] [CrossRef] [Scilit]
- Zhang, J.; Steele, M.; Runciman, K.; Dewey, S.; Morison, J.; Lee, C.; Rainville, L.; Cole, S.; Krishfield, R.; Timmermans, M.-L.; et al. The Beaufort Gyre intensification and stabilization: A model-observation synthesis. J. Geophys. Res. Ocean. 2016, 121, 7933–7952. [Google Scholar] [CrossRef] [Scilit]
- Chen, C.; Gao, G.; Zhang, Y.; Beardsley, R.C.; Lai, Z.; Qi, J.; Lin, H. Circulation in the Arctic Ocean: Results from a high-resolution coupled ice-sea nested Global-FVCOM and Arctic-FVCOM system. Prog. Oceanogr. 2016, 141, 60–80. [Google Scholar] [CrossRef] [Scilit]
- Holloway, G.; Dupont, F.; Golubeva, E.; Häkkinen, S.; Hunke, E.; Jin, M.; Karcher, M.; Kauker, F.; Maltrud, M.; Maqueda, M.A.M.; et al. Water properties and circulation in Arctic Ocean models. J. Geophys. Res. Ocean. 2007, 112, C04S03. [Google Scholar] [CrossRef] [Scilit]
- Proshutinsky, A.; Aksenov, Y.; Holland, D.; Kinney, J.C.; Gerdes, R.; Karcher, M.; Kauker, F.; Koeberle, C.; Hakkinen, S.; Hibler, W.; et al. Arctic Ocean change studies: Synthesizing model results and observations. Oceanography 2011, 24, 102–113. [Google Scholar] [CrossRef] [Scilit]
- Steele, M.; Ermold, W.; Häkkinen, S.; Holland, D.; Holloway, G.; Karcher, M.; Kauker, F.; Maslowski, W.; Steiner, N.; Zhang, J. Adrift in the Beaufort Gyre: A model intercomparison. Geophys. Res. Lett. 2001, 28, 2935–2938. [Google Scholar] [CrossRef] [Scilit]
- Proshutinsky, A.; Yang, J.; Krishfield, R.; Gerdes, R.; Karcher, M.; Kauker, F.; Koeberle, C.; Hakkinen, S.; Hibler, W.; Holland, D.; et al. Arctic Ocean study: Synthesis of model results and observations. EOS Trans. Am. Geophys. Union 2005, 86, 368–371. [Google Scholar] [CrossRef] [Scilit]
- Holloway, G.; Wang, Z. Representing eddy stress in an Arctic Ocean model. J. Geophys. Res. Ocean. 2009, 114, C06020. [Google Scholar] [CrossRef] [Scilit]
- Newton, R.; Schlosser, P.; Martinson, D.G.; Maslowski, W. Freshwater distribution in the Arctic Ocean: Simulation with a high-resolution model and model-data comparison. J. Geophys. Res. Ocean. 2008, 113, C05024. [Google Scholar] [CrossRef] [Scilit]
- Spall, M.A. Dynamics and thermodynamics of the mean transpolar drift and ice thickness in the Arctic Ocean. J. Clim. 2019, 32, 8449–8463. [Google Scholar] [CrossRef] [Scilit]
- Spall, M. Potential vorticity dynamics of the Arctic halocline. J. Phys. Oceanogr. 2020, 50, 2491–2506. [Google Scholar] [CrossRef] [Scilit]
- Yang, J. Seasonal and interannual variability of downwelling in the Beaufort Sea. J. Geophys. Res. Ocean. 2009, 114, C00A14. [Google Scholar] [CrossRef] [Scilit]
- Holloway, G. Observing global ocean topostrophy. J. Geophys. Res. Ocean. 2008, 113, C07054. [Google Scholar] [CrossRef] [Scilit]
- Chen, C.; Gao, G.; Qi, J.; Proshutinsky, A.; Beardsley, R.C.; Kowalik, Z.; Lin, H.; Cowles, G. A new high-resolution unstructured grid finite volume Arctic Ocean model (AO-FVCOM): An application for tidal studies. J. Geophys. Res. Ocean. 2009, 114, C08017. [Google Scholar] [CrossRef] [Scilit]
- Münchow, A.; Falkner, K.K.; Melling, H. Spatial continuity of measured seawater and tracer fluxes through Nares Strait, a dynamically wide channel bordering the Canadian Archipelago. J. Mar. Res. 2007, 65, 759–788. [Google Scholar] [CrossRef] [Scilit]
- Zhang, Y.; Chen, C.; Beardsley, R.C.; Gao, G.; Lai, Z.; Curry, B.; Lee, C.M.; Lin, H.; Qi, J.; Xu, Q. Studies of the Canadian Arctic Archipelago water transport and its relationship to basin-local forcings: Results from AO-FVCOM. J. Geophys. Res. Ocean. 2016, 121, 4392–4415. [Google Scholar] [CrossRef] [Scilit]
- Zhang, Y.; Chen, C.; Beardsley, R.C.; Gao, G.; Qi, J.; Lin, H. Seasonal and interannual variability of the Arctic sea ice: A comparison between AO-FVCOM and observations. J. Geophys. Res. Ocean. 2016, 121, 8320–8350. [Google Scholar] [CrossRef] [Scilit]
- Gao, G.; Chen, C.; Qi, J.; Beardsley, R.C. An unstructured-grid, finite-volume sea ice model: Development, validation, and application. J. Geophys. Res. Ocean. 2011, 116, C00D04. [Google Scholar] [CrossRef] [Scilit]
- Deng, Y.; Gao, G.; Zhang, Y.; Chen, C. Seasonal and interannual variability of Bering Strait throughflow from AO-FVCOM and observation. J. Ocean Univ. China 2019, 18, 615–625. [Google Scholar] [CrossRef] [Scilit]
- Zhang, Y.; Chen, C.; Beardsley, R.C.; Perrie, W.; Gao, G.; Zhang, Y.; Qi, J.; Lin, H. Applications of an unstructured grid surface wave model (FVCOM-SWAVE) to the Arctic Ocean: The interaction between ocean waves and sea ice. Ocean Model. 2020, 145, 101532. [Google Scholar] [CrossRef] [Scilit]
- Shen, X.; Zhang, Y.; Chen, C.; Hu, S.; Xu, D.; Shao, W.-Z.; Chang, L.; Feng, G. Arctic sea ice variation in the Northwest Passage in 1979–2017 and its response to surface thermodynamics factors. Adv. Clim. Change Res. 2021, 12, 563–580. [Google Scholar] [CrossRef] [Scilit]
- Zhang, Y.; Chen, C.; Shen, X.; Xu, D.; Shao, W.; Beardsley, R.C.; Chang, L.; Feng, G. Role of sea level pressure in variations of the Canadian Arctic Archipelago throughflow. Adv. Clim. Change Res. 2021, 12, 539–552. [Google Scholar] [CrossRef] [Scilit]
- Zhang, Y.; Zhang, Y.; Xu, D.; Chen, C.; Shen, X.; Hu, S.; Chang, L.; Zhou, X.; Feng, G. Impacts of atmospheric and oceanic factors on monthly and interannual variations of polynya in the east Siberian Sea and Chukchi Sea. Adv. Clim. Change Res. 2021, 12, 527–538. [Google Scholar] [CrossRef] [Scilit]
- Zhang, Y.; Ye, Z.; Chen, F.; Chen, C.; Gao, G.; Beardsley, R.C.; Wang, D.; Qi, J.; Xu, D.; Zhou, Y. Challenges in improving Arctic freshwater simulations: An evaluation of CMIP6 models in the Beaufort gyre region. Ocean Model. 2025, 197, 102565. [Google Scholar] [CrossRef] [Scilit]
- Ye, Z.; Zhang, Y.; Guo, W.; Chen, C.; Guo, H.; Shao, W.; Wang, D.; Xu, D.; Zhou, Y. Evaluation and projection of Arctic sea ice transport through Fram Strait with emphasis on atmospheric multimodal responses. J. Mar. Syst. 2025, 252, 104139. [Google Scholar] [CrossRef] [Scilit]
- Zhang, Y.; Liang, Y.; Chen, C.; Beardsley, R.C.; Zha, Y.; Wang, D.; Zhou, Y.; Xu, Q.; Qi, J.; Zuo, J.; et al. Toward an Arctic Ocean forecast system based on Finite Volume Community Ocean model. Ocean Model. 2026, 201, 102714. [Google Scholar] [CrossRef] [Scilit]
- Hunke, E.C.; Lipscomb, W.H.; Turner, A.K.; Jeffery, N.; Elliott, S. CICE: The Los Alamos Sea Ice Model Documentation and Software User’s Manual, version 4.1, LA-CC-06-012. T-3 Fluid Dyn. Group Los Alamos Natl. Lab. 2010, 675, 500. [Google Scholar]
- Zhong, W.; Steele, M.; Zhang, J.; Zhao, J. Greater role of geostrophic currents in Ekman dynamics in the western Arctic Ocean as a mechanism for Beaufort Gyre stabilization. J. Geophys. Res. Ocean. 2018, 123, 149–165. [Google Scholar] [CrossRef] [Scilit]
- McGeehan, T.; Maslowski, W. Evaluation and control mechanisms of volume and freshwater export through the Canadian Arctic Archipelago in a high-resolution pan-Arctic ice-ocean model. J. Geophys. Res. Ocean. 2012, 117, C00D14. [Google Scholar] [CrossRef] [Scilit]
- Comiso, J.C. Large decadal decline of the Arctic multiyear ice cover. J. Clim. 2012, 25, 1176–1193. [Google Scholar] [CrossRef] [Scilit]
- Regan, H.C.; Lique, C.; Armitage, T.W. The Beaufort Gyre extent, shape, and location between 2003 and 2014 from satellite observations. J. Geophys. Res. Ocean. 2019, 124, 844–862. [Google Scholar] [CrossRef] [Scilit]
- Osadchiev, A.A.; Frey, D.I.; Shchuka, S.A.; Tilinina, N.D.; Morozov, E.G.; Zavialov, P.O. Structure of the freshened surface layer in the Kara Sea during ice-free periods. J. Geophys. Res. Ocean. 2021, 126, e2020JC016486. [Google Scholar] [CrossRef] [Scilit]
- Zheng, L.; Overeem, I.; Wang, K.; Clow, G.D. Changing Arctic river dynamics cause localized permafrost thaw. J. Geophys. Res. Earth Surf. 2019, 124, 2324–2344. [Google Scholar] [CrossRef] [Scilit]
- Kelly, S.J.; Proshutinsky, A.; Popova, E.K.; Aksenov, Y.K.; Yool, A. On the origin of water masses in the Beaufort Gyre. J. Geophys. Res. Ocean. 2019, 124, 4696–4709. [Google Scholar] [CrossRef] [Scilit]
- Bebieva, Y.; Timmermans, M.L. An examination of double-diffusive processes in a mesoscale eddy in the Arctic Ocean. J. Geophys. Res. Ocean. 2016, 121, 457–475. [Google Scholar] [CrossRef] [Scilit]
- Chapman, D.C.; Gawarkiewicz, G. Offshore transport of dense shelf water in the presence of a submarine canyon. J. Geophys. Res. Ocean. 1995, 100, 13373–13387. [Google Scholar] [CrossRef] [Scilit]
- Gao, G. An Unstructured-Grid Finite-Volume Arctic ICE-Ocean Coupled Model (AO-FVCOM: Development, Validation and Applications, (Doctoral Dissertation); University of Massachusetts-Dartmouth: Dartmouth, MA, USA, 2011. [Google Scholar]
- Krishfield, R.A.; Plueddemann, A.J.; Honjo, S. Eddys in the Arctic Ocean from IOEB ADCP Data; Tech. Rep. WHOI-2002-09; Woods Hole Oceanographic Institution: Woods Hole, MA, USA, 2002; p. 144. [Google Scholar]
- Plueddemann, A.J.; Krishfield, R.; Takizawa, T.; Hatakeyama, K.; Honjo, S. Upper ocean velocities in the Beaufort Gyre. Geophys. Res. Lett. 1998, 25, 183–186. [Google Scholar] [CrossRef] [Scilit]
- Spall, M.A.; Pickart, R.S.; Fratantoni, P.S.; Plueddemann, A.J. Western Arctic shelfbreak eddies: Formation and transport. J. Phys. Oceanogr. 2008, 38, 1644–1668. [Google Scholar] [CrossRef] [Scilit]
- Zhao, M.; Timmermans, M.L. Vertical scales and dynamics of eddies in the Arctic Ocean’s Canada Basin. J. Geophys. Res. Ocean. 2015, 120, 8195–8209. [Google Scholar] [CrossRef] [Scilit]
- Zhao, M.; Timmermans, M.L.; Cole, S.; Krishfield, R.; Proshutinsky, A.; Toole, J. Characterizing the eddy field in the Arctic Ocean halocline. J. Geophys. Res. Ocean. 2014, 119, 8800–8817. [Google Scholar] [CrossRef] [Scilit]
- Pickart, R.S.; Moore, G.W.K.; Torres, D.J.; Fratantoni, P.S.; Goldsmith, R.A.; Yang, J. Upwelling on the continental slope of the Alaskan Beaufort Sea: Storms, ice, and oceanographic response. J. Geophys. Res. Ocean. 2009, 114, C00A13. [Google Scholar] [CrossRef] [Scilit]
- Pickart, R.S.; Spall, M.A.; Moore, G.W.; Weingartner, T.J.; Woodgate, R.A.; Aagaard, K.; Shimada, K. Upwelling in the Alaskan Beaufort Sea: Atmospheric forcing and local versus non-local response. Prog. Oceanogr. 2011, 88, 78–100. [Google Scholar] [CrossRef] [Scilit]
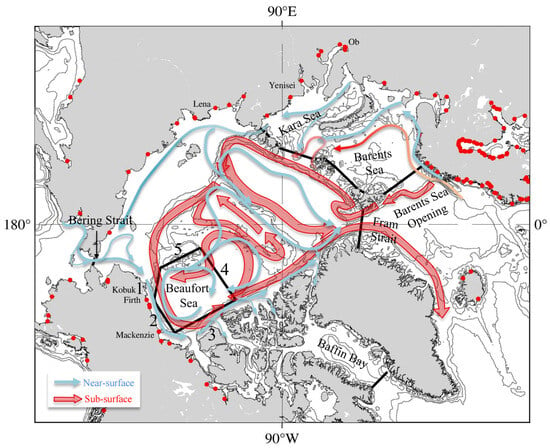
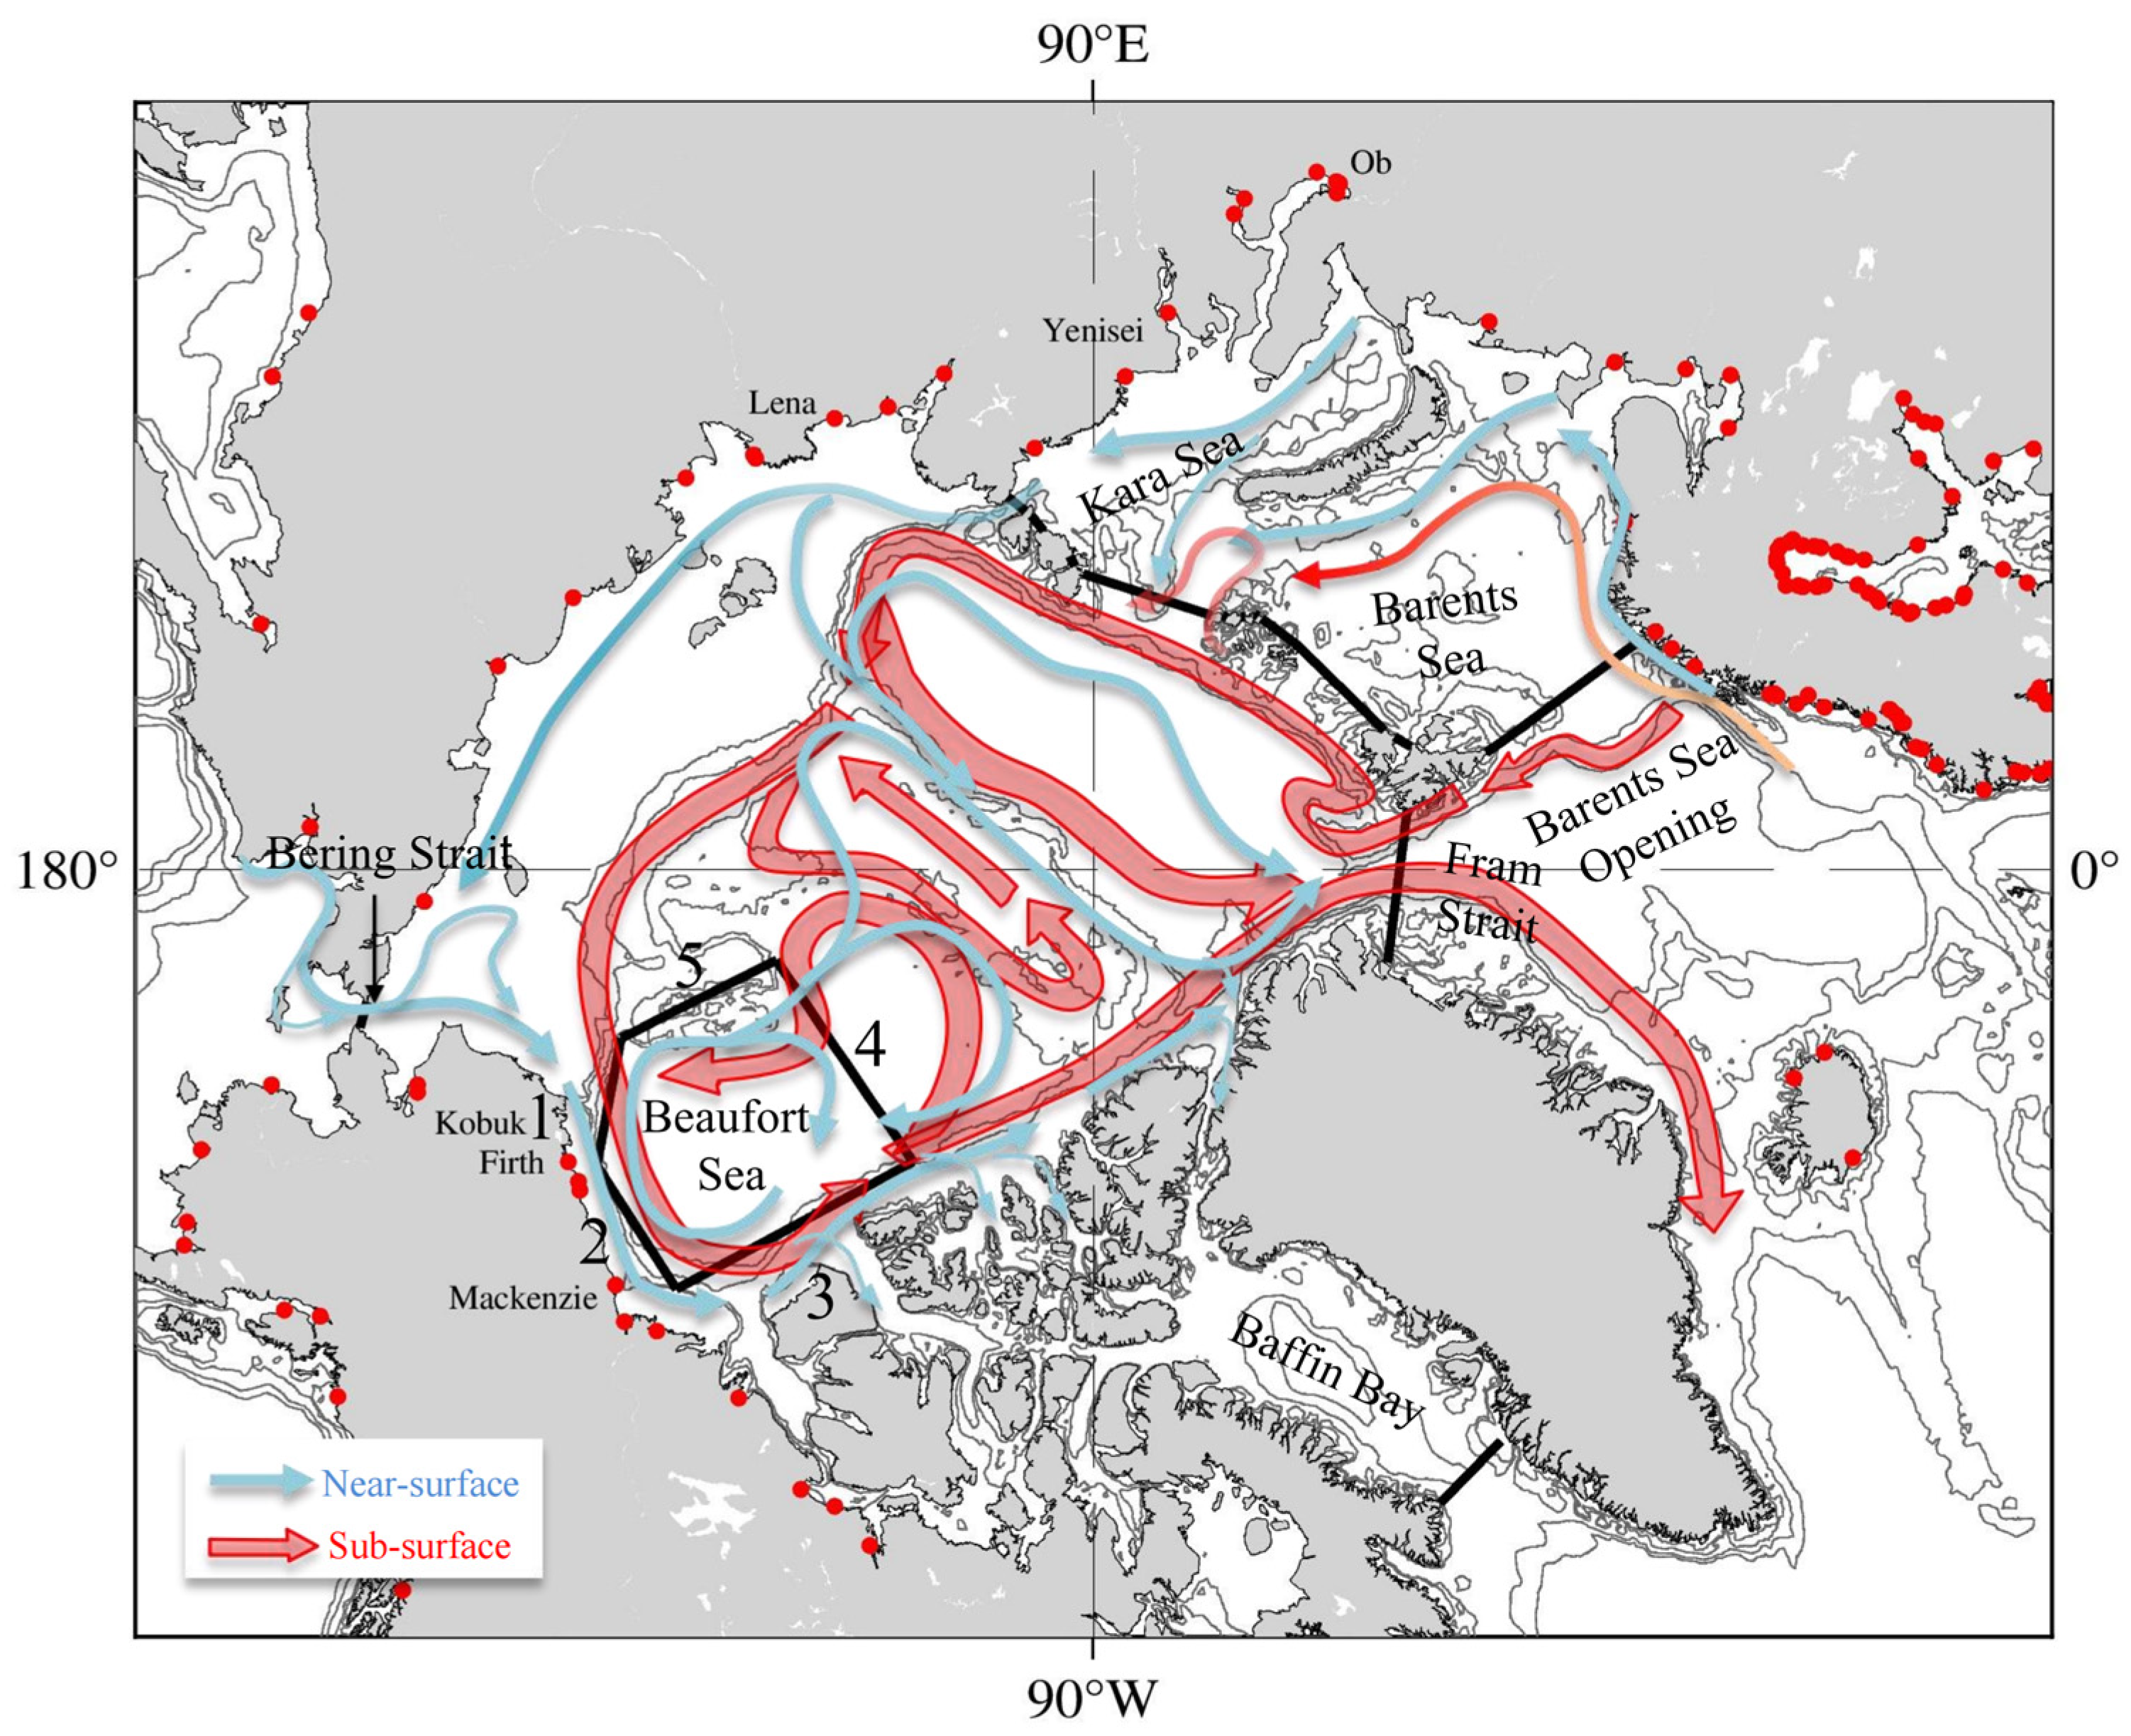
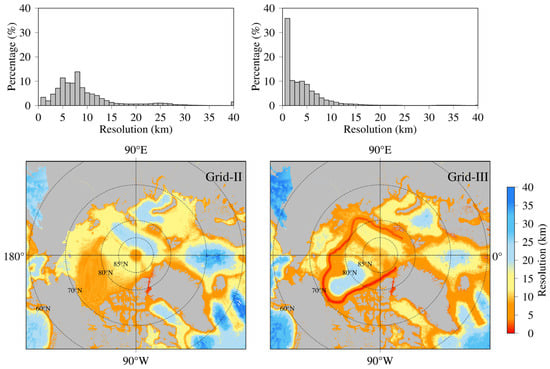
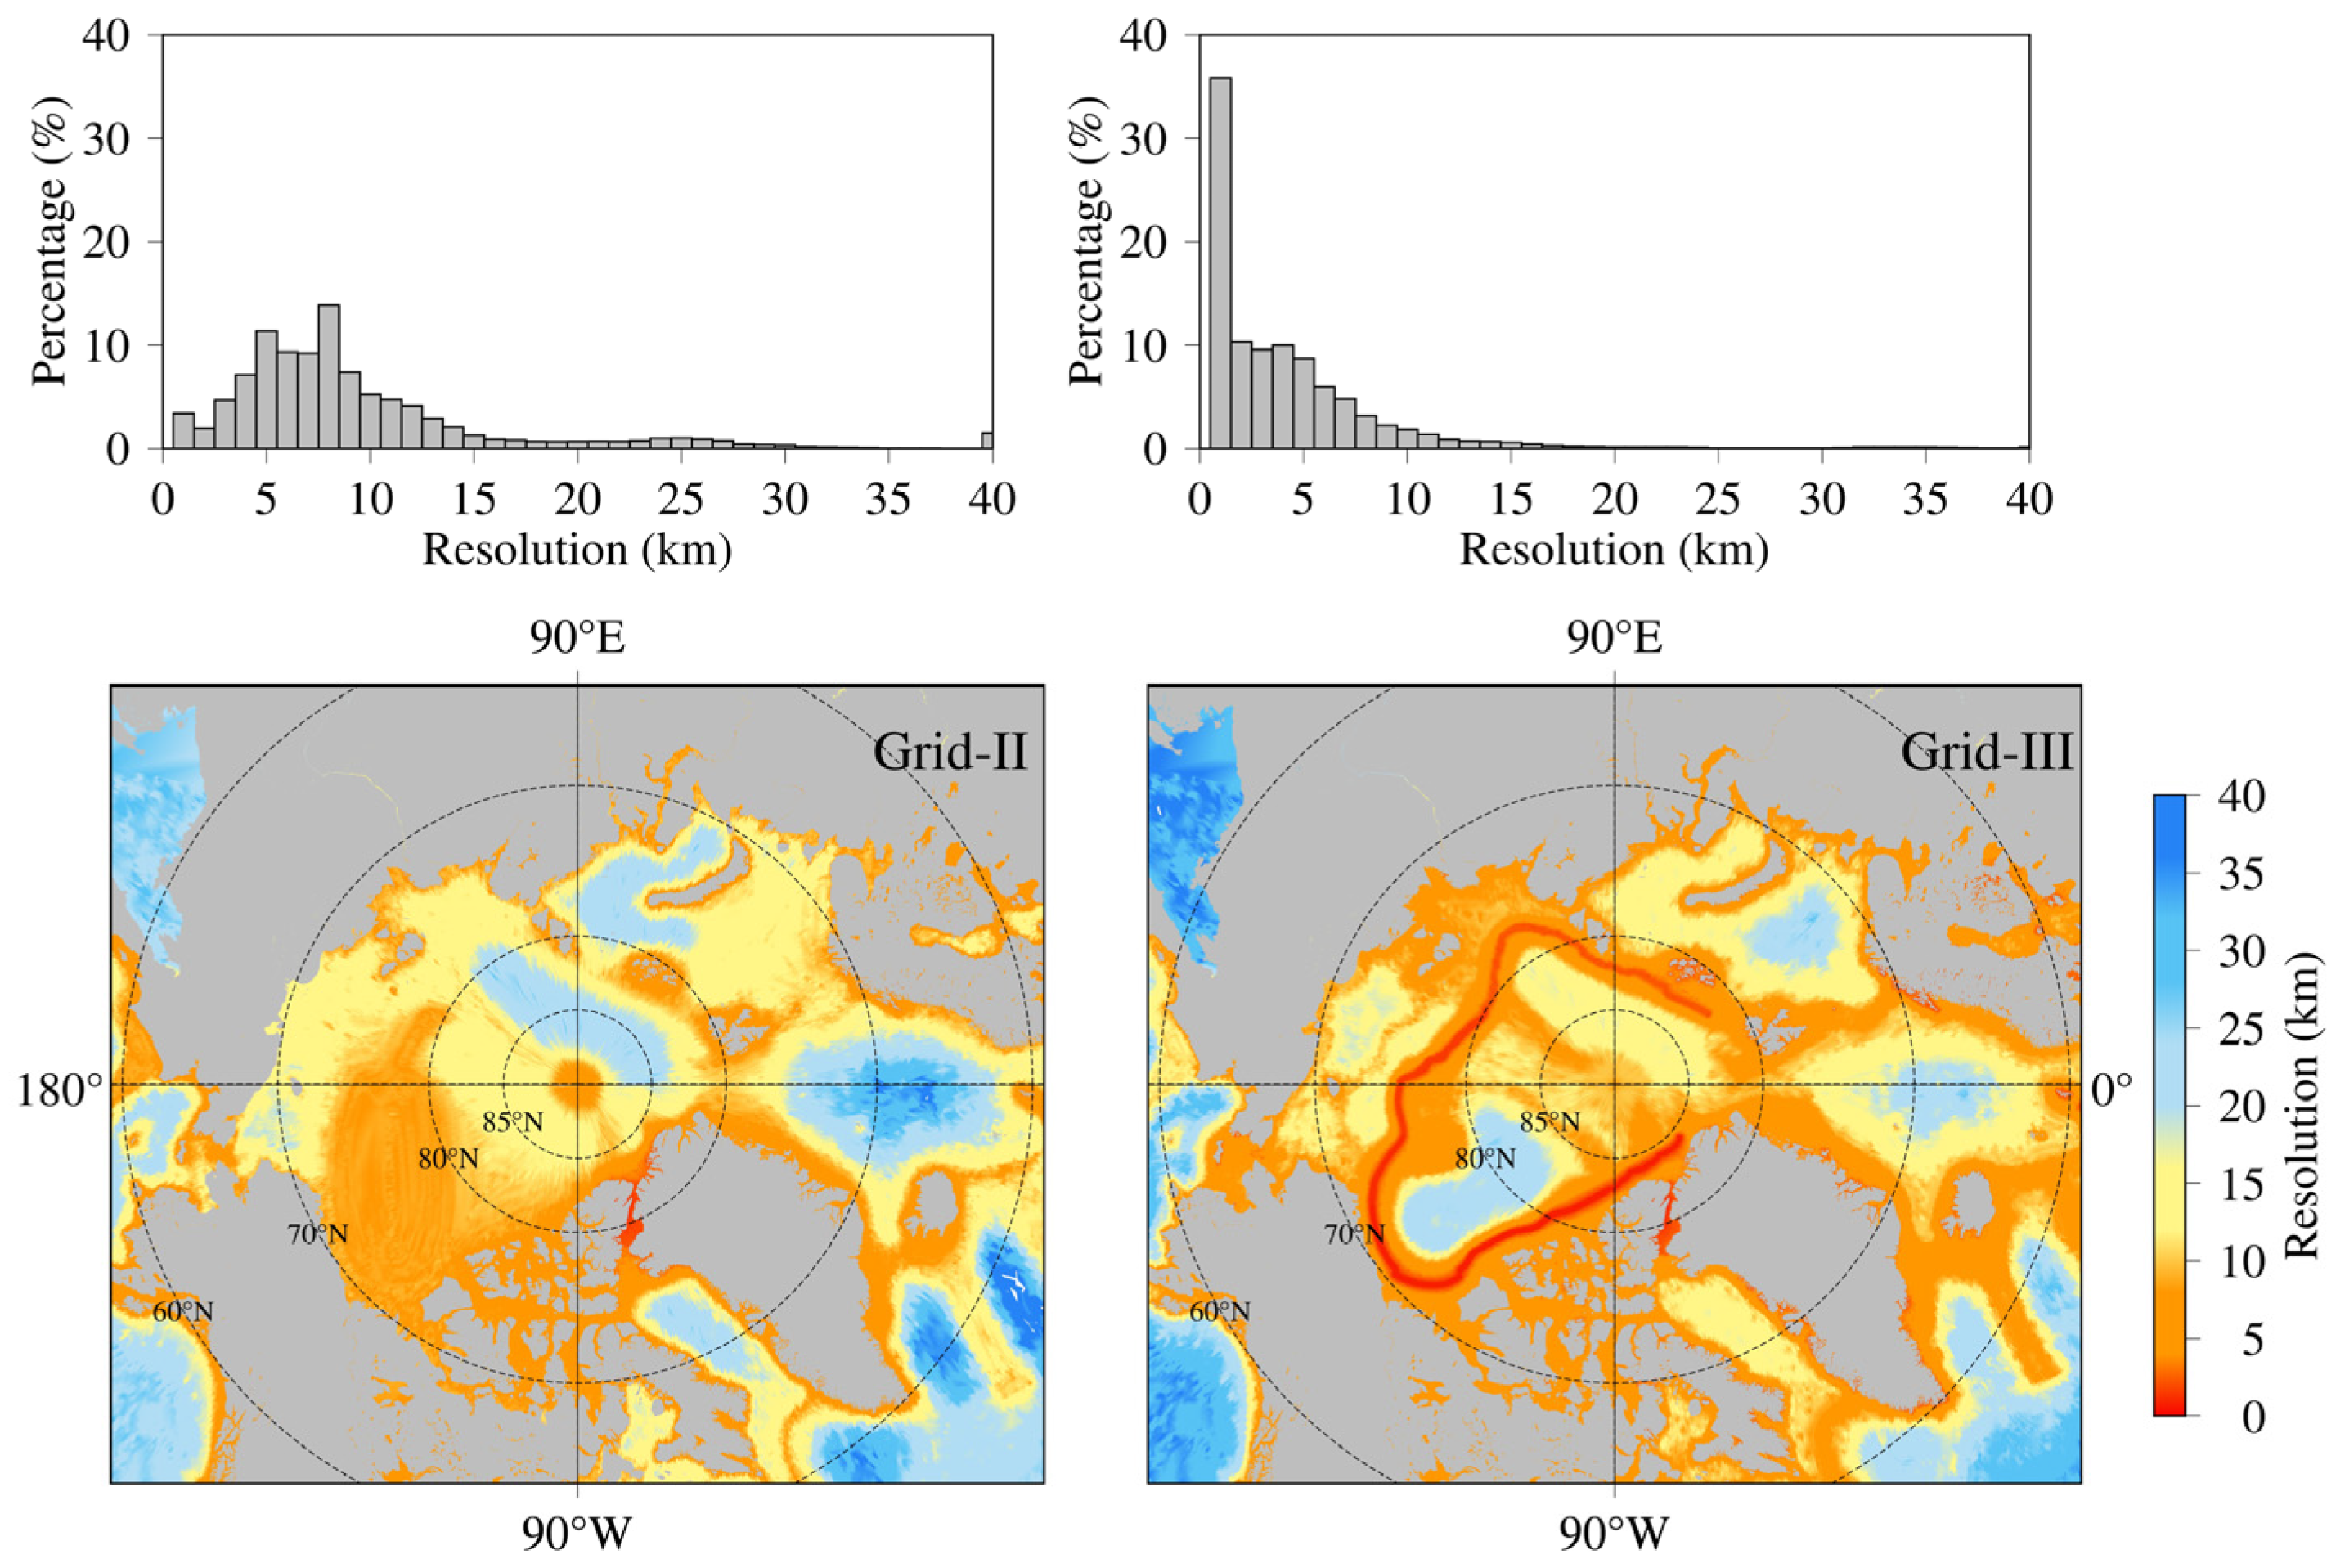
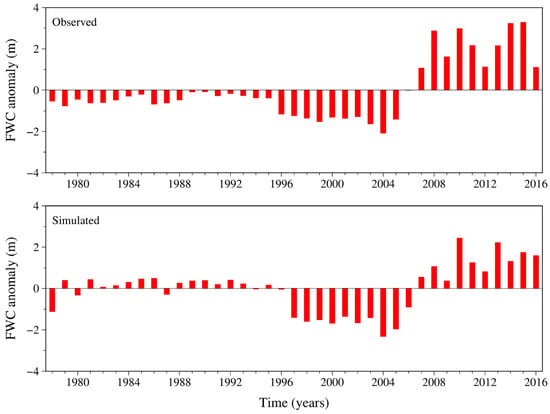
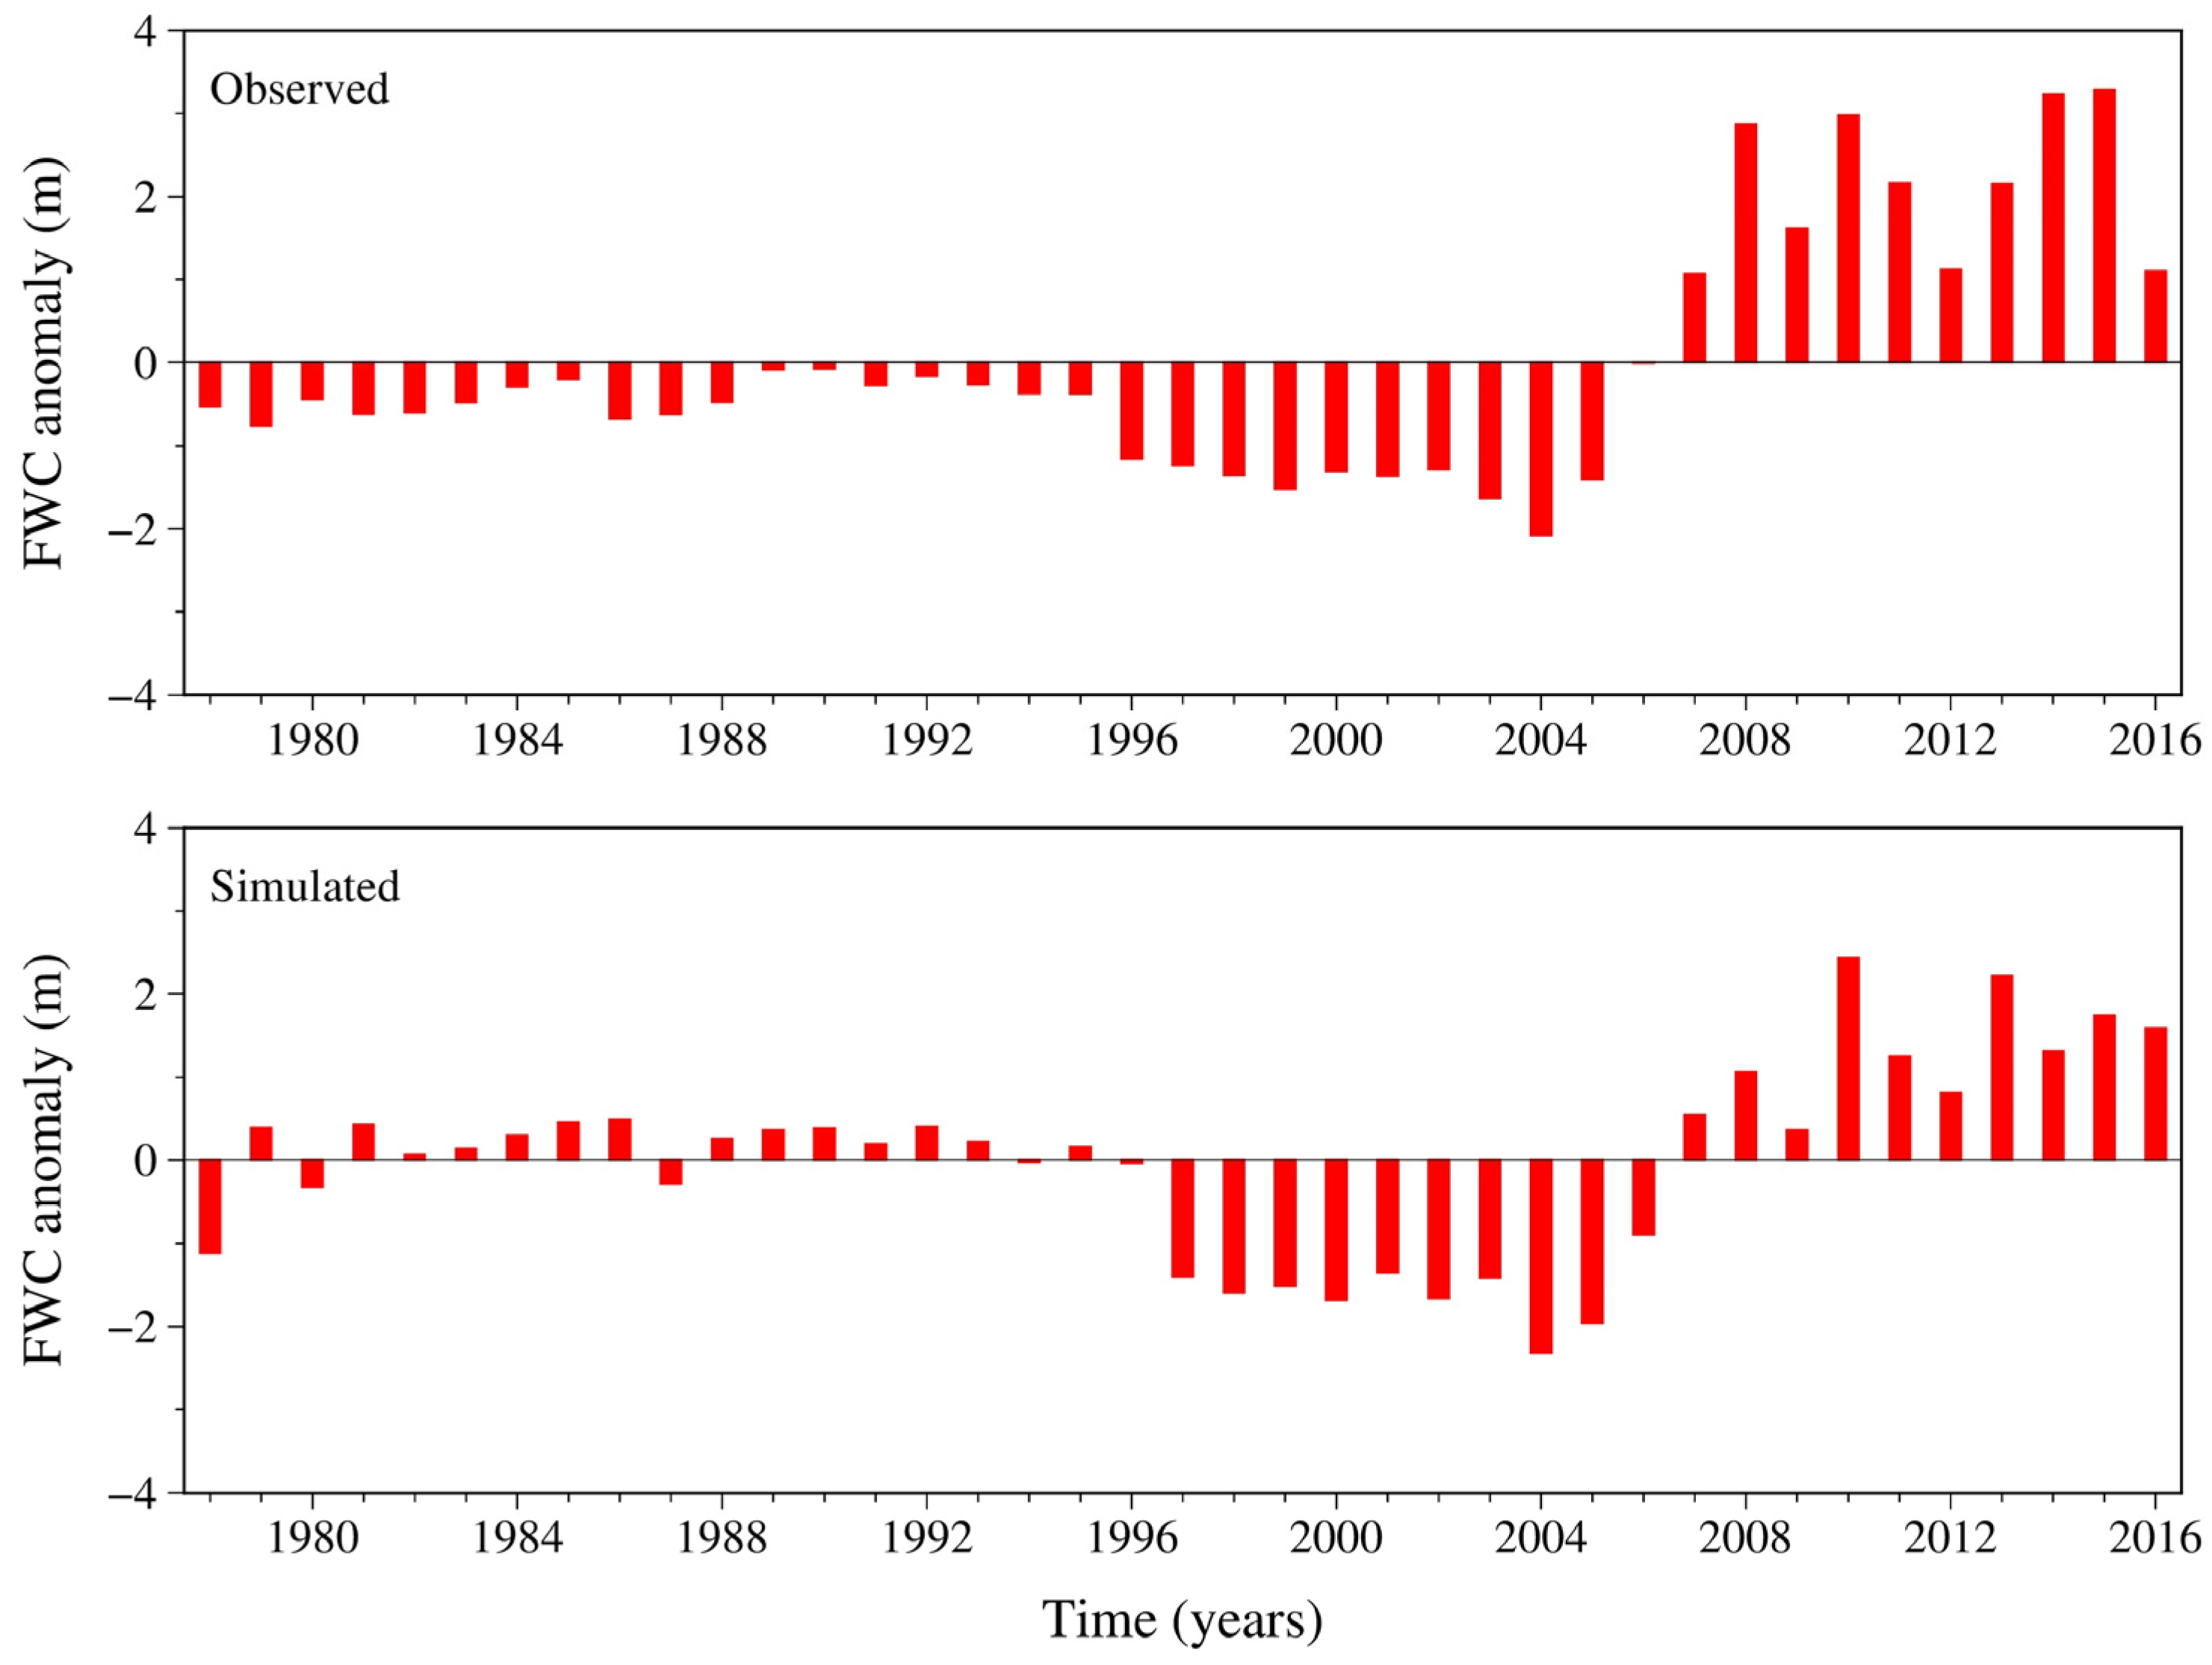
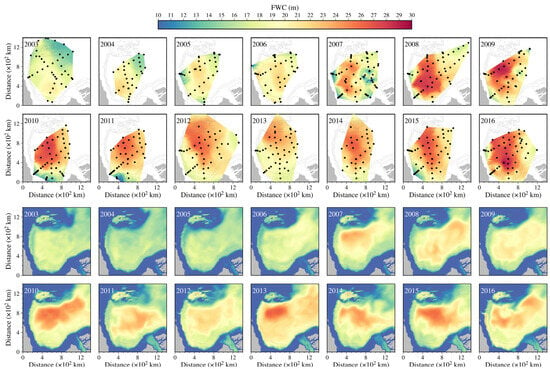
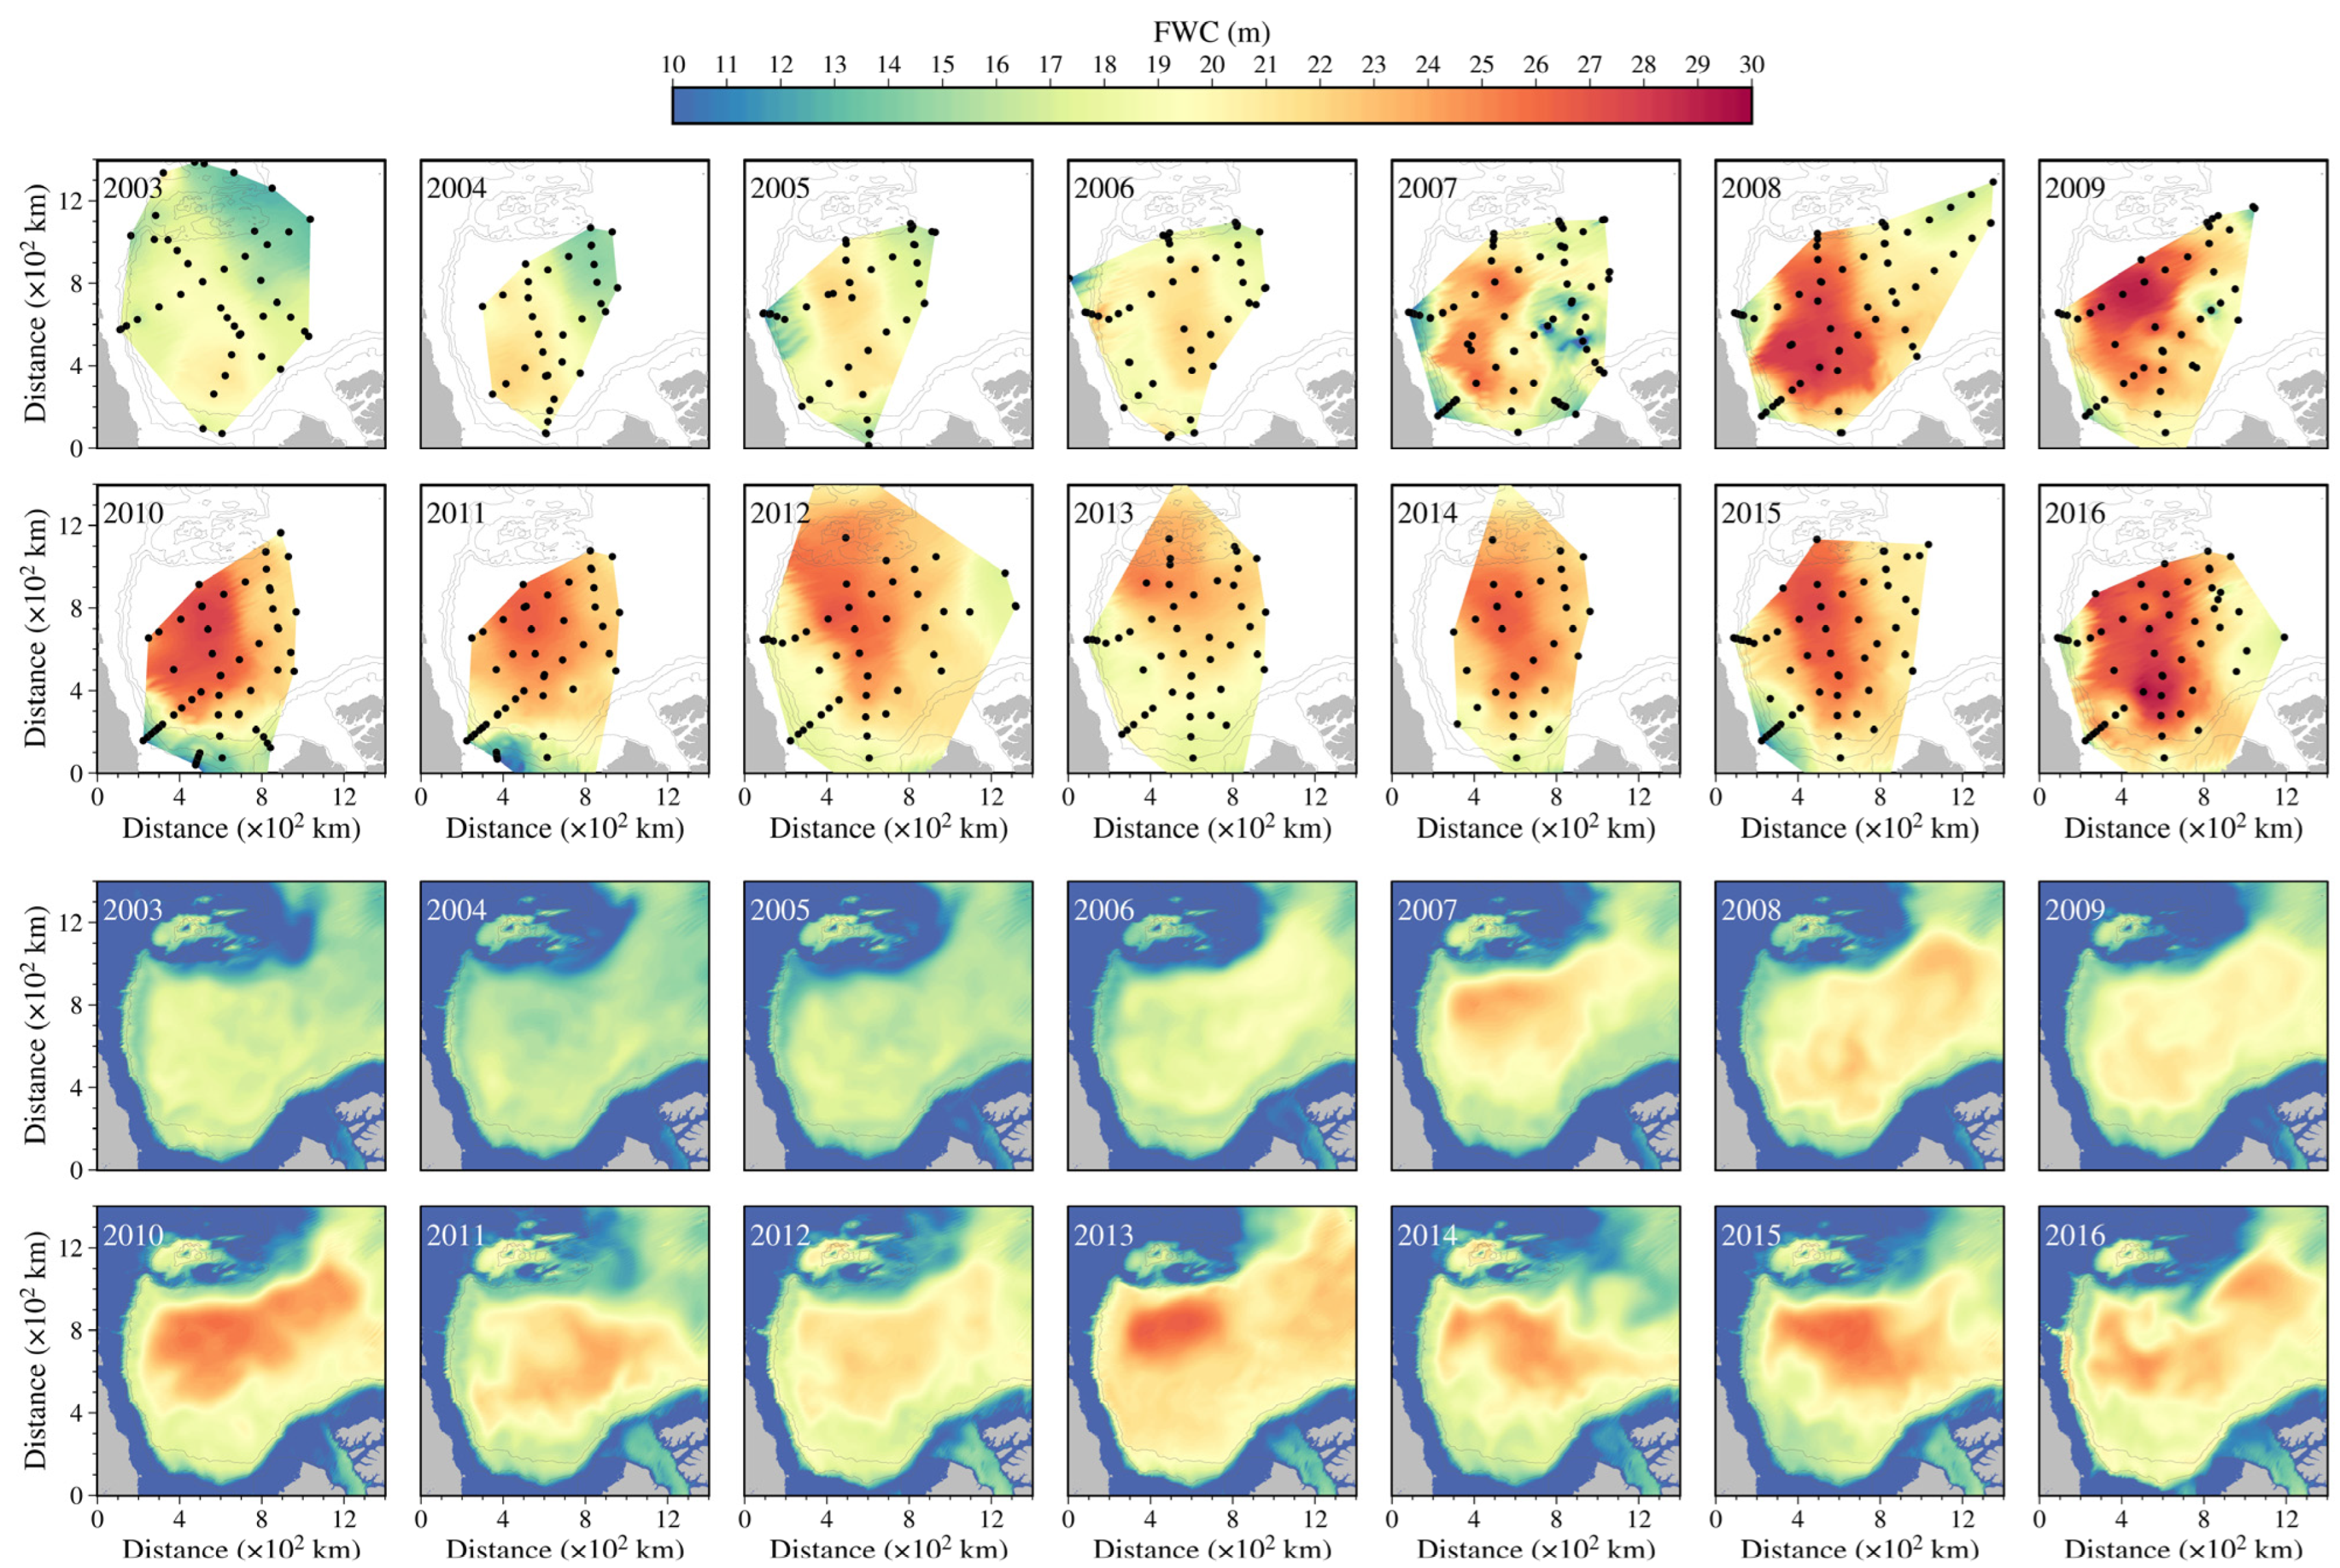
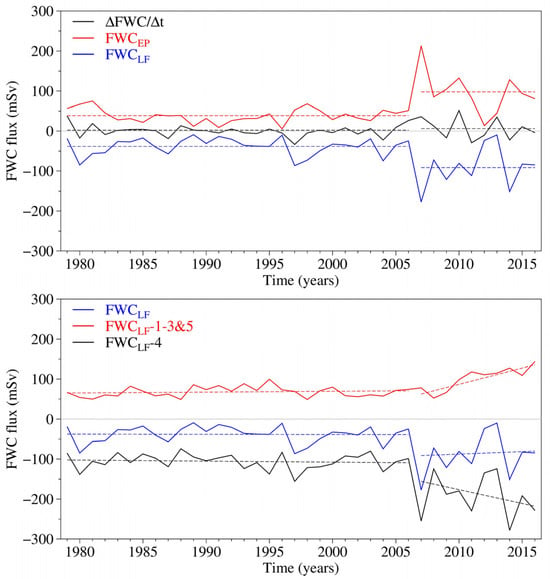
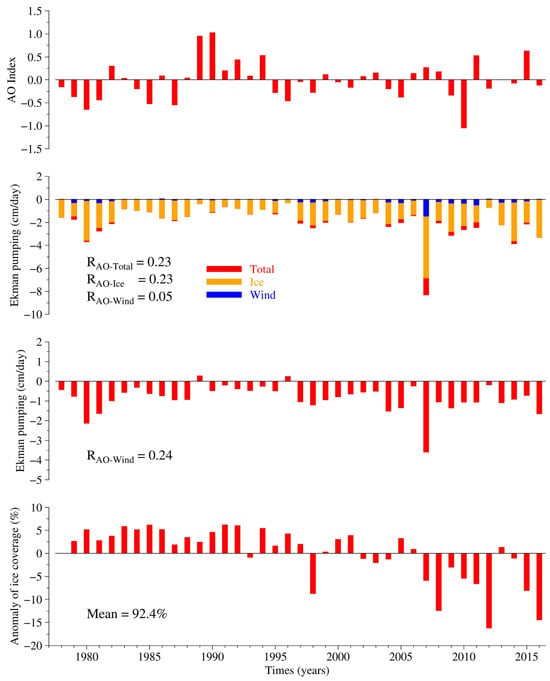
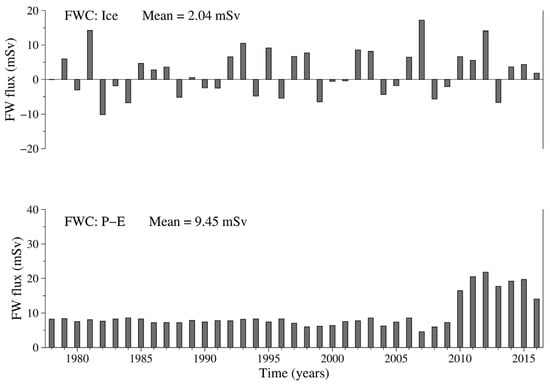
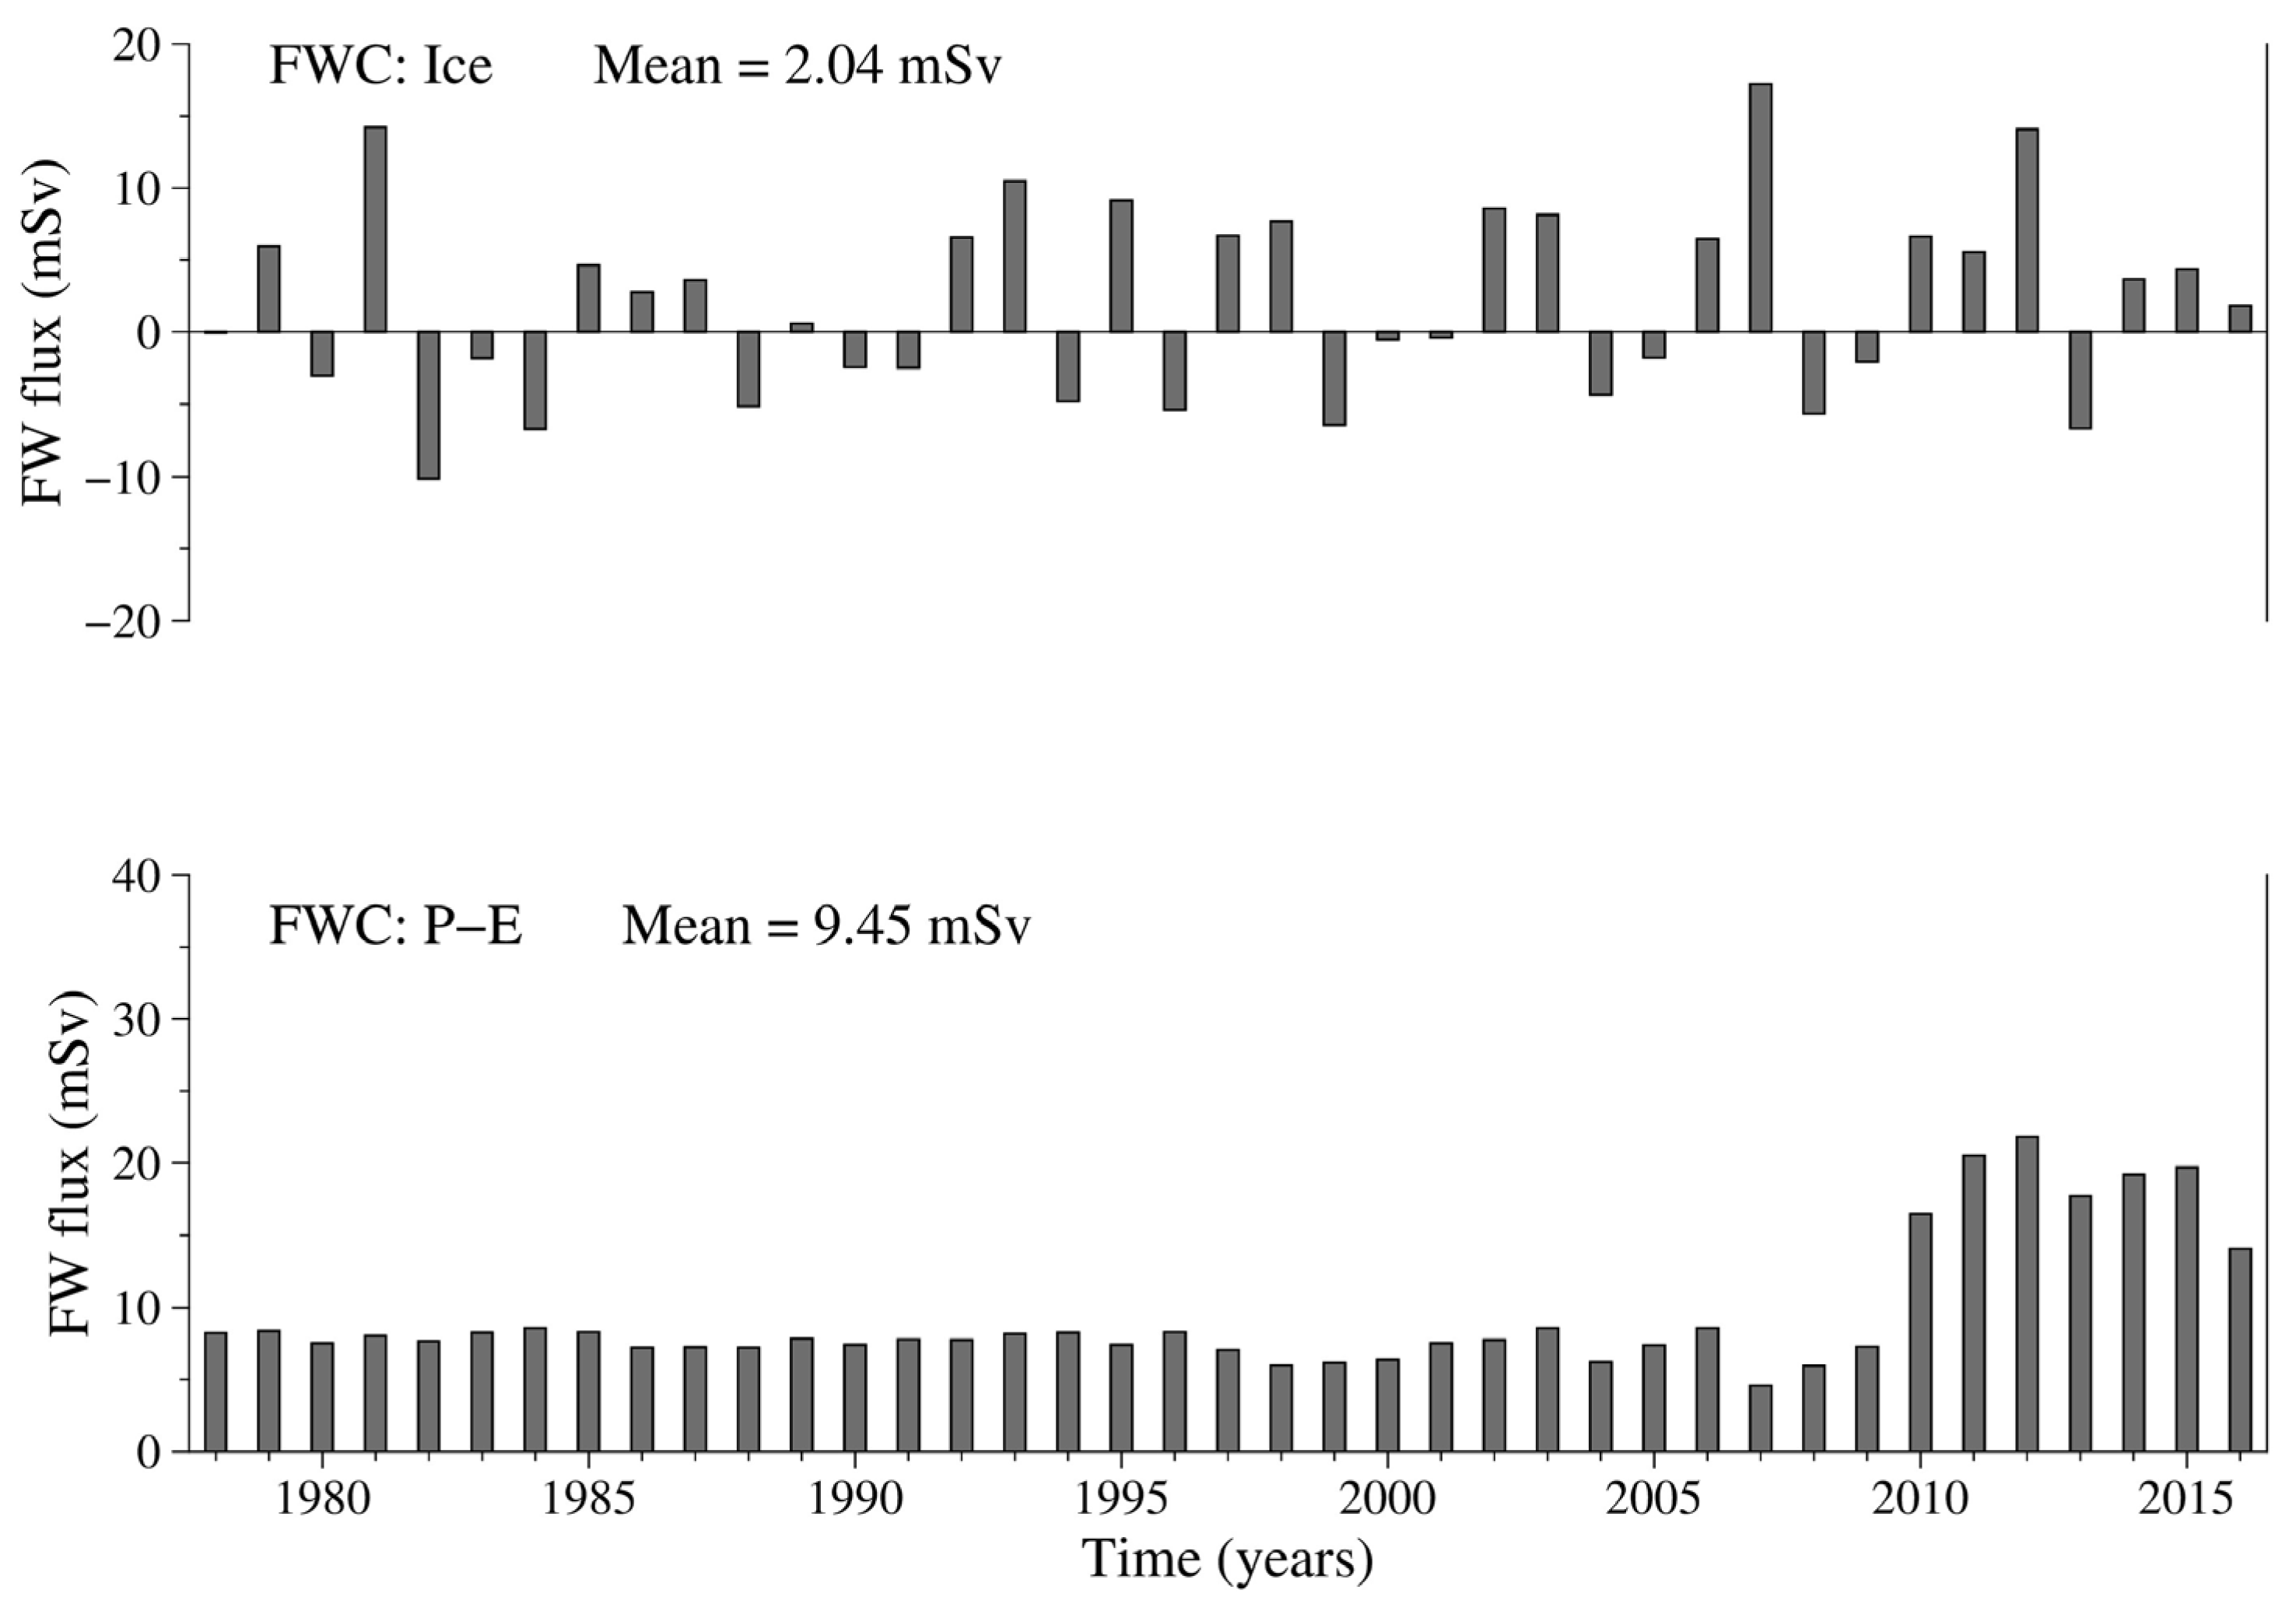
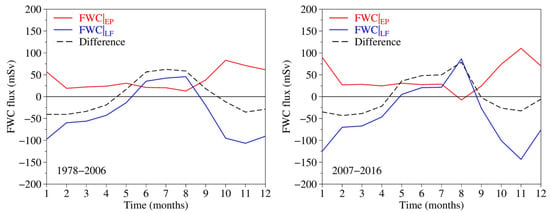
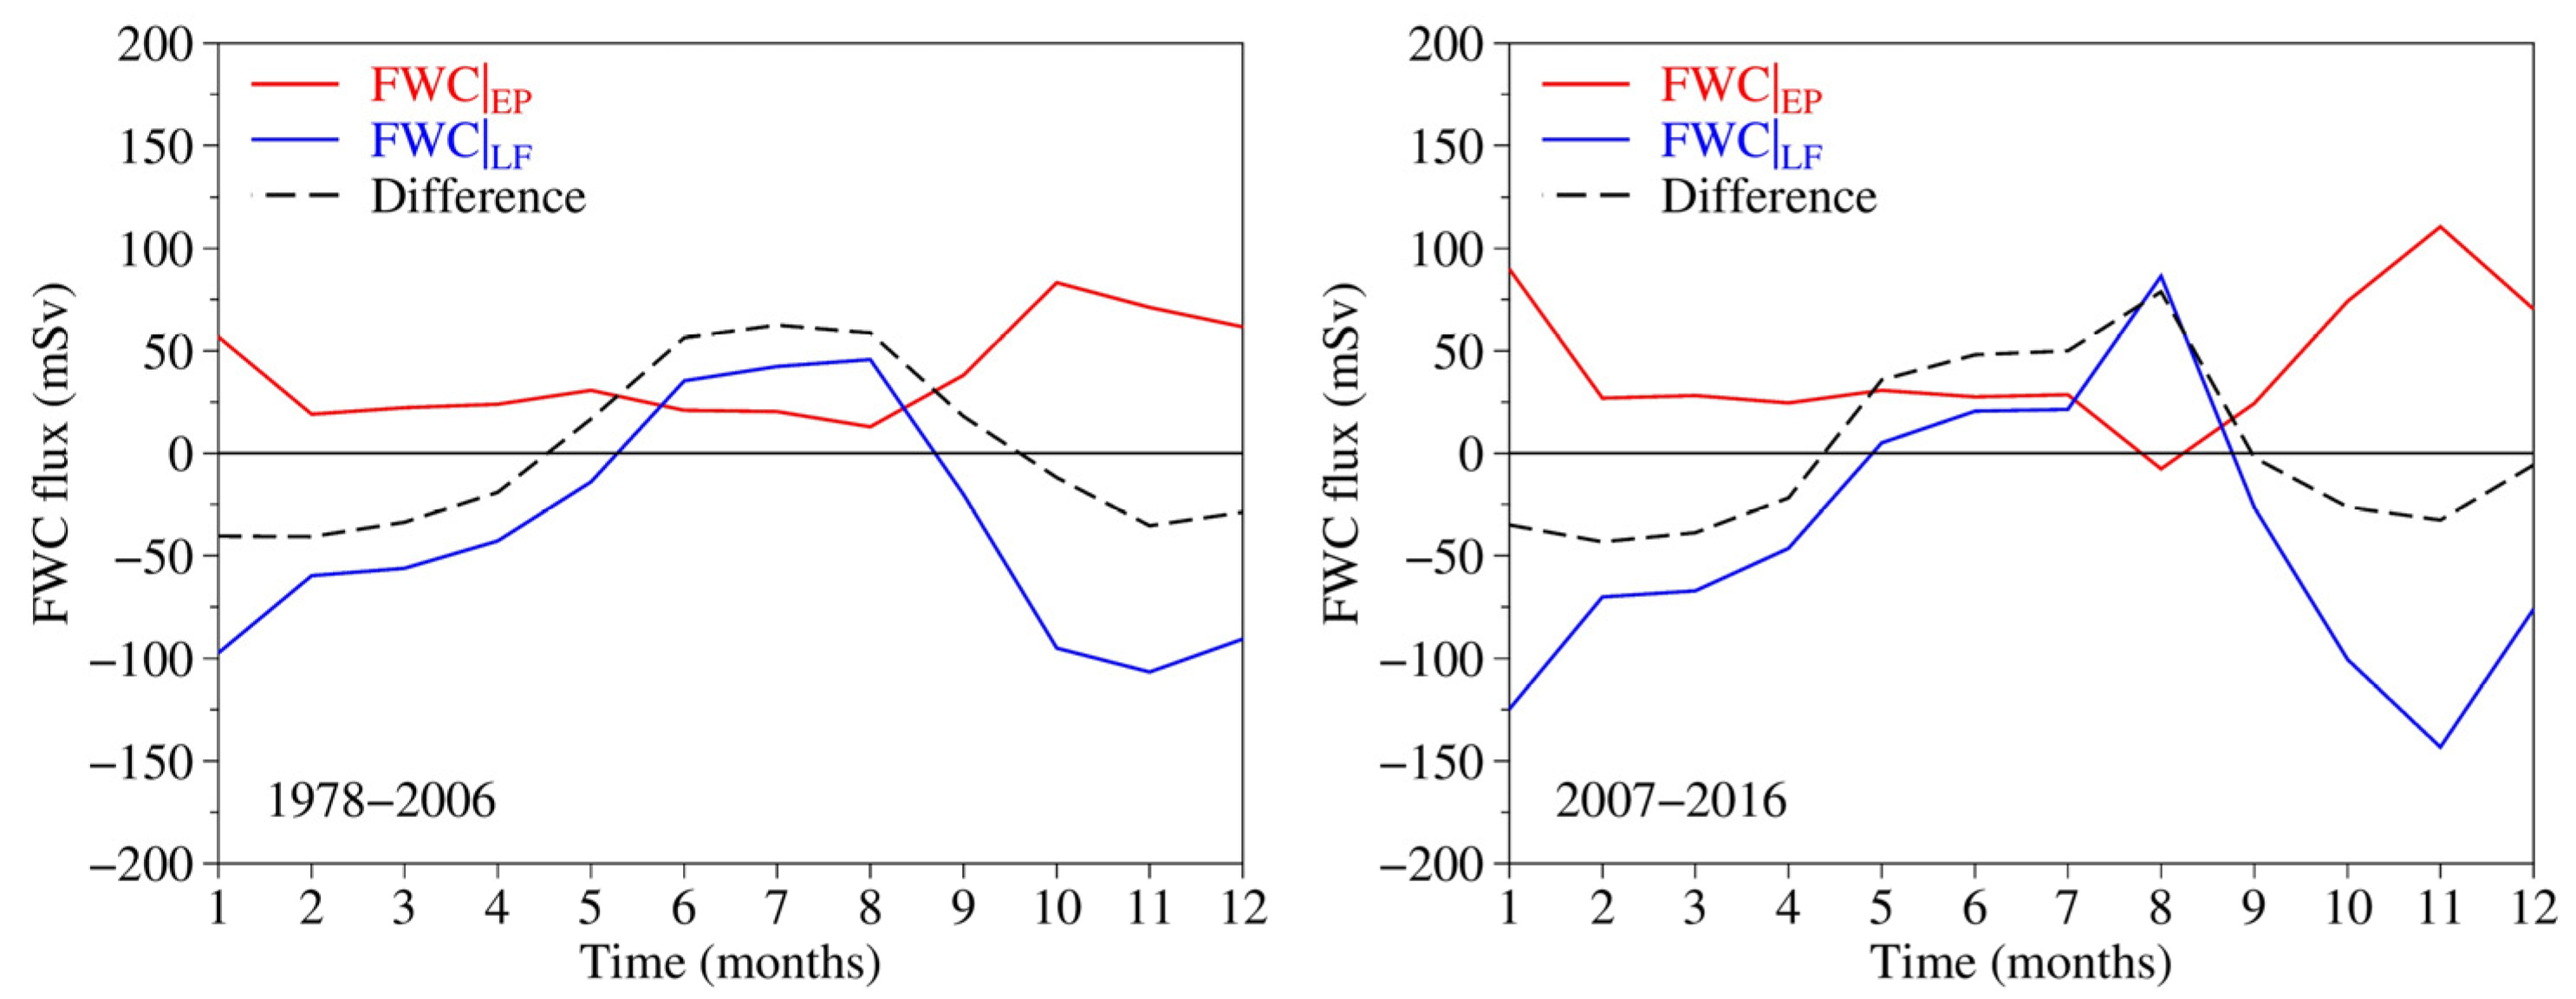
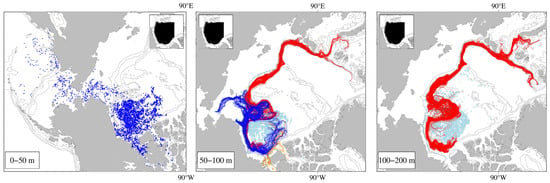
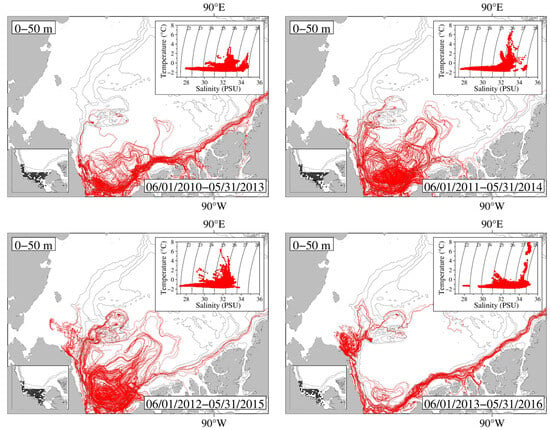
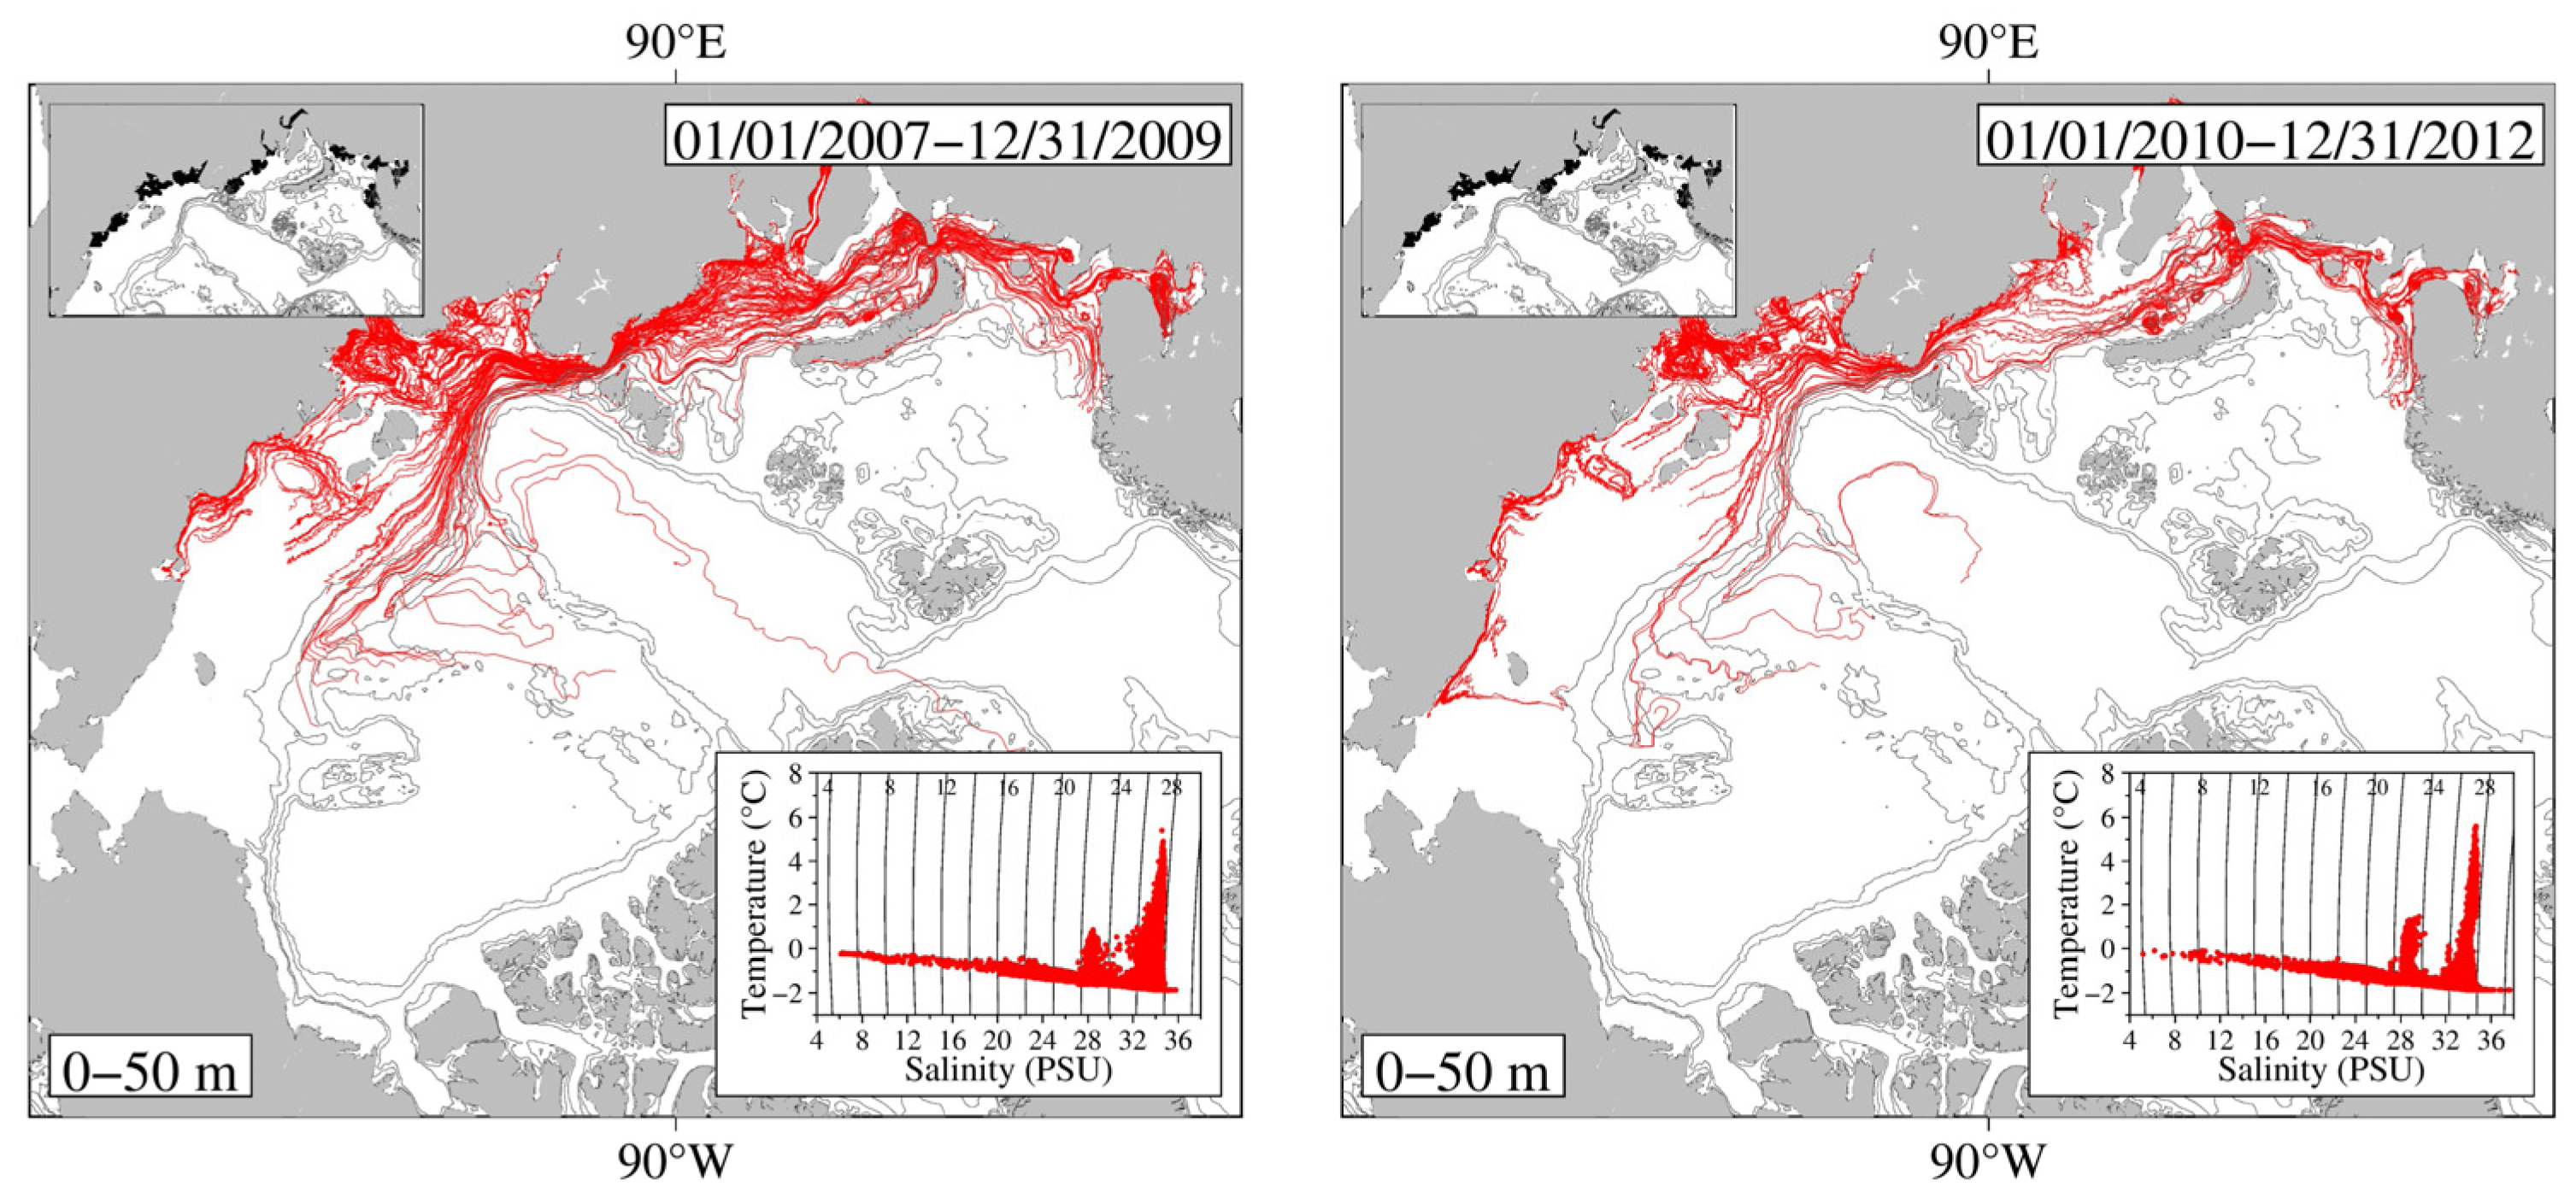
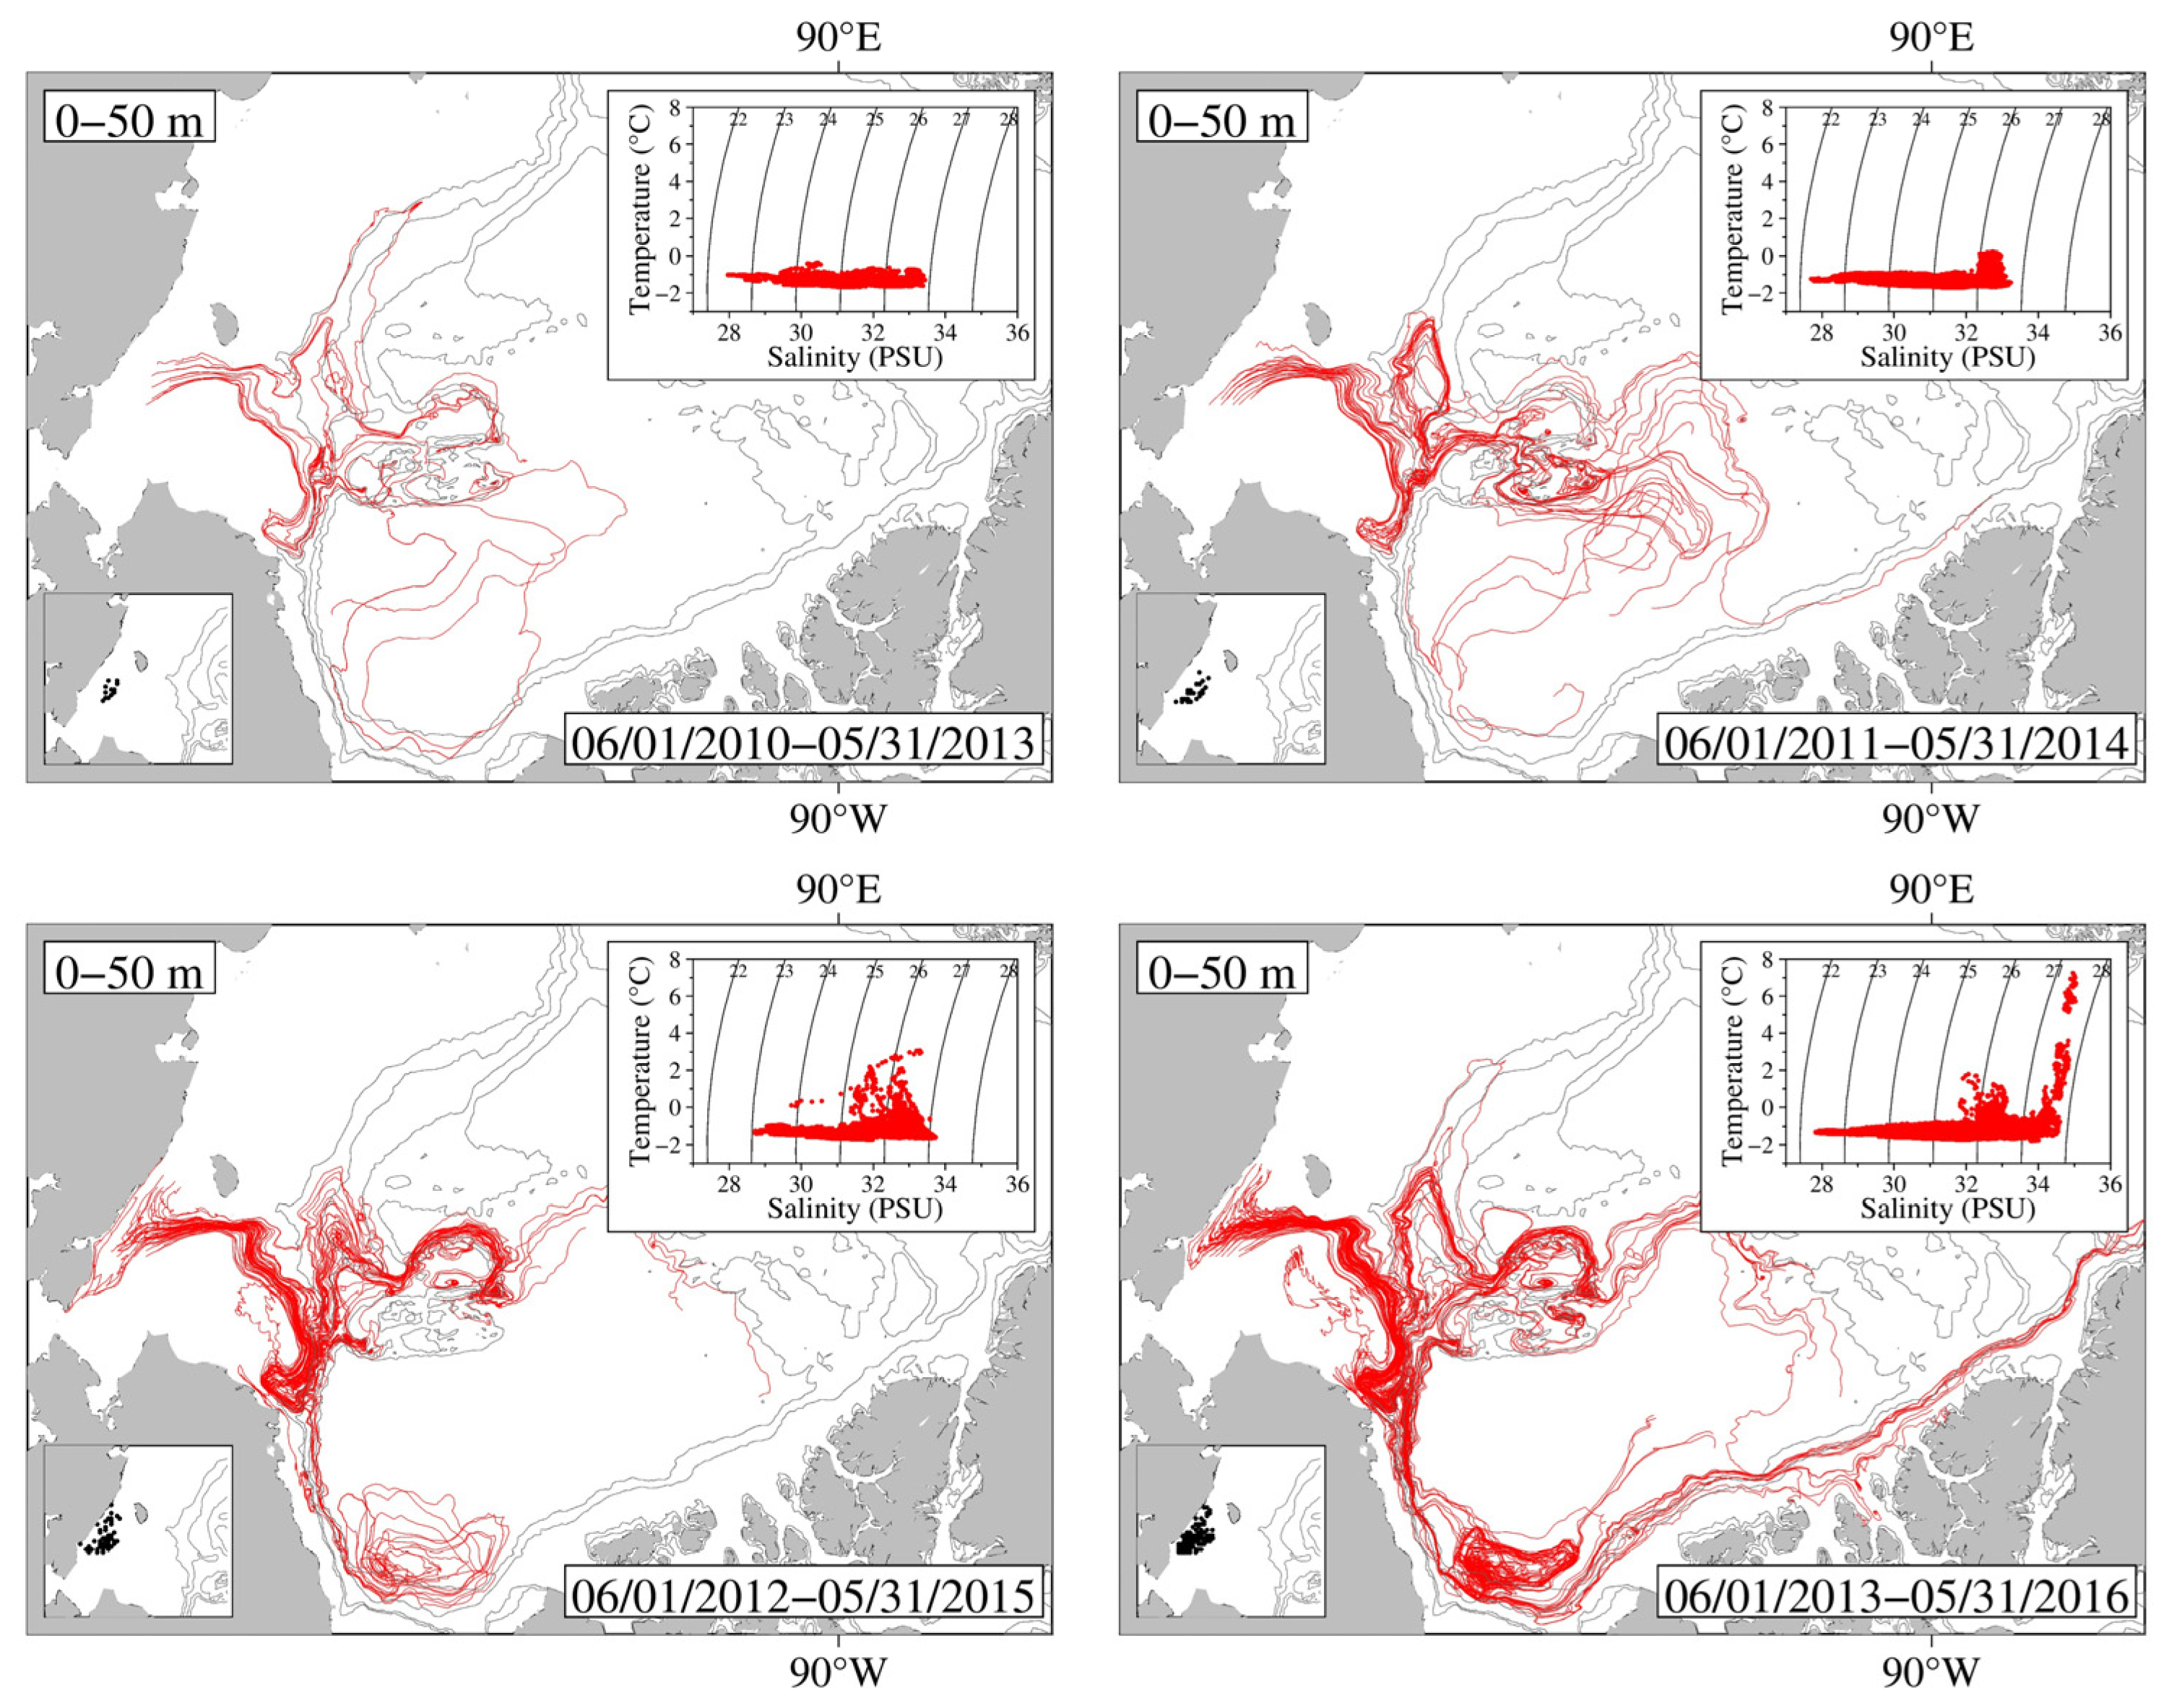
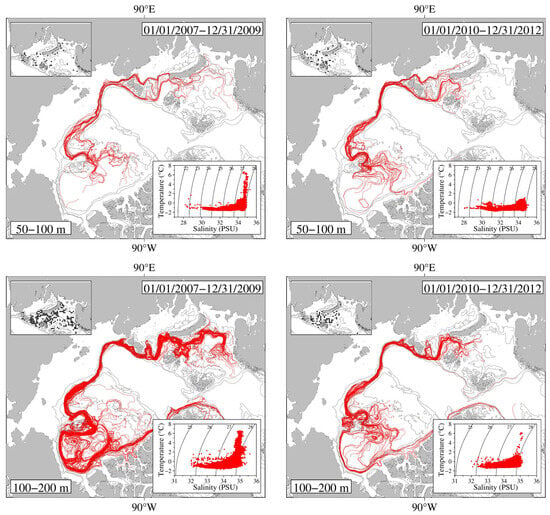
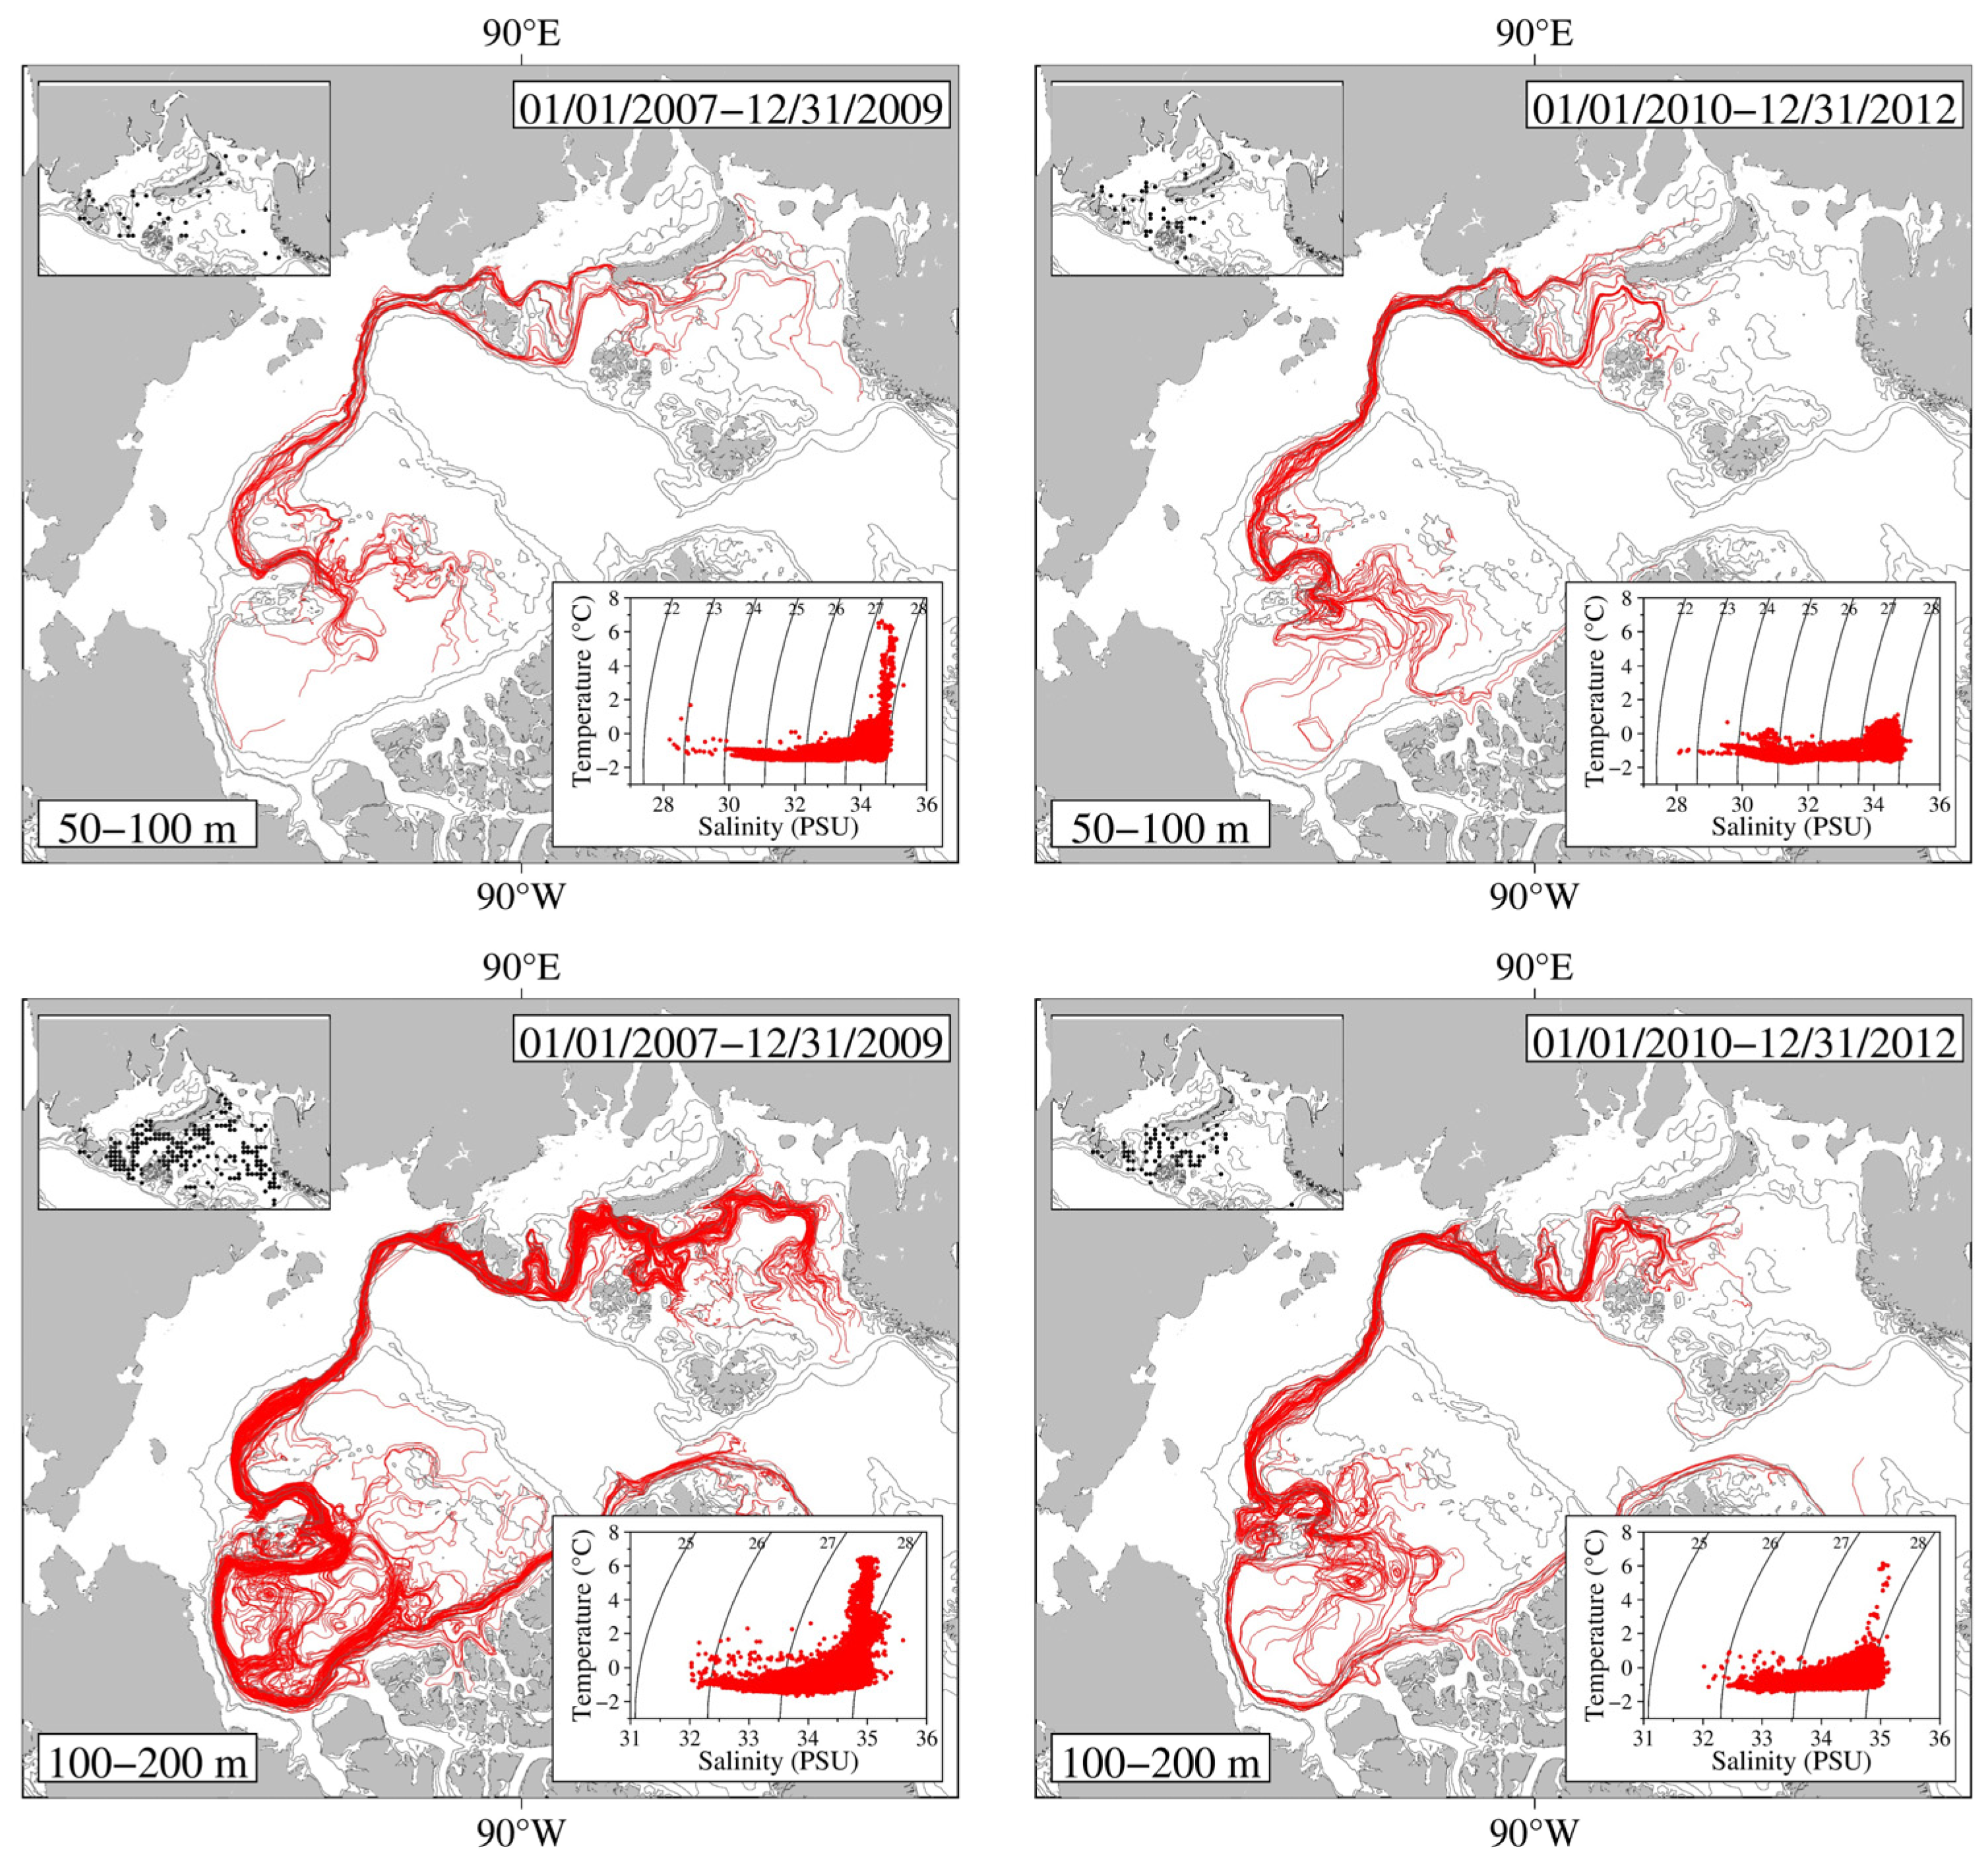
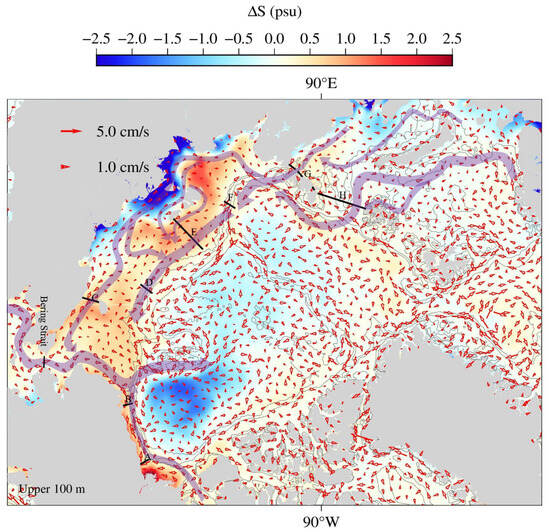
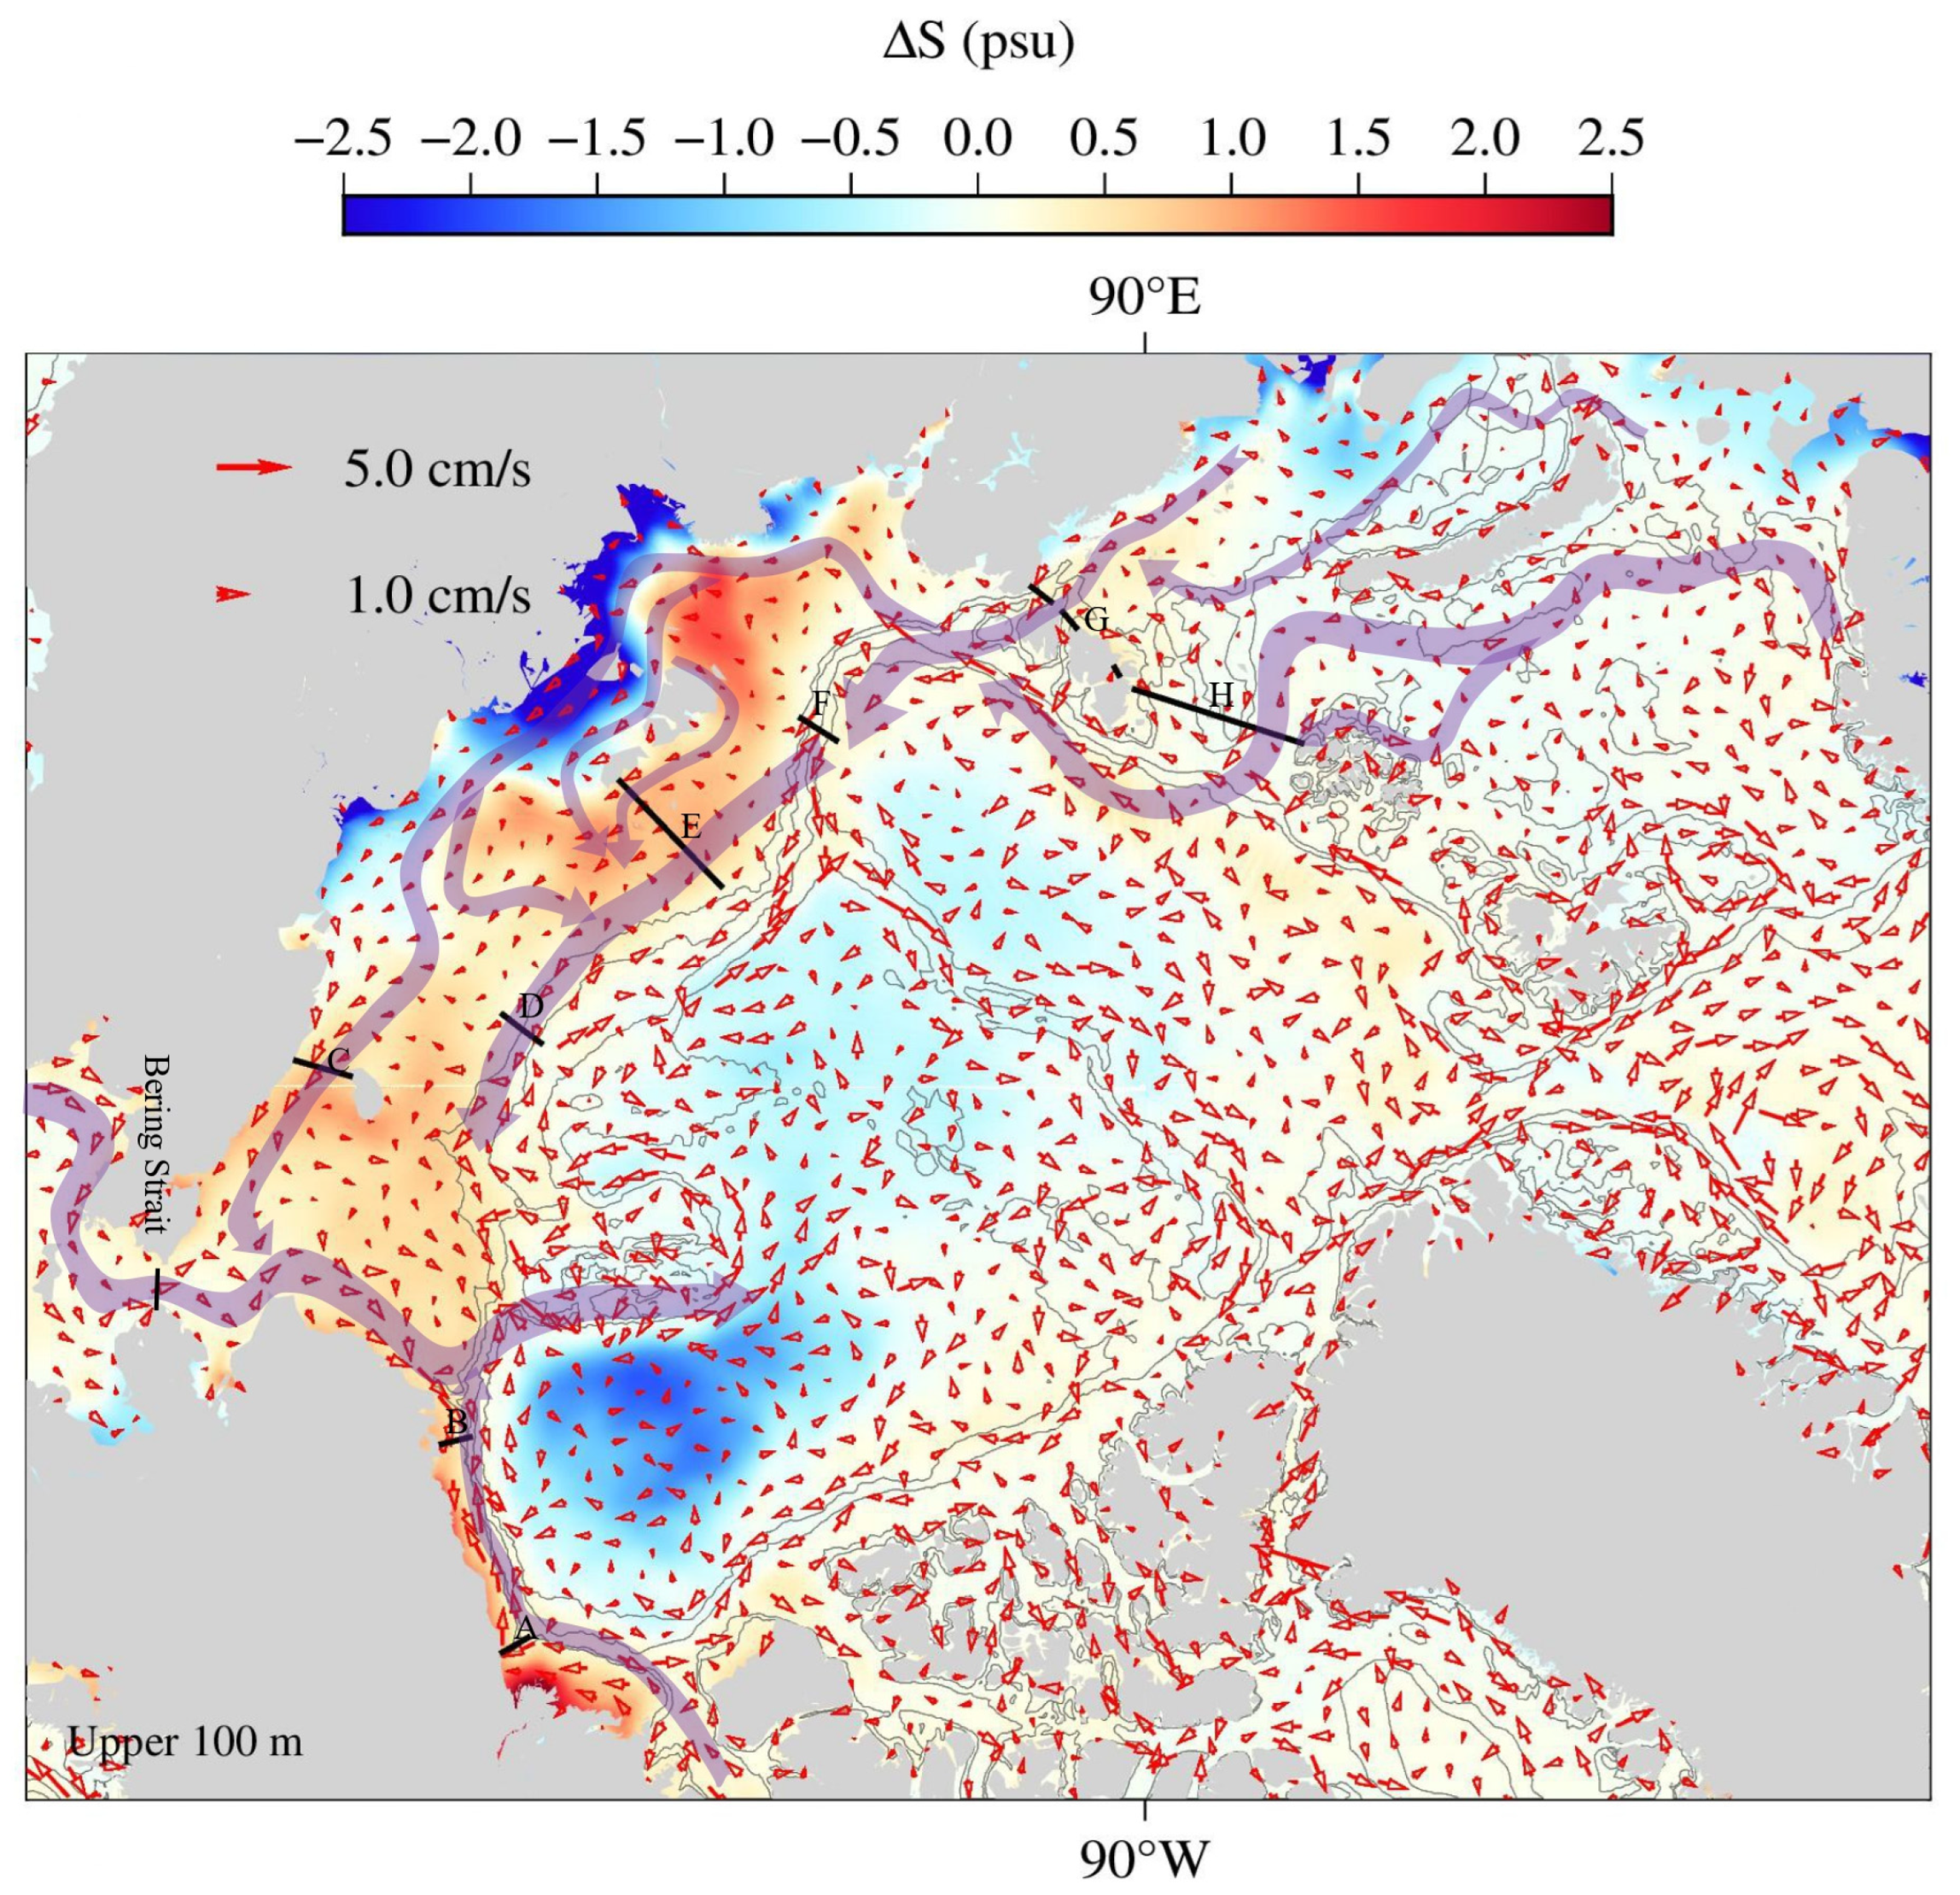
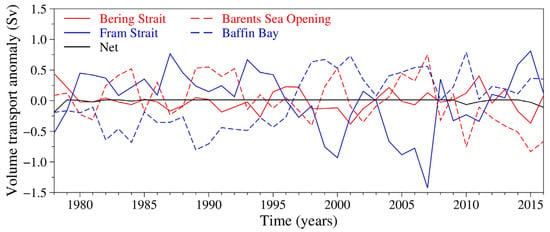
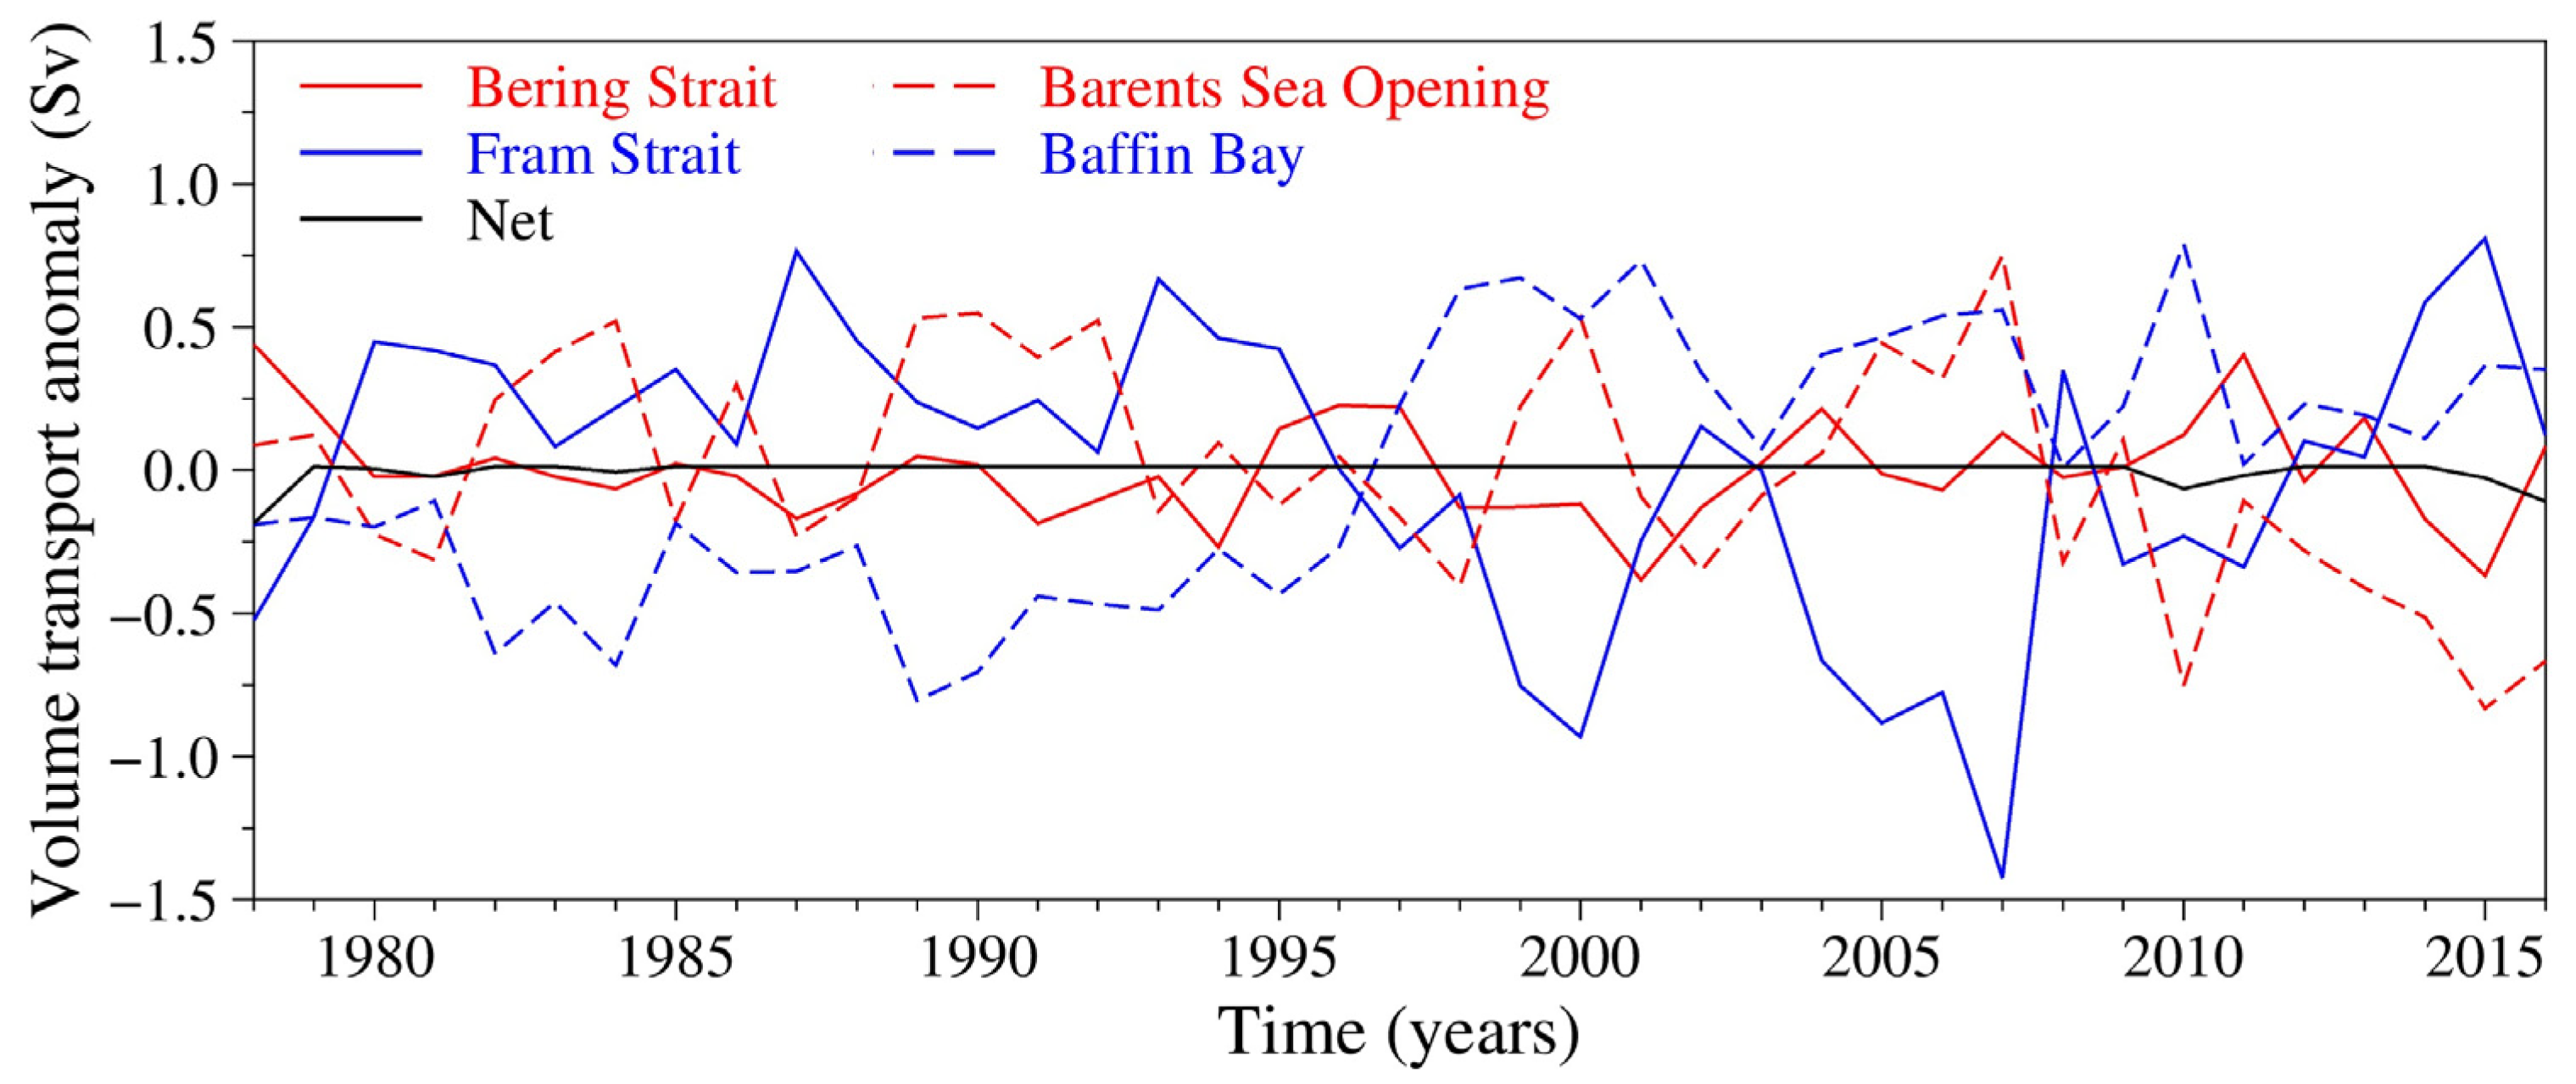
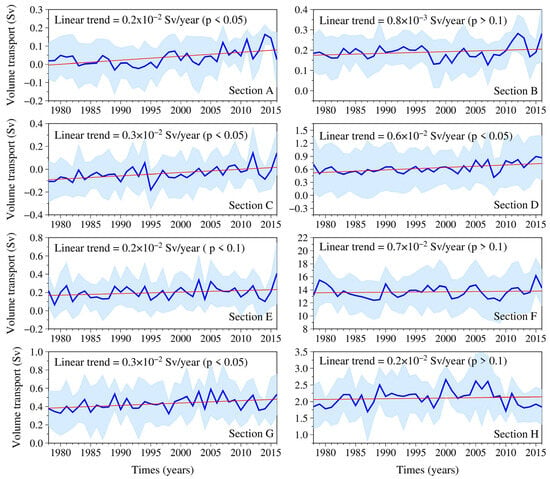
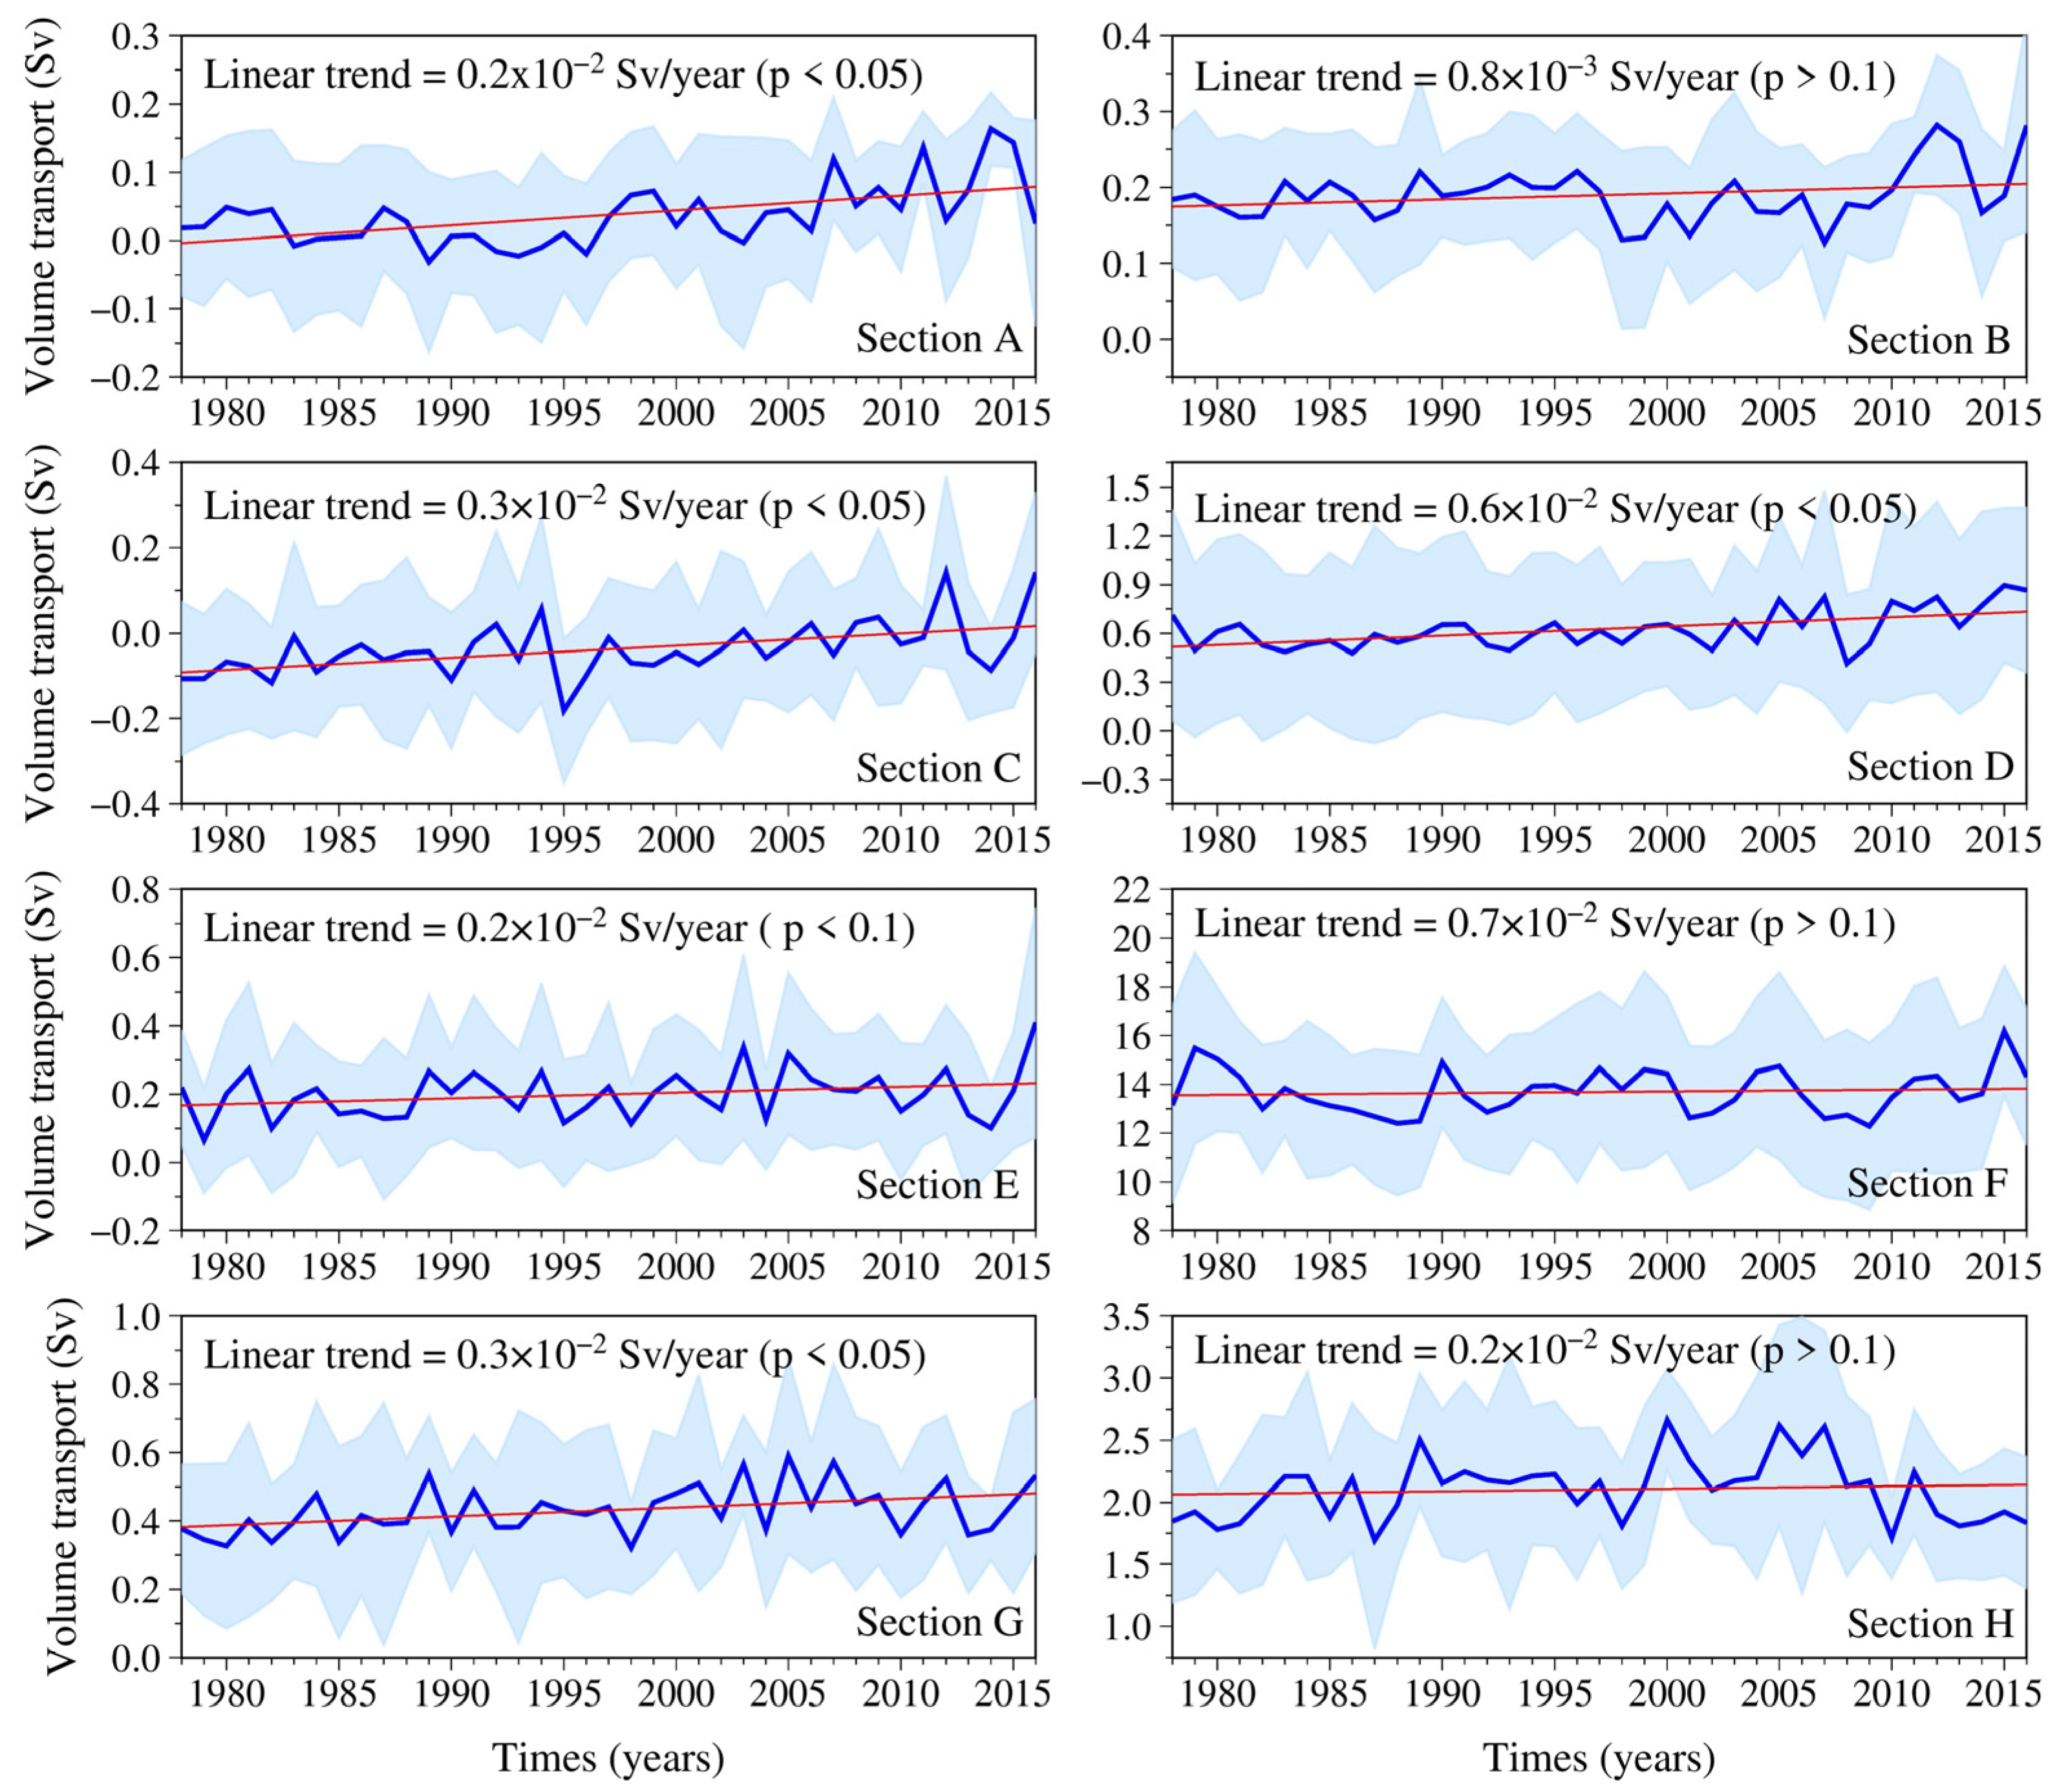
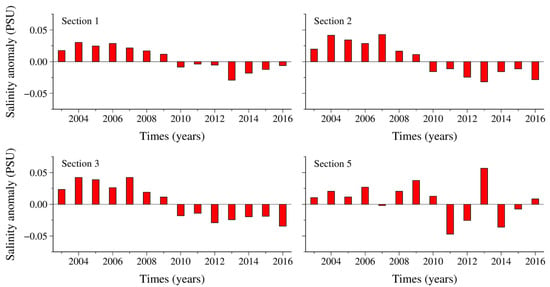
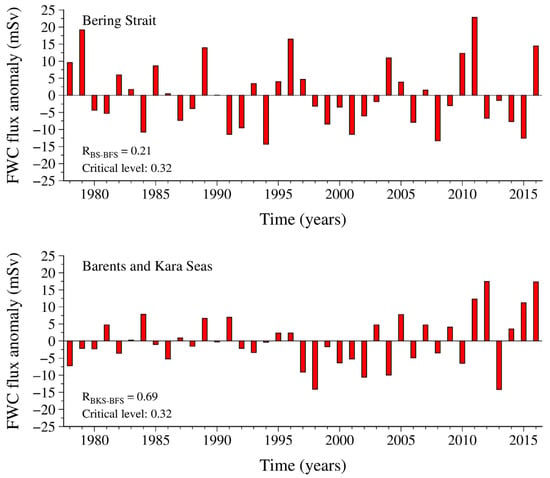
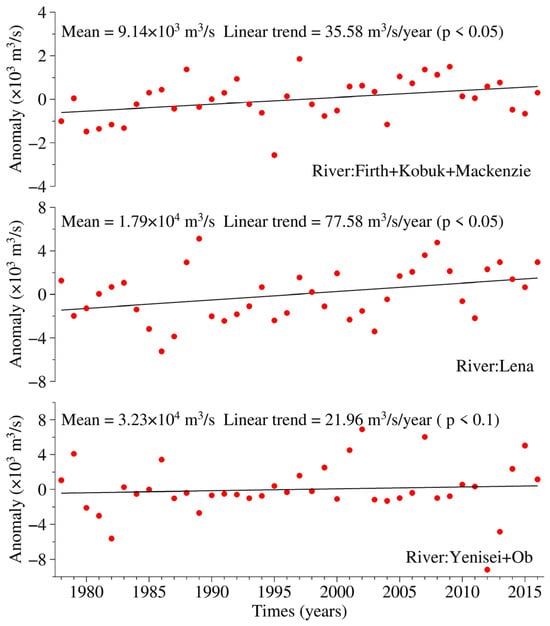
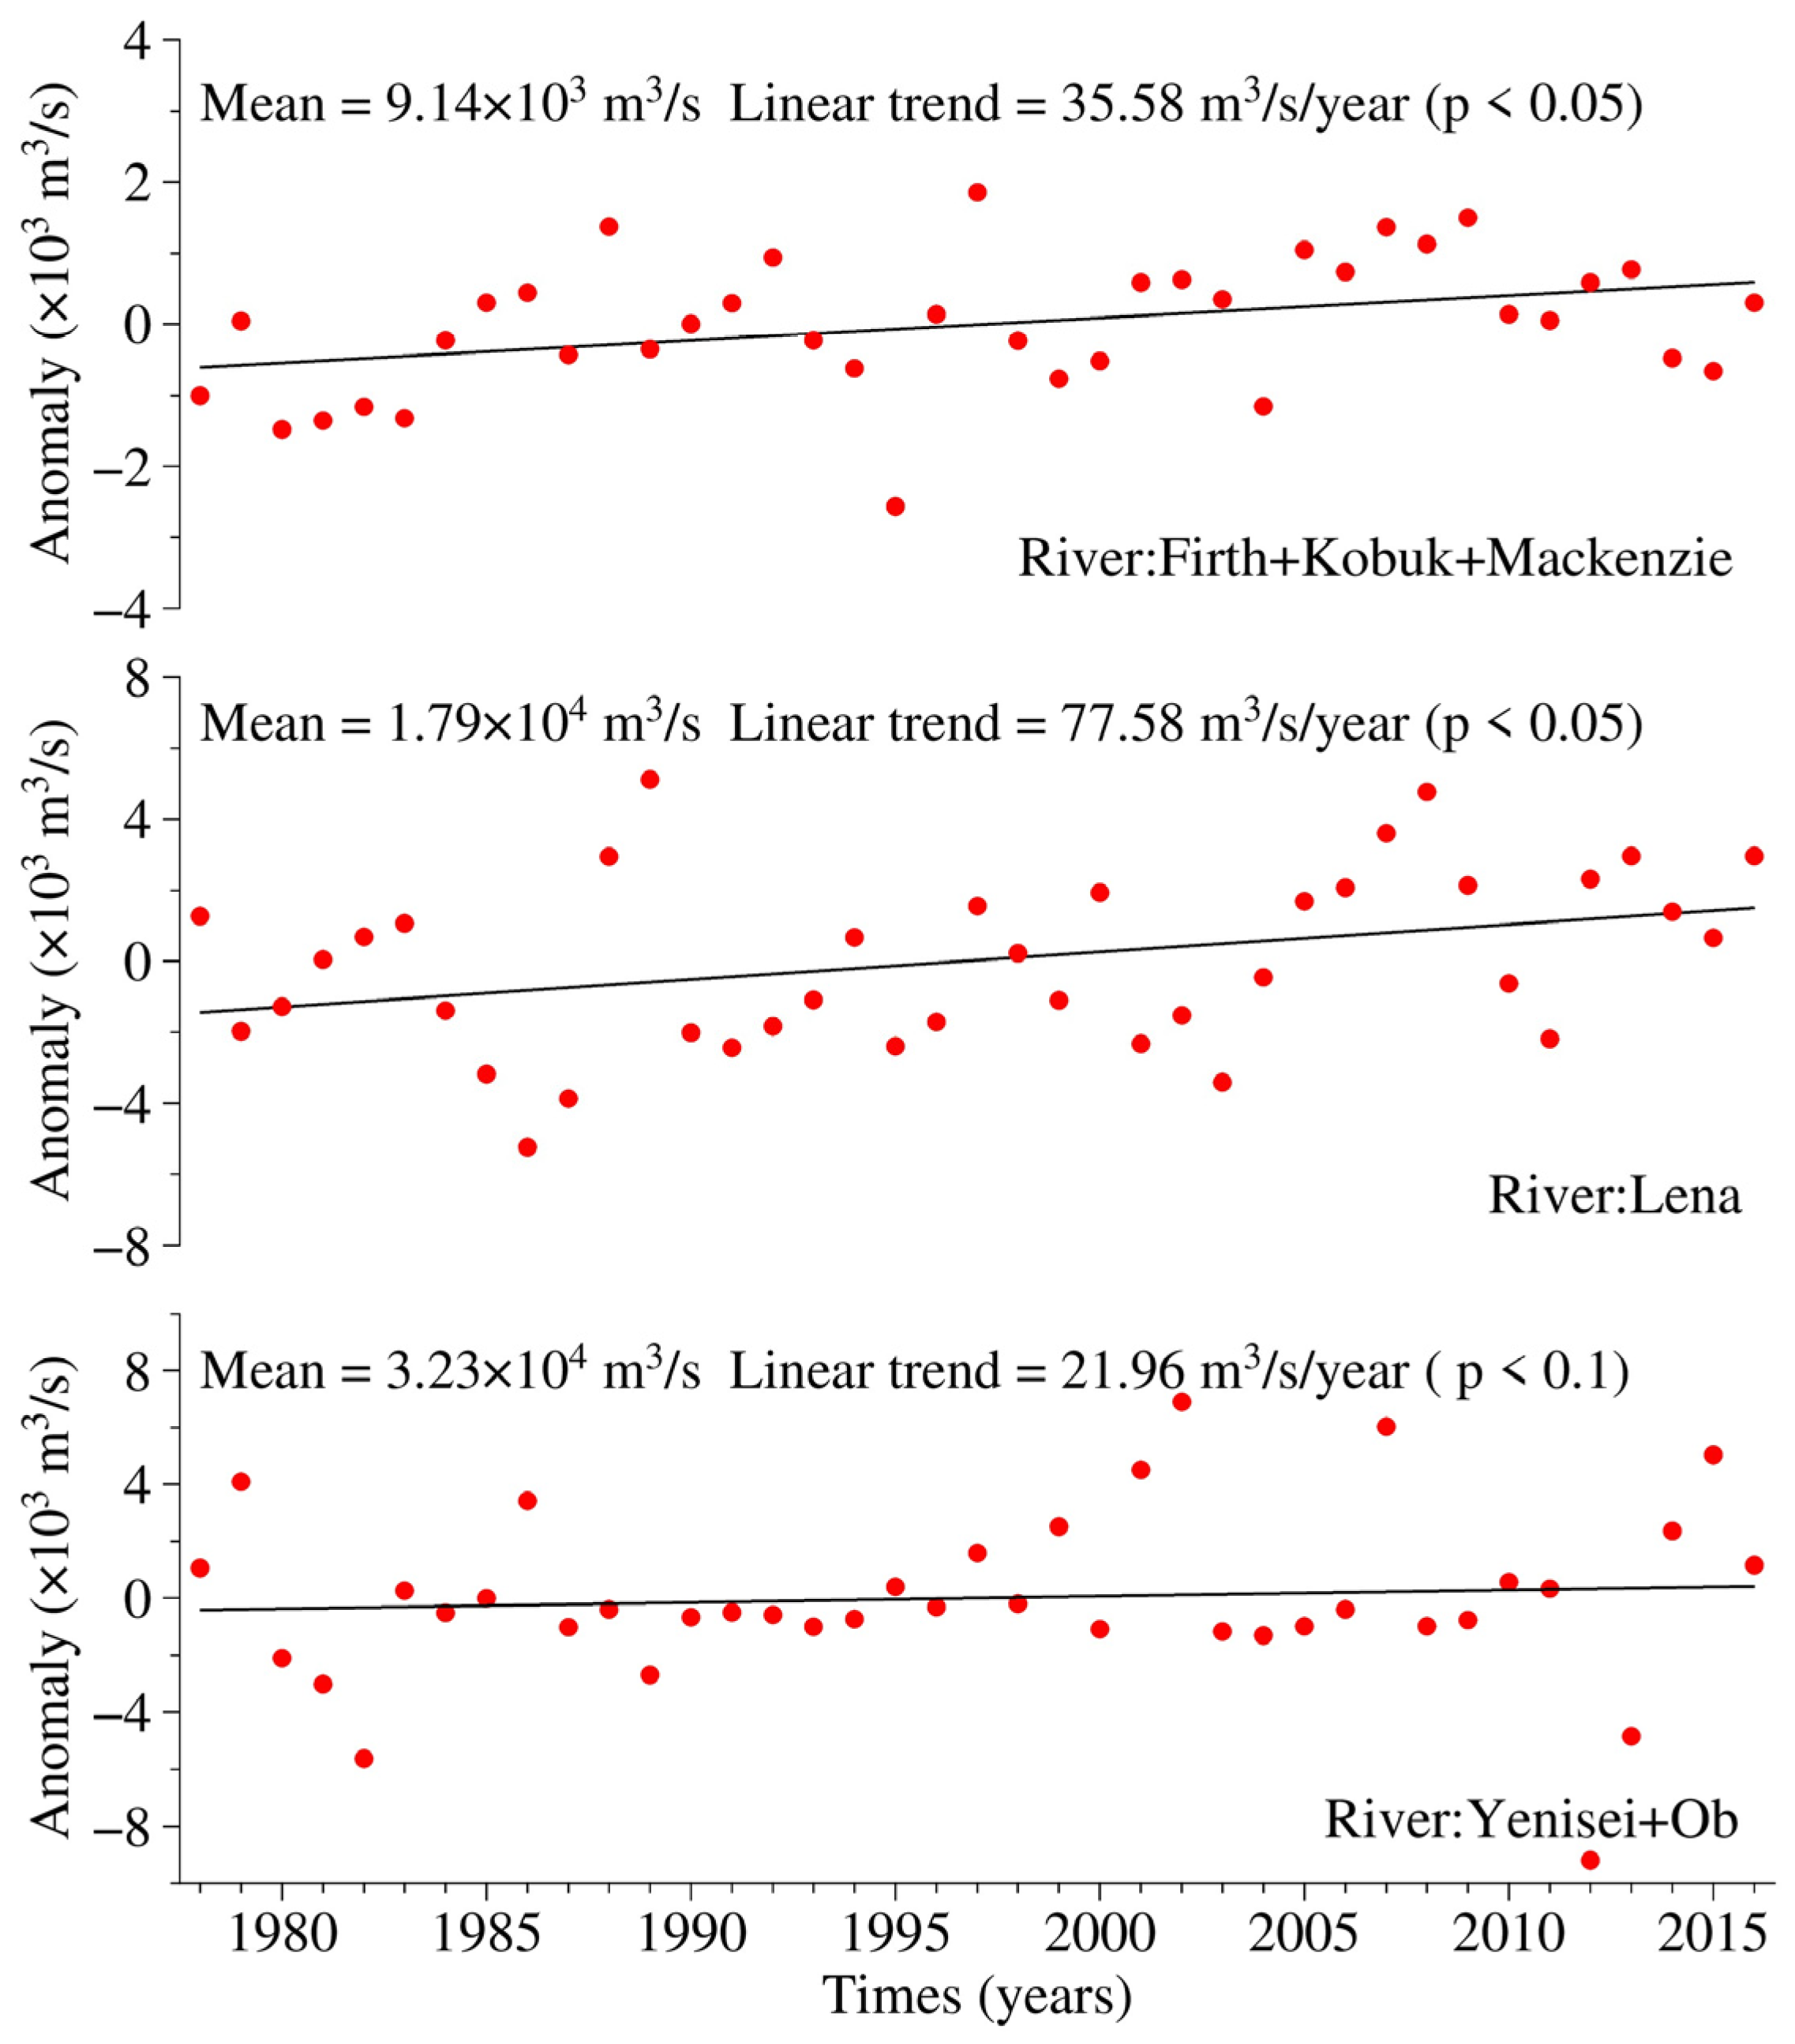
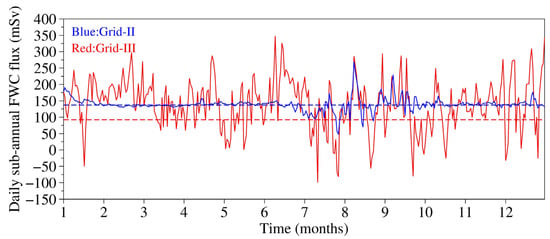
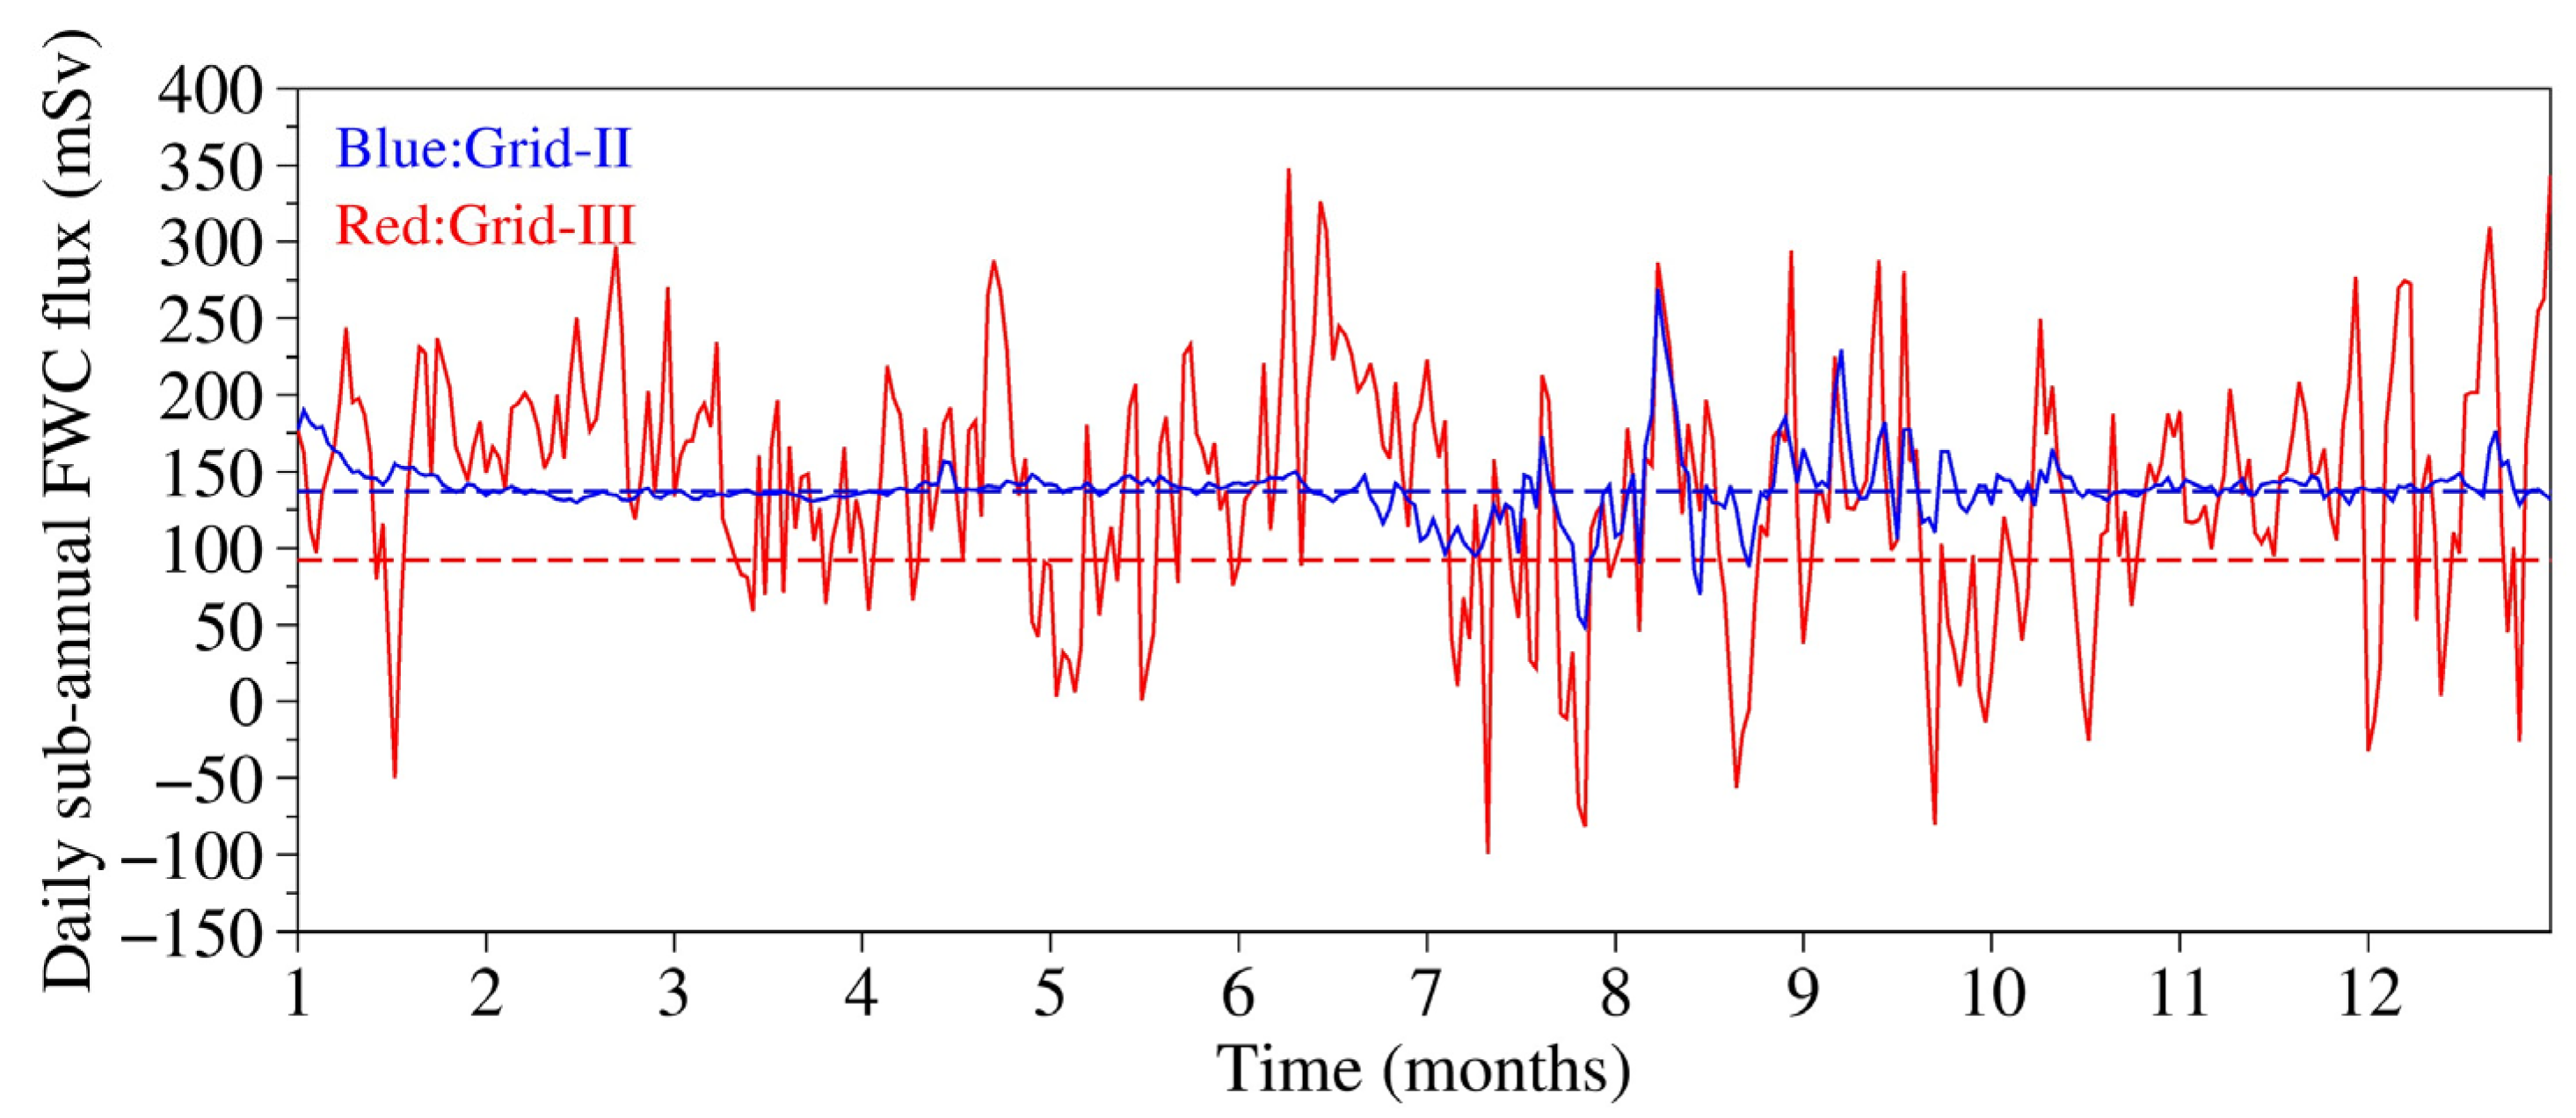

Disclaimer/Publisher’s Note: The statements, opinions and data contained in all publications are solely those of the individual author(s) and contributor(s) and not of MDPI and/or the editor(s). MDPI and/or the editor(s) disclaim responsibility for any injury to people or property resulting from any ideas, methods, instructions or products referred to in the content. |
© 2026 by the authors. Licensee MDPI, Basel, Switzerland. This article is an open access article distributed under the terms and conditions of the Creative Commons Attribution (CC BY) license.