


Abstract
Decarbonizing the maritime sector requires not only adopting alternative fuels and propulsion technologies but also quantitatively assessing their impacts on coastal and urban air quality. This study develops a stochastic, time-resolved air-quality modelling framework to evaluate ship-related pollutant dispersion in port environments. The approach integrates Automatic Identification System (AIS) trajectories, vessel-specific emission factors, and meteorological inputs within a moving-source Gaussian dispersion model to simulate the spatio-temporal evolution of pollutant concentrations. A 24 h case study for the Ports of Los Angeles and Long Beach demonstrates highly intermittent emission behaviour, with peak aggregated emission rates reaching approximately 1.2 kg/s for CO2 and 3.8 g/s for SO2. Temporally integrated concentration fields reveal maximum cumulative dosages of 0.145 g·s/m3 for NOx, 0.023 g·s/m3 for SO2, 0.014 g·s/m3 for total PM, and 7.5 g·s/m3 for CO2 in near-port traffic corridors. Sensitivity analysis indicates that effective emission height variations alter cumulative exposure by up to 17%, whereas temporal resolution changes produce deviations below 7%, confirming numerical stability. Monte Carlo uncertainty propagation demonstrates bounded but non-negligible variability in exposure estimates under realistic emission and wind uncertainties. Results show that cumulative exposure patterns differ substantially from short-term concentration peaks, highlighting the importance of time-integrated and receptor-based metrics for port air quality assessment. The proposed AIS-driven stochastic framework provides a reproducible and computationally efficient tool for evaluating operational mitigation strategies and supporting evidence-based maritime decarbonization pathways.
1. Introduction
Global maritime transport accounts for more than 80% of international trade volume and remains a major contributor to local air pollution in coastal and port-adjacent urban areas [1,2]. Despite recent improvements in fuel standards [3,4], engine technologies [5,6,7], and retrofitting [8], ships continue to emit substantial quantities of nitrogen oxides (NOx), sulphur oxides (SOx), particulate matter (PM), carbon monoxide (CO), volatile organic compounds (VOCs), and greenhouse gases [9]. These emissions accumulate particularly in port zones, where vessel traffic density, manoeuvring, hoteling, and auxiliary engine use create persistent hotspots with elevated pollutant concentrations [10]. Such conditions pose direct risks to public health and contribute to regional air quality degradation, making port emissions a central focus in national and international environmental regulations [11], with recent studies further quantifying the associated social and economic costs of ship emissions in major container ports [12].
Current decarbonization strategies in maritime transport range from alternative fuels (LNG, methanol [13], ammonia [14], and hydrogen [15]) to electrification, wind-assisted propulsion [16], slow steaming [17], and optimized port operations [18], which are typically evaluated in terms of CO2 reduction potential and economic feasibility. Several modelling studies have evaluated the air-quality implications of ship emission reduction measures, demonstrating that operational and technological interventions can significantly alter pollutant dispersion patterns and near-field concentration levels [19]. However, the environmental performance of these strategies cannot be fully understood without quantifying their impact on local air quality under dynamic operational conditions. Transition pathways to reduce greenhouse gas emissions may yield complex trade-offs among NOx, PM, and secondary pollutant formation, depending on engine type, fuel properties, and operational behaviour [20]. As a result, high-resolution, physically consistent modelling of pollutant dispersion from ships is essential for assessing the environmental effectiveness of maritime decarbonization measures [21,22,23].
Although several dispersion modelling approaches exist, ranging from Eulerian chemical transport models [24] to Computational Fluid Dynamics (CFD) simulations [25] and Gaussian plume models [26], many are computationally intensive, require detailed emission inventories, or lack the temporal fidelity needed to capture rapidly changing ship positions in port-based operations. Port-focused modelling investigations have demonstrated that ship-related emissions can significantly elevate near-field NOx and PM concentrations under specific wind and stability regimes [27,28]. Subsequent studies further emphasized the importance of coupling emission inventories with dispersion dynamics for accurate exposure assessment [29,30]. Despite these advances, the incorporation of fully dynamic Automatic Identification System (AIS)-driven ship trajectories into a stochastic, time-resolved dispersion framework remains limited. When integrated with emission factors and meteorological inputs, AIS-based modelling enables high-resolution characterization of pollutant dispersion with both spatial precision and temporal continuity [31].
Despite this potential, existing studies often rely on either static emission inventories or simplified dispersion assumptions, with limited incorporation of stochastic variability or uncertainty propagation [32]. Meteorological fluctuations, especially wind speed, wind direction, and atmospheric stability, critically influence dispersion outcomes and can introduce substantial uncertainty into predicted concentrations. Similarly, vessel-specific emission rates vary with load, fuel composition, and operating mode. Therefore, deterministic modelling frameworks are insufficient to fully describe the probabilistic nature of pollutant exposure in port regions [33].
To address these gaps, this study develops a stochastic, time-resolved air quality modelling framework that couples AIS trajectories with a Gaussian dispersion model and Monte Carlo uncertainty propagation. The framework computes dynamic emission fields from moving ships, incorporates vessel motion and stack parameters, and resolves pollutant concentrations at hourly intervals. Sensitivity analysis identifies the dominant drivers of concentration variability, while stochastic simulations capture uncertainties in emission factors and meteorological conditions. The resulting model is designed to be transparent, reproducible, and easily extensible for scenario testing, including alternative fuels, port scheduling policies, and emission mitigation strategies.
This work contributes to maritime environmental modelling in three keyways:
- A fully time-resolved dispersion module that integrates AIS-derived ship trajectories with dynamic plume evolution;
- A stochastic modelling framework that quantifies uncertainties in both emissions and atmospheric conditions;
- A decision-support tool for evaluating the air-quality implications of maritime decarbonization pathways and operational strategies.
Overall, the presented framework enables a more realistic characterization of ship-induced air pollution in port environments and provides a scientific basis for the design of effective emission-control and decarbonization policies.
2. Study Area and Data Sources
This study focuses on ship-induced air pollutant dispersion in a central port area characterized by dense maritime traffic and complex operational patterns, including manoeuvring, queuing, and low-speed navigation. The selected study area is the Los Angeles-Long Beach (LA-LB) port complex (ports of Los Angeles and Long Beach, CA, USA), one of the busiest container ports worldwide, where ship emissions contribute significantly to local air quality degradation. Previous air-quality investigations in the LA-LB port region have documented substantial ship-related pollutant emissions associated with intense maritime activity and port operations. An AIS-based emission inventory analysis for the LA-LB ports reported significant annual emissions of NOx, SO2, and total PM, with container ships, cargo vessels, and oil tankers accounting for nearly 90% of total ship-related pollutants [34]. The study further highlighted the influence of vessel operational modes (cruising, manoeuvring, and berthing) and emission control area (ECA) policies on the spatial and temporal distribution of pollutants within the port complex.
2.1. Study Area Description
The LA-LB port complex is located along the southern California, USA and serves as a critical hub for international maritime trade. The port area is characterized by high vessel density, frequent congestion, and extended queuing periods, particularly for large cargo vessels [35]. These operational conditions make the region well-suited for analysing the spatio-temporal variability of ship-related emissions and their impact on nearshore and inland receptors.
For modelling purposes, the study domain was defined to fully encompass the main navigation channels, anchorage areas, and adjacent coastal zones with the highest ship traffic intensity. Shore-based receptors were positioned downwind of the dominant shipping lanes to capture the potential exposure of port infrastructure and nearby urban areas to ship-originated air pollutants.
2.2. AIS Data and Vessel Traffic Information
Ship traffic data were obtained from AIS records covering a continuous 24 h period. Vessel trajectories were filtered to remove incomplete records, duplicate Maritime Mobile Service Identity (MMSI) entries, and unrealistic speed values (>30 knots in port conditions). The raw AIS signals were temporally interpolated to 5 min (1 min and 10 min) intervals to ensure numerical stability and continuity in emission rate calculations. Vessel trajectories were reconstructed by linear interpolation between consecutive AIS position reports, allowing each ship to be treated as a moving emission source with continuously varying spatial coordinates. The dataset includes time-stamped vessel positions, speed over ground, vessel identifiers, and vessel type classifications. Only cargo vessels with a length greater than 100 m were considered in the analysis, as these ships typically account for most total emissions due to their higher installed engine power and longer operational durations.
2.3. Coordinate Transformation and Spatial Representation
To facilitate dispersion calculations, geographic coordinates (latitude and longitude) were transformed into a local Cartesian coordinate system. A reference origin was defined at the mean latitude and longitude of all vessel positions within the dataset. The Transformation assumes a spherical Earth and applies a standard equirectangular projection, resulting in horizontal coordinates in meters. This approach enables efficient calculation of downwind and crosswind distances between emission sources and receptor locations while preserving sufficient spatial accuracy at the port scale.
2.4. Vessel Categorization and Emission Parameters
Each vessel was classified into operational categories based on AIS vessel type codes, including cargo ships, tankers, passenger vessels, and other ship types. For each category, representative engine power ratings, design speeds, and NOx, SO2, total PM, and CO2 emission factors were assigned based on commonly reported values in the literature [36,37,38,39,40].
Instantaneous emission rates were estimated using a load-factor-based approach, where the engine load factor was expressed as a cubic function of the ratio of the actual vessel speed to the design speed. This formulation reflects the non-linear relationship between ship speed and primary engine power demand. The resulting emission rates vary over time and space, directly reflecting real vessel operations in the port area.
2.5. Meteorological Data and Wind Field Assumptions
A spatially varying wind field represented meteorological conditions throughout the modelling domain. A mean wind speed was assumed, while wind direction was allowed to vary smoothly with spatial coordinates to capture the local variability commonly observed in coastal port environments. Wind vectors were interpolated at each vessel position to determine the effective advection velocity governing pollutant transport. Atmospheric stability conditions were dynamically classified based on local wind speed, using a simplified Pasquil stability scheme [41]. These stability classes were subsequently used to determine horizontal and vertical dispersion parameters in the Gaussian plume formulation.
3. Methodology
This study employs a time-dependent stochastic Gaussian dispersion framework to quantify ship-related air pollutant concentrations in port areas. Individual vessels are modelled as moving point sources whose emission rates vary dynamically with operational conditions, as derived from AIS data. The methodology integrates vessel kinematics, emission estimation, atmospheric advection-dispersion processes, and temporal accumulation within a unified modelling framework. The dispersion formulation resolves the physical transport of emitted pollutants in the near-field domain, providing high-resolution spatio-temporal characterization of primary emission plumes under realistic port operational conditions.
Let denote individual ships operating within the study domain and let represent time. A time-dependent position vector characterises each vessel
and an instantaneous emission rate (g/s). The total pollutant concentration at a receptor point and time is obtained by the superposition of contributions [42] from all vessels:
where is the concentration field induced by the vessel .
3.1. Vessel Kinematics and Emission Rate Estimation
AIS position reports are available at discrete times and are interpolated linearly to obtain continuous vessel trajectories. The instantaneous speed over ground is used to estimate the engine load factor. The instantaneous speed over ground is used to estimate the engine load factor , defined as follows:
where is the design speed of the vessel . Recent studies have demonstrated the effectiveness of spatial-temporal AIS datasets for high-resolution estimation of ship energy consumption and carbon emissions, supporting the integration of dynamic vessel kinematics into emission modelling frameworks [43]. For each pollutant, the instantaneous emission rate is then calculated as follows:
where is the emission factor (g/kWh), is the installed main engine power (kW) and is a load factor. Equation (4) captures the strong non-linear dependence of emissions on vessel speed and operational state.
3.2. Wind Field and Coordinate Transformation
A spatially varying wind field is prescribed over the modelling domain. At each vessel position, local wind components are obtained by interpolation, yielding a wind magnitude as follows:
For each vessel-receptor pair, a coordinate system is introduced that is rotated to align with the local wind direction. The downwind () and crosswind () distances are given by the following:
Only receptors located downwind () contribute to the concentration field.
3.3. Gaussian Dispersion Model for Moving Sources
Each vessel is treated as an instantaneous point source with an effective emission height . The concentration contribution from the vessel at a receptor location is computed using the Gaussian plume model as used in [44]:
The second exponential term accounts for reflection at the ground surface. The Gaussian model adopted in this study describes the physical advection and atmospheric dispersion of primary pollutants emitted from moving vessels. It does not explicitly represent chemical reactions, secondary pollutant formation, or pollutant transformation processes occurring in the atmosphere. Consequently, the resulting concentration fields should be interpreted as estimates of the transport and dilution behaviour of primary ship emissions under the prescribed meteorological conditions, rather than as results from a fully coupled atmospheric chemistry simulation.
3.4. Atmospheric Stability and Dispersion Parameters
Atmospheric stability is dynamically classified based on the wind speed using a simplified Pasquil scheme [41]. For each stability class, the horizontal and vertical dispersion coefficients are expressed as functions of downwind distance [45]:
where the coefficients depend on the stability class. This formulation allows dispersion characteristics to evolve continuously in space and time as vessels move through the domain.
3.5. Temporal Integration and Cumulative Concentration
To evaluate cumulative exposure, instantaneous concentration fields are integrated over time:
which is approximated numerically using discrete time steps :
This approach captures both short-term peak concentrations and long-term accumulation effects relevant for regulatory assessment. In this study, the simulation period was 24 h, but the proposed framework is not restricted to daily simulations. The methodology can be extended to multi-day or seasonal analyses, provided AIS and meteorological data are available.
3.6. Sensitivity
To evaluate the robustness of the dispersion model, a parametric sensitivity analysis was conducted focusing on two critical modelling parameters: effective emission height (H) and temporal resolution (Δt). The effective emission height represents the combined effects of stack geometry, buoyancy, and initial plume momentum. Although a baseline value of 30 m was adopted based on port emission inventory assumptions, alternative heights of 20 m and 40 m were evaluated to quantify near-field sensitivity.
Temporal resolution affects the numerical representation of moving emission sources and the integration of cumulative concentrations. The base simulation employed a 5 min AIS interpolation interval. Additional simulations were conducted at 1 min and 10 min resolutions to assess discretization-induced variability.
3.7. Stochastic Representation
Uncertainties in emission factors, wind speed, atmospheric stability, and model parameters are implicitly represented through time-varying inputs and spatial variability. The resulting concentration fields, therefore, constitute stochastic realizations of air quality conditions, suitable for subsequent receptor-based exposure and risk analysis.
3.8. Uncertainty
Beyond deterministic sensitivity analysis, an uncertainty quantification framework was implemented to account for stochastic variability in emission and meteorological inputs. A Monte Carlo approach [46,47] was employed to propagate input uncertainties through the dispersion model. Emission factors were treated as multiplicative stochastic variables and sampled from lognormal distributions with a relative standard deviation of 20%, representing variability among vessel classes and operational conditions. Wind speed uncertainty was introduced using a lognormal distribution with a 30% relative standard deviation, while wind direction was perturbed using a normal distribution with a standard deviation of 15°. The effective emission height was sampled from a normal distribution with a standard deviation of 5 m around the baseline value. A total of 1000 realizations were performed to ensure statistical convergence of the stochastic simulations. For each realization, perturbed parameters were propagated through the Gaussian dispersion model, and the resulting cumulative concentration fields were analysed statistically. Mean values, standard deviations, and 95% confidence intervals were derived from the empirical distributions obtained from the Monte Carlo ensemble.
3.9. Receptor-Based Exposure Assessment
The assessment of air quality impacts in port environments requires translating modelled concentration fields into meaningful exposure metrics at locations of regulatory and societal relevance. In this study, receptor-based exposure assessment is conducted by defining fixed receptor points representing shoreline and near-port areas and evaluating time-resolved pollutant concentrations resulting from ship emissions.
Receptors are defined as fixed points located downwind of the main shipping lanes and anchorage areas, representing locations where ship-generated air pollutants may affect port cities and nearby populated regions. A linear array of receptors is positioned parallel to the shoreline at a constant distance from the dominant vessel traffic corridor, enabling the assessment of lateral concentration gradients. Each receptor is characterized by spatial coordinates:
where denotes the receptor height above ground level. A receptor height of 1.5 m is assumed, corresponding to typical human breathing height and commonly adopted in air quality exposure studies. At each time step , the instantaneous pollutant concentration at the receptor is obtained from the superposition of contributions from all vessels:
where is computed using the Gaussian dispersion formulation described in Equation (8). To ensure consistency with regulatory frameworks, which typically rely on averaged concentrations, the hourly mean concentration is computed. Let denote the set of discrete time steps within an hour . The hourly averaged concentration at the receptor is defined as:
This averaging process reduces short-term variability while preserving the influence of sustained emission patterns, such as prolonged queuing or congestion events. In addition to hourly averages, cumulative exposure is evaluated to quantify the integrated impact of ship emissions over the entire study period. The cumulative concentration at the receptor is defined as follows:
where Δt is the model time step. This metric reflects both the magnitude and duration of exposure and is particularly relevant for assessing long-term environmental stress in port areas.
The computed receptor-based concentration metrics are suitable for direct comparison with air quality guidelines and regulatory threshold values for nitrogen oxides and related pollutants. Hourly mean concentrations enable assessment against short-term exposure limits, while cumulative metrics provide insight into the persistence and spatial extent of pollution hotspots. By combining spatially distributed receptors with time-resolved concentration estimates, the proposed framework provides a transparent, quantitative basis for evaluating the impacts of ship emissions. It supports informed decision-making in port-city and port-air quality management.
4. Results and Discussion
This section presents and discusses the results obtained from the proposed time-dependent stochastic dispersion model, focusing on the spatio-temporal characteristics of ship-induced emission concentrations in the port area. The analysis combines instantaneous concentration fields, cumulative exposure patterns, and receptor-based metrics to provide a comprehensive assessment of air quality impacts associated with vessel traffic. Model outputs are examined with respect to vessel movement, emission variability, and meteorological conditions, highlighting the role of queuing and low-speed operations in shaping nearshore pollution levels. The discussion emphasises both short-term concentration peaks and longer-term cumulative exposure, with particular attention to their implications for regulatory compliance and maritime decarbonization strategies.
4.1. Model Behaviour Under Synthetic Ship Traffic Scenarios
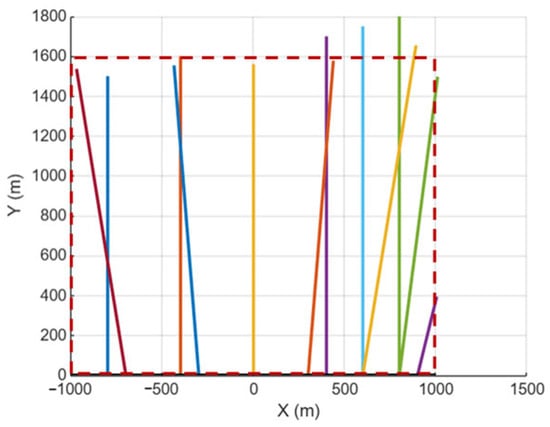
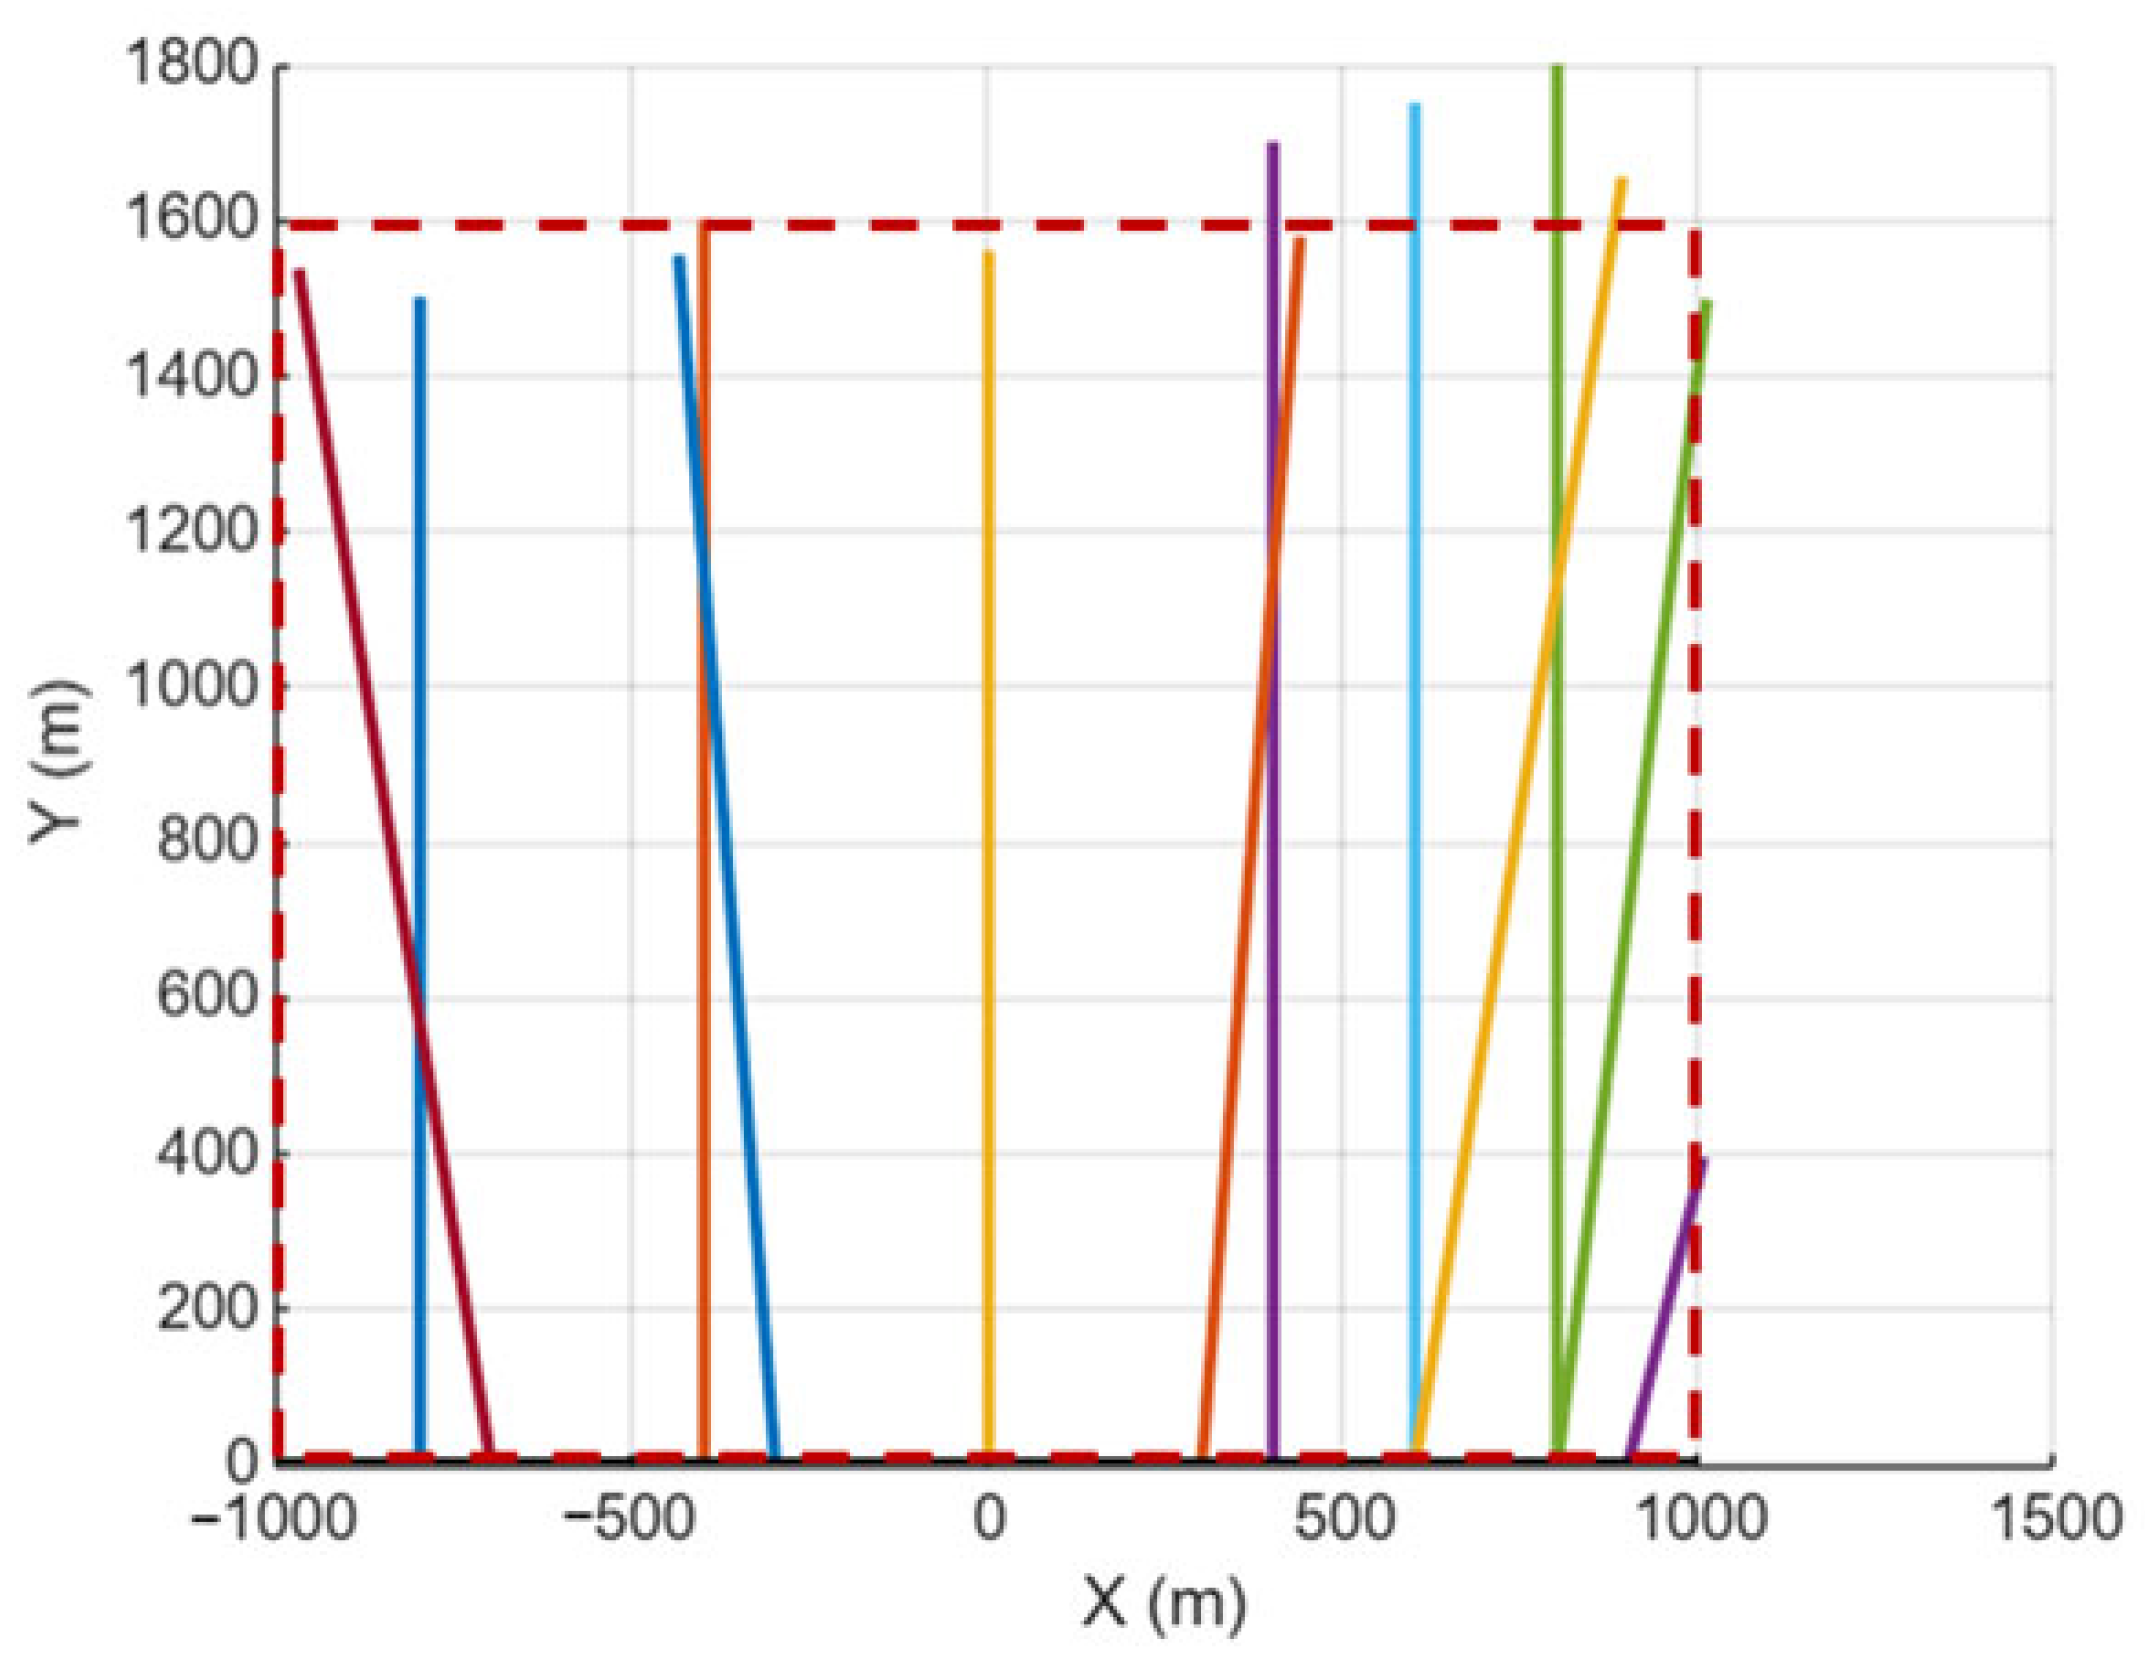
To establish a baseline understanding of the dispersion model behaviour, synthetic ship trajectories within a rectangular control domain were first examined (Figure 1). These idealized trajectories allow the isolation of the effects of ship motion, emission-rate variability, and atmospheric dispersion without the added complexity of real-world traffic patterns. The results demonstrate that even under simplified conditions, moving emission sources generate highly heterogeneous concentration fields, characterized by elongated plumes aligned with the prevailing wind direction.
Figure 1.
Synthetic ship trajectories within a rectangular control domain.
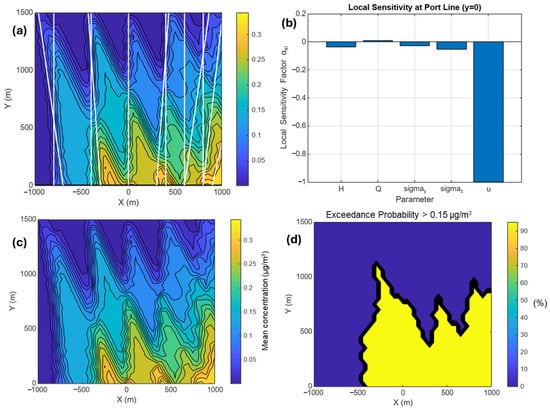
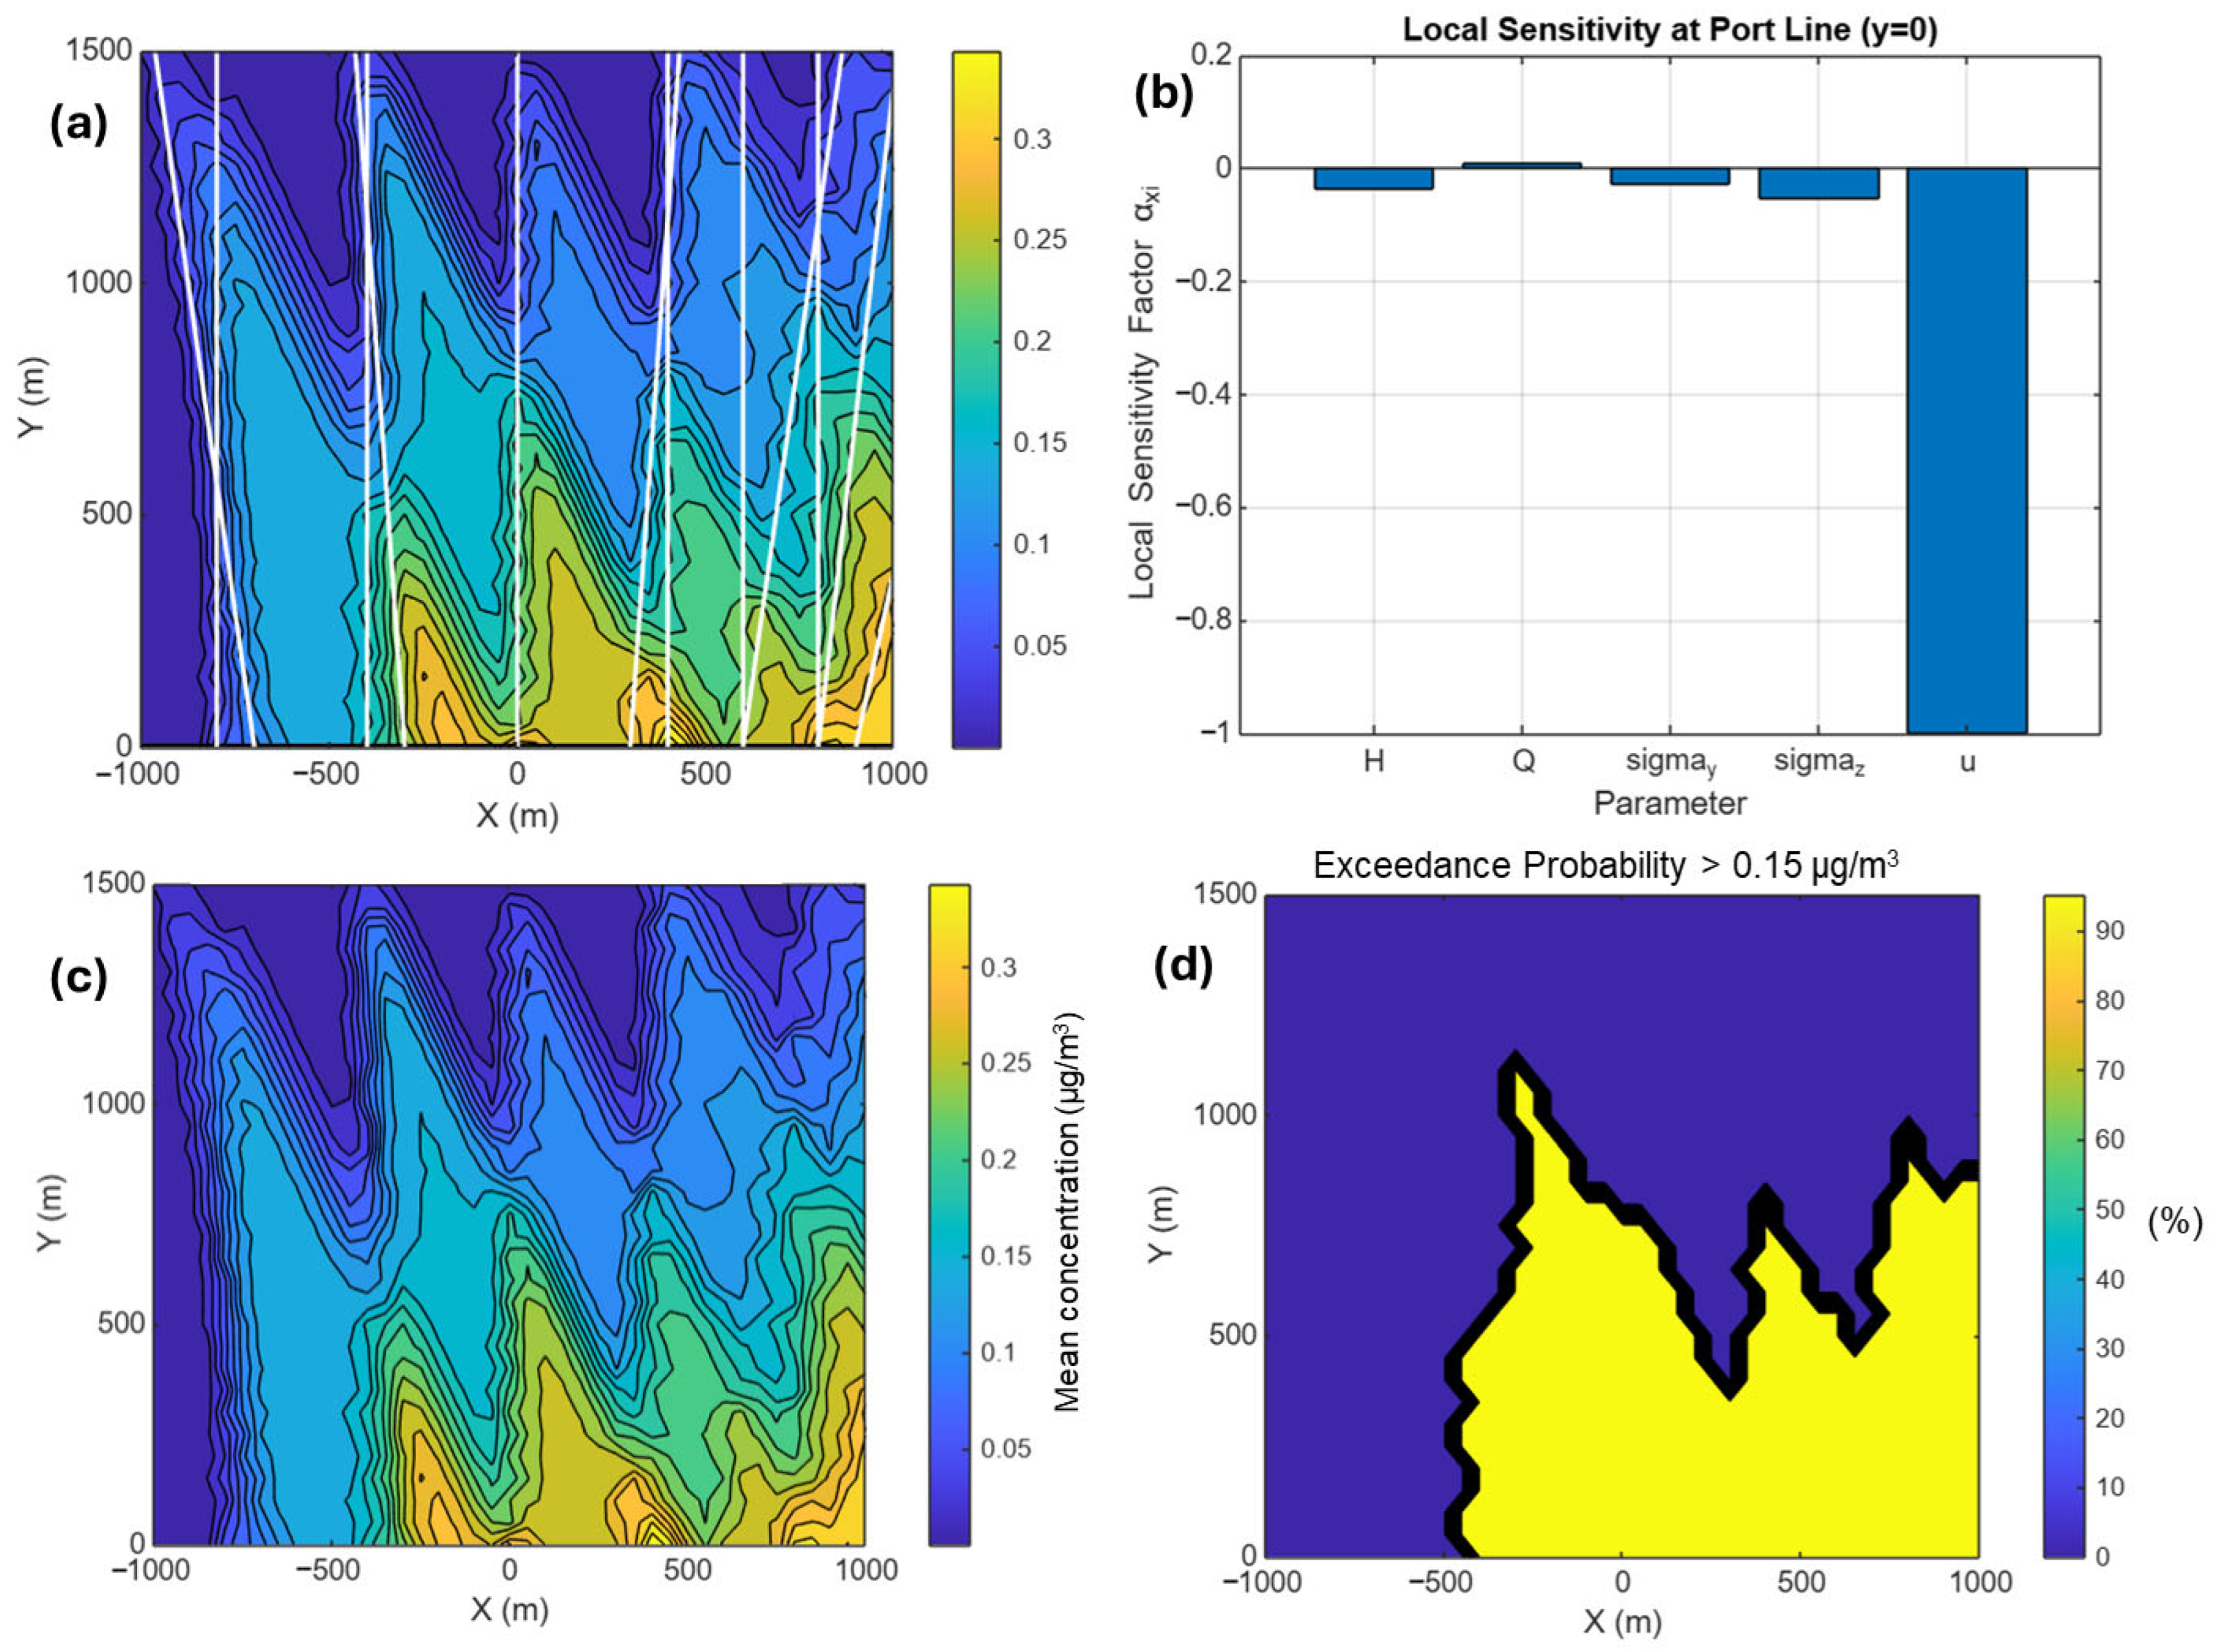
Figure 2a presents the cumulative emission concentration from the synthetic simulations, revealing distinct zones of elevated exposure downwind of the shipping corridor. The corresponding local sensitivity analysis along the port line (Figure 2b) highlights strong spatial gradients, indicating that small changes in receptor location can lead to significant differences in cumulative exposure. Mean concentration levels (Figure 2c) smooth out short-term fluctuations but still retain the imprint of dominant ship pathways, while exceedance probabilities (Figure 2d) emphasise the stochastic nature of exposure, particularly in regions intermittently affected by plume overlap. These results confirm that cumulative and probabilistic metrics provide complementary insights beyond instantaneous concentration snapshots and justify their inclusion in subsequent real-world analyses.
Figure 2.
(a) Cumulative emission concentration of NOx emission, (b) local sensitivity along the port line, (c) mean concentration, and (d) exceedance probability, obtained from synthetic ship emission simulations.
4.2. AIS-Based Vessel Traffic Characteristics in the Ports of Los Angeles and Long Beach
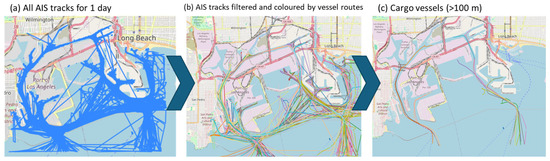
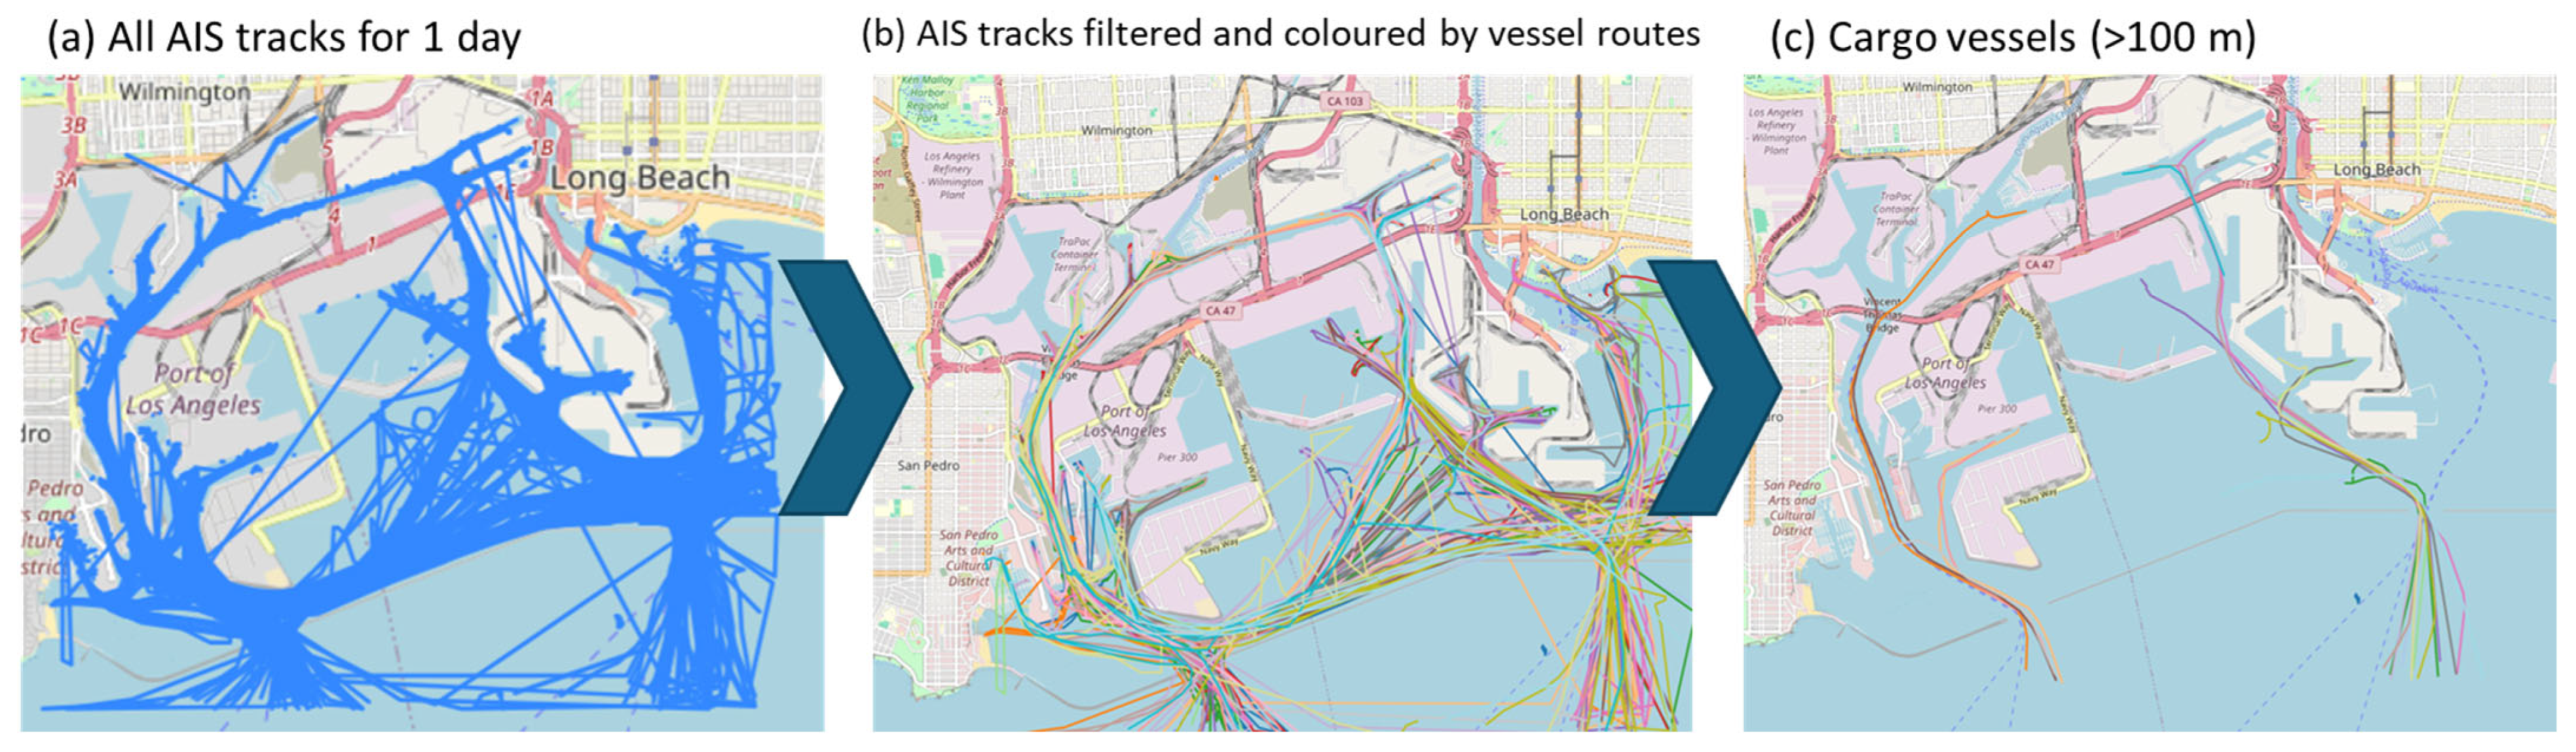
The model’s real-world application is based on AIS data from the Ports of Los Angeles and Long Beach for 24 April 2024 (a sample date used to evaluate the model). Modelling parameters and assumptions were listed in Table 1. Figure 3 illustrates the successive filtering stages applied to the raw AIS dataset. The complete dataset (Figure 3a), comprising over 100,000 AIS records, reveals intense traffic density and complex navigation patterns within the port area. After filtering and trajectory reconstruction, individual vessel routes become clearly identifiable (Figure 3b), highlighting major shipping lanes, turning basins, and anchorage zones. Further filtering was applied to isolate cargo vessels with a length greater than 100 m (Figure 3c), which account for the majority of ship-related emissions due to their higher engine power and longer operational times.
Table 1.
Modelling parameters and assumptions.
Figure 3.
Spatial distribution and filtering stages of AIS vessel traffic data for the Ports of Los Angeles and Long Beach on 24 April 2024, (a) complete AIS dataset including all vessels with reported positions during the selected day (over 100,000 AIS records), (b) filtered AIS dataset with individual vessel routes distinguished by colour, illustrating traffic density and navigation patterns within the port area, and (c) further filtered dataset showing only cargo vessels with a length greater than 100 m, which constitute the primary emission sources considered in the dispersion modelling.
The operational characteristics adopted for cargo vessels in the dispersion modelling framework are summarized in Table 2. Representative values of main engine power, design speed, fuel type, and emission factors were selected to reflect typical operating conditions of large cargo vessels navigating port environments. Marine distillate fuels (MDO/MGO) with a sulphur content of 0.1% were considered, in line with current ECA regulations applicable to the Ports of Los Angeles and Long Beach. PM variable represents total exhaust PM emitted from marine diesel engines. Size-resolved particulate fractions such as PM10 or PM2.5 are not explicitly distinguished in the modelling framework because particulate emissions were estimated using representative emission factors expressed in g/kWh. Previous studies indicate that marine diesel exhaust particles are predominantly in the fine particulate range (PM2.5), suggesting that the simulated PM fields are broadly representative of PM2.5 emissions. These parameters provide a consistent and realistic basis for estimating speed-dependent emission rates and subsequent pollutant dispersion. While individual vessel characteristics may vary, the selected values allow the analysis to focus on the influence of traffic patterns, vessel operations, and atmospheric dispersion processes on cumulative air quality impacts.
Table 2.
Operational characteristics of the cargo vessels.
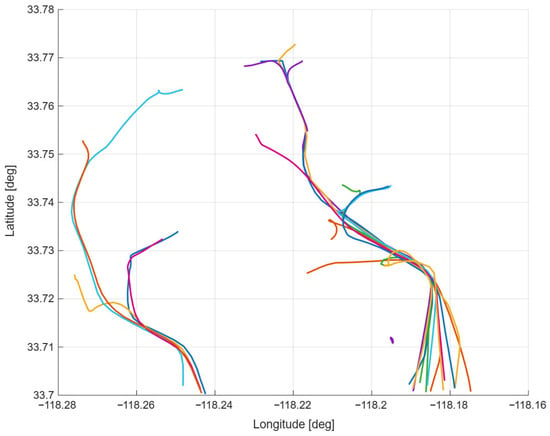
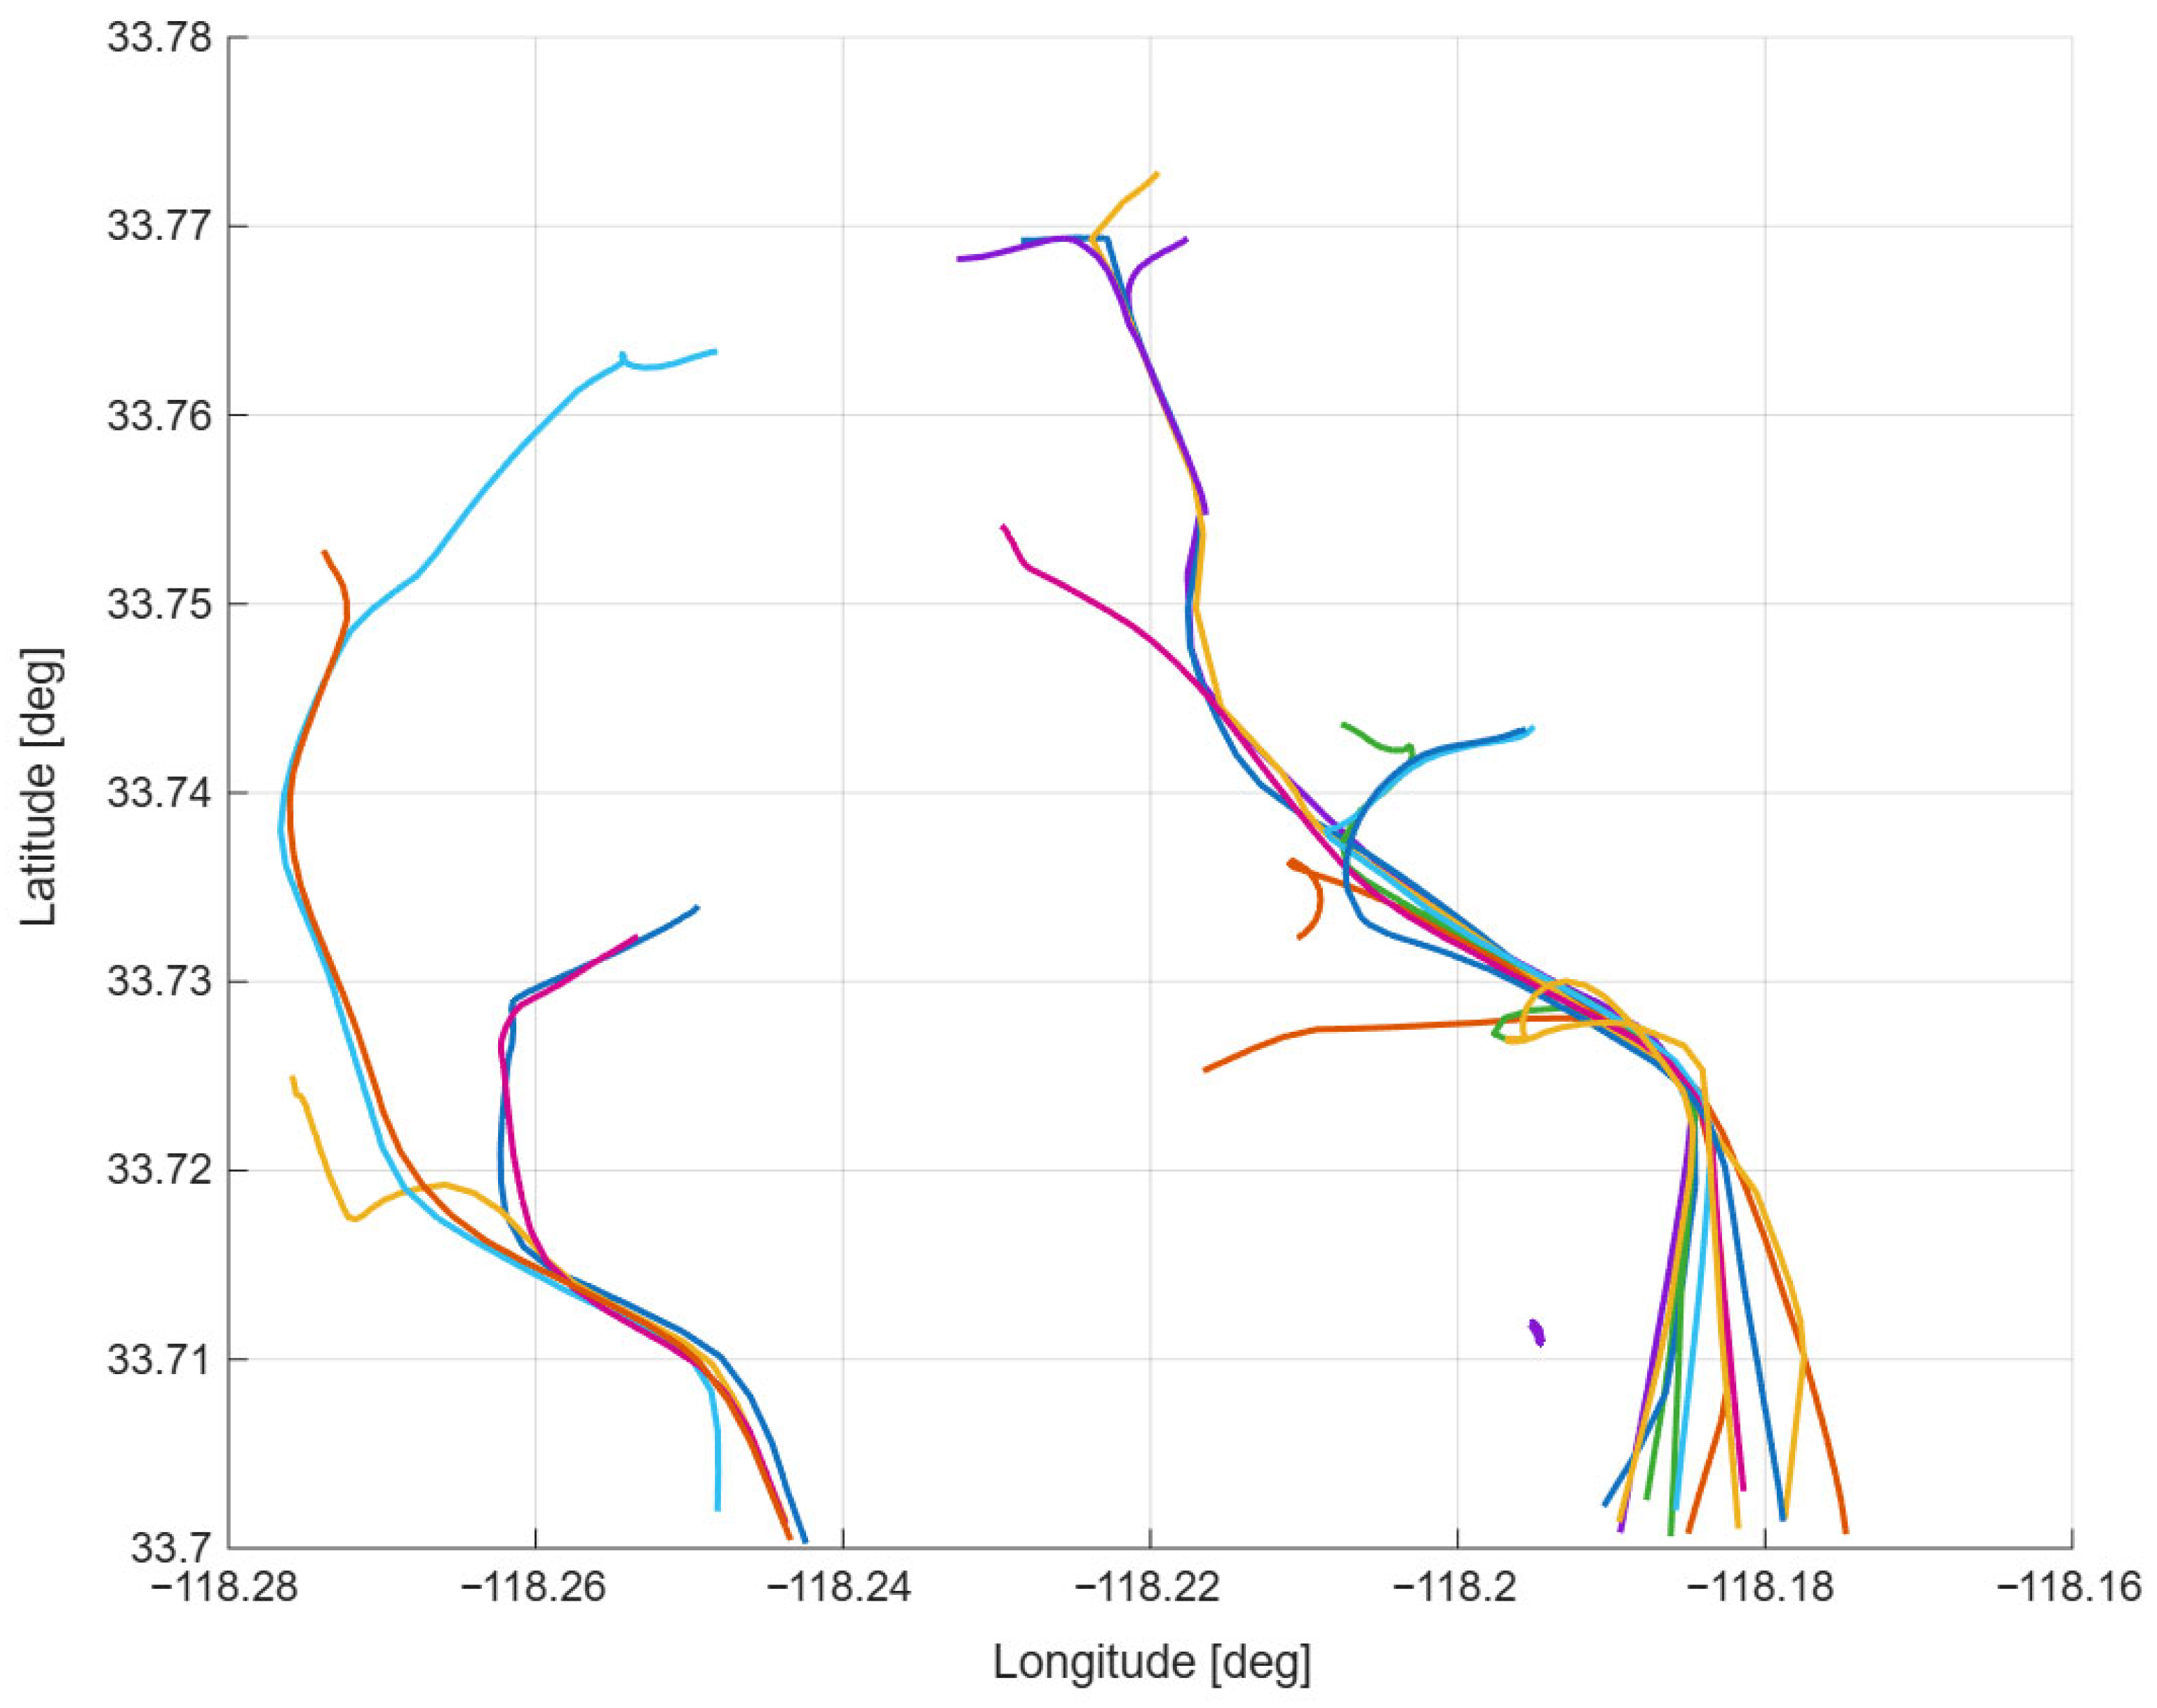
The reconstructed trajectories of these vessels over 24 h are shown in Figure 4, revealing pronounced queuing behaviour and repeated low-speed manoeuvres near port entrances and terminal areas. These operational characteristics play a critical role in shaping nearshore emission patterns and subsequent pollutant dispersion.
Figure 4.
Reconstructed AIS-based trajectories of cargo vessels with a length greater than 100 m in the Ports of Los Angeles and Long Beach for 24 h.
To ensure the robustness and physical consistency of the dispersion framework, a structured sensitivity analysis was conducted to quantify the influence of key modelling parameters on cumulative exposure estimates. The sensitivity analysis shows that decreasing emission height from 30 m to 20 m increases cumulative exposure by approximately 16.87%, while increasing it to 40 m reduces exposure by about 13.69% (Table 3). In contrast, temporal resolution variations (1–10 min) produce deviations below 7%, demonstrating numerical stability of the moving-source Gaussian formulation with respect to time discretization (Table 4).
Table 3.
Sensitivity of cumulative NOx exposure to emission height (Δt = 5 min).
Table 4.
Sensitivity to temporal resolution (H = 30 m).
An effective emission height of 30 m and a temporal resolution of 5 min were adopted as the baseline configuration for the study. The 30 m height represents a physically realistic average stack elevation for large commercial vessels operating under port conditions, while avoiding near-field overestimation associated with lower release heights. Similarly, the interpolation interval of 5 min strikes a balance between computational efficiency and numerical accuracy, as finer resolutions yielded only marginal improvements at increased computational cost.
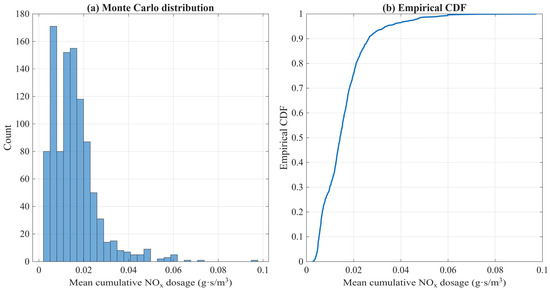
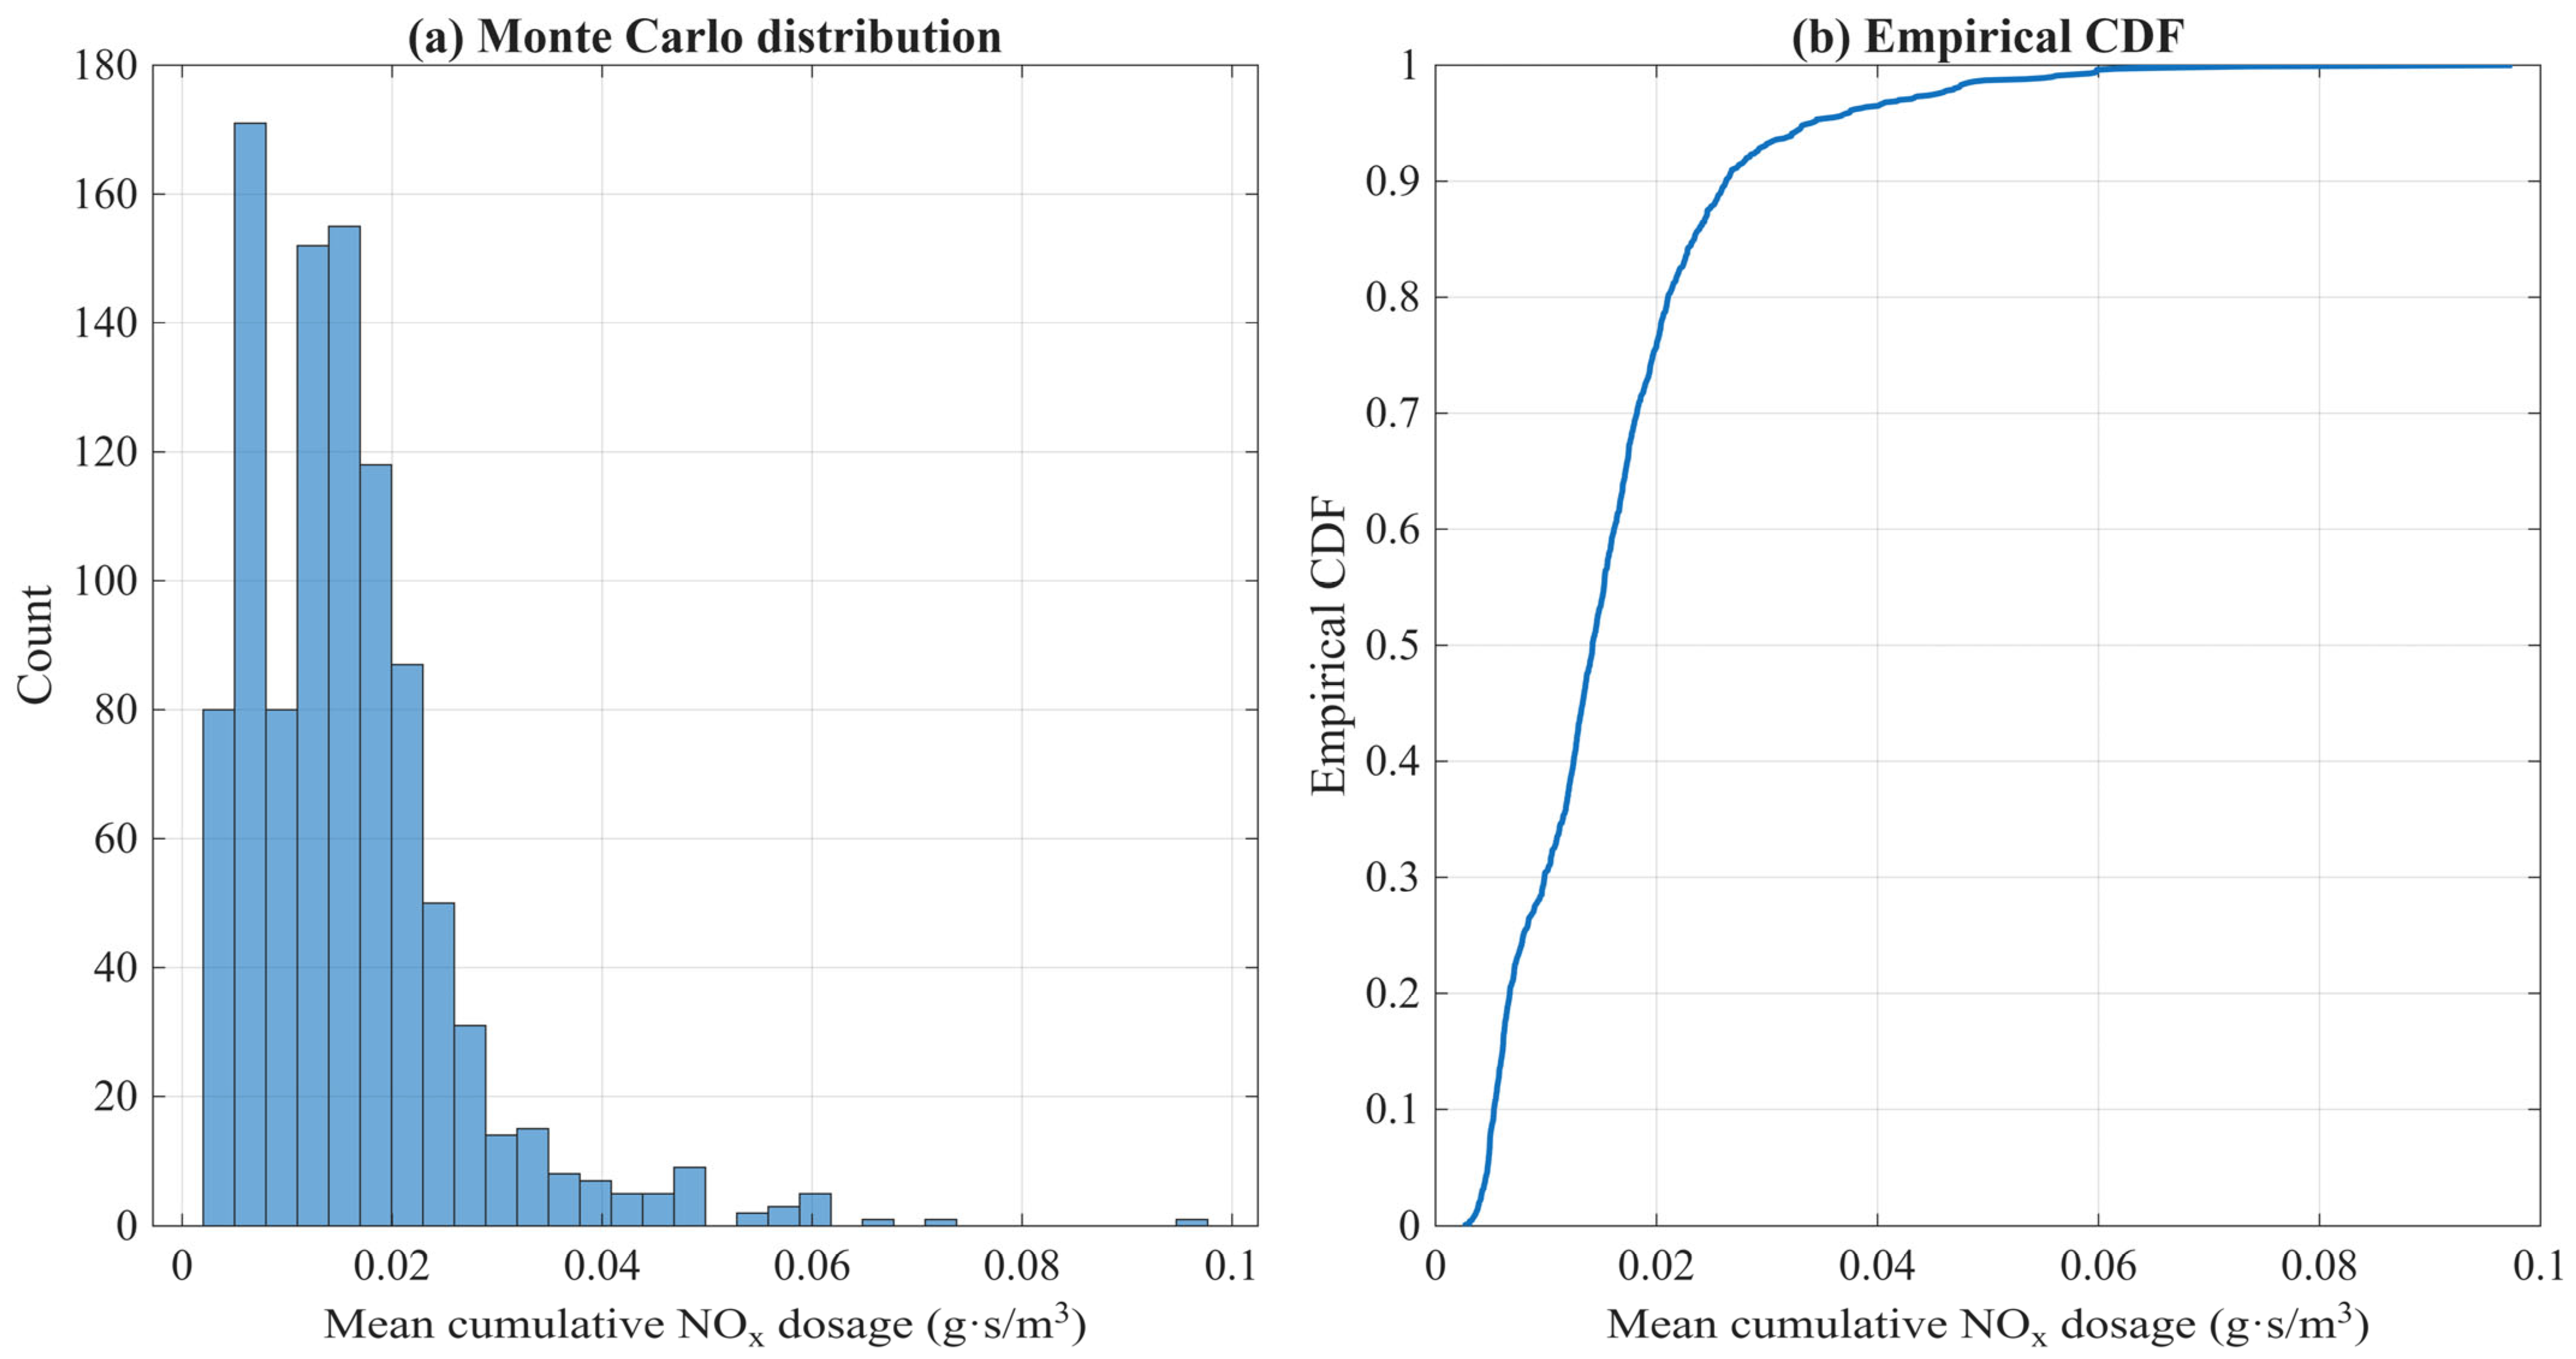
The results of the Monte Carlo uncertainty analysis performed for the mean cumulative NOx dosage over the 24 h simulation period are presented in Figure 5. A total of 1000 realizations were generated by perturbing emission factors, wind speed, wind direction and effective emission height. The histogram shown in Figure 5a illustrates the probability distribution of the domain-averaged cumulative NOx. The distribution exhibits a positive skewness, reflecting the multiplicative nature of uncertainties in emission factors and meteorological parameters. Most realizations cluster within a relatively narrow range around the baseline value, while a small number of higher-end outcomes generate an extended right-hand tail. This behaviour indicates that extreme exposure scenarios, although infrequent, remain physically plausible under combined uncertainty conditions. The empirical cumulative distribution function (CDF) in Figure 5b further quantifies the probabilistic behaviour of the model output. The steep slope in the central portion of the CDF indicates moderate dispersion around the median value, whereas the gradual asymptotic approach toward unity reflects diminishing probability of extremely high-concentration outcomes. The 95% confidence interval derived from the ensemble demonstrates that uncertainty in emission factors and wind conditions introduces bounded but non-negligible variability in cumulative exposure estimates. Overall, the Monte Carlo analysis confirms that while stochastic variability affects the magnitude of predicted cumulative exposure, the dispersion framework remains numerically stable and does not exhibit uncontrolled sensitivity to input perturbations. The results support the robustness of the AIS-driven Gaussian modelling approach under realistic ranges of operational and meteorological uncertainty.
Figure 5.
Monte Carlo uncertainty analysis of domain-averaged cumulative NOx dosage, (a) histogram of 1000 realizations and (b) corresponding empirical CDF.
4.3. Cumulative Emission Dispersion Patterns
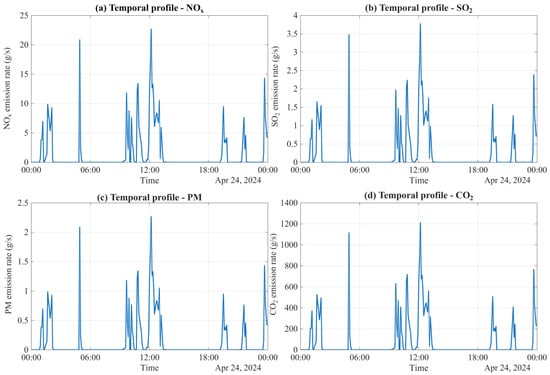
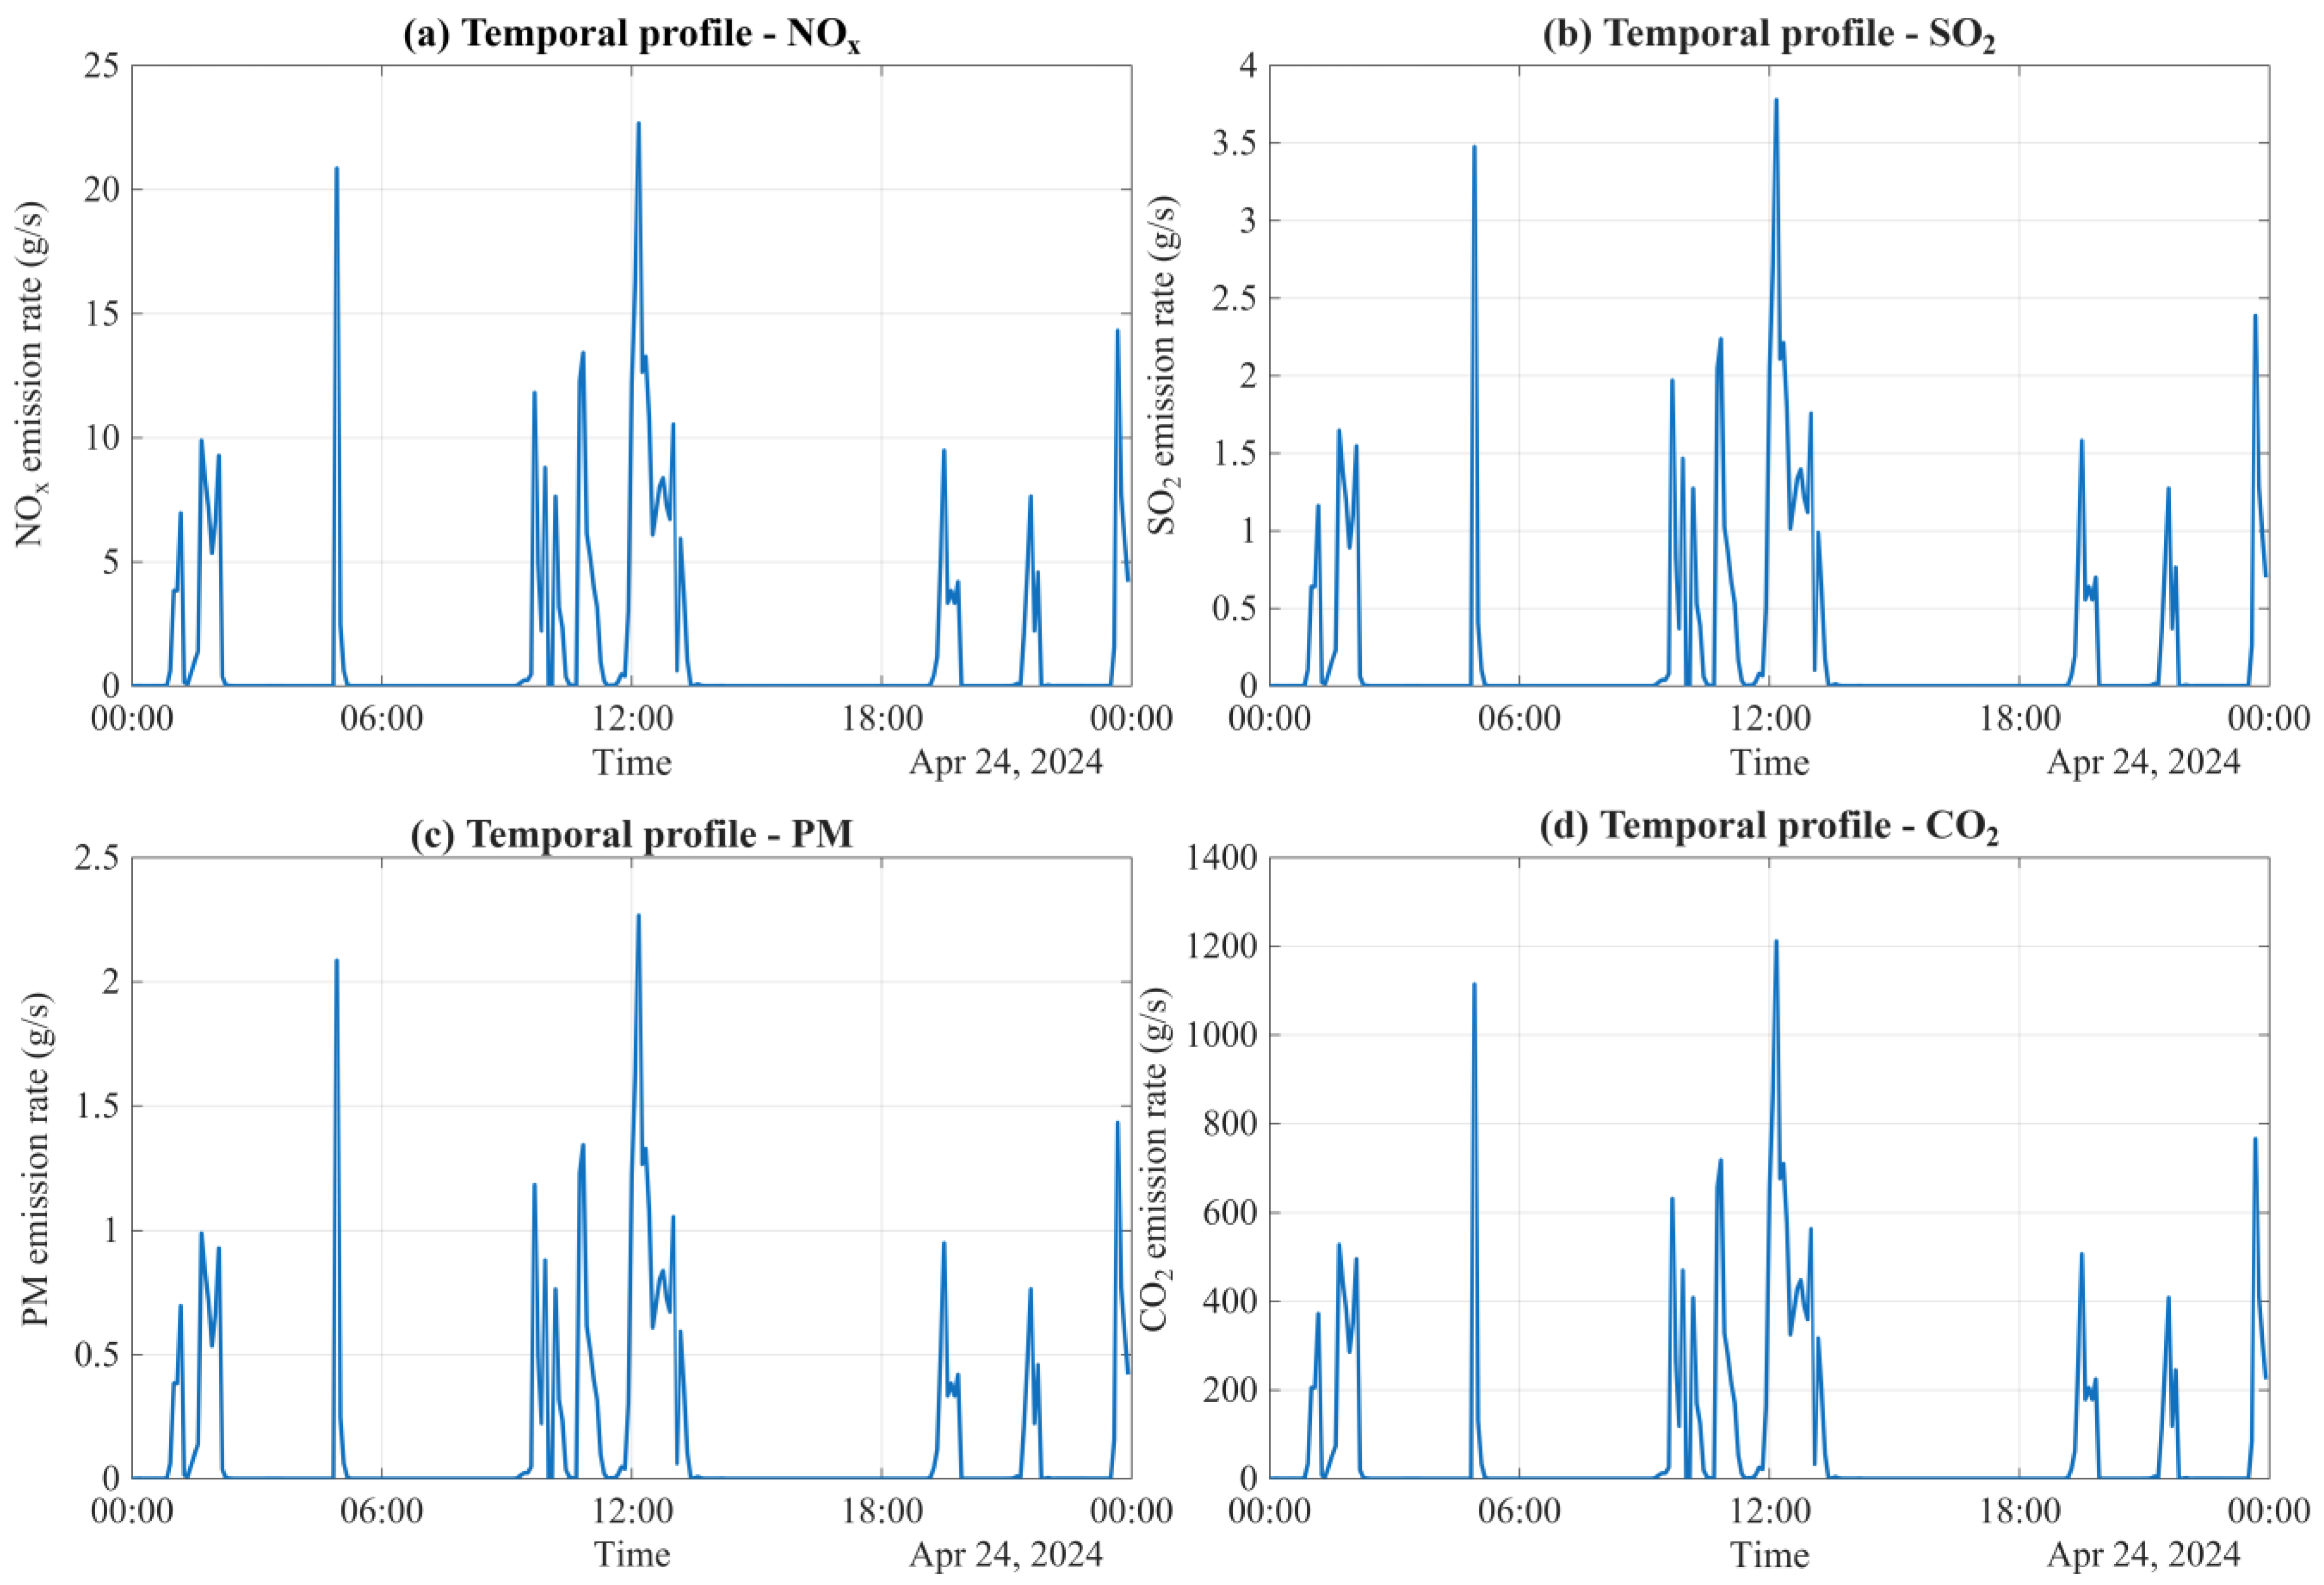
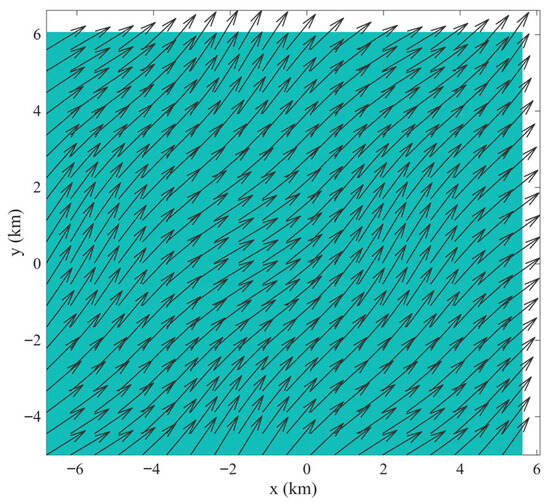
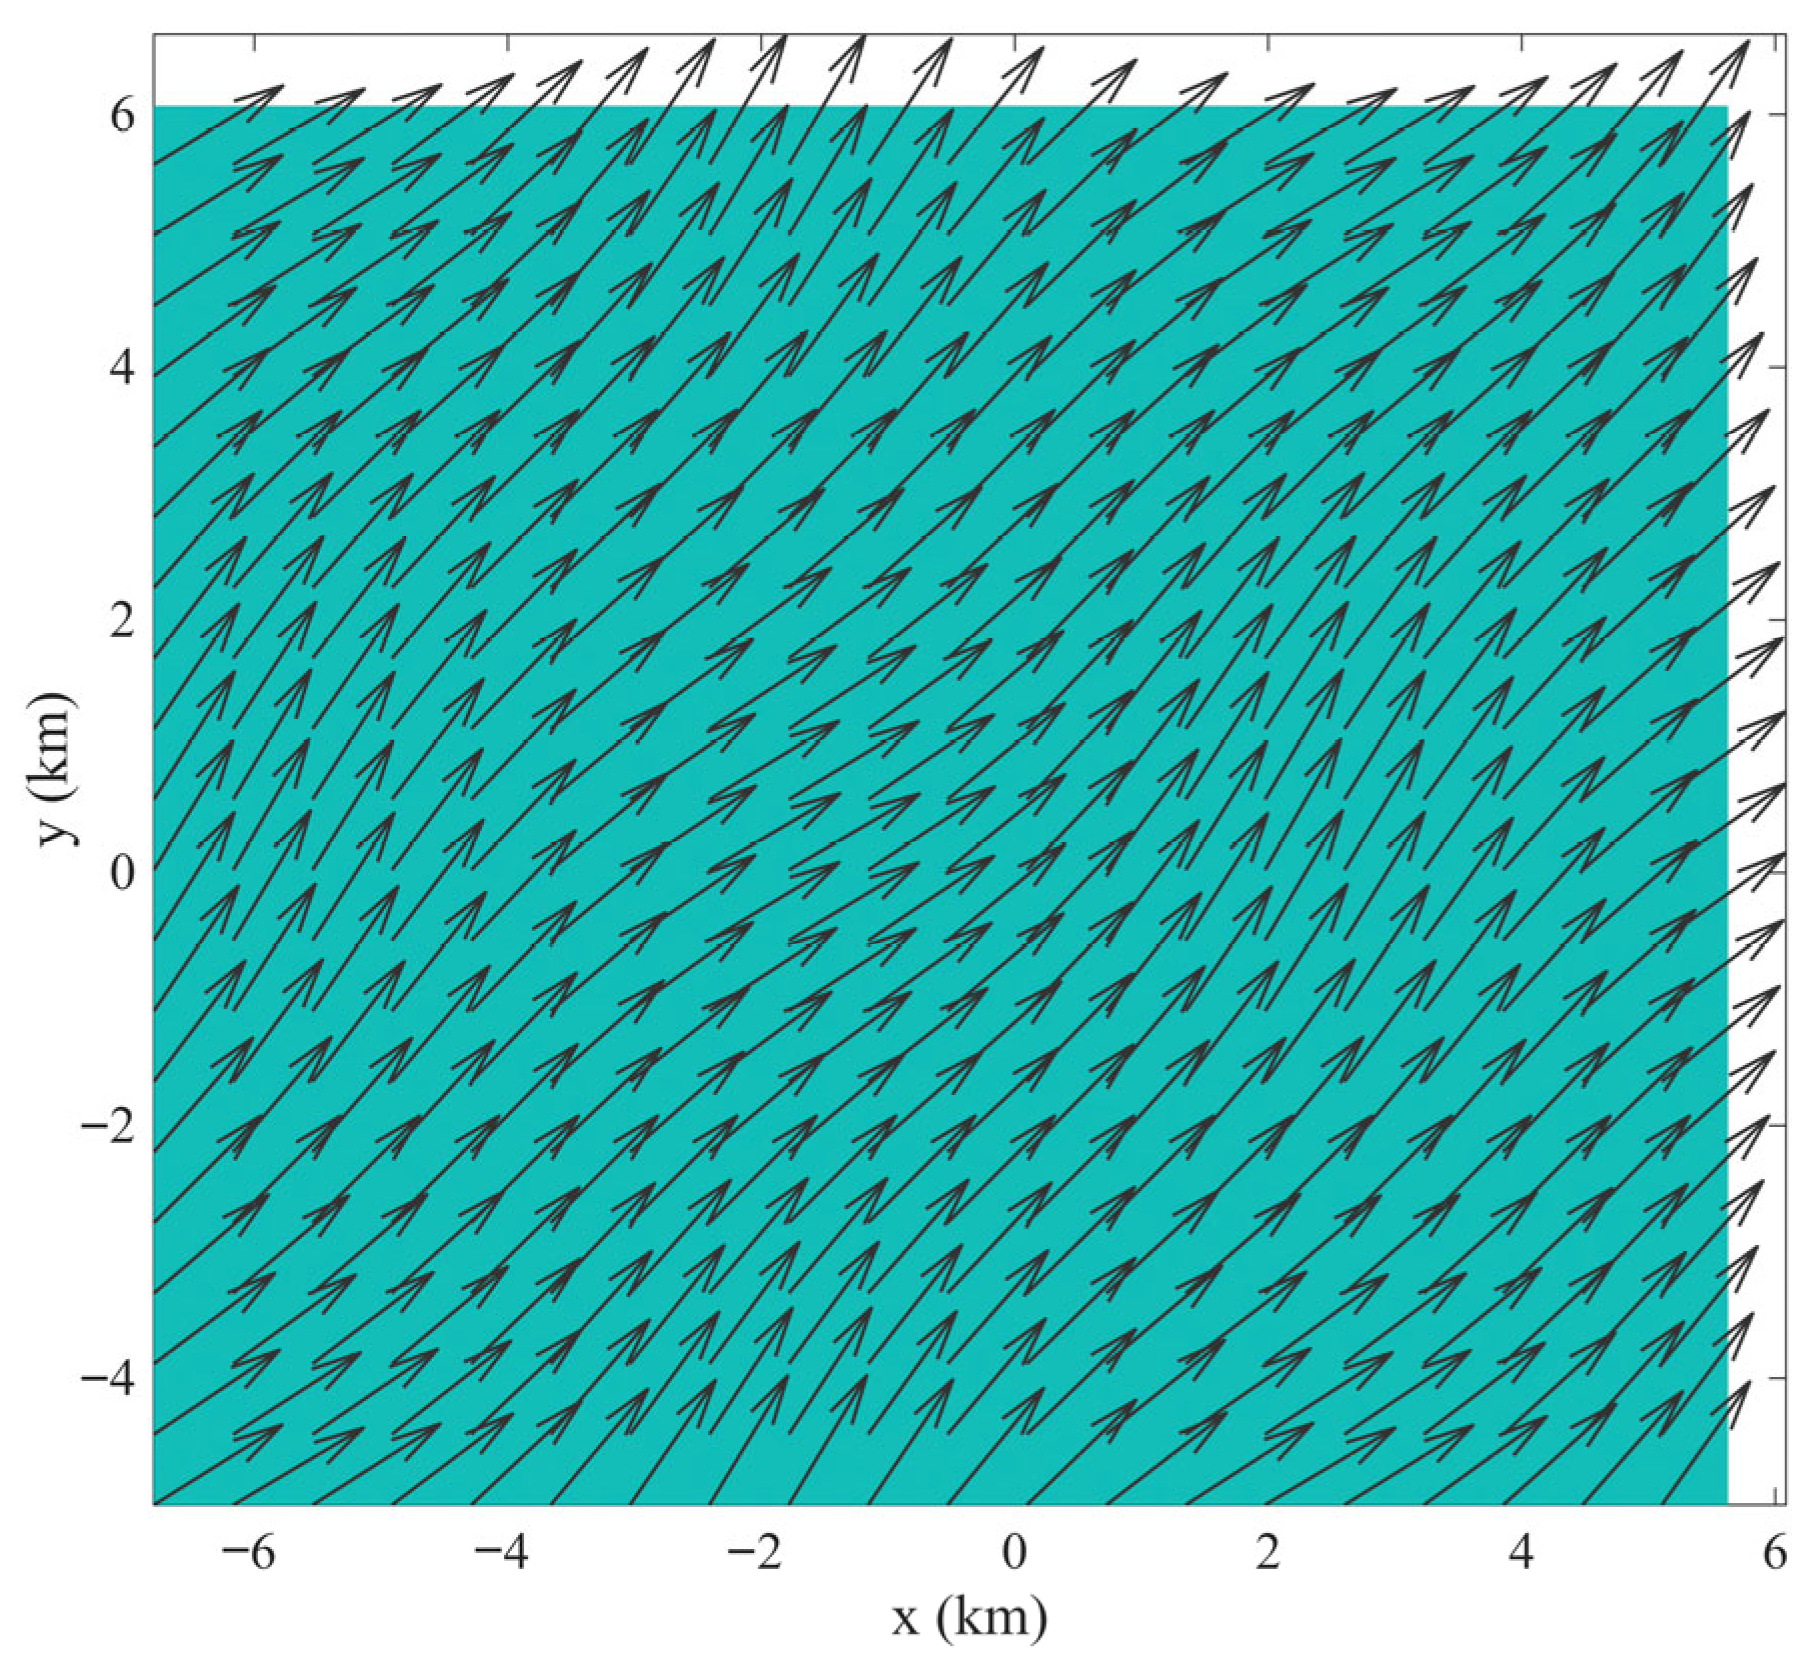
The cumulative impact of ship emissions in port environments is governed by the interaction between time-varying emission rates and prevailing meteorological forcing. Figure 6 illustrates the 24 h temporal evolution of aggregated emission rates for NOx, SO2, PM, and CO2 from cargo vessels longer than 100 m. Emission activity is highly intermittent, with pronounced spikes corresponding to manoeuvring, queuing, and reduced-speed operations. Peak emission rates reach approximately 23 g/s for NOx, 3.8 g/s for SO2, 2.2 g/s for total PM, and 1200 g/s for CO2. These synchronized peaks reflect the cubic speed–power relationship embedded in the emission estimation framework, whereby small variations in operational speed produce disproportionately large changes in emission intensity. When coupled with the applied northeasterly wind field (Figure 7), these episodic emission bursts generate elongated plume structures that systematically advect toward the southwestern shoreline sector. The relatively stable wind direction during the simulation period promotes coherent plume alignment, resulting in spatial accumulation along preferred transport corridors rather than isotropic dispersion. This behaviour highlights the strong directional control exerted by synoptic-scale wind forcing on near-field exposure patterns.
Figure 6.
Temporal profile of total (a) NOx, (b) SO2, (c) total PM, and (d) CO2 emissions aggregated from all cargo vessels in the Ports of Los Angeles and Long Beach over the 24 h simulation period.
Figure 7.
Spatially varying wind field applied as meteorological input to the dispersion model.
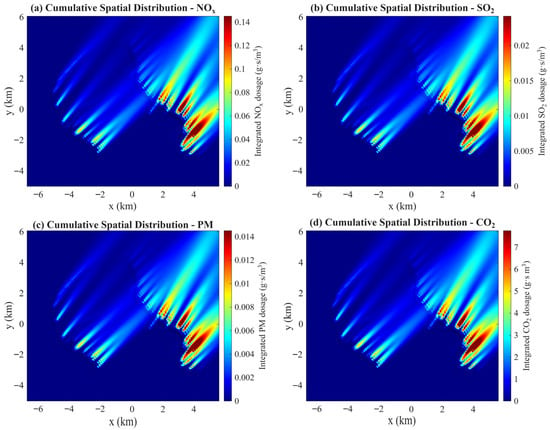
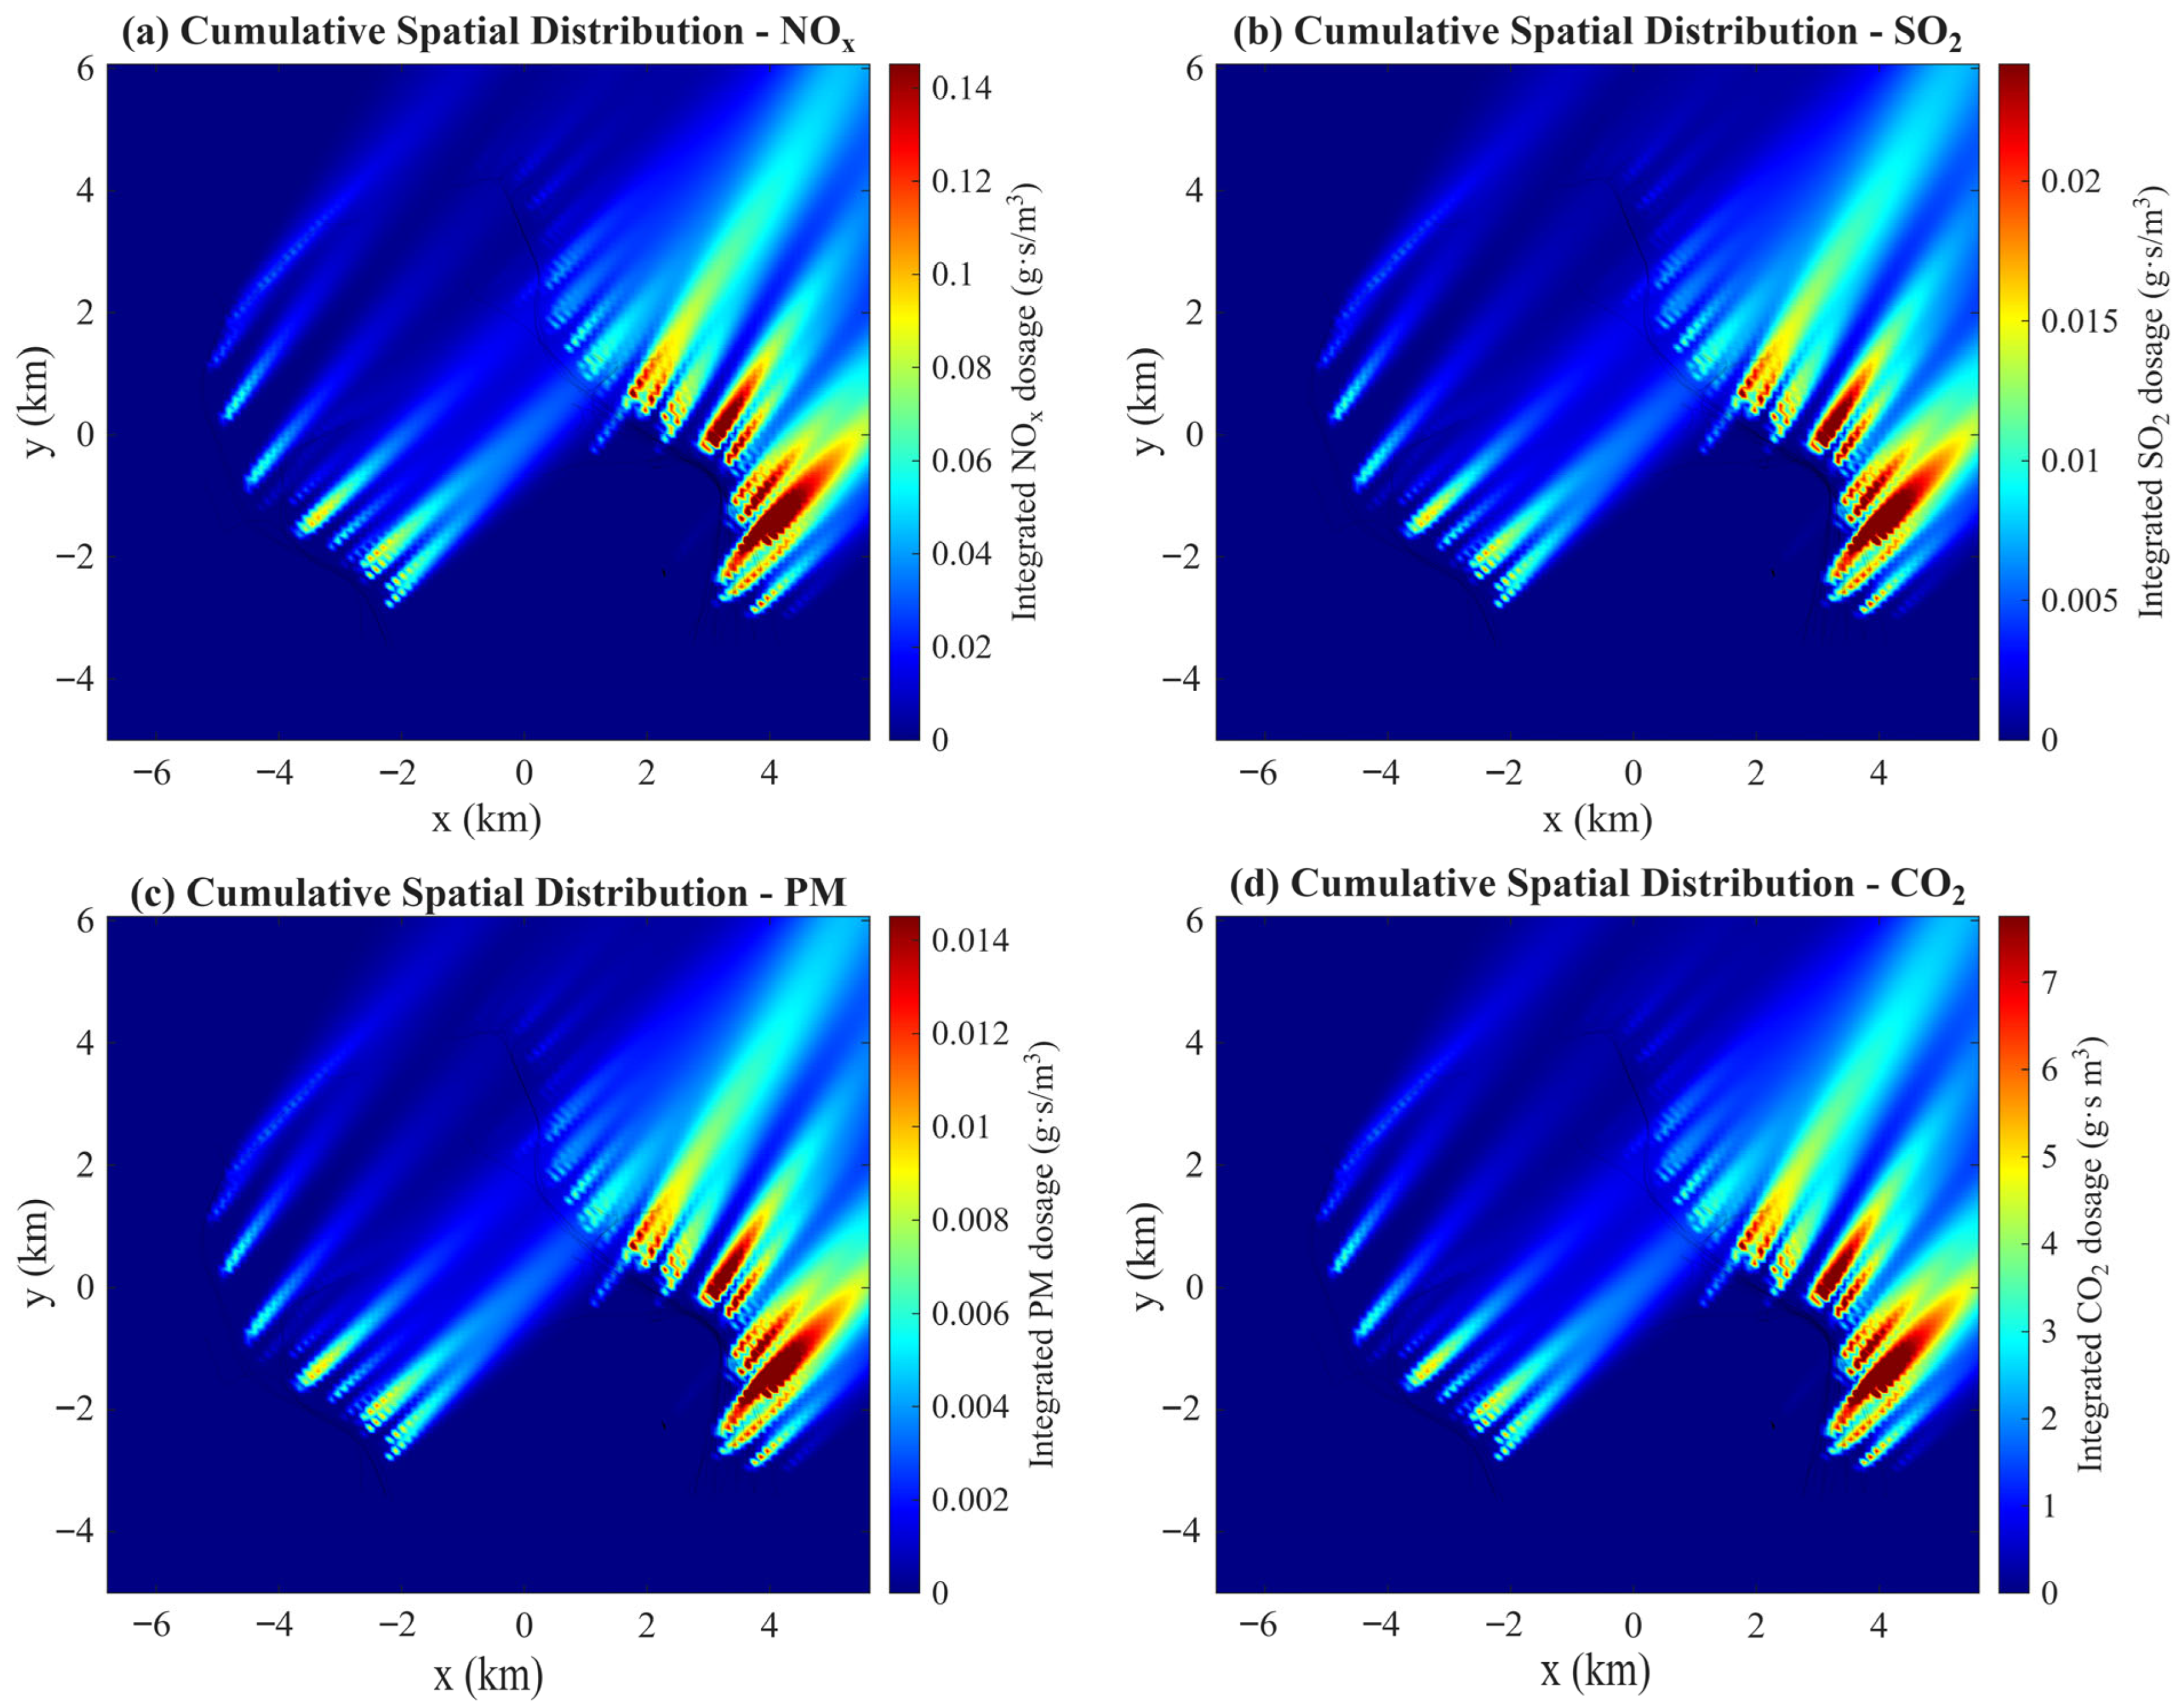
The temporally integrated concentration maps presented in Figure 8 reveal clear spatial gradients for all pollutants. Maximum cumulative dosages reach approximately 0.145 g·s/m3 for NOx, 0.023 g·s/m3 for SO2, 0.014 g·s/m3 for total PM, and 7.5 g·s/m3 for CO2 within near-port zones characterized by dense traffic and reduced vessel speeds. High-exposure regions are concentrated along berthing and approach channels, where repeated plume overlap occurs due to persistent traffic density and aligned wind advection. The spatial similarity observed among the NOx, SO2, total PM, and CO2 concentration fields reflects the common dispersion formulation used for all pollutants in the Gaussian transport model. Because the model accounts only for physical advection and atmospheric dispersion of primary emissions, the resulting plume structures are primarily governed by vessel trajectories and prevailing meteorological transport conditions. Differences among pollutant fields, therefore, arise mainly from variations in emission magnitudes rather than pollutant-specific atmospheric processes. These findings demonstrate that cumulative exposure patterns cannot be inferred from instantaneous peak concentrations alone. While short-term maxima are often associated with transient plume-alignment events, cumulative maps integrate the effects of traffic density, operational duration, and repeated plume superposition. Consequently, temporally integrated concentration fields provide a more stable and policy-relevant representation of chronic exposure zones in port-adjacent areas.
Figure 8.
Cumulative spatial distribution of integrated (a) NOx, (b) SO2, (c) total PM, and (d) CO2 over the 24 h simulation period for cargo vessel emissions in the Ports of Los Angeles and Long Beach.
Receptor-based analysis further quantifies these impacts at locations of regulatory and practical relevance. Hourly mean concentrations exhibit substantial variability, particularly during morning and midday activity peaks, whereas cumulative exposure metrics reflect the persistence of low-speed vessel operations and queuing behaviour. The results confirm that operational congestion, even at moderate instantaneous emission rates, can contribute significantly to total daily exposure through prolonged emission duration. This underscores the importance of incorporating time integration in exposure-oriented assessments. From a management perspective, the results indicate that operational measures, such as optimized arrival scheduling, speed harmonization near port entrances, and reduced anchorage waiting times, can substantially mitigate cumulative exposure without requiring immediate technological retrofitting. Because plume structure is largely dictated by vessel activity patterns and wind alignment, targeted traffic coordination strategies may effectively reduce repeated plume overlap in sensitive shoreline zones.
Overall, the integration of AIS-derived vessel dynamics with a time-dependent stochastic Gaussian dispersion framework provides a physically consistent and computationally efficient tool for evaluating both instantaneous and cumulative air-quality impacts. The approach enables the identification of chronic exposure hotspots, the quantification of probabilistic risk bounds, and the scenario-based evaluation of operational mitigation strategies, thereby supporting evidence-based and risk-informed port management decisions.
5. Conclusions
This study developed and implemented a time-dependent, AIS-based stochastic air-quality modelling framework to evaluate the impacts of ship emissions in a port environment. By representing each vessel as a moving emission source and coupling dynamic AIS-based operational data with a Gaussian dispersion model, the framework provides high-resolution spatio-temporal concentration maps of air pollutant distribution in complex port environments. Unlike conventional static emission inventories, the proposed approach explicitly accounts for vessel kinematics and speed-dependent emission rates derived from a cubic speed–power relationship. Atmospheric stability effects are incorporated through stability-dependent dispersion parameters, while wind forcing is implemented under a representative prevailing-direction scenario to enable controlled interpretation of near-field dispersion behaviour. Within this defined case-study configuration, the model quantifies short-term peak concentrations and cumulative exposure patterns associated with queuing, manoeuvring, and slow-moving vessels.
The receptor-based exposure module further translates concentration fields into regulatory metrics, including hourly averages and cumulative exposure indicators, facilitating hotspot identification and operational impact assessment. Sensitivity and uncertainty analyses demonstrate that emission height exerts a stronger influence on near-field exposure than temporal resolution, while stochastic simulations provide confidence bounds for predicted concentration levels.
It is important to emphasize that the present work represents a methodological and quantitative exposure assessment framework rather than a long-term climatological or compliance validation study. The Gaussian dispersion formulation adopted in this work is based on well-established atmospheric transport models that have been extensively validated in previous experimental and field studies. While the Gaussian dispersion formulation employed is widely validated in atmospheric modelling literature, direct comparison with synchronized in-situ monitoring data was not possible for the selected simulation period. Future research will focus on incorporating variable meteorological fields, chemical transformation processes, and observational datasets to enable model-measurement evaluation and further enhance predictive capability.
Overall, the AIS-based stochastic dispersion framework provides a structured and adaptable methodology for linking real vessel activity to exposure metrics in port environments. By integrating operational dynamics with quantitative uncertainty characterization, the approach offers a technically grounded basis for supporting emission management strategies and evidence-informed maritime environmental planning.
Author Contributions
R.Ş. and Y.G. contributed to the conceptualization, methodology, and implementation of this study, to the analysis of the results, and to the writing of the manuscript. All authors have read and agreed to the published version of the manuscript.
Funding
This research received no external funding.
Data Availability Statement
The original contributions presented in this study are included in the article. Further inquiries can be directed to the corresponding author.
Acknowledgments
The authors gratefully acknowledge the EU COST (European Cooperation in Science and Technology) Action CA23159, DeWaTra (Decarbonizing Waterborne Transportation), for supporting scientific networking, knowledge exchange, and collaborative research activities that contributed to the development of this study.
Conflicts of Interest
The authors declare no conflicts of interest.
References
- Mohammadpour, J.; Salehi, F. A Review of Alternative Liquid Fuels in Marine Engines. Appl. Energy Combust. Sci. 2025, 24, 100394. [Google Scholar] [CrossRef] [Scilit]
- Islam, S.; Toma, L.T.; Bhowmik, R.C.; Ridwan, M.; Hossain, M.E.; Esquivias, M.A. From Ports to Power Grids: Evaluating the Environmental Implications of Shipping Activity, Electrification, and Human Capital in G-20 Countries. Transp. Res. Interdiscip. Perspect. 2025, 34, 101719. [Google Scholar] [CrossRef] [Scilit]
- Alshareef, M.H.; Alghanmi, A.F. Optimizing Maritime Energy Efficiency: A Machine Learning Approach Using Deep Reinforcement Learning for EEXI and CII Compliance. Sustainability 2024, 16, 10534. [Google Scholar] [CrossRef] [Scilit]
- Ravi, S.S.; Osipov, S.; Turner, J.W.G. Impact of Modern Vehicular Technologies and Emission Regulations on Improving Global Air Quality. Atmosphere 2023, 14, 1164. [Google Scholar] [CrossRef] [Scilit]
- Gülcan, H.E.; Gültekin, N.; Ciniviz, M. Experimental Investigation of the Effect of Variable Valve Lift on Combustion Stability and Exhaust Emissions in a Diesel/Methane CRDI Engine. Energy 2024, 300, 131603. [Google Scholar] [CrossRef] [Scilit]
- Wang, Y.; Wang, G.; Yang, L.; Chen, G.; He, S. Intelligent Optimization of Diesel Engine Selective Catalytic Reduction Urea Injection Based on Multi-Model State Estimation to Reduce NH3 Slip and NOx Emission. Fuel 2024, 365, 131188. [Google Scholar] [CrossRef] [Scilit]
- Şener, R.; Gül, M.Z. Optimization of the Combustion Chamber Geometry and Injection Parameters on a Light-Duty Diesel Engine for Emission Minimization Using Multi-Objective Genetic Algorithm. Fuel 2021, 304, 121379. [Google Scholar] [CrossRef] [Scilit]
- Garbatov, Y.; Georgiev, P.; Yalamov, D. Risk-Based Retrofitting Analysis Employing the Carbon Intensity Indicator. Ocean. Eng. 2023, 289, 116283. [Google Scholar] [CrossRef] [Scilit]
- Lee, H.; Park, D.; Choo, S.; Pham, H.T. Estimation of the Non-Greenhouse Gas Emissions Inventory from Ships in the Port of Incheon. Sustainability 2020, 12, 8231. [Google Scholar] [CrossRef] [Scilit]
- Khayenzeli, A.W.; Son, W.-J.; Jo, D.-J.; Cho, I.-S. An AIS-Based Study to Estimate Ship Exhaust Emissions Using Spatio-Temporal Approach. J. Mar. Sci. Eng. 2025, 13, 922. [Google Scholar] [CrossRef] [Scilit]
- Logothetis, I.; Antonopoulou, C.; Zisopoulos, G.; Mitsotakis, A.; Grammelis, P. A Case Study of Air Quality and a Health Index over a Port, an Urban and a High-Traffic Location in Rhodes City. Air 2023, 1, 139–158. [Google Scholar] [CrossRef] [Scilit]
- Nguyen, P.N. Ship Emissions and Social Costs at Southeast Asian Container Ports. Transp. Saf. Environ. 2025, 7, tdaf067. [Google Scholar] [CrossRef] [Scilit]
- Dierickx, J.; Beyen, J.; Block, R.; Hamrouni, M.; Huyskens, P.; Meichelböck, C.; Verhelst, S. Strategies for Introducing Methanol as an Alternative Fuel for Shipping. In Proceedings of the 7th Transport Research Arena TRA 2018, Vienna, Austria, 16–19 April 2018; pp. 1–10. [Google Scholar]
- Xu, L.; Xu, S.; Bai, X.-S.; Repo, J.A.; Hautala, S.; Hyvönen, J. Performance and Emission Characteristics of an Ammonia/Diesel Dual-Fuel Marine Engine. Renew. Sustain. Energy Rev. 2023, 185, 113631. [Google Scholar] [CrossRef] [Scilit]
- Kanberoğlu, B.; Okumuş, F.; Sönmez, H.I.; Gonca, G.; Kökkülünk, G.; Kaya, C.; Aydin, Z. Performance Investigation and Emission Analysis of a Diesel Engine Operated on Hydrogen and Ammonia. Appl. Therm. Eng. 2025, 281, 128702. [Google Scholar] [CrossRef] [Scilit]
- Plessas, T.; Papanikolaou, A. Design Optimization and Assessment Platform for Wind-Assisted Ship Propulsion. J. Mar. Sci. Eng. 2025, 13, 1389. [Google Scholar] [CrossRef] [Scilit]
- Degiuli, N.; Martić, I.; Grlj, C.G. Slow Steaming as a Sustainable Measure for Low-Carbon Maritime Transport. Sustainability 2024, 16, 11169. [Google Scholar] [CrossRef] [Scilit]
- Xu, L.; Chen, Y. Overview of Sustainable Maritime Transport Optimization and Operations. Sustainability 2025, 17, 6460. [Google Scholar] [CrossRef] [Scilit]
- Buccolieri, R.; Cesari, R.; Dinoi, A.; Maurizi, A.; Tampieri, F.; Sabatino, S. Di Impact of Ship Emissions on Local Air Quality in a Mediterranean City’s Harbour after the European Sulphur Directive. Int. J. Environ. Pollut. 2016, 59, 30. [Google Scholar] [CrossRef] [Scilit]
- Hanaoka, T.; Masui, T. Exploring Effective Short-Lived Climate Pollutant Mitigation Scenarios by Considering Synergies and Trade-Offs of Combinations of Air Pollutant Measures and Low Carbon Measures towards the Level of the 2 °C Target in Asia. Environ. Pollut. 2020, 261, 113650. [Google Scholar] [CrossRef] [Scilit] [PubMed]
- Grigoriadis, A.; Mamarikas, S.; Ntziachristos, L. Quantitative Impact of Decarbonization Options on Air Pollutants from Different Ship Types. Transp. Res. D Transp. Environ. 2024, 133, 104316. [Google Scholar] [CrossRef] [Scilit]
- Garbatov, Y.; Georgiev, P. Risk-Based Conceptual Ship Design of a Bulk Carrier Accounting for Energy Efficiency Design Index (EEDI). Int. J. Marit. Eng. 2021, 163, 51–62. [Google Scholar] [CrossRef] [Scilit]
- Garbatov, Y.; Georgiev, P. Advances in the Prevention of Shipping-Related Air Pollution. Energies 2024, 17, 5991. [Google Scholar] [CrossRef] [Scilit]
- Kota, S.H.; Ying, Q.; Zhang, Y. Simulating Near-Road Reactive Dispersion of Gaseous Air Pollutants Using a Three-Dimensional Eulerian Model. Sci. Total Environ. 2013, 454–455, 348–357. [Google Scholar] [CrossRef] [Scilit] [PubMed]
- Coirier, W.J.; Fricker, D.M.; Furmanczyk, M.; Kim, S. A Computational Fluid Dynamics Approach for Urban Area Transport and Dispersion Modeling. Environ. Fluid Mech. 2005, 5, 443–479. [Google Scholar] [CrossRef] [Scilit]
- Brusca, S.; Famoso, F.; Lanzafame, R.; Mauro, S.; Garrano, A.M.C.; Monforte, P. Theoretical and Experimental Study of Gaussian Plume Model in Small Scale System. Energy Procedia 2016, 101, 58–65. [Google Scholar] [CrossRef] [Scilit]
- Cesari, R.; Buccolieri, R.; Dinoi, A.; Maurizi, A.; Landi, T.C.; Di Sabatino, S. Influence of Ship Emissions on Ozone Concentration in a Mediterranean Area: A Modelling Approach. In Proceedings of the International Technical Meeting on Air Pollution Modelling and its Application; Springer Proceedings in Complexity; Mensink, C., Kallos, G., Eds.; Springer: Cham, Switzerland, 2018; pp. 317–321. ISBN 978-3-319-57645-9. [Google Scholar]
- Toscano, D.; Murena, F.; Quaranta, F.; Mocerino, L. Assessment of the Impact of Ship Emissions on Air Quality Based on a Complete Annual Emission Inventory Using AIS Data for the Port of Naples. Ocean. Eng. 2021, 232, 109166. [Google Scholar] [CrossRef] [Scilit]
- Cesari, R.; Genga, A.; Buccolieri, R.; Di Sabatino, S.; Siciliano, M.; Siciliano, T.; Dinoi, A.; Maurizi, A.; Ielpo, P. Combining Chemical Composition Data and Numerical Modelling for the Assessment of Air Quality in a Mediterranean Port City. Appl. Sci. 2021, 11, 2181. [Google Scholar] [CrossRef] [Scilit]
- Priyan, S.; Guo, Y.; Broderick, B.M.; Caulfield, B.; McNabola, A.; O’Mahony, M.; Thornes, J.; Gallagher, J. Identifying Air Pollution Characteristics, Source Apportionment Methods, and Air Quality Modeling Approaches in Transport Hub Settings: State-of-Play and Future Directions. Atmos. Pollut. Res. 2026, 17, 102709. [Google Scholar] [CrossRef] [Scilit]
- Ribeiro da Silva, J.N.; Santos, T.A.; Teixeira, A.P. Methodology for Predicting Maritime Traffic Ship Emissions Using Automatic Identification System Data. J. Mar. Sci. Eng. 2024, 12, 320. [Google Scholar] [CrossRef] [Scilit]
- Tsanakas, N.; Ekström, J.; Olstam, J. Estimating Emissions from Static Traffic Models: Problems and Solutions. J. Adv. Transp. 2020, 2020, 5401792. [Google Scholar] [CrossRef] [Scilit]
- Garbatov, Y.; Georgiev, P.; Fuchedzhieva, I. Extreme Value Analysis of NOx Air Pollution in the Winter Seaport of Varna. Atmosphere 2022, 13, 1921. [Google Scholar] [CrossRef] [Scilit]
- Xiao, G.; Wang, T.; Chen, X.; Zhou, L. Evaluation of Ship Pollutant Emissions in the Ports of Los Angeles and Long Beach. J. Mar. Sci. Eng. 2022, 10, 1206. [Google Scholar] [CrossRef] [Scilit]
- Cartwright, K.; Cottrill, L.; Hamrick, G.; Nye, L.; Leue, M. Ports of Long Beach/Los Angeles Transportation Master Plan. In Proceedings of the Ports ’01: America’s Ports: Gateway to the Global Economy; American Society of Civil Engineers: Reston, VA, USA, 2001; pp. 1–15. [Google Scholar]
- Lee, Y.; Park, Y.; Kim, G.; Yoo, J.; Pinzon-Acosta, C.; Gonzalez-Olivardia, F.; Cruz, E.; Lee, H. Ship Air Emission and Their Air Quality Impacts in the Panama Canal Area: An Integrated AIS-Based Estimation During Hotelling Mode in Anchorage Zone. J. Mar. Sci. Eng. 2025, 13, 1888. [Google Scholar] [CrossRef] [Scilit]
- Nunes, R.A.O.; Alvim-Ferraz, M.C.M.; Martins, F.G.; Sousa, S.I.V. Assessment of Shipping Emissions on Four Ports of Portugal. Environ. Pollut. 2017, 231, 1370–1379. [Google Scholar] [CrossRef] [Scilit]
- Goldsworthy, L.; Goldsworthy, B. Modelling of Ship Engine Exhaust Emissions in Ports and Extensive Coastal Waters Based on Terrestrial AIS Data—An Australian Case Study. Environ. Model. Softw. 2015, 63, 45–60. [Google Scholar] [CrossRef] [Scilit]
- Moreno-Gutiérrez, J.; Calderay, F.; Saborido, N.; Boile, M.; Rodríguez Valero, R.; Durán-Grados, V. Methodologies for Estimating Shipping Emissions and Energy Consumption: A Comparative Analysis of Current Methods. Energy 2015, 86, 603–616. [Google Scholar] [CrossRef] [Scilit]
- Kuzu, S.L.; Bilgili, L.; Kiliç, A. Estimation and Dispersion Analysis of Shipping Emissions in Bandirma Port, Turkey. Environ. Dev. Sustain. 2021, 23, 10288–10308. [Google Scholar] [CrossRef] [Scilit]
- Kahl, J.D.W.; Chapman, H.L. Atmospheric Stability Characterization Using the Pasquill Method: A Critical Evaluation. Atmos. Environ. 2018, 187, 196–209. [Google Scholar] [CrossRef] [Scilit]
- Stockie, J.M. The Mathematics of Atmospheric Dispersion Modeling. SIAM Rev. 2011, 53, 349–372. [Google Scholar] [CrossRef] [Scilit]
- Chen, X.; Lv, S.; Shang, W.; Wu, H.; Xian, J.; Song, C. Ship Energy Consumption Analysis and Carbon Emission Exploitation via Spatial-Temporal Maritime Data. Appl. Energy 2024, 360, 122886. [Google Scholar] [CrossRef] [Scilit]
- Garbatov, Y.; Georgiev, P. Stochastic Air Quality Dispersion Model for Defining Queuing Ships Seaport Location. J. Mar. Sci. Eng. 2022, 10, 140. [Google Scholar] [CrossRef] [Scilit]
- Briggs, G.A. Diffusion Estimation for Small Emissions; Preliminary Report; U.S. Department of Energy: Washington, DC, USA, 1973.
- Lee, M.; Lee, J.; Lee, J.; Kim, Y.; Park, Y.; Lee, K. Uncertainty Analysis of a GHG Emission Model Output Using the Block Bootstrap and Monte Carlo Simulation. Sustainability 2017, 9, 1522. [Google Scholar] [CrossRef] [Scilit]
- Spadaro, J.V.; Rabl, A. Estimating the Uncertainty of Damage Costs of Pollution: A Simple Transparent Method and Typical Results. Environ. Impact Assess. Rev. 2008, 28, 166–183. [Google Scholar] [CrossRef] [Scilit]

Disclaimer/Publisher’s Note: The statements, opinions and data contained in all publications are solely those of the individual author(s) and contributor(s) and not of MDPI and/or the editor(s). MDPI and/or the editor(s) disclaim responsibility for any injury to people or property resulting from any ideas, methods, instructions or products referred to in the content. |
© 2026 by the authors. Licensee MDPI, Basel, Switzerland. This article is an open access article distributed under the terms and conditions of the Creative Commons Attribution (CC BY) license.