


Abstract
Large caisson foundations in sea-crossing bridges are often constructed in non-uniform bedrock with fractured weak layers, where the mechanical response during sinking, bottom sealing, and core filling is complex and not well understood. Existing studies generally assume uniform and intact bedrock and focus primarily on the service stage, leaving the entire construction process in such complex strata largely unexamined. To address this gap, this study investigates a large caisson foundation using field investigation data and three-dimensional numerical simulation with PLAXIS 3D (version: V20), taking the Xihoumen Rail-cum-Road Sea-crossing Bridge as an engineering case. Sonar-derived bedrock geometry, geological exploration data, and laboratory rock properties are incorporated, and the full construction process is simulated. After sinking, the maximum longitudinal and transverse displacements are 0.6269 mm and 0.6298 mm, respectively, both located on the right side of the middle compartment, while the maximum vertical displacement is 2.918 mm in the suspended part. Stress concentrates at the caisson–bedrock interface, with a maximum vertical stress of 3825 kPa at the cutting edge. During core filling, the vertical displacement increases to 4.65 mm, while the longitudinal and transverse displacements show a fluctuating upward trend, reaching 0.854 mm and 0.87 mm, respectively. As the weak-layer thickness decreases from 0.8 m to 0.2 m, the displacements under the most unfavorable load combination decrease. For the investigated foundation, a weak-layer thickness of 0.6 m or more causes a notable increase in deformation, while the base stress changes little. These results are numerical predictions, and the 0.6 m threshold should be regarded as a project-specific recommendation rather than a universal design criterion. The findings provide a reference for similar projects.
1. Introduction
In recent years, caisson foundations have been widely adopted in sea-crossing bridges, super-high-rise buildings, and large deep-water foundations, owing to their exceptionally high bearing capacity, excellent settlement control, superior overall integrity, and high-stiffness characteristics that enable them to perform reliably under complex geological and deep-water conditions [1,2,3,4,5,6]. Consequently, extensive research has been conducted by many scholars on the construction techniques, bearing behavior, and deformation mechanisms of caisson structures [7,8,9].
Yan et al. [10] investigated the bearing characteristics of suction caissons in clay under rotational failure through theoretical analysis and numerical simulations, yielding an analytical method that can accurately predict caisson capacity, capture mechanism transitions, and identify the optimal padeye position; Liu et al. [11] conducted a large-scale parametric analysis of the deformation and stress characteristics of caisson structures under combined loads using numerical simulations, revealing their stress and deformation patterns, and subsequently proposed a design method for caisson structures under combined loading conditions; Malik et al. [12] carried out a three-dimensional finite element analysis to investigate the bearing behavior and soil response of offshore wind turbine caisson foundations under static horizontal loads, and examined the influence of the caisson aspect ratio; Shili et al. [13] investigated the vertical bearing capacity of circular footings and suction caissons resting on one- and two-layered clay through three-dimensional finite element limit analyses and limit equilibrium theory, revealing that smooth footings follow a Hill-type failure mechanism, rough footings follow a Prandtl-type mechanism, the depth factor increases nonlinearly with the embedment ratio, and the pullout collapse load is not governed by a tension cut-off criterion.
The preceding studies were all based on static loading conditions; however, most caisson foundations were deployed in marine environments, making the consideration of wave and current loads essential. Hence, Wang et al. [14] performed finite element analyses using a bounding surface constitutive model to investigate the displacement behavior of a rigid suction caisson in clay under the combined action of cyclic loading and seabed trenches. The effects of cyclic amplitude, mean load, trench depth, and width were analyzed, and the displacement variation characteristics of the caisson were obtained; Zhou et al. [15] investigated the dynamic response of a caisson quay wall under combined earthquake and wave actions through two-dimensional finite element dynamic analysis validated by centrifuge tests, revealing that the coincidence of a wave trough with an earthquake represents the most critical condition, extreme waves may trigger seaside subsoil liquefaction, and conventional seismic methods neglecting wave forces can severely underestimate the failure risk.
Despite these advances, most existing studies assume uniform and intact geological conditions and focus primarily on the static and dynamic response of the caisson structure itself, while insufficient attention has been paid to the mechanical behavior during caisson sinking, bottom sealing, and staged core filling in non-uniform fractured rock strata. In particular, previous studies have not fully incorporated an actual irregular bedrock profile obtained from sonar measurements, nor have they systematically examined the influence of weak-layer thickness on the entire construction process. To address this gap, this study utilizes field investigation data and the PLAXIS 3D numerical platform to investigate the mechanical response and deformation mechanisms of a large caisson foundation in non-uniform bedrock with fractured weak layers, aiming to reveal the stress and deformation evolution throughout the entire construction process under complex geological conditions. The main contributions are: (i) incorporation of sonar-derived irregular bedrock geometry; (ii) investigation of weak-layer thickness effects; and (iii) staged simulation of sinking, bottom sealing, and core filling. The Xihoumen Rail-cum-Road Sea-crossing Bridge is used as an engineering case.
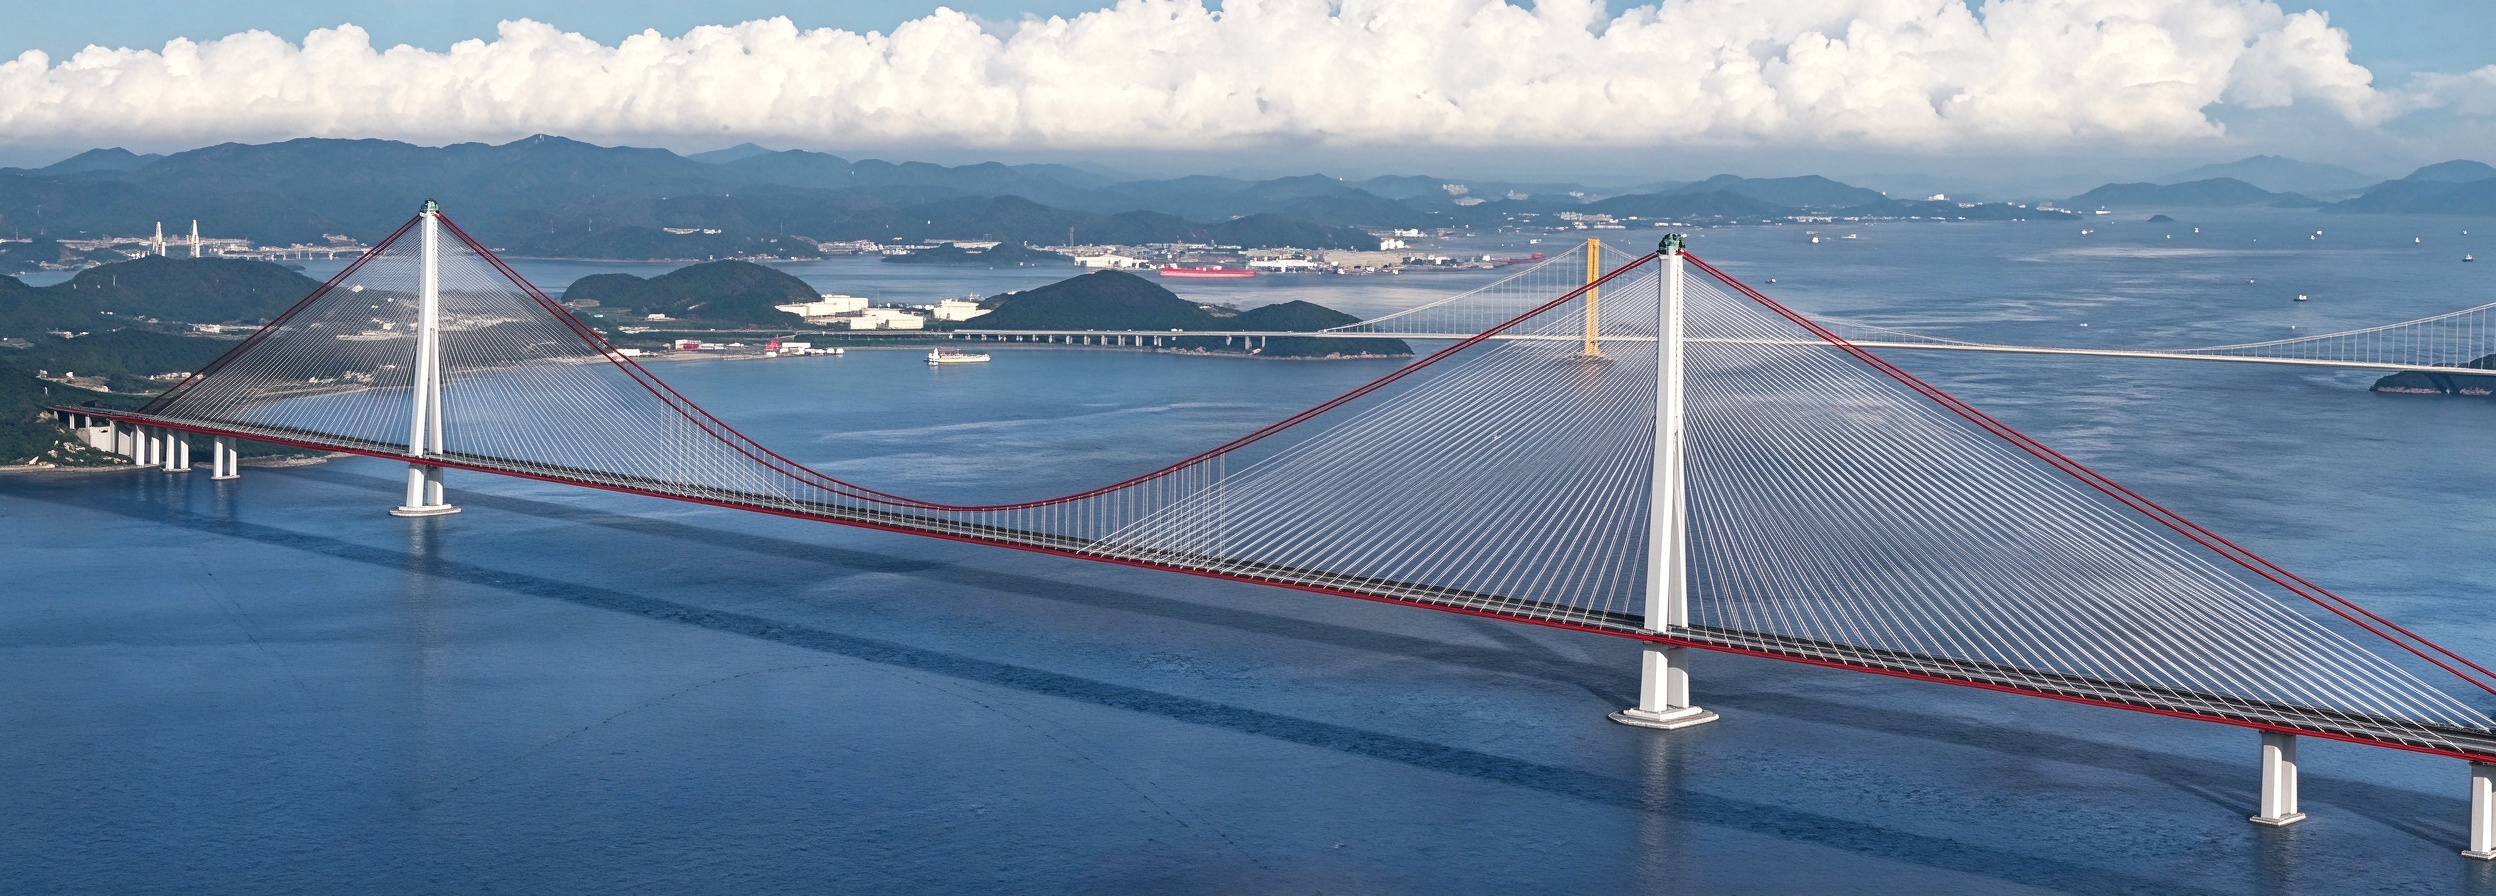
Based on the Xihoumen Rail-cum-Road Sea-crossing Bridge project (Figure 1), this paper presents an in-depth investigation into the mechanical and deformation behavior of the caisson structure during the entire construction and sinking process under uneven and fractured bedrock conditions, aiming to provide a reference for the construction of caisson foundations in similar complex strata.
Figure 1.
Xihoumen Rail-cum-Road Sea-crossing Bridge in China.
2. Project Descriptions
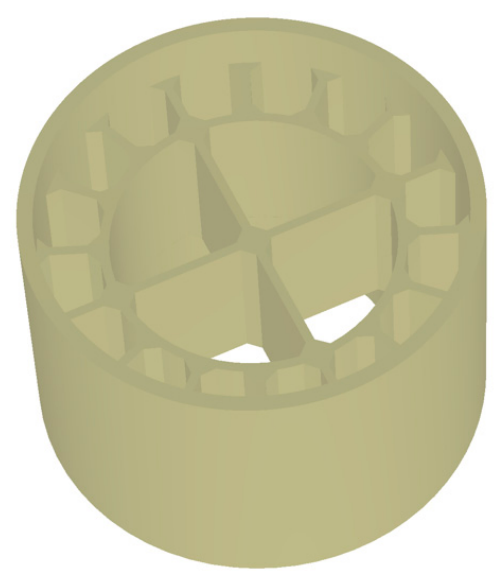
2.1. Caisson Foundation
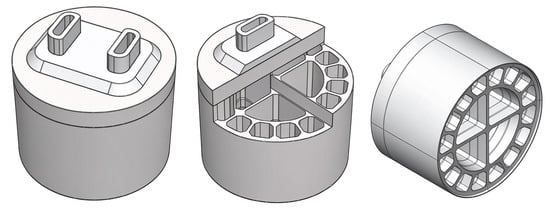
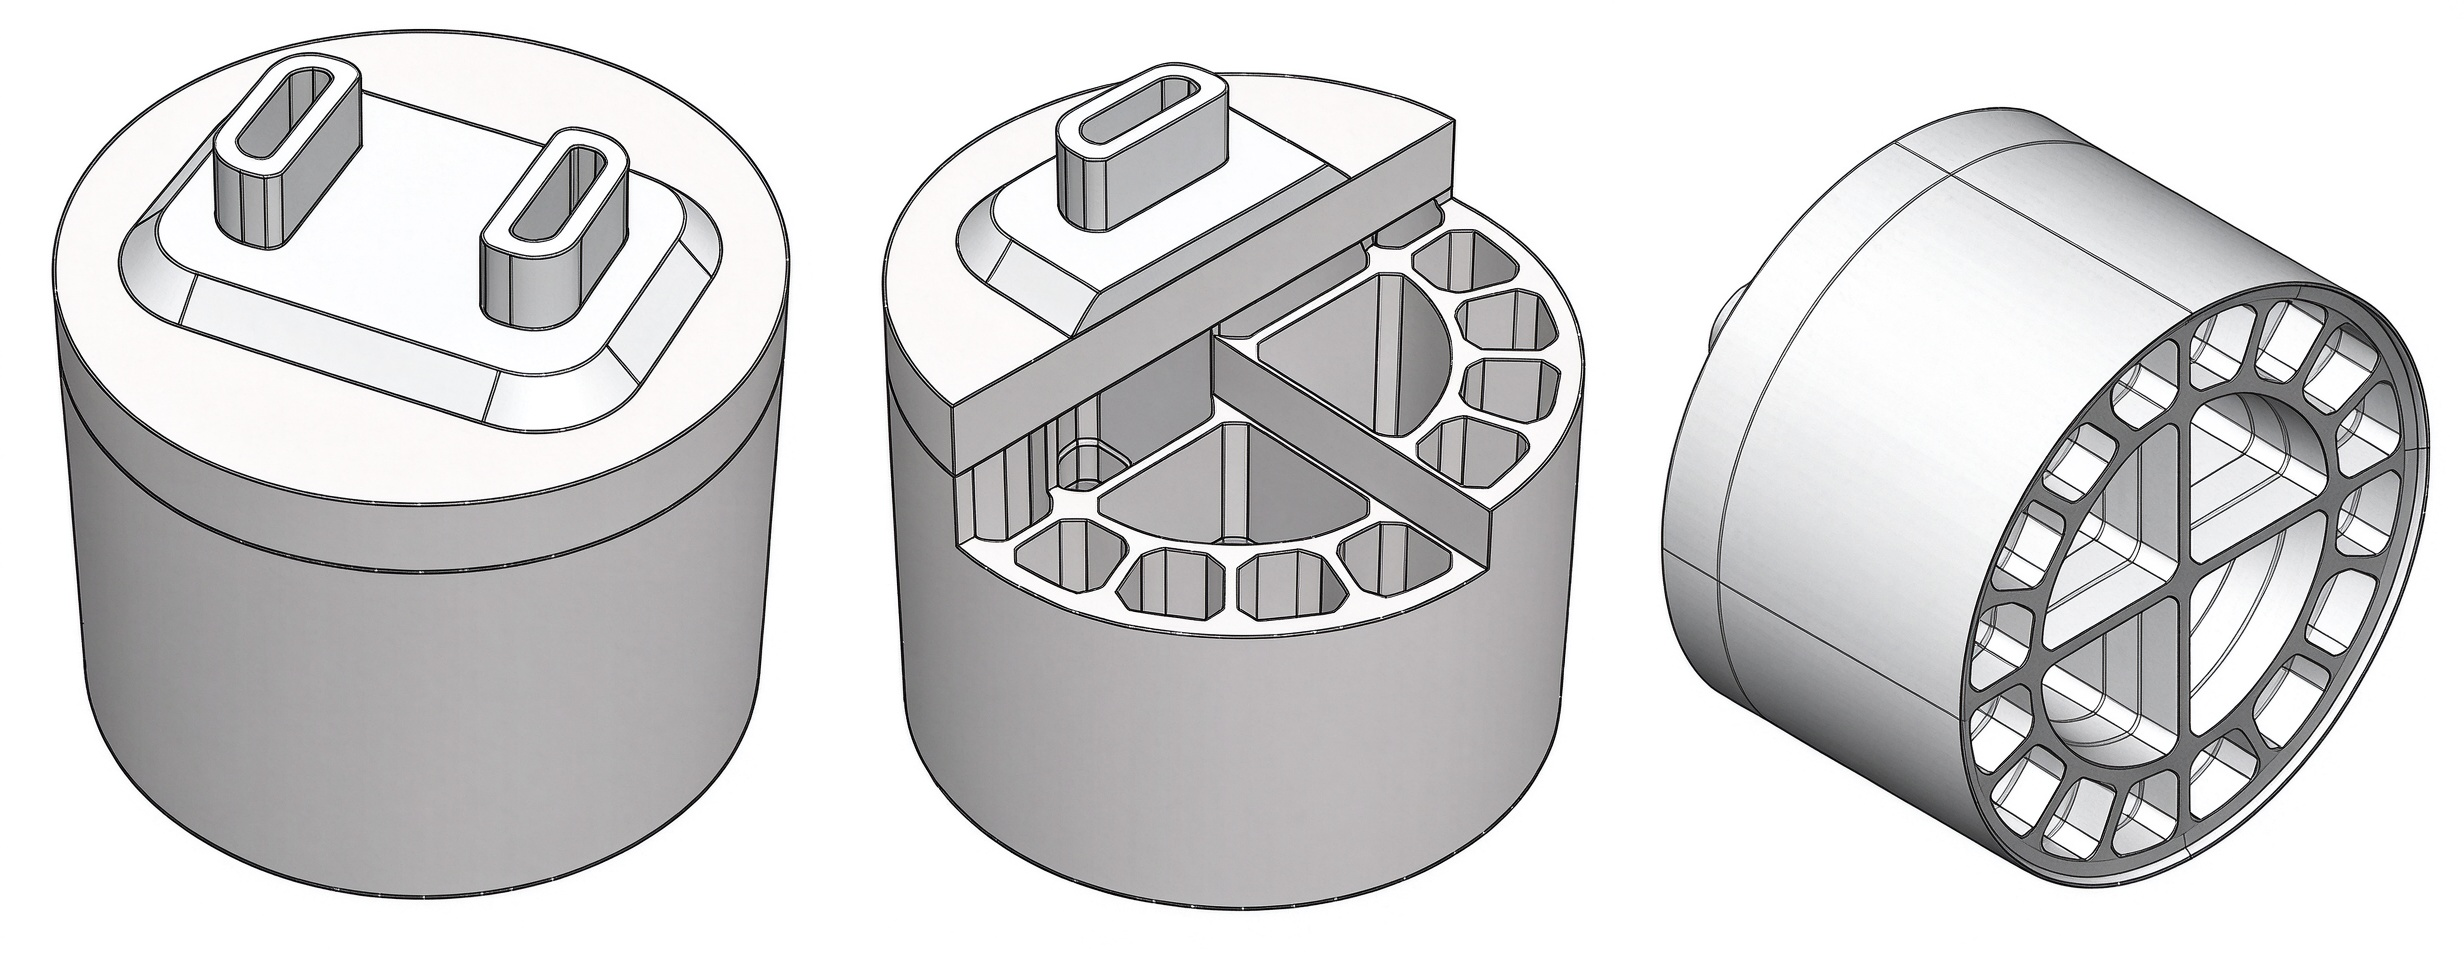
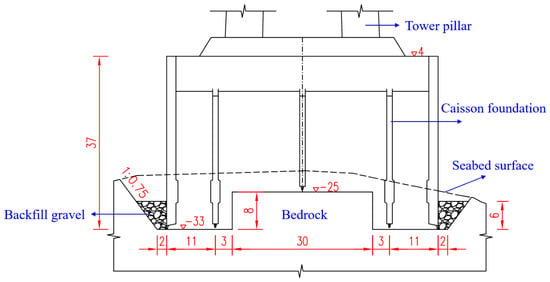
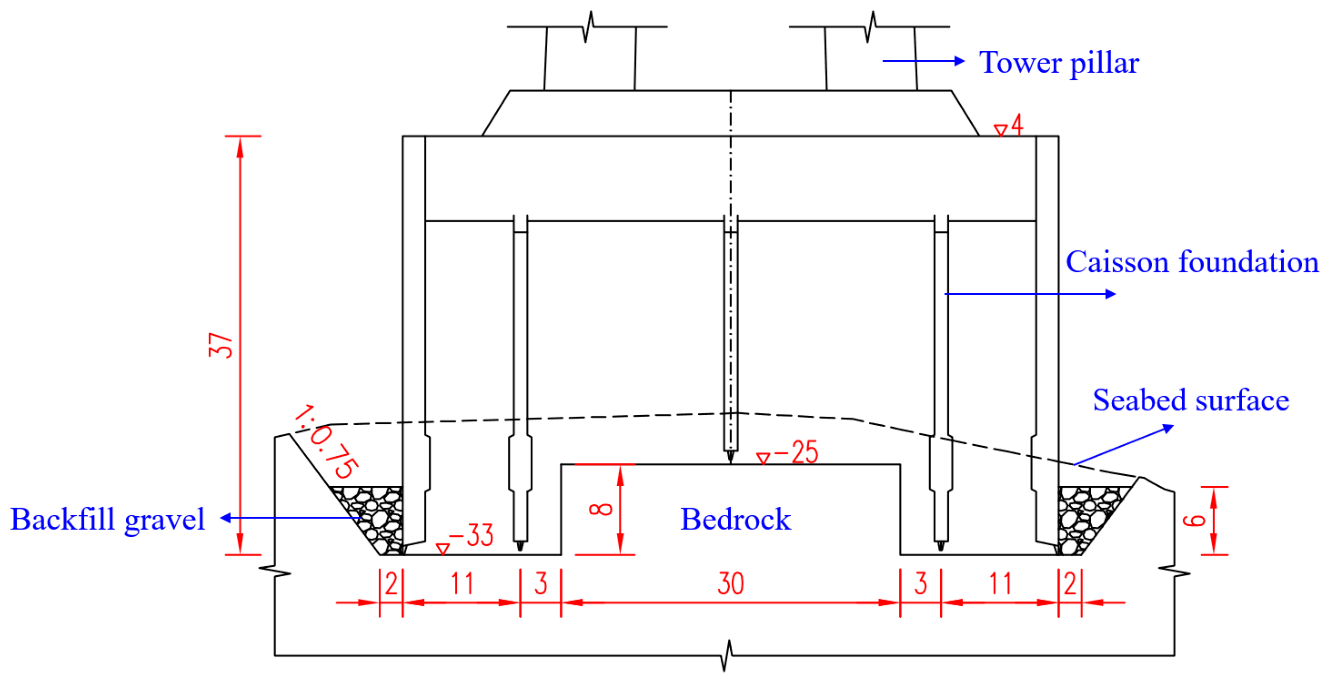
The main bridge of the Xihoumen Rail-cum-Road Bridge is a cable-stayed and suspension hybrid system with a main span of 1488 m. The foundation of the main tower at Pier No. 4 is a circular caisson with a diameter of 58.0 m and a total height of 37.0 m (top elevation +4.0 m). Above the caisson, a double-walled steel cofferdam with a height of 6.3 m (top elevation +10.3 m) and a 7.0 m thick pile cap are installed. The caisson is divided into 16 cells by internal bulkheads. In the standard segment, the caisson wall has a thickness of 2.0 m, and the partition walls are 1.2 m thick. The cutting edge is 1.8 m high with a tread width of 0.2 m, and the bottom of the inner partition wall is 1.6 m above the cutting-edge tip. The base is designed as an annular groove with an outer diameter of 62.0 m and an inner diameter of 32.0 m at the bottom. The distances from the outer and inner edges of the groove to the caisson periphery are both 2.0 m. The outer slope of the groove is 1:0.75, and the inner slope is 1:0.25. Inside the annular groove, a raised platform (boss) is 8.0 m high, with its top elevation at −25.0 m. Figure 2 and Figure 3 present the construction details of the caisson structure.
Figure 2.
Schematic diagram of the BIM model for the caisson foundation.
Figure 3.
Layout of foundation structure for caisson.
The steel caisson shell is fabricated from Q355C steel. C35 concrete is used for both the infill of the steel caisson walls and the underwater sealing concrete, while C20 concrete is adopted for the infill of the caisson cells and C45 concrete for the caisson cover slab. The maximum water depth at the location of Pier No. 4 main tower is 28 m. The weakly and slightly weathered bedrock, consisting of dacite, is directly exposed on the seabed. The upper layer is weakly weathered dacite (W2) with a basic bearing capacity of 2000 kPa and an average thickness of 10 m, whereas the lower layer is slightly weathered dacite (W1) with a bearing capacity of 3500 kPa. The rock surface is relatively even, and the base of the foundation is embedded into the W1 layer to a depth ranging from 1 to 10 m.
2.2. Construction Plan for Caisson Bottom Sealing
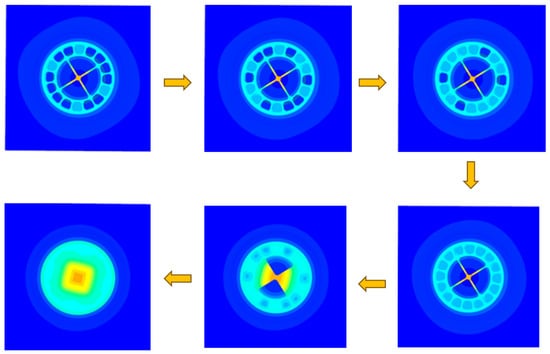
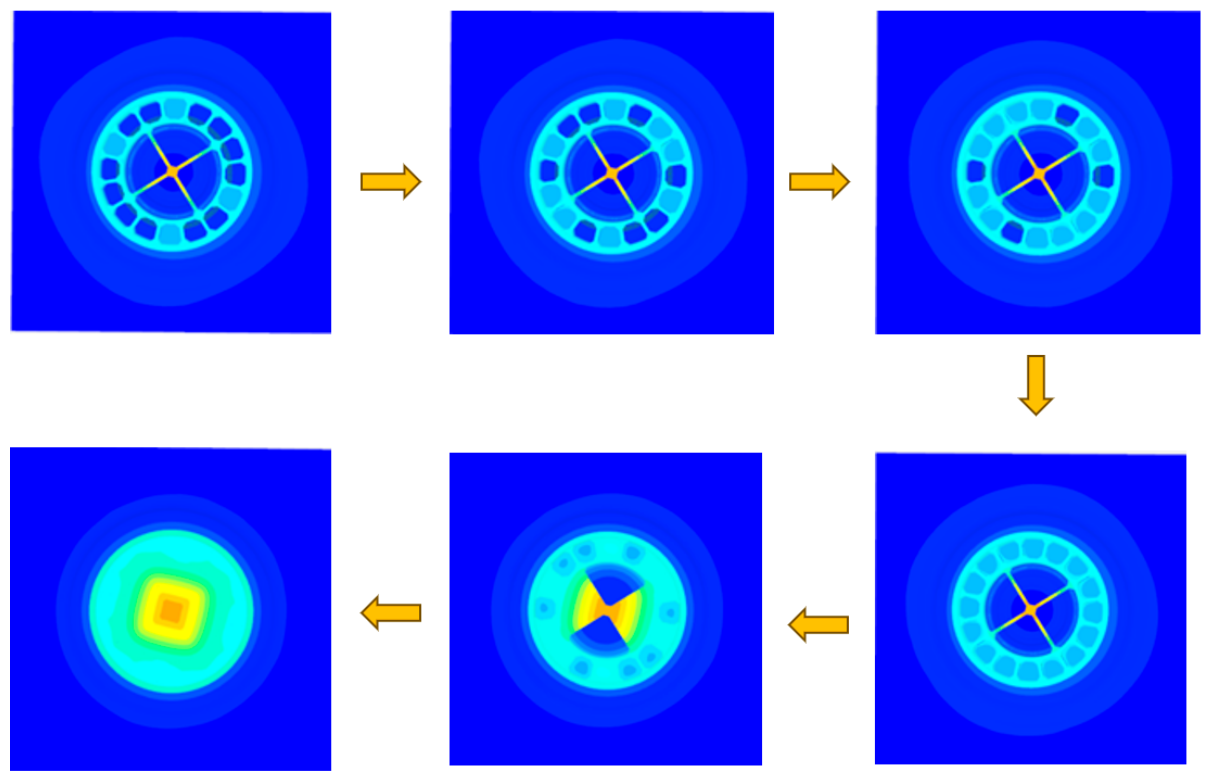
After the caisson was accurately sunk to the designed elevation, gravel was first backfilled around the outer side of the foundation pit, and the caisson base was cleaned. Subsequently, bottom sealing and concrete filling operations were carried out. During the concrete filling process, the bottom sealing concrete was first poured at the base of the caisson, followed by the concrete filling of each cell in accordance with the principle of symmetry. The specific filling sequence is shown in Figure 4.
As shown in Figure 4 and Figure 5, different colors denote the concrete filling zones within each compartment of the caisson. In order to avoid thermal cracking due to the excessive buildup of hydration heat during mass concrete placement, the concrete was poured in successive batches at varying elevations, with each layer placed progressively. This method regulates the lift thickness and the amount of heat generated per batch, thus safeguarding the structural integrity.
2.3. Current Status of Fractured Bedrock with Weak Interlayers
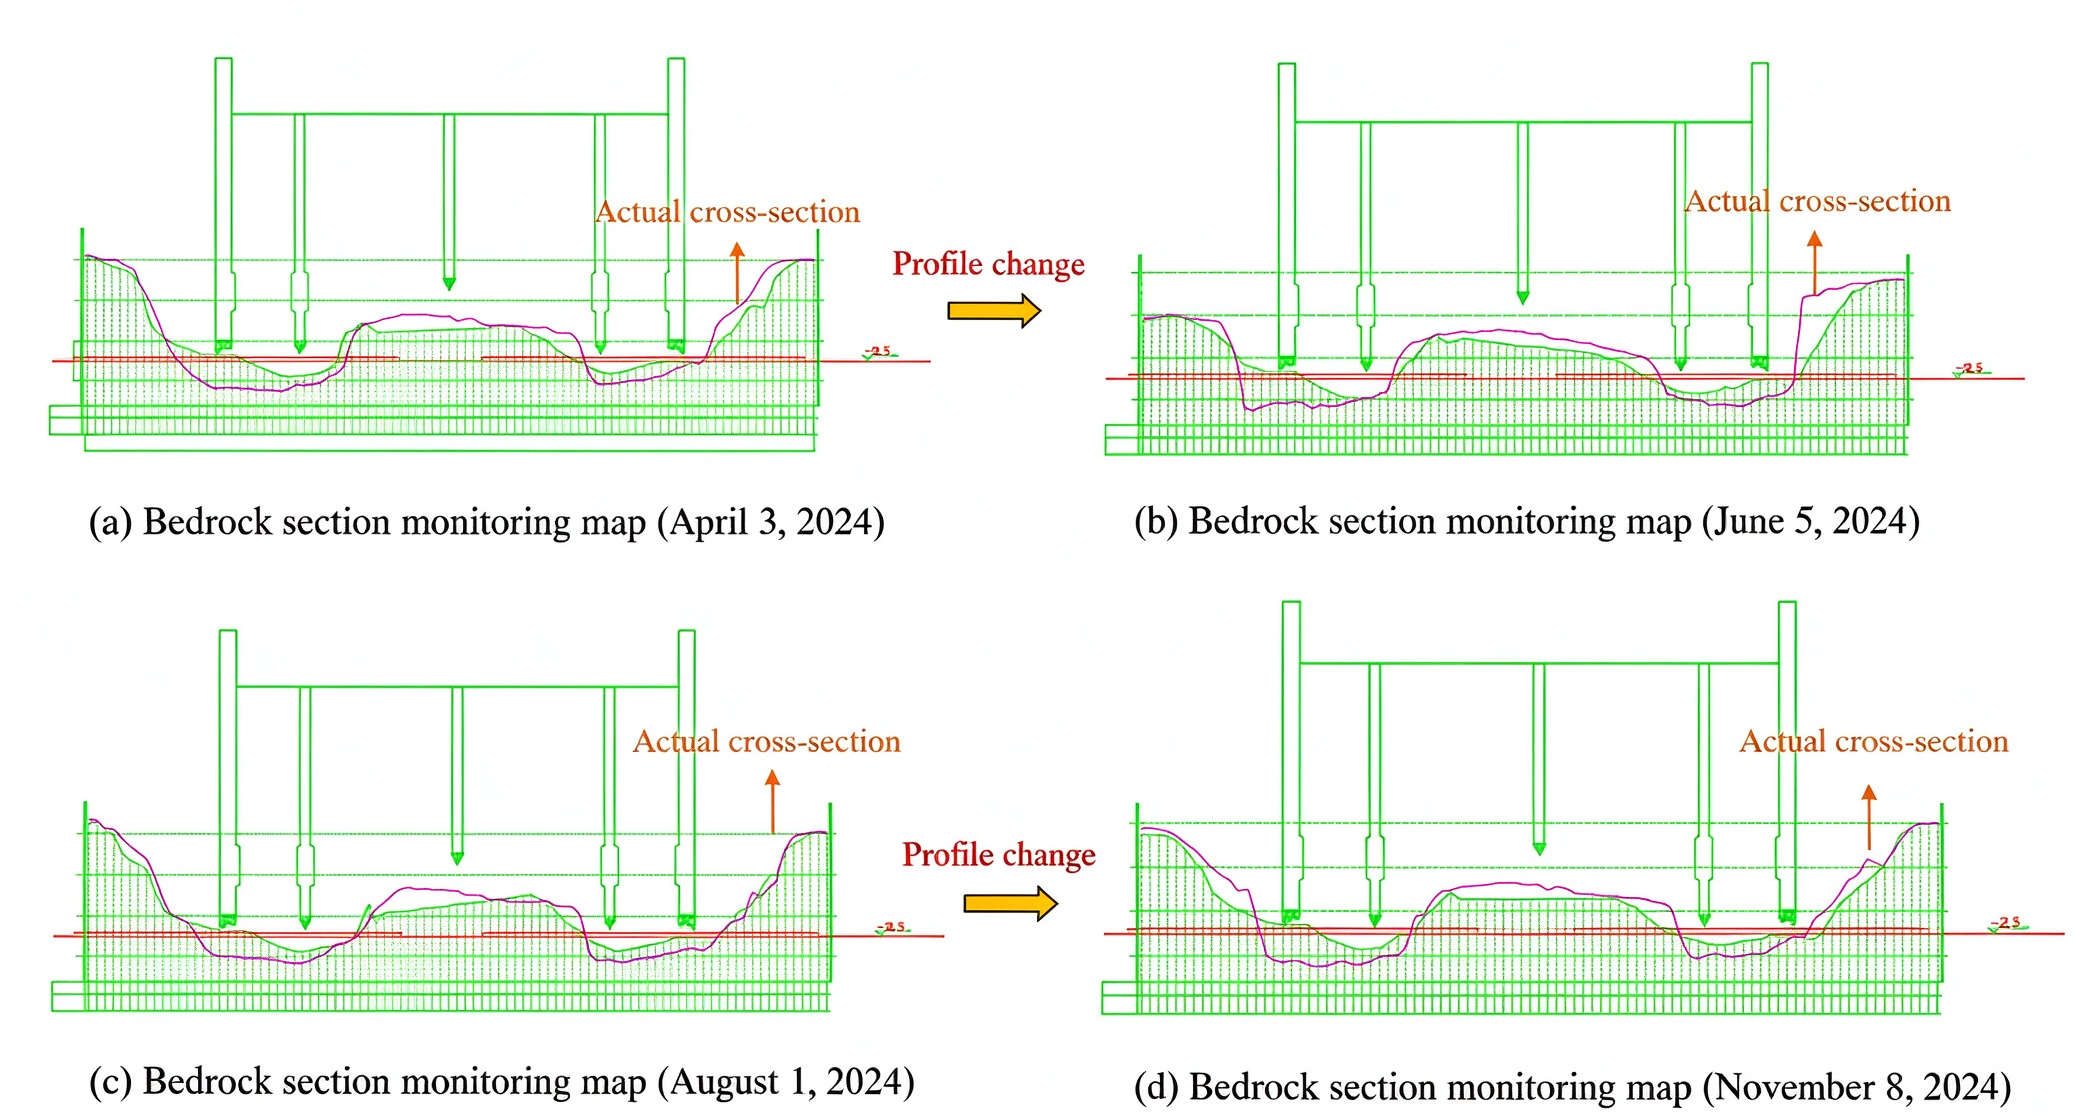
During the sinking of the caisson structure, blasting of the bedrock was required to provide sufficient space for the caisson cutting edge to be smoothly embedded into the rock layer. However, the blasting operations loosened the surrounding rock, leading to the formation of weak layers with relatively poor mechanical properties. Furthermore, under the combined action of waves and currents, the bedrock surface layer underwent changes such as erosion, migration, or detachment, which further affected the stability and overall bearing capacity of the rock mass. Therefore, to identify the weak layer within the bedrock and remove as much of it as possible, a sonar detection system was deployed on site to comprehensively monitor the bottom bedrock prior to concrete pouring. Based on the monitoring data, a real-time cross-sectional map reflecting the actual bedrock morphology was generated. This map was subsequently used to guide the removal of loose material and to optimize the foundation preparation before concreting (Figure 6).
Figure 4.
Concrete filling sequence of caisson compartments.
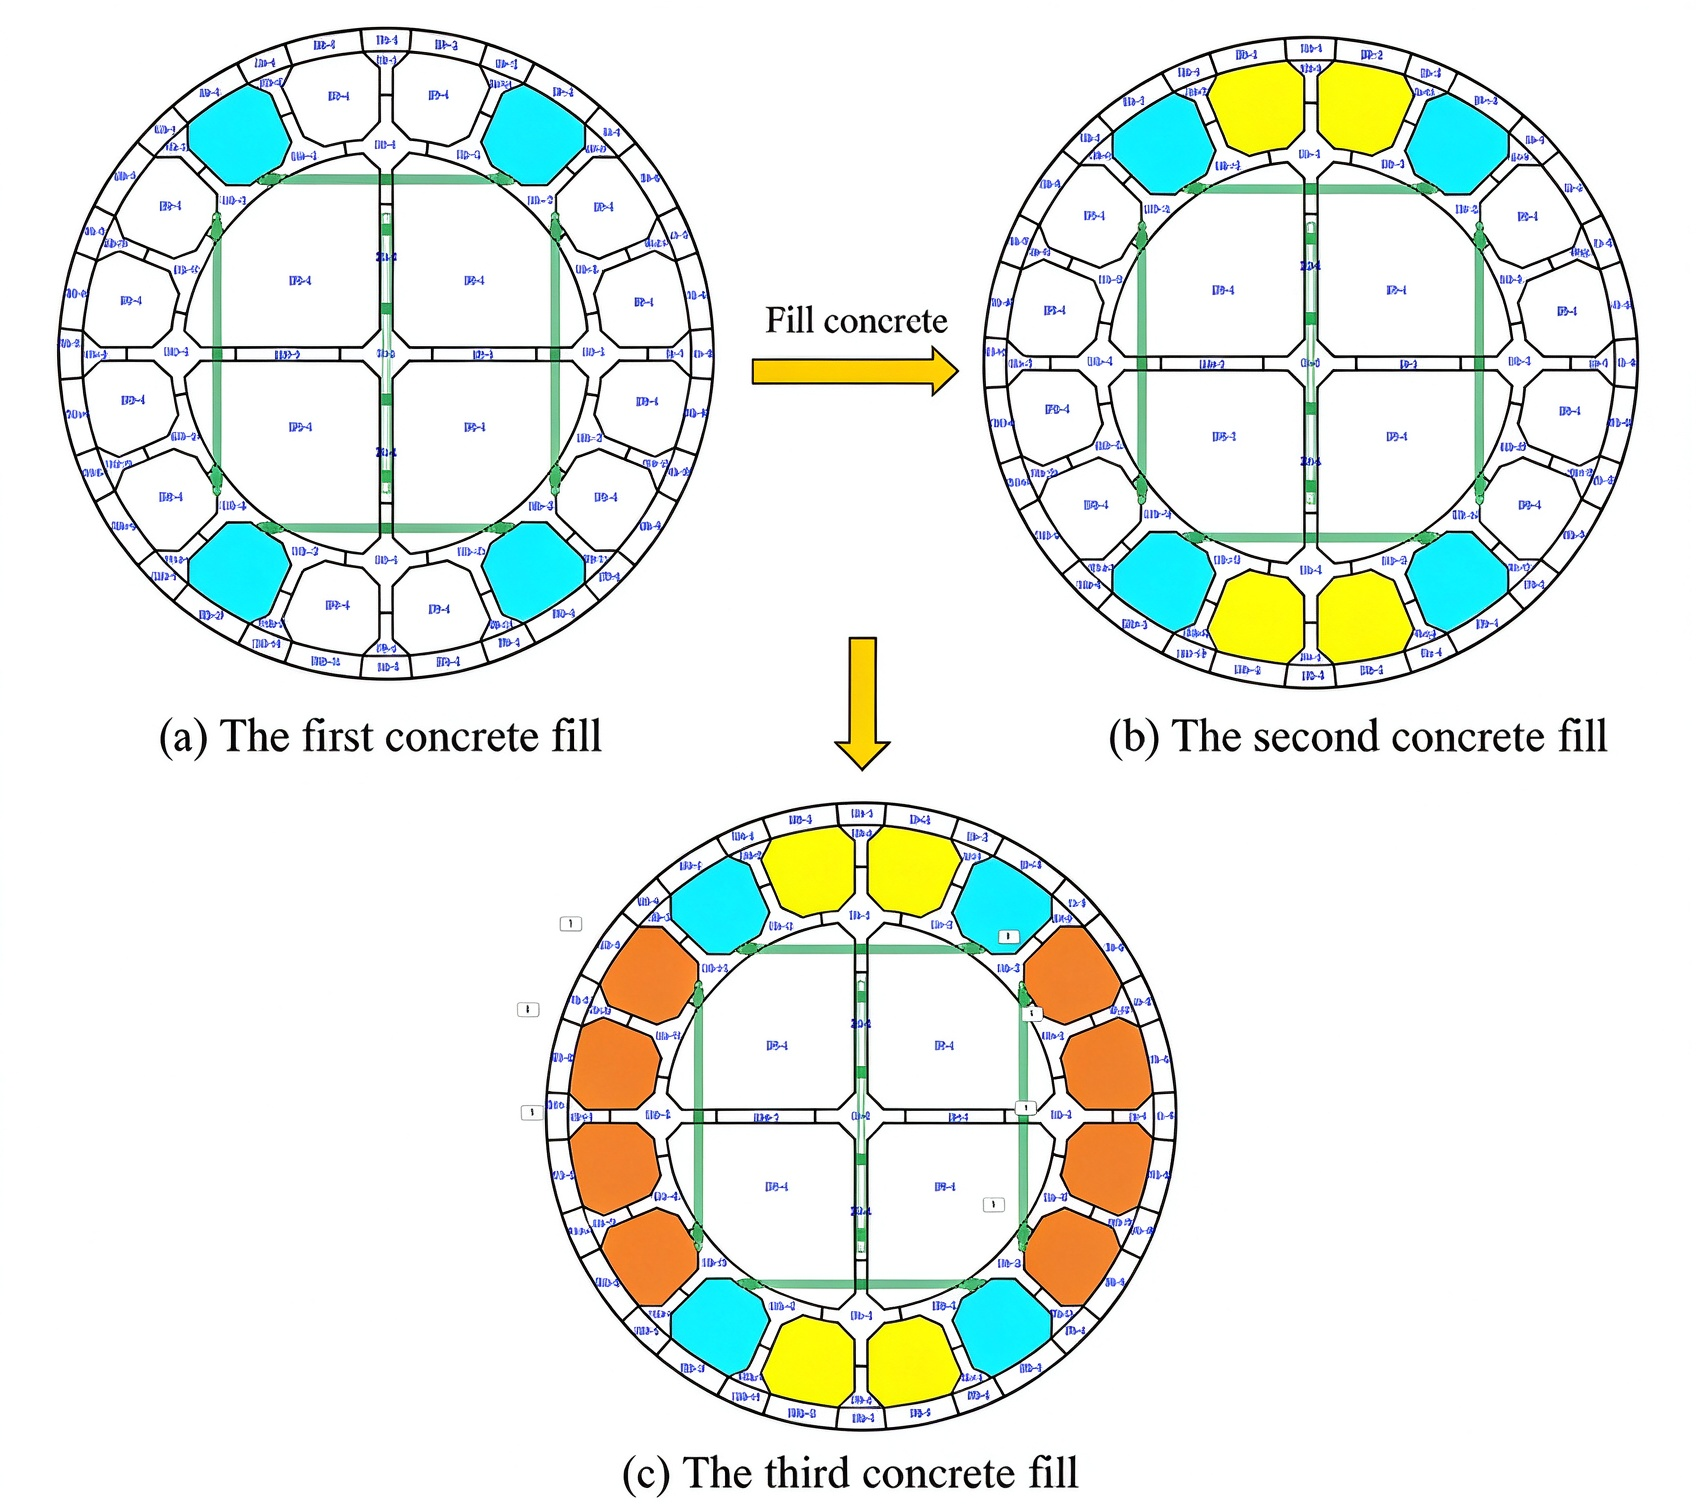
Figure 5.
Concrete height sequence for batch filling of the caisson.
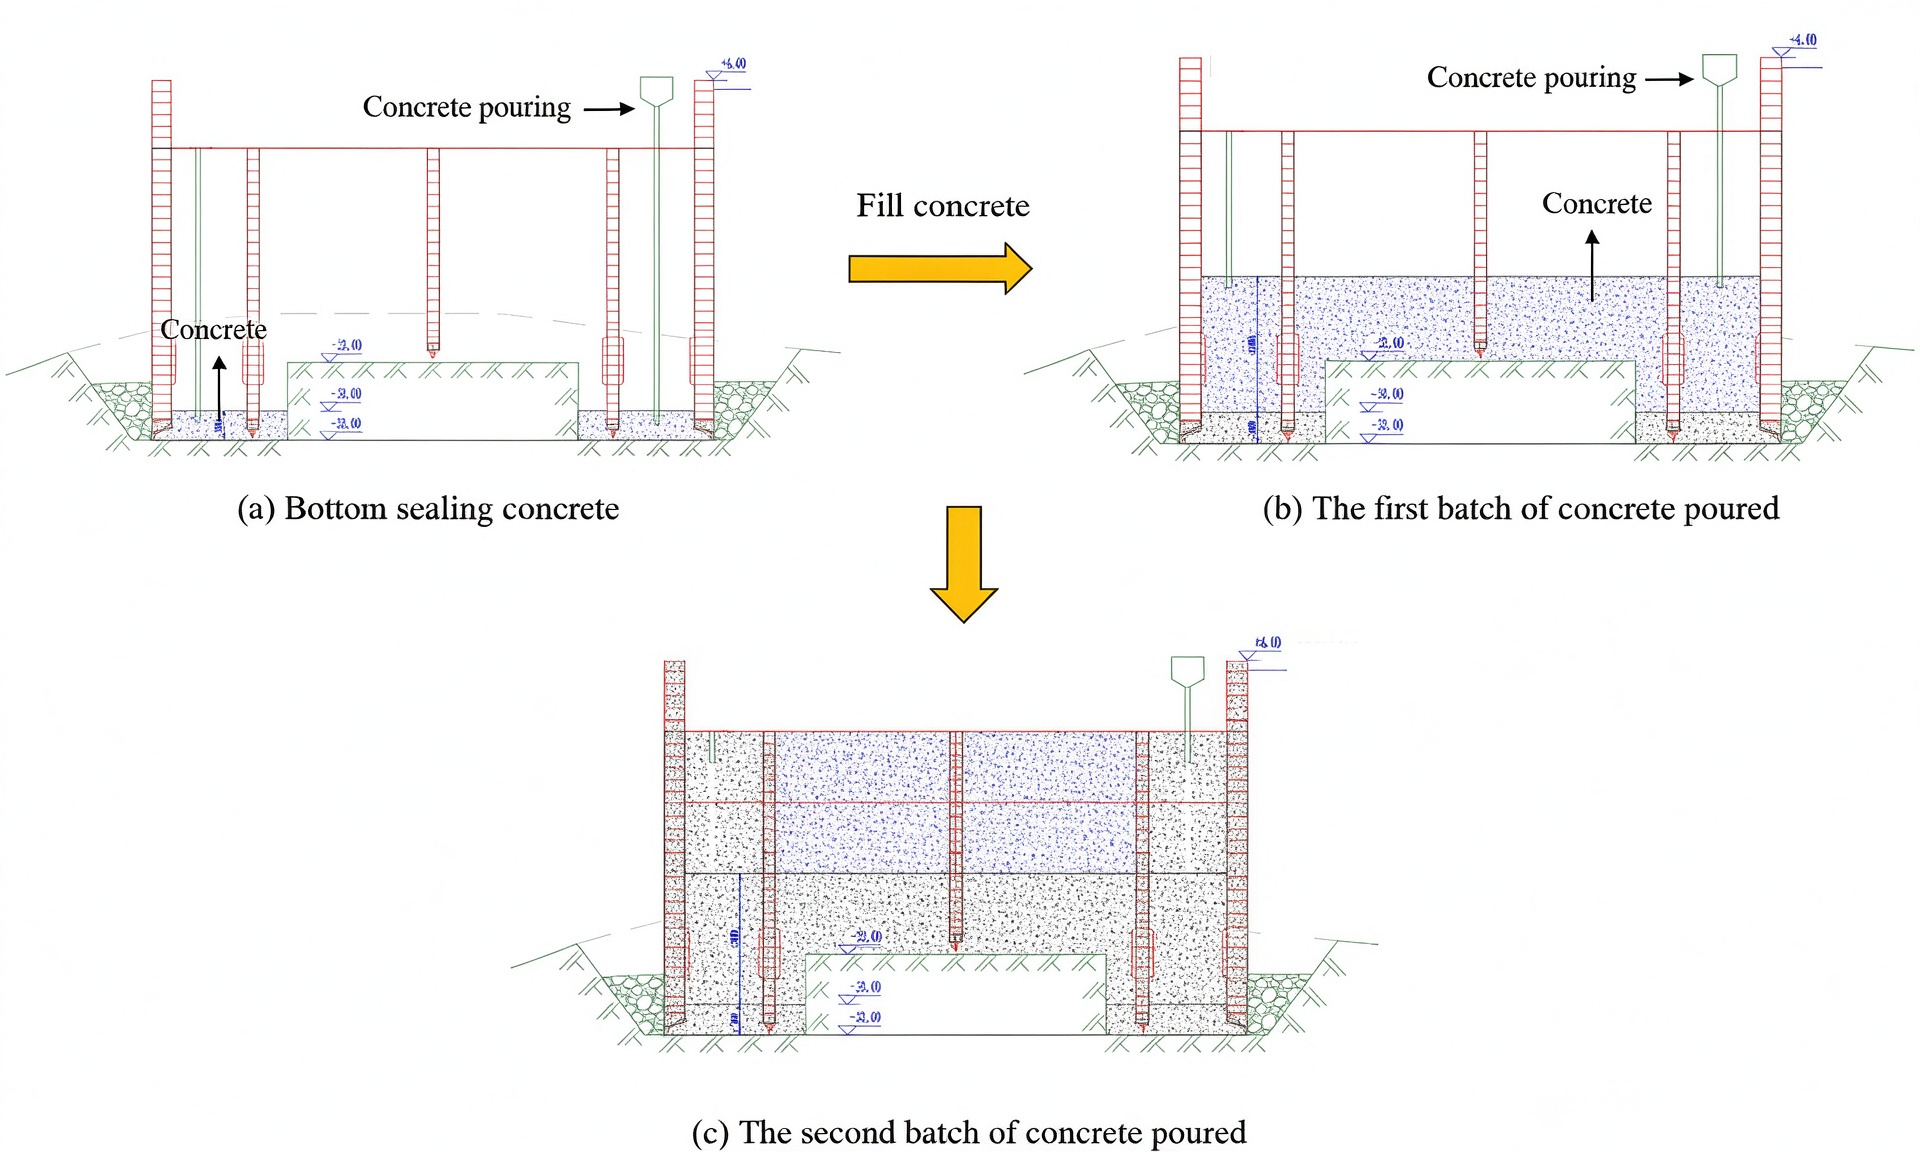
Figure 6.
Bedrock cross-section map derived from sonar detection.
2.4. Geological Exploration
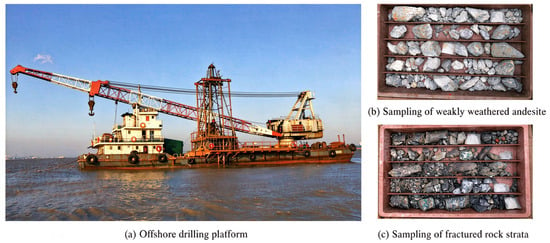
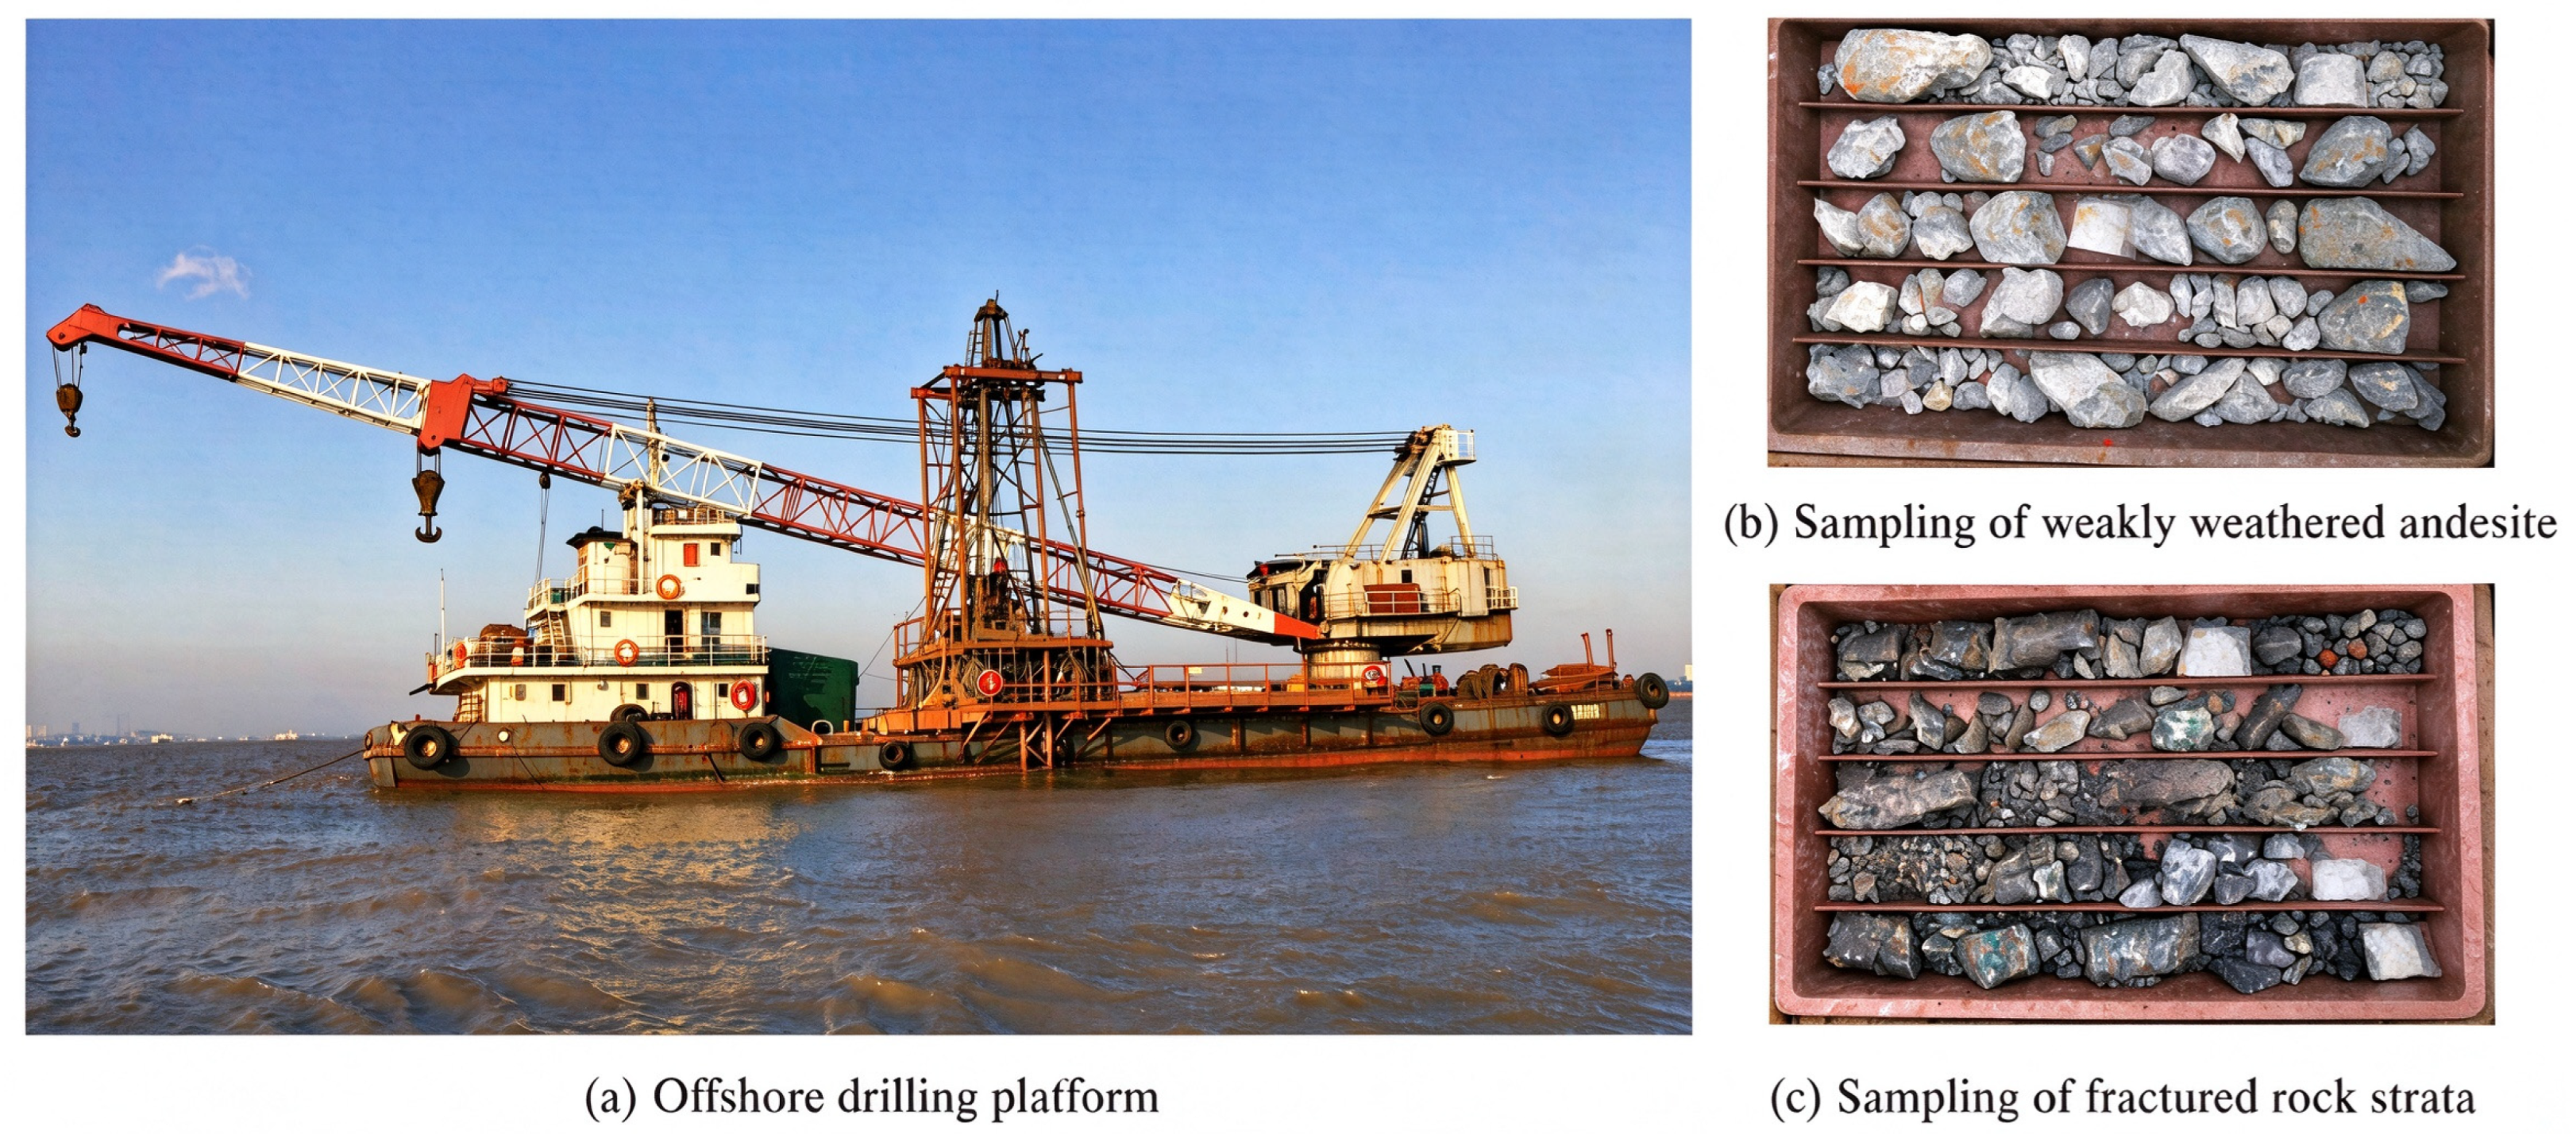
Figure 7 shows the entire process of drilling and coring. The drilling operation was carried out using an offshore drilling platform with a self-elevating structure, which ensured stability under wave conditions. A total of five boreholes were drilled in the rock strata traversed by the caisson structure, with depths ranging from 8 to 15 m and a total footage of approximately 52 m. Representative core samples of weakly weathered andesite and fractured rock layers were obtained through continuous coring using a dual-tube, single-action core barrel, achieving an average core recovery rate of 92%.
Figure 7.
Drilling and core sampling site map.
Indoor mechanical tests were subsequently conducted on the collected core samples. The moisture content was determined using the oven-drying method, yielding values ranging from 1.2% to 3.5%. The natural density, measured via the saturation density method, ranged from 2.62 to 2.74 g/cm3. Uniaxial compressive strength (UCS) tests were performed on standard core specimens (50 mm in diameter with a height-to-diameter ratio of 2:1) using an electro-hydraulic servo press, in accordance with the Standard for Testing Methods of Engineering Rock Masses (GB/T 50266-2013) [16]. The UCS of the weakly weathered andesite was found to be 93.81 MPa, while that of the fractured rock layers ranged from 33.28 MPa. These key parameters—density, uniaxial compressive strength, and moisture content—provide a reliable basis for assigning rock mechanical properties in subsequent numerical simulations (Table 1).
Table 1.
Key rock parameters.
3. Numerical Simulation
To investigate the influence of fractured rock layers on the construction and stress-deformation behavior of the caisson structure, a model was established using PLAXIS 3D V20 software together with the actual monitored bedrock cross-sectional map. The study thoroughly examined the mechanical performance and deformation safety throughout the entire caisson core-filling construction process under conditions of uneven bedrock and the presence of fractured weak layers.
3.1. Model Construction
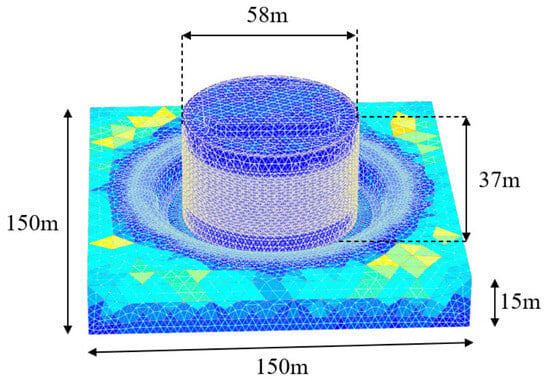
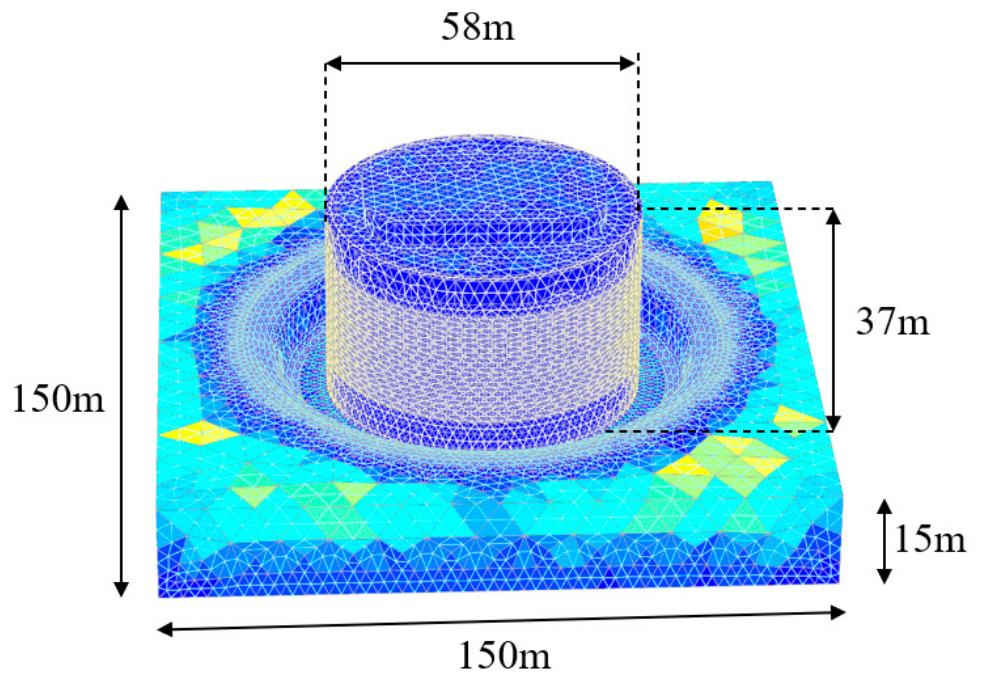
As shown in Figure 8, the overall model dimensions are 150 m × 150 m × 15 m for the bedrock model and 58 m × 58 m × 37 m for the caisson structure. The lateral boundaries were set as roller boundaries, and the bottom boundary was fixed. The top boundary was free. The mesh consists of approximately 143,350 elements and 210,000 nodes. The mesh type is 10-node tetrahedral elements. Local mesh refinement was applied around the caisson–bedrock interface and the weak layers, where stress and deformation gradients are largest. The criteria used to select the mesh density were: (i) a maximum displacement change of less than 1% between two successive mesh densities and (ii) adequately resolved plastic zones. A mesh-convergence study was performed using coarse, medium, and fine meshes. The maximum vertical displacement differed by less than 0.46% between the medium and fine meshes, and the medium mesh was therefore adopted for all analyses. The numerical discretization error is 0.03 mm.
Figure 8.
Model dimensions, boundary conditions and mesh of the bedrock–caisson system.
As shown in Table 2, the maximum vertical displacements corresponding to the coarse, medium, and fine meshes are 6.82 mm, 6.55 mm, and 6.52 mm, respectively. The difference between the medium and fine meshes is less than 0.46%, indicating that the medium mesh is sufficiently accurate. Therefore, the medium mesh is adopted for all subsequent analyses. The vertical displacement difference between the 0.2 m and 0.4 m weak-layer cases is 0.923 mm, which is larger than the discretization error of 0.03 mm, confirming that the reported difference is not an artifact of mesh discretization.
Table 2.
Key parameters in PLAXIS 3D.
The model establishment primarily includes two parts: the bedrock part and the structural part. The bedrock part further comprises the uneven bedrock after blasting and the fractured weak rock layers. Shared nodes were used between the caisson and the surrounding materials, implying perfect bonding; interface separation and sliding were therefore not explicitly modelled. This assumption provides a reasonable approximation for the global load transfer and deformation trend, but it cannot capture local slip or separation at the caisson–bedrock interface. Consequently, the local stress concentrations near the cutting edge and in low-lying bedrock areas should be interpreted qualitatively rather than as exact contact stresses. The global displacement trends are less sensitive to this assumption, but a full contact-interface analysis is beyond the scope of the present study and is recommended for future work.
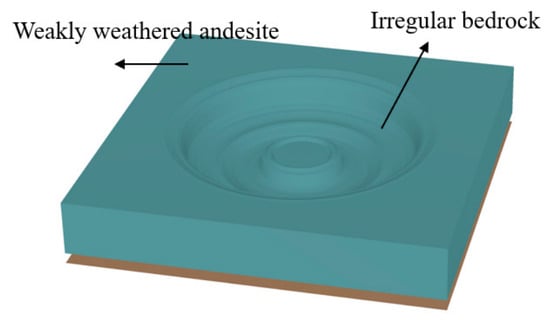
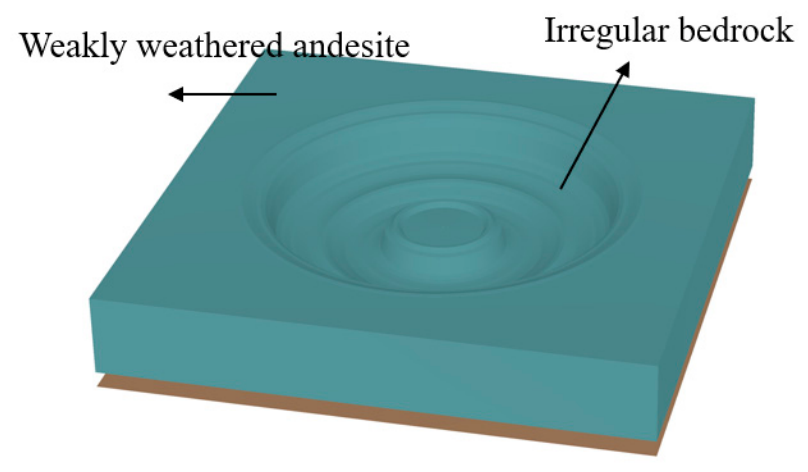
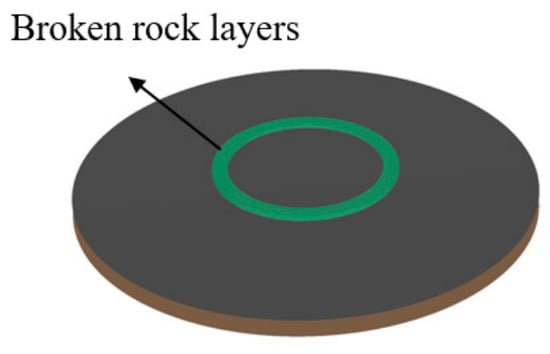
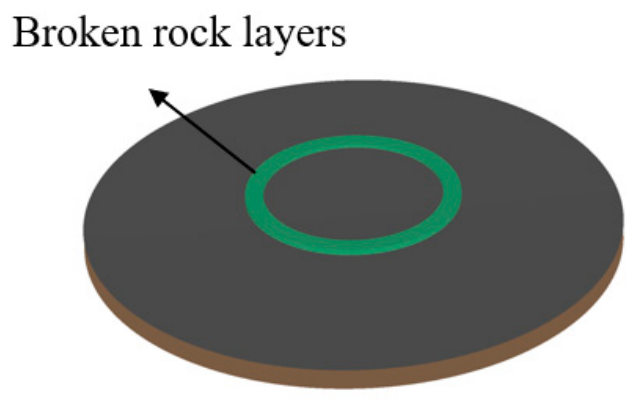
The bedrock geometry is relatively simple; however, as shown in Figure 9, the bedrock surface is not flat but undulating. Therefore, based on the sonar scanning map monitored near the date of caisson concrete pouring, the data were imported into PLAXIS 3D V20 [17] as the bedrock model. In addition, weak rock layers with thicknesses of 0.2 m, 0.4 m, 0.6 m, and 0.8 m were created on the bedrock surface to study their influence on the deformation and stress of the caisson structure. Figure 9 and Figure 10 present the modeling of the uneven bedrock and the weak rock layers.
Figure 9.
Irregular bedrock model in PLAXIS 3D.
Figure 10.
Broken rock layer model in PLAXIS 3D.
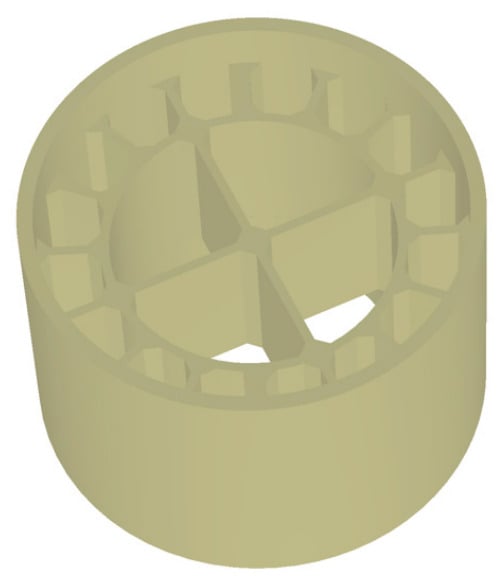
The caisson structure features a complex geometry and contains numerous internal components, making direct creation within finite element software inefficient. To address this, a 3D model was first developed using the drafting software AutoCAD 2023 and subsequently imported into the simulation software (PLAXIS 3D) for further analysis. As shown in Figure 11, the caisson model was established according to the detailed requirements given in Figure 2 and Figure 3.
Figure 11.
Caisson model in PLAXIS 3D.
Table 3 summarizes the construction stages simulated in PLAXIS 3D, including the activated/deactivated components, applied loads, water levels, concrete filling sequence, and initial stress conditions. The correspondence between these numerical phases and the field construction sequence shown in Figure 4 and Figure 5 is also indicated.
Table 3.
Construction-stage simulation in PLAXIS 3D.
3.2. Material Parameters
In this numerical model, different constitutive models were adopted for different material types to reflect their respective mechanical behaviors. Specifically, the bedrock and weak rock layers were simulated using the Hoek–Brown (HB) constitutive model, which is suitable for rock materials. The caisson structure was modeled as reinforced concrete, and its mechanical behavior was described using the Mohr–Coulomb (MC) constitutive model [18,19]. The material parameters were primarily derived from the recommended values in the geological survey report. The specific parameters for each material are presented in Table 4.
Table 4.
Key parameters in PLAXIS 3D.
The reinforced-concrete caisson was represented by a Mohr–Coulomb model because the present study focuses on the global stiffness and load-transfer behavior rather than local concrete cracking. The maximum compressive stress in the caisson obtained from the present analysis is approximately 11.35 MPa, which is well below the design compressive strength of C35 and C45 concrete. Therefore, the concrete remains essentially elastic during the construction stages, and the plastic parameters of the Mohr–Coulomb model have negligible influence on the global deformation. The cohesion and friction angle were used only to define an equivalent shear strength envelope, while the global deformation is controlled primarily by the elastic modulus and Poisson’s ratio. A full nonlinear concrete model would require additional parameters that are difficult to calibrate for a massive caisson under global soil–structure interaction.
The material parameters used in the Hoek–Brown model were calibrated from the laboratory test results and the geological survey report. The laboratory UCS values (93.81 MPa for weakly weathered andesite and 33.28 MPa for fractured rock) were obtained from intact rock samples. For the numerical model, rock-mass parameters are required. Therefore, the geological survey report recommended design values of 70 MPa and 30 MPa, respectively, which account for the size effect, sampling disturbance, and the presence of joints and fractures. The Hoek–Brown parameters were determined as follows: mi = 15 for andesite; GSI = 100 for the weakly weathered andesite and GSI = 20 for the fractured rock mass; D = 0 for the weakly weathered andesite and D = 1 for the fractured rock mass; and Ei = 35 GPa for the weakly weathered andesite and 40 MPa for the fractured rock layer. The origin and physical meaning of all parameters are summarized in Table 4.
The elastic modulus of the fractured rock layer (40 MPa) was determined from the geological survey report, which recommended this value based on borehole logging, core recovery, and empirical correlations for highly fractured rock masses. This value is consistent with the Hoek–Brown parameters GSI = 20 and D = 1, which reflect a highly fractured and blast-disturbed rock mass. The difference between the weakly weathered andesite (35 GPa) and the fractured rock layer (40 MPa) is physically reasonable, because the fractured layer is a thin, loose, and strongly disturbed zone, whereas the weakly weathered andesite is a relatively intact rock mass. A full sensitivity analysis of this parameter was not performed, which is acknowledged as a limitation of this study.
The numerical model was established through a four-step workflow: field measurement → parameter derivation → numerical model → validation. First, sonar surveys were used to obtain the actual bedrock geometry, and boreholes with continuous coring were used to obtain representative rock samples. Second, laboratory tests on the core samples provided the natural density, moisture content, and uniaxial compressive strength. These values were calibrated to rock-mass parameters using the Hoek–Brown criterion, with GSI, mi, D, and Ei determined from the geological survey report and empirical correlations. Third, the sonar-derived bedrock cross-section was converted into a three-dimensional surface by interpolating the measured elevation points and imported into PLAXIS 3D. The caisson geometry was created in AutoCAD and imported into PLAXIS 3D. The calibrated rock-mass parameters were assigned to the bedrock and weak layers.
Fourth, comprehensive measurements of caisson settlement, stress, tilt, and full-field deformation were unavailable; only horizontal displacement at the caisson top was monitored during the 150-day construction period and is used for limited validation in Section 3.4. Stress and other displacement components therefore remain numerical predictions. The selected sonar section is representative of the full foundation footprint, as it was extracted near the date of concrete pouring and covers the central caisson base including the main uneven features. Parameter calibration is summarized in Table 5.
Table 5.
Key parameters in PLAXIS 3D.
Justification and Limitations of Constitutive and Interface Assumptions
The constitutive models adopted here serve as effective representations of the main mechanical behavior rather than complete descriptions of all physical processes. The Hoek–Brown model is used for the weakly weathered andesite and fractured rock layer, as GSI and D capture the strength reduction caused by jointing, fracturing, and blast disturbance. The reinforced-concrete caisson is represented by an equivalent elastic–plastic Mohr–Coulomb model; the maximum compressive stress is approximately 11.35 MPa, well below the design strength of C35 and C45 concrete, so the concrete remains essentially elastic and global deformation is controlled mainly by the elastic modulus and Poisson’s ratio. Parameters were calibrated against laboratory tests and the geological survey report (Table 4 and Table 5). Nevertheless, the models involve simplifications, particularly for the fractured rock mass and the caisson–bedrock interface; these limitations are explicitly considered in interpreting the local stress results and in Section 6.
3.3. Load Setting
The external loads acting on the caisson during its operational phase mainly include wind loads, water flow loads, wave loads, and hydrostatic pressure. Hydrostatic pressure can be automatically calculated and applied to the structure’s surface by the simulation software based on the predefined water level. For dynamic horizontal loads such as wind, waves, and currents, their standard values will be calculated in accordance with relevant specifications [20,21,22], and the detailed method for applying them in PLAXIS 3D (or other finite element software) will be described. It is worth noting that all three types of loads are horizontal. To capture the structural response under the most unfavorable conditions, the model assumes that the wind, wave, and water flow loads all act in the same direction, specifically along the positive X-axis of the global coordinate system, thereby forming the most adverse horizontal load combination through linear superposition.
3.3.1. Wind Load
According to the Wind-resistant Design Specification for Highway Bridges (JTG/T 3360-01-2018) [20], the wind load on the bridge pier foundation can be calculated according to Equation (1):
where is the wind load per unit length of component (N/m); is the air density (kg/m3); is the equivalent static gust wind speed at the reference height of the component (m/s); CD is the resistance coefficient of components; is the projected area per unit length (m2/m) of the component along the wind direction is calculated using the outer diameters of the inclined cable, main cable, and suspension rod.
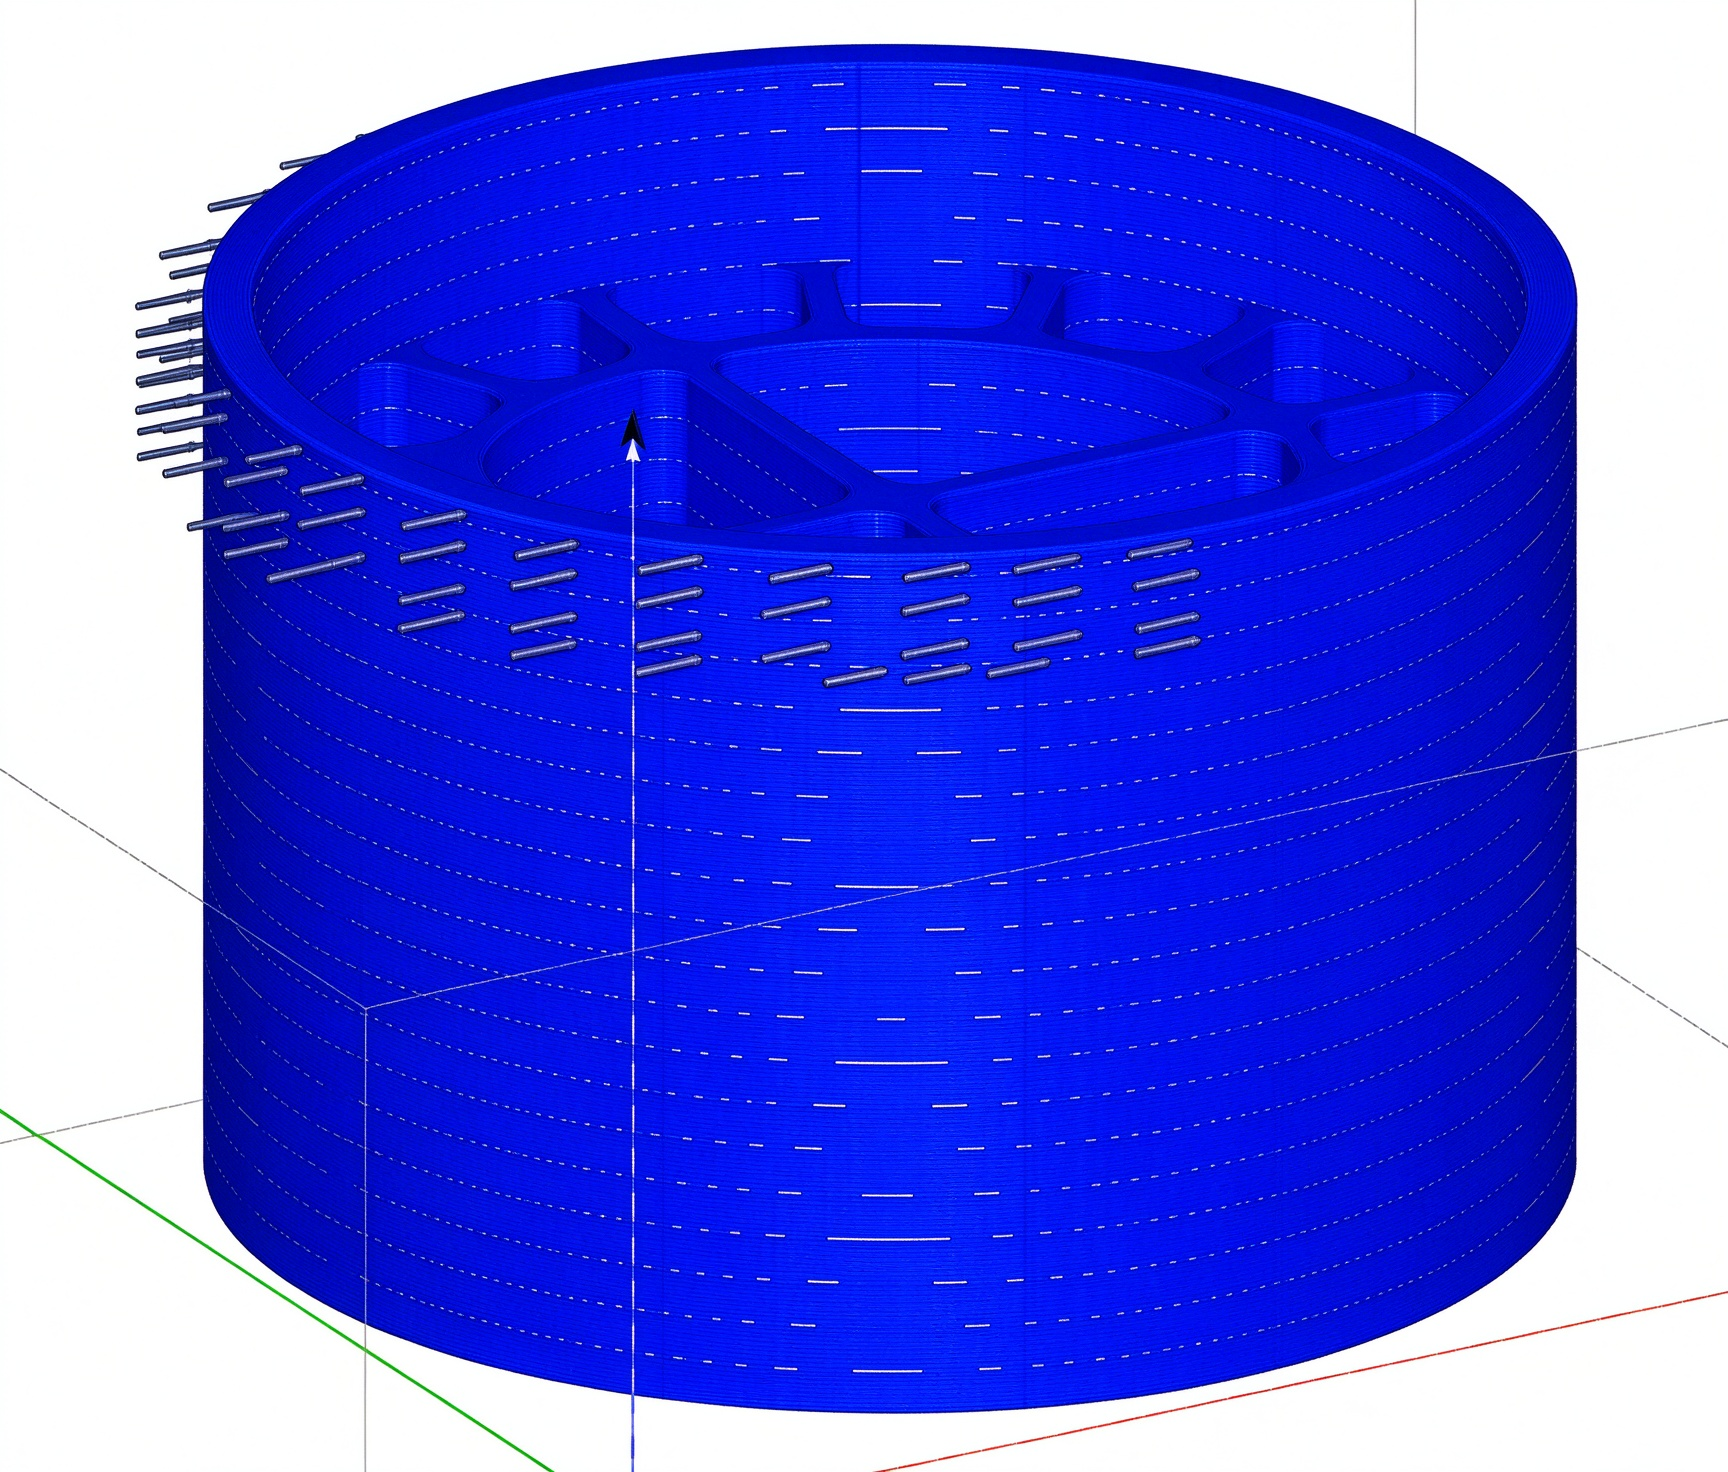
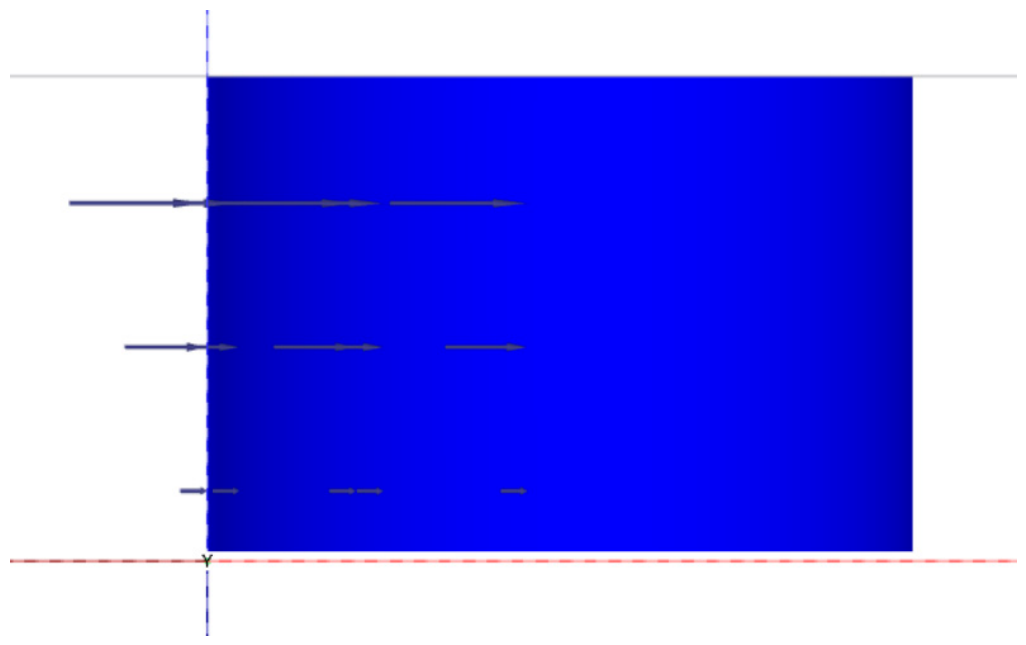
Using Equation (1) and considering that the wind load acts uniformly on the portion of the caisson above the water surface, the wind load is applied as a uniform surface load. Its magnitude is obtained by dividing the total wind load by the projected area of the windward side, resulting in an equivalent surface load of 0.123 kN/m2. The following diagram illustrates the application of the wind load in the model(Figure 12).
Figure 12.
Schematic diagram of wind load application.
3.3.2. Water Flow Load
According to the Design Code for Specification for structural design of reinforced concrete sinking well of water supply and sewerage engineering (CECS 137-2015) [21], when the sinking well is located at the center of the river, the standard value of the water pressure acting on the well shall be calculated using Equation (2) (Figure 13).
where is the drag coefficient of water flow; is the water density (kg/m3); is the average flow velocity (m/s); is the water blocking area of the caisson.
As water flow velocity generally decreases toward the seabed, the water flow load is assumed to follow a triangular distribution along the height direction—maximum at the water surface and zero at the seabed, with linear variation in between. Using an average flow velocity of 1.5 m/s and the calculation method above, the surface load at the water surface is 1.80765 kN/m2. It then decreases linearly along the height at a gradient of −0.05254796 kN/m2 per meter, dropping to zero at the cutting edge based on Equation (2).
Figure 13.
Schematic diagram of the application of water flow load.
3.3.3. Wave Load
According to the Code of Hydrology for Sea Harbour (JTS145-2-2013) [22], the MacCamy-Fuch formula can be used for large-diameter cylinders with relative water depth D/L > 0.15 and D/L > 0.2. Under the assumptions of ideal, irrotational, and potential, the wave force FH, wave moment MH, and eccentricity eH of large-diameter upright cylinders can be calculated using Equations (3)–(5).
where d is the calculated water depth of caisson (m); L is the wavelength of water waves (m); D is the caisson diameter; is the coefficient of wave current interaction force; is the water body weight (N/m3); H is the wave height of domain waves (m); k is the wave number of water waves (m−1); R is the radius of a cylinder.
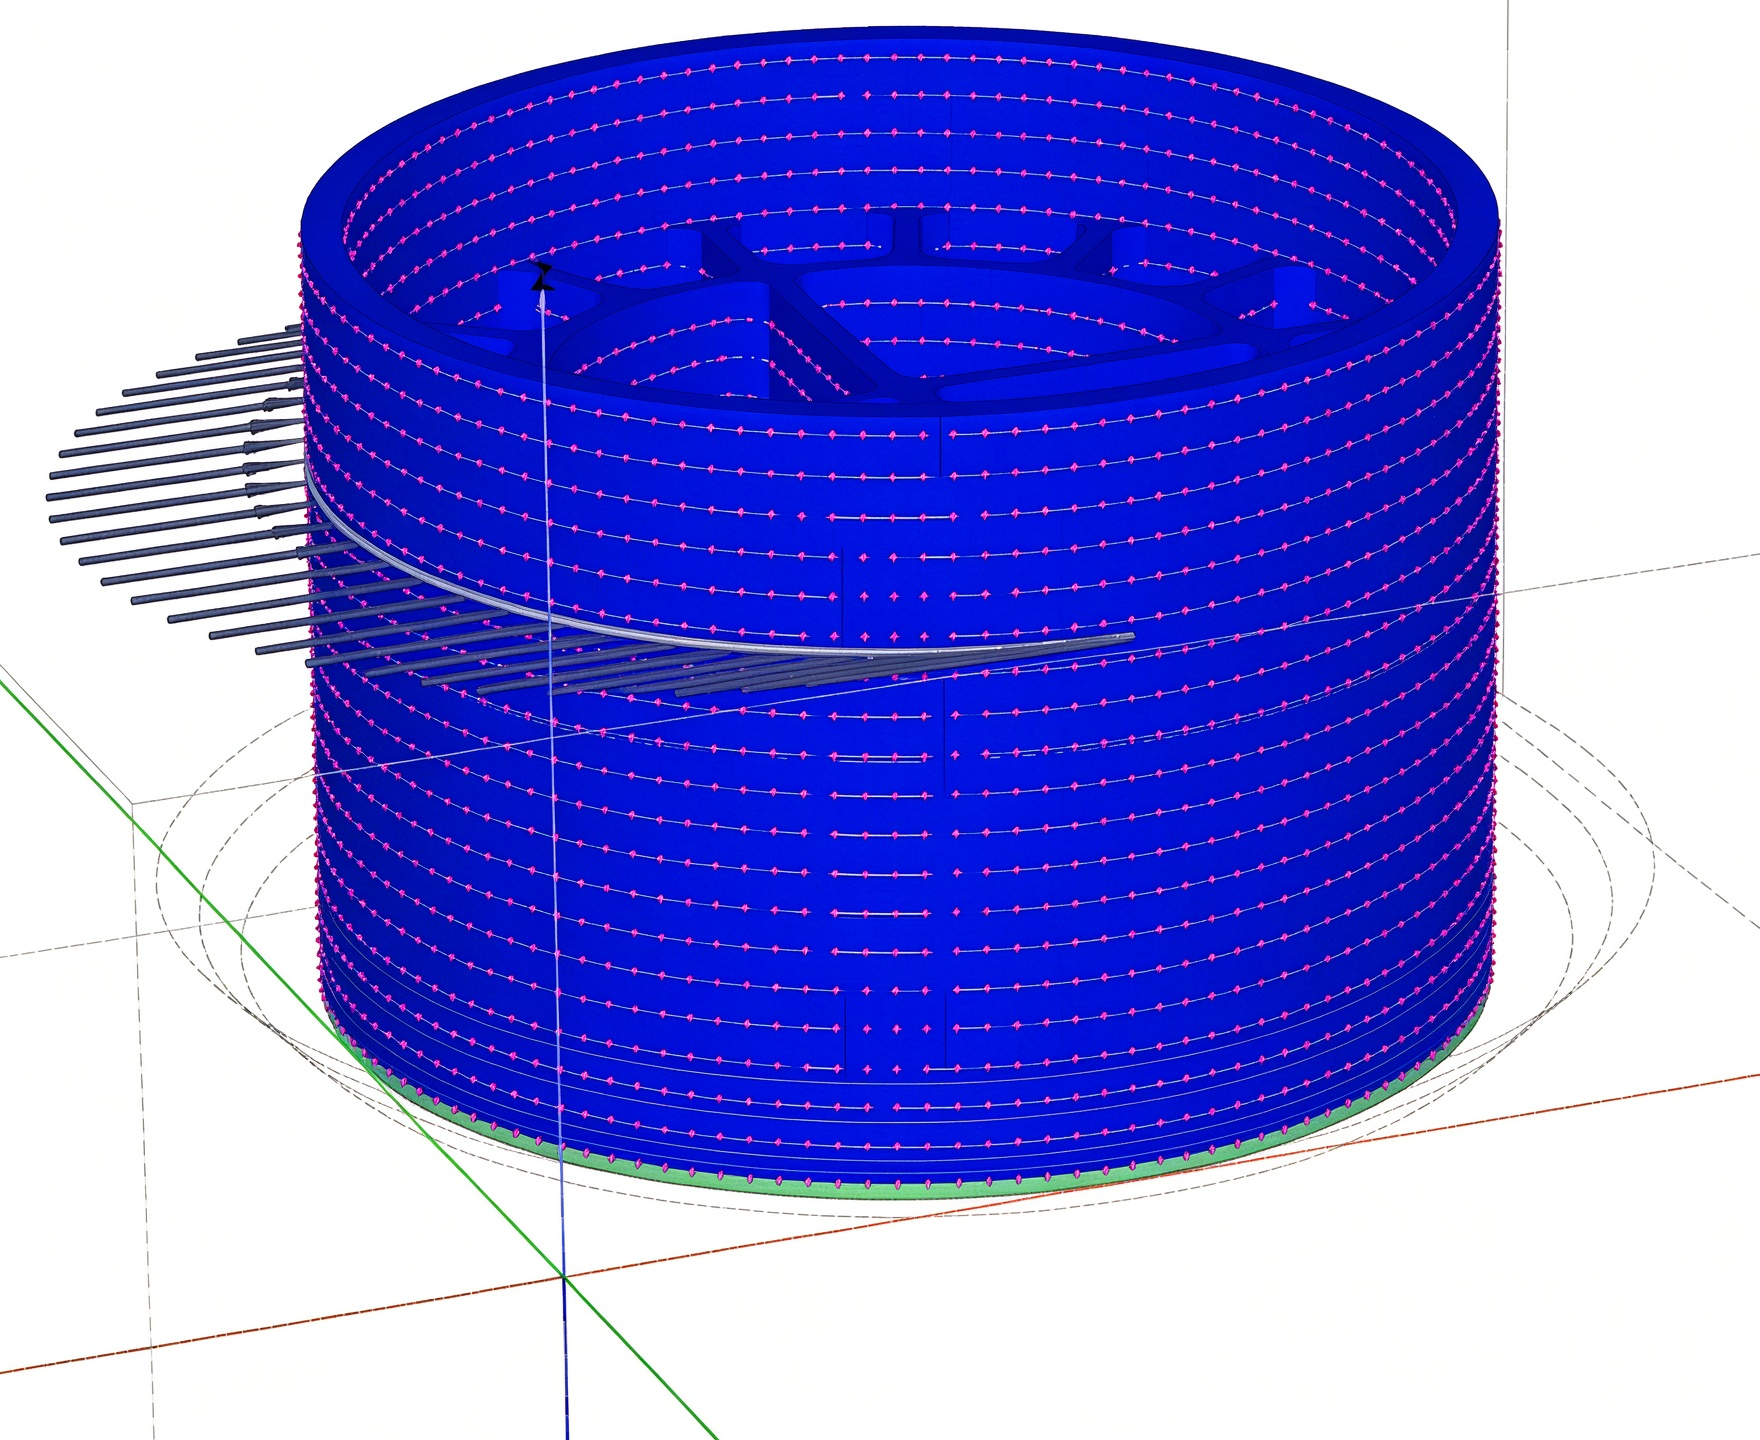
The wave load primarily acts near the water surface and can therefore be simplified as a line load. After converting FH into a line load based on the projection length, the resulting line load is 12.2167 kN/m, applied at a height of eH. For a wave height of 1 m, the wave line load calculated using the above method is 24.4334 kN/m and is also applied at height eH. The following Figure 14 shows a schematic diagram of the wave load application in the model.
Figure 14.
Schematic diagram of wave load application.
3.4. Definition of Operating Conditions
The working conditions are defined to cover the entire caisson construction process. Core filling is carried out in batches following the construction requirements, so as to investigate the deformation, stress, and bearing characteristics of the caisson structure as well as the bedrock response during construction. To examine the bearing behavior during the operational phase, four working conditions are defined with weak-layer thicknesses of 0.8, 0.6, 0.4, and 0.2 m. These four cases are intended as representative conditions rather than an exhaustive parametric sweep, and they are used to evaluate the load–displacement characteristics of the caisson structure under the most unfavorable scenario (Figure 15).
Figure 15.
Concrete pouring sequence.
3.5. Displacement Verification
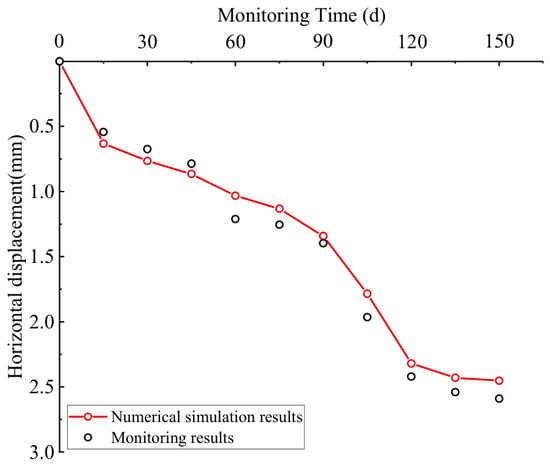
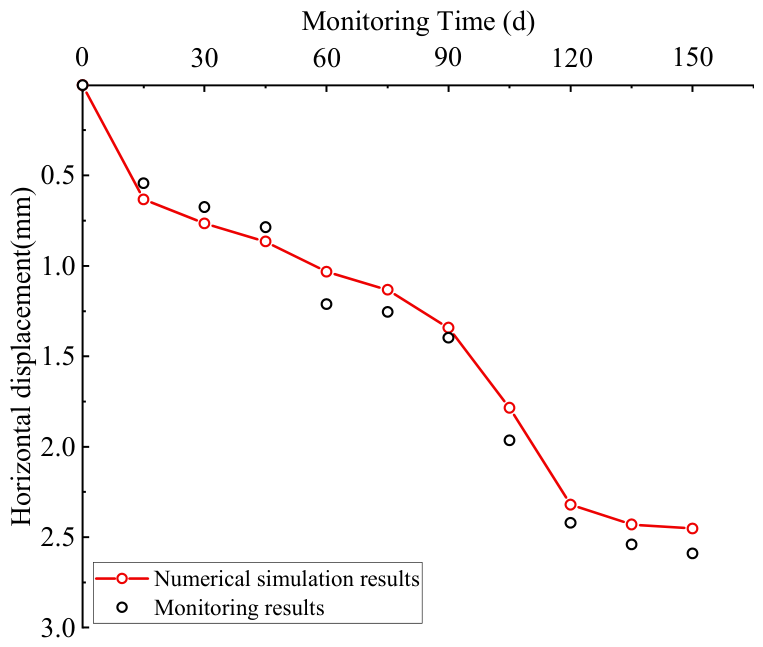
As shown in Figure 16, within the 150-day construction period of the open caisson structure, the monitored horizontal displacements and the numerical simulation results exhibit a generally consistent variation trend, both showing a growth pattern that is rapid at first and then slows down, which can be roughly divided into three stages: rapid growth, decelerating growth, and stabilization. The maximum monitored horizontal displacement is 2.59 mm, while the maximum value obtained from the numerical simulation is 2.452 mm. The absolute deviation between them is 0.138 mm, and the relative error is approximately 5.3% (with the monitored value as the baseline), indicating that the numerical model can well reflect the overall development pattern of the horizontal displacement of the open caisson structure. The monitored and simulated values show some deviations in local time intervals, which may mainly arise from disturbances to the structure itself during concrete filling construction, simplification of soil parameters and boundary conditions, time-varying effects of construction loads, and field monitoring errors. After the completion of concrete pouring, the horizontal displacement gradually stabilizes, indicating that the stress and deformation states of the structure gradually reach equilibrium after concrete filling is completed. Overall, the numerical simulation results agree well with the monitoring results and can serve as a reference basis for analyzing the development pattern of horizontal displacement during open caisson construction and evaluating structural stability.
Figure 16.
Comparison between monitored and simulated horizontal displacements.
4. Simulation Results
4.1. Displacement Variation Characteristics
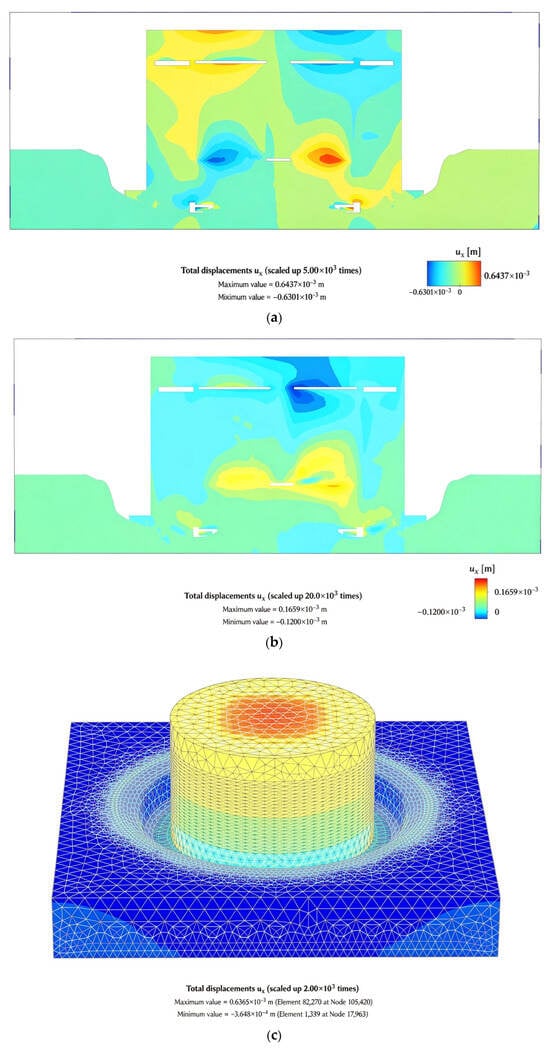
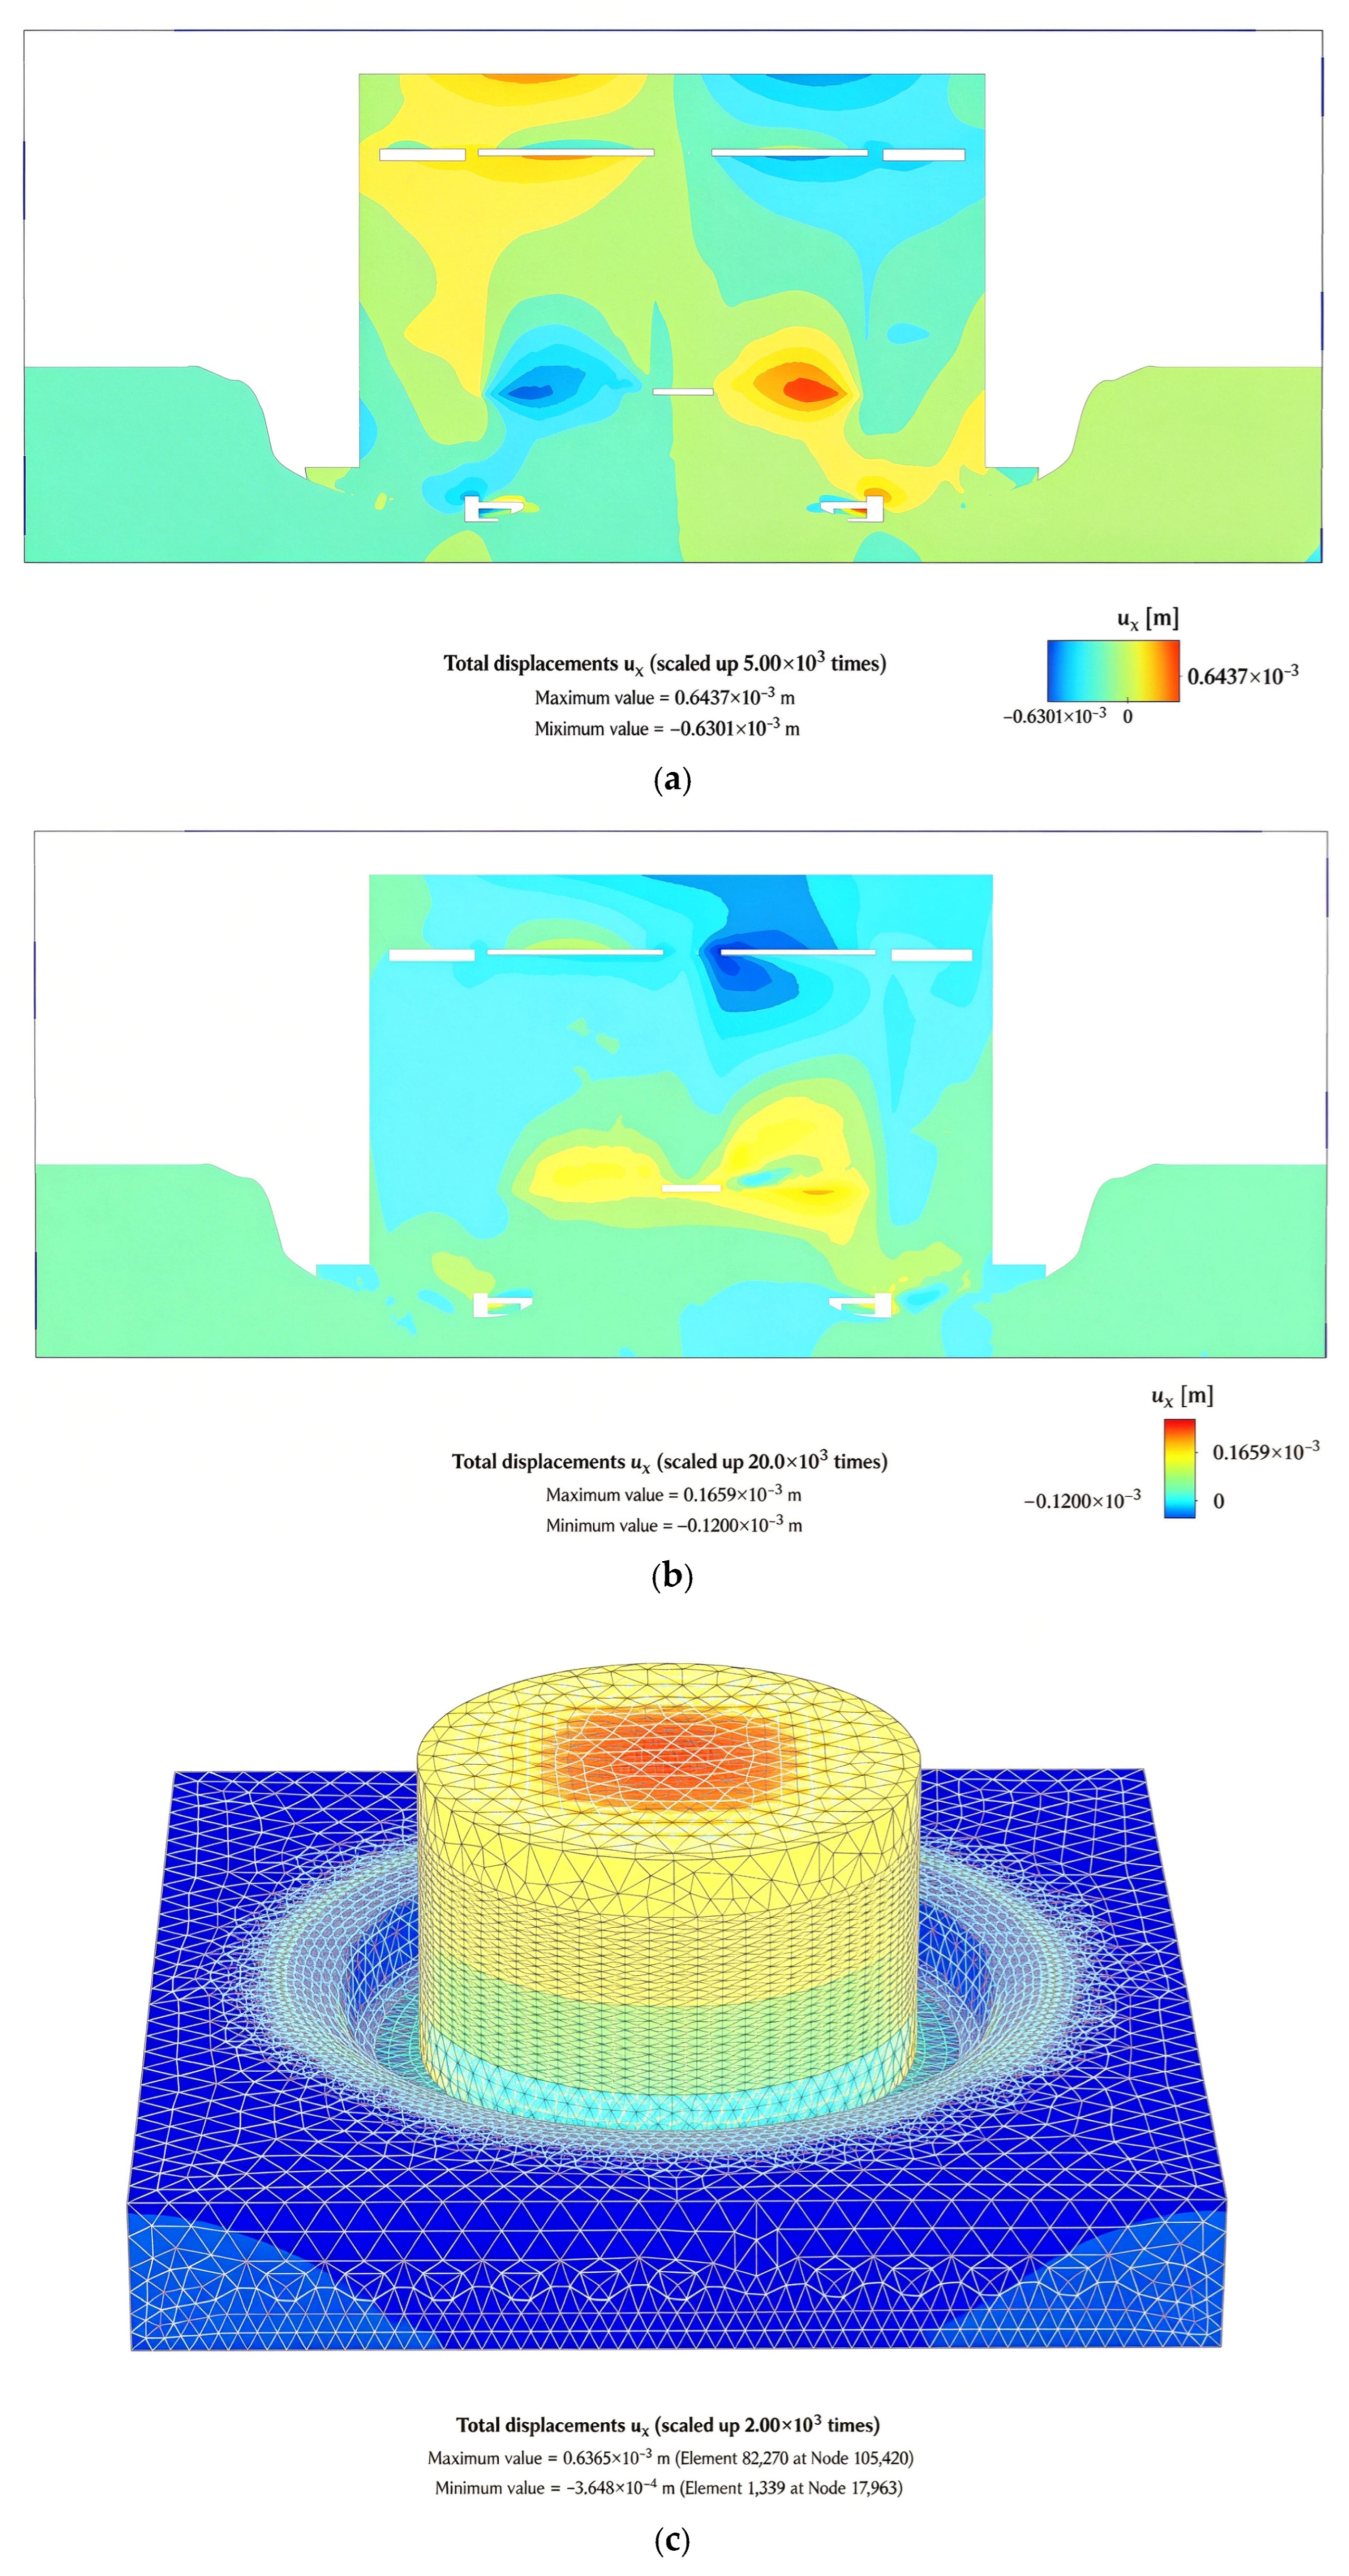
As shown in Figure 17, after the caisson sinking is completed, the maximum longitudinal displacement of the caisson is 0.6269 mm, occurring mainly on the right side of the middle compartment. The maximum transverse displacement is 0.6298 mm, also primarily distributed on the right side of the middle compartment. The maximum vertical displacement is 2.918 mm, mainly observed in the suspended part of the middle compartment. These results indicate that in bedrock containing weak layers, the lateral displacement generated during caisson sinking is relatively small. The vertical displacement is primarily governed by gravity, which causes a certain degree of displacement in the suspended portion of the middle caisson compartment.
Figure 17.
Displacement variation diagram during caisson sinking. (a) Horizontal offset profile in the x-direction during the sinking process of the caisson. (b) Horizontal offset profile in the y-direction during the sinking process of the caisson. (c) Vertical offset diagram during the sinking process of the caisson.
4.2. Stress Characteristics of Bedrock
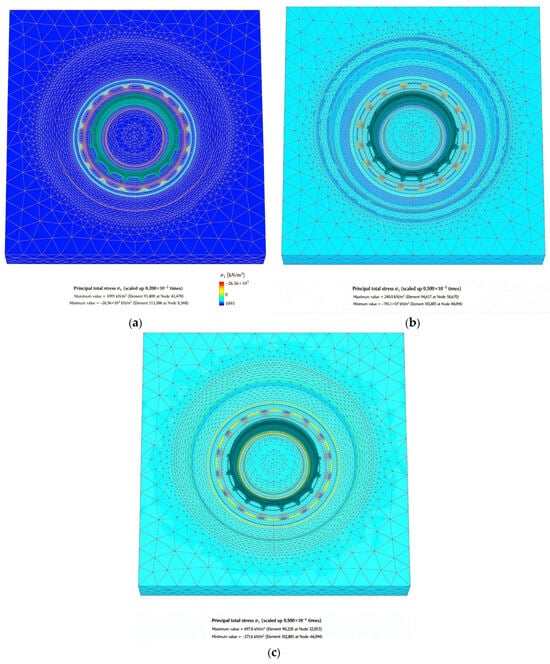
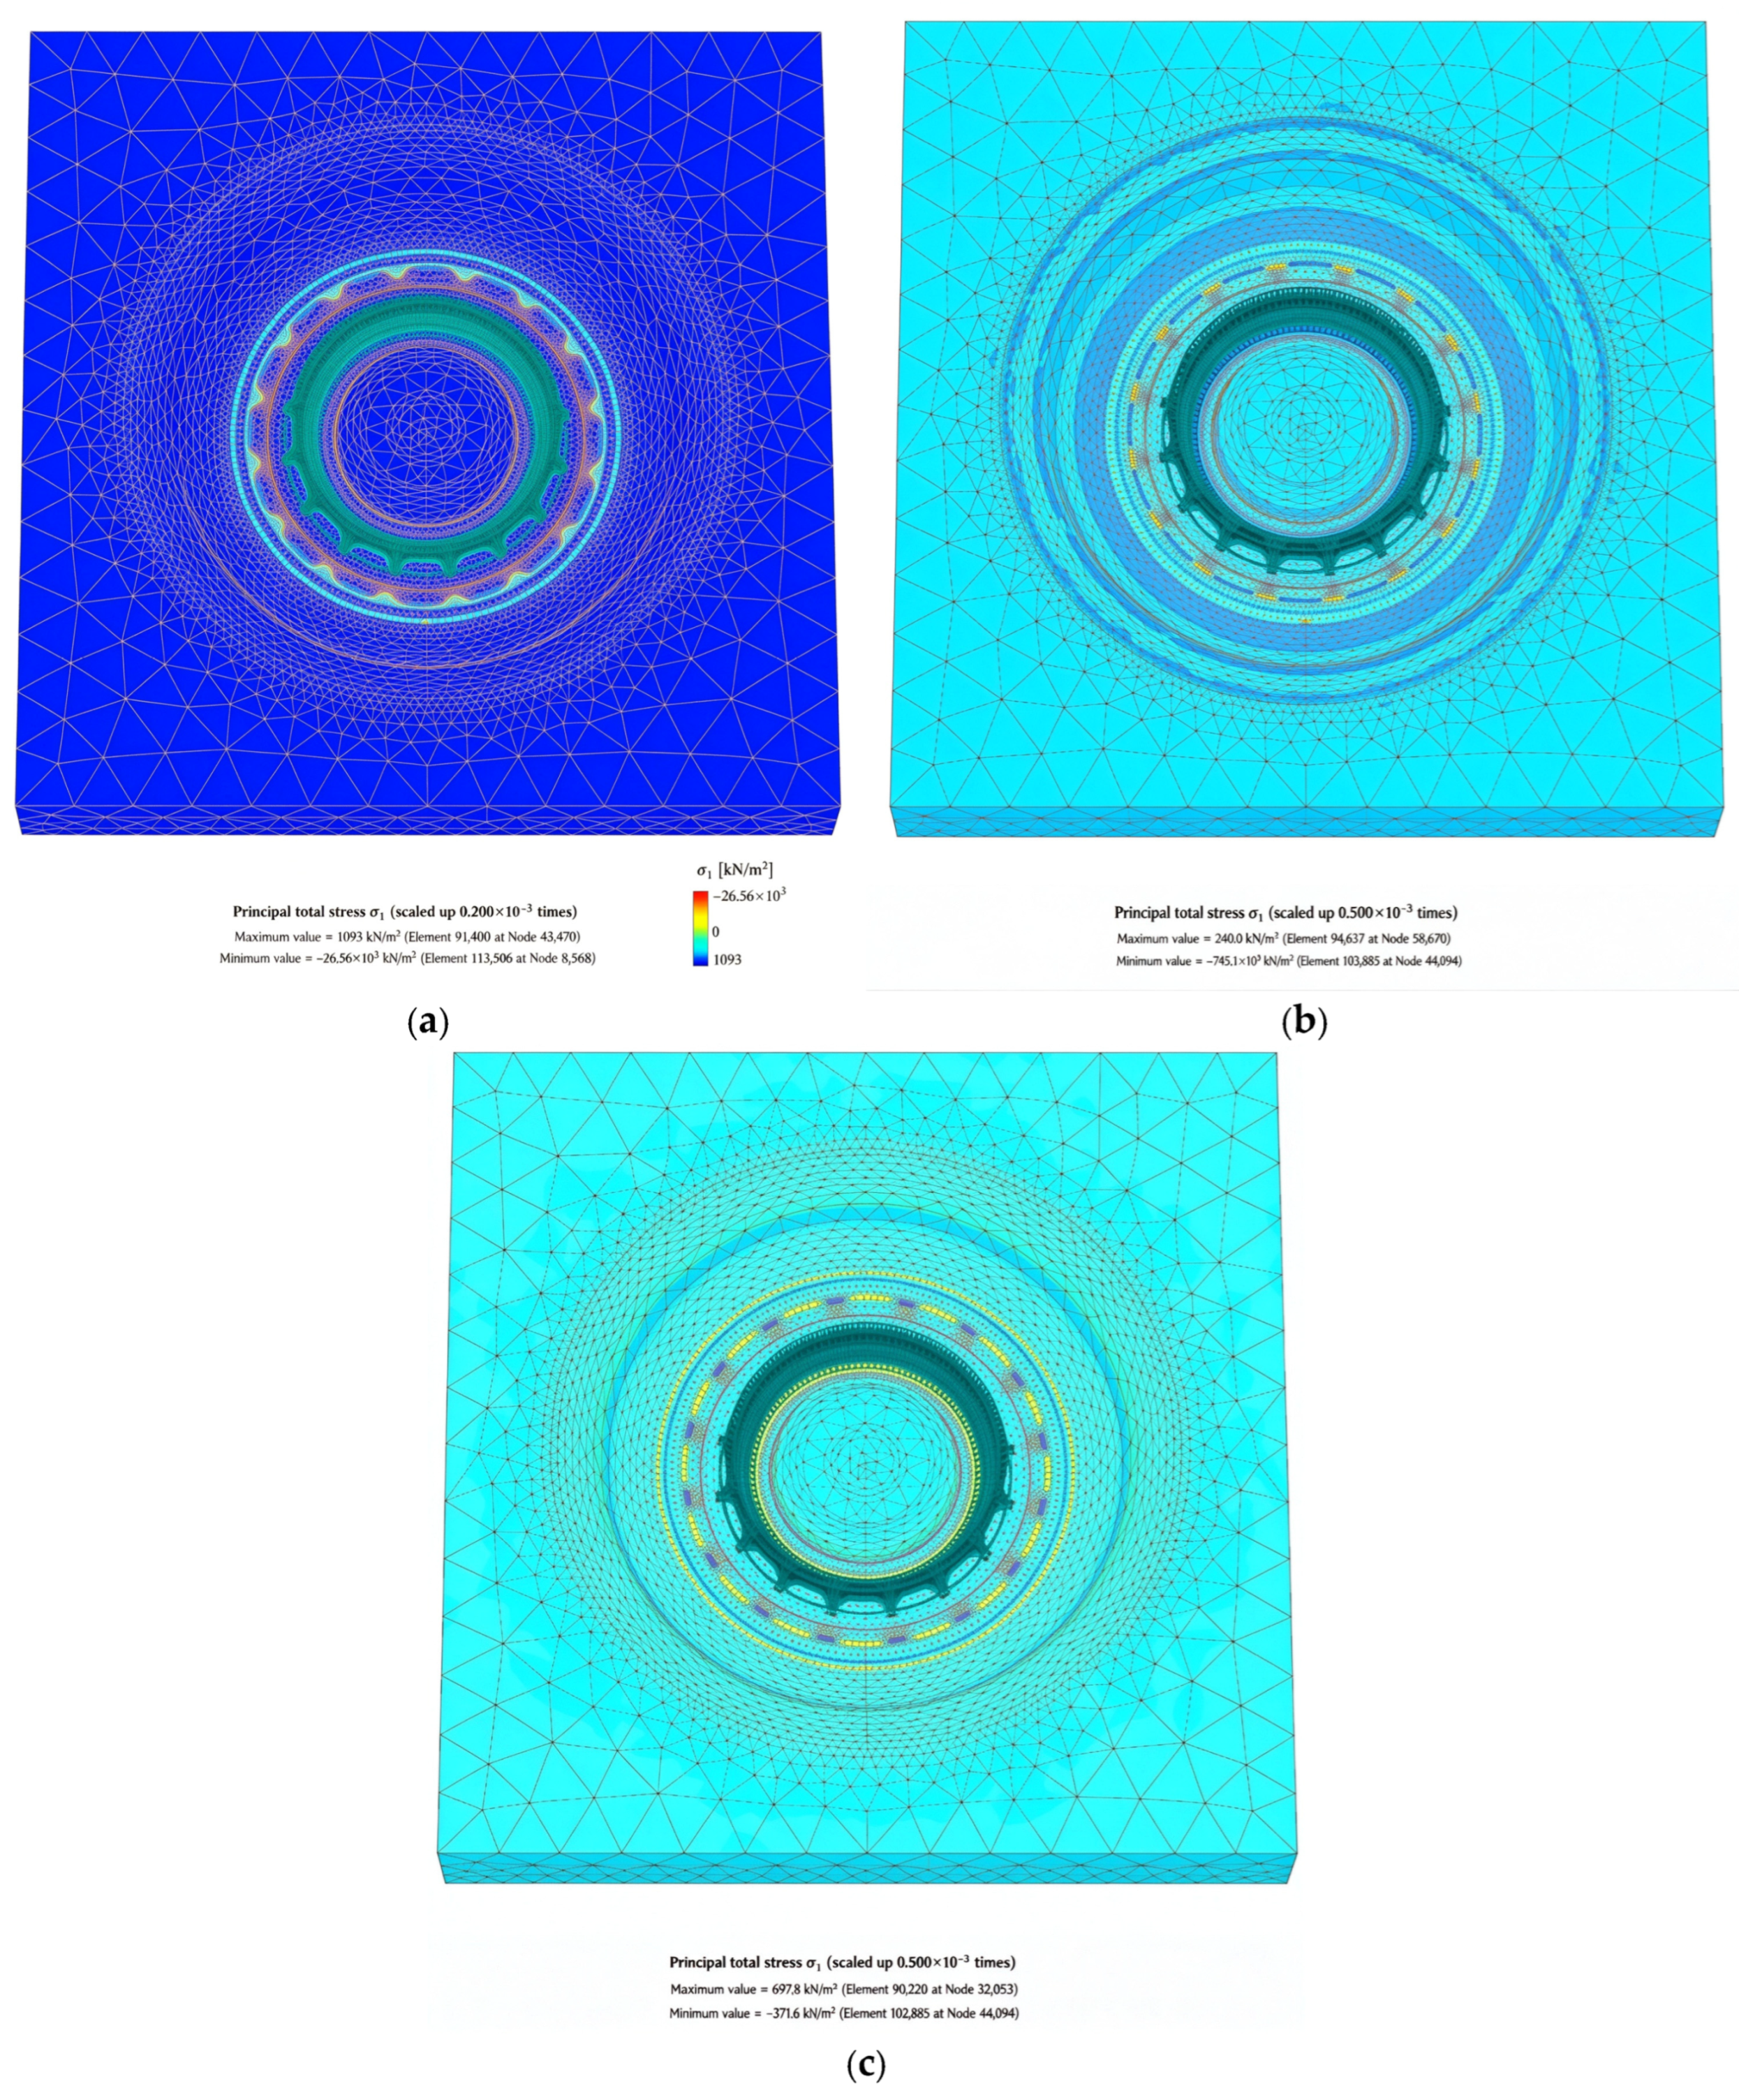
Figure 18 shows that after caisson sinking, stress concentrates at the caisson–bedrock interface. The maximum vertical stress (3825 kPa) occurs at the cutting edge in contact with weak layers and bedrock. The maximum longitudinal stress (966.2 kPa) and transverse stress (772.8 kPa) are both located in the low-lying areas of the uneven bedrock. Thus, on bedrock with weak interlayers, gravity governs the dominant vertical stress, while bedrock irregularity induces minor caisson offset, resulting in point-load stress concentrations at the base and generating secondary longitudinal and transverse stresses. It should be noted that, because shared nodes were used at the caisson–bedrock interface, interface separation and sliding were not represented. The localized stress concentrations reported in this section should therefore be interpreted with this limitation in mind, whereas the global stress and deformation trends are interpreted at a qualitative level and are not claimed to be independent of the interface assumption.
Figure 18.
Stress contour map of the bedrock model. (a) Vertical stress contour map. (b) Longitudinal stress contour map. (c) Transverse stress contour map.
4.3. Deformation and Stress Behavior of the Caisson Throughout the Entire Core-Filling Process
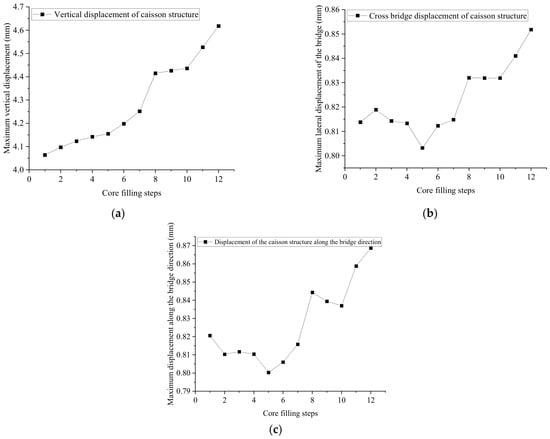
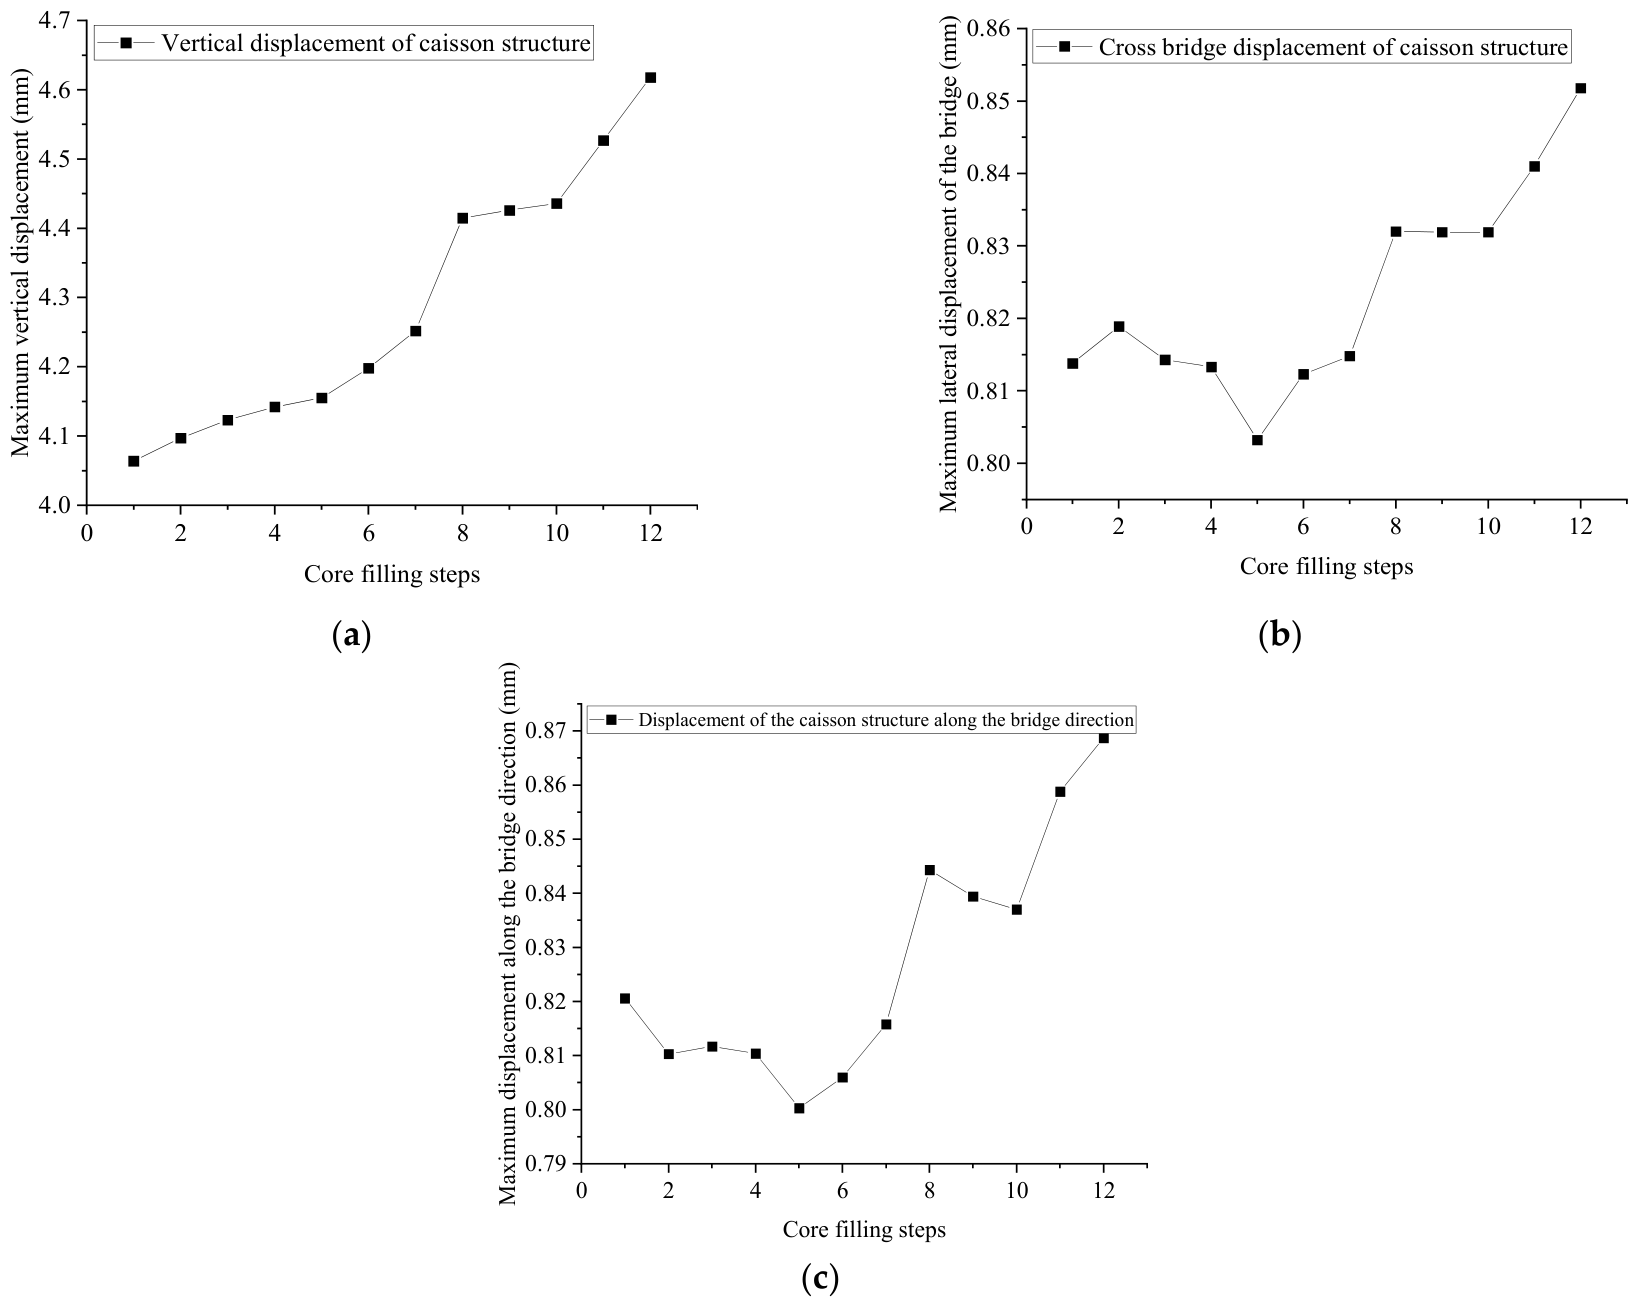
During the core-filling process, certain disturbances are imposed on the caisson structure. The relationship between the core-filling steps and the maximum displacement of the caisson is shown in Figure 19. It can be observed that as concrete is added, the vertical displacement continuously increases, reaching a maximum value of 4.65 mm. This is because the addition of concrete increases the self-weight of the caisson structure, leading to a sustained rise in vertical displacement.
Figure 19.
Deformation characteristics of caisson structure during core-filling process. (a) Maximum vertical displacement variation diagram. (b) Maximum displacement variation along the bridge direction. (c) Maximum transverse displacement variation diagram of the bridge.
The longitudinal displacement (along the bridge axis) and the transverse displacement show a fluctuating upward trend with the addition of concrete, with maximum values of 0.854 mm and 0.87 mm, respectively. This behavior is attributed to the fact that concrete addition progressively alters the properties of the gravel at the bedrock bottom, promoting continuous integration among the bedrock, gravel, and concrete. Under the action of gravitational loading, the caisson undergoes certain horizontal displacements until a new equilibrium is reached.
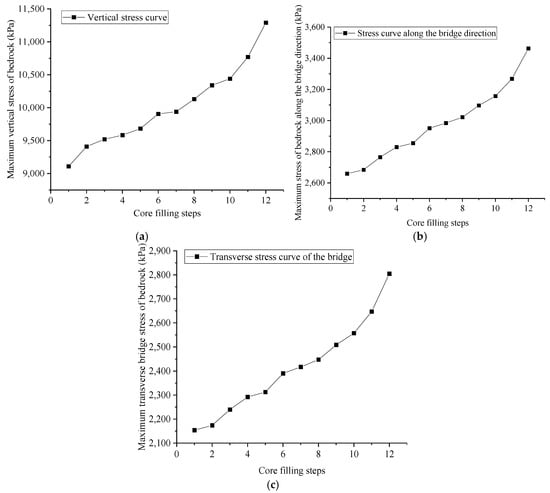
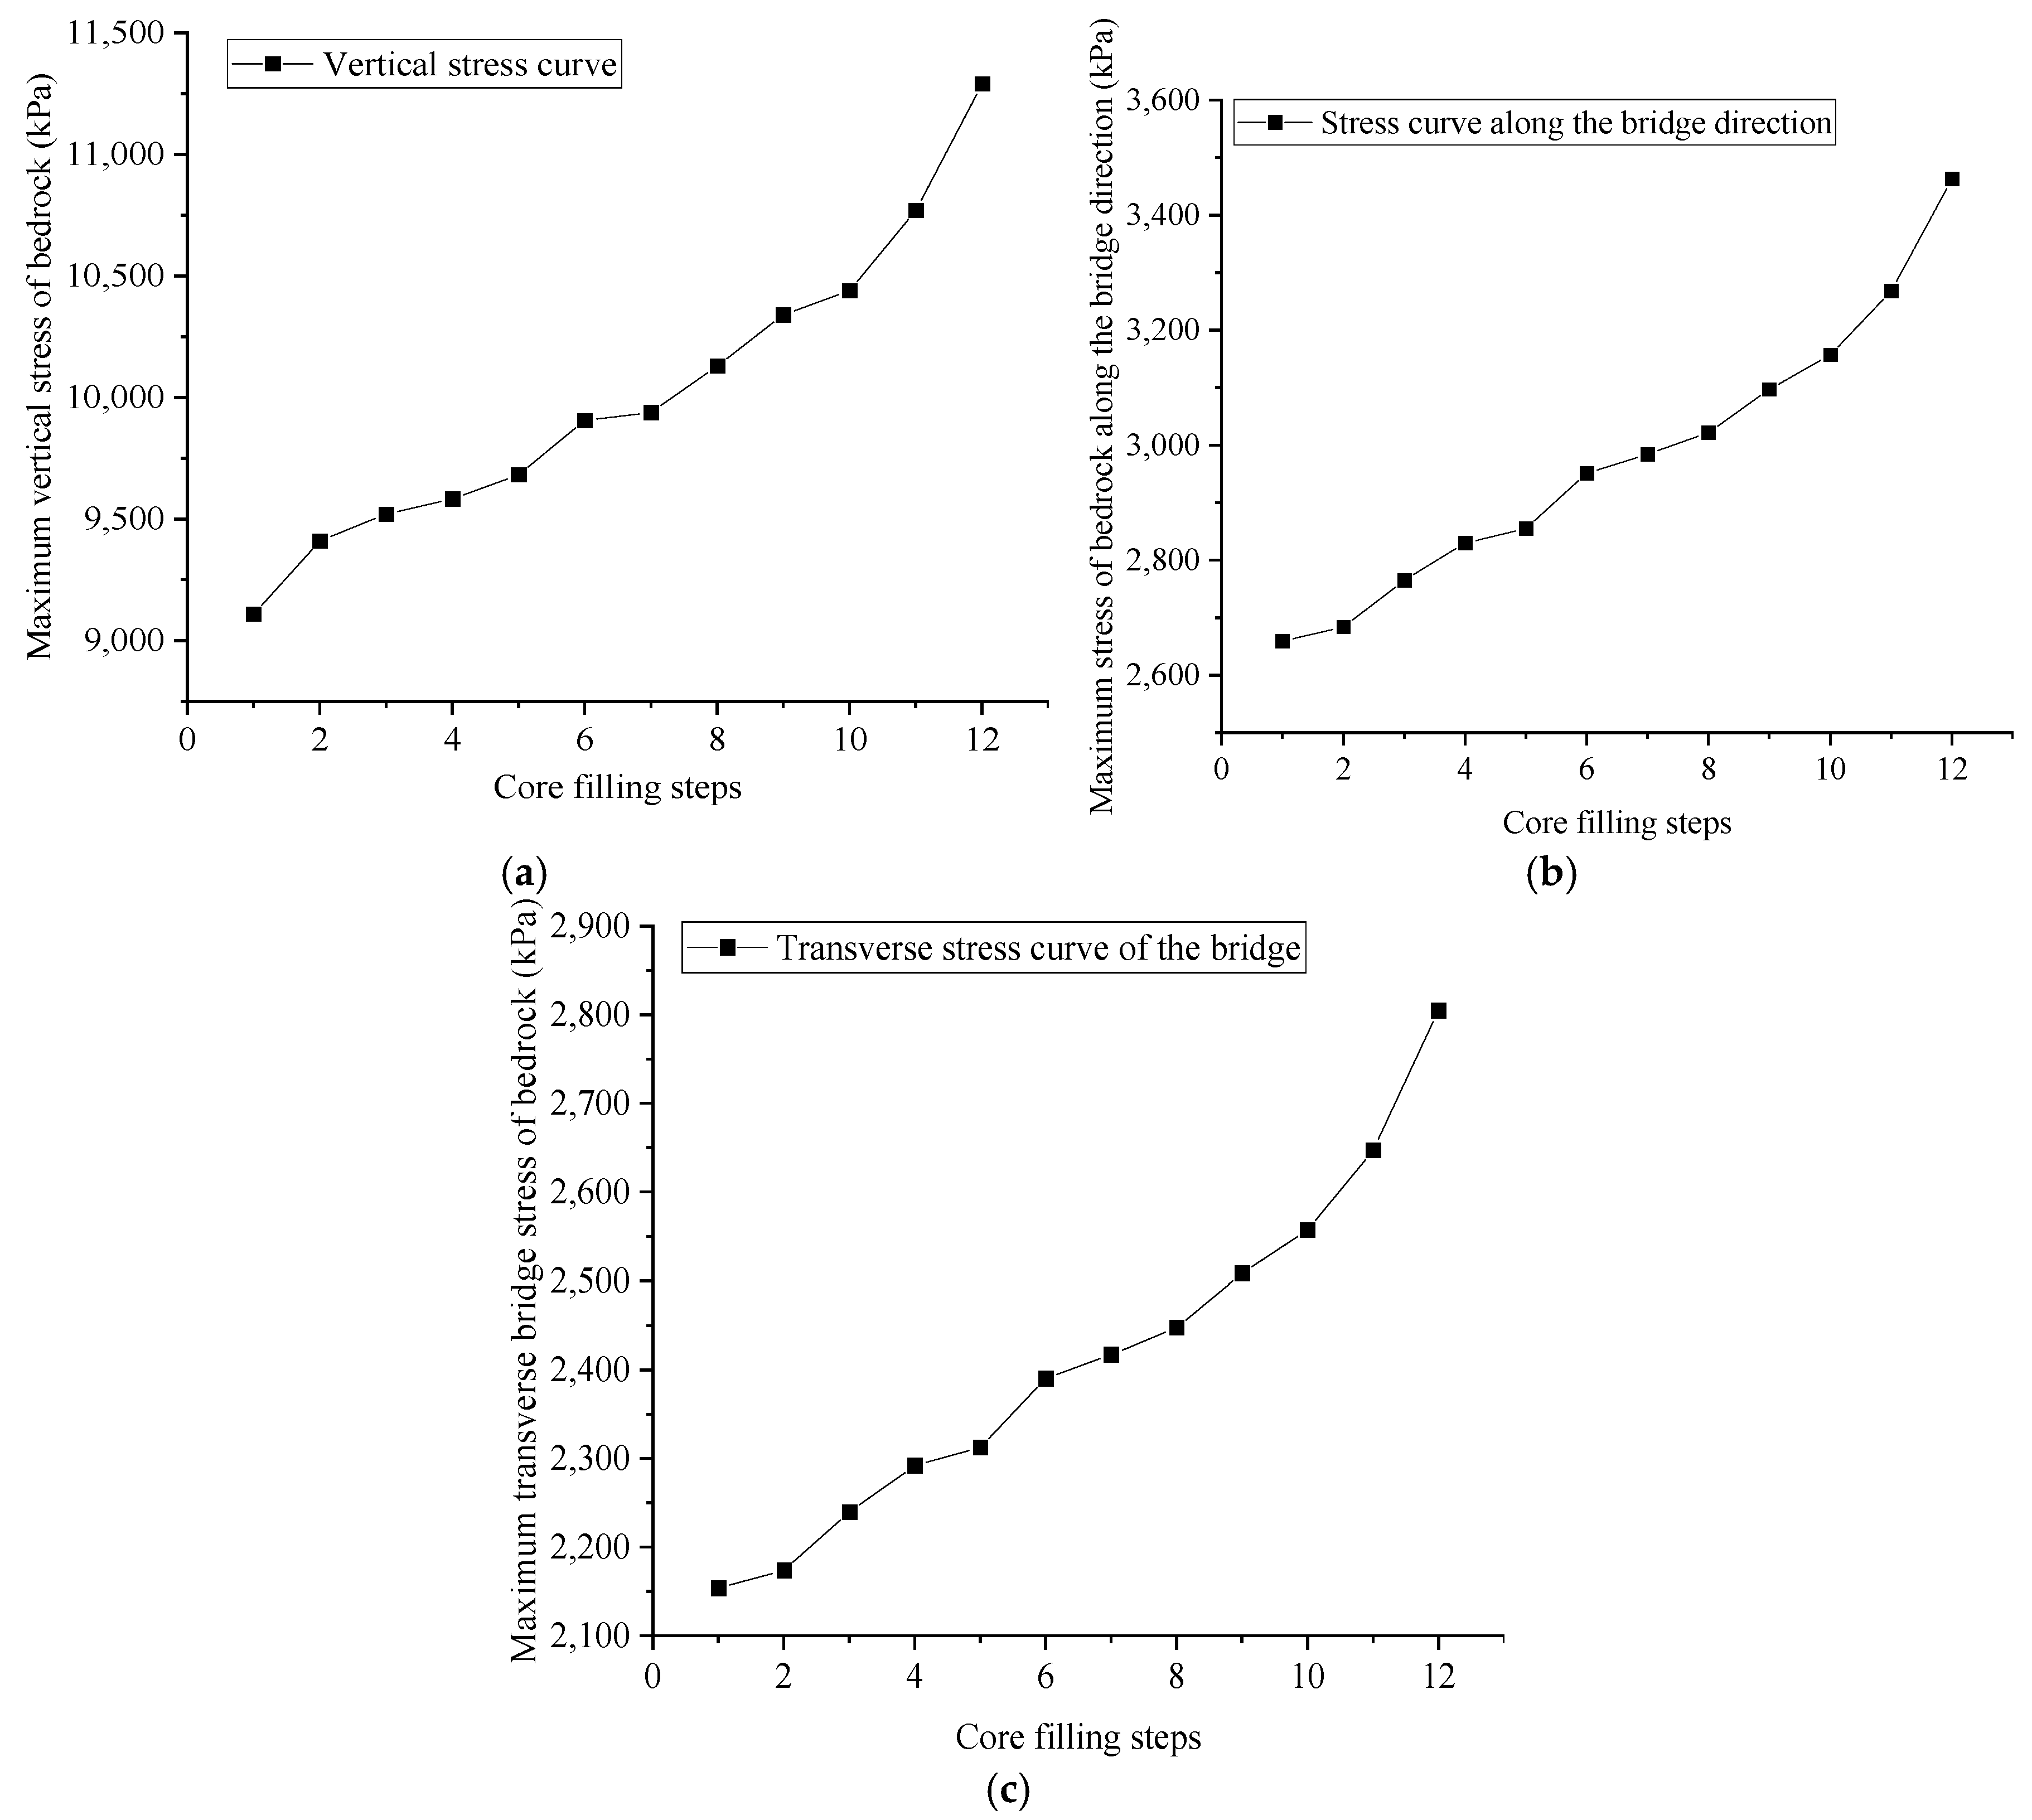
During core filling, the continuous addition of concrete causes the maximum vertical, longitudinal, and transverse stresses at the bedrock–caisson interface to increase steadily. After bottom sealing, the maximum vertical stress at the caisson–bedrock contact reaches 11,354 kPa, with longitudinal and transverse stresses reaching 3501 kPa and 2803 kPa, respectively. The reason is that concrete filling increases the caisson’s self-weight, which progressively raises the vertical stress on the weak-layer-bearing bedrock at the cutting edge. Consequently, the caisson settles or displaces slightly, inducing horizontal stresses in the bedrock. Both vertical and horizontal stresses increase with additional concrete fill until a new equilibrium is achieved (Figure 20).
Figure 20.
Stress characteristics of caisson structure during core-filling process. (a) Maximum vertical stress variation diagram. (b) Maximum longitudinal stress variation along the bridge. (c) Maximum transverse bridge stress variation.
4.4. Deformation of Caisson Structure Under Load
The caisson structure enters service immediately after concrete pouring is completed. Therefore, in numerical simulations, the loads transmitted from the upper structure to the caisson must be taken into account. According to the construction design documents, the most unfavorable loads to which the caisson is subjected during operation are as follows: maximum axial force = −2,311,200 kN (negative sign denotes compression), maximum shear force = 81,360 kN, and maximum bending moment = 2,914,107 kN·m. These loads will be applied as boundary conditions at the top of the caisson to evaluate its structural safety and deformation characteristics throughout its service life.
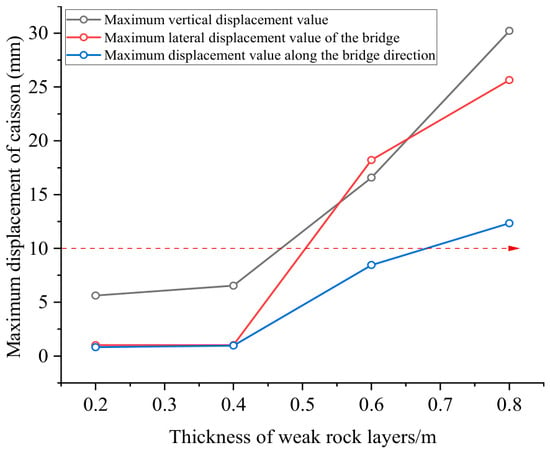
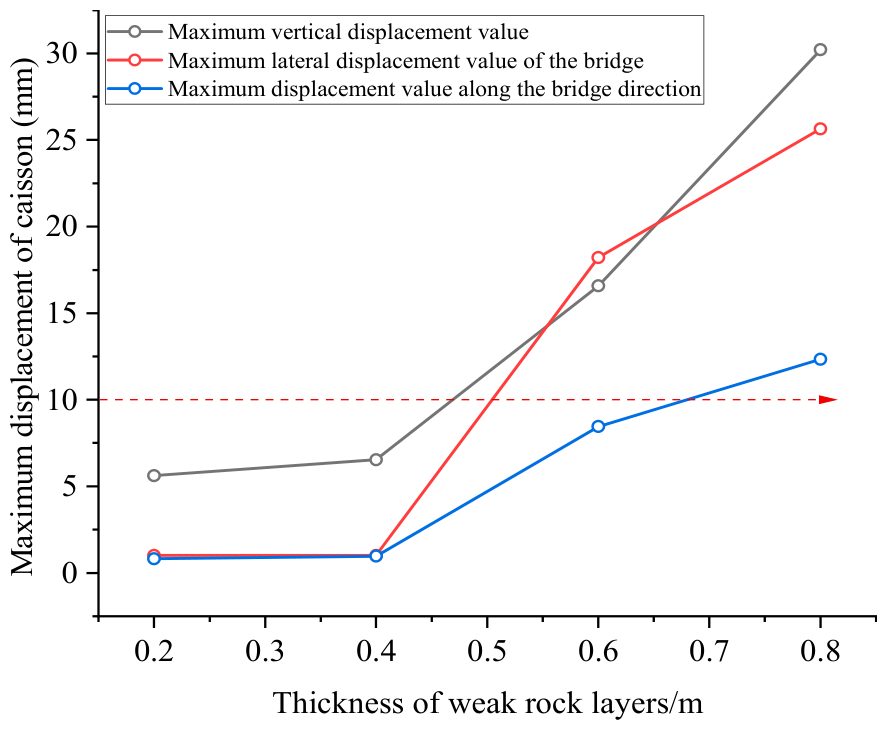
To simultaneously consider the influence of different thicknesses of weak rock layers on the stress and deformation of the caisson structure during operation, Figure 21 shows the displacement changes in the caisson structure under combined loads under different thicknesses of weak rock layers.
Figure 21.
Displacement changes in the caisson structure under combined loads under different thicknesses of weak rock layers.
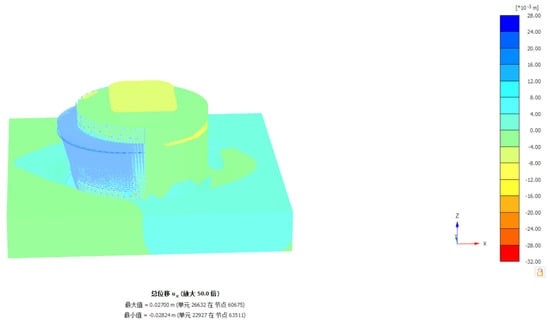
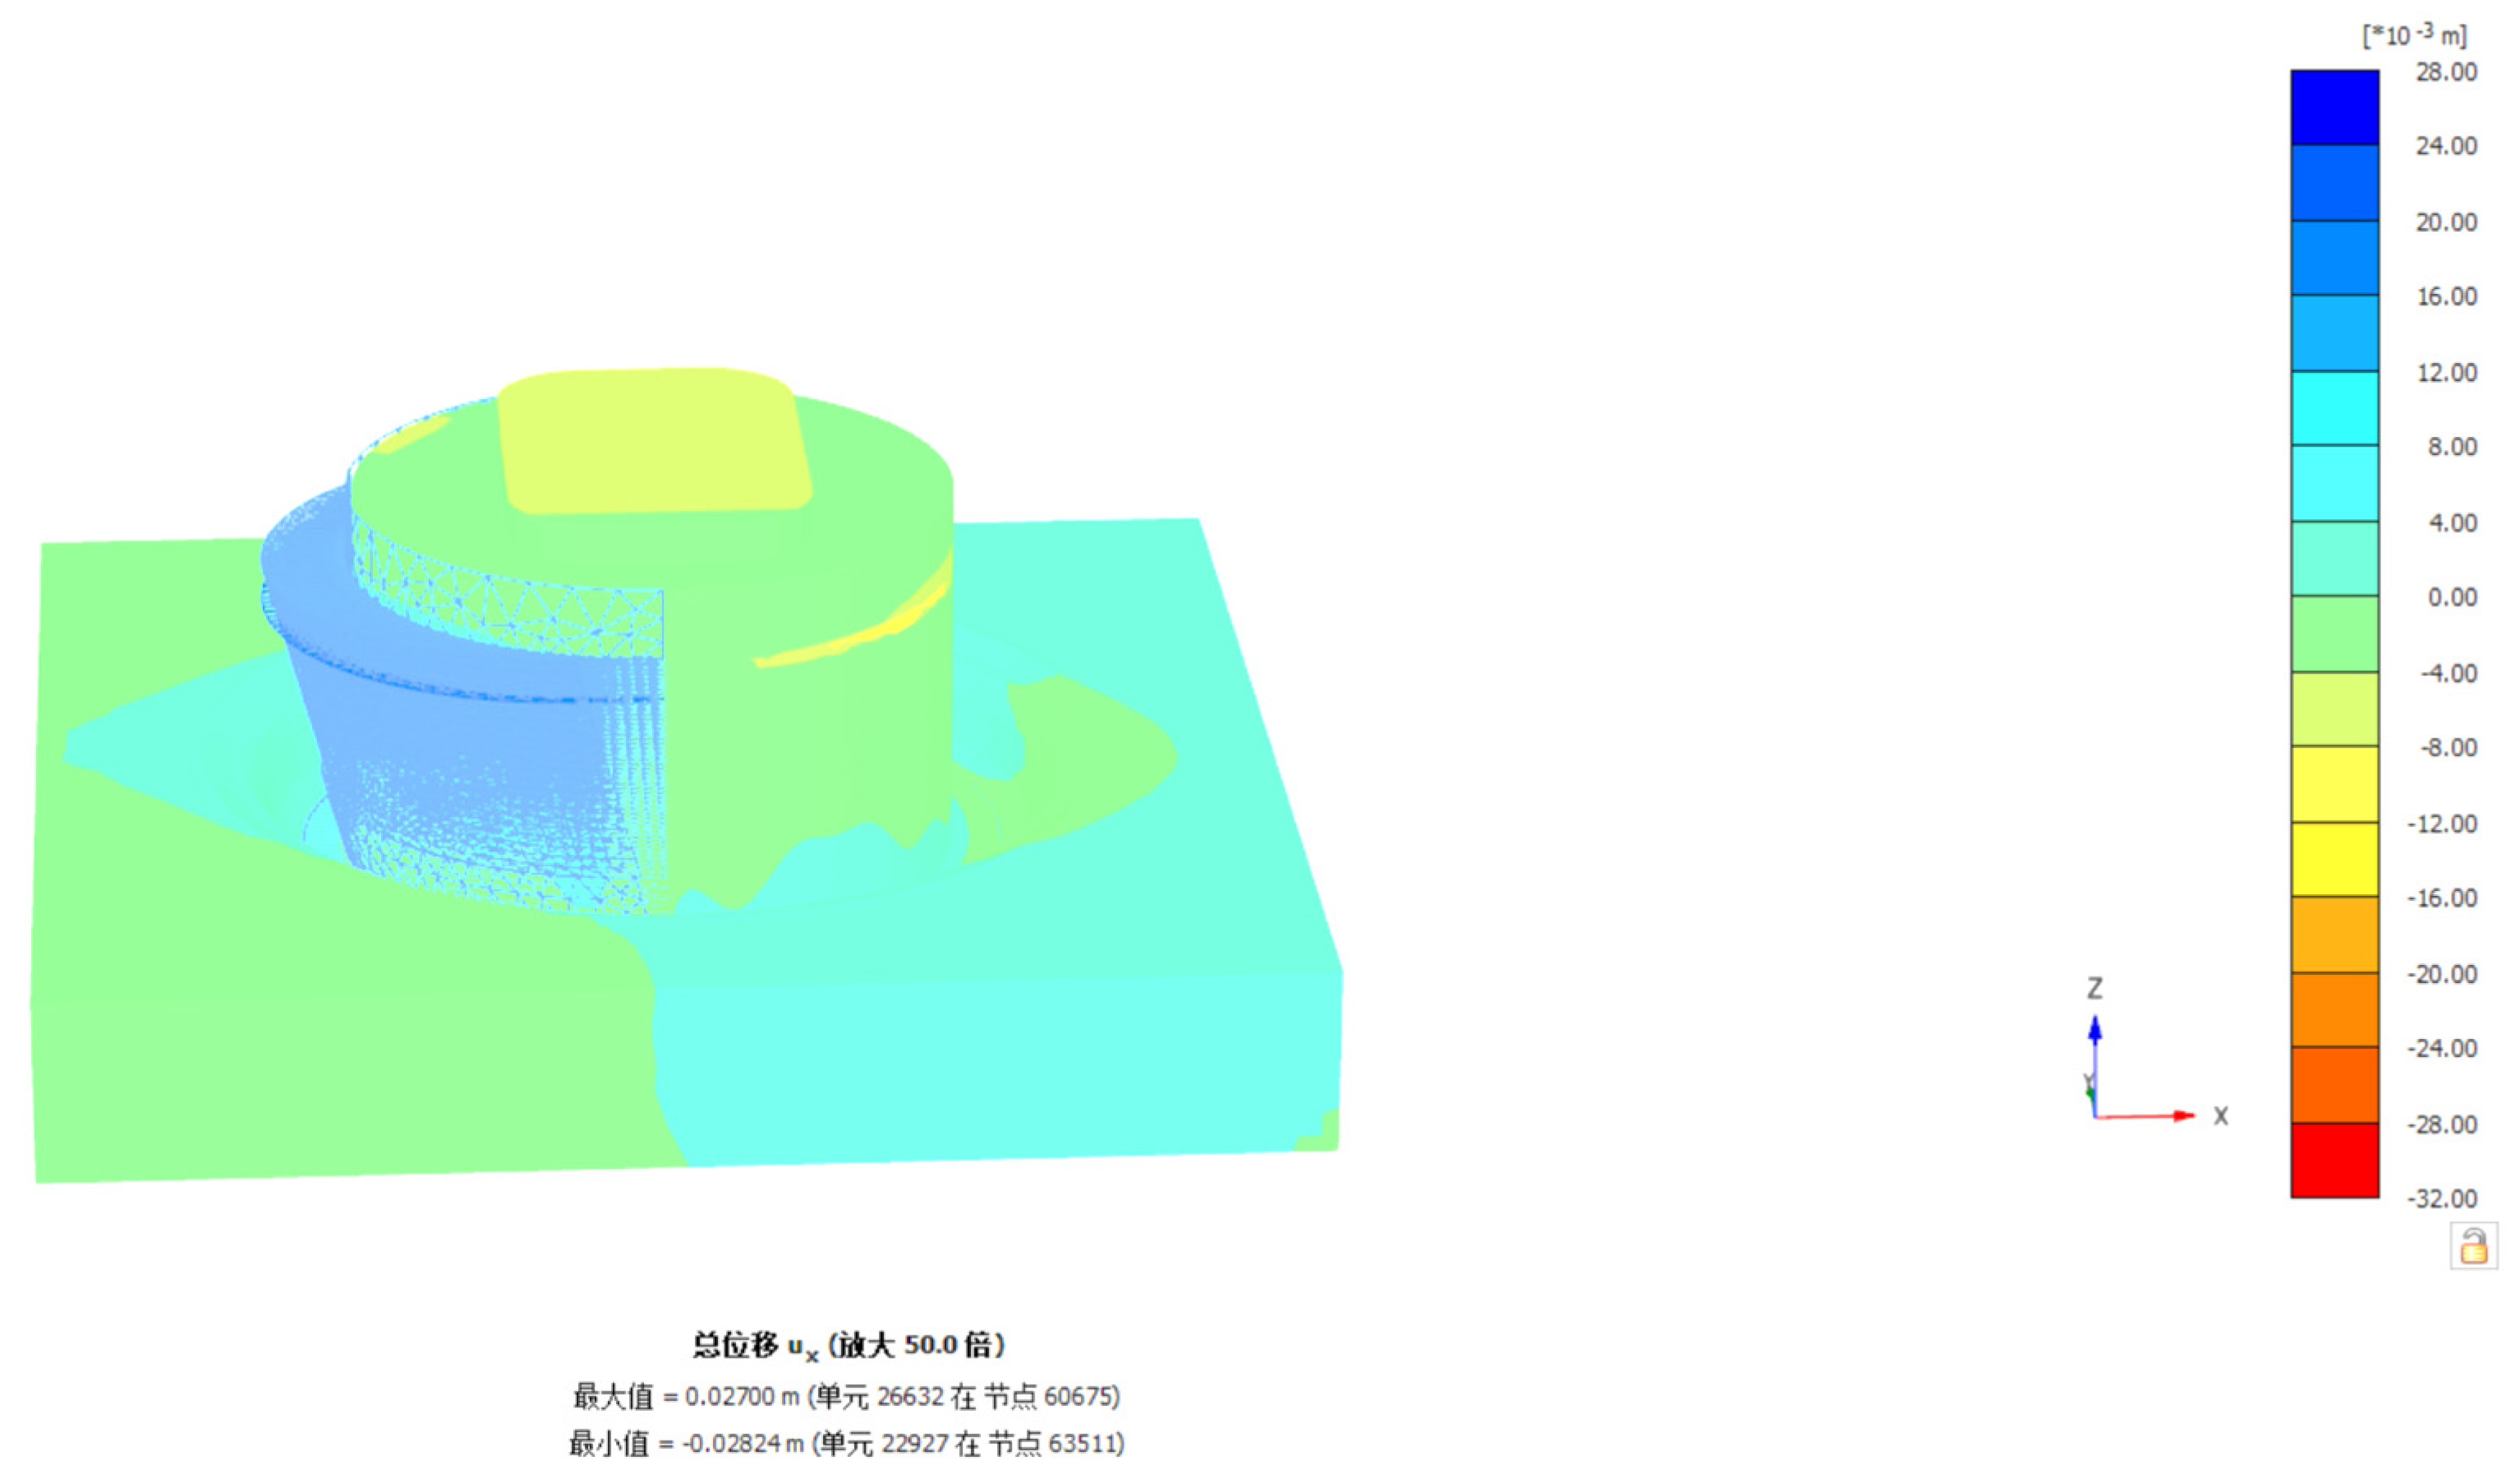
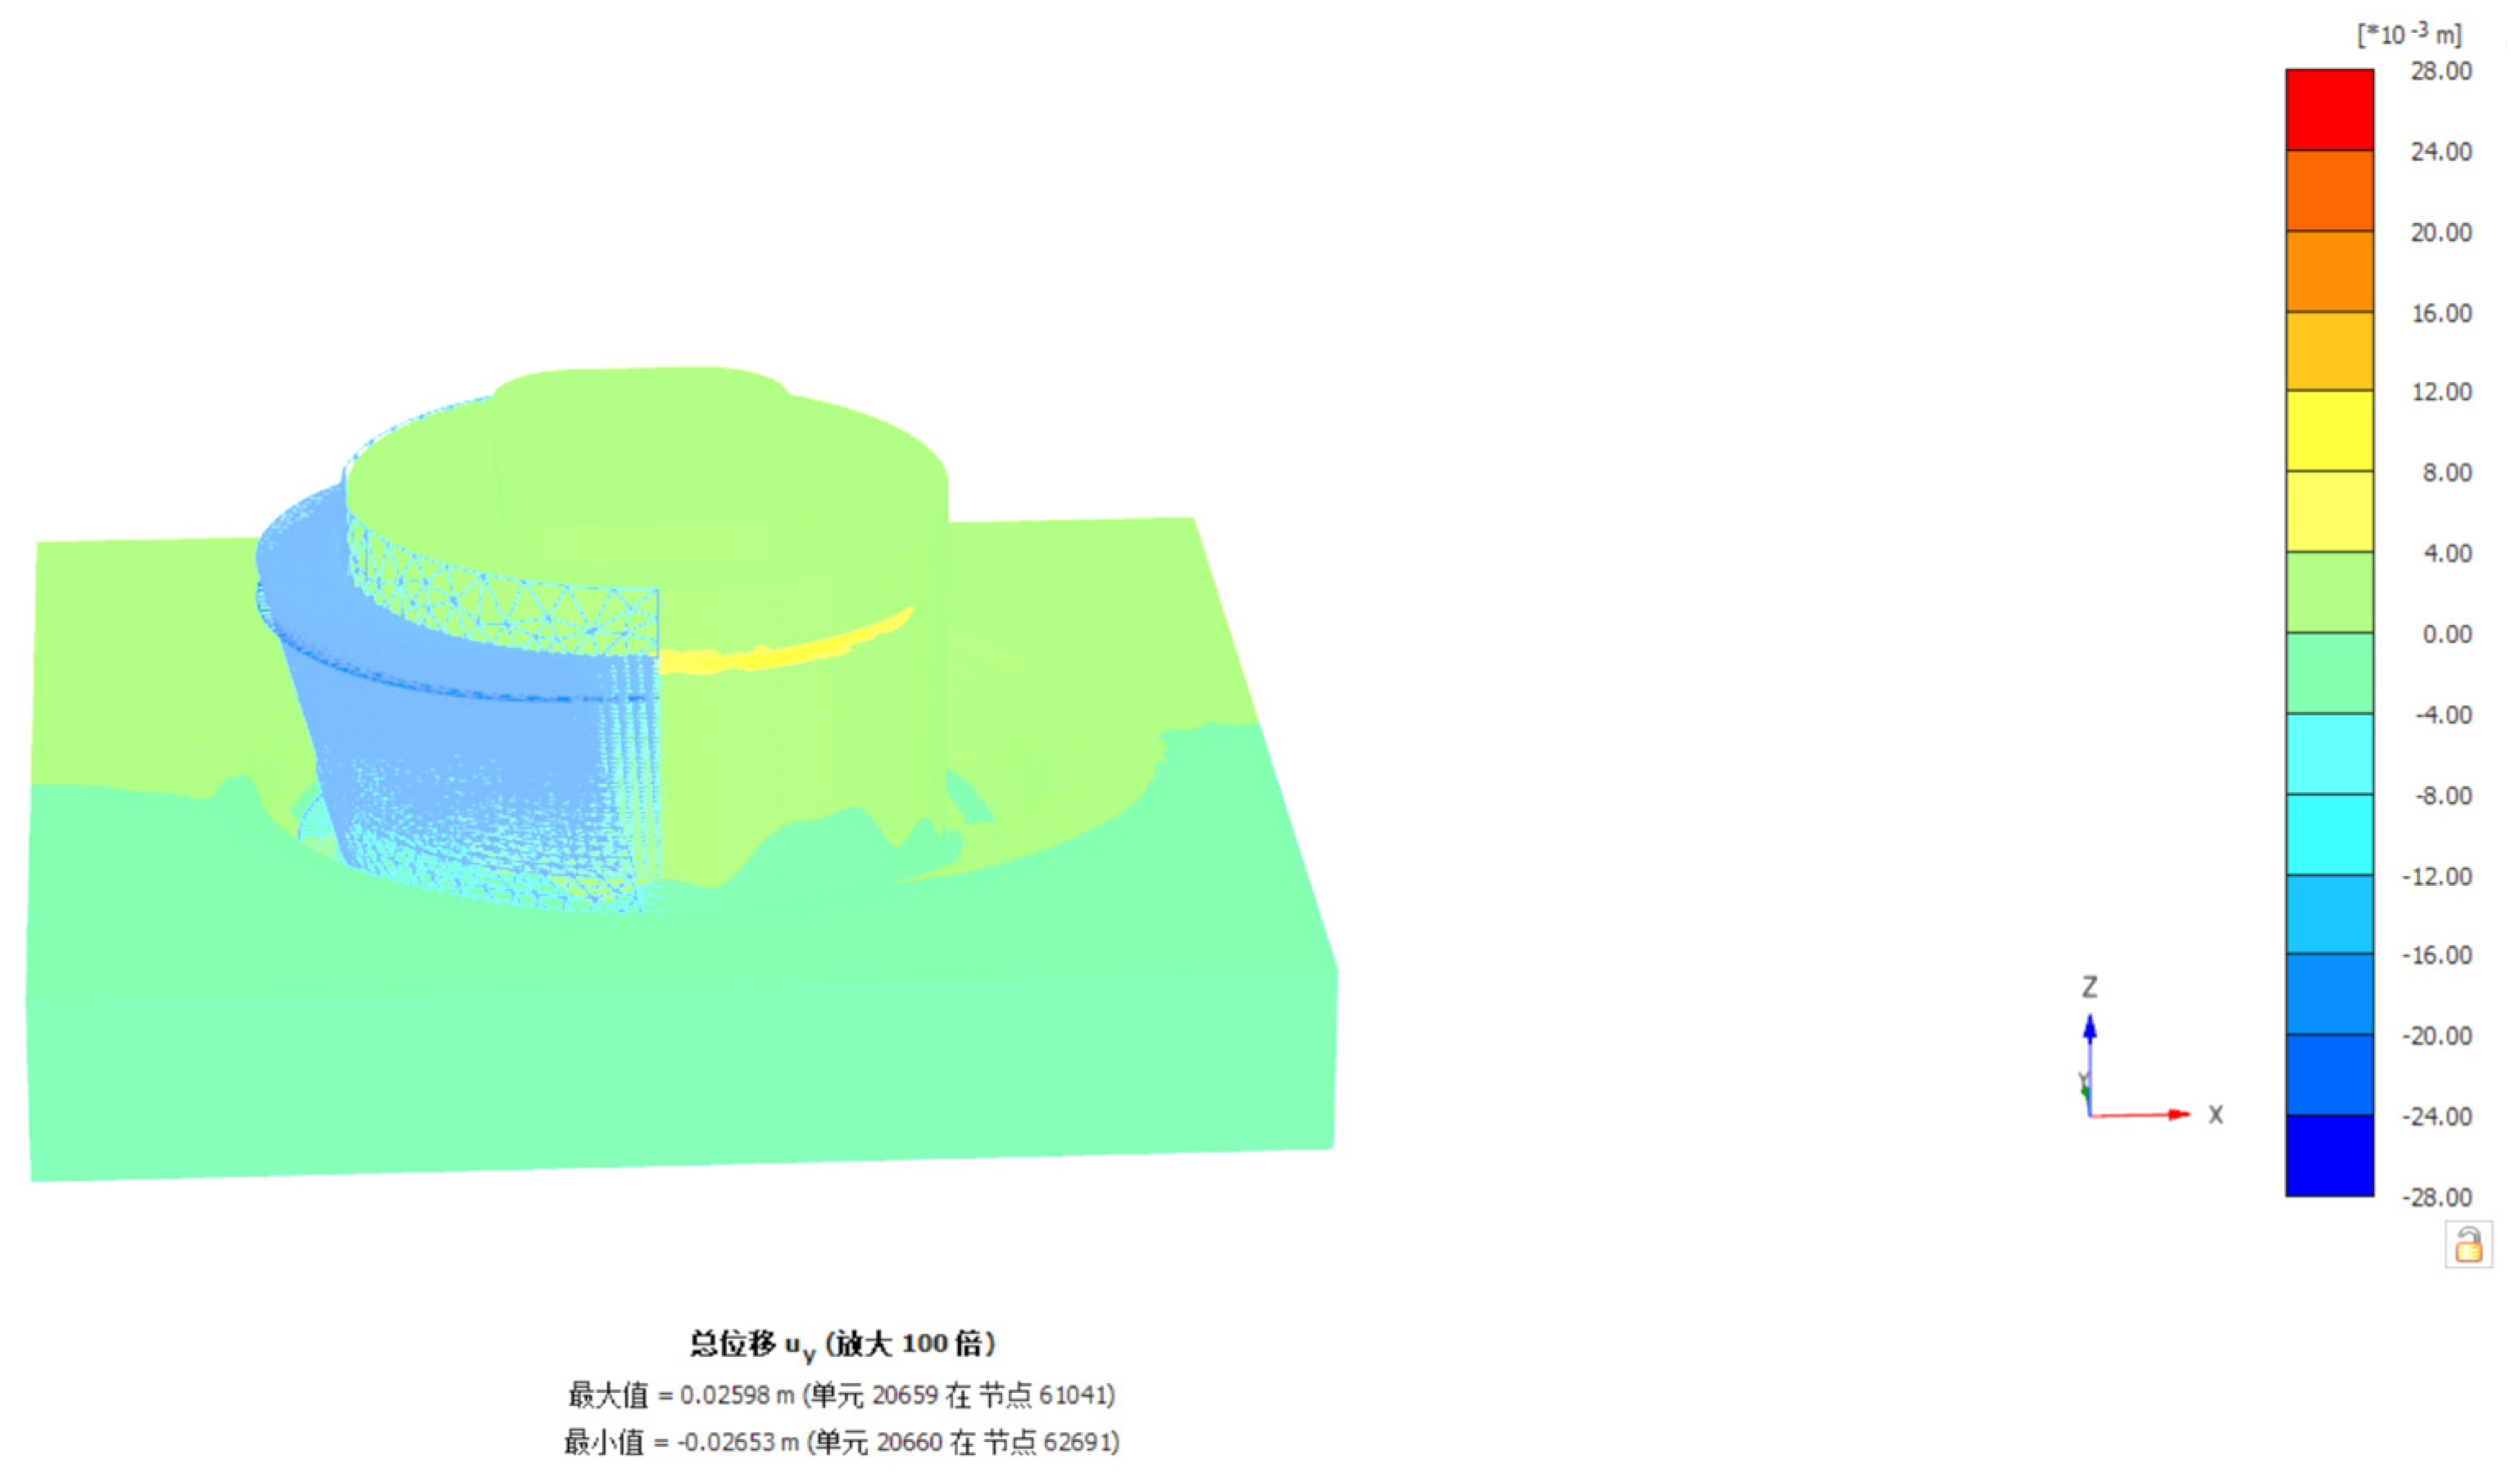
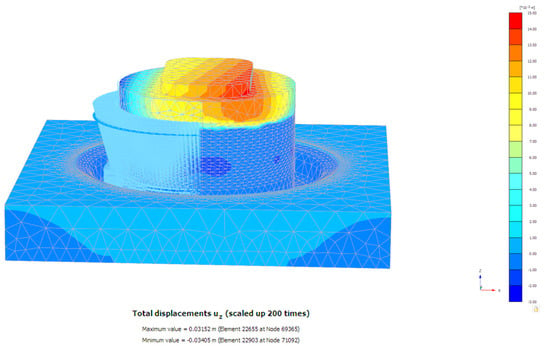
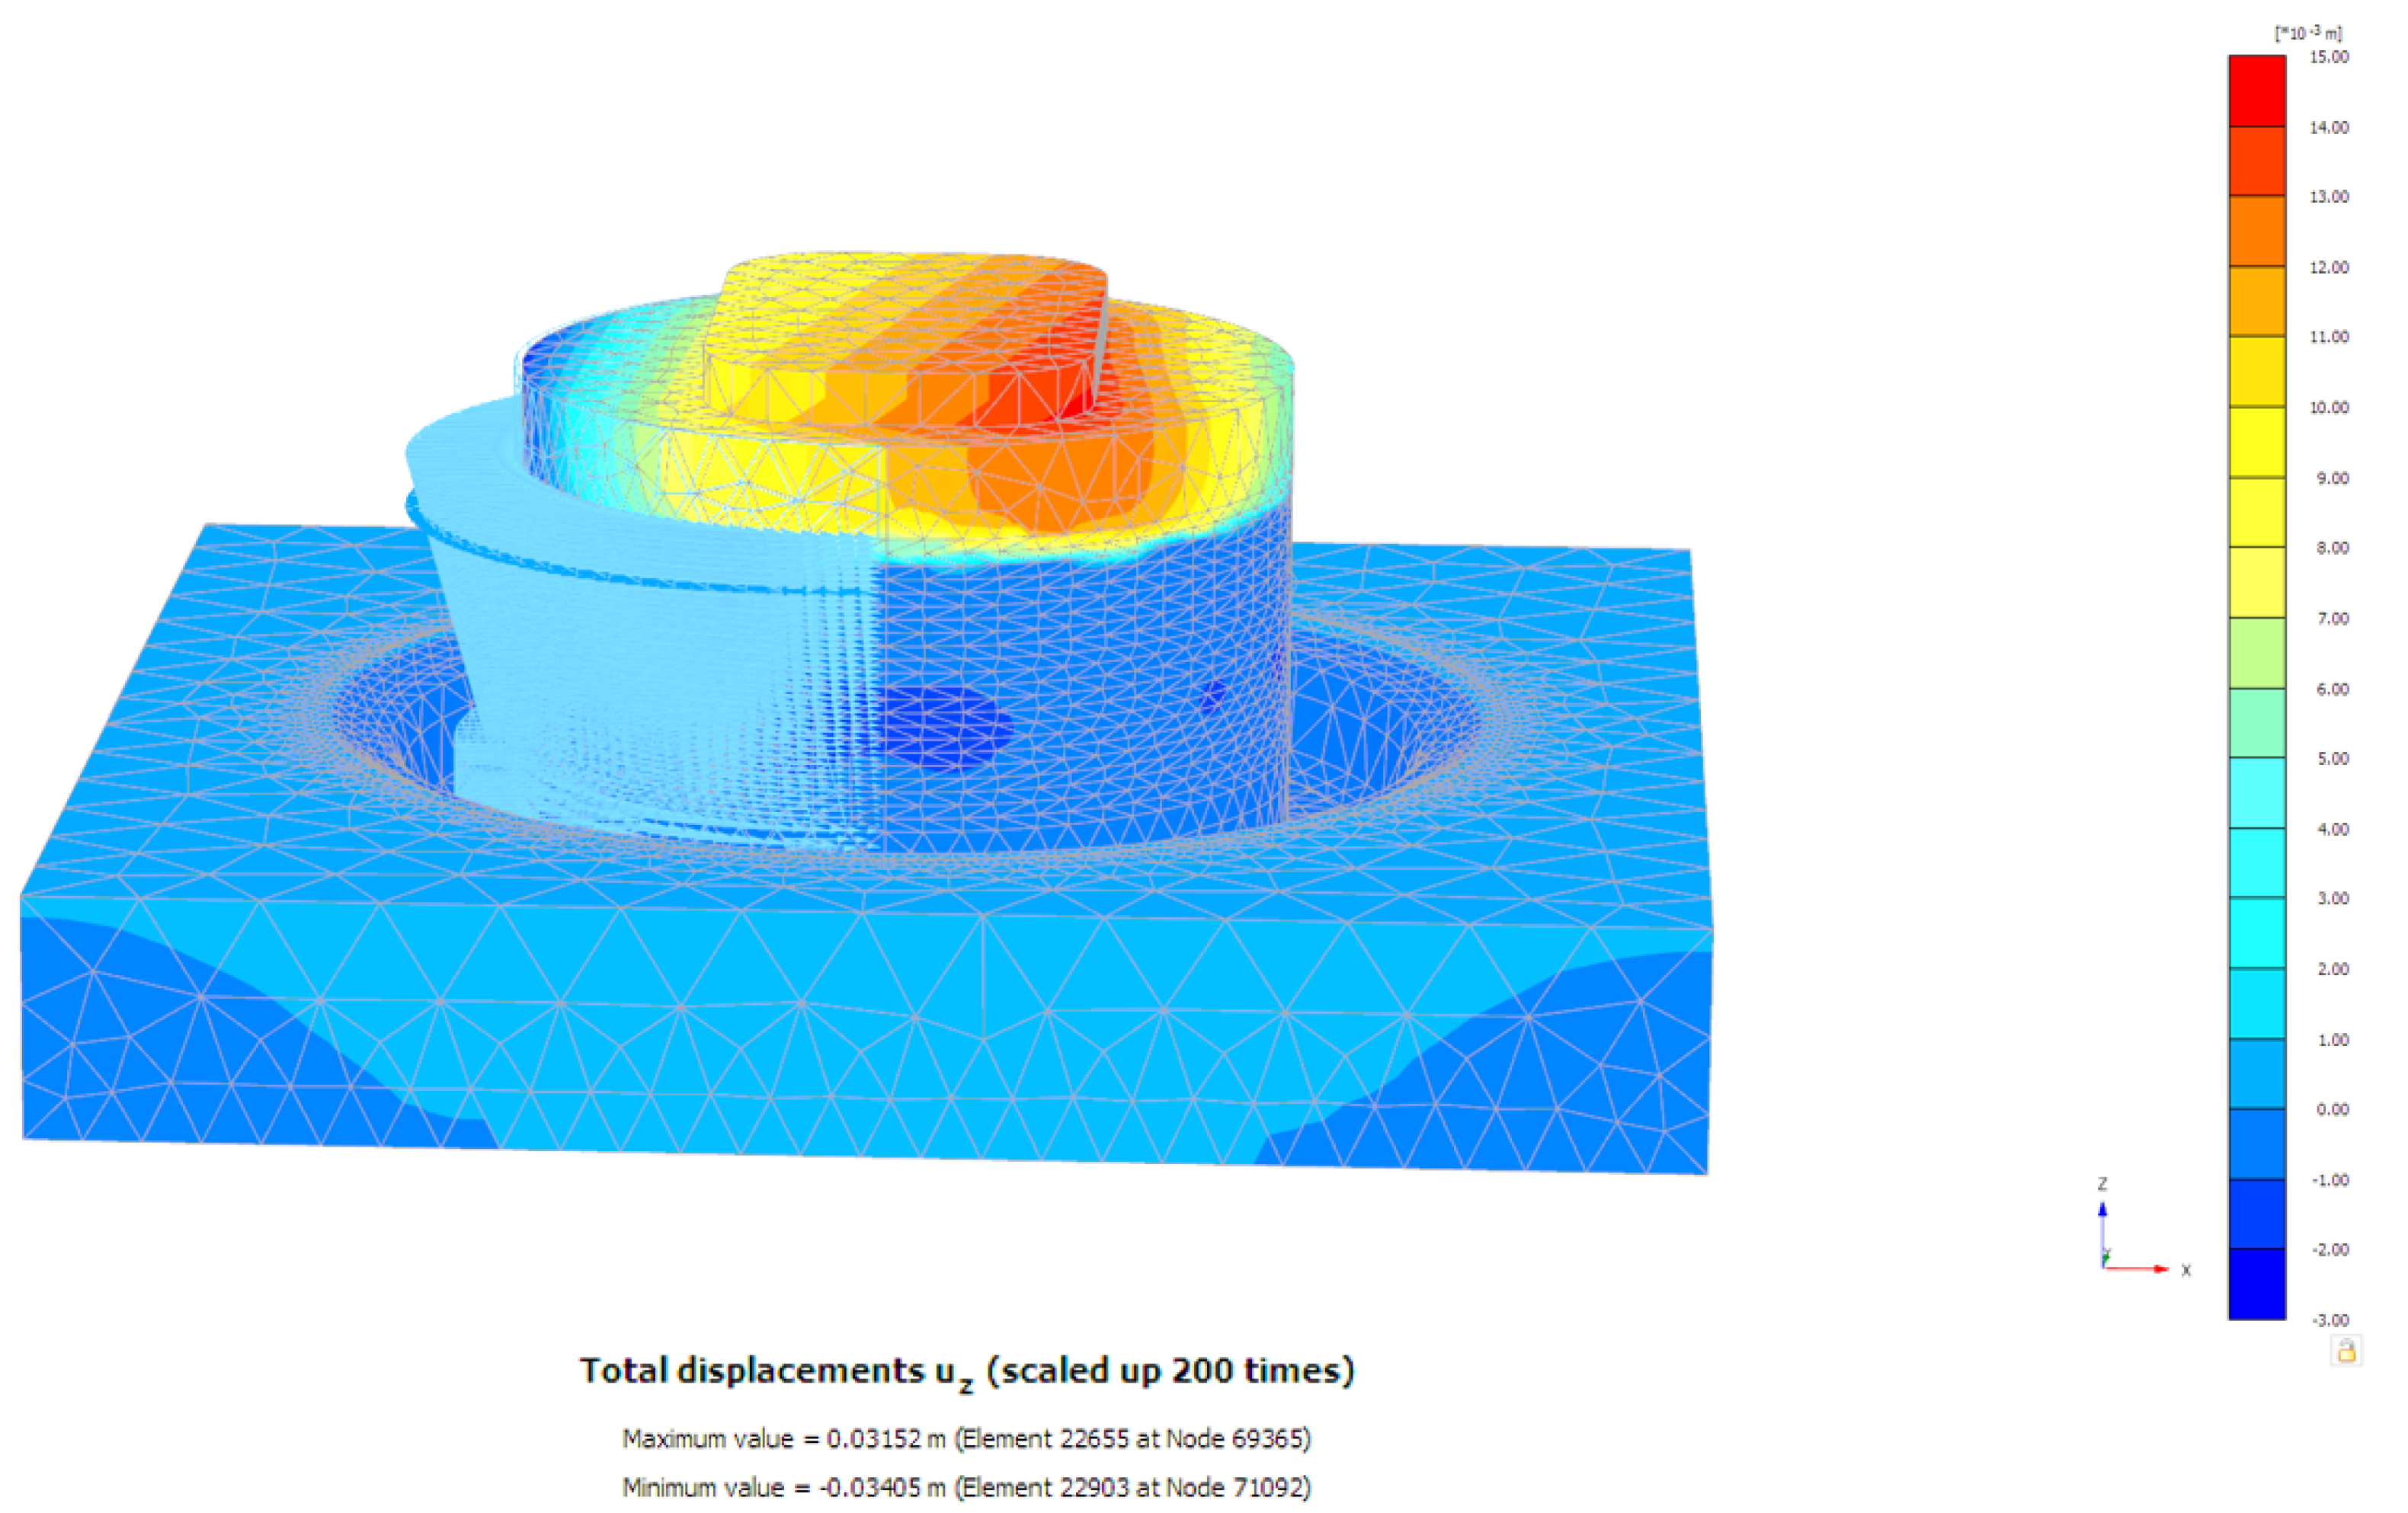
As the weak-layer thickness decreases from 0.8 m to 0.2 m, the vertical, longitudinal, and transverse displacements of the caisson structure all decrease sequentially under the most unfavorable load combination. At a weak-layer thickness of 0.8 m, the maximum vertical displacement reaches 30.21 mm, the maximum transverse displacement is 25.65 mm, and the maximum longitudinal displacement is 12.34 mm; at 0.6 m, the values are 16.57 mm, 18.21 mm, and 8.45 mm, respectively; at 0.4 m, they are 6.547 mm, 1.012 mm, and 0.968 mm; and at 0.2 m, they are 5.624 mm, 1.001 mm, and 0.821 mm, respectively (Figure 22, Figure 23 and Figure 24). During model calculation, among the four thickness cases considered, the deformation increases notably when the weak-layer thickness reaches 0.6 m, while the change in base stress remains relatively minor.
Figure 22.
Transverse displacement contour map of the caisson under the most unfavorable load.
Figure 23.
Longitudinal displacement contour map of the caisson under the most adverse load.
Figure 24.
Vertical displacement contour map of the caisson under the most unfavorable load.
To provide a quantitative basis for defining “significant deformation,” the predicted displacements are compared with the applicable serviceability criteria. According to the Code for Design of Railway Bridge and Culvert Foundation (TB 10093-2017) [23], for a design speed of 200 km/h with ballasted track, the allowable uniform settlement of piers is 50 mm, and the allowable differential settlement between adjacent piers is 20 mm. According to the Code for Design of Ground Base and Foundation of Highway Bridges and Culverts (JTG 3363-2019) [24], the differential settlement between adjacent piers should not produce an additional longitudinal slope greater than 2‰ on the bridge deck. For the investigated foundation, the maximum vertical displacement at a weak-layer thickness of 0.6 m is 16.57 mm, which is below the allowable uniform settlement of 50 mm. However, the horizontal displacements are also significant, reaching up to 18.21 mm and 8.45 mm in the transverse and longitudinal directions, respectively. These values indicate that the deformation at a weak-layer thickness of 0.6 m or more is notable from a serviceability perspective. It should be emphasized that this criterion is based on the specific bridge configuration and foundation geometry of the Xihoumen Bridge. The proposed weak-layer thickness of 0.6 m is therefore a case-specific numerical observation rather than a generally applicable design limit. The absence of measured caisson settlement and lateral displacement data means that this threshold requires further verification through long-term field monitoring and additional parametric studies.
To quantify the influence of the uncertainty in the fractured-rock modulus on the caisson deformation, analyses were carried out with the weak-layer elastic modulus E set to 20, 40, 60 and 80 MPa, while the weak-layer thickness, load combination and all other material parameters were kept unchanged. The results are summarized in Table 6. As E increases from 20 to 80 MPa, the maximum vertical displacement decreases from 43.76 to 14.65 mm, the maximum transverse displacement from 36.76 to 11.23 mm, and the maximum longitudinal displacement from 23.43 to 6.98 mm, corresponding to reductions of 66.5%, 69.5% and 70.2%, respectively. Relative to the base case of E = 40 MPa recommended by the geological investigation, reducing E to 20 MPa increases the vertical, transverse and longitudinal displacements by 44.9%, 43.3% and 89.9%, whereas increasing E to 80 MPa reduces them by 51.5%, 56.2% and 43.4%. The displacement is therefore sensitive to the weak-layer modulus, and the sensitivity is most pronounced in the low-modulus range (20–40 MPa), showing a clearly nonlinear response. At E = 20 MPa, the maximum vertical displacement reaches 43.76 mm, which approaches the 50 mm allowable uniform settlement of piers specified in TB 10093-2017, indicating that an underestimation of the weak-layer modulus would significantly reduce the settlement safety margin. The value of 40 MPa obtained from the geological investigation is therefore retained as the base case, and the deformation conclusions reported in this study are limited to this base case; the influence of the uncertainty in the weak-layer modulus should be considered in design. Accordingly, the 0.6 m threshold is conditional on the base-case modulus of 40 MPa and should not be transferred to sites with different fractured-rock properties without re-analysis.
Table 6.
Sensitivity of the maximum caisson displacements to the weak-layer elastic modulus.
5. Conclusions
Based on field investigation data and three-dimensional numerical simulation, this study investigated the caisson during its sinking, concrete pouring, and operational stages. The following conclusions are drawn from the numerical predictions:
1. After caisson sinking, the maximum longitudinal displacement is 0.6269 mm and the maximum transverse displacement is 0.6298 mm, both on the right side of the middle compartment; the maximum vertical displacement is 2.918 mm, occurring in the suspended part of the middle compartment. Stress concentrates at the caisson–bedrock contact layer: the maximum vertical stress is 3825 kPa (at the cutting edge contacting the weak layer and bedrock), while the maximum longitudinal and transverse stresses are 966.2 kPa and 772.8 kPa, respectively, both in low-lying bedrock areas. These local stress values are affected by the perfect-bonding interface assumption and should be regarded as indicative rather than exact contact stresses.
2. During core filling, vertical displacement increases steadily with concrete addition, reaching 4.65 mm due to increased self-weight. Longitudinal and transverse displacements show a fluctuating upward trend, with maxima of 0.854 mm and 0.87 mm, respectively.
3. As the weak-layer thickness decreases from 0.8 m to 0.2 m, the caisson displacements under the most unfavorable load combination decrease. For the investigated foundation, among the four thickness cases considered, a weak-layer thickness of 0.6 m leads to a notable increase in deformation, while the change in base stress remains relatively minor. This threshold is conditional on the adopted fractured-rock modulus (40 MPa) and on the limited number of thickness cases, and it is a case-specific numerical observation rather than a universal design criterion. Future field monitoring and additional parametric studies are recommended to further verify this threshold.
6. Limitations
The present study has several limitations. First, the constitutive models are effective representations rather than complete descriptions: Hoek–Brown for rock and an equivalent Mohr–Coulomb model for the reinforced concrete. A supplementary linear-elastic analysis showed displacement differences within 1.2%, and the maximum compressive stress (~11.35 MPa) is well below the design strength of C35/C45 concrete, so the concrete remains essentially elastic and global deformation is insensitive to the plastic parameters. Second, shared nodes imply perfect bonding and exclude interface separation and sliding; this reasonably approximates global load transfer but cannot capture local slip, so local stress concentrations near the cutting edge and in low-lying bedrock are interpreted qualitatively, and contact interface elements are recommended. Third, material parameters—particularly the fractured-rock modulus—involve uncertainty; a sensitivity analysis was performed, but a full probabilistic treatment was not. Fourth, only horizontal displacement at the caisson top was monitored during the 150-day construction period and used for limited validation; stress and other displacement components remain numerical predictions. Fifth, wind, wave, and current loads were applied in the same direction as a conservative envelope. Sixth, the 0.6 m weak-layer threshold is based on a single geometry, parameter set, and load combination and is a case-specific observation, not a universal design criterion. Future work should include parametric studies, contact-interface modelling, and independent validation.
Author Contributions
L.M.: Experiment, Conceptualization, S.O.: Data curation, Resources, J.Y.: Visualization, Validation, G.D.: Supervision, Funding acquisition, Conceptualization. Z.G.: Theoretical explanation, Writing—original draft. W.Z.: Data curation, Resources. All authors have read and agreed to the published version of the manuscript.
Funding
This work was supported by the National Natural Science Foundation of China (52508371, 52378328, 52578392), the China Postdoctoral Science Foundation (2025M773257), the Postdoctoral Fellowship Program of CPSF (GZC20252140), the Jiangsu Funding Program for Excellent Postdoctoral Talent (2025ZB120), and the Basic Research Program of Jiangsu (BK20251312).
Data Availability Statement
The raw data supporting the conclusions of this article will be made available by the authors on request.
Conflicts of Interest
Authors L.M., S.O. and J.Y. were employed by China Railway Fourth Division Group Co., Ltd. The remaining authors declare that the research was conducted in the absence of any commercial or financial relationships that could be construed as a potential conflict of interest.
References
- Kumar, N.D.; Rao, S.N. Earth pressures on caissons in marine clay under lateral loads—A laboratory study. Appl. Ocean Res. 2010, 32, 58–70. [Google Scholar] [CrossRef] [Scilit]
- Wen, C. Uniaxial behaviour of suction caissons in soft deposits in deepwater. Science 2005, 310, 638–642. [Google Scholar]
- Sun, L.; Zhang, Y.; Feng, X.; Gourvenec, S.; Li, S. Upper-bound solutions for inclined capacity of suction caissons in a trenched seabed. Geotechnique 2022, 74, 473–485. [Google Scholar]
- Zhou, H.; Randolph, M.F. Large deformation analysis of suction caisson installation in clay. Can. Geotech. J. 2006, 43, 1344–1357. [Google Scholar] [CrossRef] [Scilit]
- Liu, J.; Guo, X.; Yi, P. Probabilistic approach to the stability analysis of caisson foundations under combined loading in spatially variable soil. Appl. Ocean Res. 2023, 134, 103509. [Google Scholar] [CrossRef] [Scilit]
- Zhu, F.Y.; O’Loughlin, C.D.; Bienen, B.; Cassidy, M.J.; Morgan, N. The response of suction caissons to long-term lateral cyclic loading in single-layer and layered seabeds. Geotechnique 2018, 68, 729–741. [Google Scholar] [CrossRef] [Scilit]
- Sankarbabu, K.; Sannasiraj, S.A.; Sundar, V. Hydrodynamic performance of a dual cylindrical caisson breakwater. Coast. Eng. 2008, 55, 431–446. [Google Scholar] [CrossRef] [Scilit]
- Chen, X.; Li, Y.; Teng, B. Numerical and simplified methods for the calculation of the total horizontal wave force on a perforated caisson with a top cover. Coast. Eng. 2007, 54, 67–75. [Google Scholar] [CrossRef] [Scilit]
- Aubeny, C.P.; Han, S.W.; Murff, J.D. Inclined load capacity of suction caissons. Int. J. Numer. Anal. Methods GeoMech. 2003, 27, 1235–1254. [Google Scholar] [CrossRef] [Scilit]
- Yan, D.T.; Yan, Y.; Hou, Z.C.; Fu, D.F.; Wang, D. Upper-bound solutions for capacity of a catenary-moored suction caisson in clay. Comput. Geotech. 2026, 196, 108178. [Google Scholar] [CrossRef] [Scilit]
- Liu, T.; Zhang, Y.; Meng, Q.S. Numerical investigation and design of suction caisson for on-bottom pipelines under combined V-H-M-T loading in normal consolidated clay. Ocean Eng. 2023, 274, 113997. [Google Scholar] [CrossRef] [Scilit]
- Malik, B.A.; Mandhaniya, P.; Soni, A.K.; Ouyang, Z.K. Numerical modeling and failure analysis of caisson foundations subjected to the monotonic lateral loads. Ocean Eng. 2024, 309, 118491. [Google Scholar] [CrossRef] [Scilit]
- Shili, M.; Zong, Z.L.; Xie, L.Q.; Ji, Y.F.; Xie, Q.H.; Wei, Y.W. Bearing capacity of circular footings and suction caissons on one- and two-layered clay under vertical loading. Ocean Eng. 2025, 319, 120282. [Google Scholar] [CrossRef] [Scilit]
- Wang, L.; Zhang, T.R.; Cheng, X.L.; Xu, W.H.; Shen, Z.C.; Rui, S.J.; Tian, Y.H. Numerical investigation on the suction caisson response considering seabed trenches and cyclic loading. Ocean Eng. 2025, 315, 119839. [Google Scholar] [CrossRef] [Scilit]
- Zhou, L.L.; Su, L.; Liang, H.Z.; Yan, Z.; Ju, P.; Ling, X.Z. Caisson-foundation system subjected to earthquake and wave: Simulation, validation, and analysis. Soil Dyn. Earthq. Eng. 2026, 200, 109756. [Google Scholar] [CrossRef] [Scilit]
- GB/T 50266-2013; Standard for Test Methods of Engineering Rock Mass. China Planning Press: Beijing, China, 2013.
- Brinkgreve, R.B.J.; Zampich, L.M.; Manoj, N.R. PLAXIS 3D Tutorial Manual (Edition V20); Bentley Systems: Hoofddorp, The Netherlands, 2019. [Google Scholar]
- da Silva, M.V.; Antao, A.N. A new Hoek-Brown-Matsuoka-Nakai failure criterion for rocks. Int. J. Rock Mech. Min. Sci. 2023, 172, 105602. [Google Scholar] [CrossRef] [Scilit]
- Schwartzkopff, A.K.; Sainoki, A.; Karakus, M.; Akdag, S. A three-dimensional Hoek-Brown elastic-perfectly plastic constitutive model based on an analytical explicit solution. Comput. Geotech. 2026, 195, 108075. [Google Scholar] [CrossRef] [Scilit]
- JTG/T 3360-01-2018; Wind-Resistant Design Specification for Highway Bridges. China Architecture and Building Press: Beijing, China, 2018.
- CECS 137-2015; Specification for Structural Design of Reinforced Concretesinking Well of Water Supply and Sewerage Engineering. China Architecture and Building Press: Beijing, China, 2015.
- JTS145-2-2013; Code of Hydrology for Sea Harbour. China Architecture and Building Press: Beijing, China, 2013.
- TB 10093-2017; Code for Design on Subsoil and Foundation of Railway Bridge and Culvert. China Railway Publishing House: Beijing, China, 2017.
- JTG 3363—2019; Specifications for Design of Foundation of Highway Bridges and Culverts. China Communications Press: Beijing, China, 2020.


Disclaimer/Publisher’s Note: The statements, opinions and data contained in all publications are solely those of the individual author(s) and contributor(s) and not of MDPI and/or the editor(s). MDPI and/or the editor(s) disclaim responsibility for any injury to people or property resulting from any ideas, methods, instructions or products referred to in the content. |
© 2026 by the authors. Licensee MDPI, Basel, Switzerland. This article is an open access article distributed under the terms and conditions of the Creative Commons Attribution (CC BY) license.