


Abstract
Search and Rescue (SAR) operations are conducted to locate and safely rescue individuals or objects in distress as rapidly as possible following maritime emergencies. In this process, operational performance depends not only on determining the target’s probable location but also on the specific search pattern used to scan the search area. The aim of this study is to develop alternative search patterns to the parallel and expanding square search patterns used within the International Aeronautical and Maritime Search and Rescue (IAMSAR) methodology. To this end, Hilbert, Moore, Morton, V-formation, pentagonal, hexagonal, octagonal, and spiral search patterns were mathematically defined and rendered for algorithmic implementation. The patterns underwent a three-stage evaluation process. The first stage assessed baseline performance independently of external factors; the second stage evaluated behaviour under different initial target locations; and the third stage assessed target detection performance for five distinct types of drifting targets under varying wind, current, and search area conditions. The results revealed that the Moore pattern achieved the highest number of fastest target detections in the parallel search group, followed by the Hilbert pattern, while the Morton pattern stood out in terms of second-fastest detection counts. In the expanding square search group, the spiral pattern achieved the highest number of fastest target detections, followed by the hexagonal and expanding square patterns, while the expanding square pattern ranked first in second-fastest detection counts, followed by the octagonal pattern. However, the relative performance of the patterns varied depending on search area size and environmental conditions. The study’s primary contribution is treating search pattern selection as an independent SAR planning variable, offering viable alternatives to IAMSAR patterns, and establishing a reproducible, extensible framework through mathematical and algorithmic definitions that can be used in future optimisation, decision support, and area-scanning initiatives. In doing so, the study frames the question “which search pattern can most effectively cover the designated search area?” as a systematic research problem alongside the fundamental SAR question: “Where should the target be searched for?”
1. Introduction
Today, transportation systems are of critical importance to the sustainability of global trade and supply chains. Because approximately 71% of the Earth’s surface consists of seas, oceans, and other bodies of water, and more than 80% of the cargo transported in international trade is carried by sea, maritime transport has become a fundamental component of the global transportation system [1]. Maritime transport moves large volumes of cargo over long distances at relatively low unit costs, further enhancing its importance in international trade. However, increased maritime traffic and cargo volumes also increase the risk of maritime accidents [2]. According to data from the European Maritime Safety Agency (EMSA), 26,751 maritime accidents were reported between 2015 and 2024, averaging about 2675 accidents per year. During the same period, 415 accidents resulted in 609 fatalities [3]. Maritime accidents result in more than loss of life and injuries; they also cause environmental pollution, economic losses, liability for compensation, and operational disruptions in transportation systems [4]. Therefore, responding quickly and effectively to maritime accidents is fundamental to maritime safety.
The primary objective of search and rescue (SAR) operations following maritime emergencies is to locate and safely rescue individuals or objects in distress as rapidly as possible. To facilitate this, the International Maritime Consultative Organisation (IMCO) was established in 1948 to promote international maritime safety through a framework of common standards. The organisation was later renamed the International Maritime Organisation (IMO). Among its principal responsibilities, the IMO supports international cooperation and develops unified standards to ensure safety, operational efficiency, and the prevention of pollution from ships engaged in international maritime transport [5]. A key achievement of this organisational framework was the adoption of the International Convention on Maritime Search and Rescue (SAR Convention) in Hamburg in 1979. The Convention seeks to establish a coordinated international SAR system for rescuing persons in distress at sea [6].
The IAMSAR Manual was developed by the IMO and the International Civil Aviation Organisation (ICAO) to support operational coordination under the SAR Convention. The IAMSAR Manual consists of three volumes. Volume I addresses the organisation, management, and international cooperation of SAR systems; Volume II covers mission coordination and the planning and execution of SAR operations; and Volume III addresses the operational procedures that can be implemented by ships, rescue units, and aircraft at the scene of an incident [7]. Within this framework, determining the search area, using available SAR resources, and selecting an appropriate search pattern are fundamental planning decisions that directly affect the operation’s success [7].
The maritime SAR literature has also evolved to address the development of the various components of this operational process. Drift modelling studies have evolved from determining object-specific leeway behaviour to creating time-dependent and probability-based search areas; Breivik et al. [8], Wu et al. [9], and Jeong et al. [10] are significant examples of this research direction. On search planning and resource allocation, Cho et al. [11], Miao et al. [12], and Esmaeilpour et al. [13] developed models for route optimisation, multi-platform coordination, and more efficient use of search resources. In parallel, Zhao et al. [14], Geng et al. [15], and Martinez Esteso et al. [16] focused on unmanned aerial vehicle (UAV)-based target detection, while Gronbäck et al. [17] examined the effect of UAV deployment on response times, and Tavakoli et al. [18] investigated the role of environmental conditions on safe SAR operations. Pessôa et al. [19] also presented an approach to improve the operational feasibility of standard SAR procedures by transferring IAMSAR-based calculations to a digital decision support environment. These studies have significantly advanced estimates of where a target might be located during SAR operations, how to define the search area, how to allocate resources, how to optimise routes, and how to detect the target. However, while the majority of studies in the literature focus on optimising a specific component of the existing search process, the development of new search patterns that directly serve as alternatives to the standard search patterns used under IAMSAR, and the systematic comparison of these patterns under the same initial, environmental, and target conditions, has taken a back seat.
The aim of this study is to develop alternative search patterns to the parallel and expanding square search patterns used within the IAMSAR methodology. To this end, eight alternative search patterns, Hilbert, Moore, Morton, V formation, pentagonal, hexagonal, octagonal, and spiral, were algorithmically generated and implemented. The study focuses on determining which pattern can more effectively scan a defined search area, rather than merely estimating the target’s probable location or mathematically optimising an existing route.
A three-stage test framework was developed to systematically evaluate the performance of the proposed search patterns. In the first stage, the objective was to compare the basic characteristics of the patterns by evaluating the search performance of standard patterns used under IAMSAR and alternative patterns in designated areas without external environmental influences. In the second stage, search areas were divided into grid-based sectors to examine the effect of different starting positions of the drifting target on search performance, and targets were modelled to start from the centre of each sector. In the third phase, wind and current speeds and directions were incorporated into the system; datasets and scenarios were created for five different types of drifting persons/objects by utilising their respective drift, sinking, and hydrodynamic characteristics. Thus, standard and alternative patterns were applied under the same conditions and compared in terms of target detection performance, search time, and distance covered.
In this regard, the study goes beyond applying IAMSAR search patterns as standard operating procedures and treats the search pattern as a measurable, comparable SAR planning variable. By comparing alternative patterns developed within the scope of this study under different search area sizes, drift conditions, and target characteristics, the study aims to provide an alternative pattern for IAMSAR-based search planning and establish a comparative foundation for future adaptive SAR decision support systems.
The remainder of the article is organised as follows: Section 2 presents the relevant literature; Section 3 explains the methodological framework; Section 4 presents the application and findings; Section 5 discusses the results; and Section 6 presents the theoretical, managerial, and operational implications of the study, along with conclusions and directions for future research.
2. Literature Review
The literature review is organised under five headings, reflecting the complementary core components of maritime search and rescue (SAR) operations. First, drift estimation and probabilistic search area models aimed at determining the likely location of a drifting person or object are examined. Next, studies on search patterns, route optimisation, and resource allocation for the effective scanning of the defined search area are evaluated. Third, approaches involving UAVs, artificial intelligence, and real-time target detection are discussed considering emerging technologies. Under the fourth heading, early warning, risk analysis, and the impact of environmental conditions on SAR operations are examined; finally, decision support systems, organisational structure, communications, and human factors are evaluated. This classification presents the holistic structure of the SAR process, from determining the target’s probable location to scanning the search area, detecting the target, and implementing operational decisions.
2.1. Drift Estimation and Determination of the Probabilistic Search Area
Developing an effective search plan for maritime search and rescue operations depends on accurately predicting the time-dependent position of a missing person or object under the influence of wind, currents, and waves. Research in this field indicates a shift from fixed and generalised drift coefficients to increasingly detailed, object- and region-specific stochastic models. Breivik and Allen [20] and Breivik et al. [8] showed that Monte Carlo-based models can calculate the probabilistic position distribution of a search object by combining wind, surface current, and object-specific leeway behaviours, highlighting the importance of standardised field measurements. Subsequent studies have adapted this approach to target characteristics and regional conditions. Brushett et al. [21] examined various small marine vessels, Meng et al. [22] studied fishing boats, Tu et al. [23] examined the drift characteristics of people who had fallen into the water in various postures, and Tu et al. [24] examined those of lifeboats of different capacities; they demonstrated that the target type and configuration can result in significant differences in drift behaviour. Wu et al. [25], by contrast, showed that regional leeway models can better represent actual drift trajectories than generalised models using sea-area-specific coefficients. This approach has moved beyond using drift solely to define the search area and now directly informs search planning. Wu et al. [9] integrated probability maps derived from drift models into deep reinforcement learning-based coverage path planning, ensuring that high-probability areas are scanned first; Jeong et al. [10], by contrast, developed a dynamic search planning approach that combines time-dependent particle distributions with genetic algorithm-based SAR unit deployment. These developments show that in SAR planning, the search area should be treated not as a fixed geometric region but as a dynamic, probabilistic area that changes over time due to the target’s movement and environmental effects. However, accurately predicting the target’s likely location constitutes only the first stage of search success; the next fundamental problem is determining which route and search pattern to use to scan the defined area with available resources.
2.2. Search Patterns, Route Optimisation, and Resource Allocation
The second major area of research in the SAR literature concerns which route to use to scan the designated search area and how to allocate available resources. SAR Plan, developed by Abi Zeid and Frost [26], was one of the early decision support systems designed to allocate resources in a way that maximises the probability of mission success. Ferrari and Chen [27] demonstrated that heterogeneous aircraft fleets can be optimised in terms of coverage area, flight time, and cost for offshore SAR operations. Cho et al. [11], on the other hand, developed a two-stage coverage path planning approach for multiple UAVs; in the first stage, they transformed the search area into a grid-based graph, and in the second stage, they used a mixed-integer linear programming model that minimises the total mission completion time and a randomised search heuristic approach for large-scale problems. The fact that the model produces high-quality results in short computation times, with an optimality deviation of approximately 0.7%, and was validated in a real marine environment using two different UAVs underscores the importance of these optimisation methods in terms of operational feasibility.
While Ai et al. [28] used reinforcement learning to prioritise areas with a high probability of detection, Laperrière Robillard et al. [29] used machine learning to rapidly estimate the probability of success for search plans, and Ma et al. [30] developed a multi-objective resource allocation model that simultaneously evaluates cost, safety, and response time. Morin et al. [31] addressed the direct optimisation of search paths for moving targets using an ant colony optimisation approach, while Li et al. [32], Wang et al. [33], and Wen et al. [34] focused on task sharing among heterogeneous autonomous vehicles, ASV AUV coordination, and dynamic task assignment based on varying target probabilities.
Recent studies have extended this optimisation approach to moving target and multi-source problems. Miao et al. [12] addressed UAV-based moving target search as an optimisation problem that maximises the probability of capture and developed the EMGJO algorithm, which combines motion coding, triangular walk, cooperative search, and covariance matrix learning strategies. Evaluations conducted across six different scenarios reported that the algorithm produced higher search accuracy and more efficient search paths compared to the methods under consideration. However, the researchers noted that uncertainties in real maritime environments and multi-UAV coordination need to be addressed separately in the future. Esmaeilpour et al. [13], on the other hand, developed a hybrid model and solve approach that combines mathematical programming with simulation to address the problem of insufficient optimisation of the number of search units, search duration, and horizontal operational resolution in existing SAR decision support systems. Tested on eighteen realistic Canadian SAR cases, the method demonstrated that allowing for variable search effort can eliminate unnecessary units and result in search effort savings on the order of hundreds of nautical miles.
When evaluated collectively, these studies show the literature shifting from fixed, predefined routes to adaptive optimisation systems that simultaneously evaluate target probability, movement, mission duration, safety, and resource utilisation. However, just as important as mathematical optimisation of the search route is the platform’s ability to reach the target quickly and reliably detect it during the search. These factors constitute another fundamental aspect of operational success.
2.3. UAVs, Artificial Intelligence, and Real-Time Target Detection
Correctly determining the search route is not sufficient on its own; the ability of search platforms to rapidly reach vast maritime areas and reliably detect small targets on the sea surface is a key component of SAR success. Advances in UAV technology have therefore established a significant area of research in the maritime SAR literature, both as a search platform and as a detection system. Zhao et al. [14] demonstrated the limitations of standard anchor box configurations in detecting swimmers, life jackets, and other small maritime targets in the ‘SeaDronesSee’ dataset and improved detection performance through data-driven heuristic anchor optimisation. Geng et al. [15] improved detection of small and low-visibility targets, particularly using the MSR YOLO model they developed on the MSRTD dataset, created from images captured in real marine environments. Martinez Esteso et al. [16], on the other hand, systematically evaluated classification, segmentation, object detection, tracking, and synthetic data studies related to human detection at sea using UAV images, identifying small target size, complex backgrounds caused by waves and foam, variable lighting and weather conditions, and the limited amount of real-world data as the primary challenges.
UAV research is clearly not limited to image-based target detection. Gronbäck et al. [17] used historical SAR cases and commercial vessel locations in Sweden to evaluate, via a geographic simulation model, the impact of deploying UAVs from commercial vessels or ground stations on response times. In scenarios incorporating wind, temperature, precipitation, UAV speed, range, and take-off time, the study demonstrated that UAV deployment could potentially reduce response times by approximately 7–16 min compared to historical SAR response times; while land-based fixed-wing UAVs offer a time advantage, the choice of system must be evaluated in conjunction with cost and platform characteristics. The study’s results indicate a potential reduction in response time of about 10 min for maritime-based UAVs and about 15 min for land-based UAVs. Thus, the UAV literature is expanding from the question “How can the target be detected?” to “Where should the search asset be deployed, and how quickly can it reach the scene?”
Zha et al. [35], by contrast, propose a different sensor-based approach. In this study, the term “SAR” refers to Synthetic Aperture Radar, not search and rescue. The developed radar-based ship detection approach improves detection performance, particularly in complex coastal backgrounds, and provides maritime situational awareness that can complement optical systems under low visibility or adverse meteorological conditions. However, because UAV availability and advanced sensor performance depend directly on environmental conditions, SAR planning requires a joint assessment of technological capabilities and meteorological oceanographic operational conditions.
2.4. Early Warning, Risk Analysis, and Environmental Conditions
Another research group approaches SAR effectiveness not merely as post-incident search operations but within the framework of pre-incident risk assessment, early warning, and the environmental conditions encountered during operations. Brown et al. [36] highlighted the importance of early-warning infrastructure by demonstrating that technological advancements in distress beacon systems, such as EPIRBs and PLBs, can significantly reduce the time between an alert and notification to the rescue coordination centre. Kayıran et al. [37] analysed accidents in Turkish Search and Rescue (SAR) regions during the 2001–2019 period using a Bayesian network approach and demonstrated that accident patterns and SAR requirements vary according to region, season, time, and meteorological conditions. Kengpol and Chanchittakarn [38] developed a neural network model to predict high-risk areas in advance by utilising past man-overboard incidents along with geographic and meteorological variables, while Qiao et al. [39] highlighted the importance of emergency decision making, personnel competence, and coastal support by analysing the causal structure of major maritime accidents.
Tavakoli et al. [18], by evaluating the impact of environmental conditions on SAR operations from a different perspective, developed a simplified method for calculating the probability of occurrence and the waiting time for low-wave quiescent periods in terms of the safety of helicopter operations to be conducted on a ship’s deck or at the sea surface. The study demonstrated that, by utilising the probability distributions of low-wave sequences, safe operational windows can be predicted on a geographic scale even with limited meteorological and oceanographic data. The researchers also emphasise that wind, waves, and currents not only affect the drift of the target and the delineation of the search area but also limit the ability of rescue units to operate safely. Therefore, environmental data should be considered not only as inputs that determine where the target is drifting for SAR purposes but also as operational constraints that determine when and with which assets a search and rescue operation can be safely conducted. This underscores the importance of decision support infrastructure that ensures environmental and risk information is conveyed quickly and accurately to decision makers in the field.
2.5. Decision Support, Organisational Structure, Communication, and Human Factors
The success of a SAR system does not depend solely on the development of advanced tracking or optimisation models; these methods must be integrated with standard procedures, communication infrastructure, human factors, and operational decision-making processes. Norrington et al. [40] examined the reliability of SAR coordination centres using a Bayesian Belief Network approach, demonstrating the importance of organisational and human factors in system performance. Benz et al. [41] developed a comprehensive framework for the Arctic SAR system covering port infrastructure, equipment, communications, navigation, standards, and international cooperation, while Christodoulou et al. [42] emphasised the importance of interagency cooperation and infrastructure investments in Arctic regions due to distance, ice conditions, and limited communication infrastructure. Ettinger et al. [43], on the other hand, demonstrated that the medical competence of SAR teams and interagency training are integral components of operational capacity.
In this context, Pessôa et al. [19] have developed an important decision support application directly related to IAMSAR. The researchers developed a validation tool capable of assessing the Brazilian Navy’s new SAR decision support system’s compliance with the computational models outlined in Section 4 and Section 5 of IAMSAR Volume II; they designed the system to utilise inputs such as meteorological data, available search units, target type, search distance, and elapsed time. In addition, a standalone application capable of operating on board a vessel without requiring an internet connection was created. The results of the study demonstrated that this application serves as a practical decision-making aid capable of accelerating the calculation of the search area and the updating of SAR calculations on board; it was recommended that search patterns be adapted in the future based on meteorological conditions and the defined search area. Berbić et al. [44], meanwhile, demonstrated that AIS data can be used with machine learning to predict vessel movements and identify abnormal behaviour, thereby highlighting the importance of maritime situational awareness for decision support systems.
Providing one of the most recent examples of this development, Esmaeilpour et al. [13] expanded the operational capabilities of the decision support system by integrating the simulation-based probability of success assessment used in the existing CANSARP/SAR Optimiser framework with mathematical optimisation. The developed approach addresses safe spatial separation, variable search effort, the number of search units, and search duration within the same decision framework, thereby converting a portion of the fixed inputs in classical decision support systems into directly optimisable variables. This indicates that, in the future, SAR decision support systems may evolve from being mere tools that perform standard calculations into adaptive decision systems that evaluate drift estimation, resource selection, search routes, and environmental conditions in real time.
2.6. Comprehensive Review of the Literature and Transition to the Study
When evaluated together, these studies show that the maritime SAR literature has evolved into an integrated structure of complementary phases. Drift models address the question “Where might the target be?”; environmental and risk models address “Where and under what conditions can a search be conducted?”; route and resource optimisation studies address “How should the search be planned using available resources?”; UAV and artificial intelligence approaches seek to answer the question “How can the search area be reached more quickly and how can the target be detected?”; and decision support systems seek to answer “How can all this information be translated into an operational decision?” In the current literature, Cho et al. [11], Wu et al. [9], Miao et al. [12], and Esmaeilpour et al. [13] focus on the optimisation of search routes and resources; Zhao et al. [14], Geng et al. [15], Martinez Esteso et al. [16], and Gronbäck et al. [17] have made significant contributions to UAV target detection and response capabilities; Tavakoli et al. [18] have focused on environmental operational conditions; and Pessôa et al. [19] have contributed to the digitisation of IAMSAR-based decision support. However, while a significant portion of the existing literature focuses on estimating the target’s location, optimising the current route, allocating resources, or detecting the target, studies that directly examine the standard search patterns defined within the IAMSAR framework remain in the background. This gap manifests as a limitation in the systematic comparison of different patterns in terms of distance, time, and area geometry under the same initial and search conditions. Therefore, the development of alternative patterns to the standard search patterns used in IAMSAR, their algorithmic implementation, and their comparison with standard patterns under the same conditions across different search area sizes, target types, and wind and current conditions constitutes a natural research direction that complements the drift, optimisation, and decision support studies in the literature. Such an approach establishes a direct link between existing SAR research and the research problem of this study by adding the question “Which pattern can most effectively scan the defined search area?” to the questions “Where should the target be searched for?” and “How should the search route be optimised?”, which have been predominantly addressed in the literature.
3. Methodology
This section will explain the patterns used in search and rescue operations under IAMSAR. Next, this section will explain patterns that serve as alternatives to those currently used in search and rescue operations. Finally, it will describe the drift system and the sector system used to determine when objects begin to drift.
3.1. IAMSAR Patterns
Patterns recognised by the International Aeronautical and Maritime Search and Rescue Manual, including the parallel search pattern, the coordinated air sea search pattern, the expanding square search pattern, the sector search pattern, the track search pattern, and the contour search pattern, are also available.
The parallel search pattern is used to search a wide area when the hazard’s location is unknown. It is very effective over bodies of water and open, flat terrain. The search starts at a corner of the area. The search legs are parallel to each other and to the long sides of the lower rectangle. The parallel search pattern can be used with a single vessel or with two, three, four, or more vessels. As shown in Figure 1, it is based on scanning linear lines parallel to one another from one end to the other and shifting them by the search interval at the ends of the lines [45].
Figure 1.
IAMSAR search patterns.
The expanding square search pattern is effective when the object’s location is known to be within certain boundaries. The starting point is always the object’s last known location. As shown in Figure 1, the vessel increases its distance travelled by the search swath width (S) every two turns and changes its direction by 90°. AIMSAR recommends a search track width of at least 2 nautical miles [45].
The sector search pattern, as shown in Figure 1, is an area search method that uses overlapping cross-shaped legs. It is used when the location of the object being searched for is known precisely and the search area is very small; because of the small coverage area, the search is conducted by either one ship or one aircraft. For aircraft, the search pattern radius ranges from 5 to 20 nautical miles, while for ships, it ranges from 2 to 5 nautical miles [45].
The track search pattern is used when an aircraft or ship has gone missing without leaving a trail along a known route; aviation sectors typically use this pattern because aircraft travel so fast. In the track search pattern, the search is conducted with a ½ S search interval around the track [45].
Contour search, on the other hand, is used when sharp changes in elevation make other models impractical such as around mountains and in valleys. When conducted by aircraft, this method begins at the highest peak and proceeds from top to bottom, using a new search altitude for each turn.
If an On-Scene Coordinator (OSC) is present, the Coordinated Ship Aircraft Search Model is used. While the vessel continues along its route as directed by the OSC serving as a waypoint for the aircraft, the aircraft conducts most of the search. Conversely, as shown in Figure 1, the aircraft can fly in a straight line while the vessel conducts most of the search using the parallel search method [45].
All the patterns mentioned above are used in search and rescue operations under the IAMSAR framework. While each has different applications, the parallel search pattern and the expanding square search pattern are the most widely accepted and frequently used in the maritime sector. These patterns are based on the mathematical formulas in the IAMSAR Manual, and alternative patterns have been developed and tested using the same criteria.
3.2. Alternative Approach Patterns
This section describes the search patterns we propose as alternatives to the parallel and expanding square search patterns used in the maritime sector under IAMSAR.
3.2.1. Parallel Search Pattern Alternatives
As an alternative to the parallel search pattern, the V-formation search pattern, which is based on the flight patterns of flocks of birds, was tested alongside the Hilbert curve, Morton Z curve, and Moore curve patterns used in fractal geometry.
Morton (Z-Order) Curve Pattern
The Morton curve is a discrete fractal search pattern based on bit interleaving of the sequential arrangement of the bits of multidimensional spatial coordinates in binary form [46]. The Morton curve is formulated in Equations (1)–(4).
where
n: order;
xi, yi: cell position in binary 2;
z: one-dimensional Morton code determining the cell’s order along the orbit;
W: total width of the search area;
H: total height of the search area;
S: track spacing;
aj,bj: coordinate components.
An orbit consists of cell centre coordinates arranged in ascending order of the z code (z0 < z1 < z2 …).
Hilbert Curve Pattern
The Hilbert curve is a fractal structure that maximises continuity at adjacent cell transitions and minimises changes in direction. It is generated step by step using the Lindenmayer (L System) rules as follows [47]. The Hilbert curve is formulated in Equations (5)–(9).
where
L ⟶ −RF + LFL + FR−
R ⟶ +LF − RFR − FL+
xm = xm−1+ΔL ⋅ cos(θm)
ym = ym−1+ΔL ⋅ sin(θm)
L, R: directional production rule alphabet in a Lindenmayer grammar;
F: forward movement and drawing step in a Lindenmayer grammar;
+: (π/2 radians clockwise);
−: (π/2 radians counterclockwise);
n: iteration order;
ΔL: scalar length of each linear F step;
θm: instantaneous direction angle during curve formation;
xm,ym: Cartesian position components.
Moore Curve Pattern
The Moore curve is a structural variation of the Hilbert curve, and its main advantage is that the search path ends near where it begins (like a closed-loop scheme). It uses the same grammar rules (L and R derivations) as the Hilbert curve. The Moore curve is formulated in Equations (10)–(12).
where
LFL + F + LFL
⌊…⌋: base function;
xm,ym: orbit nodes;
ym: vertical step parameter (condition: m ∈ ℕ, ym ≤ H).
V-Formation Pattern
This pattern is an alternative to the parallel pattern based on the zigzag formation we see when looking up at the sky during bird migrations. Instead of making sharp turns in each back-and-forth cycle, it scans the area with vertical steps equal to half the search interval (S/2). The Cartesian coordinate sequence of the orbital nodes is based on the principle that the horizontal boundaries (0 and W) oscillate using the floor function. The V formation is formulated in Equations (13) and (14).
where
⌊…⌋: base function;
xm,ym: orbit nodes;
ym: vertical step parameter (condition: m ∈ ℕ, ym ≤ H).
As the index m increases sequentially, the sequence xm generates the period 0, W, W, 0, 0, W, W… and forms zigzag transition blocks.
3.2.2. Expanding Square Search Pattern Alternatives
As alternatives to the expanding square search pattern, the Archimedean spiral pattern, the pentagonal search pattern, the hexagonal search pattern, and the octagonal search pattern were tested.
Spiral Pattern
In continuous-time orbit planning, the spiral pattern is a search pattern generated by taking the derivative of the polar distance from the centre (r) with respect to the instantaneous angle (θ), where the derivative is held constant. The spiral is formulated in Equations (15)–(17).
where
S: track spacing;
xc: horizontal coordinate of the centre point of the search area;
yc: vertical coordinate of the centre point of the search area;
x, y: horizontal and vertical positions, either independent or dependent on a parametric function;
θ: instantaneous angular displacement in the polar coordinate system;
r: polar distance from the centre.
Regular Polygons with N Sides
For a regular N-gon (N ≥ 3), the coordinates of the j vertex (j = 0, 1,…, N 1) of the polygon can be expressed using the following general formula. The polygons are formulated in Equations (18) and (19).
where
N: number of sides of a regular polygon;
m: ring index;
j: vertex index of the polygon;
xm,j: horizontal (X axis) coordinate of the j vertex in the m ring;
ym,j: vertical (Y axis) coordinate of the j vertex in the m ring;
xc, yc: Cartesian coordinates of the centre;
S: track spacing;
θ0: initial phase angle;
π: radian.
This formula is used to create pentagonal (N = 5), hexagonal (N = 6), and octagonal (N = 8) patterns.
3.2.3. Continuity of the Generated Search Routes
Equations (1)–(19) define the geometric structures and coordinate-generation methods for the proposed alternative search patterns. To ensure that these coordinates form continuous search paths, a common path-generation method is applied to all patterns. In this method, the generated coordinates are arranged in a specific order, and each pair of consecutive coordinates is connected by a linear segment. The mathematical continuity of the resulting routes is shown below.
Definition 1.
Search Route Construction
Let the ordered sequence of coordinates generated by a search pattern be defined as follows:
= (P0, P1, …, PM), Pk = (xk, yk), M ≥ 1
A route segment connecting two consecutive coordinates is expressed by the following parametric function:
γk(t) = (1 − t)Pk + tPk + 1, t ∈ [0, 1], k = 0, …, M − 1
The entire search path is obtained by joining these segments end to end while preserving the defined order of their coordinates.
Proposition 1.
Continuity of the Generated Search Route
For any finite, ordered sequence of coordinates with at least two valid coordinates, the sequential linear connection method defined by Equation (21) generates a geometrically continuous search path.
Proof.
Since each γk(t) segment is an affine function of the parameter t, it is continuous on the interval [0, 1]. At the transition between two consecutive segments, the endpoint of the previous segment and the starting point of the next segment satisfy the following equation:
γk(1) = Pk + 1 = γk + 1(0), k = 0, …, M − 2
Consequently, consecutive segments share a common endpoint, and joining these segments in sequence forms a continuous, piecewise-linear path. This demonstrates the geometric continuity of the resulting search path. In the computational implementation, this route-generation method is applied consistently to all search patterns. For each ordered sequence of coordinates, the total route length is calculated as follows:
The proposed definition and proof of continuity apply to all search patterns evaluated in this study. The ordered coordinates in the parallel, Hilbert, Moore, Morton, and V-formation patterns are connected via consecutive linear segments. Similarly, in the expanding square, pentagonal, hexagonal, and octagonal patterns, successive route points are connected using the same method. This method creates continuous connections between spatially non-adjacent coordinates in the Morton pattern and between successive loops in the polygon patterns. In the spiral pattern, the continuous parametric curve is represented in a computational environment by sequentially combining sampled coordinates.
In the mathematical formulation, the same sequential route segments form the basis for calculating travel distances, travel times, and target detection conditions. Thus, the coordinate sequences generated by mathematical expressions and the associated computational route-generation method ensure geometric continuity of search routes regardless of the patterns’ geometric structure whenever at least two valid coordinates are present. □
3.3. Sector System and Leeway System
The search areas are divided into square-shaped subsectors starting from the centre to determine the starting points of the objects to be drifted; this allows for testing each pattern’s ability to detect the drifted objects. The drifting motion of the object is also calculated based on the wind and current acting on the object, as well as the object’s submersion ratio and aerodynamic drift, and is included in the tests.
3.3.1. Sector System
The total search area has been divided into square subsectors for optimisation and target tracking. A two-dimensional grid system was constructed by taking the centre of the search area (xc,yc) as the origin [11].
Sector Centre Calculation
When calculating sector centres, the centre points (tx,ty) are first determined, and an absolute boundary check is performed in the [0, W] × [0, H] space to eliminate imaginary nodes outside the area [11]. The sector centre is formulated in Equations (24)–(27).
where
tx = xc + ix ⋅ dsec
ty = yc + iy ⋅ dsec
W: area width;
H: area height;
dsec: sector edge length (km);
xc,yc: centre coordinates;
tx,ty: centre coordinates of a sector with indices ix ve iy;
ix, iy: sector indices.
Spiral ID Algorithm
The prioritisation of sectors is carried out in a spiral matrix arrangement consisting of layers expanding outward from the centre. The unique identification number (ID_spiral) of a sector with the index pair (ix,iy) is derived using a piecewise function based on the layer index (k), which represents its distance from the centre [11]. The Spiral ID is formulated in Equations (28)–(31).
k = max(|ix|,|iy|)
For the innermost central cell (ix = 0,iy = 0 ⟹ k = 0),
IDspiral(0,0) = 1
For all other outer layers (k ≥ 1), the highest ID value (Smax) in that layer is the square boundary coefficient of the corresponding layer.
where
Smax = (2k + 1)2
ix, iy: sector indices;
k: layer index representing the sector’s distance from the centre;
Smax: square boundary coefficient of the relevant layer;
IDspiral: unique identification number of a sector with indices ix and iy.
Defining Sector Boundaries
All sectors in which the search operation will be conducted are arranged in an optimised hierarchy from the centre outward and fed into the simulation’s target matrix as input [11]. The Sector Boundaries are formulated in Equation (32).
where
Asec: two-dimensional square area in space occupied by a specific sector;
xc,yc: centre coordinates of the total search area (km);
dsec: side length of a sector square;
ix,iy: horizontal and vertical relative index steps of the sector relative to the centre;
tx,ty: absolute centre coordinates of the relevant sector;
k: spiral layer number in which the cell is located (ℤ+);
Smax: highest boundary index value in the current layer;
IDspiral: sector’s unique priority number.
3.3.2. Leeway System
The movement of targets floating freely on the water surface (person in water, oil drum, 40-foot container, life raft canopy with drogue, mine, etc.) is modelled as the superposition of surface current- and wind-induced drift (leeway) vectors. The instantaneous change in position in spacetime is calculated using the following steps [8].
Standardisation of Wind Speed
Using the wind speed (W10) at the standard meteorological measurement height of 10 m as a reference, the wind speed (Vwind, knot) is converted to the International System of Units (m/s). The wind speed standardisation is formulated in Equation (33).
where
W10 = Vwind × 0.514444
W10: wind speed at a height of 10 m (m/s);
Vwind: wind speed provided as input (knots).
Equation (33) uses 1 knot = 0.514444 m/s. When wind speed is required in km/h, 1 knot = 1.852 km/h.
Leeway Speed
Leeway speed is defined as the velocity of a drifting object relative to the surrounding water that arises primarily from wind forcing and is governed by the object’s aerodynamic and hydrodynamic characteristics, including its degree of immersion [8]. The leeway speed is formulated in Equations (34)–(37).
where
Ld = (ad ⋅ W10 + bd) ⋅ I
Lc = (ac ⋅ W10 + bc) ⋅ I
Vdw = 3.6 ⋅ Ld
Vcw = 3.6 ⋅ Lc
Ld: downwind leeway (m/s);
Lc: crosswind leeway (m/s);
ad,bd: wind direction drift coefficients;
ac,bc: crosswind drift coefficients;
I: object immersion factor (immersion, 0 < I ≤ 1);
Vdw, Vcw: conversion to km/h to adapt the drift velocities Ld and Lc to the scale.
Equations (34)–(37) convert the leeway speeds from m/s to km/h using 1 m/s = 3.6 km/h.
Jibe Model
The target’s lateral drift direction is not fixed and jibes to the right or left of the wind over time. If the following inequality holds for a uniformly distributed random variable, R∼U(0,1), then J changes sign [8]. The jibe model is formulated in Equation (38).
where
J: direction of lateral drift (J ∈ {−1,1});
Pjibe: target-specific probability of a change in direction;
Δt: time in seconds.
Vector Decomposition
The X and Y components (km/h) of the velocity vectors acting on the target are formulated as follows [8]. Wind and current directions are measured clockwise from geographic north (0°) and indicate where they move (x: east; y: north). To reverse a meteorological wind-from direction, add 180° before input. The vector decomposition is formulated in Equations (39)–(45).
where
vdw,x = Vdw ⋅ cos(90∘ − θw)
vdw,y = Vdw ⋅ sin(90∘ − θw)
vcw,x = Vcw ⋅ cos(90∘ − (θw + 90∘ ⋅ J))
vcw,y = Vcw ⋅ sin(90∘ − (θw + 90∘ ⋅ J))
vcurr(km/h) = 1.852 ⋅ Vcurr(knots)
vcurr,x = Vcurr ⋅ cos(90∘ − θc)
vcurr,y = Vcurr ⋅ sin(90∘ − θc)
θw: wind direction;
θc: current direction;
Vdw, Vcw: downwind and crosswind leeway speeds (km/h);
Vcurr: current speed after conversion (km/h);
vdw,x, vdw,y: wind direction vector components;
vcw,x, vcw,y: wind lateral vector components;
vcurr,x, vcurr,y: surface current vector components.
Total Relocation and Location Update
At the selected time step (Δth, hour), the total displacement (Δx,Δy) caused by the linear wind, the crosswind, and the surface current is obtained by the superposition of the corresponding vectors [8]. All velocity components are in km/h; multiplying by the time step in hours gives the total displacement in km. The total relocation and location update is formulated in Equations (46)–(50).
Δx = (vdw,x + vcw,x + vcurr,x)⋅Δth
Δy = (vdw,y + vcw,y + vcurr,y)⋅Δth
For Equations (46) and (47), the time step from Equation (38) is converted to hours (velocity: km/h; displacement: km):
Accordingly, the object’s new position (Pnew) in two-dimensional space at time t+Δt is updated using the differential approximation as follows.
where
x(t+Δt) = x(t)+Δx
y(t+Δt) = y(t)+Δy
Δx,Δy: total displacement caused by the wind, lateral currents, and surface currents;
Δt: time step size.
4. Application and Validation
This section first describes the limits established for comparing, under equal conditions, the patterns proposed as alternatives to the parallel search pattern and the expanding square search pattern within the IAMSAR framework, and the test phases derived from these limits; it then presents the test results.
4.1. Definition of Dataset Parameters and Scenario Generation
Under the IAMSAR framework, it was necessary to establish test environments under equal conditions to compare the parallel search pattern and the expanding square search pattern used in the maritime sector with the patterns proposed as alternative to these. To this end, the parameters and limits listed in Table 1 were defined. As shown in Table 1, the study area was limited to ranges increasing in increments of 5 km2 and 500 km2. Wind speed and current speed were assumed to be in the range of 0–5 knots, while wind and current directions were taken in the range of 0–315 degrees at successive 45-degree intervals. Finally, five different objects were selected, with values for wind direction drift coefficients (ad, bd), crosswind drift coefficients (ac, bc), the object’s submersion ratio (I), and the crosswind drift direction (J) as shown in Table 2. These are as follows, along with their abbreviations: person in water (PIW), 40-foot container (Container 40’), life raft canopy with drogue (LCRF), WW2 mine (MINE), and oil drum (OilDrum).
Table 1.
Dataset boundary conditions and parameters.
Table 2.
Drifting object parameters.
Finally, the vessel’s speed was kept constant at 10 knots; while wind affecting the vessel was considered, the current was disregarded. The search interval (s) is specified in the IAMSAR Manual as a minimum of 2 miles under normal visibility conditions, and a search interval of 2 miles was used in the tests. These limits were established to ensure that visual observation can be conducted effectively during search and rescue (SAR) operations.
After determining the parameters shown in Table 1, the parallel search pattern, the expanding square search pattern, and alternative patterns were tested in three stages. In the first stage (i), an area search was conducted without any external factors, that is, with wind and current speeds set to 0 knots and without a drifting object. The objective of the first stage was to determine the area search times, which represent the pure capabilities of the patterns. The second stage (ii) served as a transition phase, during which a sector system was established for the areas to be scanned. The objective was to create a sector system to identify where objects would begin to drift due to wind and current. In the final stage, datasets generated from various combinations of search area sizes, wind speeds, and current speeds and directions, as defined in Table 1, were used for each of the five different types of drifting objects. The generated datasets were coded in the format [Test Group] [Object][Wind][Current], as shown in Table 3. In this coding system, AltEs and AltPar represent the expanding square and parallel search pattern groups, respectively, while the object code identifies the drifting-object type (e.g., PIW: person in water). The W and C codes indicate wind and current speeds in knots, respectively. For example, AltEs_PIW_W3_C1 represents the expanding square search pattern group with a PIW target under wind and current speeds of 3 and 1 knots, respectively. Therefore, in this study, a total of 184,000 scenarios were generated for each of the two search pattern groups, parallel search and expanding square search, resulting in 368,000 scenarios overall. These scenarios encompass all possible combinations of 23 different search area sizes, 5 wind speeds, 5 current speeds, 8 wind directions, 8 current directions, and 5 types of drifting objects. Furthermore, as presented in Table 3, a total of 250 scenarios were defined for the two search pattern groups, namely, parallel search and expanding square search, with 125 scenarios assigned to each group. For each group, the 125 scenarios were obtained from combinations of 5 wind speeds, 5 current speeds, and 5 types of drifting objects (5 × 5 × 5 = 125). Each scenario was further evaluated across 23 different search area sizes, 8 wind directions, and 8 current directions, resulting in 1472 cases per primary scenario (23 × 8 × 8 = 1472). Accordingly, 184,000 scenario cases were generated for each search pattern group (125 × 1472 = 184,000), yielding a total of 368,000 scenario cases across both groups (184,000 × 2 = 368,000). Accordingly, the scenarios generated from these datasets were implemented in Python (version 3.13), and the results were obtained using Jupyter Notebook (version 7.4.5). All analyses were performed on a computer equipped with an Intel Core Ultra 7 258V processor (2.20 GHz), 32 GB of RAM, and an Intel Arc 140V GPU.
The purpose of the final stage was to determine which pattern could detect drifting objects the fastest using the results of the datasets created with the parameters in Table 1, under what conditions each pattern could detect or miss objects, and which object had a higher detection rate based on the area, as well as to propose alternative patterns to those accepted in the maritime sector under the IAMSAR framework. Figure 2 illustrates how the images were rendered across a 200 km2 area to show the samples used in all tests. For the parallel search pattern and its alternatives, the starting point is defined as the top-right corner of the search area. In this study, due to algorithmic requirements, the Moore pattern is initiated at the point closest to the standard starting position. For the expanding square search pattern and its alternatives, the starting point is set at the centre of the search area; in all these patterns, the initial movement is directed to the left (along the −X axis), followed by a clockwise progression that expands outward from the centre.
Figure 2.
Generated search patterns for an area of 200 km2.
All stages in this study used a deterministic scenario approach based on predefined mathematical models and fixed input parameters. In the first phase, search areas, pattern-generation formulas, and scanning parameters were predetermined, and wind and current speeds were assumed to be 0 knots. In the final stage, scenarios created from combinations of different search area sizes, wind and current speeds, and their directions were applied to five different types of drifting objects. Although different parameter combinations produced different performance results, because no components involved random variability, repeated calculations under the same conditions yielded identical results. Therefore, repeating the same scenarios does not constitute independent random observations. The objective is to directly compare the performance of search patterns under predefined parameter combinations, rather than to make statistical inferences about randomly sampled sea conditions. In this context, no inferential statistical significance tests were applied; performance evaluations were conducted based on calculated scan times, distances travelled, target detection times, and detection rankings. Therefore, the performance rankings reflect results calculated under the evaluated conditions and should not be interpreted as evidence of a statistically significant advantage across all possible sea conditions.
4.2. Stage 1: Baseline Area Coverage Performance Evaluation
Table 4 presents the results of the first stage of the study, in which 23 area coverage tests were conducted to compare the performance of IAMSAR-recommended search patterns and their proposed alternatives under identical environmental conditions. To eliminate the influence of external environmental factors on search pattern performance, both wind and current speeds were set to 0 knots, and no drifting objects were included in the evaluation.
Search patterns were evaluated in two separate groups based on their starting positions. The first group consists of the parallel search pattern, which begins at a corner of the search area, and the alternatively proposed Hilbert, Morton, Moore, and V-formation patterns. The second group includes the expanding square, pentagonal, hexagonal, octagonal, and spiral search patterns, which begin at the centre of the search area. For all search patterns in both groups, track spacing (S) was kept constant at 2 nautical miles, and this value formed the basis for mathematically generating the search routes. Each search pattern was evaluated independently for each search area of varying sizes ranging from 5 to 500 km2, as specified in Table 4. All patterns within the same group were tested under the same search area boundaries and the same environmental conditions. Search routes were mathematically generated to cover the entire predefined search area, based on a specified 2 NM track spacing. Each search pattern continued until it reached the final coordinate of the route generated according to the mathematical structure of the relevant algorithm and the boundaries of the defined search area. The criterion for completing the search operation was defined as reaching the final coordinate determined by the algorithm, and this principle was applied uniformly across all search patterns. The route-planning process followed the principle of including all sections of the defined search areas within the planned search scope, ensuring that no sub-area was intentionally excluded from the search. Thus, the total distance travelled and completion times for all search patterns were compared under standardised line spacing and environmental conditions. This evaluation focuses on total distance travelled and time to complete the routes created for the defined search areas, rather than on the probability of detecting the search object.
Table 3.
Dataset of the scenarios.
Table 4.
Area coverage efficiency test.
Table 4 has two main columns showing results for the parallel search pattern and its alternatives, and the expanding square search pattern and its alternatives. Each column includes the names of the fastest and second-fastest patterns, the distance covered, and the time taken. When examining the results for the parallel search pattern and its alternatives in the first column covering areas of 5–500 km, the Hilbert search pattern and the parallel search pattern stand out as the top two performers. As the area increases, the parallel search pattern performs better, while the Hilbert search pattern performs well in smaller areas. Additionally, the Hilbert search pattern was the fastest to scan the area within the 130–200 km2 range. In second place, the Morton curve search pattern was successful in small areas, but as the area increased, the parallel and Hilbert search patterns became the second-fastest area-scanning patterns when they did not take first place. When examining the results for the expanding square search pattern and alternative search patterns in the second column, the expanding square pattern scans areas in the ranges 35–50 km2 and 90–120 km2 more quickly, while in other areas the hexagonal and pentagonal patterns scan more quickly. When examining second-place performance, we observe that even when it does not rank first, the expanding square search pattern is not the second-fastest pattern for areas up to 250 km2, and that the alternative patterns yield better results. For areas of 250 km2 and above, however, the expanding square search pattern is the second-fastest pattern.
4.3. Stage 2: Sector System for Determining the Initial Positions of Drifting Objects
This stage is a transitional phase in which the sector system is established for the objects to drift. Each sector covers an area of 2 × 2 km2, and the sectors expand in a spiral pattern starting from the centre, depending on the size of the area. As shown in Figure 3, 121 sectors were created within a 500 km2 area, and the objects at the centre of each sector were drifted by the variable wind and current from the datasets in Table 3 for the final stage. This stage supports the final stage of dataset analysis, regardless of the area scanned by the patterns, and establishes a standard starting position for the drifted object across all areas to be scanned.
Figure 3.
A 500 km2 area sector system.
4.4. Stage 3: Comprehensive Scenario-Based Search Pattern Performance Evaluation
In this stage, scenarios created using the datasets in Table 3 were tested under equal conditions, comparing alternative search patterns to both the parallel search pattern and the expanding square search pattern, and results were obtained. The results are as follows.
Figure 4 shows the number of times the parallel search pattern and its alternatives detected drifting objects in the fastest and second-fastest times across all datasets. In the graph, the orange bars represent the number of instances in which a pattern achieved the fastest detection time compared to the other alternatives, while the blue bars represent the number of instances in which it achieved the second-fastest detection time. Overall, the Moore pattern ranked first with 1,380,980 fastest detections, followed by the Hilbert pattern with 1,248,807 detections. The Morton pattern achieved the highest number of second-fastest detection times, with 1,597,079, followed by the Hilbert pattern, which ranked second with 852,108 second-fastest detection times. The parallel search pattern, however, was behind its alternatives with 258,428 fastest and 253,539 second-fastest detections.
Figure 4.
Parallel search pattern and alternatives.
Figure 5 shows the number of times drifting objects were detected in the fastest and second-fastest times across all datasets using the expanding square search pattern and its alternatives. The orange bars represent the number of instances where the fastest detection time was achieved, while the blue bars represent the number of instances where the second-fastest detection time was achieved. The results show that the spiral pattern stood out significantly from the other patterns, with 2,148,058 fastest detections. The spiral pattern was followed by the hexagon pattern with 1,092,066 fastest detections and the expanding square pattern with 882,062 fastest detections. For second-fastest detections, the expanding square pattern ranked first with 1,673,627 detections, while the octagon pattern achieved 1,209,647 and the hexagon pattern achieved 904,556 detections.
Figure 5.
Expanding square search pattern and alternatives.
Figure 6 shows the number of times the expanding square search pattern and its alternatives achieved the shortest detection time for a drifting object of the PIW type under conditions of 3-knot wind and a 1-knot current across different search areas. The results show that the expanding square pattern achieves the highest values in areas between 20 and 35 km2, while the spiral pattern achieves the highest values in areas between 70 and 350 km2. While the spiral and hexagonal patterns yielded similar results in areas ranging from 40 to 60 km2, the spiral and octagonal patterns achieved comparable values in a 400 km2 area, and the octagonal pattern yielded the highest detection count in areas ranging from 450 to 500 km2.
Figure 6.
Expanding square search pattern and alternatives in scenario AltEs_PIW_W3_C1.
Figure 7 shows the number of times the expanding square search pattern and its alternatives achieved the shortest detection time for a drifting object of the PIW type under conditions of 3-knot wind and 3-knot current across different search areas. The results show that the spiral pattern generally achieves the highest detection counts in areas ranging from 20 to 500 km2. The hexagonal pattern showed higher detection counts than the other alternatives, particularly in areas of 70 km2 and larger, while the octagonal pattern showed higher detection counts in areas ranging from 300 to 500 km2.
Figure 7.
Expanding square search pattern and alternatives in scenario AltEs_PIW_W3_C3.
Figure 8 shows the numbers required to achieve the shortest detection time for a drifting object of the PIW type under conditions of 3-knot wind and a 5-knot current, using the expanding square search pattern and its alternatives across different search areas. The results show that the spiral pattern achieves the highest detection counts across all areas from 20 to 500 km2. The hexagonal pattern showed more pronounced detection counts, particularly in areas of 70 km2 and larger; the expanding square pattern in areas of 150 km2 and larger; and the octagonal pattern in areas of 300 km2 and larger.
Figure 8.
Expanding square search pattern and alternatives in scenario AltEs_PIW_W3_C5.
Figure 9 shows the number of times the parallel search pattern and its alternatives achieved the shortest detection time for a drifting object of the PIW type under conditions of 3-knot wind and a 1-knot current across different search areas. The results show that the Moore pattern generally achieves the highest detection counts in areas ranging from 20 to 100 km2. In areas ranging from 110 to 500 km2, however, the Hilbert pattern stands out and achieves the highest detection counts, particularly in areas of 300 km2 and larger.
Figure 9.
Parallel search pattern and alternatives in scenario AltPar_PIW_W3_C1.
Figure 10 shows the number of times the parallel search pattern and its alternatives achieved the shortest detection time for a drifting object of the PIW type under conditions of 3-knot wind and a 3-knot current across different search areas. The results show that the Moore pattern generally achieves the highest detection counts in areas ranging from 20 to 140 km2, while in areas between 45 and 50 km2, it yields values close to those of the Morton pattern. In areas ranging from 150 to 500 km2, the Hilbert pattern achieves the highest detection counts, while both the Moore and Morton patterns show increased detection counts, particularly in areas of 300 km2 and larger.
Figure 10.
Parallel search pattern and alternatives in scenario AltPar_PIW_W3_C3.
Figure 11 shows the number of detections required to achieve the shortest detection time for a drifting object of the PIW type under conditions of 3-knot wind and a 5-knot current using the parallel search pattern and its alternatives across different search areas. The results show that, for areas ranging from 20 to 140 km2, the Moore pattern generally achieves the highest number of detections. While the Hilbert and Moore patterns show similar results for areas between 150 and 200 km2, the Moore pattern achieved the highest detection counts for areas between 250 and 350 km2, the Hilbert pattern for the 400 km2 area, and the Moore pattern again for areas between 450 and 500 km2.
Figure 11.
Parallel search pattern and alternatives in scenario AltPar_PIW_W3_C5.
In conclusion, the Moore and Hilbert patterns achieve higher numbers of drifting objects detected in the shortest time than the traditional parallel search pattern. In contrast, while the spiral pattern stands out in total objects detected in the shortest time, the relative performance of the expanding square pattern and other alternatives varies with search area size and wind and current conditions. Area-based comparisons show that the patterns yielding the shortest detection times can vary across different scenarios, and that the relative advantages of the patterns depend on the environmental and operational conditions under evaluation. Details of the results presented in Figure 4, Figure 5, Figure 6, Figure 7, Figure 8, Figure 9, Figure 10 and Figure 11 can be found in the Supplementary Materials.
4.5. Sensitivity Analysis
To evaluate the sensitivity of search patterns to changes in environmental conditions, a single-variable sensitivity analysis was conducted using the datasets created in the third phase. To this end, in Analysis A, the current speed was kept constant at 1 knot while the wind speed was varied between 1 and 5 knots; in Analysis B, the wind speed was kept constant at 1 knot while the current speed was varied between 1 and 5 knots. A PIW was used as the drifting object type. While keeping the other scenario parameters constant, changes in the target detection performance and success rankings of both search pattern groups were compared. The parameters used in the analyses are presented in Table 5.
Table 5.
Parameters used in sensitivity analysis.
As part of the sensitivity analysis, the effects of changes in wind and current speeds on the success rates of search patterns in initially detecting drifting objects were examined. For both pattern groups, heat maps visualised first-detection success rates across different speed values. Figure 12 presents the results for the parallel search pattern and its alternatives, while Figure 13 presents the results for the expanding square search pattern and its alternatives.
Figure 12.
Sensitivity analysis of parallel search pattern and alternatives.
Figure 13.
Sensitivity analysis of expanding square search pattern and alternatives.
In the results of Analysis A, wind speeds from 1 to 5 knots did not alter the pattern, with the highest first-detection rate in both pattern groups. In the parallel search group, the initial detection rate of the Hilbert pattern increased from 37.85% to 38.81%, while in the expanding square search group, the initial detection rate of the spiral pattern rose from 38.29% to 39.80%. In Analysis B, the initial detection rates changed more significantly as current speed increased. In the expanding square group, the spiral pattern maintained the highest initial detection rate, rising from 38.3% to 43.6% across all current speeds, while in the parallel search group, the Hilbert pattern had the highest initial detection rate at 37.9% at a current speed of 1 knot; at current speeds of 2 knots and above, the Moore pattern rose from 35.7% to 45%, becoming the pattern with the highest initial detection rate.
Overall, the sensitivity analysis shows that initial detection performance remains relatively stable under changes in wind speed but is more strongly affected by changes in current speed. This indicates shows that the effectiveness of different search patterns depends on specific environmental conditions. However, the sensitivity analysis conducted is limited to the selected drifting object and the specified ranges of environmental parameters; it does not account for sensor characteristics, ship manoeuvring dynamics, or time-dependent environmental variability under actual operational conditions.
5. Results and Discussion
The SAR Convention aims to ensure that contracting states conduct search and rescue operations for persons in distress at sea within a framework of coordinated, standardised procedures. The IAMSAR Manual, which supports the operational implementation of this framework, provides standard methods for planning, coordinating, and executing search and rescue operations in the maritime and aviation sectors. In this study, scenarios representing different environmental and operational conditions were developed to evaluate the performance of traditional search patterns used under the IAMSAR framework and to compare the effectiveness of search patterns developed as alternatives.
The primary motivation for selecting these alternative patterns was to highlight differences in distance covered, search time, and target detection performance when scanning the same search area using different search patterns. Accordingly, the Hilbert, Moore, Morton, and V-formation patterns were evaluated as alternatives to the parallel search pattern. The Hilbert and Moore curves are space-filling search patterns that provide high spatial continuity between adjacent regions within the area. The Morton curve, by contrast, offers a distinct search pattern that scans the area using a hierarchical, orderly spatial sequence [48]. The purpose of including these three patterns is to examine the effect on SAR performance of scanning the area with more holistic, highly continuous paths, as opposed to the standard linear parallel scanning approach. In contrast, the V-formation pattern was evaluated as a biologically inspired search pattern based on the coordinated movement patterns observed in bird flocks, and the applicability of this distinct scanning organisation to the SAR problem was investigated [49].
As alternatives to the expanding square search pattern, pentagonal, hexagonal, octagonal, and spiral patterns were selected. A common feature of these patterns is that they allow the search to expand outward from a specific centre or datum point. The pentagonal, hexagonal, and octagonal patterns were used to evaluate the effect on performance of altering the number of corners and the direction change structure in the expanding square approach; the spiral pattern, meanwhile, was considered as an alternative search pattern that provides a more continuous expansion outward from the centre rather than sharp corner transitions. Thus, the aim was not only to compare the performance of different patterns but also to examine how transforming the same basic search logic into different pattern geometries alters the operational results.
Instead of evaluating pattern performance directly under environmental variables, we implemented a three-stage testing process to distinguish performance differences attributable to the search pattern from those caused by environmental effects as follows:
- In the first stage, the system excluded external influences such as wind, current, and target drift and tested the standard patterns used under IAMSAR, along with the proposed alternative patterns, under the same initial and search area conditions. In this stage, the distance travelled and the search time required by the patterns to scan the defined area were primarily evaluated. The aim was to establish the baseline performance of each search pattern independently of environmental conditions and to more accurately assess, in subsequent stages, the extent to which observed changes stemmed from geometry versus environmental and target-dependent factors.
- In the second stage, considering that in real SAR operations the target may be located at different points within the search area, a sector-based structure was applied to the search areas. For this purpose, the areas to be scanned were divided into sectors using a grid system, and the centre of each sector was defined as a possible target starting point. By initiating the drift of a person or object from different sector centres, the study avoided evaluating the pattern’s performance against a single datum or target location. This allowed a systematic examination of how the same pattern would behave toward targets in different regions of the search area and facilitated the creation of a more comprehensive starting position structure for the drift scenarios applied in the final stage.
- In the final stage, the model was further adapted to real operational conditions, and wind, current, and target drift were evaluated together. The speeds and directions of wind and current were determined; additionally, datasets were created for five different types of drifting people/objects by utilising their respective sinking, drifting, and drift characteristics. Standard and alternative patterns were run under the same initial conditions for different search area sizes, target types, and environmental conditions, and their target detection performances were compared. Thus, the study evolved into a phased evaluation structure, starting with purely geometric area search performance in the first phase, incorporating variability in the target’s initial position in the second phase, and encompassing environmental drift and target characteristics in the third phase.
Furthermore, to ensure that comparisons were made between patterns with similar starting points and search logic, the patterns were evaluated in two main groups. In the first group, the IAMSAR parallel search pattern was compared with the Hilbert, Moore, Morton, and V-formation patterns. In the second group, the expanding square search pattern was evaluated alongside the pentagonal, hexagonal, octagonal, and spiral search patterns. This grouping was intended to reduce bias from directly comparing patterns with significantly different characteristics within a single group and to enable a more meaningful evaluation among patterns with similar search logic. The area search analyses conducted in the initial phase, independently of external factors, provided a baseline for comparison for subsequent scenarios. In this phase, the patterns were analysed independently of additional uncertainties that could be introduced by target movement, wind, and currents, and the differences in distance and time required by the search patterns to scan the area were examined. Consequently, the target detection performances obtained in subsequent phases were evaluated not only in terms of environmental variables but also by considering the initial search patterns.
Table 4 shows the area search results from the first stage, with no wind or current effects and no drifting targets. Among the parallel search patterns and their alternatives, the Hilbert and parallel search patterns had the shortest area search times. The Hilbert pattern achieved the shortest search time, particularly in smaller areas and within the 130–200 km2 range, while the parallel search pattern became more advantageous as the area size increased. For the second-shortest search times, the Morton pattern stood out in small areas, while in larger areas the parallel and Hilbert patterns ranked second when they were not first. In the expanding square search pattern group, the expanding square pattern achieved the shortest area search time in the 35–50 km2 and 90–120 km2 ranges, while the pentagon and hexagon patterns stood out in other areas. The expanding square pattern achieved the second-shortest search time in areas of 250 km2 and larger. In the second stage, the sector system shown in Figure 3 was created, and the initial positions of the drifting objects were integrated into this system.
In the final stage, the parallel search pattern was compared with the Hilbert, Moore, Morton, and V-formation patterns. When all scenarios were evaluated together, the Moore pattern ranked first in the number of drifting objects detected in the shortest time, followed by the Hilbert pattern; the Morton pattern, meanwhile, stood out for the number of instances in which it achieved the second-shortest detection time. These three alternative patterns achieved faster detections than the traditional parallel search pattern across all evaluated scenarios. However, it was observed that the relative performance of the patterns varied depending on the size of the search area and environmental conditions. Indeed, in area-based PIW scenarios, the Moore pattern performed better in smaller areas, while the Hilbert pattern stood out in specific sections of larger areas; changes in current conditions also influenced this distribution. The geometric structures of the Hilbert and Moore patterns, which provide spatial continuity, may help explain differences in encounter times with targets. However, this explanation is based on an interpretation of the pattern’s geometry and must be validated under actual operational conditions. The V-formation pattern, by contrast, was behind the traditional parallel search pattern in total detections. These results indicate that alternative patterns can offer advantages in the evaluated scenarios, but that no single pattern can be considered unconditionally superior for all search area sizes and environmental conditions. The SAR literature also emphasises the effects of target motion and time-dependent spatial probability distributions on search planning. While Wu et al. [9] focused on prioritising regions with high detection probability using drift-dependent target probability distributions, Jeong et al. [10] showed that time-dependent particle distributions affect SAR unit deployment and search performance. Although these studies do not directly prove the superiority of a specific search pattern, they support the view that target motion cannot be evaluated independently of search planning.
The expanding square search pattern was compared with pentagonal, hexagonal, octagonal, and spiral search patterns. When all scenarios were evaluated together, the spiral pattern stood out for detecting the most drifting objects in the shortest time, followed by the hexagonal and expanding square patterns. For the second-shortest detection time, the expanding square pattern ranked first, while the octagonal pattern ranked second. This indicates that the alternative patterns differ not only in the total number of fastest detections but also in the second-fastest detection results. However, detailed analyses based on search area size and environmental conditions revealed variations in the relative performance of the patterns. In the selected PIW scenarios, the spiral pattern generally achieved the most first detections, while results for the expanding square, hexagonal, and octagonal patterns varied with search area size and current conditions. The traditional expanding square pattern, on the other hand, achieved the shortest scan time within specific small area intervals in the first stage, where environmental effects were absent. The spiral pattern’s geometric structure, which continuously expands from the centre outward, may offer an advantage in the time it takes to encounter drifting targets. Similarly, the different direction-changing structures of polygonal patterns can interact in various ways with the target’s motion and the characteristics of the search area. However, these explanations rely on a geometric interpretation of the current results, and the effects have not been directly measured. Therefore, the identified advantages must be verified under real maritime conditions, accounting for the ships’ manoeuvrability and sensor characteristics. The results show that search pattern performance depends not only on geometric shape but also on the interaction between the generated trajectory, the target’s motion, and the search area. Consequently, when applying different search geometries to SAR systems, trajectory length, turn structure, outward expansion from the centre, and conditions for encountering a moving target need to be evaluated collectively.
The five different types of drifting targets used in the scenarios resulted in variations in detection times; however, this effect was less pronounced than the variations caused by wind and current speeds. This finding indicates that while drifting behaviour dependent on target type is important, the effect of environmental drift forces on performance can be more pronounced in the evaluated scenarios. The literature has also shown that an object’s type and configuration alter its drift trajectory. It has been shown that the type of watercraft, the posture of a person who has fallen into the water, and the characteristics of a life raft result in distinct drift characteristics. The findings of this study, however, indicate that these target-induced drift differences may affect not only the location of the potential search area but also the relative performance of the search patterns used. In addition, the area-based detection and miss rates of the drifting targets were evaluated as a third performance indicator for each search pattern. Detailed results for this analysis are provided in Appendix A.
The target detection and miss rates calculated in this study are based on a detection criterion defined by the distances of drifting targets from the search route. As a result, these rates do not directly reflect visual obstructions that may arise under rough sea conditions or the proportion of the unique area physically covered by the search patterns. Accordingly, target detection success should be evaluated separately from the probability of visual detection and area coverage efficiency under actual sea conditions.
Overall, when all results were evaluated together, the Moore pattern ranked first in the parallel search group in terms of the number of target detections achieved in the shortest time, followed by the Hilbert pattern, while the Morton pattern stood out particularly in the number of detections achieved in the second-shortest detection times. The traditional parallel search pattern and the V formation, however, were behind their alternatives in these metrics. In the expanding square group, the spiral pattern clearly outperformed the hexagon and expanding square patterns in the total number of fastest detections. For second-fastest detection counts, the expanding square and octagon patterns stood out. However, evaluations based on area and environmental conditions indicate that the relative performance of the patterns can vary depending on the size of the search area, wind and current conditions, and the characteristics of the drifting target.
The study’s three-stage evaluation framework is also significant for interpreting these results. In the first stage, the characteristics of the patterns were determined independently of environmental effects; in the second stage, different starting positions of the target within the search area were incorporated into the system; and in the final stage, wind, current, and target-specific drift characteristics were evaluated together. This approach ensured that pattern performance was examined not under a single condition but under progressively increasing operational complexity. Thus, the results obtained reveal not only detection success in a specific scenario but also the interaction between the search pattern and environmental and target-dependent variables. When evaluated alongside fundamental trends in the existing SAR literature, the study’s distinguishing features become clearer. Current studies primarily focus on modelling target drift, estimating the target’s probabilistic location, optimising the search route, allocating resources, and detecting the target via sensors or UAV systems. While these approaches have significantly improved various stages of SAR operations, the development of new patterns that could serve as alternatives to the standard IAMSAR search patterns and the direct comparison of these patterns under the same drift, environmental, and search area conditions have remained relatively limited in the literature.
This study proposes alternative search patterns to parallel and expanding square search patterns to address this research gap; it mathematically formulates these patterns, implements them algorithmically, and compares their performance with standard IAMSAR patterns under the same conditions. Defining the proposed patterns not only as conceptual search structures but also as reproducible mathematical structures enable their reuse, parametric modification, and integration into different systems in future SAR planning models. This structure lets researchers evaluate patterns under different search space configurations, environmental conditions, target behaviours, and platform characteristics without recreating the underlying search logic. Consequently, the contribution of this study is not limited to comparing pattern performances; it also provides a reproducible and extensible search pattern framework that can be used in future optimisation, simulation, and decision support applications. The findings also indicate that the choice of search pattern should be considered not merely as a fixed procedural element but as an operational planning variable that interacts with wind and current conditions, the size of the search area, the target’s initial position, and the target’s mobility. However, the results do not support unconditionally using a specific alternative pattern in place of standard IAMSAR patterns. On the contrary, the findings indicate that a single search pattern may not be optimal for all SAR scenarios, and that pattern selection should be based on mission-specific conditions. Scenarios with low drift, more confined areas, and a reliable datum may not benefit as much from the same search pattern as scenarios characterised by high wind current effects, extensive search areas, and higher target mobility. Therefore, comparing standard and alternative patterns before the mission under the same environmental and operational inputs can enable more flexible, data-driven pattern selection in SAR planning.
Consequently, this study directly addresses the question “Which pattern can most effectively scan the defined search area?” in addition to the traditionally emphasised questions in SAR planning: “Where might the target be located?” and “How should the search route be optimised?” This approach moves beyond treating search pattern selection as merely a standard operational procedure; instead, it treats it as a SAR planning variable that can be compared in conjunction with environmental conditions and target behaviour and integrated into future decision support systems.
5.1. Theoretical Implications
The current literature on maritime search and rescue increasingly focuses on drift modelling, probability-based search planning, route optimisation, and resource allocation; in contrast, it addresses the search pattern only to a limited extent as an independent determinant of operational performance. Breivik et al. [8] established the theoretical foundation for object-specific drift estimation using the leeway approach, while subsequent studies have extended this approach toward the integration of the target’s probabilistic distribution into search planning. Wu et al. [9] integrated drift-based probability maps into coverage path planning using deep reinforcement learning, while Jeong et al. [10] utilised time-dependent particle distributions for the dynamic deployment of SAR units and search planning. Similarly, Morin et al. [31], Miao et al. [12], and Esmaeilpour et al. [13] have focused primarily on optimising the search path, the process of reaching the target, and multiple SAR sources.
This study extends the existing literature by conceptualising the search pattern as a distinct component of SAR performance. While previous studies have largely focused on questions such as where the target might be located or how to optimise an existing search route, this study directly examines how the search pattern used to scan the search area affects operational outcomes. In this context, the study develops alternative geometries to the standard search patterns used under IAMSAR and comparatively tests them across different datasets and scenarios. Thus, the study extends the current optimisation-based SAR approach by systematically comparing search pattern structures.
Furthermore, the proposed approach enables the evaluation of the relationship between search area characteristics, pattern geometry, search duration, and distance covered within a common analytical framework. In this regard, the study raises the question “Which pattern can most effectively scan the defined search area?” as a systematic research problem, in addition to the questions “Where should the search be conducted?” and “How should the search route be optimised?”, which are primarily addressed in current SAR theory. Thus, the selection of a search pattern moves from an operational preference to a theoretically examinable component of SAR planning. This approach provides a conceptual foundation for future work that integrates pattern geometry with drift models, probability distributions, environmental conditions, and adaptive decision support systems.
5.2. Practical Implications
The findings of this study indicate that selecting a search pattern in maritime search and rescue operations can be approached not merely as a standard procedure but as an operational decision evaluated based on the size of the search area, the target’s drift characteristics, and environmental conditions. While the standard patterns used under IAMSAR remain the primary reference in SAR planning, the alternative patterns evaluated in this study offer complementary options under specific scenario conditions. Across all scenarios in the parallel search group, the Moore and Hilbert patterns achieved the fastest detection time, while the Morton pattern achieved the second-fastest detection time, indicating that comparing these alternatives based on mission conditions could be beneficial. However, considering performance differences related to area size and environmental conditions, it is not appropriate to unconditionally recommend any of these patterns as a replacement for the traditional parallel search pattern.
Similarly, in operations that use the expanding square search pattern, it is important to reassess the pattern choice based on environmental and operational conditions. The aggregate results across all scenarios show that the spiral pattern achieves the fastest detection time, while the traditional expanding square pattern yields the second-fastest detection time. However, the expanding square pattern achieves the fastest scanning time for certain area sizes in the initial phase when environmental effects are absent, showing that it retains its advantage under certain conditions. Therefore, comparing the spiral, hexagonal, and other alternative patterns with the traditional expanding square pattern, particularly by considering search area size and the target’s drift behaviour, may offer additional options for operational planning. This approach also aligns with studies emphasising that environmental variables affect both target movement and operational planning. Tavakoli et al. [18] have shown that meteorological and oceanographic conditions affect the time windows during which SAR operations can be safely conducted.
The fact that the patterns developed in the study are algorithmically coded also provides a practical advantage for transferring the findings to decision support systems. Before a SAR mission, standard and alternative patterns can be run from the same starting position, search area, target type, and wind and current conditions to compare estimated search time, distance covered, and target detection performance. Thus, the mission coordinator or operations planner can select the pattern not only based on a predefined procedure but also by considering quantitative results from mission-specific scenarios. This approach is consistent with the digital operations planning approach presented by the IAMSAR-compliant decision support and verification tool developed by Pessôa et al. [19]. The study in question demonstrated that variables such as meteorology, target type, available units, search distance, and elapsed time can be evaluated within a single decision support environment. Similarly, Esmaeilpour et al. [13] demonstrated that search time and resource utilisation can be optimised in a decision support approach combining simulation with mathematical optimisation, and that flexible search efforts can yield significant operational savings. Therefore, pre-mission comparison of the proposed patterns can contribute to the more effective use of available SAR resources, particularly in operations where mission duration, range, or fuel is limited.
Although fractal search patterns, such as those proposed by Hilbert and Moore, show strong target detection performance in the scenarios, their complex geometric structures may pose challenges for real-world maritime operations. Short route segments and frequent course changes can make it difficult to follow these patterns manually, increasing watch officers’ workload and making it harder to follow the planned route precisely. However, these patterns are not limited to autonomous maritime vehicles. They may also apply to conventional ships equipped with appropriate navigation planning and automatic route-tracking systems. However, these systems do not eliminate ships’ physical manoeuvring constraints. The present study did not directly evaluate the operational challenges that may arise from manual route tracking, the crew’s workload, or the effects of automatic route-tracking systems on performance. Therefore, it has not yet been confirmed that the performance advantages identified in the scenarios will be maintained to the same extent in real-world ship operations.
Another important factor affecting the performance of search patterns under actual sea conditions is the limitations on visual detection imposed by sea state. Particularly in rough sea conditions, small targets near the water’s surface may be partially or completely obscured by waves, making them undetectable even if they are within the target detection range. In addition, because the relationship between the vessel’s course and the direction of the waves can affect target observability, the detection performance of search patterns involving cross-course or curved routes may vary under different sea conditions. From this perspective, it is important to distinguish between the route range and the effective search width, which depends on the target’s characteristics, the search platform, and environmental conditions when evaluating search patterns. A decrease in the effective scan width can lead to a lower probability of target detection, even if the same route range is maintained. Furthermore, different search zones and areas can affect area coverage efficiency, which determines how much of the search area is effectively searched. Although the present study compared all search patterns under a common detection criterion, it did not directly model wave-induced visual blind spots or variations in effective scanning width depending on sea state and course direction. Therefore, assessing whether the performance differences identified between the patterns will be maintained to the same extent under actual sea conditions requires accounting for these factors as well.
From a practical application perspective, another important issue is the phased validation of alternative patterns before they are directly converted into operational standards. In the first phase, tests conducted in a simulation environment under various sea and weather conditions can be used; in the second phase, training and field exercises; and in subsequent phases, controlled real-world operational tests. In this process, the platforms’ turning radius and manoeuvrability, cruising speed, fuel or battery capacity, sensor field of view and detection probability, communication constraints, and real-time wind and current changes must also be incorporated into the model. The existing literature also supports this requirement. Cho et al. [11] tested the multi-UAV coverage path approach they developed in a real marine environment and demonstrated that the actual mission duration could differ from simulation results due to wind and communication uncertainties. Miao et al. [12] also emphasised that, despite successful results in simulations, uncertainties and disruptive effects in real maritime environments must be separately evaluated in terms of algorithm performance. This allows for an assessment of whether the pattern advantages identified in the simulation environment are maintained under actual operational conditions.
In this study, although wind and current speeds varied across scenarios created from different datasets, they were assumed to remain constant within each scenario. This approach controls for temporal and spatial environmental variability by enabling comparisons of different search patterns under the same environmental conditions. However, in real marine environments, wind and current conditions vary by time and location, which can affect drifting target trajectories, detection times, and the relative performance of search patterns. Therefore, the results must be evaluated within the model assumptions, where environmental conditions are constant throughout each scenario. Future studies aim to evaluate the proposed search patterns under more realistic environmental conditions by integrating temporally and spatially varying wind and current fields into the system.
Existing IAMSAR search patterns offer significant advantages in terms of coordination and operational feasibility, particularly in multi-vessel operations. However, using the alternative patterns proposed in this study in multi-vessel operations requires integrating them with existing search and rescue coordination procedures. In this context, dividing search areas into sub-zones among vessels, pre-planning vessel routes, maintaining appropriate safety distances, and implementing coordinated communication procedures can help manage potential collision risks. However, because the present study focuses on comparing individual search patterns, the scenario base scope did not include multi-vessel coordination and collision avoidance mechanisms.
6. Conclusions
This study compared standard IAMSAR search patterns used in maritime search and rescue operations with alternative patterns and systematically investigated how the search pattern affects target detection performance. Accordingly, scenarios were created in which different types of drifting targets, wind and current speeds, and search area sizes were varied; the parallel search pattern was compared with the Hilbert, Moore, Morton, and V-formation patterns, while the expanding square search pattern was compared with pentagonal, hexagonal, octagonal, and spiral patterns. Thus, the comparative analysis framework evaluated patterns with similar initial and scanning logic under the same operational conditions.
The findings indicate that search patterns yield different results for detecting drifting objects. In the parallel search group, across all scenarios combined, the Moore pattern achieved the highest number of instances with the fastest detection time, followed by the Hilbert pattern, while the Morton pattern stood out particularly in the number of instances with the second-fastest detection time. The V-formation pattern, however, was behind the traditional parallel search pattern in the overall evaluation. In the expanding square group, the spiral pattern stood out significantly in the number of times the fastest detection time was achieved, while the hexagonal and expanding square patterns followed it. For the number of times the second-fastest detection time was achieved, the expanding square and octagonal patterns stood out. However, the fact that the traditional parallel and expanding square patterns provided advantages at certain area sizes demonstrated that the superiority of alternative patterns cannot be generalised to all search conditions.
Another important finding is that the relative performance of search patterns depends on environmental conditions and search area size. While variations in wind and current speeds affect the movements of drifting targets and the conditions under which they encounter search patterns, the expansion of the search area has also led to differences in the detection performance of the patterns. This is demonstrated by the fact that the superiority of the Moore and Hilbert patterns in area-based evaluations varies under different conditions, while in the expanding square group, the relative performance of the spiral and other patterns differs depending on environmental parameters. Furthermore, the sensitivity analysis showed that the patterns with the highest initial detection rates remained dominant under changes in wind speed, whereas the leading pattern in the parallel search group could change under changes in current speed. Although detection times differed across five drifting object types, the evaluated scenarios showed that these differences were less pronounced than the variations caused by changes in wind and current speeds. These findings indicate that search pattern performance depends on interactions among target type, target movement, environmental conditions, and search area characteristics.
However, the performance differences in this study reflect deterministic scenarios based on predefined parameter combinations. Therefore, the performance rankings presented are valid only within the evaluated scenarios and should not be interpreted as indicating statistically significant superiority under all sea conditions, which may vary and involve uncertainty. In future studies, incorporating probabilistic environmental variability and uncertainties into the model will allow a more comprehensive examination of the statistical significance of performance differences between search patterns and their consistency across conditions.
In this regard, the study provides a complementary contribution to the current SAR literature on drift estimation, probability-based search planning, route optimisation, resource allocation, and target detection. While existing research primarily addresses where a target might be located or how an existing search route can be optimised, this study directly investigates which pattern would be more effective for scanning the search area. Therefore, the primary contribution of this study is not the invalidation of the standard patterns used under IAMSAR or the proposal of a single universal alternative; rather, it is its demonstration that the relative performance of different patterns may vary depending on the search area, environmental conditions, and target mobility and the provision of measurable alternatives to IAMSAR-based search planning.
Beyond this comparative contribution, the study also contributes to the SAR literature by mathematically formulating the proposed search patterns and making them algorithmically implementable. This framework enables researchers to reproduce, reuse, modify, and integrate the patterns into different models in future SAR optimisation, simulation, and decision support studies. In addition, the three-stage evaluation framework offers a methodological contribution by first examining the pattern’s performance through a baseline analysis independently of external influences, then gradually analysing it under scenarios involving different target starting positions, and finally examining it under scenarios that include wind, current, and target-specific drift characteristics. Consequently, this study’s contribution is not limited to identifying high-performance search patterns; it also provides a reusable, extensible framework for investigating search pattern selection under different operational conditions.
However, because the study’s results came from data-based scenarios, the alternative patterns must be validated under real-world sea conditions before they can be implemented in operations. Future studies should include the platforms’ manoeuvrability, turning radius, fuel consumption, sensor field of view and target detection probability, variable sea conditions, wave-induced visual obstructions, changes in effective scanning width, area coverage efficiency, communication constraints, and real-time wind and current variations. In addition, evaluating the feasibility of applying fractal search patterns, particularly in conjunction with manual navigation and automatic route-following systems in terms of crew workload and operational performance, will be an important part of future research. Furthermore, integrating the alternative patterns with dynamic drift models, time-dependent probability maps, and adaptive decision support systems could enable the search pattern to be automatically selected or reconfigured based on changing conditions during operations. Accordingly, future studies plan to test hybrid search patterns that combine different search patterns in a complementary manner using multiple SAR platforms. As part of these studies, the aim is to more thoroughly investigate the operational feasibility and generalisability of the proposed patterns by evaluating route coordination, maintaining safe distances between vessels, and managing collision risks during simultaneous search operations.
Supplementary Materials
The following supporting information can be downloaded at: https://www.mdpi.com/article/10.3390/jmse14212095/s1, Table S1. Expanding Square Search Pattern and Alternatives: Overview; Table S2. Parallel Search Pattern and Alternatives: Overview; Table S3. Expanding Square Search Pattern and Alternatives Scenario AltEs_PIW_W3_C1; Table S4. Expanding Square Search Pattern and Alternatives Scenario AltEs_PIW_W3_C3; Table S5. Expanding Square Search Pattern and Alternatives Scenario AltEs_PIW_W3_C5; Table S6. Parallel Search Pattern and Alternatives Scenario AltPar_PIW_W3_C1; Table S7. Parallel Search Pattern and Alternatives Scenario AltPar_PIW_W3_C3; Table S8. Parallel Search Pattern and Alternatives Scenario AltPar_PIW_W3_C5; Table S9. Expanding Square Search Pattern and Alternatives Scenario AltEs_PIW_W3_C1 Detection Results.
Author Contributions
Conceptualization, Ş.C.G.; methodology, Ş.C.G.; software, Ş.C.G.; validation, Ş.C.G.; formal analysis, Ş.C.G.; investigation, Ş.C.G.; data curation, Ş.C.G.; writing original draft preparation, Ş.C.G.; writing review and editing, Ş.C.G., E.A. and E.Ç.; visualization, Ş.C.G.; supervision, E.A. and E.Ç.; project administration, Ş.C.G. All authors have read and agreed to the published version of the manuscript.
Funding
This research received no external funding.
Institutional Review Board Statement
This material is the authors’ own original work, which has not been previously published elsewhere. The paper is not currently being considered for publication elsewhere. The paper reflects the authors’ own research and analysis in a truthful and complete manner.
Informed Consent Statement
Not applicable.
Data Availability Statement
The datasets generated and analysed during this study will be made publicly available upon acceptance of the manuscript in the following GitHub repository: https://github.com/Can-GKC/Rethinking-IAMSAR-Patterns (accessed on 1 November 2026).
Acknowledgments
This article is based on an ongoing doctoral dissertation being conducted within the PhD Program in Maritime Transportation Engineering at the Institute of Graduate Studies of İskenderun Technical University. The authors gratefully acknowledge Samet Gürgen and Emre Çakmak for their valuable academic contributions and constructive support during the development of this study.
Conflicts of Interest
The authors declare no conflicts of interest.
Appendix A. Notation and Symbols
Table A1.
Notation and symbols used in this study.
References
- UNCTAD. Review of Maritime Transport 2025: Staying the Course in Turbulent Waters; United Nations: Geneva, Switzerland, 2025; Available online: https://unctad.org/publication/review-maritime-transport-2025 (accessed on 15 May 2026).
- Zampeta, V.; Chondrokoukis, G.; Kyriazis, D. Applying big data for maritime accident risk assessment: Insights, predictive insights and challenges. Big Data Cogn. Comput. 2025, 9, 135. [Google Scholar] [CrossRef] [Scilit]
- European Maritime Safety Agency. Annual Overview of Marine Casualties and Incidents 2025. 2025. Available online: https://www.emsa.europa.eu/publications/item/5562-annual-overview-of-marine-casualties-and-incidents-2025.html (accessed on 15 May 2026).
- Wei, D.; Chen, Z.; Rose, A. Evaluating the role of resilience in reducing economic losses from disasters: A multi-regional analysis of a seaport disruption. Pap. Reg. Sci. 2020, 99, 1691–1722. [Google Scholar] [CrossRef] [Scilit]
- International Maritime Organization. Introduction to IMO. Available online: https://www.imo.org/en/about/pages/default.aspx (accessed on 10 June 2025).
- International Maritime Organization. International Convention on Maritime Search and Rescue (SAR). 27 April 1979. Available online: https://www.imo.org/en/about/conventions/pages/international-convention-on-maritime-search-and-rescue-%28sar%29.aspx (accessed on 5 January 2025).
- International Maritime Organization; International Civil Aviation Organization. IAMSAR Manual (Vol. II). 2019. Available online: https://www.imo.org/en/ourwork/safety/pages/iamsarmanual.aspx (accessed on 5 January 2025).
- Breivik, Ø.; Allen, A.A.; Maisondieu, C.; Roth, J.C. Wind-induced drift of objects at sea: The leeway field method. Appl. Ocean Res. 2011, 33, 100–109. [Google Scholar] [CrossRef] [Scilit]
- Wu, J.; Cheng, L.; Chu, S.; Song, Y. An autonomous coverage path planning algorithm for maritime search and rescue of persons-in-water based on deep reinforcement learning. Ocean Eng. 2024, 291, 116403. [Google Scholar] [CrossRef] [Scilit]
- Jeong, H.; Kim, C.-K.; Hong, S.-Y.; Yun, J.-H.; Kim, D.-Y.; Kim, Y.-H. Genetic-algorithm-based heatmap optimization of maritime search and rescue unit deployment considering time-step dynamics. Ocean Eng. 2026, 347, 124029. [Google Scholar] [CrossRef] [Scilit]
- Cho, S.W.; Park, H.J.; Lee, H.; Shim, D.H.; Kim, S.-Y. Coverage path planning for multiple unmanned aerial vehicles in maritime search and rescue operations. Comput. Ind. Eng. 2021, 161, 107612. [Google Scholar] [CrossRef] [Scilit]
- Miao, F.; Yan, G.; Xie, Y. Optimization of UAV-based moving target search in maritime search and rescue: An enhanced multi-strategy golden jackal optimization algorithm. Ocean Eng. 2025, 341, 122841. [Google Scholar] [CrossRef] [Scilit]
- Esmaeilpour, A.; Morin, M.; Abi-Zeid, I. Maritime search and rescue operations planning: A hybrid approach for multi-asset deconfliction and efficient resource allocation. Saf. Sci. 2027, 205, 107406. [Google Scholar] [CrossRef] [Scilit]
- Zhao, B.; Song, R.; Zhou, Y.; Yu, L.; Zhang, X.; Liu, J. Heuristic data-driven anchor generation for UAV-based maritime rescue image object detection. Heliyon 2024, 10, e30485. [Google Scholar] [CrossRef] [Scilit]
- Geng, W.; Yi, J.; Cheng, L. An efficient detector for maritime search and rescue object based on unmanned aerial vehicle images. Displays 2025, 87, 102994. [Google Scholar] [CrossRef] [Scilit]
- Martinez-Esteso, J.P.; Castellanos, F.J.; Calvo-Zaragoza, J.; Gallego, A.J. Maritime search and rescue missions with aerial images: A survey. Comput. Sci. Rev. 2025, 57, 100736. [Google Scholar] [CrossRef] [Scilit]
- Grönbäck, A.-M.; Andersson Granberg, T.; Matinrad, N. UAV deployment in maritime search and rescue: Evaluating the influence of dispatch location and weather conditions on response times. Saf. Sci. 2026, 204, 107392. [Google Scholar] [CrossRef] [Scilit]
- Tavakoli, S.; Kirezci, C.; Lee, J.; Sgarioto, D.; Skvortsov, A.T.; Babanin, A.V. A simple method for calculating the probability of quiescent periods in random seas for maritime search and rescue operations. Ocean Eng. 2024, 304, 117838. [Google Scholar] [CrossRef] [Scilit]
- Pessôa, L.A.M.; Barbosa, C.E.; David, R.B. Toward an IAMSAR-compliant naval shipboard application and validator for maritime SAR decision systems. Procedia Comput. Sci. 2023, 221, 146–153. [Google Scholar] [CrossRef] [Scilit]
- Breivik, Ø.; Allen, A.A. An operational search and rescue model for the Norwegian Sea and the North Sea. J. Mar. Syst. 2008, 69, 99–113. [Google Scholar] [CrossRef] [Scilit]
- Brushett, B.A.; Allen, A.A.; Futch, V.C.; King, B.A.; Lemckert, C.J. Determining the leeway drift characteristics of tropical Pacific Island craft. Appl. Ocean Res. 2014, 44, 92–101. [Google Scholar] [CrossRef] [Scilit]
- Meng, S.; Lu, W.; Li, Y.; Wang, H.; Jiang, L. A study on the leeway drift characteristic of a typical fishing vessel common in the Northern South China Sea. Appl. Ocean Res. 2021, 109, 102498. [Google Scholar] [CrossRef] [Scilit]
- Tu, H.; Wang, X.; Mu, L.; Xia, K. Predicting drift characteristics of persons-in-the-water in the South China Sea. Ocean Eng. 2021, 242, 110134. [Google Scholar] [CrossRef] [Scilit]
- Tu, H.; Xia, K.; Mu, L.; Chen, X.; Wang, X. Predicting drift characteristics of life rafts: Case study of field experiments in the South China Sea. Ocean Eng. 2022, 262, 112158. [Google Scholar] [CrossRef] [Scilit]
- Wu, J.; Cheng, L.; Chu, S. Modeling the leeway drift characteristics of persons-in-water at a sea-area scale in the seas of China. Ocean Eng. 2023, 270, 113444. [Google Scholar] [CrossRef] [Scilit]
- Abi-Zeid, I.; Frost, J.R. SARPlan: A decision support system for Canadian search and rescue operations. Eur. J. Oper. Res. 2005, 162, 630–653. [Google Scholar] [CrossRef] [Scilit]
- Ferrari, J.F.; Chen, M. A mathematical model for tactical aerial search and rescue fleet and operation planning. Int. J. Disaster Risk Reduct. 2020, 50, 101680. [Google Scholar] [CrossRef] [Scilit]
- Ai, B.; Jia, M.; Xu, H.; Xu, J.; Wen, Z.; Li, B.; Zhang, D. Coverage path planning for maritime search and rescue using reinforcement learning. Ocean Eng. 2021, 241, 110098. [Google Scholar] [CrossRef] [Scilit]
- Laperrière-Robillard, T.; Morin, M.; Abi-Zeid, I. Supervised learning for maritime search operations: An artificial intelligence approach to search efficiency evaluation. Expert Syst. Appl. 2022, 206, 117857. [Google Scholar] [CrossRef] [Scilit]
- Ma, Q.; Zhang, D.; Wan, C.; Zhang, J.; Lyu, N. Multi-objective emergency resources allocation optimization for maritime search and rescue considering accident black-spots. Ocean Eng. 2022, 261, 112178. [Google Scholar] [CrossRef] [Scilit]
- Morin, M.; Abi-Zeid, I.; Quimper, C.-G. Ant colony optimization for path planning in search and rescue operations. Eur. J. Oper. Res. 2023, 305, 53–63. [Google Scholar] [CrossRef] [Scilit]
- Li, X.; Gao, M.; Kang, Z.; Sun, H.; Liu, Y.; Yao, C.; Zhang, A. Collaborative search and rescue based on swarm of H-MASSs using consensus theory. Ocean Eng. 2023, 278, 114426. [Google Scholar] [CrossRef] [Scilit]
- Wang, H.; Tong, S.; Wang, A.; Zhang, W.; Hu, Z.; Peng, Z. Heterogeneous cross domain coordinated control of ASV-AUV system for maritime search and rescue. Ocean Eng. 2024, 306, 117950. [Google Scholar] [CrossRef] [Scilit]
- Wen, H.; Shi, Y.; Wang, S.; Chen, T.; Di, P.; Yang, L. Route planning for UAVs maritime search and rescue considering the targets moving situation. Ocean Eng. 2024, 310, 118623. [Google Scholar] [CrossRef] [Scilit]
- Zha, C.; Min, W.; Han, Q.; Xiong, X.; Wang, Q.; Xiang, H. SAR ship detection based on salience region extraction and multi-branch attention. Int. J. Appl. Earth Obs. Geoinf. 2023, 123, 103489. [Google Scholar] [CrossRef] [Scilit]
- Brown, R.; Molyneux, D.; Ryan, J.; Major, A. Maritime search and rescue in Canada and the use of emergency radio beacons. Mar. Policy 2023, 147, 105261. [Google Scholar] [CrossRef] [Scilit]
- Kayiran, B.; Yazir, D.; Aslan, B. Data-driven Bayesian network approach to maritime accidents involved by dry bulk carriers in Turkish search and rescue areas. Reg. Stud. Mar. Sci. 2023, 67, 103193. [Google Scholar] [CrossRef] [Scilit]
- Kengpol, A.; Chanchittakarn, C. Geo-spatial intelligence for searching and rescuing man overboard incidents using an artificial neural network: An empirical study of the Royal Thai Navy in the Gulf of Thailand. Expert Syst. With Appl. 2024, 238, 121858. [Google Scholar] [CrossRef] [Scilit]
- Qiao, W.; Guo, H.; Deng, W.; Huang, E.; Lin, G.; Ma, X.; Lian, C. Complex network-based risk analysis for maritime heavy casualties in China during 2012–2021. Ocean Eng. 2024, 308, 118258. [Google Scholar] [CrossRef] [Scilit]
- Norrington, L.; Quigley, J.; Russell, A.; Van der Meer, R. Modelling the reliability of search and rescue operations with Bayesian belief networks. Reliab. Eng. Syst. Saf. 2008, 93, 940–949. [Google Scholar] [CrossRef] [Scilit]
- Benz, L.; Münch, C.; Hartmann, E. Development of a search and rescue framework for maritime freight shipping in the Arctic. Transp. Res. Part A Policy Pract. 2021, 152, 54–69. [Google Scholar] [CrossRef] [Scilit]
- Christodoulou, A.; Dalaklis, D.; Raneri, P.; Sheehan, R. An overview of the legal search and rescue framework and related infrastructure along the Arctic Northeast Passage. Mar. Policy 2022, 138, 104985. [Google Scholar] [CrossRef] [Scilit]
- Ettinger, S.; Long, A.; Ganti, A.; Mortimer, R.B.; Chiang, W.; Spano, S. Search and rescue in the Pacific West States. Wilderness Environ. Med. 2022, 33, 43–49. [Google Scholar] [CrossRef] [Scilit]
- Berbić, I.; Stupalo, V.; Kavrana, N.; Bukljaš, M. Overview of machine learning methods in maritime traffic monitoring based on Automatic Identification System. Transp. Res. Procedia 2023, 73, 220–226. [Google Scholar] [CrossRef] [Scilit]
- International Maritime Organization (IMO); International Civil Aviation Organization (ICAO). IAMSAR Manual: International Aeronautical and Maritime Search and Rescue Manual, Volume III—Mobile Facilities, 2022 ed.; International Maritime Organization: London, UK, 2022. [Google Scholar] [CrossRef] [Scilit]
- Morton, G.M. A Computer Oriented Geodetic Data Base and a New Technique in File Sequencing; International Business Machines Company: Ottawa, ON, Canada, 1966. [Google Scholar]
- Liu, X. Four alternative patterns of the Hilbert curve. Appl. Math. Comput. 2004, 147, 741–752. [Google Scholar] [CrossRef] [Scilit]
- Jagadish, H.V. Linear clustering of objects with multiple attributes. ACM SIGMOD Rec. 1990, 19, 332–342. [Google Scholar] [CrossRef] [Scilit]
- Wang, Y.; Lu, T.; Yang, L.; Qu, X.; Han, P. Shipborne UAV deployment and search path optimization for long-range maritime search and rescue. Ocean Eng. 2026, 362, 126472. [Google Scholar] [CrossRef] [Scilit]
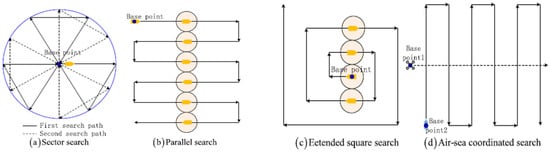
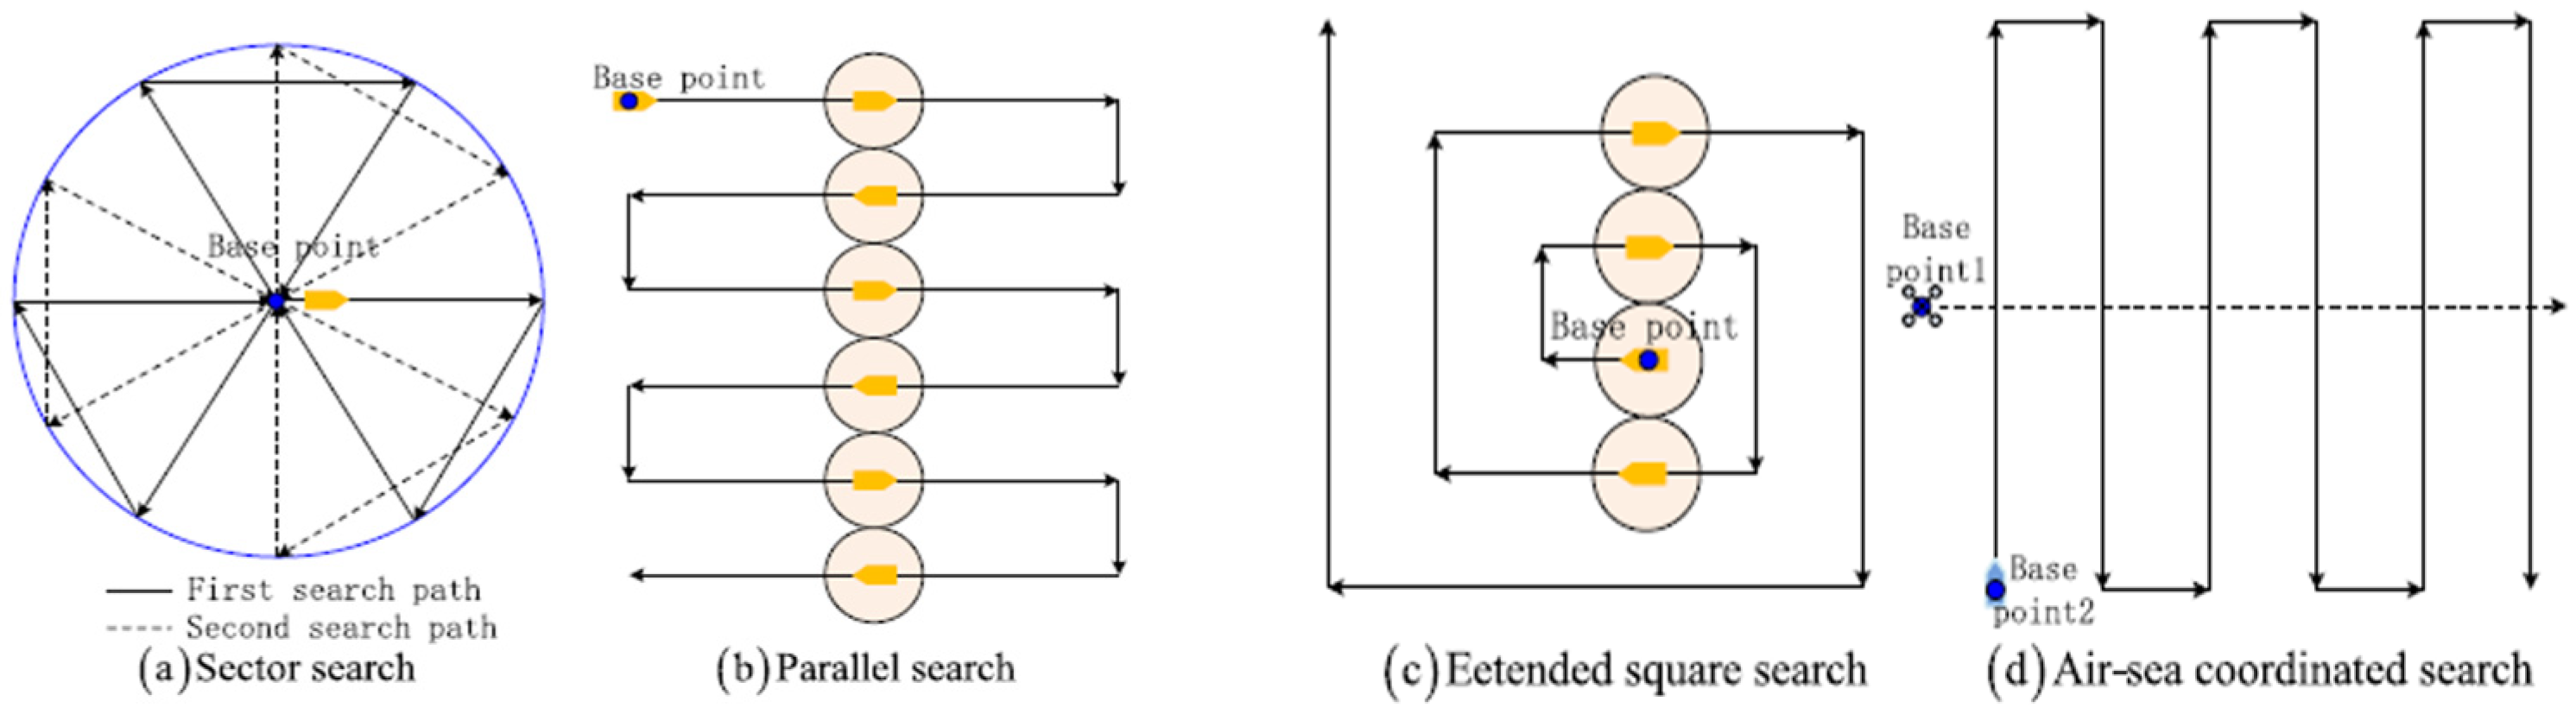
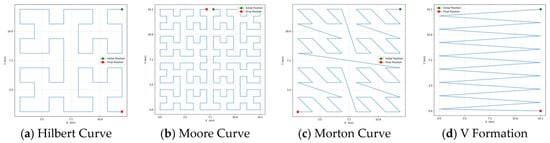
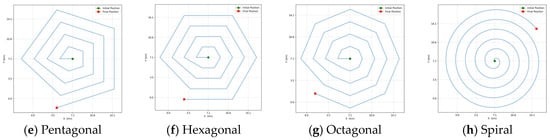
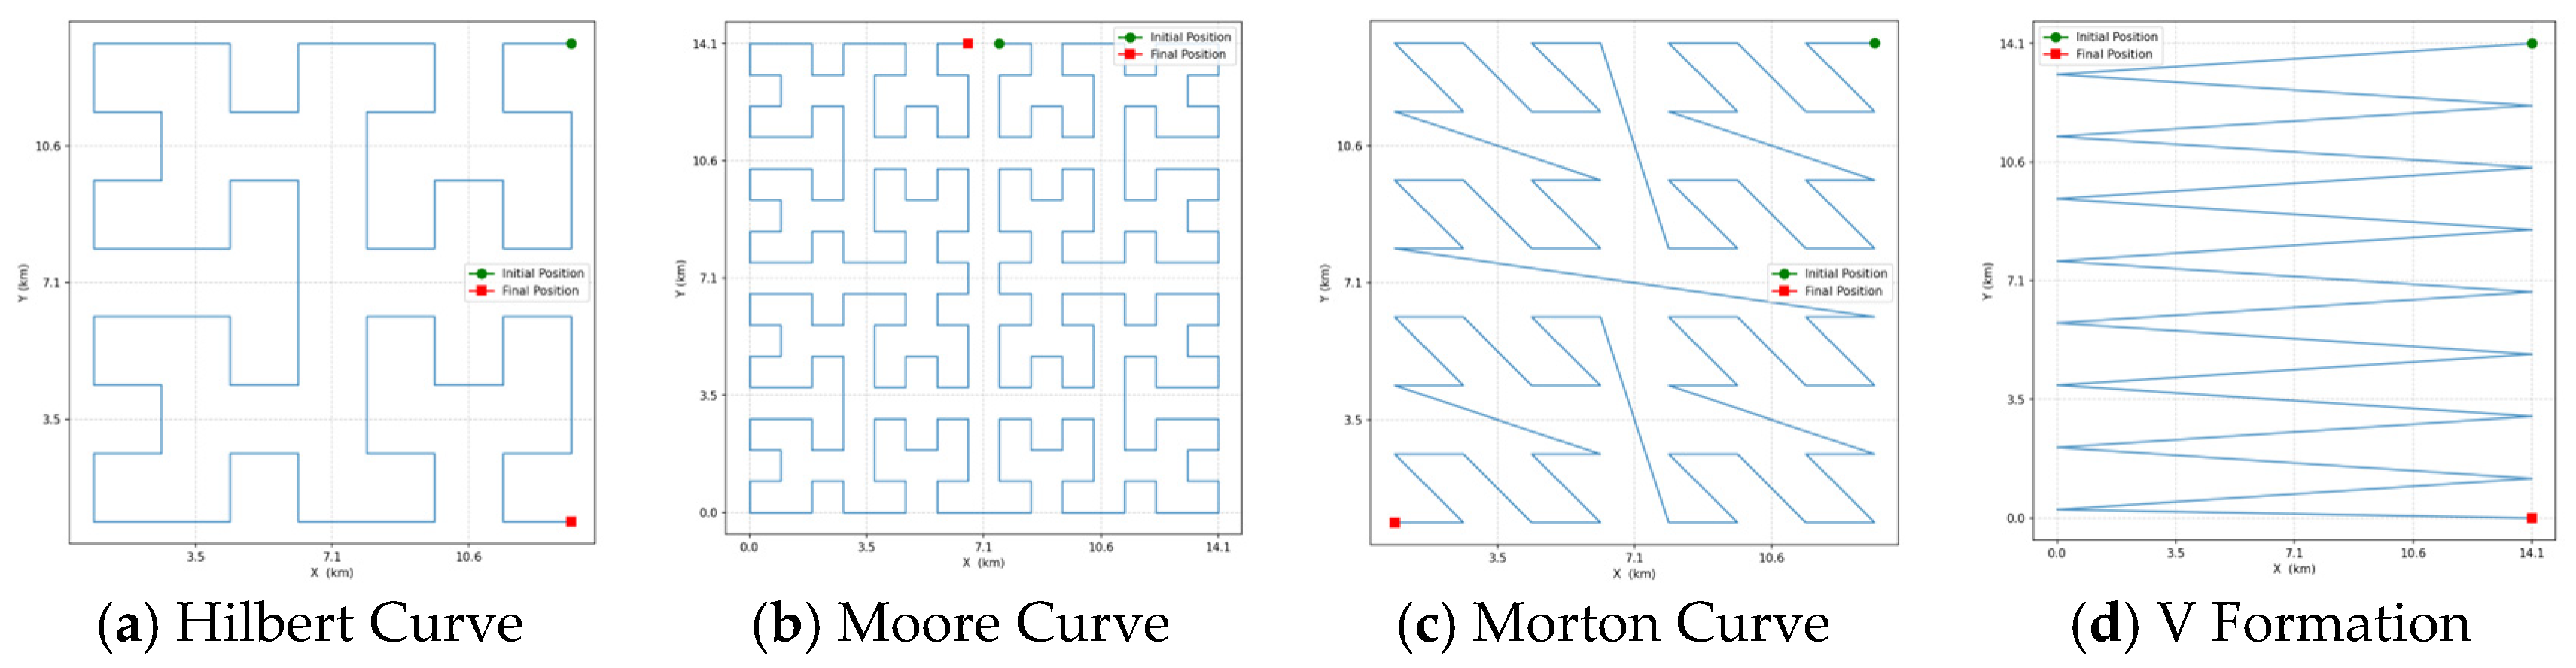
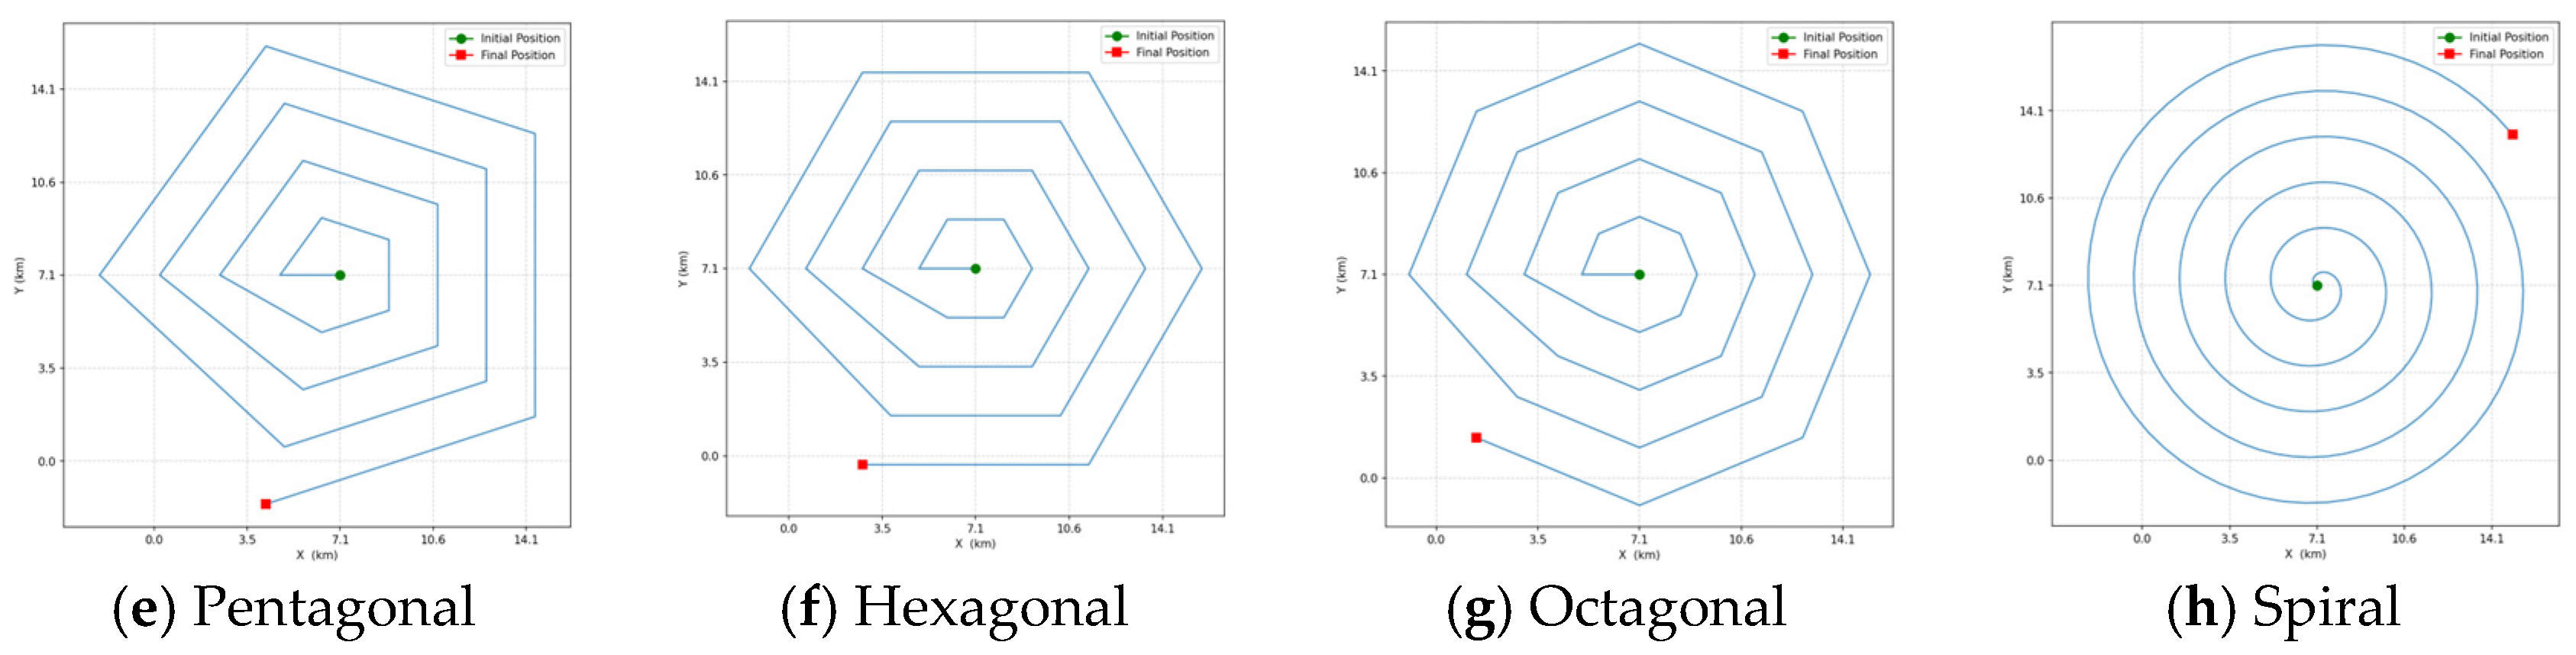
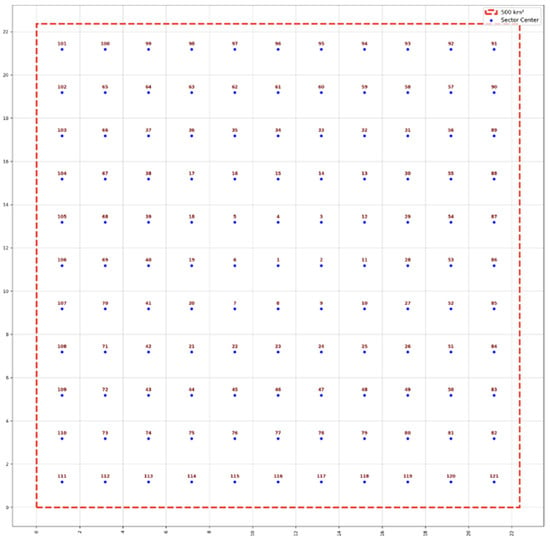
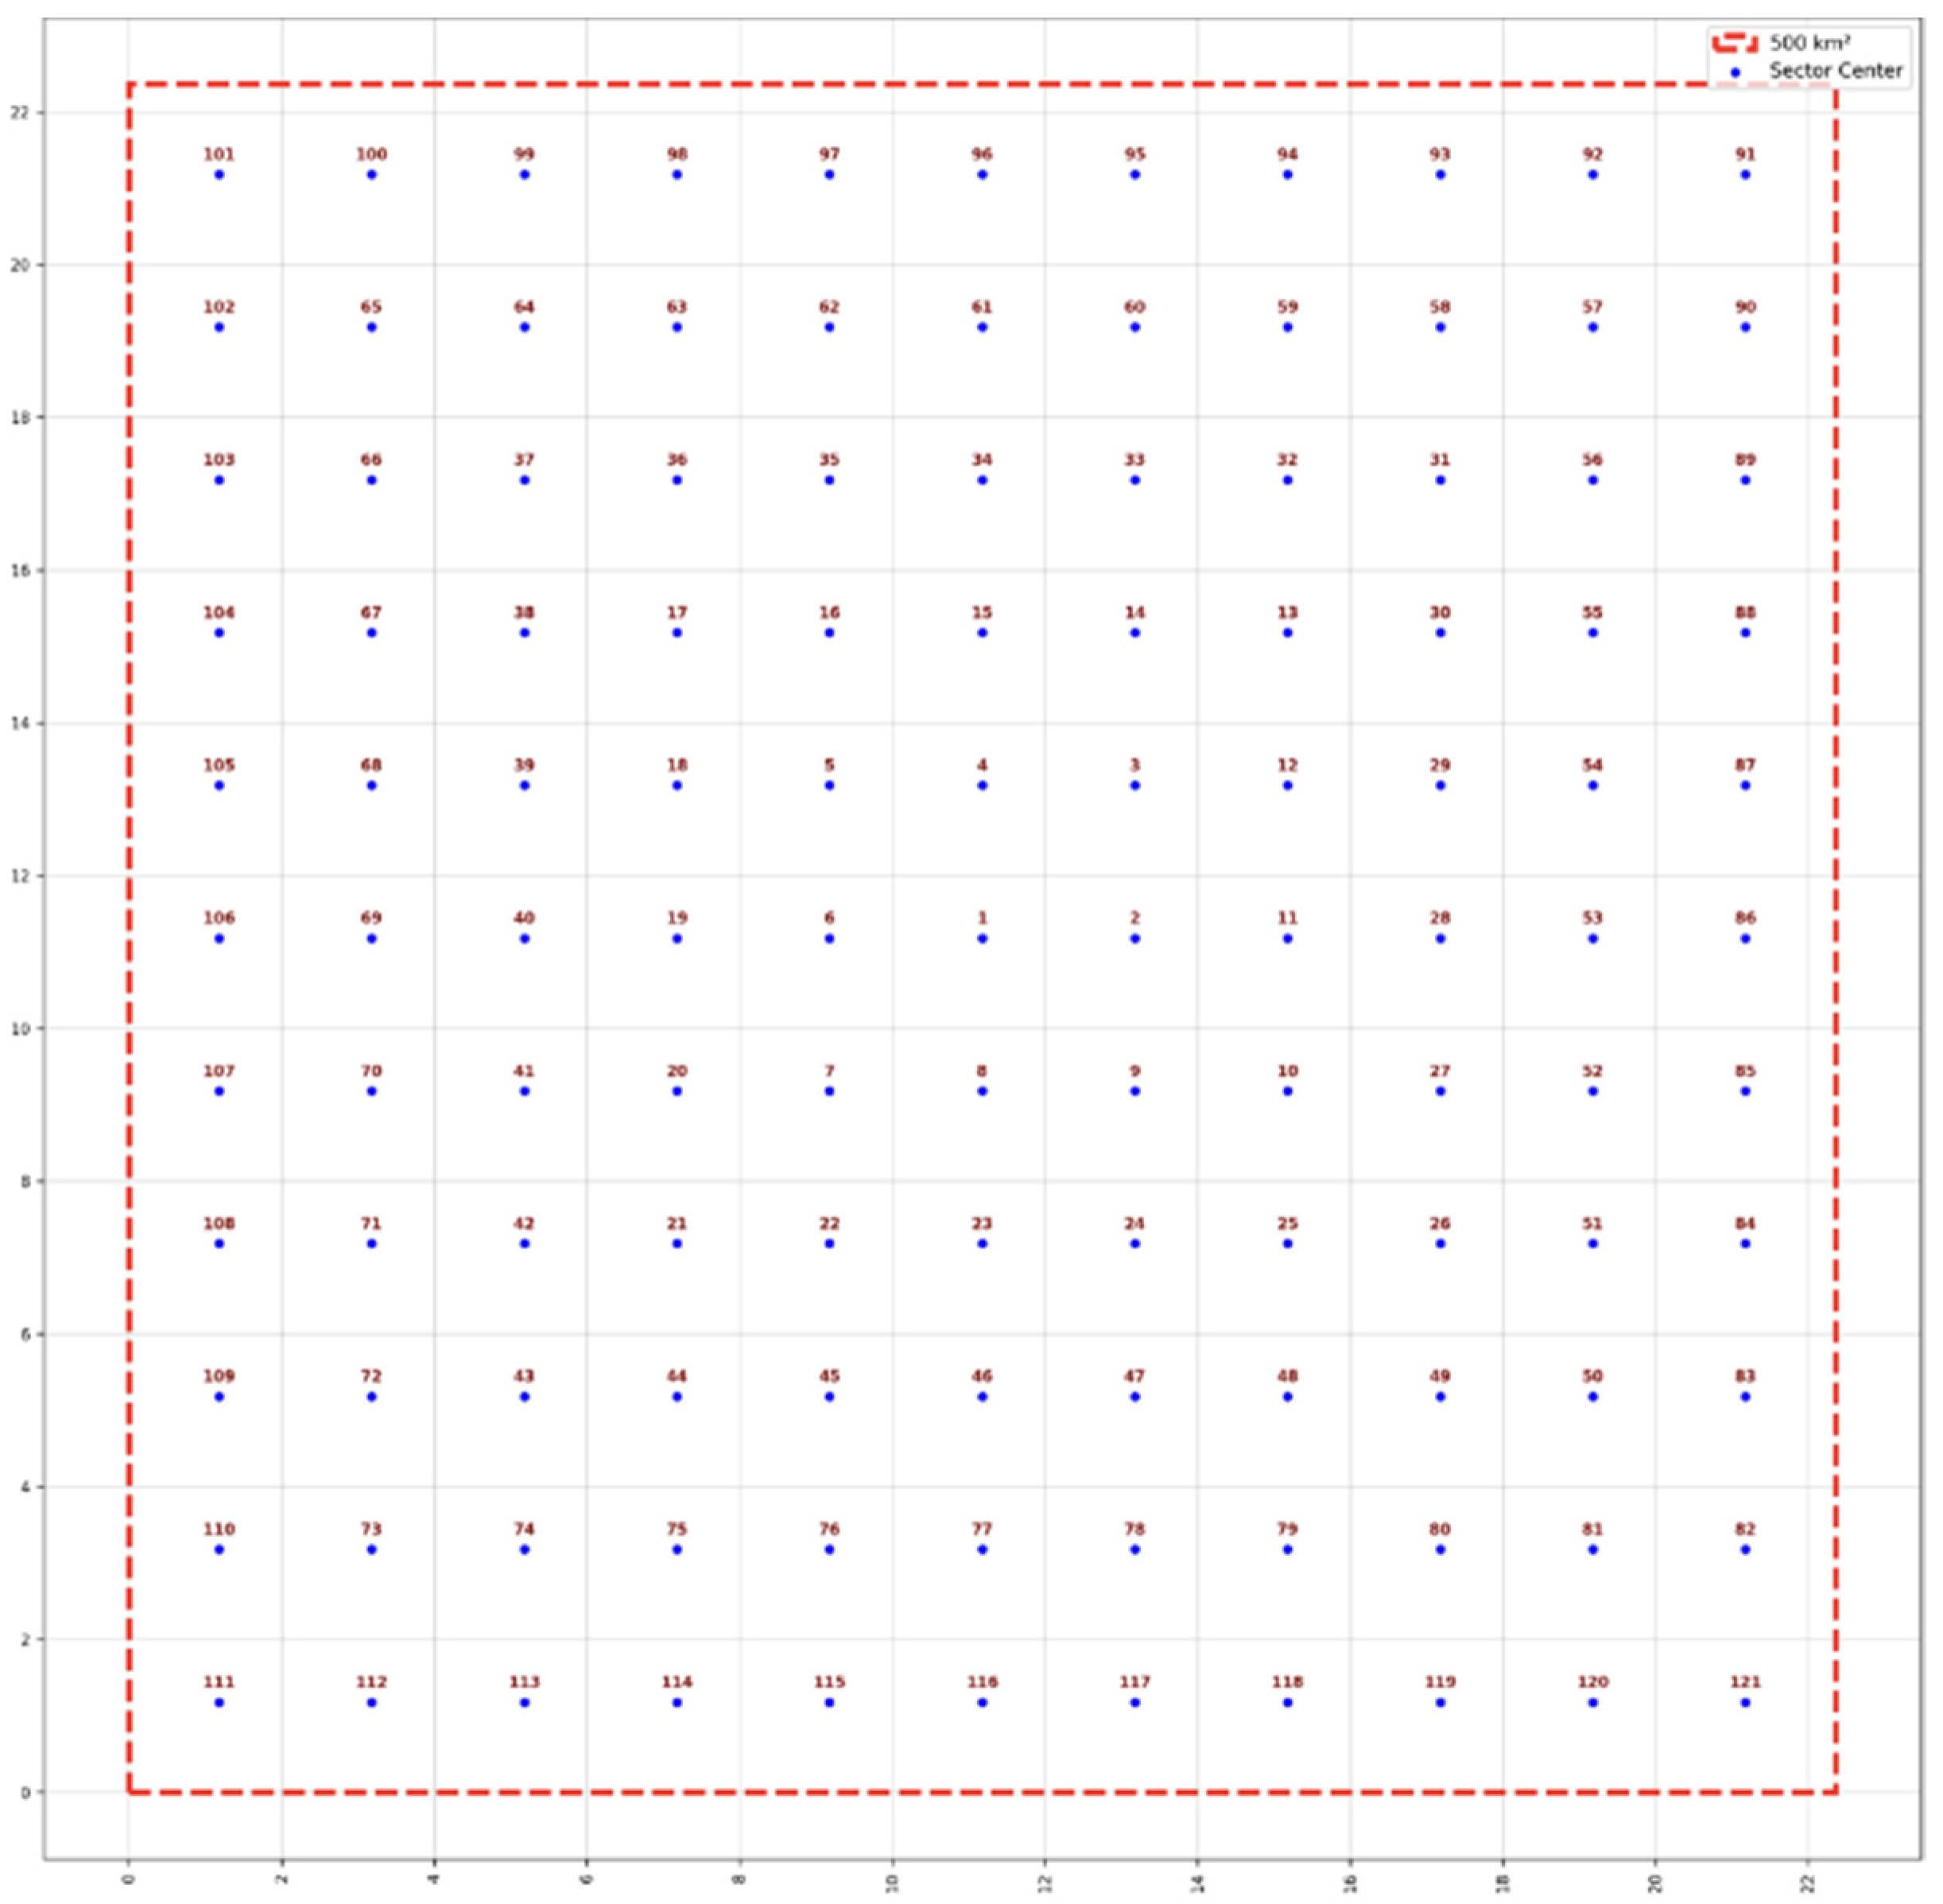
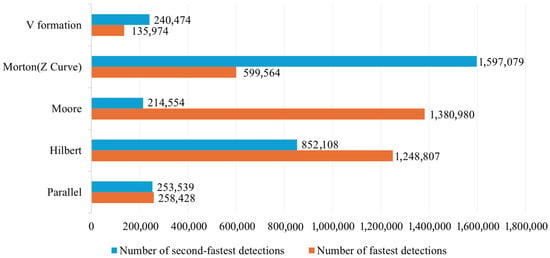
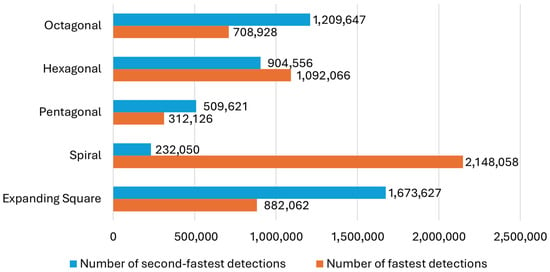

















Disclaimer/Publisher’s Note: The statements, opinions and data contained in all publications are solely those of the individual author(s) and contributor(s) and not of MDPI and/or the editor(s). MDPI and/or the editor(s) disclaim responsibility for any injury to people or property resulting from any ideas, methods, instructions or products referred to in the content. |
© 2026 by the authors. Licensee MDPI, Basel, Switzerland. This article is an open access article distributed under the terms and conditions of the Creative Commons Attribution (CC BY) license.