


Abstract
Microplastic (MP) transport through the deep ocean remains poorly constrained, particularly regarding particle morphology and water-column biogeochemistry. We quantified MP abundance concentrations in the water column, expressed as items/L, and sedimentary MP inventories, expressed as items/kg dry weight (dw), in two full-depth profiles to 5650 m and characterized MP inventories in surface sediments from 33 stations in the western Pacific Pigafetta Basin. MPs occurred throughout the water column (0.7 ± 0.4–7.9 ± 2.8 items/L; mean, 3.0 ± 1.5 items/L) and generally decreased from euphotic to abyssal and bottom waters. Apparent oxygen utilization maxima and enhanced nutrient regeneration occurred at 800–1000 m, whereas MP abundance was negatively correlated with apparent oxygen utilization and potential density. This pattern is consistent with changes in MP-associated carrier phases and suspension states rather than local accumulation within the remineralization maximum. Fibers and fragments dominated the water column, while surface sediments contained relatively more fibers and smaller particles, indicating compartment-level differences in morphology and size. Sediment abundance ranged from 6.5 to 180.1 items/kg dw. A conservative, Fourier-transform infrared spectroscopy (FTIR)-constrained, morphology-resolved free-particle settling model estimated a mean sinking velocity of 17.6 m/d and a modelled free-particle vertical transport potential of 2.82 × 10⁴ items/m2/d, with non-fibers contributing 87%. This transport potential is distinct from depositional flux and burial flux, neither of which was directly measured in this study. These modelled values represent transport potential under specified free-particle assumptions and are not direct measurements of depositional flux, burial, or long-term sequestration. The results identify morphology-dependent settling and carrier-phase transformation as processes that may influence the distribution of MPs between the water column and surface sediments.
1. Introduction
The deep ocean is often described as the ultimate sink for marine microplastics (MPs), yet this statement remains more plausible than mechanistically demonstrated [1,2,3]. MPs have now been reported from surface waters, mesopelagic and bathypelagic waters [4,5,6], hadal trenches, and deep-sea sediments, showing that plastic particles can cross large vertical gradients in density, pressure, temperature, and biological activity [7,8,9]. However, the processes that connect water-column transport with sedimentary inventories remain poorly constrained [10,11,12]. This uncertainty is particularly important because a low MP abundance in deep water does not by itself quantify downward delivery to the seafloor [4,13]; conversely, high sediment inventories may reflect not only local deposition, but also hydrodynamic focusing, resuspension, historical accumulation, and post-depositional redistribution [1,12].
The western Pacific is a key region for examining these processes [10,14]. It receives plastic inputs from densely populated and industrialized margins, is influenced by intense ocean circulation and water-mass exchange, and contains some of the deepest abyssal and trench systems on Earth [15,16,17]. Within this setting, the Pigafetta Basin (PB) represents a large abyssal depositional environment where suspended particles transported from the upper ocean may be redistributed, transformed, and ultimately retained in sediments [1,12,18]. Previous studies in the western Pacific and adjacent deep-sea systems have confirmed the widespread occurrence of MPs, but many datasets remain compartmentalized, focusing either on water-column abundance or on sediment inventories [4,19]. Such separation makes it difficult to determine whether deep-sea sediments function as passive repositories of sinking plastics or as part of an active water–sediment continuum shaped by physical and biogeochemical processes [11,20].
Vertical transport of MPs is controlled by more than polymer density [21,22,23]. Low-density polymers such as polyethylene and polypropylene can remain suspended or buoyant, but their effective density may increase through biofouling, mineral attachment, incorporation into fecal pellets, or aggregation with marine snow [24,25,26]. Higher-density polymers and compact fragments may sink more readily, although their trajectories can still be modified by stratification, turbulence, and lateral advection [27,28]. Particle morphology further complicates this behavior [22,29]. Fibers, films, fragments, and foams differ in drag, surface area, aggregation potential, and susceptibility to biological colonization [30,31]. As a result, MP settling cannot be adequately inferred from abundance alone; it requires consideration of particle shape, size, and polymer composition together with the hydrographic structure of the water column [32,33,34].
Biogeochemical gradients provide an additional layer of control over the vertical fate of MPs [35,36]. Apparent oxygen utilization (AOU), dissolved oxygen, nutrient concentrations, and potential density provide complementary information on water-mass structure and organic-matter remineralization, thereby helping to characterize the environmental conditions experienced by MP-carrying particles [36,37]. In intermediate waters, enhanced remineralization and particle reworking may promote the fragmentation or disaggregation of organic aggregates and fecal pellets, potentially releasing associated MPs and reducing the efficiency of direct vertical transfer [38,39]. Although particle fluxes generally attenuate with depth, a persistent fraction can continue to supply material and potentially associated MPs to abyssal and bottom waters [40,41]. Consequently, a mid-water layer characterized by intense remineralization should not necessarily be interpreted as an MP accumulation zone; rather, it may represent a transformation zone in which MPs are released, reaggregated, repackaged, or redistributed among sinking and suspended particle pools [25,38,41].
The sediment–water interface represents a dynamic boundary at which delivered MPs may be deposited, resuspended, or redistributed laterally before eventual burial [42,43,44]. Their retention in surface sediments may be influenced by sediment grain size, organic-matter content, mineral associations, redox conditions, and pore-water chemistry, although the relative importance of these factors remains insufficiently constrained in deep-sea environments [45,46]. Consequently, sedimentary MP assemblages should be regarded as integrated products of selective settling, water-column transformation, near-bottom advection, hydrodynamic sorting, and post-depositional remobilization rather than as direct records of vertical input alone [47,48,49]. Resolving the mechanisms and efficiency of deep-sea MP sequestration therefore requires coordinated measurements of MPs in the water column and sediments together with hydrographic, biogeochemical, sedimentological, and pore-water geochemical observations [50,51].
Here, we investigated the vertical distribution and transport potential of MPs in the PB, western Pacific, using two full-depth water-column profiles and 33 surface-sediment stations. We further estimated morphology- and density-constrained sinking velocities and free-particle vertical transport potentials to evaluate whether the observed water-column patterns are consistent with potential downward transport toward abyssal depths. Specifically, this study aimed to (1) characterize the vertical and sedimentary distribution of MPs in the PB; (2) identify how water-mass structure and remineralization influence MP transport through the water column; (3) assess the role of particle morphology and polymer composition in regulating sinking behavior; and (4) determine whether the basin acts primarily as a passive sink or as an active transformation and sequestration zone for MPs.
2. Materials and Methods
2.1. Study Area and Sampling
The survey was conducted in the Pigafetta Basin (PB), an abyssal depositional basin in the western Pacific with water depths generally exceeding 5500 m. Sampling was conducted aboard the R/V Haiyang Dizhi 6 from 11 July to 22 August 2024. Station positions were recorded using a Global Navigation Satellite System (GNSS; Fugro 9205, Leidschendam, The Netherlands). The design combined two full-depth water-column profiles with basin-scale surface-sediment sampling to compare suspended MP distributions with surface-sediment inventories.
Two water-column profiles, W1 and W2, were established in the PB (Figure 1; Table S1). Seawater was collected at 24 discrete depths, from the surface to approximately 5650 m, using an SBE 917plus CTD–rosette system (Sea-Bird Electronics, Bellevue, WA, USA). The sampling depths were 0, 10, 20, 30, 50, 75, 100, 150, 200, 250, 300, 400, 500, 600, 700, 800, 900, 1000, 1500, 2000, 3000, 4000, 5000 m, and a near-bottom layer. Approximately 5 L of seawater from each depth was transferred to pre-cleaned stainless-steel containers for MP analysis; separate aliquots were used for physicochemical measurements. The two water-column profiles were compared with 33 surface-sediment stations distributed across the wider basin rather than with directly colocated sediment cores. W1 was approximately 10.2 km from the nearest sediment station, S19. W2 was approximately 64.2 km from the nearest sediment station, S18 (Figure 1; Table S1). These spatial relationships do not establish a colocated water–sediment mass balance. Because quality-controlled cruise-specific temperature and salinity data were unavailable, hydrographic calculations used annual WOA23 climatological temperature and salinity fields rather than contemporaneous shipboard temperature and salinity observations. For each water-column profile, the WOA23 grid cell nearest to the recorded station position was selected at 0.25° horizontal resolution. Each sampled depth was matched to the nearest available WOA23 depth level using nearest-neighbor matching; no interpolation to an unobserved WOA23 depth level was applied. These data were used to estimate seawater density, oxygen saturation, AOU, and potential density anomaly. The resulting variables are climatology-assisted estimates and should not be interpreted as fully synoptic in situ water-mass conditions (Table S2; Texts S1 and S2).
Figure 1.
Study area and sampling stations in the western Pacific Pigafetta Basin. (A) Regional location of the Pigafetta Basin, with cyan arrows indicating the generalized direction of the North Equatorial Current. The inset shows the global location of the study region, and the dashed boxes delineate the areas enlarged in the corresponding maps. (B) Bathymetry and distribution of the 33 surface-sediment stations (S1–S33; red circles) and two full-depth water-column stations (W1 and W2; yellow triangles). Station labels and symbols identify sampling locations rather than independent statistical replicates (Table S1).
Surface sediments were collected from 33 stations, S1–S33, using a box corer (GH-Box50, Guangzhou Marine Geological Survey, Guangzhou, China) (Figure 1; Table S1). Only cores with an undisturbed sediment surface and visible overlying water were retained. The upper 0–5 cm of each core was subsampled with stainless-steel spatulas because this interval represents the most active layer for recently deposited particles and sediment–water interface geochemical gradients. Sediment samples were wrapped in pre-cleaned aluminum foil, placed in pre-cleaned aluminum-foil self-sealing bags, and sealed immediately after transfer. The bags were kept closed during onboard storage at 4 °C, and contact with unclean surfaces was minimized to reduce potential contamination from the packaging material before MP extraction and geochemical analysis in the laboratory.
2.2. Determination of Physicochemical Parameters
Water-column DO, pH, TA, and nutrients were measured aboard the R/V Haiyang Dizhi 6 immediately after sample recovery. Temperature and salinity were obtained from WOA23 and used to calculate seawater density, oxygen saturation, AOU, and potential density anomaly (σθ). Thus, the AOU calculation combined shipboard-measured DO with oxygen saturation derived from climatological temperature and salinity, while potential density was calculated entirely from climatological temperature and salinity. This combination may introduce mismatch between contemporaneous oxygen observations and climatological hydrographic conditions. Because cruise-specific temperature and salinity data were unavailable, this uncertainty could not be quantified through direct paired-data error propagation. The derived AOU and density variables were therefore used as climatology-assisted descriptors of hydro-biogeochemical structure rather than as synoptic water-mass measurements (Table S2; Texts S1 and S2). DO was measured by iodometric titration using an automated titration system (TITRONIC 300, SI Analytics, Mainz, Germany). Concentrations reported in mg/L were converted to μmol/kg using the seawater density calculated from WOA23 temperature and salinity. The conversion equation and unit treatment are provided in Text S1.
AOU was calculated as the difference between oxygen saturation and measured DO:
where is the shipboard-measured DO concentration (μmol/kg), is the oxygen saturation concentration calculated from WOA23 temperature and salinity using the equations of Garcia and Gordon (1992) [52]. Because [O2]sat depends on temperature and salinity, any difference between the WOA23 climatology and the contemporaneous hydrographic state may propagate into the AOU estimate. The magnitude of this uncertainty could not be calculated directly because paired cruise-specific temperature and salinity measurements were unavailable. AOU values were therefore interpreted as climatology-assisted estimates of oxygen utilization rather than fully synoptic in situ values or direct measurements of remineralization intensity. Detailed calculations are provided in Text S1.
σθ referenced to the sea surface was calculated from WOA23 temperature and salinity using EOS-80. Because both temperature and salinity were climatological, the resulting σθ represents a climatology-assisted estimate of the density structure rather than a synoptic measurement of the sampled water masses. The full density formulation and coefficients are provided in Text S2 [53]. σθ anomaly was used together with AOU to characterize broad hydro-biogeochemical structure and to evaluate whether MP abundance maxima coincided with apparent physical or biogeochemical transition layers.
Seawater pH was measured with a calibrated pH meter (SPB-3, INESA Scientific Instrument Co., Ltd., Shanghai, China), and TA was determined by potentiometric titration using the SI TITRONIC 300 system. Reactive silicate, phosphate, ammonium, nitrite, and nitrate were analyzed by standard colorimetric methods using a spectrophotometer (U-5100, Hitachi High-Tech, Tokyo, Japan). These data were used to characterize water-column biogeochemical gradients. Sediment pH and Eh were measured in the upper 0–5 cm layer using calibrated electrodes, including a platinum electrode for Eh. These variables were used to characterize near-surface redox and acid–base conditions relevant to MP retention. Instruments were calibrated before analysis and checked periodically during the cruise, following the analytical and quality-control procedures described previously [8,12].
2.3. MP Extraction and Analysis
MPs were extracted from seawater and sediment samples using procedures designed to reduce organic interference while minimizing contamination and polymer misclassification. Three independent 1.5 L seawater samples were collected from three separate 5 L sampling bottles at each depth and filtered through pre-cleaned 20 μm nylon membranes. These samples were treated as bottle-level field replicates rather than technical aliquots from a single bottle. Retained material was transferred to glass vessels, digested with 30% H2O2 at 65 °C for 24 h, refiltered through 5 μm nylon membranes, dried in covered glass Petri dishes, and examined microscopically.
Three dried sediment replicates of approximately 200 g per station were subjected to density flotation using pre-filtered NaI solution (density, 1.7 g/cm3). After magnetic stirring and overnight settling, the supernatant was collected, digested with H2O2 under the conditions described above, filtered through 5 μm nylon membranes, and dried for microscopic examination.
Putative MPs were examined using stereomicroscopes with digital imaging systems (Stemi 508 and Discovery V8, Carl Zeiss, Germany) and classified as fibers, fragments, films, or pellets. Color and long- and short-axis dimensions were recorded using ImageJ Fiji (1.54f). Fiber length, diameter, and aspect ratio were measured, whereas long- and short-axis dimensions were retained for non-fibrous particles. These measurements were used for particle characterization and settling calculations.
A stratified random subset of visually identified particles, comprising 338 water-column particles (188 from W1 and 150 from W2) and 223 sediment particles, was analyzed by micro (μ)-FTIR (Nicolet iN10, Thermo Fisher Scientific, Waltham, MA, USA). The subset was designed to capture morphological diversity (fibers, fragments, pellets, films), major color classes (white, transparent, blue, gray, red, green, black), and size fractions (<0.1, 0.1–0.25, 0.25–0.5, 0.5–1, 1–2, and 2–5 mm) observed across depth horizons and sampling stations. Spectra were collected in transmission mode from 400 to 4000 cm−1 using 16 scans at a spectral resolution of 4 cm−1.
Polymer identification was conducted against the Hummel Polymer and Additives Library using the Thermo Fisher OMNIC/OMNIC Paradigm search workflow (Thermo Fisher Scientific, Waltham, MA, USA). Automated identification was accepted at a Hit Quality Index (HQI) threshold of ≥75%. For spectra with HQIs between 65% and 75% resulting from surface weathering, mechanical abrasion, or fine particle adhered coatings, identification was confirmed by manual verification of diagnostic vibrational bands: the carbonyl C=O stretch at ~1715 cm−1 and ester C–O–C stretch at ~1240 cm−1 for polyester (PES); the methylene C–H stretching doublet at 2915 and 2848 cm−1 and rocking vibration at 718 cm−1 for polyethylene (PE); the methyl C–H stretching at 2950 cm−1 and symmetric bending at 1377 cm−1 for polypropylene (PP); and the amide I (C=O stretch at ~1635 cm−1) and amide II (N–H bend at ~1540 cm−1) bands for polyamides (nylon). Spectra exhibiting ambiguous features, persistent baseline distortion, or HQI < 65% were categorized as unidentifiable and excluded from synthetic microplastics. Natural and semi-synthetic cellulosic materials, including natural cellulose, cotton, regenerated cellulose/rayon, and cellophane, were strictly excluded when calculating synthetic polymer proportions.
2.4. Quality Assurance and Quality Control (QA/QC)
Contamination-control procedures were applied during sampling, laboratory processing, and microscopic identification. Before sample collection and laboratory processing, stainless-steel containers were cleaned with filtered ultrapure water. The containers were kept covered before use and whenever samples were not being transferred. The same cleaning and covered-handling procedures were applied to filtration units, tools, and work surfaces to minimize procedural and airborne microplastic contamination.
A rigorous batch-matched blank design was implemented throughout sample handling. For seawater, a total of 48 procedural blanks were processed simultaneously, with one procedural blank paired to each of the 24 sampling depth layers in each CTD profile (W1 and W2). For sediments, 33 procedural blanks were processed, with one procedural blank paired to each sediment sampling station (S1–S33). Microplastic counts in seawater blanks averaged 1.29 ± 1.06 items/membrane (62 particles in total), while sediment blanks averaged 1.61 ± 1.10 items/membrane (53 particles in total). All blank-detected particles in both compartments were fibers.
The color breakdown of fibers in seawater blanks was blue (58.1%), white (24.2%), red (11.3%), and green (6.5%). In sediment blanks, fibers were composed of blue (52.8%, 28/53), white (20.8%), transparent (15.1%), red (5.7%), and green (5.7%). Batch correction was applied by subtracting the matching blank counts of the corresponding morphology and color from each paired depth layer or station replicate, and normalizing to sample volume or sediment dry weight (dw); negative values were set to zero. Because blank loads were consistently low (0–3 items/membrane), the observed vertical stratification and sediment distribution patterns remained robust after correction.
Potential shedding from nylon filtration membranes was carefully checked and distinguished from environmental particles. Membrane shedding artifacts typically display distinctive planar mesh intersections, irregular angular flake shapes, or frayed colorless edges, which were readily differentiated from environmental microplastic fibers characterized by uniform diameter, high aspect ratio, distinct coloration, and smooth or mechanically weathered surfaces. Subsequent μ-FTIR verification further excluded natural cellulosic particles and confirmed that nylon represented only a minor fraction of the synthetic assemblage, confirming that membrane shedding did not compromise data integrity. FTIR-confirmed particles were used to estimate the synthetic fraction of visually identified particles and reduce potential overestimation from natural fibers and non-synthetic materials.
2.5. Modeling of Sinking Velocity and Flux
Morphology-dependent sinking velocities were estimated separately for fibers and non-fibrous particles. To distinguish genuine synthetic polymers from natural and regenerated fibers, the observed MP abundance at each depth was first corrected using the profile-specific FTIR-confirmed synthetic-polymer fraction:
where Ccorr is the FTIR-corrected MP abundance (items/L), Cobs is the observed MP abundance (items/L), and fsyn is the confirmed synthetic-polymer fraction from FTIR analysis. In this study, fsyn was 0.606 for W1 and 0.473 for W2. Because FTIR subsampling was designed to characterize population-level polymer compositions across each water column, particles were indexed by profile rather than by individual depth layer. Individual sampling depths contained limited particle numbers (frequently <8 particles per depth), such that calculating depth-specific confirmation fractions would introduce substantial binomial sampling noise. Applying profile-level confirmation fractions therefore provides a representative and statistically robust scaling of synthetic plastic abundance across the water column. Polymer-density assignments for the sinking model were constrained by the empirical frequency distribution of confirmed synthetic polymer types in each profile. The resulting weighted density distributions were applied to the corresponding morphology groups at each depth. For fragments, pellets, and films, the terminal sinking velocity was estimated using a shape-corrected modified Stokes equation:
where Vs,nonfiber is the non-fiber sinking velocity (m/s), ρp is the density of the synthetic polymer (kg/m3), ρf is the in situ seawater density (kg/m3), g is gravitational acceleration (9.81 m/s2, μ is seawater dynamic viscosity (Pa∙s)), Cshape is the morphology-specific shape correction factor, and Cdrag is the conservative drag multiplier. Fiber sinking velocities were estimated with a low-Reynolds-number slender-particle approximation incorporating aspect-ratio, orientation, and drag corrections. The FTIR subset comprised 188 particles from W1, including 114 confirmed synthetic polymers, and 150 particles from W2, including 71 confirmed synthetic polymers. Because FTIR identification was performed on a stratified subset rather than on every visually identified particle, profile-specific polymer-composition distributions were used to constrain the density assignment of the corresponding morphology groups. The complete set of equations, the parameter values for Cshape and Cdrag, and the unit conversions are provided in Text S3.
Ccorr = Cobs × fsyn
Group-specific fluxes were then calculated by multiplying the depth-wise FTIR-corrected abundance of each morphology group by its mean daily sinking velocity, and the total vertical flux at each depth was the sum of the fiber and non-fiber components:
Ftotal = Ffiber + Fnonfiber
In this study, water-column MP concentration is reported as items L−1, while surface-sediment MP inventory is reported as items/kg dw. The model output is reported as modelled free-particle vertical transport potential in items/m2/d. This quantity is calculated from FTIR-corrected abundance and morphology-specific sinking velocity under the specified model assumptions. It should not be interpreted as depositional flux, which would require direct measurement of particle arrival at the sediment–water interface, or as burial flux, which would require measurements of particle incorporation below the active sediment surface. Neither depositional flux nor burial flux was directly measured in this study.
Because this morphology-resolved aggregation avoids pooling fibers and non-fibers before velocity averaging, it preserves their distinct hydrodynamic behaviors; the resulting values should therefore be interpreted as conservative, morphology-resolved free-particle vertical transport potentials rather than direct measurements of sediment-trap flux, deposition, burial, or retention efficiency.
2.6. Data Analysis
Statistical analyses were performed using IBM SPSS Statistics 25.0 and OriginPro 2025 (OriginLab Corporation, Northampton, MA, USA), and sediment distributions were mapped in ArcMap 10.3. Normality was assessed using the Kolmogorov–Smirnov test. Group differences were evaluated using one-way ANOVA for normally distributed data, and Kruskal–Wallis or Mann–Whitney U tests for non-normally distributed data involving multiple or two groups, respectively. For the water-column profile analysis, Spearman rank correlations with two-sided permutation p-values were calculated separately for W1 and W2. Each profile contained 24 depth-level observations. Correlations using the pooled water-column dataset contained 48 depth-level observations and were treated as descriptive because the observations were strongly structured by depth and profile. The reported p-values were unadjusted and were not interpreted as confirmatory evidence; no causal or mechanistic inference was based on these correlations. Pearson or Spearman correlations were selected according to data distribution. Statistical significance was set at p < 0.05 for descriptive reporting only.
The three bottle-level seawater measurements at each depth were summarized before correlation analysis, and the depth-level mean was used as the statistical observation. Therefore, the unit of replication for the profile correlations was sampled depth rather than individual filtration replicate, with n = 24 for each profile and n = 48 for the pooled descriptive analysis. This approach avoided treating repeated measurements from the same depth as independent vertical observations.
At each depth, morphology-specific velocities were combined using the observed fiber and non-fiber fractions. The resulting depth-level values are modelled free-particle transport potentials. Pooled mean sinking velocity and total flux were calculated as arithmetic means of the corresponding depth-level values across both CTD profiles after applying the two-fold drag multiplier.
The vector illustration of MPs in deep-sea surface sediments was created using ChatGPT (OpenAI GPT-5.5; https://chatgpt.com/, accessed on 20 July 2026). GPT-6.1-sol (OpenAI; https://chatgpt.com/, accessed on 22 October 2026) was used for language polishing and readability improvement of the manuscript. We subsequently reviewed and edited the illustration for use in this manuscript. ChatGPT was not used for experimental data generation, statistical analysis, machine-learning calculations, interpretation of results, or preparation of data-based figures and tables.
3. Results and Discussion
3.1. Vertical Distribution of MPs and Hydro-Biogeochemical Structure of the Water Column
Microplastics were detected throughout both 5650 m water-column profiles, indicating that the deep western Pacific water column is not merely a zone of dilution but also a vertical transport corridor for plastic particles. Across the 48 water samples, MP abundance ranged from 0.73 ± 0.41 to 7.82 ± 2.82 items/L, with a mean of 3.02 ± 1.48 items/L (Table 1 and Table S2). Although MPs occurred at all sampled depths, their vertical distribution was clearly stratified. In W1, the maximum abundance occurred at 200 m, reaching 6.82 items/L, whereas W2 showed its highest abundance in the surface layer, reaching 7.82 items/L (Figure 2A; Table S2).
Table 1.
Summary of water-column microplastic abundance and hydro-biogeochemical parameters by depth zone.
Figure 2.
Water-column MP abundance, hydro-biogeochemical structure, and standardized environmental-variable heatmap in W1 and W2. (A) Depth-resolved MP abundance from the surface to near-bottom waters; values represent the mean ± standard deviation of three independent bottle-level seawater samples at each depth (n = 3 per depth). (B) Apparent oxygen utilization (AOU) profiles. (C) Potential density anomaly (σθ) profiles. (D) Z-scored matrix of MP abundance, AOU, σθ, DO, PO43−, and NO3− across depth. (E) AOU–MP relationship based on 48 depth-level observations, with point size scaled by depth. Blue and red symbols denote W1 and W2, respectively. The size of the circles represents water depth, with larger circles indicating greater depths and smaller circles indicating shallower depths. AOU and potential density anomaly are climatology-assisted derived variables based on WOA23 temperature and salinity; AOU also incorporates shipboard-measured DO. These variables should not be interpreted as fully synoptic water-mass observations. (Table S2; Texts S1 and S2).
The standardized water-column heatmap shows that MP abundance, oxygen utilization, density structure, nutrients, and hydro-biogeochemical variables vary coherently with depth but do not reach their extrema in the same layers (Figure 2D). The decline in suspended MP abundance with depth may therefore reflect the combined effects of particle retention, aggregation–disaggregation cycles, hydrodynamic sorting, lateral redistribution along density surfaces, and removal to the seabed during descent, rather than simple monotonic dilution alone [54,55].
The MP profiles were closely embedded within a well-defined hydro-biogeochemical structure. AOU increased from low values in the upper water column to maxima of 231.35 μmol/kg in W1 and 233.18 μmol/kg in W2 at approximately 800–1000 m (Figure 2B; Table S2). σθ increased from 21.85–22.25 kg/m3 in surface waters to approximately 27.78 kg/m3 in abyssal waters (Figure 2C). Because AOU and potential density were derived partly or entirely from WOA23 climatological temperature and salinity, these patterns describe climatology-assisted hydro-biogeochemical structure rather than fully synoptic water-mass conditions. The AOU maximum coincided with the density interval of σθ = 27.1–27.4, kg/m3, corresponding to the intermediate/deep transition water where oxygen consumption and organic matter remineralization would be expected to be elevated based on the derived hydro-biogeochemical structure (Figure 2B,C; Table S2). However, MP abundance did not increase within the AOU maximum layer. Instead, MP abundance showed descriptive negative Spearman associations with AOU in W1 (r = −0.397, n = 24, p = 0.0553) and W2 (r = −0.354, n = 24, p = 0.0901), and with potential density in W1 (r = −0.597, n = 24, p = 0.0018) and W2 (r = −0.564, n = 24, p = 0.0038) (Figure 3 and Figure S1; Table S2). Because both predictors and MP abundance vary systematically with depth, these associations are interpreted as descriptive profile patterns rather than independent evidence of a mechanistic effect of AOU or potential density on MP abundance. This pattern suggests that MPs were not simply enriched in the layer of strongest climatology-assisted AOU elevation; rather, the upper and intermediate water column served as the main suspended MP reservoir, whereas the OMZ transition and deeper layers functioned as zones of particle transformation and progressive loss from suspension [56]. Because AOU and potential density were derived using WOA23 climatological temperature and salinity, and because all variables were strongly structured by depth, the AOU–MP and density–MP associations are interpreted as descriptive profile-level co-variation rather than independent evidence that remineralization or density mechanistically controls MP abundance (Figure 3 and Figure S1; Table S2).
Figure 3.
Spearman correlation summary for water-column transport and sediment geochemical conditions. The variable “Flux” denotes modelled free-particle vertical transport potential in items/m2/d and does not represent measured depositional or burial flux. W1 and W2 each contain 24 depth-level observations; the pooled water-column dataset contains 48 depth-level observations. Exact two-sided permutation p-values are reported as unadjusted descriptive values. Stars indicate nominal descriptive thresholds (* p < 0.05, ** p < 0.01, *** p < 0.001); p-values are two-sided, unadjusted permutation p-values and are not interpreted as confirmatory mechanistic evidence. and are not intended to indicate independent mechanistic validation. “- -“ indicates variables not applicable to that dataset. Water pooled represents the combined W1 and W2 water-column dataset. Flux, modelled free-particle vertical transport potential in items/m2/d. A complete correlation matrix including all measured water-column variables is provided in Figure S1.
The nutrient profiles further support strong vertical biogeochemical zonation. Phosphate increased from <0.13 μmol/L in the upper 150 m to approximately 3.0 μmol/L at 800–1500 m, while nitrate increased from near-surface values generally below 6 μmol/L to a maximum of 176.96 μmol/L (Figure 2D). This nutrient regeneration pattern broadly followed the increase in AOU but did not coincide with the highest MP abundances (Figure 2A,B,D). These results indicate that biological remineralization does not directly maximize suspended MP abundance in the OMZ transition layer [54]. Instead, remineralization likely modifies the carrier phases and residence state of MPs [36].
In the upper water column, MPs may be supplied by atmospheric deposition, surface-derived inputs, ship-related activities, and lateral transport [54,57]. During downward transport, incorporation into marine snow, fecal material, or other organic aggregates can enhance the vertical transfer of MPs [18,58]. Subsequent remineralization and disaggregation of these carrier phases may release associated MPs back into suspension, slowing their net removal and potentially contributing to the observed AOU–MP decoupling (Figure 2E) [58,59]. Therefore, the observed decrease in suspended MP abundance below 1000 m is consistent with a dynamic balance among downward export, aggregate degradation, hydrodynamic redistribution, and eventual deposition at the sediment–water interface [1].
3.2. Morphological Evidence for Selective Transport and Hydrodynamic Sorting in the Water Column
The water-column morphometric dataset contained 1673 particles and showed that the suspended MP assemblage was dominated by fibers and fragments. Fibers accounted for 49.3% of all particles, fragments for 44.6%, pellets for 5.3%, and films for 0.8% (Figure 4A). Particle size ranged from 0.02 to 4.22 mm, with a median of 0.48 mm and a mean of 0.72 ± 0.64 mm (Figure 4B). The dominance of small particles and elongated morphologies is important because particle size and shape regulate settling velocity, hydrodynamic drag, aggregation behavior, and interactions with biological particles and organisms [22,47].
Figure 4.
Morphological characteristics of water-column and sediment MPs. (A) Relative proportions of fibers, fragments, pellets, and films. Water-column morphology data comprise 1673 particles and sediment morphology data comprise 696 particles. (B) Size-frequency distributions based on the same particle sets. (C) FTIR-confirmed polymer composition based on 188 particles from W1, 150 particles from W2, and 223 sediment particles. The legend in subplot A is the same as that in subplot B. (D) Conceptual interpretation of morphology-dependent settling potential and potential interfacial sorting. FTIR, Fourier-transform infrared spectroscopy. Panel (D) is conceptual and does not represent an additional set of observations.
The two water columns showed distinct morphology distributions, indicating that lateral heterogeneity persisted within the same basin. In W1, fibers represented 57.6% of the particles and fragments accounted for 34.3%. In W2, fragments were slightly more abundant, accounting for 48.6%, compared with 46.1% for fibers (Figure 4A). The color distribution was also broad, dominated by white (36.8%), blue (18.1%), transparent (17.3%), and gray particles (16.8%). The prevalence of white and transparent particles may reflect pigment loss, surface weathering, or prolonged environmental exposure, although color alone cannot be used as a definitive indicator of degradation stage because it is also influenced by the original material, pigment formulation, polymer type, and exposure history [60,61].
Spectroscopic verification of the subsampled particles revealed clear differences in confirmed synthetic polymers between the two profiles (Figure 4C). In profile W1, 114 of 188 analyzed particles were confirmed as synthetic polymers, yielding a synthetic fraction of 60.6% with a 95% Wilson score confidence interval of 53.5–67.4%. The confirmed synthetic assemblage was dominated by PES (57.9%/), PP (20.2%), and PE (12.3%), with minor contributions from PU (3.5%), alkyd resin (2.6%), nylon (1.8%), PP-PE copolymer (0.9%), and poly(butadiene-acrylonitrile) (0.9%). The remaining 74 particles (39.4%) comprised natural and semi-synthetic cellulosic materials (cellulose, 47; cotton, 12; cellophane, 6) or unidentifiable particles (9) and were excluded from synthetic MP counts. In profile W2, 71 of 150 analyzed particles were confirmed as synthetic polymers, corresponding to a synthetic fraction of 47.3% (95% Wilson confidence interval: 39.5–55.3%). The synthetic assemblage was dominated by PES (63.4%), PE (14.1%), and PP (11.3%), with minor fractions of PVC (4.2%), nylon (4.2%), PS (1.4%), and PP-PE (1.4%); 79 particles (52.7%) were non-synthetic (cellulose, 55; cotton, 12; rayon, 7; cellophane, 2; unidentifiable, 3) (Figure 4C).
The size distribution provides evidence consistent with selective removal during vertical transport, because the residence and settling behavior of MPs are strongly size-dependent [32]. Compared with the upper water column, deeper suspended assemblages were characterized by lower MP abundance and generally fewer large particles, consistent with the size-dependent vertical patterns reported in full-water-column observations [54]. This pattern suggests that larger, denser, or more compact particles may have been more efficiently removed from suspension before reaching the deepest sampled layers because particle size, density, and shape jointly determine terminal settling velocity [22,32,54]. In contrast, small fibers and elongated fragments may remain suspended for longer periods because of their relatively high drag and low effective settling velocities, while fronts, stratification, and transport along density surfaces can further redistribute them laterally [22,47]. Thus, the observed particle-size and morphological structure is consistent with hydrodynamic sorting during descent, although aggregation, biofouling, and disaggregation may modify the intrinsic settling behavior of individual particles [62].
3.3. Spatial Accumulation and Geochemical Setting of MPs in Surface Sediments
Surface sediments contained substantial MP inventories, but these matrix-specific values cannot be used alone to quantify deposition or burial flux. Across the 33 sediment stations, MP abundance ranged from 6.49 to 180.10 items/kg dw, with a mean of 67.36 ± 42.15 items/kg dw and a median of 56.87 items/kg dw (Table 2 and Table S3). The highest abundance was observed at S24, whereas the lowest was observed at S20. The station-by-station abundance pattern showed pronounced spatial heterogeneity, and the Eh-coded bars indicated that high and low MP inventories occurred within a broadly oxidizing sedimentary setting rather than along a simple monotonic redox gradient (Figure 5A).
Table 2.
Summary of surface sediment MP abundance and sediment geochemical parameters across 33 stations.
Figure 5.
Spatial accumulation of MPs and sediment geochemical setting in surface sediments. (A) Station-by-station MP abundance in surface sediments across 33 stations; values are mean ± standard deviation from three sediment replicates per station (n = 3 per station), and bar colors represent sediment Eh. (B) Relationship between MP abundance and sediment Eh based on 33 station-level means (n = 33); point color represents sediment temperature and the orange line indicates the linear trend. (C) Relationship between MP abundance and sediment pH based on 33 station-level means (n = 33); point color represents sediment temperature and the orange line indicates the linear trend. Eh, sediment redox potential; MP, microplastics. Correlations are exploratory; the nominal Eh association did not remain statistically significant after Benjamini–Hochberg correction across the measured sediment-geochemistry predictors (Figure S2; Table S3).
Because water-column and sediment abundances were expressed on different matrix-specific bases, their numerical values cannot be directly compared as a concentration ratio. The widespread occurrence and spatially heterogeneous inventories of MPs in surface sediments are therefore interpreted as sedimentary distribution patterns that are compatible with multiple sources and transport pathways; the modelled flux provides transport potential rather than a measured depositional flux (Table 1 and Table 2; Figure 5A). Because the sediment stations were not established as colocated sediment counterparts of the two water-column profiles, these inventories cannot be linked to W1 or W2 through a direct particle mass balance. Lateral focusing, resuspension, historical accumulation, and post-depositional redistribution may also contribute to the observed sedimentary patterns.
The surface sediment environment was mildly alkaline and strongly oxidizing. Sediment pH ranged from 6.90 to 7.28, with a mean of 7.17 ± 0.10, while Eh ranged from 529.80 to 609.00 mV, with a mean of 564.82 ± 20.60 mV (Table 2 and Table S3). Sediment temperature ranged from 19.8 to 23.9 °C, with a mean of 21.02 ± 1.02 °C, and was used as the color scale in the geochemical scatter plots (Figure 5B,C). MP abundance showed a clearer positive association with Eh, r = 0.354 (p = 0.042), than with pH, r = 0.220 (p = 0.218), whereas its relationship with sediment temperature was negligible, r = −0.023 (p = 0.899) (Figure 5B,C and Figure S2). After Benjamini–Hochberg correction across these three sediment-geochemistry comparisons, the Eh association was not statistically significant (q ≈ 0.13); all three relationships are therefore treated as exploratory.
These results indicate that sedimentary MP abundance is associated with benthic geochemical conditions but is unlikely to be explained by any single measured variable, because surface-sediment inventories reflect the combined effects of particle supply, sedimentation history, hydrodynamic redistribution, and post-depositional processes [47]. The sediment measurements in this study were limited to pH, Eh, and measurement temperature in the upper 0–5 cm, whereas grain size, organic-matter content, mineral composition, sedimentation rate, and pore-water chemistry were not measured (Table 2 and Table S3). MP abundance was nominally positively associated with Eh (r = 0.354, p = 0.042), although the substantial scatter indicates that redox conditions alone have limited explanatory power for the observed inventory pattern (Figure 5B). After Benjamini–Hochberg correction across the three measured sediment-geochemistry predictors, namely pH, Eh, and temperature, the Eh association was not statistically significant (q ≈ 0.13). This result is therefore interpreted as an exploratory association rather than confirmatory evidence of a redox effect. By contrast, the relationship between MP abundance and pH was weaker, indicating that pH was more useful as a descriptor of the benthic environmental setting than as a predictor of sedimentary MP abundance in the present dataset (Figure 5C) [63]. Eh and pH may also covary with unmeasured or incompletely resolved factors, including sediment texture, organic-matter content, mineral composition, sedimentation rate, pore-water chemistry, organic–mineral associations, depositional conditions, and near-bottom hydrodynamics, all of which can influence particle delivery, retention, resuspension, and burial at the seafloor [63,64]. Accordingly, these relationships should be interpreted as exploratory associations with near-surface sedimentary conditions rather than evidence that sediment geochemistry directly controls MP retention, deposition, or burial [65]. Because only the upper 0–5 cm of each sediment core was sampled, the sediment dataset represents near-surface MP inventories and cannot be used to quantify burial rates, vertical sediment accumulation, resuspension history, or long-term sequestration (Table S3; Figure 5A).
3.4. Size and Morphological Contrasts Between Water-Column and Sedimentary MPs
In addition to the relationships between sedimentary MP abundance and benthic environmental conditions described above, comparisons of particle size and morphology between the water column and surface sediments provide further insight into the potential transfer and retention of MPs across the sediment–water interface. The particle-size distributions differed between the two environmental compartments (Figure 6A). Sediment MPs had a median size of 0.19 mm and a mean size of 0.53 ± 0.68 mm, whereas water-column MPs had a median size of 0.48 mm and a mean size of 0.72 ± 0.64 mm. The greater relative contribution of small particles to the sedimentary assemblage suggests that fine MPs are not necessarily maintained in suspension despite their low individual settling velocities [66]. Their occurrence in surface sediments may reflect aggregate-mediated transport, fragmentation of larger particles, near-bottom hydrodynamic sorting, or preferential retention within the sediment matrix [67]. Because individual particles were not tracked from the water column to the seabed, however, the observed size contrast should be interpreted as a compartment-level difference rather than as direct evidence of vertical particle transfer [68]. The spatial separation between the water-column profiles and the distributed sediment stations further prevents the size contrast from being interpreted as a direct profile-to-sediment transfer signature.
Figure 6.
Morphological and size contrasts between water-column and surface-sediment microplastic assemblages and a conceptual framework for potential processes near the sediment–water interface. (A) Relative particle-size distributions of MPs in water-column (n = 1673 particles) and surface-sediment (n = 696 particles) samples. (B) Fiber-to-fragment ratios in the two environmental compartments, calculated from the same particle datasets. (C) Proportions of visually selected particles confirmed as synthetic polymers by Fourier-transform infrared spectroscopy (FTIR) at water-column stations W1 (n = 188), W2 (n = 150), and in surface sediments (n = 223). (D) Conceptual representation of potential morphology-dependent processes, including fiber association, ballasted settling of fragments, aggregate-mediated transport, near-bottom sorting, and incorporation into the upper sediment layer. The comparison represents compartment-level consistency and contrast across the study area and does not establish a colocated transfer pathway or mass balance between W1/W2 and individual sediment stations (Figure 1; Table S1). Panel (D) is conceptual and has no independent sample size; the mechanisms shown were not directly quantified in this study.
The morphological composition of MPs also differed between the water column and surface sediments (Figure 6B). Among the 696 particles identified in the sediment samples, fibers accounted for 55.7%, fragments for 38.9%, pellets for 4.6%, and films for 0.7%. Fibers and fragments therefore collectively represented 94.6% of the sedimentary assemblage. The fiber-to-fragment ratio increased from 1.11 in the water column to 1.43 in the sediments, indicating a greater relative contribution of fibers to the deposited assemblage. Although the overall morphology of sedimentary MPs broadly resembled that of suspended MPs, the higher fiber-to-fragment ratio in sediments is consistent with morphology-dependent transfer, near-bottom sorting, and/or post-depositional redistribution. This comparison indicates consistency between assemblages but does not establish that the sedimentary particles originated from either W1 or W2, nor does it distinguish vertical settling from lateral focusing or historical accumulation (Figure 6B; Table S1).
The fraction of visually selected particles confirmed as synthetic polymers by FTIR spectroscopy varied among sample groups (Figure 6C). 60.6% (95% CI: 53.5–67.4%) and 47.3% (95% CI: 39.5–55.3%) of the analyzed candidate particles from water-column stations W1 and W2, respectively, were confirmed as synthetic, compared with 37.7% (95% Wilson confidence interval: 31.5–44.2%) of those from surface sediments. In surface sediments, confirmed synthetic polymers were dominated by PES (63.1%), PE (14.3%), and nylon (7.1%), with minor occurrences of PP (3.6%), EVA (2.4%), PAN (2.4%), and PP-PE (2.4%). Non-synthetic particles in sediments (62.3%) were dominated by cellulose (61), rayon (25), cotton (22), cellophane (10), and unidentifiable mineral/organic particles (21) (Figure 6C; Table S4). The lower confirmation fraction in sediment samples may reflect the greater complexity of the sediment matrix, in which mineral grains, biological remains, and natural fibers can resemble weathered MPs during visual screening. Surface fouling, mineral coatings, and advanced weathering may also reduce spectral quality and complicate polymer identification. Consequently, the FTIR-confirmed synthetic fraction should be interpreted primarily as an indicator of the reliability of visual identification among the analyzed candidate particles, rather than as a direct measure of environmental MP abundance. The lower sediment confirmation fraction also highlights the importance of spectroscopic verification when comparing MPs between water and sediment matrices.
The combined size and morphological contrasts are compatible with several potential pathways affecting the distribution of MPs near the sediment–water interface (Figure 6D). Isolated fibers would generally be expected to settle slowly because of their elongated geometry, high hydrodynamic drag, and orientation-dependent motion. Their relative enrichment in abyssal surface sediments therefore cannot readily be explained by the settling of clean, freely suspended fibers alone. Fibers may be transported downward after biofilm development or incorporation into organic aggregates, fecal material, and mineral-ballasted particles. Their relative enrichment in abyssal surface sediments could reflect processes beyond clean, freely suspended settling, including association with organic or mineral particles, lateral redistribution, and post-depositional incorporation into the upper sediment layer. Fragments may undergo comparatively rapid ballasted settling when associated with dense organic or mineral particles, whereas MP-containing aggregates may be concentrated, redistributed, or sorted by near-bottom hydrodynamic processes. These mechanisms are hypotheses supported by the compartment-level patterns and were not directly measured in this study.
Collectively, the smaller particle sizes and higher fiber-to-fragment ratio observed in surface sediments are consistent with compartment-level sorting and differences in particle history across the sediment–water interface. Nevertheless, the present data cannot distinguish among direct gravitational settling, aggregate-mediated transport, lateral near-bottom advection, resuspension, and post-depositional redistribution. The pathways illustrated in Figure 6D should therefore be regarded as a conceptual framework for interpreting the observed assemblage contrasts, rather than as direct evidence for a specific transport, deposition, or post-depositional mechanism. In particular, the comparison does not constitute a colocated mass balance or proof of a direct transfer pathway from the sampled water-column profiles to the sampled sediment stations. (Figure 6D; Table S1).
3.5. Morphology-Resolved Free-Particle Transport Potential
Fibers and non-fiber particles were modeled separately to account for their contrasting geometries and hydrodynamic behaviors. Non-fiber settling was calculated using a projected-area-equivalent radius derived from the measured long and short axes, whereas fibers were represented using their length, diameter, and aspect ratio. Morphology-specific drag corrections were then applied under the primary drag ×2 scenario. Visually determined abundances were corrected using the profile-specific fractions of FTIR-confirmed synthetic particles: 60.6% at W1 (114/188) and 47.3% at W2 (71/150). The corresponding polymer distributions were used to constrain particle-density assignments. Rayon, cellophane, and other non-synthetic particles were excluded from the modeled MP flux calculations. Depth-resolved sinking velocities and flux estimates are provided in Table S4.
To assess the impact of FTIR subsampling uncertainty on the model, we propagated the 95% confidence intervals of the confirmation fractions (W1: 53.5–67.4%; W2: 39.5–55.3%) into the transport calculations. This uncertainty scales the absolute modelled transport potential linearly by approximately ±11.5% at W1 and ±16.5% at W2. However, because this scaling applies uniformly across all depths within each profile and because individual particle terminal velocities are governed by individual morphometry and polymer densities, this uncertainty does not alter the depth-attenuation trajectories, cross-profile spatial variability, or the key finding that non-fiber particles account for ~87% of the integrated vertical free-particle transport potential (Figure 7C,D; Table S4).
Figure 7.
Conservative morphology-resolved free-particle vertical transport potential under the primary drag ×2 scenario. All transport-potential values are expressed as items/m2/d. (A) Depth-resolved total modelled transport potential based on 48 depth-level estimates, including 24 estimates from W1 and 24 estimates from W2, shown on a log10 scale with hydrographic depth zones indicated by background bands. (B) Relationship between FTIR-corrected abundance and morphology-resolved mean sinking velocity based on the same 48 depth-level estimates; colors denote hydrographic depth zones, and symbol size represents modelled total transport potential. (C) Relative contributions of fibers and non-fiber particles to mean modelled transport potential in each depth zone; the surface/euphotic, intermediate/OMZ transition, deep-water, and abyssal/bottom-water zones contain 16, 20, 6, and 6 depth levels, respectively. (D) Summary of the pooled mean modelled transport potential, morphological contributions, and depth-zone means based on 48 depth-level estimates. The plotted values are model outputs under the drag ×2 assumption rather than independent experimental replicates; descriptive depth-level ranges are provided in Table S4, and no inferential error bars are shown. These values are modelled free-particle transport potentials and are not direct measurements of depositional flux, burial flux, or retention efficiency.
Depth-resolved modelled free-particle vertical transport potentials, expressed in items/m2/d, varied substantially within and between the two profiles and did not decrease monotonically with depth (Figure 7A). Relatively high but variable fluxes occurred in the surface/euphotic and intermediate waters, followed by generally lower values in deep water. Nevertheless, non-negligible modeled flux persisted in abyssal and bottom waters. W1 exhibited a pronounced local maximum at approximately 5000 m, whereas W2 showed an overall decline toward the seafloor. Mean modelled transport potentials across the sampled depths were 2.43 × 10⁴ items/m2/d at W1 and 3.22 × 10⁴ items/m2/d at W2 (Table S4; Figure 7A). These values describe modelled transport potential rather than measured depositional or burial flux. All depth-level totals were audited against Equation (4) and the fiber and non-fiber components. The contrasting deep-water trajectories indicate spatially heterogeneous vertical transport; therefore, the local maximum at W1 should not be interpreted as evidence of a basin-wide increase in abyssal flux. Across the 48 depth-level estimates, modelled mean sinking velocity ranged from 4.29 to 66.93 m/d, with a median of 14.00 m/d. Total modelled transport potential ranged from 3.92 × 10³ to 8.89 × 10⁴ items/m2/d, with a median of 1.98 × 10⁴ items/m2/d (Table S4; Figure 7A,B). These values are descriptive depth-level ranges rather than formal confidence intervals because the model outputs are not independent experimental replicates. The pooled mean modelled transport potential was 3.77 × 10⁴ items/m2/d under drag ×1.5, 2.82 × 10⁴ items/m2/d under drag ×2, and 1.88 × 10⁴ items/m2/d under drag ×3 (Table S5). Thus, the absolute magnitude of the modelled potential was sensitive to the drag multiplier, whereas the drag ×2 scenario provided an intermediate-conservative estimate. A complete sensitivity analysis for polymer density and fiber orientation was not performed because individual polymer identities and empirical orientation distributions were not available for all visually identified particles.
The phase-space analysis shows that modeled vertical flux depended jointly on FTIR-corrected abundance and morphology-resolved sinking velocity (Figure 7B). Across the pooled observations, the group-weighted mean and median sinking velocities were 17.63 and 14.03 m/d, respectively (Table S4; Figure 7B). Depths with moderate particle abundances could produce relatively high potential settling fluxes when dominated by faster-settling assemblages, whereas high abundances did not necessarily translate into high fluxes when particle-specific settling velocities were low, because MP settling behavior varies substantially with particle dimensions, shape, density contrast with seawater, and biological modification [62,69]. Suspended abundance alone was therefore not a reliable proxy for downward transport potential, because it represents an instantaneous or time-integrated standing stock rather than the rate at which particles cross a given depth horizon [54]. Instead, the estimated flux reflected the combined effects of corrected abundance and modeled particle-specific settling velocities, with the latter constrained by particle dimensions, morphology, polymer density, density contrast with seawater, and shape-dependent hydrodynamic drag [22].
Non-fiber particles dominated modeled transport in all hydrographic depth zones (Figure 7C). Their contribution increased from 83.8% in the surface/euphotic layer to 88.4% in the intermediate/OMZ transition layer, 89.1% in deep water, and 95.2% in abyssal/bottom water. Correspondingly, the fiber contribution decreased from 16.2% near the surface to 4.8% in abyssal/bottom water. This trend is consistent with the greater effective settling potential of compact fragments and other non-fiber particles, which generally experience less shape-related drag than elongated fibers under the modeled free-settling conditions.
Mean total flux also varied among depth zones, decreasing from 3.86 × 10⁴ items/m2/d in the surface/euphotic layer to 2.54 × 10⁴ items/m2/d in the intermediate/OMZ transition layer and 1.46 × 10⁴ items/m2/d in deep water. It subsequently increased to 2.36 × 10⁴ items/m2/d in abyssal/bottom water (Figure 7C). This partial increase indicates that declining suspended abundance with depth did not translate proportionally into lower modeled transport potential [4,11,70]. However, because W1 and W2 showed contrasting abyssal patterns, the abyssal/bottom-water mean represents persistent but spatially variable delivery rather than uniform near-bottom flux enhancement.
Across both profiles and all sampled depths, the pooled mean modelled transport potential was 2.82 × 10⁴ items/m2/d, with a median of 2.04 × 10⁴ items/m2/d (Table S4; Figure 7D). Non-fiber particles accounted for 87.0% of the pooled mean modelled transport potential, whereas fibers contributed 13.0%. These values describe the specified free-particle settling scenario and do not measure deposition at or retention within the seafloor. A low suspended concentration therefore cannot by itself be used to quantify delivery or burial. Because the sediment stations were not colocated with the water-column profiles and no water–sediment mass balance was established, the modelled transport potential cannot be directly converted into the MP inventory of any specific sediment station (Tables S1 and S4; Figure 7A–D). A low suspended concentration does not necessarily indicate weak delivery because it may partly reflect the removal of faster-settling particles from the water column.
The relatively small modeled fiber contribution does not, however, imply that fibers are unimportant to benthic accumulation. Fibers constituted 55.7% of the sedimentary MP assemblage and were relatively enriched compared with the water column. This apparent contrast suggests that their delivery and accumulation may involve processes not represented by the free-particle settling model, including incorporation into marine snow and other biogenic aggregates [20,58], packaging into fecal material and biologically mediated repackaging [18], and biofouling-induced changes in particle density and sinking behavior [70]. Their elongated geometry may further modify their settling orientation and interactions with surrounding particles, potentially increasing their interception by organic–mineral aggregates and depositional traps near the sediment–water interface [1,69]. Such trapping could enhance benthic retention even when the modeled free-particle settling flux is relatively low.
Overall, the modelled results describe morphology- and density-dependent free-particle transport potential through the water column. These values are not direct measurements of depositional flux, burial flux, resuspension, or retention efficiency. The model does not explicitly resolve turbulence, lateral advection, aggregation–disaggregation, biological repackaging, near-bottom resuspension, or post-depositional redistribution. No independent settling-column, sediment-trap, or in situ depositional-flux data were collected during the cruise. Therefore, the modelled values should be interpreted as scenario-based transport potentials rather than validated predictions of in situ settling or burial flux. (Table S4; Figure 7A–D). Accordingly, the combined water-column, modelled-transport, and sediment observations show a spatial and morphological association between suspended and sedimentary MP assemblages, but they do not establish a colocated transfer pathway or quantify deposition, long-term burial, or permanent sequestration.
These findings have broader implications for the interpretation of deep-sea MP observations. Water-column MP concentration should not be treated as a direct proxy for downward delivery, while surface-sediment inventories should not be interpreted as direct records of local vertical input because they may also reflect lateral focusing, resuspension, historical accumulation, and post-depositional redistribution. The morphology-resolved results indicate that particle shape and carrier-phase transformation should be considered when assessing the potential movement of MPs through the deep ocean, but they do not establish the efficiency of transfer from the sampled water column to individual sediment stations. Future studies should combine colocated full-depth water-column profiles with sediment-trap or settling-column measurements, deeper sediment cores, and direct observations of aggregation, biofouling, lateral advection, and near-bottom resuspension to determine the relative contributions of vertical transport and post-depositional processes [10,39,51].
4. Conclusions
MPs occurred throughout the 5650 m water column and in surface sediments of the western Pacific PB, revealing spatially distinct suspended and sedimentary MP assemblages. Surface sediments contained relatively more fibers and smaller particles than the water-column assemblage, indicating compartment-level morphological and size differences that may arise from multiple transport and post-depositional processes. Because the water-column profiles and sediment stations were not linked through a colocated mass balance, these contrasts indicate consistency between assemblages rather than proof of a direct transfer pathway from the sampled water column to the sampled sediments. The measured sediment pH, Eh, and temperature were useful for describing the near-surface benthic setting, but their exploratory associations with MP abundance did not demonstrate direct geochemical control of the sedimentary inventory. A conservative, morphology-resolved free-particle settling model constrained by FTIR yielded a pooled mean modelled transport potential of 2.82 × 10⁴ items/m2/d, with non-fiber particles accounting for 87.0% of the specified settling scenario. Modelled transport potential persisted at abyssal and bottom-water depths but varied substantially between the two profiles. These values should not be interpreted as measured depositional flux, burial flux, retention efficiency, or permanent sequestration. Direct measurements of settling, deposition, resuspension, and burial are needed to establish the efficiency of transfer to and persistence in abyssal sediments. The main positive implication of this study is that MPs were detected throughout the water column and in surface sediments, while morphology-resolved modelling indicated non-zero transport potential at abyssal and bottom-water depths. These results identify particle morphology, carrier-phase transformation, and free-particle settling potential as plausible processes influencing the distribution of MPs between suspended and sedimentary compartments. The main limitation is that the available observations and model do not establish how much of the surface-water MP pool is actually deposited, resuspended, buried, or permanently retained in abyssal sediments. Therefore, the abyssal seafloor should be regarded as an important observed sedimentary compartment and a target for further process-based investigation, rather than as a demonstrated permanent MP sink.
Supplementary Materials
The following supporting information can be downloaded at: https://www.mdpi.com/article/10.3390/jmse14212094/s1, Table S1: Sampling stations, geographic coordinates, and sampling categories in the western Pacific Pigafetta Basin; Table S2: Depth-resolved hydrographic and biogeochemical properties and microplastic abundance along two full-depth water-column profiles in the western Pacific Pigafetta Basin; Table S3: Physicochemical properties and microplastic abundance of surface sediments collected from the western Pacific Pigafetta Basin; Table S4: Depth-resolved morphology-specific sinking velocities and modeled vertical fluxes of microplastics at W1 and W2 under the primary drag ×2 scenario; Table S5: Sensitivity of pooled modelled free-particle transport potential to the drag multiplier; Figure S1: Spearman correlation matrix of microplastic abundance and hydrographic and biogeochemical variables in the water column of the western Pacific Pigafetta Basin; Figure S2: Spearman correlation matrix of microplastic abundance and physicochemical properties of surface sediments in the western Pacific Pigafetta Basin.
Author Contributions
Conceptualization, H.D.; methodology, H.D., D.C., B.H. and J.K.; software, H.D. and Y.F.; project administration, H.D., Y.F., B.H. and Y.D.; validation, H.D. and D.C.; formal analysis, H.D.; resources, H.D.; data curation, H.D.; writing—original draft preparation, H.D.; writing—review and editing, H.D., Y.F., D.C., B.H. and Y.D.; visualization, H.D. and Y.F.; supervision, Y.D. All authors have read and agreed to the published version of the manuscript.
Funding
This work was supported by the National Natural Science Foundation of China (No. 42407552 and 42476237), Postdoctoral Science Foundation of China (2025M770861), Guangzhou Basic and Applied Basic Research Foundation (2025A04J4402), Guangdong Major Project of Basic and Applied Basic Research (2023B0303000015) and the Postdoctoral Fellowship Program of CPSF (GZC20251735).
Data Availability Statement
The original contributions presented in this study are included in the. article and Supplementary Material. Further inquiries can be directed to the corresponding author.
Acknowledgments
During preparation of this study, the authors used ChatGPT (OpenAI GPT-5.5; https://chatgpt.com/, accessed on 20 July 2026) solely to generate a vector illustration of microplastics in deep-sea surface sediments. GPT-6.1-sol (OpenAI; https://chatgpt.com/, accessed on 22 October 2026) was also used for language polishing and readability improvement of the manuscript. The illustration was subsequently reviewed and edited by the authors. No AI-generated content was used for experimental data generation, statistical analysis, machine-learning calculations, interpretation of results, or preparation of data-based figures and tables. The authors take full responsibility for the content of this publication.
Conflicts of Interest
The authors declare no conflicts of interest.
Abbreviations
The following abbreviations are used in this manuscript:
| AOU | Apparent oxygen utilization |
| CTD | Conductivity, temperature, and depth |
| DO | Dissolved oxygen |
| Eh | Redox potential |
| EOS-80 | Equation of State of Seawater 1980 |
| FTIR | Fourier-transform infrared spectroscopy |
| GNSS | Global Navigation Satellite System |
| MP | Microplastic |
| MPs | Microplastics |
| OMZ | Oxygen minimum zone |
| PB | Pigafetta Basin |
| pH | Potential of hydrogen |
| R/V | Research vessel |
| TA | Total alkalinity |
| WOA23 | World Ocean Atlas 2023 |
| μ-FTIR | Micro-Fourier-transform infrared spectroscopy |
References
- Kane, I.A.; Clare, M.A.; Miramontes, E.; Wogelius, R.; Rothwell, J.J.; Garreau, P.; Pohl, F. Seafloor microplastic hotspots controlled by deep-sea circulation. Science 2020, 368, 1140–1145. [Google Scholar] [CrossRef] [Scilit] [PubMed]
- Bergmann, M.; Collard, F.; Fabres, J.; Gabrielsen, G.W.; Provencher, J.F.; Rochman, C.M.; van Sebille, E.; Tekman, M.B. Plastic pollution in the Arctic. Nat. Rev. Earth Environ. 2022, 3, 323–337. [Google Scholar] [CrossRef] [Scilit]
- Woodall, L.C.; Sanchez-Vidal, A.; Canals, M.; Paterson, G.L.J.; Coppock, R.; Sleight, V.; Calafat, A.; Rogers, A.D.; Narayanaswamy, B.E.; Thompson, R.C. The deep sea is a major sink for microplastic debris. R. Soc. Open Sci. 2014, 1, 140317. [Google Scholar] [CrossRef] [Scilit] [PubMed]
- Pabortsava, K.; Lampitt, R.S. High concentrations of plastic hidden beneath the surface of the Atlantic Ocean. Nat. Commun. 2020, 11, 4073. [Google Scholar] [CrossRef] [Scilit] [PubMed]
- Choy, C.A.; Robison, B.H.; Gagne, T.O.; Erwin, B.; Firl, E.; Halden, R.U.; Hamilton, J.A.; Katija, K.; Lisin, S.E.; Rolsky, C.; et al. The vertical distribution and biological transport of marine microplastics across the epipelagic and mesopelagic water column. Sci. Rep. 2019, 9, 7843. [Google Scholar] [CrossRef] [Scilit] [PubMed]
- Kanhai, L.D.K.; Gardfeldt, K.; Krumpen, T.; Thompson, R.C.; O’Connor, I. Microplastics in sea ice and seawater beneath ice floes from the Arctic Ocean. Sci. Rep. 2020, 10, 5004. [Google Scholar] [CrossRef] [Scilit] [PubMed]
- Peng, G.; Bellerby, R.; Zhang, F.; Sun, X.; Li, D. The ocean’s ultimate trashcan: Hadal trenches as major depositories for plastic pollution. Water Res. 2020, 168, 115121. [Google Scholar] [CrossRef] [Scilit] [PubMed]
- Deng, H.; Fu, Y.; Su, L.; Chen, D.; Deng, X.; Hu, B.; Chen, Y.; Deng, Y. Unveiling the deep-sea microplastic Odyssey: Characteristics, distribution, and ecological implications in Pacific Ocean sediments. J. Hazard. Mater. 2025, 489, 137537. [Google Scholar] [CrossRef] [Scilit] [PubMed]
- Deng, H.; Fu, Y.; Su, M.; Chen, D.; Yao, H.; Tan, Y.; Zhang, L.; Wang, J.; Deng, Y. Stratification and deposition pathways of microplastics in the abyssal sediments of the Philippine Sea. Water Res. 2025, 287, 124425. [Google Scholar] [CrossRef] [Scilit] [PubMed]
- Van Sebille, E.; Aliani, S.; Law, K.L.; Maximenko, N.; Alsina, J.M.; Bagaev, A.; Bergmann, M.; Chapron, B.; Chubarenko, I.; Cózar, A. The physical oceanography of the transport of floating marine debris. Environ. Res. Lett. 2020, 15, 023003. [Google Scholar] [CrossRef] [Scilit]
- Kvale, K.; Prowe, A.F.; Chien, C.-T.; Landolfi, A.; Oschlies, A. The global biological microplastic particle sink. Sci. Rep. 2020, 10, 16670. [Google Scholar] [CrossRef] [Scilit] [PubMed]
- Tekman, M.B.; Wekerle, C.; Lorenz, C.; Primpke, S.; Hasemann, C.; Gerdts, G.; Bergmann, M. Tying up loose ends of microplastic pollution in the Arctic: Distribution from the sea surface through the water column to deep-sea sediments at the HAUSGARTEN observatory. Environ. Sci. Technol. 2020, 54, 4079–4090. [Google Scholar] [CrossRef] [Scilit] [PubMed]
- Cózar, A.; Echevarría, F.; González-Gordillo, J.I.; Irigoien, X.; Úbeda, B.; Hernández-León, S.; Palma, Á.T.; Navarro, S.; García-de-Lomas, J.; Ruiz, A. Plastic debris in the open ocean. Proc. Natl. Acad. Sci. USA 2014, 111, 10239–10244. [Google Scholar] [CrossRef] [Scilit] [PubMed]
- Jambeck, J.R.; Geyer, R.; Wilcox, C.; Siegler, T.R.; Perryman, M.; Andrady, A.; Narayan, R.; Law, K.L. Plastic waste inputs from land into the ocean. Science 2015, 347, 768–771. [Google Scholar] [CrossRef] [Scilit] [PubMed]
- Onink, V.; Kaandorp, M.L.; van Sebille, E.; Laufkötter, C. Influence of particle size and fragmentation on large-scale microplastic transport in the Mediterranean Sea. Environ. Sci. Technol. 2022, 56, 15528–15540. [Google Scholar] [CrossRef] [Scilit] [PubMed]
- Jamieson, A.J.; Brooks, L.; Reid, W.D.; Piertney, S.; Narayanaswamy, B.E.; Linley, T. Microplastics and synthetic particles ingested by deep-sea amphipods in six of the deepest marine ecosystems on Earth. R. Soc. Open Sci. 2019, 6, 180667. [Google Scholar] [CrossRef] [Scilit] [PubMed]
- Meijer, L.J.; Van Emmerik, T.; Van Der Ent, R.; Schmidt, C.; Lebreton, L. More than 1000 rivers account for 80% of global riverine plastic emissions into the ocean. Sci. Adv. 2021, 7, eaaz5803. [Google Scholar] [CrossRef] [Scilit] [PubMed]
- Cole, M.; Lindeque, P.K.; Fileman, E.; Clark, J.; Lewis, C.; Halsband, C.; Galloway, T.S. Microplastics alter the properties and sinking rates of zooplankton faecal pellets. Environ. Sci. Technol. 2016, 50, 3239–3246. [Google Scholar] [CrossRef] [Scilit] [PubMed]
- Peng, X.; Chen, M.; Chen, S.; Dasgupta, S.; Xu, H.; Ta, K.; Du, M.; Li, J.; Guo, Z.; Bai, S. Microplastics contaminate the deepest part of the world’s ocean. Geochem. Perspect. Let. 2018, 9, 1–5. [Google Scholar] [CrossRef] [Scilit]
- Michels, J.; Stippkugel, A.; Lenz, M.; Wirtz, K.; Engel, A. Rapid aggregation of biofilm-covered microplastics with marine biogenic particles. Proc. Roy. Soc. B Biol. Sci. 2018, 285, 20181203. [Google Scholar] [CrossRef] [Scilit] [PubMed]
- Quintana, R.; Manzano-Medina, S.; Pérez-López, L.; Oyón-Sanz, A.; González-Fernández, D.; González-Gordillo, J.I.; Marti, E.; Echevarría, F.; Morales-Caselles, C. Vertical Distribution and Composition of Plastics in Coastal Areas of the Gulf of Cádiz: Insights into Transport Dynamics. Environ. Sci. Technol. 2025, 59, 17760–17772. [Google Scholar] [CrossRef] [Scilit] [PubMed]
- Dittmar, S.; Ruhl, A.S.; Altmann, K.; Jekel, M. Settling velocities of small microplastic fragments and fibers. Environ. Sci. Technol. 2024, 58, 6359–6369. [Google Scholar] [CrossRef] [Scilit] [PubMed]
- Tang, K.H.D.; Li, R. The effects of plastisphere on the physicochemical properties of microplastics. Bioprocess. Biosyst. Eng. 2025, 48, 1–15. [Google Scholar] [CrossRef] [Scilit] [PubMed]
- Meng, D.; Li, Y. Assessing the settling velocity of biofilm-encrusted microplastics: Accounting for biofilms as an equivalent to surface roughness. Environ. Sci. Technol. 2024, 58, 1329–1337. [Google Scholar] [CrossRef] [Scilit] [PubMed]
- Olivia, M.; Wu, W.-H.; Tsai, A.-Y.; Hsu, H.-C.; Gong, G.-C.; Shiu, R.-F. Microplastics affect marine snow formation and sinking to the ocean’s interior. Water Res. 2025, 288, 124601. [Google Scholar] [CrossRef] [Scilit] [PubMed]
- Li, Y.; Ke, S.; Xu, D.; Zhuo, H.; Liu, X.; Gao, B. Preferential deposition of buoyant small microplastics in surface sediments of the Three Gorges Reservoir, China: Insights from biomineralization. J. Hazard. Mater. 2024, 468, 133693. [Google Scholar] [CrossRef] [Scilit] [PubMed]
- Sugathapala, T.M.; Capuano, T.; Brandt, L.; Iudicone, D.; Sardina, G. Vertical transport of buoyant microplastic particles in the ocean: The role of turbulence and biofouling. Environ. Pollut. 2025, 369, 125819. [Google Scholar] [CrossRef] [Scilit] [PubMed]
- Tseng, Z.E.; Wu, Y.; Menemenlis, D.; Wang, G.; Ruf, C.; Pan, Y. Distribution of plastics of various sizes and densities in the global ocean from a 3D Eulerian model. J. Geophys. Res. Oceans 2025, 130, e2025JC023272. [Google Scholar] [CrossRef] [Scilit]
- Ruiz-Gonzalez, V.; Defontaine, S.; Jalón-Rojas, I. Sinking together? Settling behavior of microplastics in the presence of fine sediments. Environ. Sci. Technol. 2026, 60, 10251–10262. [Google Scholar] [CrossRef] [Scilit] [PubMed]
- Parrella, F.; Brizzolara, S.; Holzner, M.; Mitrano, D.M. Impact of heteroaggregation between microplastics and algae on particle vertical transport. Nat. Water 2024, 2, 541–552. [Google Scholar] [CrossRef] [Scilit] [PubMed]
- Beheshtimaal, A.; Xu, R.; Wang, B.; Salehi, M. Vertical distribution of new and weathered microplastics in the water column: Implications for developing reliable sampling methods. Water Res. 2025, 287, 124456. [Google Scholar] [CrossRef] [Scilit] [PubMed]
- Qian, S.; Qiao, X.; Zhang, W.; Yu, Z.; Dong, S.; Feng, J. Machine learning-based prediction for settling velocity of microplastics with various shapes. Water Res. 2024, 249, 121001. [Google Scholar] [CrossRef] [Scilit] [PubMed]
- Coyle, R.; Service, M.; Witte, U.; Hardiman, G.; McKinley, J. Modeling microplastic transport in the marine environment: Testing empirical models of particle terminal sinking velocity for irregularly shaped particles. ACS ES T Water 2023, 3, 984–995. [Google Scholar] [CrossRef] [Scilit] [PubMed]
- Mountford, A.S.; Morales Maqueda, M. Eulerian modeling of the three-dimensional distribution of seven popular microplastic types in the global ocean. J. Geophys. Res. Oceans 2019, 124, 8558–8573. [Google Scholar] [CrossRef] [Scilit]
- Kim, S.-K.; Shin, J.-H.; Ji, Y.-J.; Seong, M.-J.; Je, C.-Y.; Kim, J.-S.; Song, N.-S. Horizontal and vertical distributions of microplastics and their water–sediment partitioning in a macrotidal estuarine embayment: Implications for coastal sequestration potential. J. Hazard. Mater. 2026, 513, 142508. [Google Scholar] [CrossRef] [Scilit] [PubMed]
- Kvale, K.; Oschlies, A. Recovery from microplastic-induced marine deoxygenation may take centuries. Nat. Geosci. 2023, 16, 10–12. [Google Scholar] [CrossRef] [Scilit]
- Ikenoue, T.; Nakajima, R.; Osafune, S.; Siswanto, E.; Honda, M.C. Vertical flux of microplastics in the deep subtropical Pacific Ocean: Moored sediment-trap observations within the Kuroshio Extension Recirculation Gyre. Environ. Sci. Technol. 2024, 58, 16121–16130. [Google Scholar] [CrossRef] [Scilit] [PubMed]
- Zhao, S.; Mincer, T.J.; Lebreton, L.; Egger, M. Pelagic microplastics in the North Pacific Subtropical Gyre: A prevalent anthropogenic component of the particulate organic carbon pool. Proc. Natl. Acad. Sci. USA Nexus 2023, 2, pgad070. [Google Scholar] [CrossRef] [Scilit] [PubMed]
- Wu, N.; Grieve, S.W.; Manning, A.J.; Spencer, K.L. Marine snow as vectors for microplastic transport: Multiple aggregation cycles account for the settling of buoyant microplastics to deep-sea sediments. Limnol. Oceanogr. 2025, 70, 899–910. [Google Scholar] [CrossRef] [Scilit]
- Chen, P.; Kane, I.A.; Clare, M.A.; Soutter, E.L.; Mienis, F.; Wogelius, R.A.; Keavney, E. Direct evidence that microplastics are transported to the deep sea by turbidity currents. Environ. Sci. Technol. 2025, 59, 7278–7287. [Google Scholar] [CrossRef] [Scilit] [PubMed]
- Galgani, L.; Goßmann, I.; Scholz-Böttcher, B.; Jiang, X.; Liu, Z.; Scheidemann, L.; Schlundt, C.; Engel, A. Hitchhiking into the deep: How microplastic particles are exported through the biological carbon pump in the North Atlantic Ocean. Environ. Sci. Technol. 2022, 56, 15638–15649. [Google Scholar] [CrossRef] [Scilit] [PubMed]
- Wazne, M.; Simon, L.; Krause, S.; Vallier, M.; Dendievel, A.-M.; Touchet, C.M.; Mourier, B.; Montagnac, G.; Mermillod-Blondin, F. Microplastics storage at the sediment-water interface in a gravel-bed river: Importance of local hydro-sedimentary conditions in downwelling, upwelling, and sedimentation zones. Water Res. 2025, 279, 123433. [Google Scholar] [CrossRef] [Scilit] [PubMed]
- Su, X.; Liu, M.; Dou, J.; Tang, Y.; Lu, Z.; Xu, J.; He, Y. Comprehensive understanding on the aging process and mechanism of microplastics in the sediment–water interface: Untangling the role of photoaging and biodegradation. Environ. Sci. Technol. 2024, 58, 16164–16174. [Google Scholar] [CrossRef] [Scilit] [PubMed]
- Summers, E.; Du, J.; Park, K.; Wharton, M.; Kaiser, K. Importance of the water-sediment bed interactions in simulating microplastic particles in an estuarine system. Front. Mar. Sci. 2024, 11, 1414459. [Google Scholar] [CrossRef] [Scilit]
- Schmidtmann, J.; Weishäupl, H.-K.; Hopp, L.; Meides, N.; Peiffer, S. UV-weathering affects heteroaggregation and subsequent sedimentation of polystyrene microplastic particles with ferrihydrite. Environ. Sci. Processes Impacts 2025, 27, 992–1002. [Google Scholar] [CrossRef] [Scilit] [PubMed]
- Hou, Y.; Wang, Y.; Zhu, L.; Zhang, Z.; Dong, Z.; Qiu, Y. Different inhibitory mechanisms of flexible and rigid clay minerals on the transport of microplastics in marine porous media. Environ. Pollut. 2024, 356, 124246. [Google Scholar] [CrossRef] [Scilit] [PubMed]
- Wang, T.; Zhao, S.; Zhu, L.; McWilliams, J.C.; Galgani, L.; Amin, R.M.; Nakajima, R.; Jiang, W.; Chen, M. Accumulation, transformation and transport of microplastics in estuarine fronts. Nat. Rev. Earth Environ. 2022, 3, 795–805. [Google Scholar] [CrossRef] [Scilit]
- Wang, Q.; Li, H.; Zhang, J.; Han, Y.; Liu, Y.; Wang, J.; Cai, M.; Liu, M.; Li, Z.; Fang, Z. The Dynamic Sink: How Settling–Resuspension Cycles Drive Offshore Transport of High-Density Microplastics. Environ. Pollut. 2026, 399, 128144. [Google Scholar] [CrossRef] [Scilit] [PubMed]
- Jalón-Rojas, I.; Romero-Ramírez, A.; Fauquembergue, K.; Rossignol, L.; Cachot, J.; Sous, D.; Morin, B. Effects of biofilms and particle physical properties on the rising and settling velocities of microplastic fibers and sheets. Environ. Sci. Technol. 2022, 56, 8114–8123. [Google Scholar] [CrossRef] [Scilit] [PubMed]
- Bäuerlein, P.S.; Erich, M.W.; van Loon, W.M.; Mintenig, S.M.; Koelmans, A.A. A monitoring and data analysis method for microplastics in marine sediments. Mar. Environ. Res. 2023, 183, 105804. [Google Scholar] [CrossRef] [Scilit] [PubMed]
- Kuroda, M.; Isobe, A.; Uchida, K.; Hagita, R.; Hamada, S. Settling and Along-Isopycnal Subduction of Small Microplastics Into Subsurface Layers of the Western North Pacific Ocean. Environ. Sci. Technol. 2025, 59, 20716–20725. [Google Scholar] [CrossRef] [Scilit] [PubMed]
- Garcia, H.E.; Gordon, L.I. Oxygen solubility in seawater: Better fitting equations. Limnol. Oceanogr. 1992, 37, 1307–1312. [Google Scholar] [CrossRef] [Scilit]
- Fofonoff, N.P.; Millard, R.C. Algorithms for computation of fundamental properties of seawater. In UNESCO Technical Papers in Marine Science; UNESCO: Paris, France, 1983; 53p. [Google Scholar]
- Zhao, S.; Kvale, K.F.; Zhu, L.; Zettler, E.R.; Egger, M.; Mincer, T.J.; Amaral-Zettler, L.A.; Lebreton, L.; Niemann, H.; Nakajima, R.; et al. The distribution of subsurface microplastics in the ocean. Nature 2025, 641, 51–61. [Google Scholar] [CrossRef] [Scilit] [PubMed]
- Rynek, R.; Tekman, M.B.; Veit-Köhler, G.; Wagner, S.; Reemtsma, T.; Jahnke, A. Plastics from Surface to Seabed: Vertical Distribution of (Micro) plastic Particles in the North Pacific Ocean. Environ. Sci. Technol. 2025, 59, 26145–26156. [Google Scholar] [CrossRef] [Scilit] [PubMed]
- Li, C.; Zhu, L.; Wang, X.; Li, D. Elucidating the distribution and characteristics of microplastics in water column of the northwestern South China Sea with a large-volume in situ filtration technology (plankton pump). Front. Mar. Sci. 2025, 12, 1556592. [Google Scholar] [CrossRef] [Scilit]
- Brahney, J.; Mahowald, N.; Prank, M.; Cornwell, G.; Klimont, Z.; Matsui, H.; Prather, K.A. Constraining the atmospheric limb of the plastic cycle. Proc. Natl. Acad. Sci. USA 2021, 118, e2020719118. [Google Scholar] [CrossRef] [Scilit] [PubMed]
- Porter, A.; Lyons, B.P.; Galloway, T.S.; Lewis, C. Role of marine snows in microplastic fate and bioavailability. Environ. Sci. Technol. 2018, 52, 7111–7119. [Google Scholar] [CrossRef] [Scilit] [PubMed]
- Giering, S.L.; Sanders, R.; Lampitt, R.S.; Anderson, T.R.; Tamburini, C.; Boutrif, M.; Zubkov, M.V.; Marsay, C.M.; Henson, S.A.; Saw, K. Reconciliation of the carbon budget in the ocean’s twilight zone. Nature 2014, 507, 480–483. [Google Scholar] [CrossRef] [Scilit] [PubMed]
- Wu, X.; Zhao, X.; Feng, Y. Critical Impact of Colored Pigments on the Long-Term Photoaging of Polyethylene Microplastics in Coastal Seawater Environments. ACS ES T Water 2025, 5, 5243–5253. [Google Scholar] [CrossRef] [Scilit]
- Lu, Q.; Zhou, Y.; Sui, Q.; Zhou, Y. Mechanism and characterization of microplastic aging process: A review. Front. Environ. Sci. Eng. 2023, 17, 100. [Google Scholar] [CrossRef] [Scilit] [PubMed]
- Nguyen, T.H.; Tang, F.H.; Maggi, F. Sinking of microbial-associated microplastics in natural waters. PLoS ONE 2020, 15, e0228209. [Google Scholar] [CrossRef] [Scilit] [PubMed]
- Martin, C.; Young, C.A.; Valluzzi, L.; Duarte, C.M. Ocean sediments as the global sink for marine micro-and mesoplastics. Limnol. Oceanogr. Lett. 2022, 7, 235–243. [Google Scholar] [CrossRef] [Scilit]
- Gao, C.; Liang, B.; Zhang, S. Accumulation characteristics and ecological risk evaluation of microplastics in sediment cores from the artificial reef area and surrounding seas of Haizhou Bay, north China. Sci. Total Environ. 2024, 925, 171789. [Google Scholar] [CrossRef] [Scilit] [PubMed]
- Vibhatabandhu, P.; Prachayakul, T.; Tang-Siri, J.; Benmas, P.; Srithongouthai, S.; Kanokkantapong, V. Effect of tidal current on the settling and accumulation of microplastics in the Chao Phraya River estuary, Thailand. Mar. Pollut. Bull. 2024, 200, 116068. [Google Scholar] [CrossRef] [Scilit] [PubMed]
- Wu, N.; Grieve, S.; Manning, A.; Spencer, K. Coupling fragmentation to a size-selective sedimentation model can quantify the long-term fate of buoyant plastics in the ocean. Philos. Trans. Ser. A Math. Phys. Eng. Sci. 2025, 383, 20240445. [Google Scholar] [CrossRef] [Scilit] [PubMed]
- Nash, R.; Joyce, H.; Pagter, E.; Frias, J.; Guinan, J.; Healy, L.; Kavanagh, F.; Deegan, M.; O’Sullivan, D. Deep sea microplastic pollution extends out to sediments in the Northeast Atlantic Ocean margins. Environ. Sci. Technol. 2022, 57, 201–213. [Google Scholar] [CrossRef] [Scilit] [PubMed]
- Ourgaud, M.; Phuong, N.N.; Papillon, L.; Panagiotopoulos, C.; Galgani, F.; Schmidt, N.; Fauvelle, V.; Brach-Papa, C.; Sempere, R. Identification and quantification of microplastics in the marine environment using the laser direct infrared (LDIR) technique. Environ. Sci. Technol. 2022, 56, 9999–10009. [Google Scholar] [CrossRef] [Scilit] [PubMed]
- Waldschläger, K.; Schüttrumpf, H. Effects of particle properties on the settling and rise velocities of microplastics in freshwater under laboratory conditions. Environ. Sci. Technol. 2019, 53, 1958–1966. [Google Scholar] [CrossRef] [Scilit] [PubMed]
- Lobelle, D.; Kooi, M.; Koelmans, A.A.; Laufkötter, C.; Jongedijk, C.E.; Kehl, C.; van Sebille, E. Global modeled sinking characteristics of biofouled microplastic. J. Geophys. Res. Oceans 2021, 126, e2020JC017098. [Google Scholar] [CrossRef] [Scilit] [PubMed]
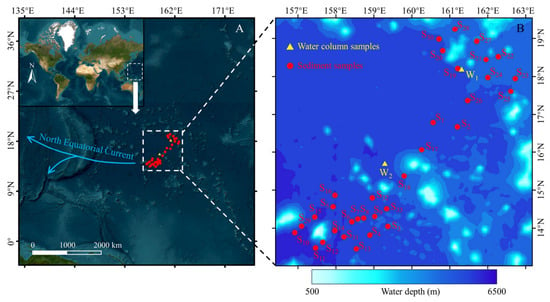
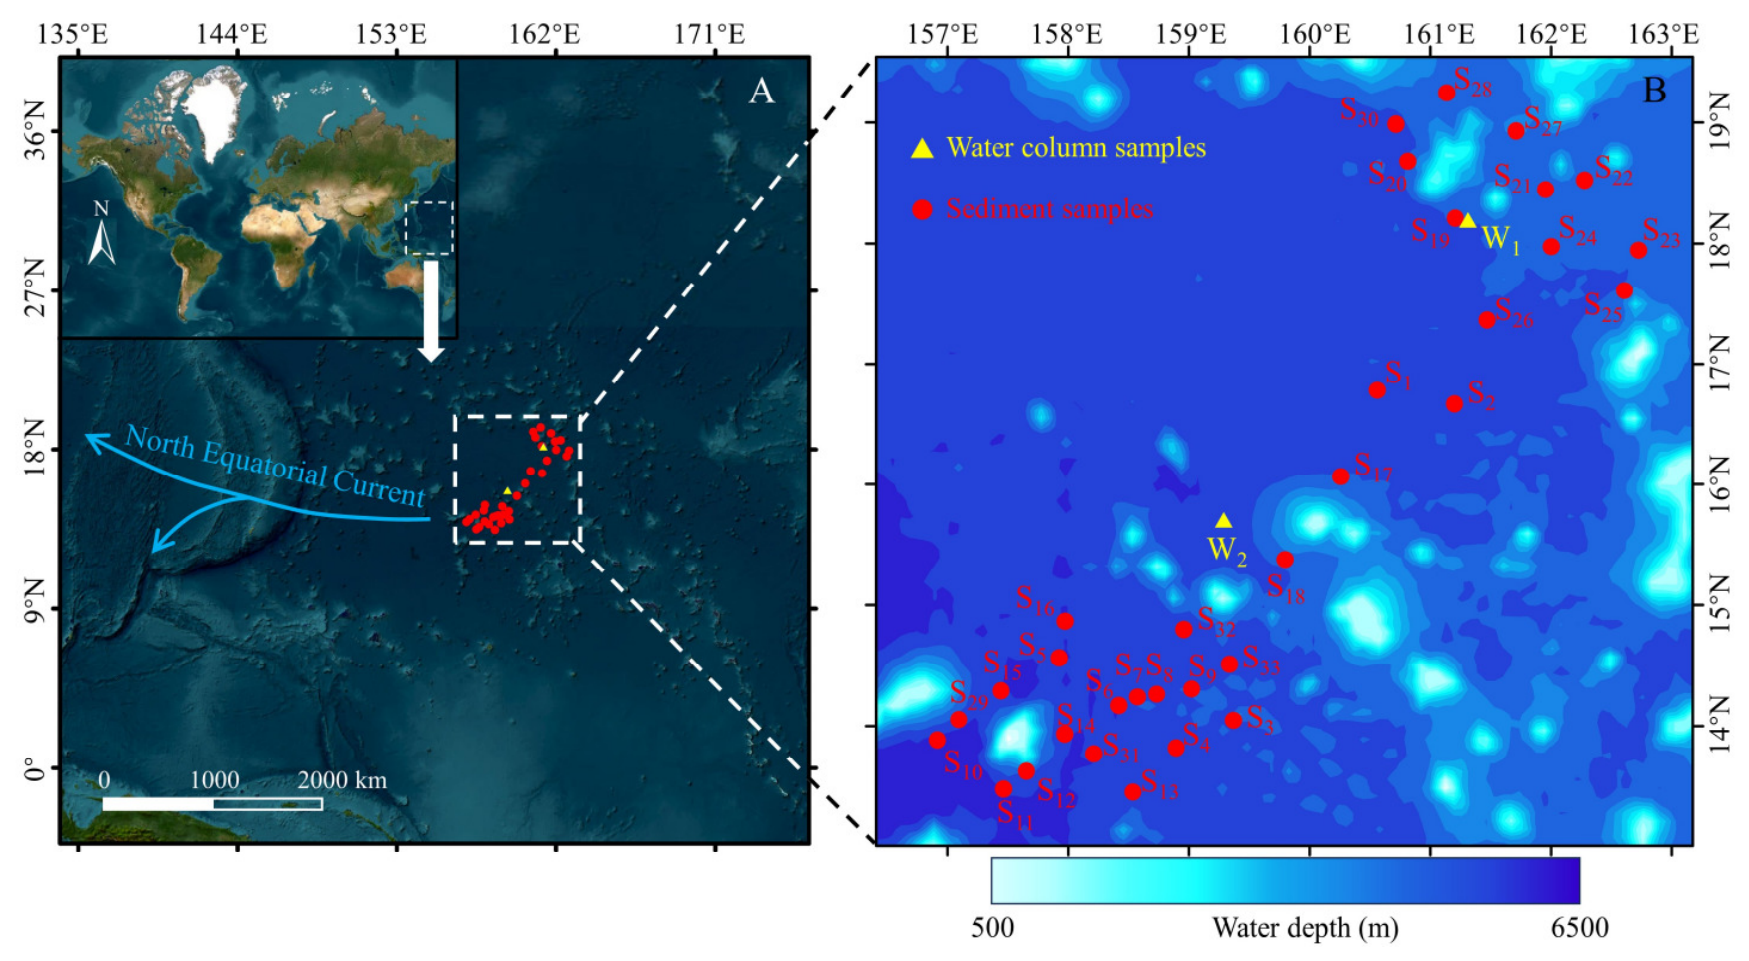
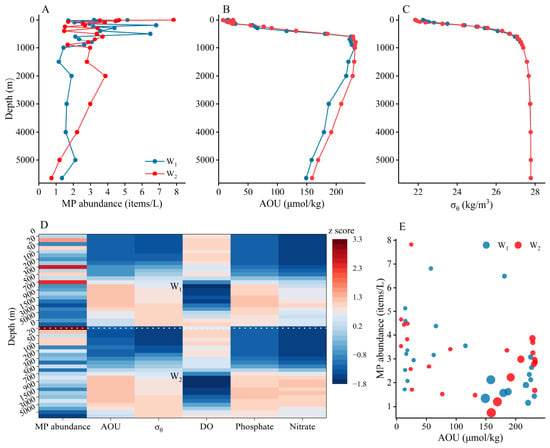
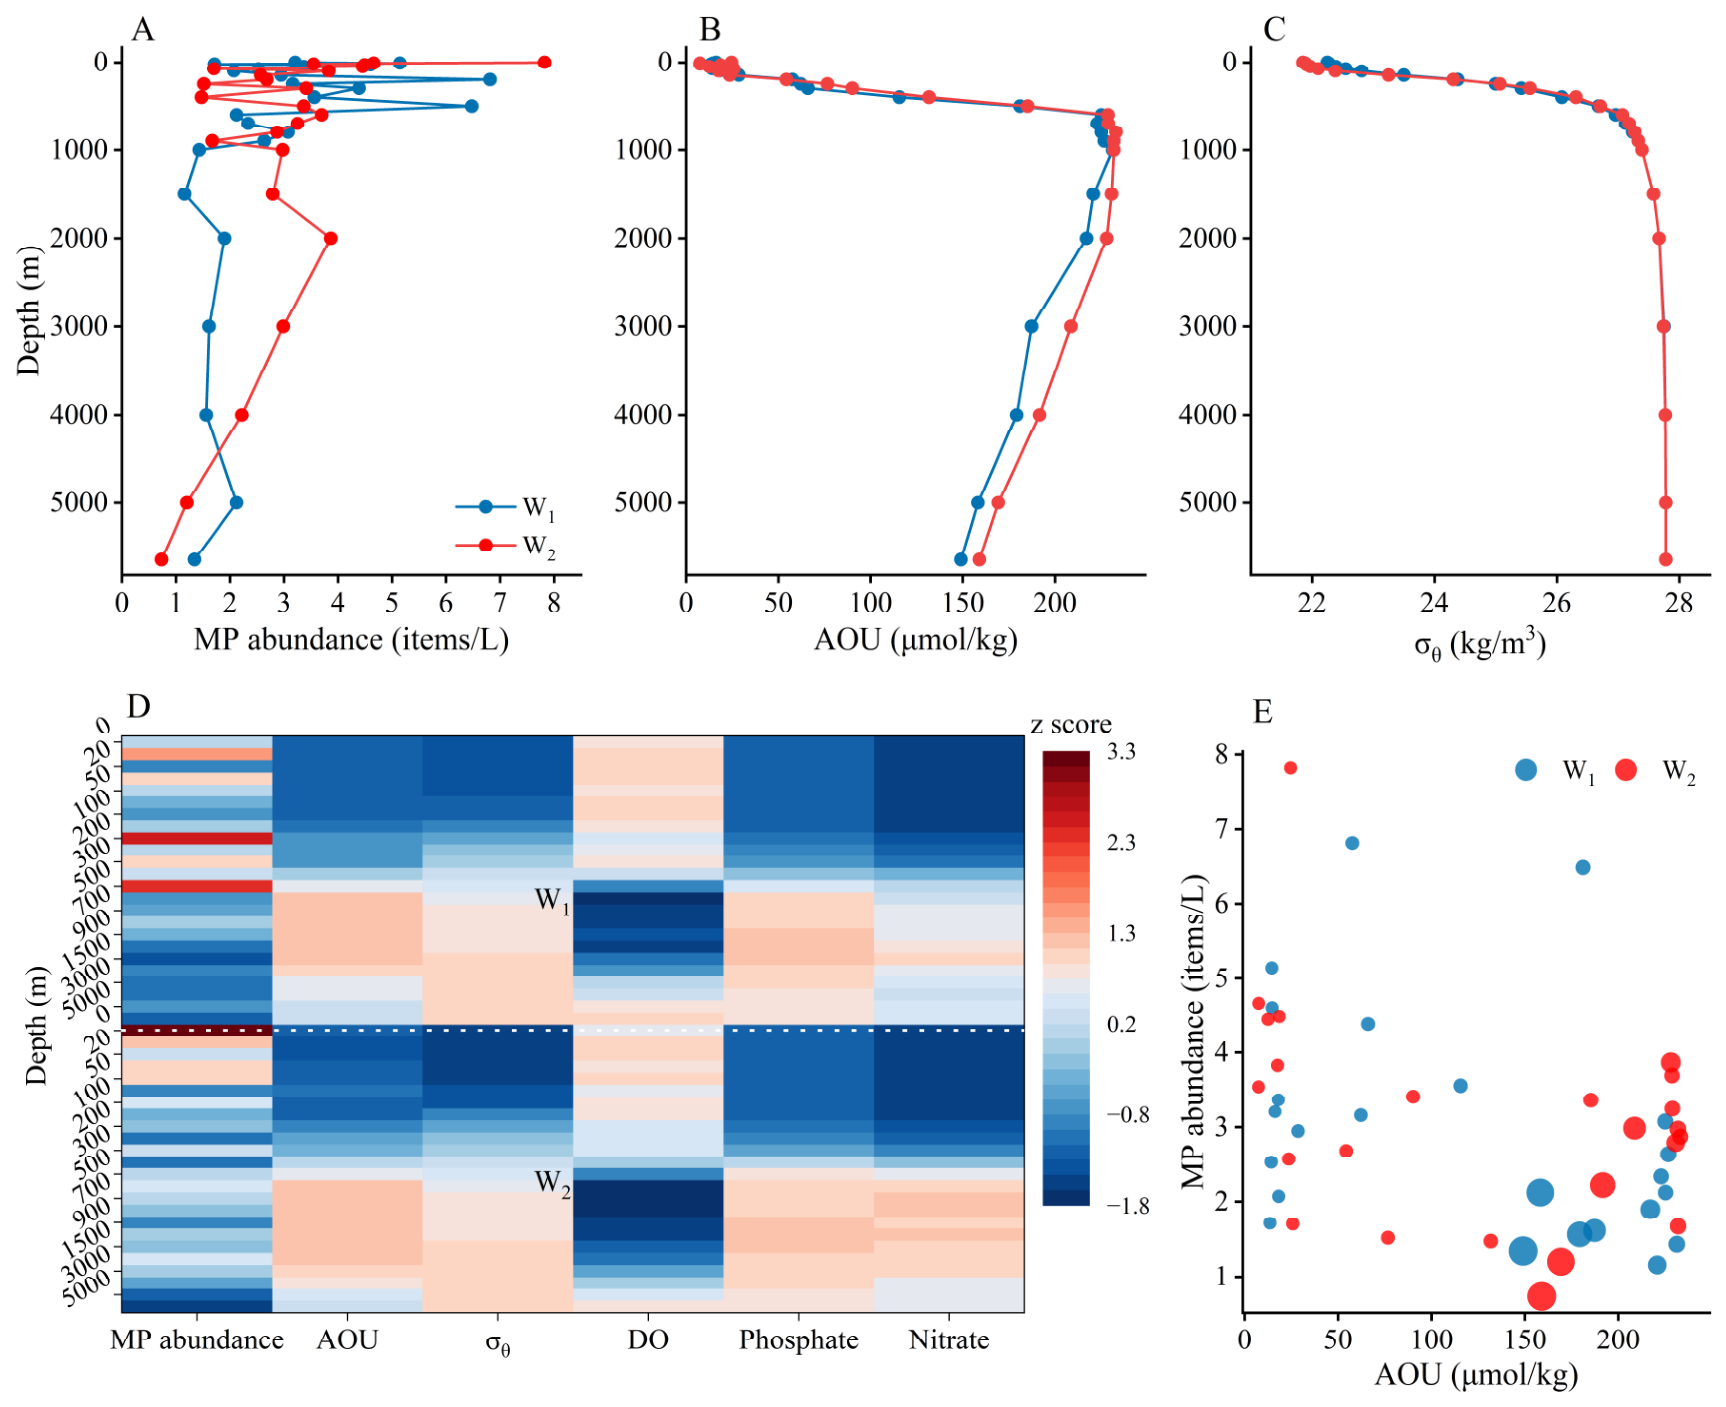
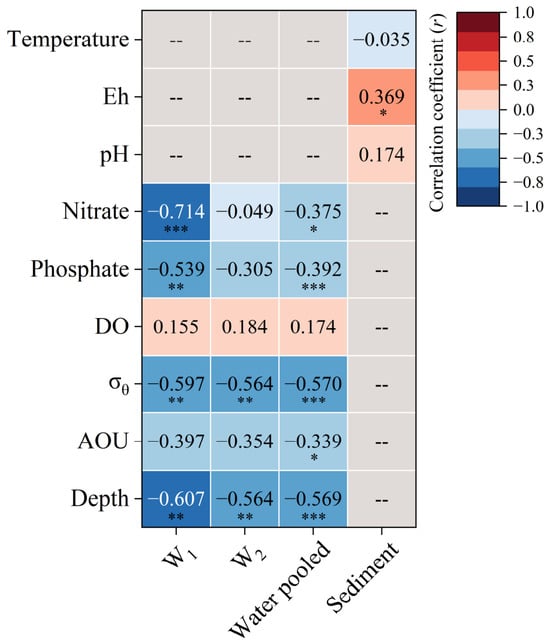
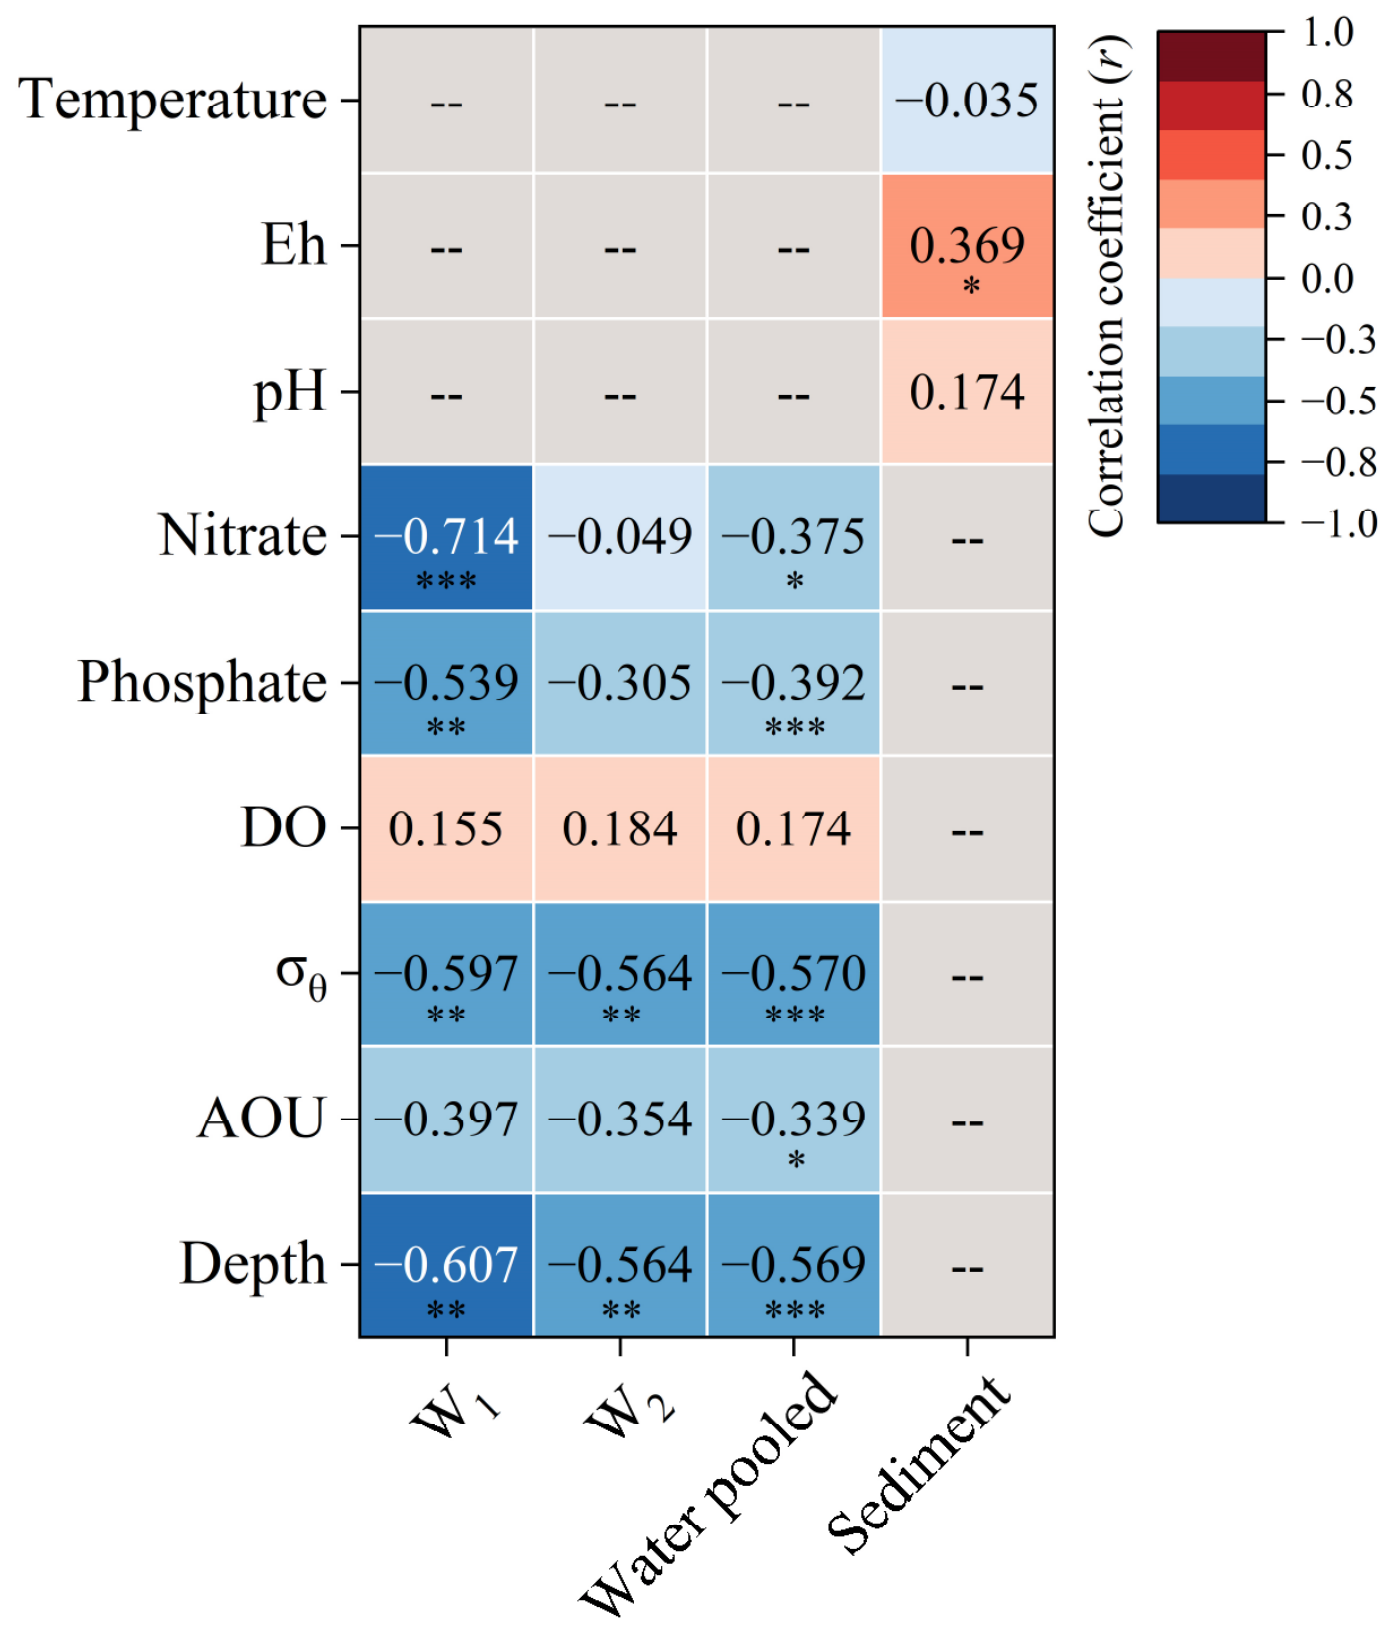
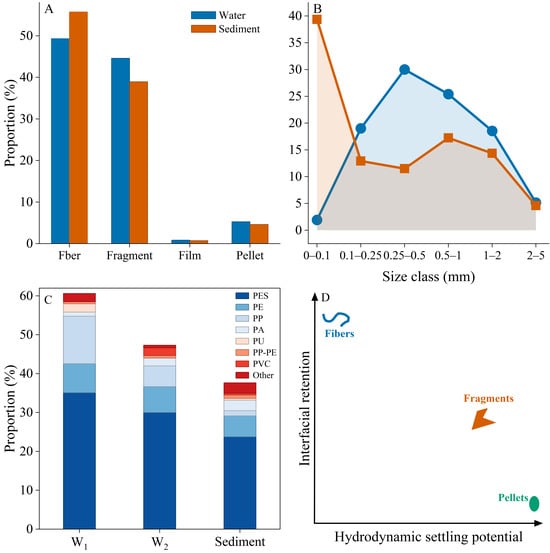
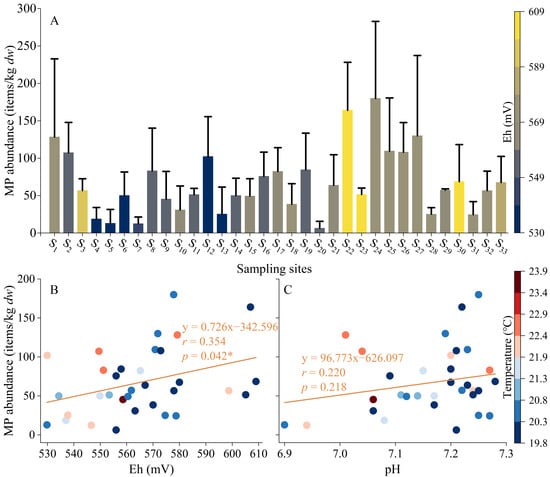
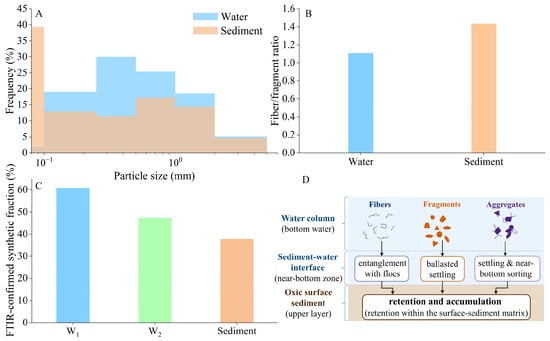
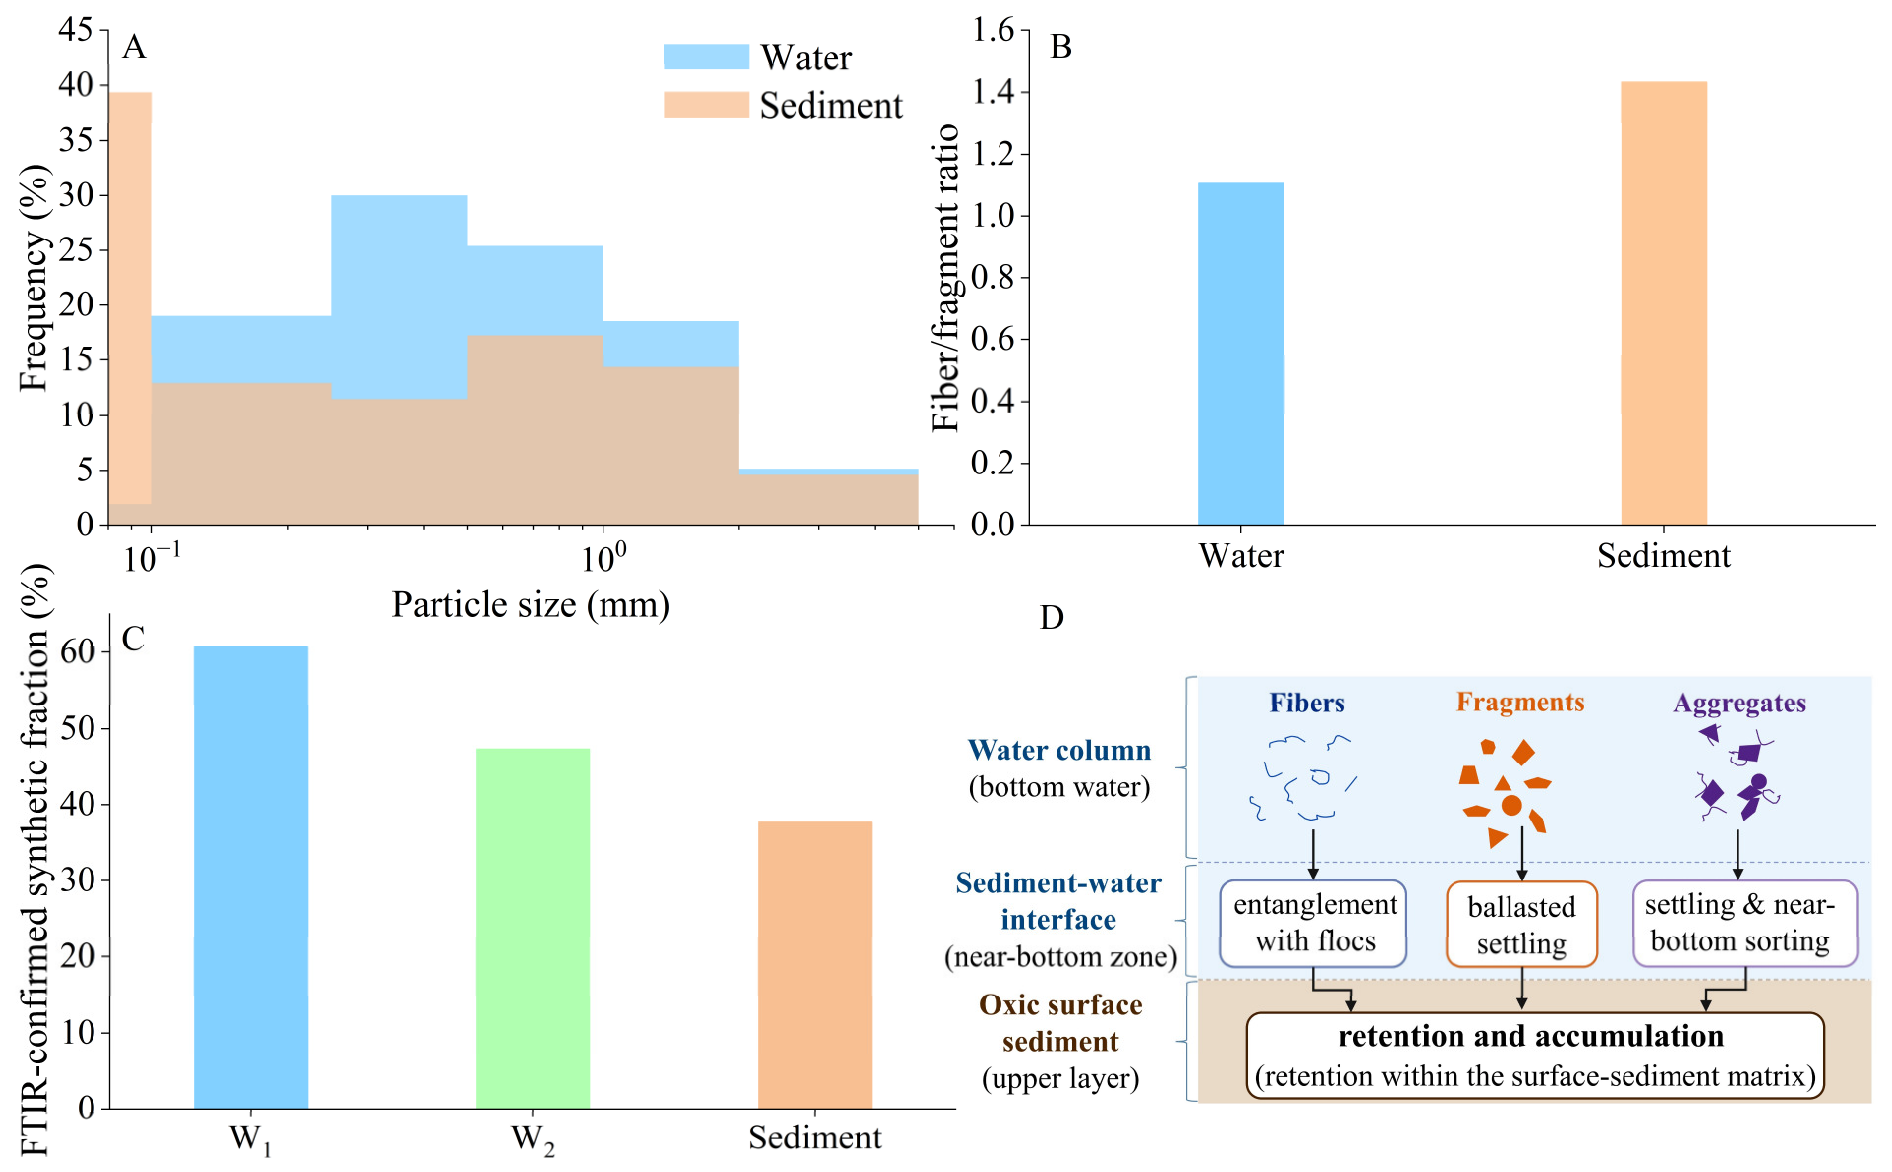
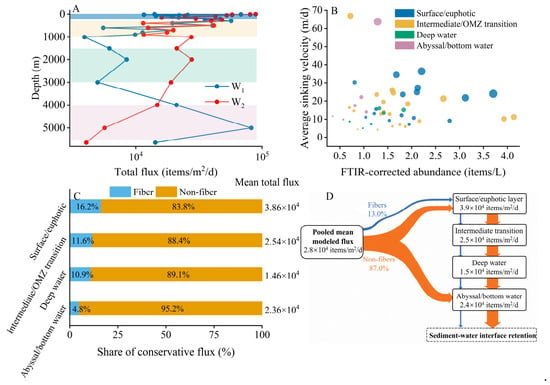
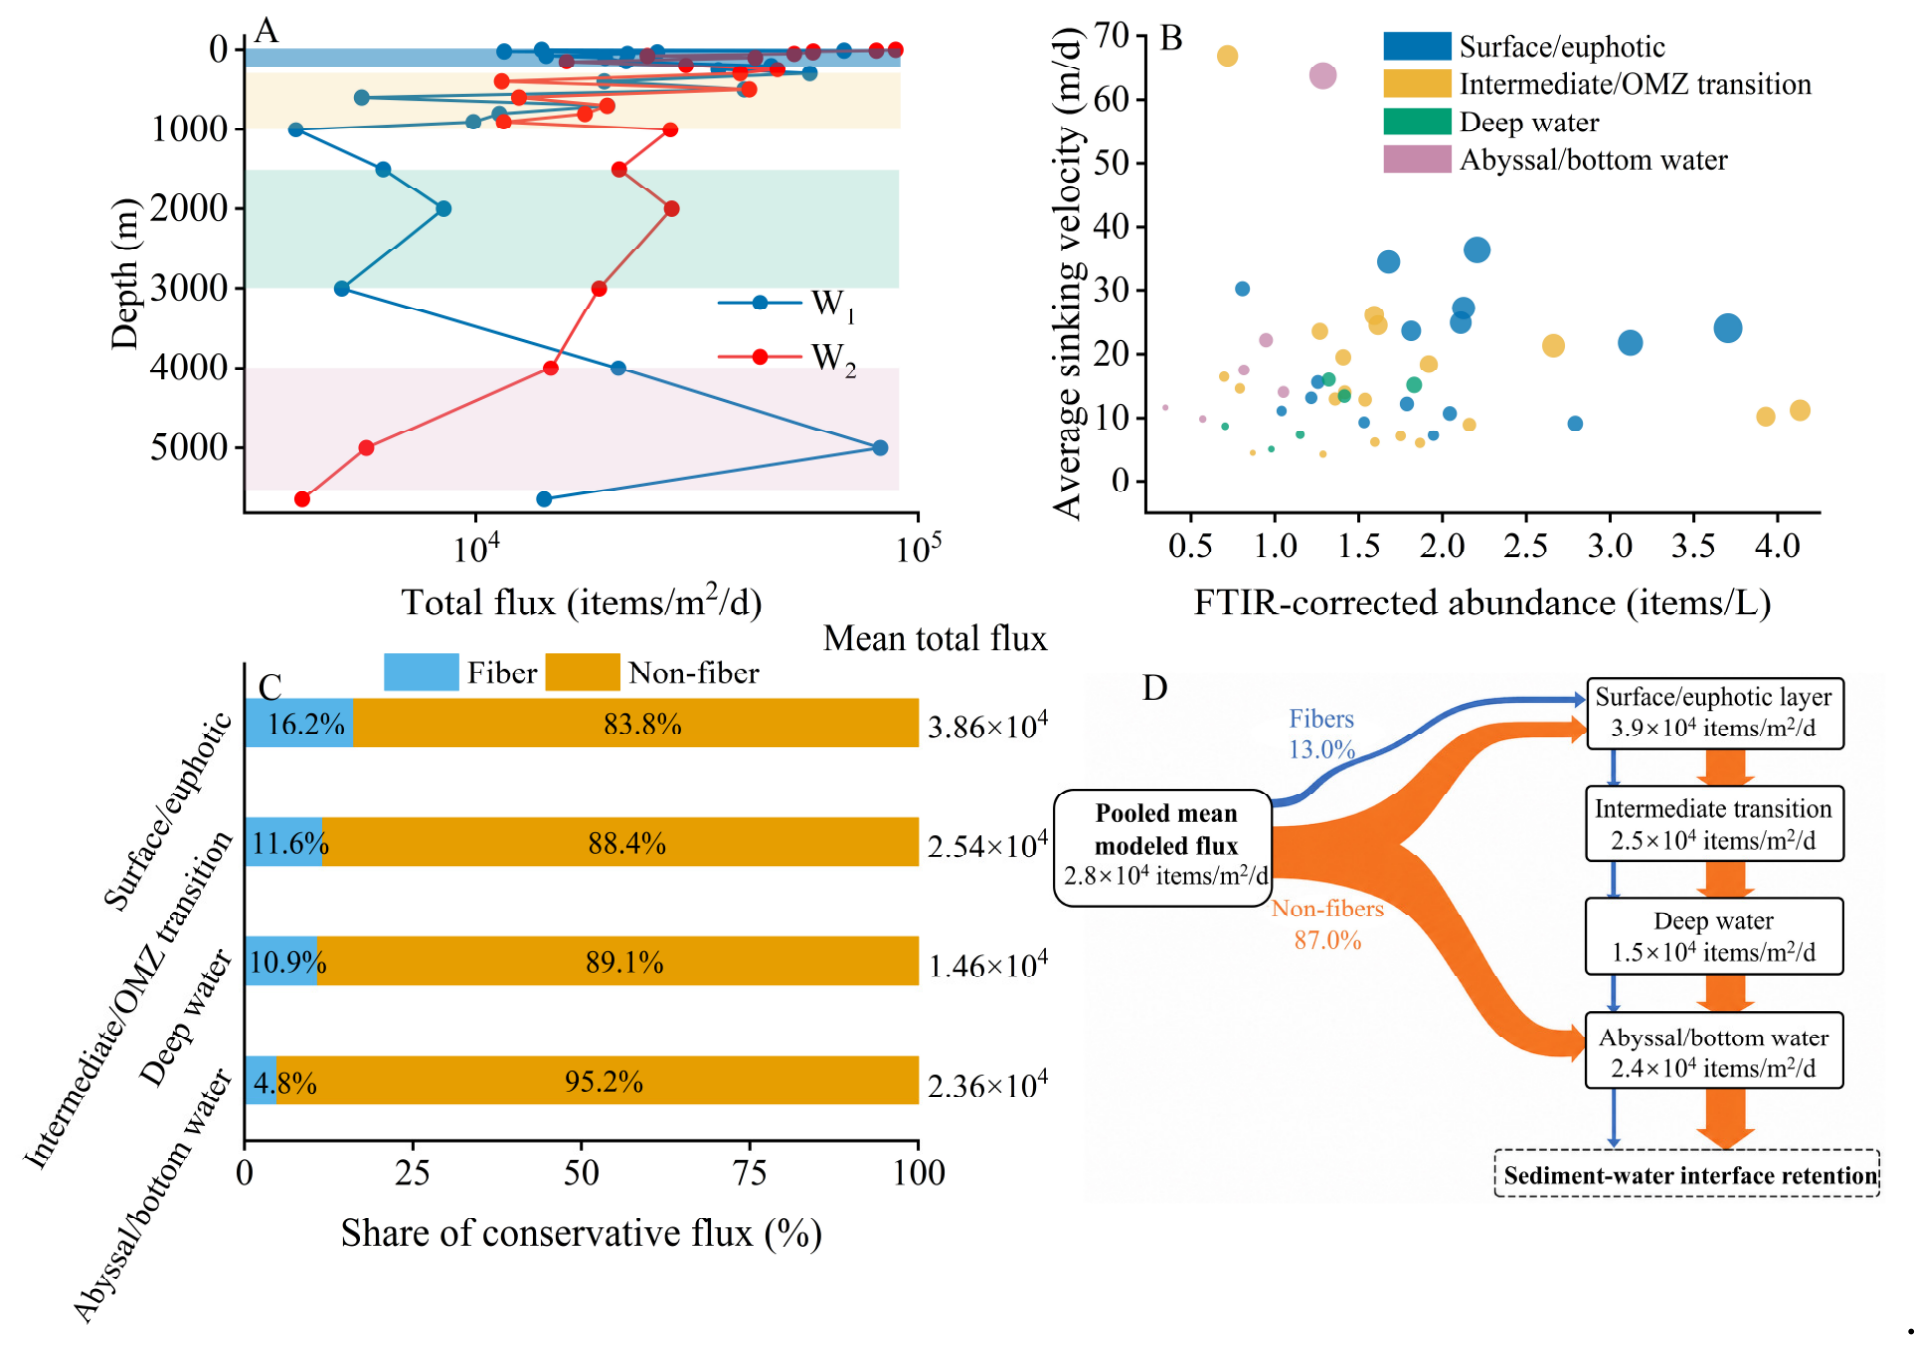

Disclaimer/Publisher’s Note: The statements, opinions and data contained in all publications are solely those of the individual author(s) and contributor(s) and not of MDPI and/or the editor(s). MDPI and/or the editor(s) disclaim responsibility for any injury to people or property resulting from any ideas, methods, instructions or products referred to in the content. |
© 2026 by the authors. Licensee MDPI, Basel, Switzerland. This article is an open access article distributed under the terms and conditions of the Creative Commons Attribution (CC BY) license.