


Abstract
Driven by global climate goals and stringent shipping decarbonization policies led by the International Maritime Organization (IMO) and the European Union, green alternative fuels have become a key pathway toward net-zero shipping. Life cycle assessment (LCA) is essential for quantifying the environmental performance of marine fuels and supporting fuel selection, policy making, and industrial deployment. However, existing studies still diverge in system boundary setting, emission factor selection, and methodological frameworks, leading to considerable discrepancies in reported fuel performance and constraining their large-scale deployment. This review synthesizes recent advances in the LCA of marine alternative fuels. It summarizes the physicochemical properties, energy conversion efficiency, propulsion configurations, and deployment status of mainstream options, including LNG, methanol, ammonia, hydrogen, biofuels, and battery power. It then outlines the standardized LCA framework for marine fuels, represented by the IMO 2024 Fuel LCA Guidelines and the well-to-wake (WtW) accounting framework. On this basis, it compares the environmental, economic, technical, and social performance of these fuels and discusses the major methodological debates and remaining challenges. Finally, it identifies future research priorities, including methodological standardization, integrated multidimensional assessment, and uncertainty analysis. These findings can inform the selection of shipping decarbonization pathways and further marine fuel LCA development.
1. Introduction
Climate change is currently one of the most pressing environmental challenges worldwide. According to the 2025 State of the Global Climate report, the atmospheric concentrations of major greenhouse gases such as carbon dioxide, methane, and nitrous oxide in 2024 all reached the highest levels in the past 800,000 years, and ocean heat content continued to reach new record highs [1]. The temperature control targets established by the Paris Agreement, “well below 2 °C and pursuing 1.5 °C,” are forcing accelerated decarbonization across global industries [2].
International shipping, owing to its advantages of low cost and large capacity, carries more than 80% of global merchandise trade by volume and is a backbone of global supply chains [3]. At the same time, shipping is a significant source of greenhouse gas and air pollutant emissions: according to the Fourth IMO GHG Study, global shipping greenhouse gas emissions were approximately 1.076 billion tonnes in 2018, accounting for 2.89% of total global anthropogenic emissions, and the trend continues to rise [4]. Ship emissions of sulfur oxides, nitrogen oxides, and fine particulate matter also damage coastal air quality and public health [5,6]. Promoting deep decarbonization of the shipping industry therefore has dual practical significance for addressing climate change and improving environmental health.
Shipping decarbonization requires a combination of technical, operational, and market-based measures [7,8,9]. Technical measures include improvements in material efficiency, hull and propulsion system design, alternative fuels, energy-saving devices, and waste-heat recovery [10,11,12,13]. However, individual energy efficiency measures generally offer limited emission-reduction potential and applicability across a restricted range of operating scenarios, making it difficult to meet long-term deep decarbonization needs. Operational measures comprise speed optimization, ship-size optimization, and shore power application, among which speed and route optimization have been widely studied [14,15]; speed optimization can reduce CO2 emissions by approximately 0–60%, and ship-size optimization by approximately 0–30%, both representing low-cost short-term decarbonization options [16,17,18]. Market-based measures, in turn, drive emission reductions through price signals such as carbon taxes and emissions trading. At the policy level, the shipping decarbonization policies led by the IMO and the EU have continued to tighten. The 2023 IMO GHG Strategy set the goal of achieving net-zero emissions by around 2050 [19], and regulatory requirements are progressively extending from traditional ship energy efficiency management toward life cycle emission accounting of fuels [20]. Regional regulatory systems such as the EU have in recent years continuously strengthened shipping decarbonization constraints and promoted the transition of marine fuels toward low life cycle greenhouse gas intensity [21], imposing higher requirements on the accurate quantification of alternative fuel emission reduction benefits. Among the aforementioned decarbonization pathways, alternative fuels are widely regarded as an important technical pathway for achieving deep shipping decarbonization and moving toward the 2050 net-zero emission goal. Currently, only about 8% of the gross tonnage of the global active fleet has alternative fuel operation capability, while alternative-fueled ships account for more than half of newbuild orders, indicating a marked industrial transition trend [22]. Nevertheless, there is still no consensus on the actual emission reduction benefits and life cycle economics of different alternative fuel pathways, highlighting the need for a standardized quantitative assessment framework.
In this context, life cycle assessment (LCA) has become an essential tool for quantifying the emission reduction benefits of alternative fuels and supporting fuel selection decisions. LCA follows the international standards ISO 14040 and ISO 14044 and systematically quantifies the resource consumption and environmental impacts of a product throughout its life cycle, from raw material acquisition to final disposal, through the four phases of goal and scope definition, inventory analysis, impact assessment, and interpretation [23,24]. The marine fuel field generally adopts the “well-to-wake” (WtW) analysis framework, which divides the fuel chain into the upstream well-to-tank (WtT) stage and the onboard tank-to-wake (TtW) stage, with fuel bunkering as the demarcation point; the specific framework is shown in Figure 1 [25,26,27].
Figure 1.
General well-to-wake life cycle framework of marine fuels.
Considerable work has been conducted on the LCA of marine alternative fuels, but methodological divergences remain in accounting boundary setting, emission factor selection, and system boundary expansion. Among published reviews of marine alternative fuels, Wang et al. [28] systematically reviewed methodological frameworks and case studies, providing an important reference for this field. Jin et al. [29] reviewed sustainable shipping decarbonization pathways from the perspective of hydrogen and ammonia fuels. Park et al. [30] comprehensively reviewed the deployment of renewable energy technologies in shipping. However, these reviews still provide insufficient discussion of how propulsion technology types, energy conversion efficiency, multidimensional sustainability, and ship-route scenario applicability change LCA conclusions. Carvalho et al. [31] further pointed out that marine fuel LCA still lacks unified standards in key methodological aspects such as system boundaries, functional units, and emission factor selection. On the basis of existing reviews, this review highlights the interactions among fuel pathways, propulsion technologies, energy conversion efficiency, ship characteristics, and operating conditions, mainly in three aspects. First, it constructs a multidimensional comprehensive evaluation framework integrating environmental, economic, technical, and social dimensions and provides scenario-specific guidance for fuel selection across different ship types and operating conditions. Second, taking the IMO 2024 Fuel LCA Guidelines as a reference, it systematically reviews key methodological controversies, including system boundaries, functional units, emission factors, coproduct allocation, and accounting paradigms, and how these methodological choices affect reported findings. Third, it analyzes the methodological sources of divergent findings and identifies future research directions in light of the latest regulatory frameworks and industrial practices. This narrative review primarily draws on recent peer-reviewed LCA studies of marine alternative fuels and uses IMO and EU regulations, technical guidance, and industry reports as contextual sources. Representative studies are prioritized when they specify system boundaries, functional units, fuel-production pathways, or ship application scenarios; their results are interpreted by fuel pathway, propulsion system, and ship/route context. Differences in boundaries and functional units, and whether inputs are measured or modeled, are treated as limits on direct numerical comparison and on the strength of cross-study conclusions.
The subsequent structure of this review is as follows: Section 2 reviews the policy evolution of shipping decarbonization and summarizes the technical characteristics and deployment status of mainstream alternative fuels from the perspectives of production, storage and transport, and ship application. Section 3 elaborates the methodological framework of marine fuel LCA, along with commonly used databases and tools. Section 4 compares and analyzes the main conclusions and divergences of existing research from the four dimensions of environmental impact, economics, technological maturity, and social effects. Section 5 summarizes the key conclusions, identifies key limitations in the existing literature, and outlines priorities for future research.
2. Shipping Decarbonization and Alternative Fuels
2.1. Policy Evolution of Shipping Decarbonization
The International Maritime Organization (IMO) has progressively built a regulatory framework covering ship design, operational management, and fuel supply across the whole chain, with policy constraints gradually evolving from “ship energy efficiency management” toward “life cycle fuel management.”
In 2011, the IMO adopted the Energy Efficiency Regulations, incorporating the Energy Efficiency Design Index (EEDI) and the Ship Energy Efficiency Management Plan (SEEMP) into Annex VI of the MARPOL Convention and establishing, for the first time, mandatory energy efficiency requirements for ships; the VLCC field study by Ashry et al. [32] verified their emission reduction effects. EEDI sets a carbon emission baseline per unit of transport work for newbuildings, tightened progressively in phases (10% in Phase 1, 20% in Phase 2, and differentiated by ship type in Phase 3, up to 50%) [33]. SEEMP targets operational ships, monitoring and optimizing actual operational energy efficiency through the Energy Efficiency Operational Indicator (EEOI) [34].
In 2018, the IMO released the Initial IMO Strategy on Reduction of GHG Emissions from Ships, for the first time setting long-term decarbonization goals for shipping, and the promotion and application of alternative fuels has since become a key direction [4]. In 2021, the IMO introduced the Energy Efficiency Existing Ship Index (EEXI) and the Carbon Intensity Indicator (CII), implemented from 2023, extending energy efficiency management from newbuildings to all operational ships [35]. In 2023, the IMO adopted the 2023 IMO Strategy on Reduction of GHG Emissions from Ships. Relative to 2008, it calls for annual GHG emissions from international shipping to fall by at least 20% by 2030 (striving for 30%) and by at least 70% by 2040 (striving for 80%), with net-zero emissions around 2050 [19].
In 2024, the IMO released the 2024 Guidelines on Life Cycle GHG Intensity of Marine Fuels (MEPC.391(81)). The guidelines define accounting boundaries and methods from raw material extraction to onboard use, providing a common basis for assessing the life cycle GHG intensity of marine fuels [20]. The evolution of global and regional shipping decarbonization policies is shown in Figure 2.
Figure 2.
Evolution timeline of global IMO and EU shipping decarbonization policies (schematic, not to scale).
Beyond global unified rules, the EU has introduced regionally binding policies, taking the lead in establishing an emissions monitoring and reporting system for ships calling at its ports through the Ship Monitoring, Reporting and Verification (MRV) regulation [21]. In 2023, the EU formally legislated to include shipping in the EU ETS, implemented in phases from 2024, levying carbon charges on ships calling at EU ports according to their emissions. In the same year, the FuelEU Maritime regulation was adopted, mandating a year-by-year reduction in the life cycle greenhouse gas intensity of marine fuels, and this regulation was officially implemented in 2025 [21].
The large-scale application of marine alternative fuels is one of the key pathways for achieving net-zero emissions in shipping. This review defines alternative fuel pathways into four categories according to carbon source and energy source: fossil-based without carbon capture (gray), fossil-based with carbon capture (blue), renewable-electricity-based (green), and biomass-based (bio). Different alternative fuels differ significantly in production pathways, physical properties, storage and transport methods, and marine propulsion configurations; these differences fundamentally determine fuel selection and life cycle assessment results [28]. This section reviews the technical characteristics and deployment status of major marine alternative fuels from three perspectives: fuel classification and production, storage and transport systems, and marine propulsion.
2.2. Liquefied Natural Gas (LNG)
Marine LNG can be divided into three categories by carbon source and production method: fossil LNG, bio-LNG, and e-LNG, whose classification is shown in Figure 3.
Figure 3.
Classification and production pathways of marine LNG fuel.
2.2.1. Fossil-Based LNG
LNG is a cryogenic liquefied fuel with methane as the main component (boiling point of −162 °C). Fossil-based LNG is currently the main source of LNG supply, and its production covers extraction, pretreatment, transport, liquefaction, and storage and distribution, among which the liquefaction stage accounts for a relatively high proportion of the total energy consumption of natural gas production [28,36]. As of the end of 2023, 1760 alternative-fueled ships were in operation worldwide, of which 1070 were LNG-powered, and 273 ports worldwide were equipped with LNG bunkering facilities [22].
A major advantage of LNG as a marine fuel is the near elimination of SOx emissions, with NOx emissions also substantially reduced and CO2 emissions approximately 25% lower than those of conventional fuels [37]. However, a key challenge associated with LNG is methane slip. Lindstad and Rialland [38] reported methane slip of up to 5.3 g/kWh during the operation of low-pressure dual-fuel (Otto-cycle) four-stroke LNG engines on cruise ships. Slip can increase substantially below 50% power, whereas it is almost zero for high-pressure dual-fuel (Diesel-cycle) engines. The life cycle GHG performance of LNG depends strongly on the engine technology type and methane-slip control level, and the emission reduction performance of different technology pathways differs markedly [38,39].
In addition, the management of boil-off gas (BOG) in LNG storage and transport cannot be neglected. The daily boil-off rate of LNG carriers is approximately 0.15%, and the boil-off gas can be handled by three methods: engine utilization, re-liquefaction, or gas combustion unit (GCU) [37]. The LCA study by Hwang et al. [40] of an LNG-powered bulk carrier further shows that methane slip weakens the TtW emission reduction performance of LNG; when the LNG transport distance is extended from 11,612 km (Qatar) to 17,650 km (United States), the share of upstream supply chain emissions rises from 15.7% to 18.4%.
2.2.2. Bio-Based LNG (Bio-LNG)
Bio-LNG is a renewable LNG pathway based on biogenic carbon. Biogas is purified and upgraded to biomethane with a methane content above 95%, then cryogenically liquefied; purification removes impurities such as CO2 and H2S. Feedstocks include agricultural residues, municipal organic waste, sewage sludge, and landfill gas [28]. Because its physical properties are identical to those of fossil LNG, bio-LNG can directly rely on existing LNG storage, transport, and bunkering infrastructure. Moreover, because the feedstock is biomass waste and the CO2 released during combustion originates from atmospheric carbon absorbed during biomass growth, bio-LNG offers substantial life cycle GHG emission reduction potential when sustainable biomass feedstocks are used. However, the large-scale supply of bio-LNG is limited by the availability of sustainable biomass resources, the instability of biogas yields, and the energy consumption and cost of the purification and liquefaction stages; current global production is far from meeting the demand of the shipping industry [28], and its application is mainly confined to regions rich in biomass resources.
2.2.3. E-LNG
E-LNG is produced by using renewable electricity to electrolyze water into hydrogen, which then reacts with captured CO2 through methanation to synthesize methane, followed by liquefaction. Because the CO2 consumed in the production process and the CO2 emitted in combustion can theoretically form a closed loop, e-LNG has significant carbon-neutral potential. However, e-LNG still faces severe challenges. Although the multi-step conversion of methanation and liquefaction can reduce life cycle carbon emissions to 10–20% of conventional fuels, the energy input is far higher than that of fossil fuel pathways [41]. The current production cost is about three times that of fossil LNG [42]. The study by Maloberti et al. [42] on the LNG-electric hybrid power of a small passenger ship shows that the life cycle GHG emissions of e-LNG are approximately 78–83% lower than those of fossil LNG.
2.3. Methanol
Marine methanol can be divided into two categories by production method: industrial methanol and green methanol (biomass methanol, e-methanol), whose classification is shown in Figure 4.
Figure 4.
Classification and production pathways of marine methanol fuel.
2.3.1. Industrial Methanol
Industrial methanol is mainly produced by catalytic synthesis from syngas obtained through natural gas reforming or coal gasification; about 78% of the world’s methanol is produced in China from coal [28]. The LCA study by Wang et al. [43] of a superyacht shows that the life cycle GHG emissions of industrial methanol produced from natural gas or coal are higher than those of conventional marine diesel.
2.3.2. Bio-Methanol
Bio-methanol is produced from biomass through gasification or anaerobic fermentation to obtain syngas, followed by catalytic synthesis. Depending on the feedstock and process, bio-methanol has substantial GHG emission reduction potential when sustainable biomass feedstocks are used [43,44]. Adami and Figari [45] reported that green methanol (including bio-methanol) can achieve significant life cycle GHG emission reductions. However, methanol has only about 40% of diesel’s volumetric energy density. For the same endurance, it requires approximately 2.1 times the tank volume, and newbuild designs may lose about 8% of cargo-hold capacity.
2.3.3. E-Methanol
E-methanol is produced by using renewable electricity to electrolyze water into hydrogen, which is then catalytically synthesized with captured CO2. The evaluation of a 60 m yacht methanol conversion scheme by Basciu et al. [46] and the study by Lindstad et al. [47] both show that the life cycle GHG emissions of e-methanol can be substantially reduced compared with conventional fuels. However, large-scale e-methanol production faces two constraints. Electrolysis, CO2 capture, and methanol synthesis require far higher energy input and production costs than fossil fuel pathways [41]. Green carbon sources from biomass or direct air capture (DAC) are also scarce and costly.
2.3.4. Storage, Transport, and Marine Application of Methanol
Methanol is liquid at ambient temperature and pressure, has good compatibility with existing fuel storage and transport infrastructure, and can be transported by liquid container, tank truck, or chemical tanker. Dual-fuel engines are the mainstream marine propulsion configuration for methanol; the MAN (now Everllence) B&W ME-LGIM methanol dual-fuel engine has achieved commercial application, with a methanol energy substitution ratio of up to 95% [43]. Statistics by Adami et al. [45] show that global methanol-powered ships (including those in operation and on order by 2028) have reached 230. Methanol combustion produces almost no SOx, with NOx emissions about 60% lower than those of diesel and particulate matter about 95% lower than that of heavy fuel oil [46]. However, attention should be paid to the toxicity and corrosiveness of methanol: storage tanks and engine fuel systems need stainless steel or silicate coating protection, and inert gas protection and double-walled piping are required [45].
2.4. Ammonia
Marine ammonia can be divided into three categories by hydrogen source: gray ammonia, blue ammonia, and green ammonia, whose classification is shown in Figure 5.
Figure 5.
Classification and production principle of marine ammonia fuel.
2.4.1. Gray and Brown Ammonia (Fossil-Based)
Ammonia (NH3) contains no carbon and therefore produces no CO2 during combustion, making it a promising carbon-free fuel at the point of use. Conventional ammonia synthesis adopts the Haber-Bosch process, using natural gas (gray ammonia) or coal (brown ammonia) as feedstock, with hydrogen produced by steam methane reforming followed by catalytic synthesis with nitrogen. The LCA study by Wang et al. [48] across multiple ship types shows that the upstream production stage of gray and brown ammonia has substantial carbon emissions; global ammonia production is substantial and currently relies mainly on fossil feedstocks such as natural gas and coal [48,49]. The parametric trend LCA (PT-LCA) study by Chalaris et al. [49] of eight ammonia production pathways shows that the WtW emissions of gray ammonia are higher than those of conventional marine diesel and provide no GHG emission reduction benefit.
2.4.2. Blue Ammonia (Fossil-Based with CCS)
Blue ammonia adds carbon capture and storage (CCS) equipment downstream of the conventional SMR hydrogen production process, capturing and storing the CO2 generated during hydrogen production [50]. The study by Wang et al. [48] shows that blue ammonia can significantly reduce upstream carbon emissions through carbon capture and storage. The life cycle sustainability assessment (LCSA) by Al-Yafei et al. [50] of the 1.2 million t/y blue ammonia project in Qatar shows that the ammonia synthesis reactor contributes 55.9% of GWP and 38.7% of energy consumption, and the transport stage contributes up to 46.5% to the sensitivity of carbon emissions.
2.4.3. Green Ammonia/E-Ammonia
Green ammonia (e-ammonia) uses renewable electricity to electrolyze water into hydrogen, which is then synthesized with nitrogen from air separation through the Haber-Bosch process [47,48]. The study by Wang et al. [48] shows that green ammonia can achieve near-zero carbon emissions when renewable electricity is used for hydrogen production. Large-scale green ammonia demonstration projects are being accelerated worldwide, such as the Yara Porsgrunn project in Norway [29]. However, the life cycle carbon emissions of green ammonia are also constrained by the multi-step conversion of electrolysis and synthesis, and its energy input is markedly higher than that of fossil fuel pathways [41].
2.4.4. Storage, Transport, and Marine Application of Ammonia
The liquefaction conditions of ammonia are relatively mild, with a volumetric energy density of about 11.7 MJ/L [48]. Ammonia can be transported by liquefied gas tank trucks, pipelines, or ammonia carriers [50]. Ammonia is highly toxic and corrosive, imposing strict requirements on storage and transport materials. Low-temperature carbon steel or composite tank bodies are required, together with gas detection, ventilation, and emergency handling systems [48,51].
- The main ammonia propulsion options include the ammonia-diesel dual-fuel engine, which is currently the mainstream configuration; the MAN (now Everllence) B&W ME-LGIA ammonia dual-fuel engine can achieve an ammonia energy substitution ratio of 95%, and an SCR system is required to meet the IMO Tier III NOx requirements [48,49]. The computational analysis by Serrano et al. [52] shows that, after optimizing injection timing and spray configuration, the indicated efficiency of the ammonia engine can be 0.6% higher than that of the pure diesel mode, with CO2 emissions reduced by about 95%.
- The theoretical efficiency of ammonia solid oxide fuel cells (SOFC) can reach 50%, but the technology readiness level is only TRL 3–4, making it difficult to meet ship propulsion needs in the short term [29].
Ammonia combustion faces three major technical challenges:
- N2O emissions: the GWP (100-year) of N2O is 273 times that of CO2, and N2O emissions can reach 1.8 g/kWh under non-optimized conditions [29];
- NOx emissions: an SCR system is required to achieve Tier III compliance [48];
- Ammonia slip can reach 143 g/kWh at a 90% substitution ratio, requiring combined post-treatment with ammonia slip catalysts (ASC) and SCR [29]. The study by Bayer et al. [53] on an ammonia-hydrogen blended fuel engine in a tugboat shows that the upper limit of the ammonia substitution ratio in dual-fuel engines is about 50%; excessive ammonia proportions significantly worsen N2O and ammonia slip, and hydrogen (about 24% energy share) is a more favorable auxiliary fuel. As of the end of 2025, global ammonia-fueled ship orders reached 144 (59 confirmed), with another 302 ammonia-ready vessels [29].
2.5. Hydrogen
Marine hydrogen can be divided into three categories by production method: gray hydrogen, blue hydrogen, and green hydrogen, whose classification is shown in Figure 6.
Figure 6.
Technical framework of marine hydrogen fuel. Source: adapted from Ref. [29].
2.5.1. Fossil-Based Hydrogen (Gray/Blue)
The lower heating value per unit mass of hydrogen (H2) is as high as 120 MJ/kg, nearly three times that of conventional diesel, but its volumetric energy density is extremely low. About 76% of global hydrogen is produced through natural gas steam methane reforming (SMR) (gray hydrogen) [29], a process accompanied by substantial GHG emissions [37,54]. The life cycle emission assessment of global shipping alternative fuels by Gilbert et al. [55] shows that gray hydrogen (SMR without CCS) has higher emissions than marine diesel. Blue hydrogen, by adding CCS equipment downstream of SMR, can reduce the carbon intensity by 85–95%, down to 0.8–4.8 kg CO2-eq/kg H2 [29].
2.5.2. Green Hydrogen/E-Hydrogen
Green hydrogen (e-hydrogen) is produced directly by water electrolysis using renewable electricity and is one of the key pathways for achieving deep decarbonization of ships. Electrolysis technologies mainly include alkaline water electrolysis (AWE) and proton exchange membrane water electrolysis (PEMWE): AWE is technologically mature and low cost, but poorly adapts to the variability of renewable electricity; PEMWE responds quickly, has high current density and high hydrogen purity, but requires expensive Pt/Ir precious metal catalysts [29]. The carbon footprint study by Evers et al. [56] of inland hydrogen-powered ships shows that the PEMFC pathway powered by wind energy has a relatively low carbon footprint. The cross-scenario comprehensive analysis by Lindstad et al. [47] further confirms that, under 100% renewable electricity conditions, e-hydrogen offers substantial WtW GHG emission reduction potential. However, the large-scale application of green hydrogen is limited by the energy losses of multi-step conversion, with relatively low energy efficiency and high production costs [41].
2.5.3. Hydrogen Storage and Transport
The storage and transport of hydrogen is a key technical bottleneck constraining its marine application; the main technology pathways currently include the following three:
- Compressed gaseous hydrogen (CGH2): hydrogen is compressed to 350–700 bar and stored in composite gas cylinders. At 700 bar, the volumetric energy density is about 4.6–5.0 MJ/L, only about one-quarter of LNG, requiring 4.2 times the tank volume of LNG [29].
- Cryogenic liquid hydrogen (LH2): hydrogen is cooled to −253 °C for storage in liquid form, and the liquefaction process consumes about one-third of the energy content of hydrogen [54]. The volumetric energy density of liquid hydrogen is about 7.6–8.5 MJ/L, significantly higher than that of compressed hydrogen, but still only 36–40% of LNG [29]. A major challenge in liquid-hydrogen storage and transport is boil-off loss: a daily boil-off rate of about 0.15–1% of tank capacity requires re-liquefaction or boil-off gas recovery systems [29,37]. The assessment by Arabnejad et al. [57] reports modeled maximum fuel volumes per voyage for a Baltic Sea RoRo case: 430 m3 of LH2 and 84.09 m3 of pilot MDO in the dual-fuel configuration, compared with 134.29 m3 of MDO in the single-fuel configuration. The LH2 volume alone is about 3.2 times this reference; including pilot MDO gives 514.09 m3 in total, about 3.8 times the reference (ratios calculated from the reported volumes). These modeled fuel requirements inform tank-capacity estimates; they are not measured installed tank volumes or a general range across ship types or tank designs.
- Liquid organic hydrogen carriers (LOHC): LOHC store hydrogen in ambient-temperature, ambient-pressure liquid organic compounds through chemical bonding, are compatible with existing fuel infrastructure and have high safety, with a volumetric hydrogen storage density of about 47.1 kg H2/m3; however, the dehydrogenation process requires additional energy input and the system weight is large [29].
In hydrogen transport, pipeline transport is the most efficient mode, with a carbon footprint of only about 0.2 kt CO2, almost independent of transport distance, whereas the carbon emissions of tank truck transport increase significantly with distance [56]. For transoceanic hydrogen trade, the study by Evers et al. [56] shows that maritime transport of liquid hydrogen is superior in overall carbon footprint to the pathway of ammonia synthesis, transport, and on-site cracking for hydrogen release, because the additional energy losses of the latter offset the advantages of ammonia storage and transport convenience.
2.5.4. Hydrogen Internal Combustion Engines
Hydrogen internal combustion engines (HICE) have a technology readiness level of about TRL 5–6, can be retrofitted based on existing engine platforms, but face technical difficulties such as NOx formation, backfire, and hydrogen embrittlement, with relatively low efficiency (15–34%) [29].
Marine HICE designs include spark-ignition engines that operate on hydrogen alone and compression-ignition dual-fuel engines that use a small diesel or biodiesel pilot to initiate combustion. Pure-hydrogen combustion releases no fuel-derived CO2, whereas the pilot fuel contributes to the dual-fuel engine’s ship-end emissions. High flame temperatures may generate NOx. Combustion optimization, water injection, and selective catalytic reduction are among the control measures discussed in the reviewed literature [29].
2.6. Biofuels
Marine biofuels can be divided into FAME, HVO, bio-methanol, bio-LNG, and HTL biofuels by feedstock and process, whose classification is shown in Figure 7.
Figure 7.
Classification and application features of marine biofuels.
2.6.1. Classification and Production of Biofuels
Biofuels refer to liquid or gaseous fuels derived from renewable biomass feedstocks and are one of the low-carbon alternatives with the greatest potential for scaled deployment in the shipping industry in the short to medium term. According to feedstock and process differences, marine biofuels are mainly divided into the following categories [44,58]:
- Fatty acid methyl ester (FAME) biodiesel: produced from vegetable oil, waste cooking oil, or animal fats through transesterification. FAME can be blended with conventional marine fuels and is currently the most mature biofuel pathway. Stathatou et al. [59] tested a B50 blend of used-cooking-oil (UCO) FAME biodiesel and marine gas oil (MGO) aboard an ocean-going dry bulk carrier. They reported no operational issues and approximately 50% lower sulfur dioxide (SO2) emissions than with low-sulfur MGO.
- Hydrotreated vegetable oil/hydrotreated esters and fatty acids (HVO/HEFA): produced from vegetable oil or waste oils through hydrodeoxygenation. HVO, being paraffinic in structure and free of sulfur and oxygen, with a high cetane number and low aromatic content, can directly substitute diesel at 100% (drop-in fuel) without engine modification and possesses significant GHG emission reduction potential. The high-level emission reduction routes using waste oils are particularly effective [60].
- Bio-methanol: see Section 2.3.2 for its biomass-based production pathway.
- Bio-LNG: produced by purifying and liquefying biogas.
- Hydrothermal liquefaction (HTL) biofuels: produced from high-moisture organic wastes (such as sewage sludge and algae) through direct conversion into bio-crude at high temperature and pressure, followed by refining; this is an advantageous pathway for treating wet wastes. The comparative study by Masum et al. [44] of 11 biofuel pathways shows that the HTL pathway offers substantial GHG emission reduction potential.
The study by Kim et al. [58] of Korean purse seine fishing vessels shows that bio-LPG produced from waste cooking oil has significant life cycle GHG emission reduction potential.
2.6.2. Storage and Transport of Biofuels
The storage and transport characteristics of biofuels vary by product type:
- FAME biodiesel and HVO are liquid at ambient temperature and pressure, fully compatible with diesel storage and transport infrastructure, and can use existing tanks, pipelines, and bunkering facilities without special modification [59,60]. The analysis by Otsason et al. [60] shows that the tank volume of HVO can even be slightly reduced compared with MDO, making it one of the most convenient alternative fuels in storage and transport.
- Bio-LNG needs to be liquefied and stored at −162 °C, with storage and transport requirements identical to those of fossil LNG; double-walled vacuum-insulated tanks and boil-off gas management systems are indispensable; the volumetric tank demand of biomethane is 353% higher than that of MDO [60].
However, it should be noted that FAME has high viscosity and poor cold-flow performance, posing challenges in storage and transport that require corresponding treatment measures [60].
2.6.3. Marine Application of Biofuels
A major advantage of biofuels in marine propulsion is their “engine compatibility”-most liquid biofuels (HVO, FAME blends) can be directly used in existing marine diesel engines and boilers without major modification. The comparative assessment by Otsason et al. [60] shows that both HVO and biomethane have emission reduction potential, with biomethane having the most prominent reduction effect.
However, the large-scale application of biofuels faces a fundamental constraint: the sustainable supply limit of feedstocks. The total global sustainable biomass resources are far from meeting all the replacement demand of the shipping industry, and there are significant competitive relationships with food security and land use change [28,44]. First-generation biodiesel based on food crops is affected by the indirect land use change (ILUC) emission effect, and the actual GHG emission reduction benefits may be overestimated or even reversed [44].
2.7. Electrified and Hybrid Propulsion Systems
Marine electrified and hybrid propulsion can be divided into battery-electric, fuel cell, and hybrid configurations, whose classification is shown in Figure 8.
Figure 8.
Classification and system architecture of marine electrified and hybrid propulsion systems.
2.7.1. Battery-Electric Propulsion
Lithium-ion batteries are currently the dominant battery technology for marine battery-electric propulsion, with advantages of relatively high gravimetric energy density (about 150–250 Wh/kg), long cycle life (more than 8000 cycles), and high charge/discharge efficiency (about 94% at system level) [30,61]. All-electric ships achieve zero tailpipe emissions during the operation stage and are suitable for fixed-route scenarios such as short-sea ferries, harbor tugboats, and inland waterway vessels [30]. The LCA analysis by Jeong et al. [62] of an all-electric ferry and the study by Kim et al. [63] of a zero-emission tugboat both show that battery-electric options have substantial life cycle GHG emission reduction benefits, with the actual reduction magnitude highly dependent on the carbon intensity of the charging electricity grid.
However, the promotion of battery power in the shipping sector faces many challenges. The volumetric energy density of batteries is far lower than that of liquid fuels (lithium-ion batteries about 0.9–1.8 MJ/L vs. diesel about 35.9 MJ/L), making the required battery volume and weight impractical for large ocean-going vessels [61]. Battery system costs remain high; marine lithium battery packs cost about 500–791 USD/kWh [63,64]. In a life cycle cost analysis of 27 short-sea ferries in Scotland, Hwang et al. [64] found a significantly higher total levelized cost of energy for pure-battery ferries than for diesel ferries. Battery purchase and replacement were the main contributors: the model assumed a battery life of about 10 years and two replacements over a 25-year ship lifetime. In addition, insufficient high-power shore charging facilities, battery thermal runaway safety risks, and the environmental impact of battery retirement and disposal are also important factors constraining the large-scale application of battery power [30,61].
2.7.2. Fuel Cell Propulsion
Fuel cells are not limited by the Carnot cycle efficiency, and their theoretical efficiency is far higher than that of internal combustion engines. Marine fuel cells mainly include the following two categories:
- Proton exchange membrane fuel cells (PEMFC): fueled by pure hydrogen, operating at 80–100 °C, with small size, light weight, and quick start/stop, and are currently the most suitable fuel cell type for marine propulsion [37]. The power generation efficiency of PEMFC can reach 50–60% [29,36], far higher than that of internal combustion engines [63]. The number of hydrogen-fueled ships in operation worldwide is still small (fewer than ten as of 2026, with about 30 more on order), and most of them adopt PEMFC. The comparative study by Hwang et al. [64] further shows that the total cost of the pure hydrogen fuel cell system is significantly lower than that of the all-battery system, while the hybrid configuration combining hydrogen fuel cells with battery assistance is the most cost-effective of the options evaluated. Kim et al. [63] assumed a PEMFC unit cost of USD 1000/kW and a service life of 31,500 h in their life-cycle cost model for a South Korean tug; these are model inputs rather than measured shipboard outcomes.
- Solid oxide fuel cells (SOFC): operating at 500–1000 °C, with good fuel flexibility, capable of directly using LNG, ammonia, methanol, and other multiple fuels through internal reforming without external hydrogen production; the high-temperature exhaust is suitable for waste heat recovery, further improving the overall system efficiency [29]. Lee et al. [65] modeled an SOFC and energy-storage hybrid using operating data from a 174,000 m3 LNG carrier. Under an assumed SOFC degradation rate of 0.5% per 1000 h, the stack would require replacement after approximately seven years; the modeled WtW benefit partly reflects the absence of methane slip in LNG-fueled SOFC operation.
The LCA study by Lee et al. [37] of a 170 GT coastal ferry shows that hydrogen fuel cells (green hydrogen pathway) are significantly superior to diesel and LNG in multiple environmental impact categories, including acidification, eutrophication, photochemical oxidation, and particulate matter. The LCA by Fernández-Ríos et al. [66] of multiple hydrogen propulsion options further confirms that PEMFC combined with renewable-electricity-based hydrogen production has the lowest life cycle environmental impact among all options.
2.7.3. Energy Storage Systems and Battery Integration
In hybrid propulsion architectures, lithium-ion battery energy storage systems (ESS) work in coordination with power generation devices (diesel engines, gas engines, or fuel cells), playing a key role in “peak shaving”. At low-load conditions, the engine charges the battery. At high-load or maneuvering conditions, the battery supplements the output power, thereby optimizing the engine operating range and reducing fuel consumption and emissions [61]. The tugboat optimization study by Kim et al. [63] shows that the all-battery configuration (All-ESS) has significant GHG reduction effects but costs significantly more than diesel; in the FC+ESS hybrid configuration, the optimization of the energy storage capacity configuration (from 2600 kWh to 910 kWh) can significantly reduce costs while maintaining a high reduction effect. The combination of solar photovoltaic and batteries can further reduce life cycle carbon emissions. The study by Hwang et al. [64] of Scottish ferries shows that deck photovoltaics (covering 80% of available area) can simultaneously reduce carbon emissions and fuel costs.
2.7.4. LNG-Battery Hybrid Propulsion
LNG-battery hybrid power combines the low-emission advantage of gas engines with the efficient power regulation capability of battery energy storage, benefiting both port emission control and fuel economy. The study by Feng et al. [67] of an 800 t ro-pax ferry in British Columbia, Canada, shows that the LNG parallel hybrid propulsion system (PHEPS), through two-level optimization of engine/battery component parameters and energy management strategy, can achieve significant WtW emission and fuel cost reductions. It can effectively solve the problem of sharp increases in HC and CO emissions of pure LNG mechanical propulsion under low-load conditions. The comparative study by Maloberti et al. [42] of a small passenger ship shows that LNG hybrid power can reduce fuel consumption, but GHG emission reductions only materialize when the battery is charged with renewable electricity. When the battery is charged with grid electricity, the full life cycle GHG emissions of the hybrid configuration may even deteriorate because shore electricity carbon emissions are included. To this end, that study proposed a greenhouse gas intensity indicator (GII) accounting for all greenhouse gases, to correct the deficiency of the traditional CII, which only accounts for CO2, in hybrid power evaluation.
2.7.5. Impact of Grid Carbon Intensity
The life cycle carbon emissions of battery-powered ships depend heavily on the source of charging electricity. The study by Kim et al. [63] targeting the Korean grid provides a quantitative analysis: the emission factor of the Korean national grid was about 660 g CO2-eq/kWh in 2021, and is expected to decrease to 83 g CO2-eq/kWh by 2050, with an average annual decrease of about 6.92%. With the current Korean grid as the power source, the emission reduction benefit of pure-electric configurations are limited and far from zero emissions; only after the grid is fully decarbonized (approximately the 2050 level) can near-zero life cycle emissions be truly achieved. The assessment by Liu et al. [68] of the levelized costs of 21 low-carbon fuel technologies further shows that more than 90% of countries are expected to reach the strict green grid threshold (≤0.099 kg CO2/kWh) by 2050, when the economic competitiveness of electrolytic hydrogen production and electric ships will be greatly improved.
Similarly, the carbon emissions of PEMFC and electrolytic hydrogen production also depend heavily on the electricity source. The study by Evers et al. [56] of inland hydrogen ships shows that if grid electrolysis is used for hydrogen supply, the life cycle carbon emissions of fuel cell ships can reach about 100 kt CO2, far exceeding the diesel baseline (57 kt CO2). The study by Panić et al. [54] further compares the significant differences in electrolytic hydrogen production between the Polish grid (710 g CO2-eq/kWh, 2020) and the Swedish grid (8 g CO2-eq/kWh). Therefore, the construction of a clean grid is the key prerequisite for battery power and e-fuels to achieve near-zero life cycle carbon emission benefits.
2.8. Comprehensive Comparison of Fuel Characteristics
2.8.1. Comparison of Physical Property Parameters
Table 1 summarizes the main physical property parameters of various marine alternative fuels and the reference fuel (MGO).
Table 1.
Main physical property parameters of marine alternative fuels [28,54].
The data in Table 1 reveal a fundamental trade-off between gravimetric and volumetric energy density. Hydrogen has the highest net calorific value (120 MJ/kg) but the lowest volumetric energy density (8.5 MJ/L). Biodiesel and MGO retain volumetric energy densities above 35 MJ/L and thus remain the benchmarks for onboard energy storage. Ammonia and methanol fall in an intermediate range of 12.7–15.8 MJ/L. In addition, the wide flammability limits of hydrogen (4–75%) and the toxicity of ammonia and methanol set strict requirements for fuel handling and safety design [28,29,45,54]. These physical constraints therefore place specific demands on the storage and transport of each fuel.
2.8.2. Comparison of Storage, Transport, and Infrastructure Maturity
Table 2 compares the fuels in terms of storage and transport conditions, infrastructure maturity, and key technical bottlenecks.
Table 2.
Comparison of storage, transport, and infrastructure maturity of alternative fuels.
Table 2 shows that the fuels fall into three groups in terms of storage and transport. Biodiesel/HVO is a drop-in option: it is storable at ambient conditions in standard fuel tanks and can use the existing bunkering infrastructure [59,60]. LNG, methanol, and ammonia require roughly 2–3 times the diesel tank volume and rely on cryogenic or pressurized tanks [41,45,51]. Hydrogen is the most demanding case, requiring cryogenic storage at −253 °C [29,54]. In addition, the global bunkering network remains concentrated on LNG, while ammonia and hydrogen are still at the pilot stage [22,29]. Therefore, biodiesel/HVO, LNG, and methanol are the feasible near-term options in terms of storage and infrastructure. Ammonia and hydrogen require substantial infrastructure development before large-scale application.
2.9. Section Summary
This section reviews the technical characteristics and deployment status of six types of marine alternative fuels (LNG, methanol, ammonia, hydrogen, biofuels, and battery power) from the three perspectives of fuel production pathways, storage and transport systems, and marine propulsion configurations. The main conclusions are as follows:
First, at the production pathway level, the emission reduction potential of the three carbon-source pathways shows a clear hierarchical differentiation. Fossil-based pathways have limited overall emission reduction value and can only serve as short-term transition options. Biomass-based pathways offer medium-term mitigation potential provided that sustainable feedstocks are available. Electricity-based pathways represent a key direction for long-term deep decarbonization, but are currently constrained by both techno-economic performance and supply chain support.
Second, the applicability of alternative fuels is conditioned by onboard storage volume and safety, propulsion-system maturity, and access to bunkering or charging rather than by production pathway alone [29,38,43,56,61]. Their combined effect depends on vessel endurance and port-call patterns; the route-specific implications are examined in Section 4.3.2.
Third, in the comprehensive comparison dimension, there is no single optimal alternative fuel solution. Fuel selection depends heavily on ship type, route characteristics, fuel availability, and regional policy environment. As a standardized framework for quantifying life cycle impacts across different fuel pathways and enabling consistent cross-fuel comparison, life cycle assessment (LCA) will be elaborated in detail in the subsequent sections.
3. Methodological Framework of Life Cycle Assessment for Marine Alternative Fuels
The technical distinctions described in Section 2 are reflected in the system boundaries, inventory data, and impact factors used in marine fuel life cycle assessment. A consistent methodological framework is therefore needed for cross-fuel comparisons [28]. This section presents the methodological framework for marine fuel LCA. First, it presents the environmental LCA framework based on ISO 14040/14044, including system-boundary definition and greenhouse-gas accounting. On this basis, it introduces life cycle cost (LCC) and social life cycle assessment (S-LCA) separately, and points out that existing studies generally focus on the environmental dimension while paying insufficient attention to the economic and social dimensions. It then presents the three-dimensional integrated life cycle sustainability assessment (LCSA) framework of environment-economy-society. Finally, it reviews the software tools and databases supporting this evaluation. The overall framework is shown in Figure 9.
Figure 9.
Overall framework of the LCA methodology for marine fuels.
3.1. Environmental Dimension: Methodological Foundations of LCA
3.1.1. LCA Methodological Framework and Classification
Marine fuel LCA follows the four-phase framework established by the international standards ISO 14040 and ISO 14044: goal and scope definition, life cycle inventory analysis (LCI), life cycle impact assessment (LCIA), and interpretation [23,24]. Both the systematic review by Wang et al. [28] of marine alternative fuel LCA studies and the review by Park et al. [30] of renewable energy applications in shipping point out that this general framework needs to be adapted to the characteristics of fuel supply chains and ship propulsion systems when applied to ship fuel evaluation. Goal and scope definition needs to clarify ship type, route, and operating conditions. Inventory analysis needs to cover the complete material flows of upstream fuel production and onboard combustion, and handle the multi-step energy consumption of fuel conversion processes [41,47]. Impact assessment needs to consider both greenhouse gases and conventional pollutants [37,55]. Interpretation needs to identify key parameters with the aid of sensitivity analysis [26,39]. The four phases are not strictly sequential but iterative and interconnected [23,24].
At the methodological level, marine fuel LCA can be further divided into attributional LCA (ALCA) and consequential LCA (CLCA) [24]. ALCA allocates emissions according to the physical inputs and outputs of established processes and is the mainstream method adopted by regulatory frameworks such as the IMO 2024 Guidelines and FuelEU Maritime [20]; CLCA, by contrast, considers indirect effects such as market feedback and technology substitution induced by system changes, and is more suitable for policy consequence assessment. The accounting results of the two methods for the same fuel pathway differ significantly, constituting one of the main methodological sources of divergent findings among existing studies [28,31].
3.1.2. System Boundary Delineation and Extension
The system boundary of marine fuel LCA adopts the well-to-wake (WtW) general framework, covering the upstream well-to-tank (WtT) and onboard tank-to-wake (TtW) stages; the typical WtW system boundary delineation is shown in Figure 1, and the relevant framework has been widely adopted in a number of classic studies [25,26,27]. The sum of the two constitutes the WtW greenhouse gas intensity (GHGI) of the fuel:
where the two terms correspond to the greenhouse gas intensity of the upstream fuel supply chain and the onboard combustion stage, respectively. Above the basic WtW boundary, the depth of system boundary delineation is a key variable affecting results, as confirmed by both the review by Wang et al. [28] and the LNG empirical study by Jang et al. [39]. The narrow WtW boundary accounts only for emissions of the fuel chain itself; the extended boundary can further incorporate three types of links:
- Fuel infrastructure, including bunkering stations, hydrogen/ammonia production plants, and shore power charging facilities [37,61];
- Ship manufacturing, covering hull construction and propulsion system manufacturing [27,36];
- End-of-life disposal, involving ship dismantling, battery recycling, and environmental remediation [61,63].
The study by Oh et al. [69] on onboard carbon capture systems under the FuelEU Maritime rules further shows that whether the carbon capture link is included in the system boundary significantly changes the accounting results of each propulsion option, highlighting the importance of boundary setting. The hierarchical delineation of the system boundary of marine fuel LCA is shown in Figure 10.
Figure 10.
Three levels of system boundary for marine fuel LCA.
3.1.3. Functional Unit Selection
The functional unit is the benchmark for quantifying evaluation results and determines the basis of comparability among different fuel options [28]. Functional units commonly used in marine fuel LCA fall into three categories:
Transport work benchmark, expressed in tonne·nautical mile (t·nm) or tonne·kilometer (t·km), directly corresponds to the transport service function, but needs to be combined with actual voyages and cargo conditions [25,28];
Energy benchmark, expressed in kilowatt-hour (kWh) or megajoule (MJ), convenient for cross-fuel comparison, but weakens the influence of efficiency differences among different propulsion systems [36,41];
Full life cycle benchmark, taking the life cycle of a single ship or a fleet (e.g., a 25–30 year operating period) as the unit, suitable for evaluating overall ship options, but with large data requirements and high uncertainty [37,63]. The choices of functional unit and system boundary are coupled with each other and constitute an important methodological root of poor comparability of conclusions among studies [28]. Table 3 presents a comparison of functional unit and system boundary settings in representative studies.
Table 3.
Comparison of functional units and system boundaries in representative studies.
Table 3 summarizes the functional units and system boundaries reported in the cited studies. The IMO fuel-LCA metric of g CO2-eq/MJ provides an energy-input reference [20]. Values expressed per kWh can be converted to a per-MJ basis (g CO2-eq/kWh ÷ 3.6 = g CO2-eq/MJ) when both denominators represent the same energy input; values per kWh of delivered power additionally require propulsion efficiency. Transport-work intensities require energy use per unit of transport work, whereas ship-lifetime totals, such as those reported for tugboats by Kim et al. [63], require the corresponding lifetime energy use or transport work. Accordingly, this review draws numerical fuel contrasts primarily from comparisons that share a vessel or route, reference fuel, and assessment boundary. Across studies, it synthesizes how production pathway, electricity supply, and propulsion configuration affect the direction and magnitude of climate impacts under the stated operating conditions.
3.2. Environmental Dimension: Inventory Analysis and Impact Assessment Models
3.2.1. Inventory Analysis and GHG Intensity Accounting Models
Emission allocation in multi-product coproduction systems is a major point of controversy in the inventory analysis stage [23,24]. When fuel production is coproduced with other products (e.g., coal-to-methanol coproducing chemicals, biodiesel coproducing glycerol, hydrogen production coproducing steam), upstream emissions need to be allocated among coproducts; mainstream methods include mass allocation and energy allocation based on physical relationships, as well as the system expansion method that offsets coproducts by expanding the boundary. The selection of different allocation methods can cause significant differences in the WtT emission results of fuels; for example, biodiesel coproducing glycerol mostly adopts the mass allocation method, and hydrogen production coproducing steam mostly adopts the system expansion method to offset emissions, which is one of the important reasons for inconsistent conclusions of marine fuel emission factor studies [23,31].
On the basis of inventory analysis, the accounting of the greenhouse gas intensity of marine fuels follows the linear summation logic of emission mass multiplied by global warming potential. For inventories containing three types of greenhouse gases, i.e., carbon dioxide (CO2), methane (CH4), and nitrous oxide (N2O), the CO2 equivalent (CO2e) emissions can be calculated as follows:
where the first term is the emission mass of the i-th greenhouse gas and the second is its global warming potential (GWP). GWP values depend on the time horizon and the IPCC assessment report. Over 100 years, the AR5 values for CH4 and N2O are 28 and 265, respectively; AR6 gives 29.8 and 273. The IMO 2024 Guidelines adopt AR5 values, whereas some studies use AR6 values [20,38]. In addition, some studies adopt GWP20 to highlight the short-term warming effect of methane (CH4 approximately 85) [38,40]. The choice of version and time horizon has a particularly significant influence on the evaluation results of fuels containing methane/nitrous oxide, such as LNG and ammonia. At the methodological level, the assessment by Gilbert et al. [55] of life cycle air emissions of global shipping alternative fuels and the MariTEAM model constructed by Kramel et al. [25] jointly standardize the accounting pathway of the greenhouse gas intensity of marine fuels. The systematic evaluation by Bayraktar et al. [70] of the greenhouse gas fuel intensity (GFI) of marine fuels under the IMO maritime net-zero framework also standardizes this pathway. The GWP values of major greenhouse gases are shown in Table 4.
Table 4.
Global warming potential (GWP100) values of major greenhouse gases.
3.2.2. Multiple Environmental Impact Categories and Characterization
In addition to greenhouse gases, the life cycle assessment of marine fuels should also cover conventional environmental impact categories such as acidification, eutrophication, photochemical oxidation (smog), particulate matter, and human toxicity [37,66]. The LCA studies by Lee et al. [37] on coastal ferries, Wang et al. [43] on superyachts, and Fernández-Ríos et al. [66] on hydrogen propulsion options all show that different fuels differ significantly in their performance across impact categories, and that evaluation relying solely on the single dimension of greenhouse gases cannot fully reflect fuel sustainability. Zamboni et al. [71] compare alternative fuels in a well-to-wake greenhouse-gas framework; their analysis does not itself report the non-climate impact categories discussed here. LCIA converts various inventory substances into unified impact indicators through characterization factors, for example, converting SOx and NOx into acidification potential (kg SO2-eq), and NOx and NH3 into eutrophication potential (kg PO4-eq). Multi-category evaluation can reveal the burden shifting phenomenon in fuel substitution, that is, the improvement in a single impact category may be accompanied by the deterioration of other impact categories [48,49]. Taking nitrous oxide as an example, it possesses both a strong greenhouse effect (GWP100 up to 273) and stratospheric ozone depletion potential, and is an impact substance that needs to be identified with priority in inventory analysis [49]. The main environmental impact categories and their characterization indicators are shown in Table 5. For any impact category, its category indicator result can be obtained by summing the inventory and characterization factors as follows:
Table 5.
Main environmental impact categories and characterization indicators of marine fuel LCA.
where the first term is the indicator result of the j-th impact category, the second is the emission mass of the i-th substance in the inventory, and the third is the characterization factor of this substance for the j-th impact category.
3.2.3. Uncertainty and Sensitivity Analysis
LCA results are affected by multiple sources of uncertainty, including emission factors, system boundaries, and technical parameters. Sensitivity analysis identifies key parameters by quantifying the marginal influence of input parameter changes on results. The commonly used single-factor sensitivity coefficient is defined as:
where is the output indicator (e.g., WtW greenhouse gas intensity) and is the input parameter (e.g., methane slip rate, grid carbon intensity). When the coefficient is greater than 1, the results are highly sensitive to this parameter. The studies by Lindstad et al. [38] and Jang et al. [39] on LNG show that its WtW results are most sensitive to the methane slip rate; the studies by Law et al. [41] and Lindstad et al. [47] on e-fuels show that their results are highly sensitive to grid carbon intensity and electrolysis efficiency. For multi-parameter joint variation, Di Lullo et al. [26] systematically evaluated the uncertainty of WtT and combustion-stage greenhouse gas emissions; Monte Carlo simulation, which gives the probability distribution interval of results through random sampling of the probability distributions of input parameters, is the main means of quantifying the comprehensive uncertainty of multi-parameter coupling. In ship fuel LCA studies, this method is often used to handle the fluctuation of parameters such as slip rate and emission factors; however, limited by the insufficiency of sample data for some processes, many studies can only assume that parameters follow normal distributions, which introduces additional modeling bias. Scenario analysis tests how shipping LCA results vary across policy, technology, and carbon-price assumptions [47,49]. The parametric trend life cycle assessment (PT-LCA) method proposed by Chalaris et al. [49] also incorporates technological progress over time to project future carbon-footprint trends.
3.3. Economic Dimension: Life Cycle Cost (LCC)
It should be noted that the vast majority of existing life cycle studies of marine fuels focus on the environmental impact dimension, with limited systematic quantification of economic performance [41,64]. In fact, economic feasibility is a direct constraint determining whether alternative fuels can be deployed at scale. Technical options lacking economic support can hardly be translated into industrial practice even if their environmental benefits are significant. Therefore, life cycle cost (LCC) analysis should be systematically considered as a key dimension parallel to environmental LCA [68,72].
3.3.1. Composition of LCC
The life cycle cost of a ship can be decomposed into four components:
- Capital cost (CAPEX): one-time investments such as ship acquisition, propulsion system and tank retrofitting (e.g., methanol/ammonia dual-fuel engine conversion, battery packs, fuel cell stacks) [45,63];
- Operating cost (OPEX): continuous expenditures such as fuel procurement, maintenance, crew, port charges, insurance, and carbon allowances/carbon taxes, among which fuel cost usually dominates [41,64];
- Replacement cost: multiple replacement expenditures within the ship operating period for limited-life components such as battery packs and fuel cell stacks [63,65];
- End-of-life disposal cost: expenditures at the end of the life cycle such as ship dismantling, component recycling, and environmental remediation, usually expressed as the net cost after deducting the residual value recovery of components.
Because of the differences in propulsion systems and energy storage modes, the cost structures of different fuels differ significantly: battery power is characterized by high CAPEX and low fuel OPEX, whereas conventional fuels are characterized by low CAPEX and high fuel OPEX [63,64]. The LCC structure decomposition is shown in Figure 11.
Figure 11.
Schematic of the ship life cycle cost (LCC) composition.
3.3.2. LCC and Levelized Cost Calculation Models
Considering the time value of money, the life cycle cost of a ship can be discounted and summed as follows:
where r is the discount rate, T is the ship life cycle, the third term is the replacement cost of the k-th component discounted to year tk, and the fourth is the end-of-life disposal cost.
To eliminate the differences in energy output among different fuel options and achieve fair comparison, levelized cost indicators are often adopted. The levelized cost of energy (LCOE) or levelized cost of fuel (LCF) converts the life cycle cost into the cost per unit energy output:
where the first three terms are the investment, operation and maintenance, and fuel costs in the t-th year, respectively, and the last is the energy output in the t-th year. This model provides a unified benchmark for cross-fuel economic comparison and has been widely applied in the LCC analysis of marine alternative fuels [63,68]; the cost comparison results of specific fuel options will be elaborated in Section 4.
3.3.3. Key Economic Parameters and Policy Variables
Marine alternative fuel LCC results are highly sensitive to three types of key parameters: fuel price, component cost, and carbon pricing [41,64]. In terms of fuel price, fuel prices of different production pathways differ significantly, and fuel procurement cost is the main component of OPEX and the primary indicator for cross-fuel economic comparison [41]. In terms of component cost, the unit costs of key components such as batteries and fuel cells and their declining trends with technological progress directly affect the economic competitiveness of the corresponding propulsion options [63,64]. In terms of policy variables, carbon taxes, carbon allowance prices, and subsidies significantly affect the economic inflection point of alternative fuels by changing the relative cost structure [51,53]. The LCC composition elements and key economic parameters of major fuels are compared in Table 6.
Table 6.
LCC composition and key economic parameters of each fuel.
3.4. Social Dimension: Social Life Cycle Assessment (S-LCA)
Compared with the environmental and economic dimensions, the social dimension remains largely underexplored in marine fuel life cycle research. The vast majority of studies do not incorporate social impacts into the evaluation framework, but social sustainability (including labor rights in the fuel supply chain, community impacts, and consumer safety) is an important prerequisite for alternative fuels to gain social acceptance and policy support, and its importance is equal to that of the environmental and economic dimensions [50,73]. Social life cycle assessment (S-LCA) provides methodological support for this purpose [73].
3.4.1. S-LCA Methodological Framework
S-LCA incorporates social impact assessment into the LCA framework in accordance with the guidelines jointly issued by the United Nations Environment Programme (UNEP) and the Society of Environmental Toxicology and Chemistry (SETAC) [73]. Similar to environmental LCA, S-LCA also goes through four phases: goal and scope definition, social inventory collection, social impact assessment, and interpretation, but its evaluation objects shift from material flows to social behaviors and institutional arrangements, and the data sources of the inventory shift from process databases to corporate reports, industry statistics, stakeholder surveys, and third-party certification [73]. The life cycle sustainability assessment of the blue ammonia supply chain by Al-Yafei et al. [50], which introduces the social dimension, is one of the few practices in the shipping fuel field that incorporates social indicators into the evaluation system.
3.4.2. Stakeholders and Subcategories
S-LCA organizes evaluation indicators around six stakeholder categories: workers, local communities, society, consumers, value-chain actors, and children [73]. Table 7 summarizes five of these categories; studies should screen the child category separately where a fuel pathway creates relevant exposure. Combined with the characteristics of the marine fuel supply chain, a number of key social issues can be identified, as shown in Table 7. The S-LCA framework is shown in Figure 12.
Table 7.
Main stakeholders and social indicators of S-LCA for marine fuels.
Figure 12.
Stakeholder-subcategory framework of S-LCA for marine fuels.
3.4.3. Quantification of Social Indicators and Challenges
One S-LCA impact-assessment option is the Reference Scale Approach: indicators are rated against disclosed performance reference points; if an overall score is needed, normalized indicator scores may be combined with explicitly stated weights [73]:
where the first term is the normalized score of the i-th social indicator and the second is its weight (which can be determined by stakeholder surveys or the analytic hierarchy process). In shipping scenarios, the quantification of social impacts also needs to incorporate maritime-specific indicators: public health impacts can be converted from pollutant exposure into health effects through dose–response relationships, and energy security can be characterized by indicators such as fuel external dependence [50,73]. It should be emphasized that the application of S-LCA in the shipping field still faces significant challenges. First, the poor availability and large regional differences in social data make it difficult to establish a standardized social inventory database. Second, the strong subjectivity of indicator scoring leads to high uncertainty of results. Third, the social impact transmission pathways of the marine fuel supply chain are long and involve numerous links and wide geographical coverage, and maritime-specific issues such as port community impacts and seafarer occupational health are difficult to characterize with generic indicators, and a dedicated social indicator system for the marine fuel supply chain is lacking [50,73]. This is also the methodological root of the long-term marginalization of the social dimension in mainstream LCA research.
3.5. Three-Dimensional Integration: Life Cycle Sustainability Assessment (LCSA)
Integrating the three dimensions of environmental LCA, economic LCC, and social S-LCA constitutes the life cycle sustainability assessment (LCSA) [30,50]. LCSA is not a simple juxtaposition of the three but requires collaborative evaluation under a unified system boundary and functional unit to avoid boundary mismatches among dimensions. The LCSA practice by Al-Yafei et al. [50] on the blue ammonia supply chain shows that the integration of the environmental, economic, and social dimensions can reveal trade-offs that a single dimension cannot capture. The techno-economic and life cycle assessment by Bayer et al. [53] of ammonia-hydrogen blended fuels in tugboat engines also embodies the integrated evaluation idea of combining the environmental and economic dimensions.
The key to three-dimensional integration lies in multi-criteria decision making (MCDM) and weight allocation. Weighting methods commonly used in shipping fuel evaluation include the subjective analytic hierarchy process (AHP) and the objective entropy weight method and CRITIC method. Commonly used scheme ranking methods include TOPSIS and VIKOR, among others [50]. The multi-parameter feasibility assessment method proposed by Adami and Figari [45] is also an engineering application of this type of multi-criteria evaluation framework. When the three dimensions need to be aggregated into a single sustainability indicator, the life cycle sustainability index (LCSI), weighted normalization can be performed as follows:
where the first three terms are the normalized scores of the environmental, economic, and social dimensions, respectively, and w is the corresponding weight. It should be noted that is presented in this review as a conceptual framework for multidimensional indicator aggregation and has not yet been standardized as a marine fuel-specific sustainability indicator; its specific dimension selection, normalization method, and weight setting need to be determined according to research objectives and scenario characteristics. Different MCDM methods differ in their handling logic of weights and ranking, and the subjectivity of weight setting remains a main source of controversy regarding the robustness of LCSA results; most existing shipping research remains limited to the two-dimensional integration of environment and economy, and empirical studies truly realizing three-dimensional integration are still very limited [50]. The three-dimensional integration framework of LCSA is shown in Figure 13. It should be explained that the technical dimension adopted in Section 4 is not the fourth pillar of the traditional LCSA framework but is introduced as a supplementary maritime engineering dimension to characterize engineering features such as fuel technology maturity, propulsion efficiency, onboard storage requirements, infrastructure availability, and ship-route applicability. The traditional LCSA framework still consists of the three dimensions of environment, economy, and society.
Figure 13.
Three-dimensional integration framework of LCSA.
3.6. Commonly Used Tools and Databases
The practice of marine fuel LCA relies on the support of software tools and background databases. According to functional positioning and openness, existing tools can be divided into four categories: commercial software, open-source software, shipping-specific tools, and databases [28,30].
3.6.1. Commercial Software
Mainstream general-purpose commercial LCA software includes Sphera GaBi and PRé SimaPro, both of which have built-in rich impact assessment methods and database interfaces and are widely used in the life cycle assessment of ship fuels and propulsion systems [36,37]. The GREET (Greenhouse gases, Regulated Emissions, and Energy use in Transportation) model developed by Argonne National Laboratory of the United States focuses on the transportation and fuel fields, with built-in fuel pathway accounting functions from well to wheel/tailpipe, and is a common tool for the WtW analysis of marine fuels [28,55].
3.6.2. Open-Source Software and Shipping-Specific Tools
In the open-source field, openLCA has become an important choice for research institutions owing to its free availability, modularity, and database compatibility (supporting the import of Ecoinvent and GaBi databases) [28]. In addition, a number of shipping-decarbonization-oriented dedicated open-source tools have emerged in recent years: the Navigating Green Seas open-source tool developed by Ellersdorfer et al. [74] is specifically used for cost accounting and fuel techno-economic assessment of green shipping corridor construction, covering the WtW boundaries and construction cost estimation of fuels such as ammonia and methanol. At the model level, the PT-LCA method proposed by Chalaris et al. [49] provides a tool-based pathway for dynamic carbon footprint prediction.
3.6.3. Databases and Data Sources
Background databases are the main source of upstream emission factors and process data in LCA. Ecoinvent is the most widely used LCA database in the world, covering tens of thousands of process datasets in electricity, fuels, materials, and other fields; the GaBi database is similar but focuses more on industrial processes [28]. For marine fuels, the 2024 Guidelines on Life Cycle GHG Intensity of Marine Fuels issued by the IMO provides default emission factors and accounting templates, providing an official data benchmark for shipping LCA [20]. The functional comparison of major tools and databases is shown in Table 8.
Table 8.
Functional comparison of major LCA tools and databases.
3.7. Section Summary
This section presents the methodological framework of the life cycle assessment of marine fuels, with the main conclusions as follows:
First, the environmental dimension takes the four-phase framework of ISO 14040/14044 as the guideline and the WtW boundary and greenhouse gas intensity accounting as the core. The choice between attributional and consequential LCA, the setting of system boundaries and functional units, the selection of GWP assessment versions and time horizons, and the emission allocation methods of multi-product coproduction systems jointly constitute the key methodological variables affecting results.
Second, the economic (LCC) and social (S-LCA) dimensions remain comparatively underdeveloped yet equally important links in the existing literature. Most existing studies focus primarily on environmental impacts, while systematic LCC analyses remain limited and S-LCA applications are still scarce. This section therefore outlines the main components of LCC, its discounting and levelized-cost calculation models, and the stakeholder framework and quantification methods used in S-LCA, so as to help fill this gap.
Third, LCSA integrates the environmental, economic, and social dimensions, often in combination with multi-criteria decision-making methods, and represents an important direction for the further development of marine fuel sustainability assessment.
Fourth, general-purpose tools such as GaBi, SimaPro, GREET, and openLCA and databases such as Ecoinvent constitute the infrastructure of the methodological framework, and shipping-specific tools and models such as Navigating Green Seas, MariTEAM, and PT-LCA further improve the specificity and dynamics of evaluation.
Building on this framework, Section 4 compares existing findings on various alternative fuels across four dimensions: environment, economy, technology, and society, and examines the methodological sources of the key controversies.
4. Comparison of Life Cycle Assessment Results of Marine Alternative Fuels and Key Methodological Controversies
Building on the methodological framework in Section 3, this section takes conventional marine diesel (MGO) as the reference benchmark, selects three typical shipping scenarios (short-sea port operations, short-sea shipping, and deep-sea trunk routes) and reviews the life cycle assessment findings for mainstream alternative fuels such as LNG, methanol, ammonia, hydrogen, biofuels, and battery power. It compares their performance across the environmental, economic, technical, and social dimensions. It further analyzes the methodological sources of divergent findings. These findings and controversies also provide a basis for identifying research gaps and clarifying future research directions.
Table 9 records the vessel or supply-chain context, assessment basis, actual system boundary, key assumptions and conditional findings of 12 representative studies. Their reported assessment bases are retained because differences in these choices limit direct numerical comparison.
Table 9.
Representative studies and methodological conditions underlying the comparison.
Evidence-strength grades are this review’s appraisal of support for each stated finding, not a judgment of the study as a whole. High requires measured or independently validated decisive inputs and sensitivity or uncertainty tests supporting the finding. Moderate denotes documented empirical-model or literature-model evidence with material scenario dependence. Limited denotes a decisive unvalidated proxy or omission that could change the inference. The fuel-specific implications and study limitations are discussed in Section 4.1.1. No row meets the High criterion for its full stated finding.
4.1. Environmental Dimension: Comparison of Full Life Cycle Environmental Impacts
4.1.1. Comparison of Greenhouse Gas (WtW) Emission Intensity
To keep the comparison on a consistent basis, this section takes empirical studies in three typical shipping scenarios as the data basis, including short-sea port operations (harbor tugboats, coastal ferries), short-sea shipping (regional container ships, bulk carriers), and deep-sea trunk routes (large container ships, tankers). Existing studies consistently show that the WtW greenhouse gas intensity of alternative fuels is highly dependent on production pathways and energy sources [28,55]. Figure 14 and Table 10 provide a visual synthesis and tabulated summary of representative life-cycle climate-impact changes across fossil-based, biomass-based, and electricity-based pathways. The reference fuels follow those used in the source studies (usually MGO or diesel, but in some cases HFO, VLSFO, or fossil LNG). In Figure 14 and Table 10, positive percentages denote reductions relative to the stated reference, whereas negative percentages denote increases. The three pathway groups are discussed below:
Figure 14.
Representative life-cycle climate-impact reduction rates by fuel and production pathway.
Table 10.
Representative life-cycle climate-impact changes by fuel and production pathway.
- In fossil-based pathways, except for high-pressure Diesel-cycle LNG, which can achieve a modest reduction of about 15%, the WtW emissions of gray methanol, gray ammonia, and gray hydrogen are generally close to or even higher than those of MGO, and coal-based pathways can reach several times the emissions of diesel [38,48]. Among them, the emission reduction benefits of LNG are significantly affected by the engine type and methane slip control level, and the WtW emissions of low-pressure Otto-cycle engines can even exceed those of diesel by 35–53% on the GWP20 time horizon [38,40].
- Biomass-based pathways can lower WtW emissions in some assessed cases, but the result depends on feedstock, production process and accounting assumptions, while sustainable biomass availability remains limited [41,44].
- Electricity-based pathways can achieve emission reductions in more than 90% under 100% renewable electricity conditions, and are one of the important long-term pathways for achieving deep decarbonization, but are highly constrained by grid carbon intensity [41,47]. Taking specific fuels as examples, green ammonia can achieve about 80% emission reduction relative to diesel [48,75], and green hydrogen fuel cells can achieve near-zero WtW emissions [47,76], but if hydrogen is produced by electrolysis with high-carbon grid electricity, the life cycle emissions may even exceed the diesel benchmark [47,56].
- Evidence maturity also differs by pathway. For LNG, fleet- and engine-specific configurations inform WtW models, whereas methane-slip and upstream emission factors are drawn from literature or inventory databases rather than measured across the fleets considered [38,39]. The ammonia-SOFC pathway in [56] is a harmonized literature scenario rather than observed vessel operation.
- For hydrogen, refs. [37,56] (Moderate) show that steam-methane-reforming or carbon-intensive grid pathways may not improve on diesel; ref. [56] also includes propulsion-system manufacture and replacements, unlike the fuel-chain scope of [37]. For waste-oil FAME biodiesel blend (B50), ref. [59] (Moderate) reports an approximately 40% WtW CO2 reduction only when avoided waste-treatment credits are counted; this is not a measured multi-gas GHG reduction. For full-battery propulsion, ref. [62] (Moderate) finds a 35.7% GWP reduction for the Korean grid case but a worse result for coal electricity, with battery and engine product life cycles excluded. Figure 14’s +99% hydropower-supplied case is therefore a supply-specific scenario, not a general battery effect. These findings support pathway-sensitive interpretation of Table 10 rather than cross-study percentage pooling.
These pathway layering results are verified in different ship type scenarios: taking the deep-sea trunk route study by Huang et al. [77] on a very large crude carrier (VLCC) as an example, its accounting results also present the layered characteristics of limited emission reduction in fossil-based pathways and deep emission reduction in electricity-based pathways.
The bars for gray hydrogen, gray LNG, e-LNG, blue ammonia, green hydrogen, and e-methanol use the midpoints of the corresponding Table 10 ranges (rounded to the displayed precision); the B50 bar uses the upper bound reported in [59]. The remaining bars represent single scenarios or rounded source estimates. The blue-ammonia percentages in Table 10 are derived from the absolute GHG intensities in [48] using its MDO reference. The battery values follow the GWP scenarios in [62]; the +99% hydropower value is rounded from that source’s hydroelectricity and diesel GWP totals, not a percentage reported verbatim in the paper.
4.1.2. Comparison of Multiple Environmental Impact Categories
Beyond greenhouse-gas emissions, Table 11 compares acidification potential (AP), eutrophication potential (EP), photochemical oxidation potential (POCP), and particulate matter (PM) against the conventional-fuel reference within each cited vessel case. ‘Lower’ denotes a smaller result for the same indicator under that study’s functional unit and system boundary; ‘production-pathway-dependent’ denotes different comparison directions among the modeled production routes. LNG cases report lower AP, EP, POCP, and PM than MGO [37,40], although engine configuration and methane slip affect LNG’s climate performance [39]. For ammonia, AP and POCP are lower than HFO/MDO in the pathways assessed by Wang et al. [48], whereas EP is higher for coal-based ammonia and lower for the other modeled routes. In the battery-ferry study, AP, EP, and POCP are lower than for diesel, but the magnitude varies with the electricity source [62]. The PM column does not represent a human-toxicity score.
Table 11.
Qualitative comparison of selected non-climate impacts relative to the conventional fuel in each cited vessel case.
4.1.3. Burden Shifting and Environmental Trade-Offs
Multi-category evaluation reveals the burden shifting law in fuel substitution, that is, greenhouse gas emission reductions are often accompanied by the deterioration of other environmental impact categories [48,78]. Typical scenarios include: e-fuels achieving near-zero carbon emissions, but the manufacturing of upstream renewable power generation equipment and the electrolysis process are accompanied by material and energy consumption [41,56]. The large-scale application of biofuels involves land occupation and indirect land use change emissions [44]. For ammonia, production pathways alter climate impacts [48,49]. In the case study of Wang et al. [48], coal-based ammonia has higher EP than the HFO/MDO reference, whereas the other modeled routes have lower EP. In the battery-ferry assessment, upstream electricity supply changes the reported impacts, and battery manufacture and end-of-life lie outside the stated system boundary [62]. The burden shifting phenomenon further indicates that evaluating fuel sustainability solely by the single dimension of greenhouse gases has significant limitations, which is a key driver of the three-dimensional environment-economy-society LCSA framework [30,50].
4.1.4. Influence of Energy Conversion Efficiency and Propulsion Systems on WtW Emission Performance
The life cycle emissions of marine fuels depend not only on the carbon intensity of the fuel itself, but also on the energy conversion efficiency of converting it into effective propulsion work and the actual operating conditions. Efficiency differences among propulsion systems are directly reflected in the fuel consumption per unit of propulsion work and ship-end (TtW) emissions, thereby affecting the full life cycle (WtW) results. The efficiency advantage of fuel cells of about 15–20 percentage points over traditional internal combustion engines (derived from the efficiency ranges of about 50–60% for PEMFC and 33–47% for diesel engines) can theoretically reduce the fuel consumption per unit propulsion work in the TtW stage by about 25–35%. Energy storage and hybrid power systems can achieve significant energy efficiency improvements by optimizing engine operating points, with more pronounced effects under low-load and frequent load-variation conditions [29,68]. This means that ranking solely by fuel-level WtW emission factors may overestimate or underestimate the actual full life cycle performance of a specific ship. Taking the green hydrogen pathway as an example, the upstream electrolytic hydrogen production stage accounts for a relatively high share of energy consumption (the WtW energy consumption is close to twice that of the conventional diesel pathway) [47,56]. However, the high efficiency of PEMFC in the TtW stage can partially offset the upstream disadvantage, so that the overall WtW emissions remain significantly lower than those of the conventional diesel pathway [41,56]. Low-efficiency propulsion or adverse operating conditions, by contrast, may weaken or even reverse the emission reduction advantage of the fuel itself. Therefore, the interpretation of marine fuel LCA should be combined with the propulsion efficiency, load characteristics, and energy management strategies of specific ships and routes, rather than treating propulsion efficiency merely as a technical parameter independent of life cycle accounting [41,55].
4.2. Economic Dimension: Comparison of Life Cycle Cost (LCC)
4.2.1. Comparison of Cost Structures and Levelized Costs
Economic feasibility is a direct constraint on the large-scale deployment of alternative fuels [41,64]. Table 12 summarizes study-specific cost metrics for marine power options; Figure 15 presents the LCOE case results of MGO, hydrogen fuel cell, and battery-electric options in a Scottish short-route fixed-route ferry scenario [64]. It should be noted that the case results are constrained by ship type and route lifetime assumptions, are only applicable to similar short-sea ships, and cannot be directly extended to deep-sea trunk route vessels. The techno-economic assessment by Korberg et al. [79] of advanced fuels and propulsion systems for future fossil-free ships and the analysis by Solakivi et al. [80] of the cost competitiveness of alternative fuels under the new regulatory framework both show that the economics of alternative fuels are highly dependent on policy support and cost reduction pathways. The analysis by Hwang et al. [64] of Scottish short-sea ferries reports the 25-year ferry LCOE values used here, excluding fuel-transport costs; the hydrogen cases use green hydrogen, with battery and fuel-cell replacements included where applicable. The LCOE of pure battery ferries (0.728 USD/kWh) is about 4.3 times that of pure diesel (0.168 USD/kWh). The economics of the pure hydrogen fuel cell option (0.521 USD/kWh) and the hydrogen fuel cell + battery hybrid option (0.526 USD/kWh) are significantly better than that of the pure battery option. The study by Kim et al. [63] of a zero-emission tugboat reports 25-year life-cycle cost ratios under assumed MGO, hydrogen, and electricity price trajectories. The pure electric option is 3.4 times that of diesel, and the fuel cell + energy-storage hybrid option can be reduced to 1.7 times. The 1.7-fold result refers specifically to the two-fuel-cell/one-ESS configuration. In terms of cost structure, conventional fuels are characterized by high operating costs (fuel cost dominates), whereas zero-carbon propulsion such as batteries and hydrogen fuel cells is characterized by high capital costs (battery purchase, fuel cell stacks, and hydrogen storage systems) [63,64]. The production costs of e-fuels reported in the literature are about 3–7 times those of fossil fuels, which is the primary factor constraining their economics [41,47]. For specific ship types, the LNG economic assessment by Butarbutar et al. [81] of a 600 TEU container ship in Indonesia provides a qualitative, scenario-specific finding: LNG has a certain cost advantage over MGO at specific oil and carbon prices, but its economics are highly sensitive to LNG prices and bunkering infrastructure investment.
Table 12.
Study-specific cost metrics for marine power options.
Figure 15.
Levelized cost of energy (LCOE) of different power options.
4.2.2. Key Parameter Sensitivity and Economic Inflection Points
Limited present-day production and sparse supply facilities may contribute to the high delivered costs of emerging marine fuels, particularly hydrogen and ammonia [64]. Liu et al. [68] assess 21 low-carbon fuel production pathways and project cost reductions for several pathways by 2050 under specified learning, input-price, and financing assumptions. These are modeled production-cost scenarios, not forecasts of marine bunkering prices or ship-level TCO. Vessel-level cost assessments should therefore state whether the fuel-cost input is a delivered price or a modeled production cost, specify its assumed time path, and test alternative price trajectories. In terms of component cost, marine lithium battery packs cost about 500–791 USD/kWh and PEMFC systems about 1000 USD/kW, and their declining speed directly determines the economic competitiveness of zero-carbon propulsion [63,64]. The analysis by Orangi et al. [82] of lithium-ion battery cost trajectories based on bottom-up production modeling shows that battery costs are expected to continue to decline, providing support for improving the economics of battery power. In carbon-pricing scenarios, Trosvik and Brynolf [83] assume a constant EUA price of EUR 100/t CO2e in their Swedish-fleet base case, with sensitivity paths reaching EUR 77/t CO2 (low) and EUR 215/t CO2 (high) by 2045. These are assumed price signals, not a general break-even threshold for green ammonia; the study reports e-fuels as cost-competitive only in its low-electricity-cost cases. Overall, the timing of any cost convergence remains pathway- and scenario-dependent; projected production-cost changes must be combined with ship-level capital, operating, replacement, and policy costs before drawing TCO conclusions [68,80].
4.2.3. Impact of Policy Instruments on Fuel Economics
Policy instruments can change the relative costs of marine fuels and propulsion options, conditional on carbon-price and fuel-price assumptions [83]. In Trosvik and Brynolf’s Swedish-fleet model, the assumed EUA charge is calculated from each fuel’s tank-to-wake CO2-equivalent emission factor and added separately from fuel costs [83]. It is a policy-cost component of the modeled shipowner decision, not an increase in the fuel’s production cost. Higher EUA prices increase the modeled selection of biofuels and battery-electric propulsion, whereas cheaper fossil fuels weaken that shift [83]. FuelEU Maritime alone has limited modeled effects by 2030; combining it with an EUA price brings some alternative-fuel investments forward relative to FuelEU alone [83]. The emissions boundary also matters: the IMO’s 2024 LCA Guidelines distinguish WtT, TtW and WtW GHG intensity, with regulatory applications determined separately [20]. Bayer et al.’s hydrogen-ammonia tugboat assessment discusses capital subsidies and carbon pricing as support for green fuel pathways, alongside infrastructure development [53]. At the fuel-production level, Liu et al. identify financial de-risking and concessional finance as potential enablers in regions with high costs of capital [68]. In the study’s charging-infrastructure subsidy sensitivity, the modeled electricity-use share in 2045 rises by 95% relative to its Base EUA case [83]. These are conditional scenario results, not observed fleet-wide effects: the model applies the EUA price to all voyages and does not quantify route or port-call avoidance [83].
4.3. Technology Dimension: Maturity and Scenario Applicability
4.3.1. Technology Maturity and Demonstration Projects
Table 13 summarizes the technology readiness level (TRL) of each fuel propulsion system based on the literature [29,84]. LNG dual-fuel engines have achieved commercialized large-scale application [38,40]. Methanol dual-fuel engines have been commercialized by manufacturers such as MAN, and real-ship applications are advancing rapidly [43,45]. Ammonia internal combustion engines have entered the stage of early commercialization (data as of September 2026): the B&W ME-LGIA passed its factory acceptance test in April 2026 and type approval testing in June 2026, and the first commercial engine is scheduled to enter service in 2026. Hydrogen fuel cells (PEMFC) have achieved megawatt-scale marine applications, but hydrogen storage systems remain the main bottleneck [30,63]. Ammonia solid oxide fuel cells (SOFC) are still in the R&D stage, and Duong et al. [84] pointed out that direct ammonia SOFC has broad application prospects in ships, but key bottlenecks remain in catalysts, nitrogen oxide control, and system integration. At the same time, marine SOFC generally faces common constraints of high-cost and limited stack lifetime [65,85]. In addition, the ship electrification scheme combining fuel cells and ammonia decomposition systems proposed by Yuksel et al. [86] provides an engineering reference for ammonia-based power pathways. The feasibility analysis by Yuksel [87] of the combination of LNG dual-fuel engines and SOFC on a tanker also shows that such multi-fuel hybrid power systems possess engineering feasibility under existing technical conditions, providing supplementary evidence for technology maturity assessment. Costa et al. [88] further summarized the common technical bottlenecks in fuel transition, pointing out that bunkering facilities, safety regulations, and fuel supply are common constraints restricting the deployment of various alternative fuels.
Table 13.
Comparison of technology maturity of major alternative fuel power technologies.
Overall, the lower the technology maturity of a fuel, the higher the uncertainty of the basic data of the related LCA research and the weaker the robustness of conclusions. The LCA data systems of commercialized technologies such as LNG and batteries are relatively complete, whereas the emission factors and system boundary assumptions of emerging technologies such as ammonia and hydrogen still have large uncertainties [78,88].
4.3.2. Applicability by Ship Type/Route
The physical properties and propulsion configurations of different fuels determine their applicable ship types and routes [29,30]. Figure 16 and Table 14 summarize the applicability matching by ship type/route:
Figure 16.
Suitability matrix of typical shipping scenarios and alternative fuels.
Table 14.
Applicability of alternative fuels by ship type/route.
- Short-sea port operations and fixed-route scenarios (harbor tugboats, coastal ferries) are suitable for battery power and hydrogen fuel cells, which can achieve near-zero emissions by relying on the advantage of frequent return-to-port recharging [30,63]. The analysis by Knight et al. [76] of inland hydrogen-powered vessels and the estimation by Fitz et al. [89] of hydrogen demand for ro-pax ferries based on AIS data further corroborate the applicability of hydrogen fuels in short-distance scenarios.
- Short-sea shipping scenarios (feeder container ships, bulk carriers) are suitable for methanol, LNG, and biofuels, balancing emissions and endurance [45,51].
- Deep-sea trunk route scenarios (large container ships, tankers) have high requirements for energy density and endurance; ammonia, green methanol, and LNG are the main candidates, among which green ammonia is regarded as the main force for long-term zero-carbon emissions [29,48].
Figure 16 gives a qualitative route-specific priority, not a numerical score. High marks the main options in Table 14; Medium marks alternatives that depend on storage, refueling or charging, or technology readiness; and Low marks options with a pronounced route constraint or no distinct advantage over the main options. Low does not mean infeasible. The categories concern route applicability, not life-cycle emissions or costs; deep-sea ammonia’s High rating denotes future potential, not present readiness.
Ship-type suitability also depends on usable propulsive power relative to the mass of the complete installed propulsion and energy-storage system, including batteries or fuel tanks and auxiliary equipment, rather than the prime mover alone. The studies reviewed here do not consistently report these system masses, so no numerical power-to-weight ranking is attempted. At fixed hull dimensions and allowable displacement, additional storage mass may reduce usable payload without necessarily increasing propulsion energy. If payload and service speed are preserved instead, changes in draft or vessel design may alter resistance and power demand; the resulting effect is case-specific and need not be proportional to each additional kilogram. Low battery energy density constrains long-distance electrification [41], while compressed hydrogen storage competes for cargo space [29]. In a methanol bulk-carrier case, a newbuild retaining the reference endurance lost about 8% of cargo-hold volume, whereas a retrofit using existing tank space lost about 69% of endurance; these are case-specific results, and the study assumed unchanged resistance and neglected weight and stability changes [45]. Emissions per actual tonne-nautical mile reflect the changed cargo denominator, but neither that ratio nor emissions per kWh automatically accounts for changes in propulsion demand with draft, speed, route, or storage configuration. Those effects require vessel-specific recalculation before normalized values are extrapolated across ship sizes or routes [45,89].
4.3.3. Infrastructure and Supply Chains
The large-scale application of alternative fuels is constrained by bunkering and supply chain infrastructure [22,29]. The analysis by Brouzas et al. [90] of hydrogen storage and propulsion systems for green shipping points out that hydrogen storage capacity and bunkering systems are important prerequisites for the large-scale deployment of hydrogen power. LNG bunkering facilities are relatively complete (273 ports worldwide) [22]; methanol can rely on the existing chemical storage and transport system [45]; while ammonia and hydrogen bunkering and storage facilities are still in their infancy [29,56]; battery power depends on the construction of shore power charging facilities [30,61]. In terms of supply chains, insufficient production capacity of green fuels is a common bottleneck, and the expansion of renewable electricity, electrolyzers, and carbon capture capacity is key to supporting green fuel supply [41,68].
4.4. Social Dimension: Research Status and Comparison of Typical Issues
According to the Guidelines for Social Life Cycle Assessment of Products and Organizations issued by UNEP [73], marine fuel S-LCA should cover stakeholders including workers, local community, society, consumers, and value chain actors, as well as their corresponding subcategories such as labor rights, occupational health and safety, community impacts, and energy security. In an LCSA that includes social indicators, Al-Yafei et al. assessed a Qatar blue-ammonia supply chain from feedstock processing to maritime transport and reported a modeled emissions-related human-health impact of 16,621 DALY (54%) for the ammonia converter unit [50]. The research foundation of shipping S-LCA is weak, lacking both a standardized social inventory database and a dedicated social indicator system for the marine fuel supply chain [50,73].
Occupational health and safety, community risk, energy security, and supply-chain fairness are relevant candidate social issues for maritime S-LCA [50,73]. The high toxicity of ammonia poses a major safety threat to fuel supply chain workers and port communities, and the flammable and explosive nature of hydrogen also brings safety management challenges [29,54]. The upstream mining and electrolytic manufacturing of batteries and green hydrogen involve labor rights and community impact issues [61,73]. The large-scale application of biofuels faces social controversies of competition with food security [44]. These social issues are important prerequisites for alternative fuels to gain social acceptance and policy support, and are also gaps that future LCSA research needs to fill with priority [50,73].
Methodological recommendations for maritime S-LCA. Define the vessel or route, functional unit, fuel pathway and life-cycle stages first, then screen affected stakeholder groups across production, fuel transport, bunkering and onboard operation; explain any excluded group or stage. Prioritize indicators through a documented materiality assessment, including crew and fuel-chain worker health and safety and port-community conditions where relevant, without assuming these are already the largest measured impacts. Report each indicator’s source, location, period, data quality and use of primary observations or proxies; identify missing marine-specific evidence. Select a reference-scale or impact-pathway approach to fit the study aim. For reference scales, publish the performance reference points and level definitions; if an overall score is used, show the disaggregated results, justify weights and test sensitivity to proxies, scale thresholds and weights [73].
4.5. Key Sources of Divergence Among Existing Studies
4.5.1. Differences in System Boundaries and Functional Units
For cross-study interpretation, results are directly comparable as numerical estimates only when the functional unit and reference fuel, ship and route duty, system boundary, fuel-production pathway or electricity mix, allocation method, accounting paradigm, and GHG characterization horizon are aligned. Differences in measured versus modeled inputs must still be disclosed. If only the functional unit differs, numerical comparison requires a transparent conversion using reported fuel-use, propulsion-efficiency, payload or transport-work data, with uncertainty in the conversion stated; otherwise the values remain separate. When boundaries, attributional versus consequential approaches, or decisive inventory assumptions differ, this review reports conditional within-study patterns rather than pooling reduction percentages or ranking fuels across studies [28,31,38].
The main source of divergent findings lies in the differences in system boundary and functional unit settings [28]. Taking green ammonia as an example, the study for ocean-going bulk carriers [48] calculates a WtW reduction of about 80%, whereas the study for short-sea port operation vessels, owing to large operating condition fluctuations and relatively low post-treatment efficiency, calculates a significantly lower reduction. The difference is not a methodological error but is jointly caused by ship type conditions and boundary breadth (whether ship manufacturing, bunkering infrastructure, etc., are included) [28,31]. Similar boundary sensitivity also exists in technology combination options; the comprehensive feasibility assessment by Yuksel [87] of the LNG dual-fuel engine + SOFC combination option on a tanker is a typical example of how system boundary settings affect the accounting results of combination options. This is also one of the main reasons for the interval differences in the emission reduction ranges of the same fuel across different ship type scenarios in Table 10. The choice of functional unit (transport work benchmark vs. energy benchmark) also changes the relative ranking of different fuels [28,41].
4.5.2. Accounting Paradigms and Inventory Allocation Methods
The choice of accounting paradigm between attributional (ALCA) and consequential (CLCA) LCA is another source of result divergence. Regulatory frameworks such as the IMO Guidelines adopt the attributional approach, while some policy assessment studies adopt the consequential approach. The accounting results of the two for the same fuel pathway differ significantly, which is an important source of the incomparability of conclusions across studies [28,31]. In addition, the emission allocation methods of multi-product coproduction systems (mass allocation, energy allocation, system expansion) directly determine the WtT emission factors of fuels, and the selection of different allocation methods can cause significant differences in results. For example, biodiesel coproducing glycerol mostly adopts mass allocation, and hydrogen production coproducing steam mostly adopts system expansion, and the two have opposite directions of influence on emission factors, which is an important reason for inconsistent conclusions across studies [23,31].
4.5.3. Parameter Selection and Sources of Uncertainty
The choice of GWP version (AR5/AR6) and time horizon (GWP20/GWP100), the differences in emission factor databases, and the inconsistencies in basic data assumptions (grid carbon intensity, methane slip rate, etc.) jointly lead to significant differences in the accounting results of the same fuel across different studies [20,38]. Taking LNG as an example, the methane slip of low-pressure Otto-cycle engines can reach 5.3 g/kWh under low-load conditions [38], and higher slip levels will raise the share of CH4 in total greenhouse gas emissions. The GWP100 of CH4 is 28 in AR5 and 29.8 in AR6, while GWP20 is as high as 85; the GWP choice has a significant influence on WtW accounting results [38,40]. Combined with the differences in system boundary settings among studies, the WtW evaluation results of the same LNG fuel pathway can shift from a reduction of about 15% to an increase of 35–53% [38,40]. This kind of multi-parameter coupled result sensitivity also exists in ammonia (N2O emissions and ammonia slip), hydrogen (grid carbon intensity and electrolysis efficiency), and e-fuels (renewable electricity share and carbon capture source) pathways. Existing studies generally lack systematic sensitivity analysis and uncertainty propagation assessment; the evaluation by Di Lullo et al. [26] of WtT and combustion emission uncertainty and the PT-LCA method of Chalaris et al. [49] provide solutions for improving this limitation. The combined effects of these three types of methodological variables are the main reason for the significant differentiation of evaluation conclusions for the same fuel across different studies, and also highlight the necessity of establishing a standardized methodological framework for marine fuel LCA.
4.6. Cross-Study Comparability and Evidence Synthesis
A quantitative comparison is strongest within a study when candidate fuels share the same vessel or route, duty profile, functional unit, system boundary and accounting assumptions. Between studies, numerical comparison is also defensible when these bases align; if only the functional unit differs, conversion requires reported fuel-use, efficiency, payload, or transport-work data, with conversion uncertainty stated [28,31,41].
When a common numerical basis is unavailable, scenario contrasts and cross-study patterns can still be synthesized conditionally. Lindstad and Rialland [38] illustrate how LNG results depend on engine configuration and methane slip; the Korean coastal-ferry assessment compares electricity-source cases [62], while the Scottish ferry analysis compares costs under specified routes and fuel-price scenarios [64]. These comparisons identify drivers and conditional directions; they do not transfer the same numerical effect to other vessels, routes or regions.
Results from studies with materially different vessel duties, system boundaries, functional units, energy-supply pathways or characterization assumptions should not be pooled into a universal fuel ranking. They remain useful for qualitative synthesis of recurring mechanisms, trade-offs and the conditions behind divergent findings. Table 9 records study context and evidence strength, while Table 10 retains source-reported values and ranges rather than presenting an aggregate score. The review therefore distinguishes findings that hold under aligned conditions from results that remain case-specific.
4.7. Principal Research Gaps
Beyond the comparability limits discussed in Section 4.5 and Section 4.6, the cited cases leave vessel-level evidence gaps. The ammonia PT-LCA identifies limited information on onboard use and cautions against extending case results to dissimilar vessels [49]. A battery-ferry assessment is confined to short routes and notes unresolved constraints for ocean-going ships [62]. A methanol bulk-carrier feasibility case excludes changes in ship weight and stability [45], leaving the combined implications of storage, payload and operational energy demand insufficiently resolved.
Evidence is also distributed across different decision scales: electricity-source cases for a ferry [62], global fuel-production cost estimates [68] and Swedish maritime policy scenarios [83] cannot alone establish a joint vessel-level cost and emissions comparison under jointly varying grid, fuel-price and policy conditions. For the social dimension, the blue-ammonia LCSA reports selected indicators such as employment and health [50], narrower than the stakeholder coverage specified by UNEP [73]. This limits social comparison within the marine-fuel studies reviewed here.
4.8. Section Conclusions and Decarbonization Pathway Recommendations
4.8.1. Key Findings of the Multidimensional Assessment
Based on the analysis of this section, the following conclusions can be drawn:
- Environmental dimension: electricity-based near-zero-carbon fuels are central to long-term deep decarbonization but depend on access to low-carbon electricity; biofuels are an important option for short-term transition but are constrained by feedstocks; most fossil-based alternative fuels (gray methanol, gray ammonia, gray hydrogen) have limited or even negative emission reduction benefits [41,48].
- Economic dimension: alternative fuels currently have a significant cost disadvantage, and cost competitiveness depends on the synergy of technological cost reduction and carbon policies [63,68].
- Technical dimension: LNG and battery-electric propulsion have relatively high technology readiness, ammonia is entering early commercialization, and hydrogen is still in the demonstration and validation stage [29,88].
- Social dimension: research on this dimension remains limited, representing a major gap in the current life cycle assessment framework [50,73].
4.8.2. Fuel Selection by Ship Type/Route
Table 15 gives the fuel selection matrix by ship type/route. In the short term, relatively mature options such as LNG, biofuels, and battery-electric propulsion can play important roles in suitable applications, although their infrastructure readiness varies by fuel and operating scenario. In the medium and long term, the transition can progressively shift toward low- and near-zero-carbon pathways such as green methanol, green ammonia, and green hydrogen [29,30]. The analysis by Wang et al. [91] of alternative fuel selection for dual-fuel ships under the FuelEU rules also shows that fuel selection needs to balance both environmental and economic objectives.
Table 15.
Fuel selection matrix by ship type/route.
4.8.3. Phased Decarbonization Pathways
Combined with the phased targets of the IMO 2023 GHG Strategy [19], Table 16 gives the phased fuel adoption pathways from the time dimension.
Table 16.
Phased fuel adoption pathways (corresponding to the targets of the IMO 2023 GHG Strategy).
- Near term (up to 2030): oriented toward achieving the 20–30% emission reduction target, LNG as a transition fuel (Lindstad et al. [92]), biofuel blending, and short-sea battery power can serve as the main choices, whose common features are mature technology and low deployment barriers [21,39];
- Medium term (2030–2040): the emission reduction target rises from 20% (striving for 30%) to 70% (striving for 80%); methanol (including bio-methanol and e-methanol) and scaled biofuels can serve as the main medium-term choices, and green ammonia enters pilot application [19,29];
- Long term (2040–2050): moving toward net-zero emissions, green ammonia, e-methanol, and green hydrogen emerge as important long-term pathways toward net-zero shipping [90,93], whose realization depends on the large-scale supply of renewable electricity, the production capacity ramp-up of zero-carbon alternative fuels, and infrastructure improvement [19,68].
The phased pathway emphasizes that fuel selection is not only a spatial (ship type/route) issue but also a temporal (phase) issue, and the two need to be decided in coordination. Correspondingly, with the evolution of fuel technologies at different stages, LCA research also needs to gradually transition from a single environmental dimension to the three-dimensional integrated evaluation of environment-economy-society, providing more comprehensive methodological support for phased decision making [30,50].
In summary, this section reviews the differences in the life cycle performance of alternative fuels across the four dimensions of environment, economy, technology, and society, and analyzes the methodological sources of divergent findings. On this basis, Section 4.7 summarizes the principal research gaps, and Section 5 sets out the corresponding research priorities.
5. Conclusions and Outlook
By systematically reviewing the technical characteristics, LCA methodological framework, and multidimensional evaluation results of marine alternative fuels, this review identifies the key areas of consensus and disagreement in existing research in terms of fuel emission reduction benefits, economics, and methodological comparability. The main conclusions are as follows:
First, the suitability of marine alternative fuels varies markedly across deployment stages and operating scenarios, and there is no universally optimal solution. Electricity-based near-zero-carbon fuels have outstanding emission reduction potential and are one of the key technical pathways for achieving long-term deep emission reduction, but currently face substantial economic disadvantages and are highly dependent on clean electricity. Fuel selection should therefore account jointly for vessel characteristics, route profiles, and regional policy conditions.
Second, a general methodological framework for marine fuel LCA has now emerged, but methodological differences remain a major source of divergent findings. These choices can alter emissions estimates and, in some cases, reverse the relative ranking of fuel pathways.
Third, the life cycle performance of alternative fuels shows significant pathway dependence, and the multidimensional evaluation system is still incomplete. Most existing studies remain limited to integrating environmental and economic dimensions, and empirical studies that fully integrate environmental, economic, and social dimensions remain scarce.
Future research should focus on five priorities:
First, harmonize ship-specific functional units, WtW boundaries, allocation and GWP assumptions, and biofuel inventory rules with applicable IMO/EU guidance. Apply data-quality, sensitivity and uncertainty analysis to identify inputs that can change conclusions [20,26,28,31,38,41,44,49,62].
Second, validate emerging propulsion with onboard measurements of performance and emissions across representative loads. Extend cases from ammonia to hydrogen, e-fuels and harbor craft such as tugboats and pilot boats, and use observations to validate inventories and fleet projections [48,49].
Third, link storage to vessel operation, usable transport work and cost. Report storage mass/volume, payload, range/charging, and load-dependent energy and emissions; represent engine performance, fuel-cell degradation, hybrid energy management and low-load methane slip [45,49,64,83].
Fourth, test integrated, time-dependent scenarios for a defined vessel or route. Vary electricity and fuel prices, grid carbon intensity, carbon prices and policy support together, and quantify uncertainty in these inputs when data permit; report resulting life-cycle costs and emissions [62,68,83].
Fifth, extend marine LCSA/S-LCA across greenhouse gases, conventional pollutants, costs and social impacts. Use consistent stakeholder definitions and inventories from production through transport, bunkering and onboard use, and include vessel construction, retrofit or end-of-life stages where relevant [37,50,66,73].
In summary, there is no single marine fuel that is universally optimal in life cycle performance. Fuel selection should not pursue a universal ranking but should be decided in a scenario-specific manner based on multidimensional factors such as ship type, route characteristics, operational energy demand, propulsion efficiency, fuel production pathways, infrastructure availability, and regional electricity carbon intensity. Life cycle assessment provides a scientific basis for such scenario-specific fuel-selection decisions, and the standardization and multidimensional integration of its methodological framework will continue to provide a solid basis for optimizing shipping decarbonization pathways.
Author Contributions
Conceptualization, H.L. and Y.S.; methodology, C.L. and Y.S.; validation, C.L., X.S., W.M., S.Y., Q.T., H.C. and Y.W.; formal analysis, C.L., X.S., W.M., S.Y., Q.T., H.C. and Y.W.; resources, H.L., C.L., Y.W. and Y.S.; data curation, C.L., X.S., W.M., S.Y., Q.T., H.C. and Y.W.; writing—original draft preparation, C.L. and Y.S.; writing—review and editing, H.L., X.S., W.M., S.Y., Q.T., H.C. and Y.S.; supervision, H.L. and Y.S.; project administration, H.L. and Y.S.; funding acquisition, H.L. and W.M. All authors have read and agreed to the published version of the manuscript.
Funding
This research was partially supported by the Shandong Provincial Natural Science Foundation (ZR2024MD066) and Tianjin Municipal Key Research and Development Program (24YFZCSN00090).
Data Availability Statement
No new data were created or analyzed in this study. Data sharing is not applicable to this article.
Conflicts of Interest
Author Hongwei Chang was employed by the company Shandong Port Yantai Port Group Co., Ltd. The remaining authors declare that the research was conducted in the absence of any commercial or financial relationships that could be construed as a potential conflict of interest.
References
- World Meteorological Organization. State of the Global Climate 2025; WMO: Geneva, Switzerland, 2025. [Google Scholar]
- UNFCCC. United Nations Framework Convention on Climate Change; Paris Agreement; UNFCCC: Paris, France, 2015. [Google Scholar]
- Serra, P.; Fancello, G. Towards the IMO’s GHG Goals: A Critical Overview of the Perspectives and Challenges of the Main Options for Decarbonizing International Shipping. Sustainability 2020, 12, 3220. [Google Scholar] [CrossRef] [Scilit]
- International Maritime Organization. Fourth IMO GHG Study 2020; IMO: London, UK, 2020. [Google Scholar]
- Kiihamäki, S.-P.; Korhonen, M.; Kukkonen, J.; Shiue, I.; Jaakkola, J.J.K. Effects of Ambient Air Pollution from Shipping on Mortality: A Systematic Review. Sci. Total Environ. 2024, 945, 173714. [Google Scholar] [CrossRef] [Scilit] [PubMed]
- Wan, Z.; Ji, S.; Liu, Y.; Zhang, Q.; Chen, J.; Wang, Q. Shipping Emission Inventories in China’s Bohai Bay, Yangtze River Delta, and Pearl River Delta in 2018. Mar. Pollut. Bull. 2020, 151, 110882. [Google Scholar] [CrossRef] [Scilit] [PubMed]
- Curran, S.; Onorati, A.; Payri, R.; Agarwal, A.K.; Arcoumanis, C.; Bae, C.; Boulouchos, K.; Dal Forno Chuahy, F.; Gavaises, M.; Hampson, G.J.; et al. The Future of Ship Engines: Renewable Fuels and Enabling Technologies for Decarbonization. Int. J. Engine Res. 2024, 25, 85–110. [Google Scholar] [CrossRef] [Scilit]
- Huang, J.; Duan, X. A Comprehensive Review of Emission Reduction Technologies for Marine Transportation. J. Renew. Sustain. Energy 2023, 15, 053303. [Google Scholar] [CrossRef] [Scilit]
- Rehmatulla, N.; Calleya, J.; Smith, T. The Implementation of Technical Energy Efficiency and CO2 Emission Reduction Measures in Shipping. Ocean Eng. 2017, 139, 184–197. [Google Scholar] [CrossRef] [Scilit]
- Wang, K.; Li, Z.; Zhang, R.; Ma, R.; Huang, L.; Wang, Z.; Jiang, X. Computational Fluid Dynamics-Based Ship Energy-Saving Technologies: A Comprehensive Review. Renew. Sustain. Energy Rev. 2025, 207, 114896. [Google Scholar] [CrossRef] [Scilit]
- Balcombe, P.; Brierley, J.; Lewis, C.; Skatvedt, L.; Speirs, J.; Hawkes, A.; Staffell, I. How to Decarbonise International Shipping: Options for Fuels, Technologies and Policies. Energy Convers. Manag. 2019, 182, 72–88. [Google Scholar] [CrossRef] [Scilit]
- Bouman, E.A.; Lindstad, E.; Rialland, A.I.; Strømman, A.H. State-of-the-Art Technologies, Measures, and Potential for Reducing GHG Emissions from Shipping—A Review. Transp. Res. Part D 2017, 52, 408–421. [Google Scholar] [CrossRef] [Scilit]
- Gilbert, P.; Wilson, P.; Walsh, C.; Hodgson, P. The Role of Material Efficiency to Reduce CO2 Emissions during Ship Manufacture: A Life Cycle Approach. Mar. Policy 2017, 75, 227–237. [Google Scholar] [CrossRef] [Scilit]
- Li, Z.; Wang, K.; Hua, Y.; Liu, X.; Ma, R.; Wang, Z.; Huang, L. GA-LSTM and NSGA-III Based Collaborative Optimization of Ship Energy Efficiency for Low-Carbon Shipping. Ocean Eng. 2024, 312, 119190. [Google Scholar] [CrossRef] [Scilit]
- Wang, K.; Li, J.; Huang, L.; Ma, R.; Jiang, X.; Yuan, Y.; Mwero, N.; Negenborn, R.R.; Sun, P.; Yan, X. A Novel Method for Joint Optimization of the Sailing Route and Speed Considering Multiple Environmental Factors for More Energy Efficient Shipping. Ocean Eng. 2020, 216, 107591. [Google Scholar] [CrossRef] [Scilit]
- Spinelli, F.; Mancini, S.; Vitiello, L.; Bilandi, R.N.; De Carlini, M. Shipping Decarbonization: An Overview of the Different Stern Hydrodynamic Energy Saving Devices. J. Mar. Sci. Eng. 2022, 10, 574. [Google Scholar] [CrossRef] [Scilit]
- Lion, S.; Vlaskos, I.; Taccani, R. A Review of Emissions Reduction Technologies for Low and Medium Speed Marine Diesel Engines and Their Potential for Waste Heat Recovery. Energy Convers. Manag. 2020, 207, 112553. [Google Scholar] [CrossRef] [Scilit]
- Grzelakowski, A.S.; Herdzik, J.; Skiba, S. Maritime Shipping Decarbonization: Roadmap to Meet Zero-Emission Target in Shipping as a Link in the Global Supply Chains. Energies 2022, 15, 6150. [Google Scholar] [CrossRef] [Scilit]
- International Maritime Organization. 2023 IMO Strategy on Reduction of GHG Emissions from Ships; IMO: London, UK, 2023. [Google Scholar]
- International Maritime Organization. 2024 Guidelines on Life Cycle GHG Intensity of Marine Fuels; IMO: London, UK, 2024. [Google Scholar]
- DNV. Maritime Forecast to 2050; DNV: Oslo, Norway, 2024. [Google Scholar]
- United Nations Conference on Trade and Development. Review of Maritime Transport 2025; United Nations: Geneva, Switzerland, 2025. [Google Scholar] [CrossRef] [Scilit]
- ISO 14040:2006; Environmental Management—Life Cycle Assessment—Principles and Framework. ISO: Geneva, Switzerland, 2006.
- ISO 14044:2006; Environmental Management—Life Cycle Assessment—Requirements and Guidelines. ISO: Geneva, Switzerland, 2006.
- Kramel, D.; Muri, H.; Kim, Y.; Lonka, R.; Nielsen, J.B.; Ringvold, A.L.; Bouman, E.A.; Steen, S.; Strømman, A.H. Global Shipping Emissions from a Well-to-Wake Perspective: The MariTEAM Model. Environ. Sci. Technol. 2021, 55, 15040–15050. [Google Scholar] [CrossRef] [Scilit] [PubMed]
- Di Lullo, G.; Zhang, H.; Kumar, A. Evaluation of Uncertainty in the Well-to-Tank and Combustion Greenhouse Gas Emissions of Various Transportation Fuels. Appl. Energy 2016, 184, 413–426. [Google Scholar] [CrossRef] [Scilit]
- Del Pero, F.; Dattilo, C.A.; Giraldi, A.; Delogu, M. LCA approach for environmental impact assessment within the maritime industry: Re-design case study of yacht’s superstructure. Proc. Inst. Mech. Eng. Part M J. Eng. Marit. Environ. 2024, 238, 153–170. [Google Scholar] [CrossRef] [Scilit]
- Wang, Y.; Xiao, X.; Ji, Y. A Review of LCA Studies on Marine Alternative Fuels. J. Mar. Sci. Eng. 2025, 13, 196. [Google Scholar] [CrossRef] [Scilit]
- Jin, C.; Choi, J.H.; Lee, C.; Kim, M.H. Sustainable Maritime Decarbonization: A Review of Hydrogen and Ammonia as Future Clean Marine Energies. Sustainability 2025, 17, 11364. [Google Scholar] [CrossRef] [Scilit]
- Park, M.-H.; Yeo, S.; Kim, J.-H.; Choi, J.-H.; Lee, W.-J. Comprehensive Review on Recent Progress in Renewable and Sustainable Energy Applications in Shipping Industry, and Suggestions for Future Developments. Renew. Sustain. Energy Rev. 2026, 225, 116152. [Google Scholar] [CrossRef] [Scilit]
- Carvalho, F.; O’Malley, J.; Osipova, L.; Pavlenko, N. Key Issues in LCA Methodology for Marine Fuels; International Council on Clean Transportation: Washington, DC, USA, 2023. [Google Scholar]
- Ashry, T.A.; Nasr, N.A.; Fahim, N.S.; Marey, N.A. A Field Study Onboard VLCCs for CO2 Emission Reduction Considering EEDI and SEEMP. Alex. Eng. J. 2024, 108, 662–675. [Google Scholar] [CrossRef] [Scilit]
- Budiyanto, M.A.; Adha, A.; Prayoga, P.H.N. Distribution of Energy Efficiency Design Index for Tankers in Indonesia. Energy Rep. 2022, 8, 170–176. [Google Scholar] [CrossRef] [Scilit]
- Song, L. Discussion on EEOI Reduction Measures Based on Modern Management. Master’s Thesis, World Maritime University, Malmö, Sweden, 2014. Available online: https://commons.wmu.se/msem_dissertations/309 (accessed on 8 September 2026).
- International Maritime Organization. EEXI and CII-Ship Carbon Intensity and Rating System. Available online: https://www.imo.org/en/MediaCentre/HotTopics/Pages/EEXI-CII-FAQ.aspx (accessed on 1 January 2024).
- Hwang, S.S.; Gil, S.J.; Lee, G.N.; Lee, J.W.; Park, H.; Jung, K.H.; Suh, S.B. Life Cycle Assessment of Alternative Ship Fuels for Coastal Ferry Operating in Republic of Korea. J. Mar. Sci. Eng. 2020, 8, 660. [Google Scholar] [CrossRef] [Scilit]
- Lee, G.N.; Kim, J.M.; Jung, K.H.; Park, H.; Jang, H.S.; Lee, C.S.; Lee, J.W. Environmental Life Cycle Assessment of Eco-Friendly Alternative Ship Fuels (MGO, LNG, and Hydrogen) for 170 GT Nearshore Ferry. J. Mar. Sci. Eng. 2022, 10, 755. [Google Scholar] [CrossRef] [Scilit]
- Lindstad, E.; Rialland, A. LNG and Cruise Ships, an Easy Way to Fulfil Regulations-Versus the Need for Reducing GHG Emissions. Sustainability 2020, 12, 2080. [Google Scholar] [CrossRef] [Scilit]
- Jang, H.; Jeong, B.; Zhou, P.; Ha, S.; Nam, D. Demystifying the Lifecycle Environmental Benefits and Harms of LNG as Marine Fuel. Appl. Energy 2021, 292, 116869. [Google Scholar] [CrossRef] [Scilit]
- Hwang, S.; Jeong, B.; Jung, K.; Kim, M.; Zhou, P. Life Cycle Assessment of LNG Fueled Vessel in Domestic Services. J. Mar. Sci. Eng. 2019, 7, 359. [Google Scholar] [CrossRef] [Scilit]
- Law, L.C.; Foscoli, B.; Mastorakos, E.; Evans, S. A Comparison of Alternative Fuels for Shipping in Terms of Lifecycle Energy and Cost. Energies 2021, 14, 8502. [Google Scholar] [CrossRef] [Scilit]
- Maloberti, L.; Zaccone, R.; De Gaetano, J.; Campora, U. A Comparison among Innovative Hybrid Propulsion Systems to Reduce the Environmental Impact of a Small Passenger Ship. Sustain. Energy Technol. Assess. 2025, 75, 104194. [Google Scholar] [CrossRef] [Scilit]
- Wang, Y.; Maidment, H.; Boccolini, V.; Wright, L. Life Cycle Assessment of Alternative Marine Fuels for Super Yacht. Reg. Stud. Mar. Sci. 2022, 55, 102525. [Google Scholar] [CrossRef] [Scilit]
- Masum, F.H.; Zaimes, G.G.; Tan, E.C.D.; Li, S.; Dutta, A.; Ramasamy, K.K.; Hawkins, T.R. Comparing Life Cycle Emissions of Biofuels for Marine Applications: Hydrothermal Liquefaction of Wet Wastes, Pyrolysis of Wood, Fischer-Tropsch Synthesis of Landfill Gas, and Solvolysis of Wood. Environ. Sci. Technol. 2023, 57, 12701–12712. [Google Scholar] [CrossRef] [Scilit] [PubMed]
- Adami, G.; Figari, M. Multi-Parametric Methodology for the Feasibility Assessment of Alternative-Fuelled Ships. J. Mar. Sci. Eng. 2024, 12, 905. [Google Scholar] [CrossRef] [Scilit]
- Basciu, F.; Casali, G.; Maloberti, L.; Pais, T.; Vergassola, G.; Zaccone, R. Sustainable Yacht Refits: Structural Solutions in Methanol-Powered Conversion. Ocean Eng. 2025, 323, 120618. [Google Scholar] [CrossRef] [Scilit]
- Lindstad, E.; Lagemann, B.; Rialland, A.; Gamlem, G.M.; Valland, A. Reduction of Maritime GHG Emissions and the Potential Role of E-Fuels. Transp. Res. Part D 2021, 101, 103075. [Google Scholar] [CrossRef] [Scilit]
- Wang, H.; Zhou, P.; Jeong, B.; Mesbahi, A.; Mujeeb-Ahmed, M.P.; Jang, H.; Giannakis, A.; Sykaras, K.; Papadakis, A. Life Cycle Analysis of Ammonia Fuelled Ship-Case Ship Studies for Marine Vessels. J. Clean. Prod. 2025, 520, 146105. [Google Scholar] [CrossRef] [Scilit]
- Chalaris, I.; Jeong, B.; Jang, H. Application of Parametric Trend Life Cycle Assessment for Investigating the Carbon Footprint of Ammonia as Marine Fuel. Int. J. Life Cycle Assess. 2022, 27, 1145–1163. [Google Scholar] [CrossRef] [Scilit]
- Al-Yafei, H.; Aseel, S.; Alnouss, A.; Al-Kuwari, A.; Abdussamie, N.; Al Tamimi, T.; Al Mannaei, H.; Ibrahim, H.; Abu Hashim, N.; Al Delayel, B.; et al. Blue Ammonia and the Supply Chain Pioneering Sustainability Assessment for a Greener Future. Energies 2025, 18, 1137. [Google Scholar] [CrossRef] [Scilit]
- Zincir, B. Environmental and Economic Evaluation of Ammonia as a Fuel for Short-Sea Shipping: A Case Study. Int. J. Hydrog. Energy 2022, 47, 18148–18168. [Google Scholar] [CrossRef] [Scilit]
- Serrano, J.R.; Novella, R.; Climent, H.; Arnau, F.J.; Calvo, A.; Thorsen, L. Computational Analysis of an Ammonia Combustion System for Future Two-Stroke Low-Speed Marine Engines. J. Mar. Sci. Eng. 2025, 13, 39. [Google Scholar] [CrossRef] [Scilit]
- Bayer, M.U.; Bilgili, L.; Alkan, S.; Atak, Ü.; Çelik, V. Techno-Economic and Life Cycle Assessment of Hydrogen-Ammonia Fuel Blends in Tugboat Engines for Sustainable Port Operations. Sustainability 2025, 17, 10285. [Google Scholar] [CrossRef] [Scilit]
- Panić, I.; Cuculić, A.; Ćelić, J. Color-Coded Hydrogen: Production and Storage in Maritime Sector. J. Mar. Sci. Eng. 2022, 10, 1995. [Google Scholar] [CrossRef] [Scilit]
- Gilbert, P.; Walsh, C.; Traut, M.; Kesieme, U.; Pazouki, K. Assessment of Full Life Cycle Air Emissions of Alternative Shipping Fuels. J. Clean. Prod. 2018, 172, 855–866. [Google Scholar] [CrossRef] [Scilit]
- Evers, V.H.M.; Kirkels, A.F.; Godjevac, M. Carbon Footprint of Hydrogen-Powered Inland Shipping: Impacts and Hotspots. Renew. Sustain. Energy Rev. 2023, 185, 113629. [Google Scholar] [CrossRef] [Scilit]
- Arabnejad, M.H.; Thies, F.; Yao, H.-D.; Ringsberg, J.W. Life Cycle Assessment Method for Ship Fuels Using a Ship Performance Prediction Model and Actual Operation Conditions—Case Study of Wind-Assisted Cargo Ship. Energies 2025, 18, 4559. [Google Scholar] [CrossRef] [Scilit]
- Kim, J.K.; Jeong, B.; Choi, J.-H.; Lee, W.-J. Life Cycle Assessment of LPG Engines for Small Fishing Vessels and the Applications of Bio LPG Fuel in Korea. J. Mar. Sci. Eng. 2023, 11, 1488. [Google Scholar] [CrossRef] [Scilit]
- Stathatou, P.M.; Bergeron, S.; Fee, C.; Jeffrey, P.; Triantafyllou, M.; Gershenfeld, N. Towards Decarbonization of Shipping: Direct Emissions & Life Cycle Impacts from a Biofuel Trial aboard an Ocean-Going Dry Bulk Vessel. Sustain. Energy Fuels 2022, 6, 1687–1697. [Google Scholar] [CrossRef] [Scilit]
- Otsason, R.; Laasma, A.; Gülmez, Y.; Kotta, J.; Tapaninen, U. Comparative Analysis of the Alternative Energy: Case of Reducing GHG Emissions of Estonian Pilot Fleet. J. Mar. Sci. Eng. 2025, 13, 305. [Google Scholar] [CrossRef] [Scilit]
- Bei, Z.; Wang, J.; Li, Y.; Wang, H.; Li, M.; Qian, F.; Xu, W. Challenges and Solutions of Ship Power System Electrification. Energies 2024, 17, 3311. [Google Scholar] [CrossRef] [Scilit]
- Jeong, B.; Jeon, H.; Kim, S.; Kim, J.; Zhou, P. Evaluation of the Lifecycle Environmental Benefits of Full Battery Powered Ships: Comparative Analysis of Marine Diesel and Electricity. J. Mar. Sci. Eng. 2020, 8, 580. [Google Scholar] [CrossRef] [Scilit]
- Kim, K.; Park, K.; Roh, G.; Choung, C.; Kwag, K.; Kim, W. Proposal of Zero-Emission Tug in South Korea Using Fuel Cell/Energy Storage System: Economic and Environmental Long-Term Impacts. J. Mar. Sci. Eng. 2023, 11, 540. [Google Scholar] [CrossRef] [Scilit]
- Hwang, I.; Park, C.; Jeong, B. Life Cycle Cost Analysis for Scotland Short-Sea Ferries. J. Mar. Sci. Eng. 2023, 11, 424. [Google Scholar] [CrossRef] [Scilit]
- Lee, J.I.; Kim, D.; Sung, D.; Yang, H.; Cha, S.W. Comprehensive Techno-Economic Assessment of SOFC Hybrid System in Marine Applications: A Carbon Emission Framework Perspective. Energy Rep. 2025, 14, 4150–4159. [Google Scholar] [CrossRef] [Scilit]
- Fernández-Ríos, A.; Santos, G.; Pinedo, J.; Santos, E.; Ruiz-Salmón, I.; Laso, J.; Lyne, A.; Ortiz, A.; Ortiz, I.; Irabien, Á.; et al. Environmental Sustainability of Alternative Marine Propulsion Technologies Powered by Hydrogen-A Life Cycle Assessment. Sci. Total Environ. 2022, 820, 153189. [Google Scholar] [CrossRef] [Scilit] [PubMed]
- Feng, Y.; Zhu, H.; Dong, Z. Simultaneous and Global Optimizations of LNG-Fueled Hybrid Electric Ship for Substantial Fuel Cost, CO2, and Methane Emission Reductions. IEEE Trans. Transp. Electrif. 2023, 9, 2282–2295. [Google Scholar] [CrossRef] [Scilit]
- Liu, Z.; Terlouw, T.; Frey, P.; Bauer, C.; McKenna, R. Global Cost Drivers and Regional Trade-Offs for Low-Carbon Fuels: A Prospective Techno-Economic Assessment. Energy Environ. Sci. 2026, 19, 2246–2272. [Google Scholar] [CrossRef] [Scilit]
- Oh, J.; Kim, D.; Roussanaly, S.; Lim, Y. Greenhouse Gas Emissions of Shipping with Onboard Carbon Capture under the FuelEU Maritime Regulation: A Well-to-Wake Evaluation of Different Propulsion Scenarios. Chem. Eng. J. 2024, 498, 155407. [Google Scholar] [CrossRef] [Scilit]
- Bayraktar, M.; Bayramoğlu, K.; Yuksel, O. Evaluating the Greenhouse Gas Fuel Intensity of Marine Fuels under the Maritime Net-Zero Framework. Sustainability 2026, 18, 184. [Google Scholar] [CrossRef] [Scilit]
- Zamboni, G.; Scamardella, F.; Gualeni, P.; Canepa, E. Comparative Analysis among Different Alternative Fuels for Ship Propulsion in a Well-to-Wake Perspective. Heliyon 2024, 10, e26016. [Google Scholar] [CrossRef] [Scilit] [PubMed]
- Scheffler, F.; Imdahl, C.; Zellmer, S.; Herrmann, C. Techno-Economic and Environmental Assessment of Renewable Hydrogen Import Routes from Overseas in 2030. Appl. Energy 2025, 380, 125073. [Google Scholar] [CrossRef] [Scilit]
- United Nations Environment Programme. Guidelines for Social Life Cycle Assessment of Products and Organizations 2020; UNEP: Paris, France, 2020. [Google Scholar]
- Ellersdorfer, P.; Ali Khan, M.H.; Lejeune, M.; Kerwick, A.; Nolan, T.; Garcia Martinez, J.; Darling, A.; MacGill, I.; Daiyan, R. Navigating Green Seas: An Open-Source Tool for Costing the Development of Green Shipping Corridors. Fuel 2026, 410, 137870. [Google Scholar] [CrossRef] [Scilit]
- Ishaq, H.; Crawford, C. Review of Ammonia Production and Utilization: Enabling Clean Energy Transition and Net-Zero Climate Targets. Energy Convers. Manag. 2024, 300, 117869. [Google Scholar] [CrossRef] [Scilit]
- Knight, M.; Blanco-Davis, E.; Platt, O.; Armin, M. Life Cycle and Applicational Analysis of Hydrogen Production and Powered Inland Marine Vessels. J. Mar. Sci. Eng. 2023, 11, 1611. [Google Scholar] [CrossRef] [Scilit]
- Huang, J.; Fan, H.; Xu, X.; Liu, Z. Life Cycle Greenhouse Gas Emission Assessment for Using Alternative Marine Fuels: A Very Large Crude Carrier (VLCC) Case Study. J. Mar. Sci. Eng. 2022, 10, 1969. [Google Scholar] [CrossRef] [Scilit]
- Kumar, L.; Sleiti, A.K. Systematic Review on Ammonia as a Sustainable Fuel for Combustion. Renew. Sustain. Energy Rev. 2024, 202, 114699. [Google Scholar] [CrossRef] [Scilit]
- Korberg, A.D.; Brynolf, S.; Grahn, M.; Skov, I.R. Techno-Economic Assessment of Advanced Fuels and Propulsion Systems in Future Fossil-Free Ships. Renew. Sustain. Energy Rev. 2021, 142, 110861. [Google Scholar] [CrossRef] [Scilit]
- Solakivi, T.; Paimander, A.; Ojala, L. Cost Competitiveness of Alternative Maritime Fuels in the New Regulatory Framework. Transp. Res. Part D 2022, 113, 103500. [Google Scholar] [CrossRef] [Scilit]
- Butarbutar, R.; Gurning, R.O.S.; Semin. Prospect of LNG as Marine Fuel in Indonesia: An Economic Review for a Case Study of 600 TEU Container Vessel. Appl. Sci. 2023, 13, 2760. [Google Scholar] [CrossRef] [Scilit]
- Orangi, S.; Manjong, N.; Clos, D.P.; Usai, L.; Burheim, O.S.; Strømman, A.H. Historical and Prospective Lithium-Ion Battery Cost Trajectories from a Bottom-Up Production Modeling Perspective. J. Energy Storage 2024, 76, 109800. [Google Scholar] [CrossRef] [Scilit]
- Trosvik, L.; Brynolf, S. Decarbonising Swedish Maritime Transport: Scenario Analyses of Climate Policy Instruments. Transp. Res. Part D 2024, 136, 104457. [Google Scholar] [CrossRef] [Scilit]
- Duong, P.A. Direct Ammonia Solid Oxide Fuel Cells for Marine Application: Status and Perspectives. Renew. Sustain. Energy Rev. 2026, 235, 116968. [Google Scholar] [CrossRef] [Scilit]
- Zarabi Golkhatmi, S.; Asghar, M.I.; Lund, P.D. A Review on Solid Oxide Fuel Cell Durability: Latest Progress, Mechanisms, and Study Tools. Renew. Sustain. Energy Rev. 2022, 161, 112339. [Google Scholar] [CrossRef] [Scilit]
- Yuksel, O.; Blanco-Davis, E.; Hitchmough, D.; Shagar, G.V.; Spiteri, A.; Di Piazza, M.C.; Pucci, M.; Tsoulakos, N.; Armin, M.; Wang, J. Integrated Approach to Ship Electrification Using Fuel Cells and an Ammonia Decomposition System. J. Mar. Sci. Eng. 2025, 13, 977. [Google Scholar] [CrossRef] [Scilit]
- Yuksel, O. A Comprehensive Feasibility Analysis of Dual-Fuel Engines and Solid Oxide Fuel Cells on a Tanker Ship Considering Environmental, Economic, and Regulation Aspects. Sustain. Prod. Consum. 2023, 42, 106–124. [Google Scholar] [CrossRef] [Scilit]
- Costa, R. Technological Bottlenecks in Fuels for Maritime Decarbonization. J. Mar. Sci. Eng. 2026, 14, 570. [Google Scholar] [CrossRef] [Scilit]
- Fitz, A.C.; Gómez Trillos, J.C.; Sill Torres, F. AIS-Based Estimation of Hydrogen Demand and Self-Sufficient Fuel Supply Systems for RoPax Ferries. Energies 2022, 15, 3482. [Google Scholar] [CrossRef] [Scilit]
- Brouzas, S.; Zadeh, M.; Lagemann, B. Essentials of Hydrogen Storage and Power Systems for Green Shipping. Int. J. Hydrog. Energy 2025, 100, 1543–1560. [Google Scholar] [CrossRef] [Scilit]
- Wang, C.; Peng, Z.; Yang, J.; Zhang, N.; Li, K.; Li, X. Optimal Alternative Fuel Selection for Dual-Fuel Ships Under FuelEU Maritime Regulations: Environmental and Economic Assessment. J. Mar. Sci. Eng. 2025, 13, 1105. [Google Scholar] [CrossRef] [Scilit]
- Lindstad, E.; Eskeland, G.S.; Rialland, A.; Valland, A. Decarbonizing Maritime Transport: The Importance of Engine Technology and Regulations for LNG to Serve as a Transition Fuel. Sustainability 2020, 12, 8793. [Google Scholar] [CrossRef] [Scilit]
- MacFarlane, D.R.; Cherepanov, P.V.; Choi, J.; Suryanto, B.H.R.; Hodgetts, R.Y.; Bakker, J.M.; Ferrero Vallana, F.M.; Simonov, A.N. A Roadmap to the Ammonia Economy. Joule 2020, 4, 1186–1205. [Google Scholar] [CrossRef] [Scilit]
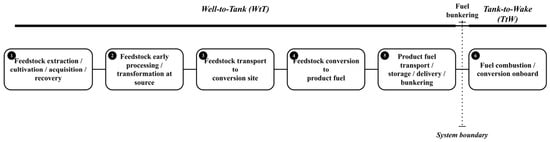
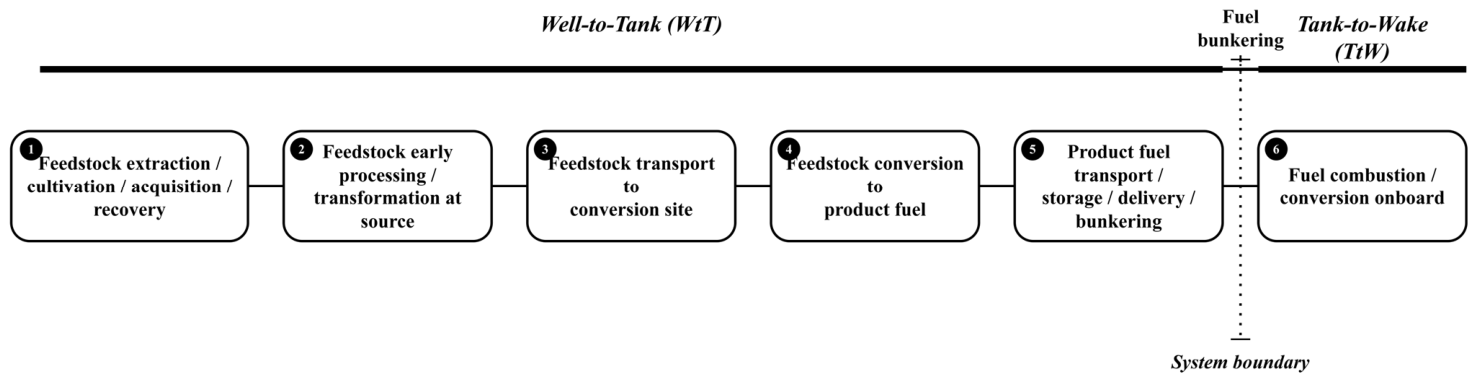
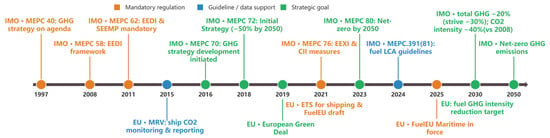
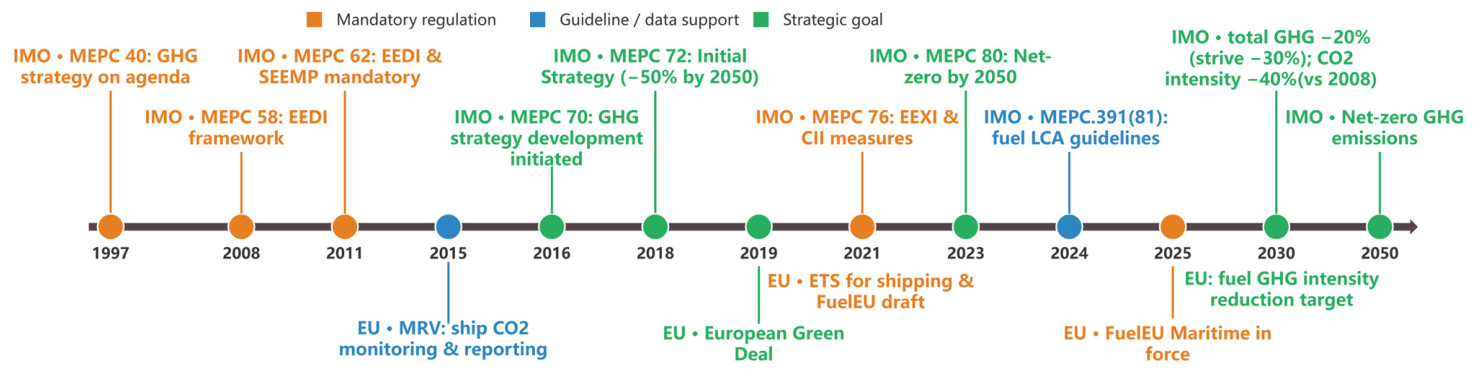
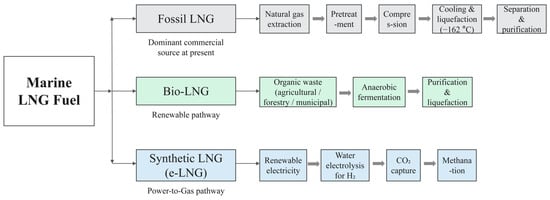
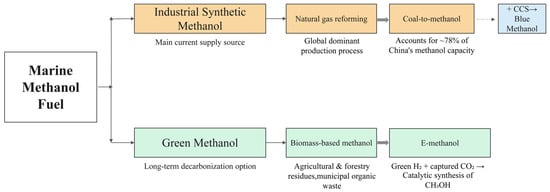
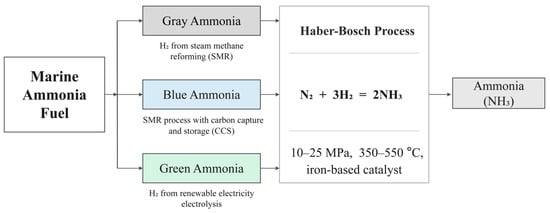
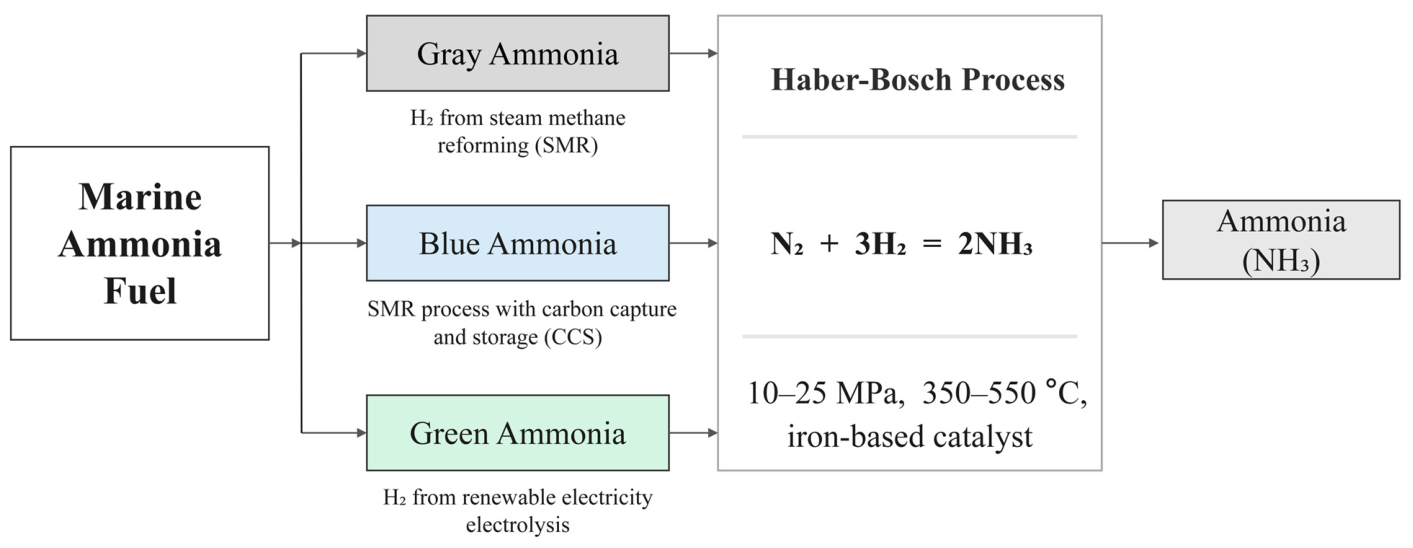
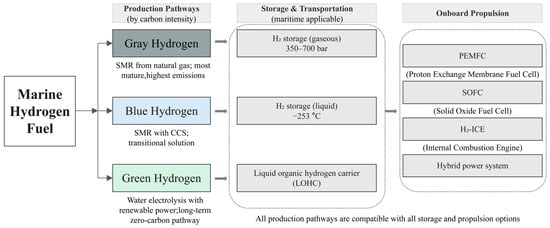
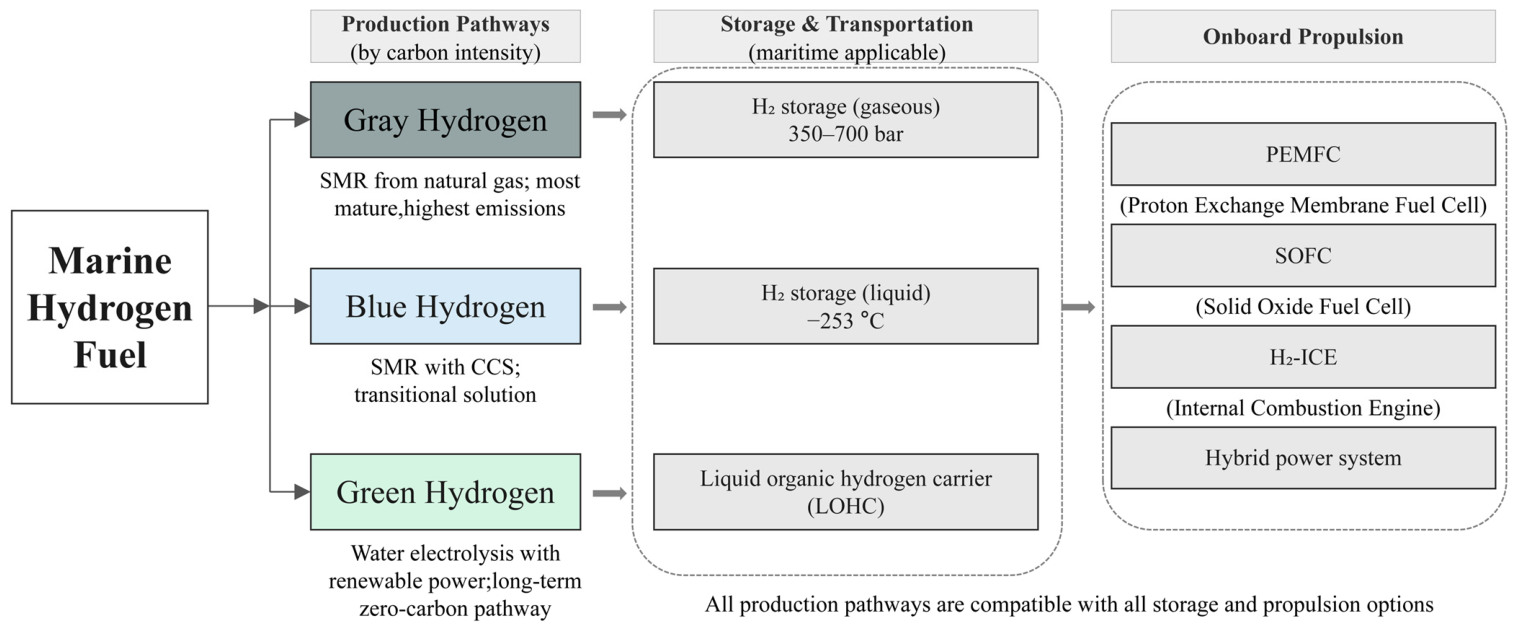
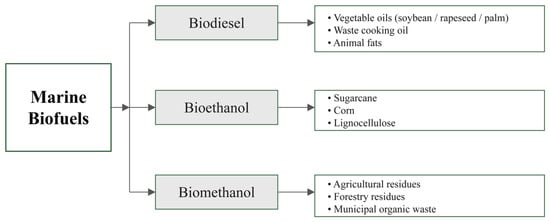
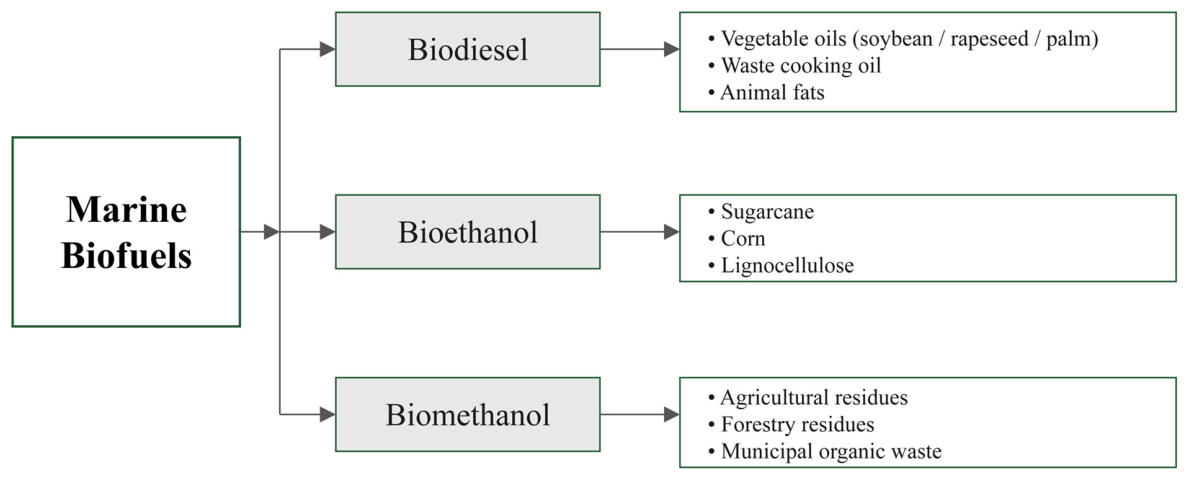
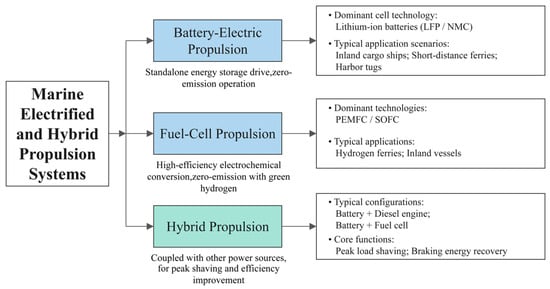
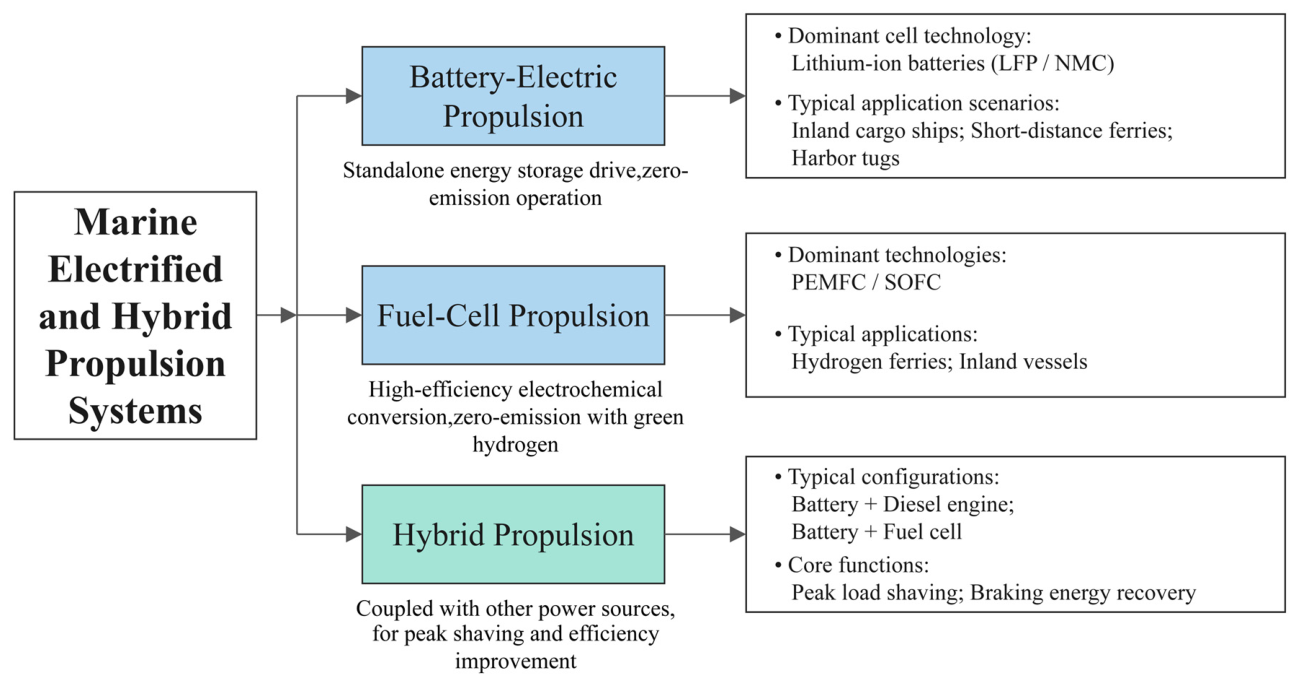
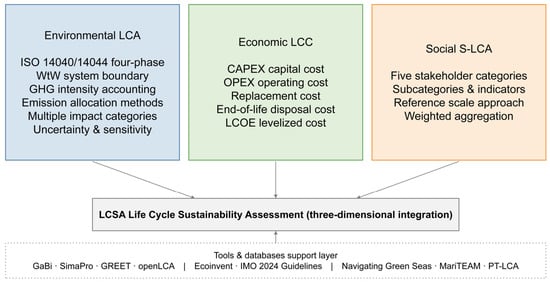
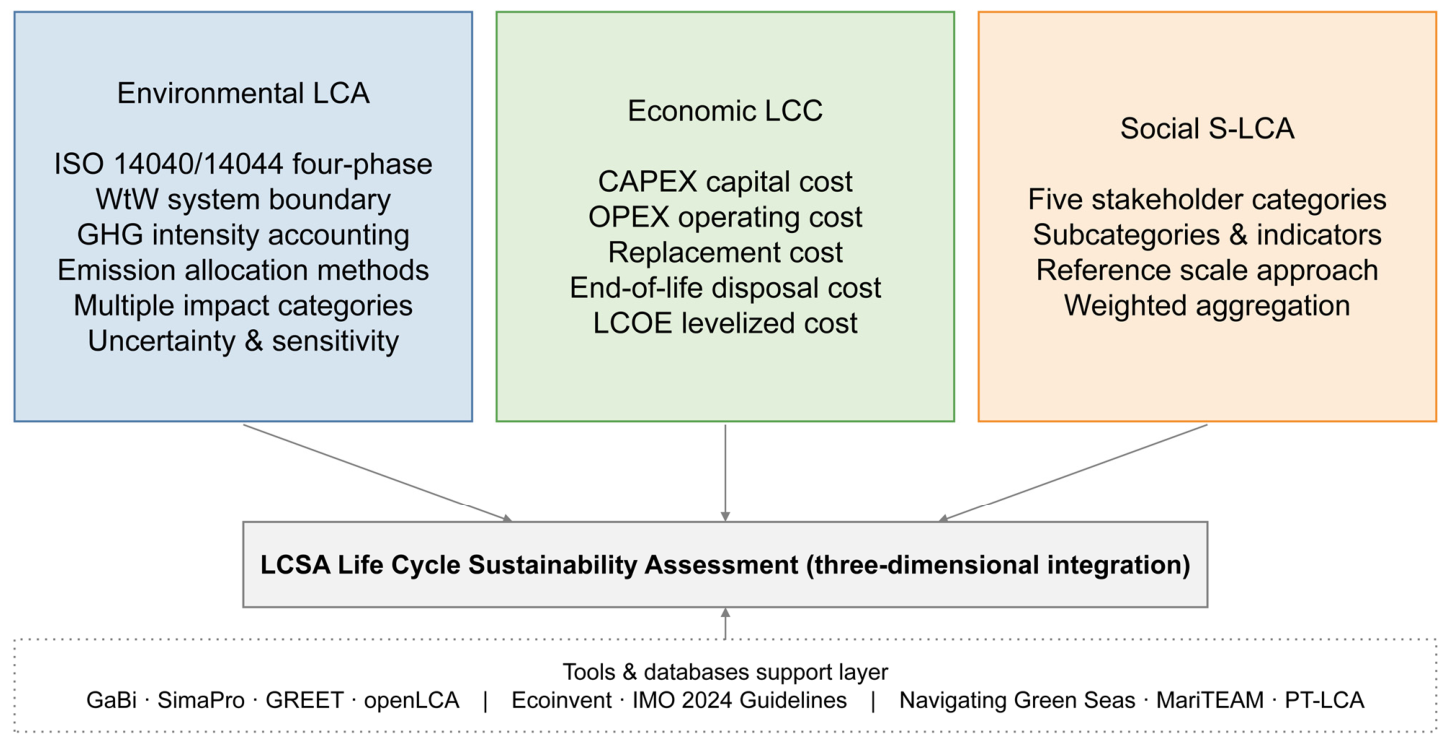
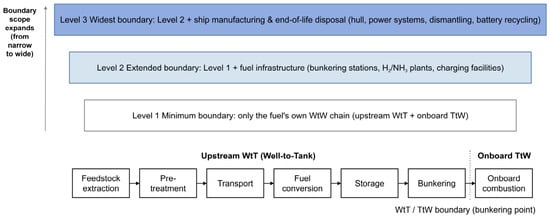
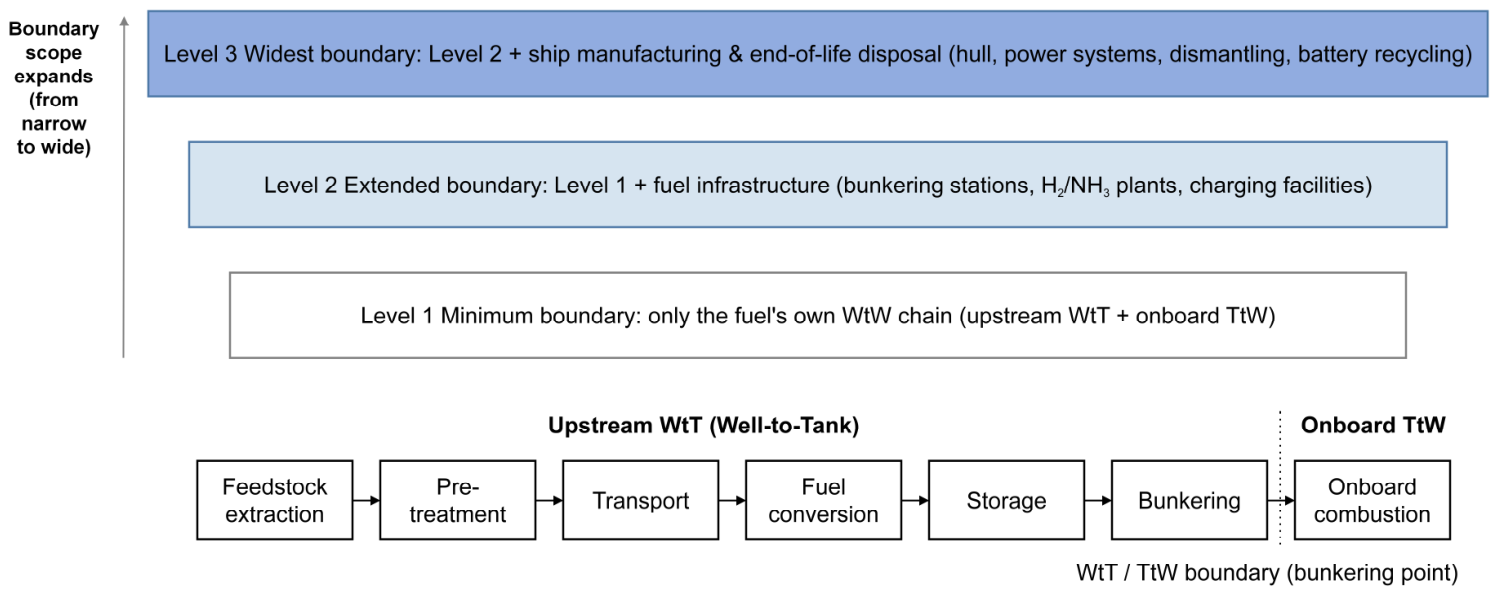
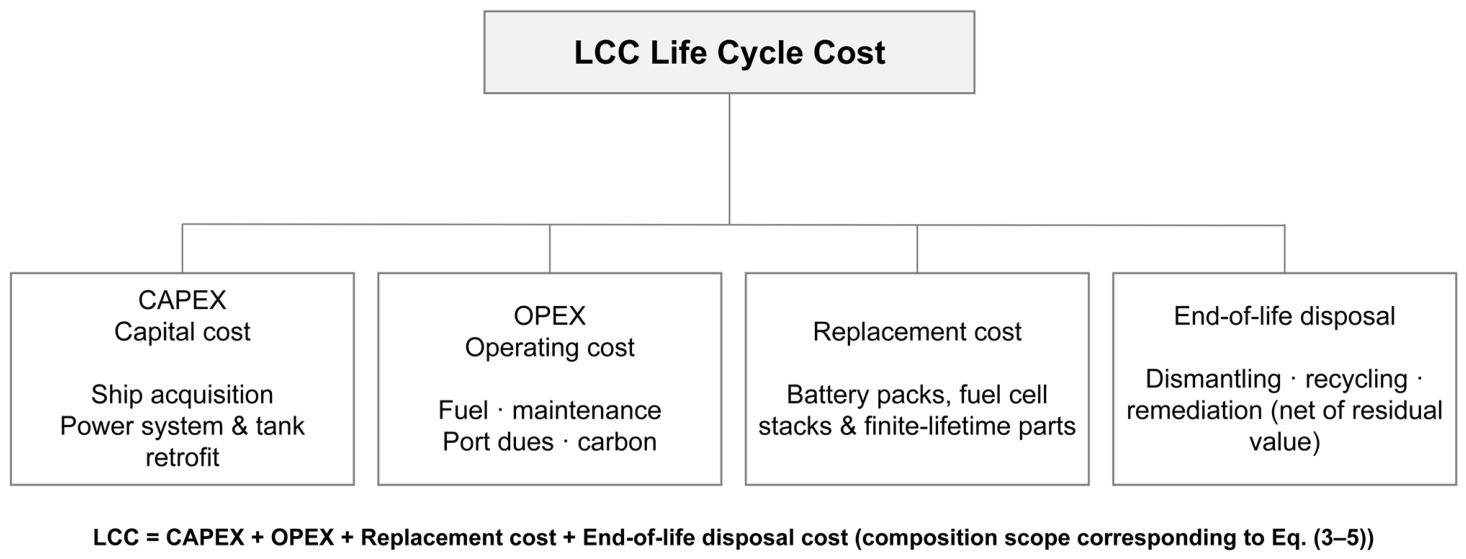
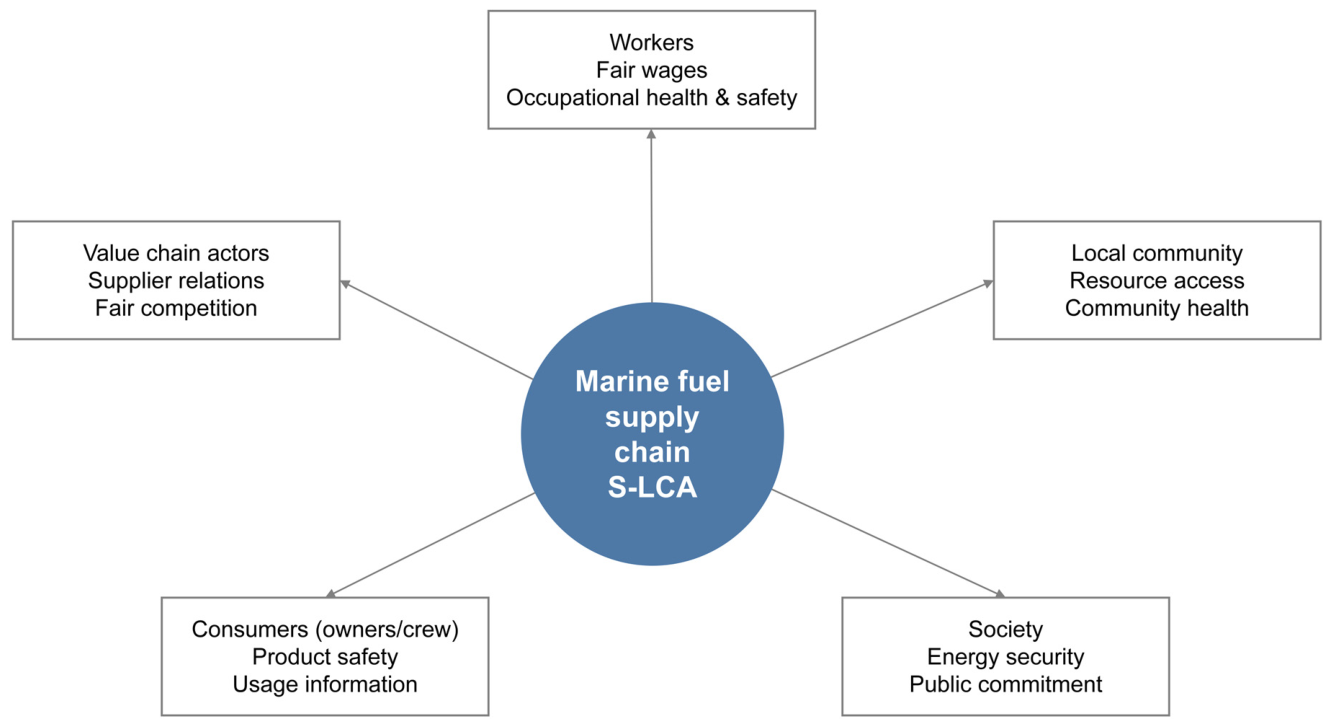
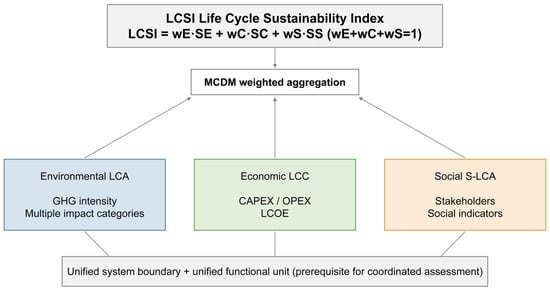
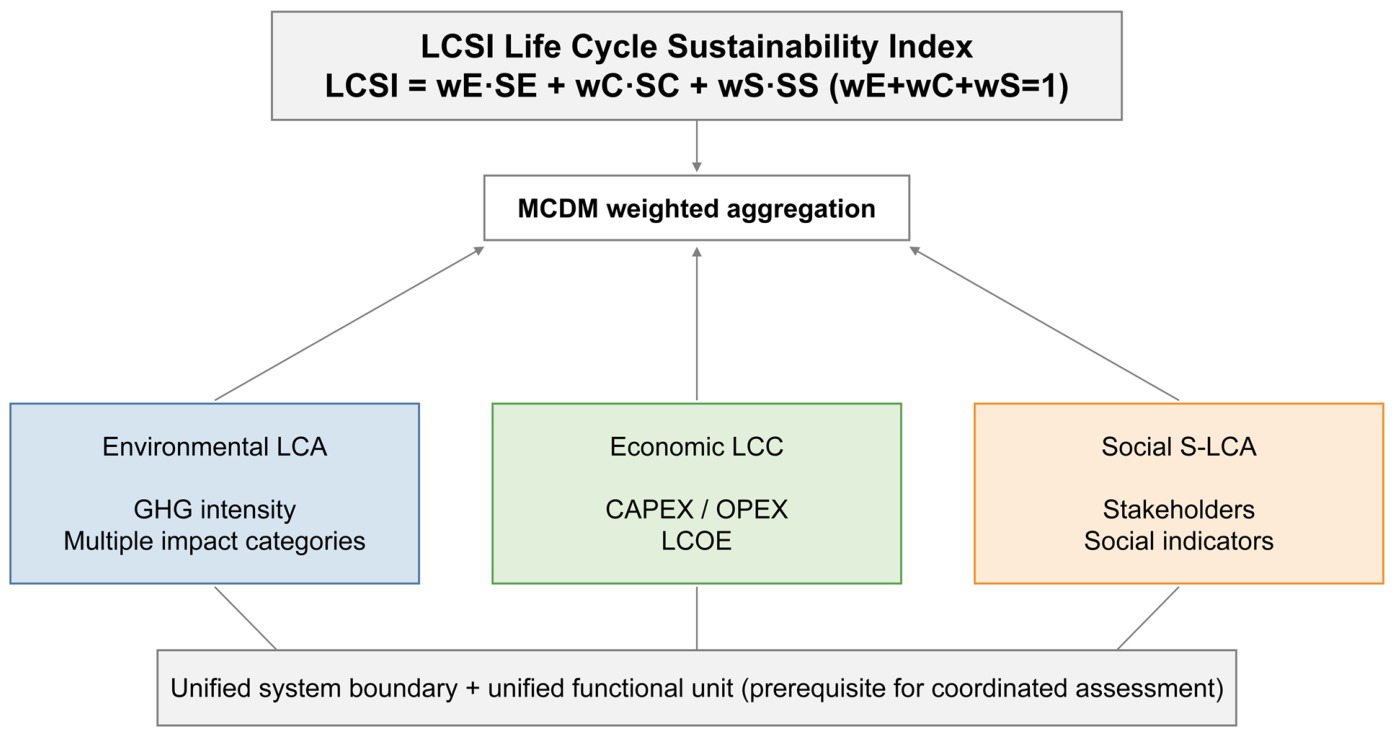
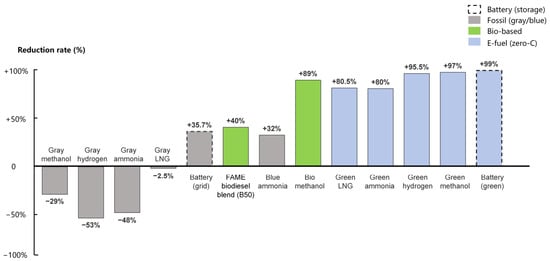
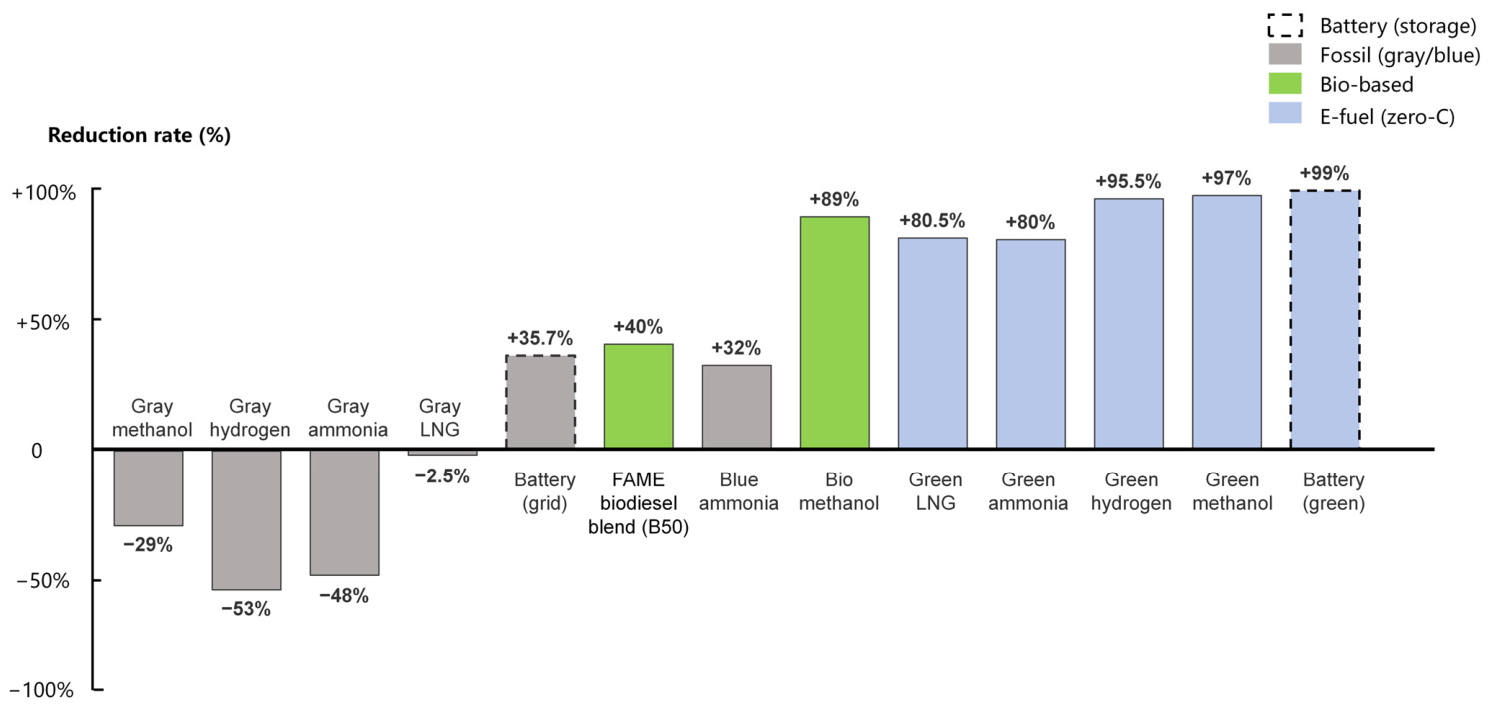
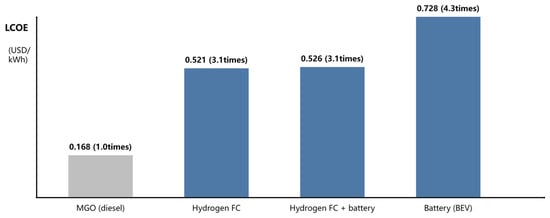
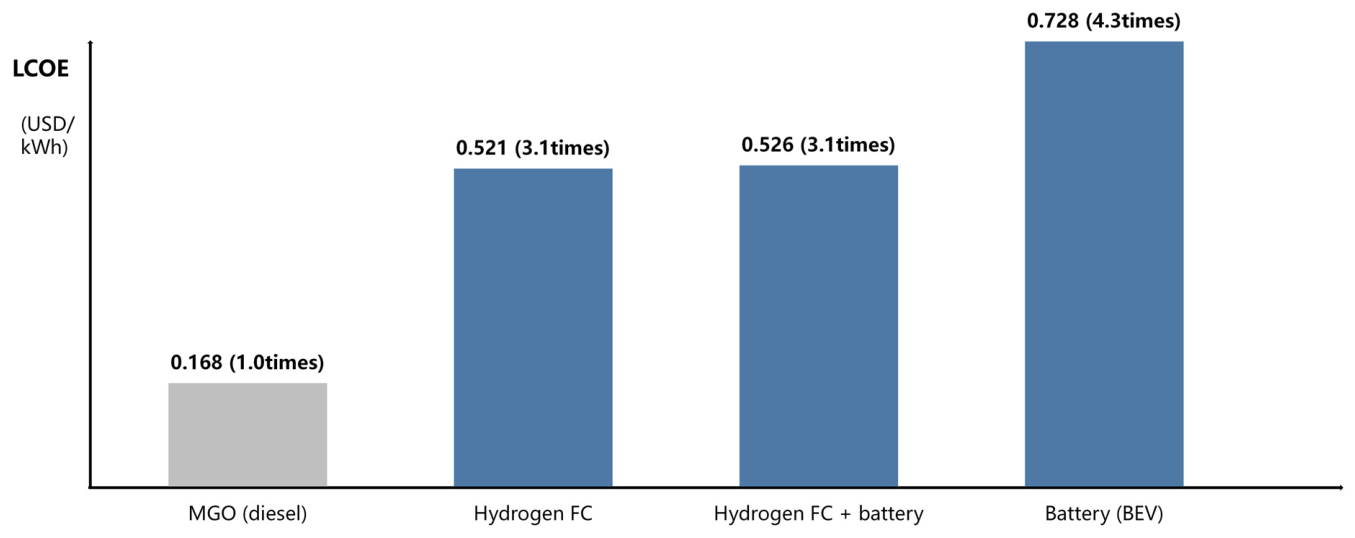
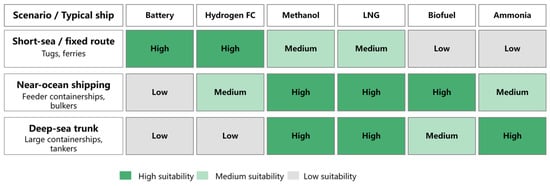
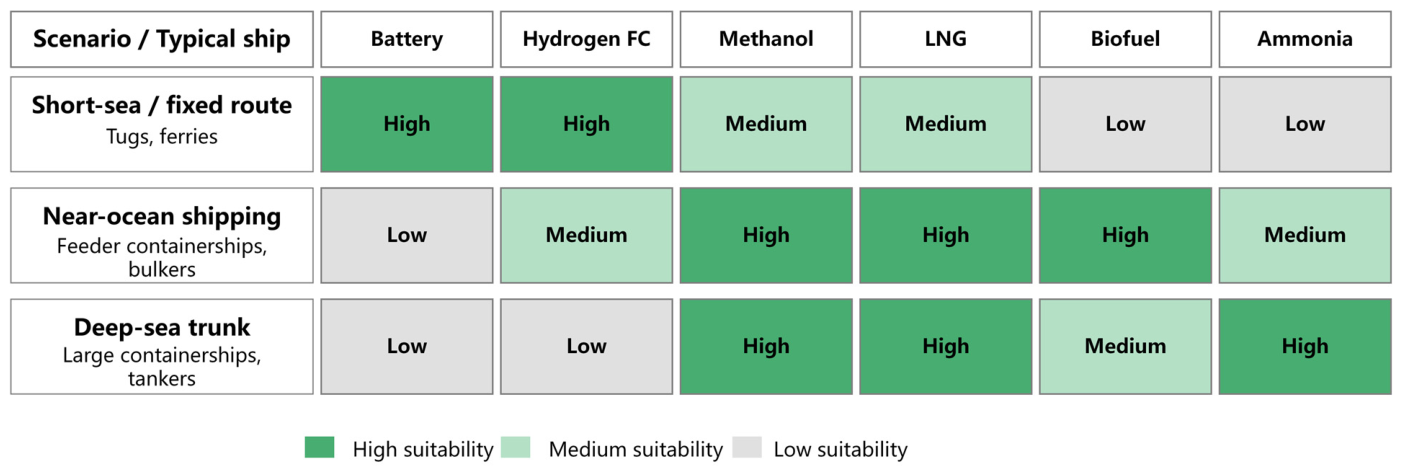

Disclaimer/Publisher’s Note: The statements, opinions and data contained in all publications are solely those of the individual author(s) and contributor(s) and not of MDPI and/or the editor(s). MDPI and/or the editor(s) disclaim responsibility for any injury to people or property resulting from any ideas, methods, instructions or products referred to in the content. |
© 2026 by the authors. Licensee MDPI, Basel, Switzerland. This article is an open access article distributed under the terms and conditions of the Creative Commons Attribution (CC BY) license.