


Abstract
To reduce impact loads during the water entry of a high-pressure escape capsule into waves, this study equips its bottom with a cushioning airbag. A numerical model is developed for the water-entry impact of this airbag-equipped capsule. This model couples the arbitrary Lagrangian–Eulerian (ALE) method with a piston-type wave-generation method, while the airbag’s behavior is captured using the control-volume (CV) method. Numerical simulations and model tests are performed for a hollow wedge block entering water. The numerical approach is validated by comparing the computed acceleration and deformation shapes with experimental measurements. Further numerical simulations are then conducted to analyze the impact loads and motion responses of the airbag-equipped capsule under regular waves. The investigation focuses on the effects of airbag shape, initial entry velocity, entry angle, and wave conditions. The results show that a raft-shaped airbag effectively reduces impact loads and promotes an earlier rebound of the capsule to the water surface. As the entry angle increases, the vertical acceleration first declines and then rises, while the airbag’s buffering effect is weakened and delayed. Moreover, the peak values of vertical acceleration, displacement, and internal airbag pressure under wave conditions are all greater than those in still water. This difference becomes more significant at lower entry velocities.
1. Introduction
Due to their unique advantages, saturation diving systems have been widely adopted by Western maritime powers, including the United States and European nations, for both military and civilian missions such as distressed vessel and submarine rescue, underwater resource exploration, and seabed construction [1]. In an emergency requiring the transfer of a high-pressure escape capsule, onboard saturation divers operate the slide-launching device to drop the capsule directly into the sea. This maneuver avoids secondary transfers and substantially shortens the evacuation procedure, thus improving diver survivability under saturation or decompression conditions. Dropping the capsule from the mother ship’s side represents a typical high-speed water-entry impact problem for large-sized structures. As the capsule strikes the sea surface at high velocity, the air–water density ratio differs by nearly three orders of magnitude. The hull therefore sustains enormous impact loads within an extremely short duration, giving rise to a strongly nonlinear and highly transient fluid–structure interaction problem. Similar water-entry impact phenomena are commonly observed in ship slamming [2], vertical water entry of air-launched torpedoes and missiles [3,4], spacecraft ditching [5], and trans-medium vehicles crossing the free surface [6]. Since Von Karman [7] presented his classic conclusion that impact pressure scales with the square of velocity based on flat-plate theory, and Wagner [8] established his theory of water impact, this topic has remained central to the intersection of ocean engineering and impact dynamics. Over the past five years, research efforts have increasingly shifted from empirical formulas toward high-fidelity numerical methods and multi-physics coupling.
Recent research on still-water entry has focused on applying ALE, SPH, and CEL methods to wedges, AUVs, missiles, and trans-medium vehicles. Chaudhry et al. [9] coupled ALE with FEM to examine hydroelastic effects during flat-nose AUV impact. Wang et al. [10] used ALE to study an air-droppable underwater glider, systematically revealing how entry angle (60–90°) and velocity (5–25 m/s) affect impact acceleration. They found that the simply supported stainless-steel beam in the conventional buoyancy system experienced stresses far above yield under impact. They then proposed an integrated hydraulic block that reduced maximum stress to below 112 MPa. Both 2:1 scale-model tests and sea trials validated the ALE model. Vepa et al. [11] compared ALE, FVM, and SPH for vertical wedge entry and concluded that SPH is more efficient for large free-surface deformations. Yin et al. [12] investigated an air-cushion vehicle dropping on water/land; using membrane theory and the ideal-gas law, they quantified the cushion’s suppression of peak impact—a typical airbag-type buffering approach. Regarding nose geometry and parametric effects, Yang et al. [13] employed a two-phase SPH-Riemann solver to study a cylinder with a semi-enclosed cavity, showing that the cavity significantly reduces slamming and alters motion. Zha et al. [14] used an improved MPS method for low-speed projectiles with four nose shapes (hemisphere and three cone angles), quantifying how nose shape affects cavity evolution and vertical force. Chang et al. [15] used OpenFOAM with overset grids to explore air entrainment and wettability during oblique cylinder entry. Koue and Abe [16] combined SPH with high-speed visualization, revealing that nose geometry controls underwater shock waves and supercavitation intensity. Cui et al. [17] adopted SPH with an open-boundary wave tank to compare slamming loads on convex versus inverted-curved wedges in both still water and waves. Most of these studies, however, used small-scale simplified bodies (wedges, cylinders, or projectiles). Systematic parametric investigations on large-scale engineering carriers equipped with attached buffers (e.g., airbags) in still water remain scarce. For missiles, torpedoes, and high-speed trans-medium vehicles—where entry velocities often reach tens to hundreds of meters per second—the physics become more complex, involving compressible flow, cavitation, and structural failure. Liu et al. [18] developed a compressible multiphase model for shock-wave–cavitation coupling, finding that impact velocity inversely correlates with shock-wave range, while low- and high-pressure zones show negative and positive correlations with velocity, respectively. Zhao et al. [19] used high-speed photography to study the trajectory stability of truncated-cone projectiles during oblique high-speed entry; they noted that the wetted nose area governs cavity shape and trajectory, and that increasing entry angle shortens surface closure time and accelerates velocity decay, with stability varying across velocities and attitudes. Sui et al. [20] tested a slender projectile with a spring buffer in oblique entry, uncovering nonlinear effects of velocity, angle, and spring stiffness on peak impact. Excessively high stiffness raised the peak, whereas larger disk mass reduced the load but induced oscillations—providing design guidelines for buffer attachments. Meng et al. [21] experimentally examined cavity evolution and motion stability during oblique high-speed entry, revealing nonlinear relationships between slenderness ratio/entry angle and velocity decay. They identified entry angle and slenderness as dominant factors affecting trajectory stability and impact loads. Hao et al. [22] applied CEL to a trans-medium vehicle, identifying parametric trends of entry velocity, angle, and attitude on impact acceleration, and they observed a linear correlation between near-section load and velocity squared. Wang et al. [4] classified key high-speed impact loads into three stages—initial slamming, tail-slap, and cavity collapse—offering stage-specific routes for mitigation design. Li et al. [23] combined 3D SPH with physical experiments on a porous plate across different entry velocities, revealing linear positive correlations between velocity and cavity width, pinch-off time, and jet height. In summary, under still-water conditions, nose geometry, entry angle, velocity, shape optimization, and buffer attachments have become core strategies for reducing peak acceleration. Nevertheless, the still-water assumption deviates appreciably from realistic sea states. For large-scale life-saving capsules in particular, wave action alters cavity evolution, slamming phase, and trajectory stability—an issue that warrants dedicated investigation.
Wave phase, height, and direction under real sea conditions significantly alter cavity morphology and trajectory stability during water entry. This topic has become a major frontier in water-entry research. Huang et al. [24] used the VOF method coupled with the Schnerr–Sauer cavitation model to study a 60° projectile entering waves with varying heights, directions, and positions. At a wave height of 1.3 m, the peak impact pressure increased by 30.9% over the still-water value. Wave-crest entry provides better stability but induces larger loads, whereas wave-trough entry suppresses cavity expansion. Wang et al. [25] also investigated projectile wave-entry characteristics. They found that cross-flow induces asymmetric cavities on both sides and promotes tail-slap, while higher entry velocity improves trajectory stability. Wang et al. [26] performed 2D OpenFOAM simulations of cylinder entry in waves, analyzing how wave height and phase affect cavity evolution and hydrodynamics. Peng et al. [27] examined high-speed oblique projectile entry under wave conditions, revealing the combined effects of wave height and phase on peak loads and instability patterns. Liu et al. [28] used RANS with overset grids to study ricochet in low-speed oblique entry. A 5° entry angle triggers ricochet, whereas a 30° angle leads to direct sinking without rebound. Spin also aggravates instability via the Magnus effect. Li et al. [29] investigated hydrodynamic loads and stability for small-angle projectiles. They proposed a stability criterion based on whether the whipping-induced angular velocity decays to zero before the second shoulder impact. Zhou et al. [30] numerically simulated cavity dynamics during the full water-entry–exit–re-entry process of a high-speed projectile crossing a wave surface. Zhang et al. [31] examined sequential dual-projectile entry in waves, observing a significant drag reduction for the trailing projectile. Wei et al. [32] compared the aerodynamic and hydrodynamic performance of trans-medium vehicles during entry and exit in both still water and waves. Most of these studies, however, focus on projectiles with diameters under 100 mm and use simplified geometries. Investigations on the coupling among wave phase, large-scale carriers, and attached buffers remain scarce. For larger marine structures, Liu et al. [33] tested a novel flare barrier on a semi-submersible platform through model experiments. They analyzed its suppression of wave run-up and motion response, as well as slamming on columns under extreme waves. Yu [34] proposed an impact damage model considering hydro-plastic coupling, suggesting that impact velocity should be the dominant parameter rather than design pressure. Wang et al. [35] studied deck slamming using transient focused wave groups, finding that trapped air pockets under gratings contribute significantly to vertical impact loads. Shen et al. [36] performed oblique-entry tests with transparent hollow cylinders. They revealed that the hollow structure shifts the stagnation point to the annular region around the opening, generating a dual-source bubble wake. Liu et al. [37] used large-eddy simulation to investigate vortex evolution during oblique cylinder entry in regular waves. In summary, wave phase (crest, trough, front, and rear) profoundly affects entry loads and trajectory stability. Nevertheless, systematic studies on large-scale engineering structures with buffer attachments—such as escape capsules—entering waves are still lacking. This gap urgently requires further investigation.
Airbags have a long track record in aviation ditching, spacecraft re-entry capsule recovery at sea, air-cushion vehicles, and underwater vehicle retrieval. Simon and Gerry [38] conducted an experimental–numerical study on the forces and deformation of an EH101 helicopter emergency airbag in water—an early representative work on aircraft ditching airbags. Marklund and Nilsson [39] simulated airbag inflation using the ALE method. Their validation confirmed ALE’s suitability for airbag–fluid coupling, which underpins the ALE+CV methodology adopted in this study. In recent years, several studies on re-entry capsule airbags have adopted methodologies similar to the present work. Han et al. [5] developed an FSI model of an airbag-equipped capsule using ALE+CV. They identified vertical velocity as the dominant factor in peak impact, found that increasing attitude angle reduces impact force by over 30%, and noted that entry at the wave trough poses the highest risk. Zhi et al. [40] established a CEL-based numerical model for water-entry recovery of an airbag-equipped structure. They systematically examined how airbag volume, entry velocity, attitude angle, and airbag fixation position affect dynamic recovery characteristics. Yin et al. [12] applied membrane theory and the ideal-gas law to model water–land drop of an air-cushion landing system, verifying the amphibious capability of air-cushion vehicles. For flexible skirts of air-cushion vehicles (ACVs), Jiang and Tang [41] used CV+ALE to study 2D flexible skirt water entry, analyzing effects of initial velocity, Young’s modulus, and pressure ratio. They [42] later extended to 3D simulations, noting that corner zones require 3D modeling to capture local effects. Yuan et al. [43] performed a load inversion study on ACV skirt bags under wave slamming using an impulse-spatial superposition method. Zhuang et al. [44] employed CEL to simulate the hydrodynamic loads and responses of an ACV skirt plate during oblique water entry with ventilation. They conducted sensitivity analyses of velocity, airbag pressure ratio, inclination angle, and mass.
The relationship of the present work to Han et al. [5] should be stated explicitly, since the two studies share the ALE plus control-volume methodology. Where the results agree, the present work provides an independent confirmation of [5] on a different and much larger configuration: the agreement on the severity of wave-trough entry is obtained here for a 16,157 kg capsule with a different airbag and a different wave set, and the mechanism behind it is now identified (Section 3.3). Beyond this confirmation, the present paper adds four elements that are not available in [5]. (i) Object and scale: a 5.81 m long, 16,157 kg saturation escape capsule released from a mother ship is analyzed, rather than a small re-entry capsule, so the airbag-to-payload volume ratio, the entry velocities (6–24 m/s) and the tolerance requirements differ substantially. (ii) Airbag design: three configurations (square, cylindrical and raft-shaped) are compared, and a selection criterion based on whether the capsule returns to the surface is established; the advantage of the raft shape is traced to the confinement produced by its skirt rather than to its size (Section 3.1). (iii) Structural modeling: the hull is modeled as an elastic body rather than a rigid body, so that both the acceleration transmitted to the crew position and the structural response are obtained, and the tolerance assessment is made at the crew position with a direction-specific limit (Section 3.1 and Section 3.2). (iv) Wave conditions: a wave-height series (0.7, 1.5 and 2.0 m) and an explicit wave-phase study (crest, front slope and trough) are added, and the trough result of [5] is explained quantitatively through the vertical acceleration and the curvature of the free surface rather than through the orbital velocity (Section 3.3).
This study investigates the wave-entry behavior of a saturation escape capsule under varying velocities and attack angles. Three airbag configurations—cylindrical, square, and raft-shaped—are analyzed to assess their effects on impact loads and motion responses. The remainder of this paper is structured as follows. Section 2 describes the materials and methods, including the ALE coupling method, the numerical model (structure domain, fluid domain, and wave modeling), and the validations of the ALE method, the numerical wave tank, and the airbag simulation method. Section 3 presents the numerical simulation analysis, covering the airbag configuration selection and cushioning performance evaluation, the effect of entry angle, and the effect of waves. Section 4 summarizes the main conclusions.
2. Materials and Methods
2.1. ALE Coupling Method
Fluid–structure interaction in this study is simulated using the arbitrary Lagrangian–Eulerian (ALE) method. The ALE implementation available in the commercial code LS-DYNA (ANSYS 2022 R1, ANSYS Inc., Canonsburg, PA, USA) is employed to model the water-entry impact of the escape capsule. The ALE formulation allows the computational mesh to move arbitrarily relative to the coordinate system. This flexibility avoids the severe mesh distortion inherent in the pure Lagrangian approach, while also overcoming the deficiencies of the pure Eulerian method in treating moving boundaries and convective transport. The ALE method is applicable to large deformation, free-surface flow, and fluid–structure interaction problems, but it generally requires a higher computational cost, and the interface reconstruction and convective transport may introduce numerical dissipation; its accuracy for strong fragmentation and splashing problems is lower than that of meshless methods such as SPH. Considering the large deformation characteristics, moving boundaries, and the requirements of computational efficiency and structural coupling in the escape capsule water entry, the ALE method is finally adopted in this study.
The ALE description is expressed in terms of the material coordinates and their derivatives with respect to a reference frame, as follows:
where Xi denotes the Lagrangian coordinate, xi the ALE coordinate, vi the material velocity, and ui the mesh velocity.
A relative velocity wi is defined as wi = ui — vi. The ALE formulation is governed by the conservation equations of mass, momentum, and energy, respectively expressed as: [45]
where bi is the body force, ρ is the density, E is the specific energy (energy per unit mass), and σij is the Cauchy stress tensor. In this study, the fluid is assumed to be inviscid, and the viscous stress is neglected. Therefore, the Cauchy stress tensor is simplified as σij = −pδij, where p is the pressure and δij is the Kronecker delta. In addition, considering the relatively high entry velocity and large characteristic dimensions in this study, surface tension is negligible compared with inertial forces. Taking the maximum entry velocity of 24 m/s, a characteristic length of 5.81 m, a water density of 1000 kg/m3, and a surface tension coefficient of 0.072 N/m as an example, the Weber number is We = ρU2L/σ ≈ 4.65 × 10⁷, which is far greater than 1, indicating that the surface tension effect is extremely small. Therefore, surface tension is neglected in this study.
2.2. Numerical Model
2.2.1. Structure Domain
Figure 1 shows the schematic diagram of the calculation domain for the airbag-equipped high-pressure escape capsule under wave conditions. The model comprises the escape capsule and the fluid domain. The capsule consists of the main structure, which is composed of the square steel base, the round tube frame, and the capsule body, and a bottom-mounted airbag. The escape capsule main structure is made of AH36 shipbuilding steel (GB/T 712-2011; Wuyang Iron and Steel Co., Ltd., Wuyang, China). Its overall dimensions are length Ls, width Bs, and height Ds, with a total weight of Ws. The airbag is made of a coated polyester fabric (Qingdao Luhang Marine Airbag Co., Ltd., Qingdao, China) and is modeled using LS-DYNA’s fabric material (type 34). Three airbag configurations are examined: square, cylindrical, and raft-shaped. The material parameters are shown in Table 1.
Figure 1.
Schematic diagram of calculation domain for high-pressure escape cabin with airbags under wave conditions.
Table 1.
The material parameters for the escape capsule main structure and airbag.
The escape capsule is discretized using Lagrangian shell elements of type 163. The element size is 40 mm, and the structural plate thickness is 0.01 m. The steel material is modeled with *MAT_ELASTIC, with its parameters listed in Table 1. In the finite element model, these material properties are directly assigned to the corresponding shell elements through the constitutive model to calculate the structural stress and deformation. The capsule dimensions are length Ls = 5.81 m, width Bs = 2.55 m, and height Ds = 3.085 m, giving a total weight of Ws = 16,157 kg. Gravity is applied using *LOAD_BODY_Y in accordance with the established coordinate system. Coupling between the structural model and the fluid domain is achieved via *CONSTRAINED_LAGRANGE_IN_SOLID. The penalty factor is automatically calculated by LS-DYNA based on the fluid material density and wave speed, and a scale factor of 0.1 is applied to ensure stable coupling. The initial entry velocity is prescribed using *INITIAL_VELOCITY_NODE.
The airbag cushioning system is modeled using the control-volume (CV) method. The airbag is made of fabric material defined by *MAT_FABRIC (LS-DYNA type 34). This material formulation realistically captures the airbag’s behavior during impact, including inflation, compression, and subsequent deformation. The airbag is filled with dry air, and its thermodynamic state is governed by the *AIRBAG_WANG_NEFSKE keyword, which conveniently allows the specification of initial internal pressure and venting pressure threshold. The fabric thickness is 0.001 m. For the venting process, the vent area is 0.02 m2, and the discharge coefficient is 0.6. In all cases considered in this study the peak internal pressure remains below the venting threshold: the highest value, 0.134 MPa at 0° entry (Section 3.2), is 1.32 PE, whereas the vent opens at Pvent = 1.5 PE = 0.152 MPa. The vent therefore does not open during the impact, and the vent area and the discharge coefficient have no influence on the results reported here; they are retained in the model for generality and for potential cases of higher impact severity. Consequently the rebound of the capsule is produced by the elastic energy stored in the compressed gas together with the buoyancy of the airbag, and not by venting. A vent that did open would reduce the internal pressure and hence limit both the peak pressure transmitted to the capsule and the rebound height.
The explicit dynamic solver of LS-DYNA is employed for the water-entry impact simulation. The structural domain (escape capsule) is discretized with Lagrangian shell elements (type 163) of 40 mm characteristic size and 0.01 m plate thickness, which gives approximately 5.1 × 10⁴ shell elements; the fluid domain (water and air) is discretized with a uniform ALE mesh of 80 mm, which gives 7.8 × 10⁶ solid elements for the 34 m × 9 m × 10 m tank; and the airbag fabric is discretized with shell elements of 40 mm, which gives approximately 6.6 × 10⁴ elements. The mesh is uniform within each region and no local refinement is applied, so the element count scales directly with the volume of the domain. Fluid–structure coupling is achieved with the penalty method (*CONSTRAINED_LAGRANGE_IN_SOLID), and the contact algorithm is based on the penalty function. Hourglass control is set to type 4 (Flanagan–Belytschko stiffness form). The finite element model was established and all results were post-processed with LS-PrePost 4.10 (×64) (ANSYS Inc., Canonsburg, PA, USA).
The central difference method is used for time integration. The stable time step follows from the CFL condition and is governed by the smallest structural shell element; with a characteristic length of 40 mm and a steel sound speed of cs = √(E/ρ) = 5.2 × 10³ m/s, the critical time step is Δt = ℓc/cs ≈ 7.7 × 10⁻⁶ s, and the step actually used is 4.0 × 10⁻⁶ s after allowance for the shell thickness and for the coupling stiffness. No mass scaling is applied, so the total mass of the model is unchanged and no artificial inertia is introduced. Because the solver step is of the order of microseconds, the state is written at intervals of 0.001 s for the still-water cases and 0.01 s for the wave cases; these are output intervals, not the solver time step.
To verify mesh convergence, three shell meshes of the capsule structure (60, 40 and 30 mm) and three airbag meshes (60, 40 and 30 mm) were compared. The errors decrease monotonically with refinement, and the production meshes deviate from the finest meshes by 2.4% in peak acceleration at the capsule and 1.2% in peak internal airbag pressure (airbag). The 40 mm capsule mesh and the 40 mm airbag mesh are therefore adopted.
2.2.2. Fluid Domain
The fluid domain measures length L, width B, and height D, with the water region occupying a height of h and a density of ρ. A Cartesian coordinate system is adopted, with the x-axis aligned with the wave propagation direction and the gravitational acceleration acting along the negative y-axis.
The tank model consists of the fluid domain and the flap. Both the air and water regions within the fluid domain are discretized using ALE elements. Their equations of state are implemented via the keywords *EOS_LINEAR_POLYNOMIAL (for air) and *EOS_GRUNEISEN (for water), as listed in Table 2 and Table 3, respectively. Two types of boundary conditions are applied to the tank: constrained and non-reflecting. The boundary conditions of the tank mainly adopt non-reflective boundary conditions and constrained boundary conditions. The bottom of the tank is constrained by the beam boundary condition *BOUNDARY_SPC_SET, while other boundaries are treated with the non-reflective boundary condition *BOUNDARY_NON_REFLECTING to dissipate waves and avoid the influence of wave reflection on the calculation results. The fluid domain mesh size is 80 mm. To verify the convergence of the fluid domain mesh, three meshes of 80 mm, 60 mm, and 40 mm are compared. The differences in wave height and peak slamming pressure are all less than 3%, so the 80 mm mesh is selected for subsequent calculations.
Table 2.
Water EOS parameters.
Table 3.
Air EOS parameters.
The size of the fluid domain is chosen to balance computational accuracy and efficiency, and its adequacy is assessed against the wave parameters actually used. For a regular wave of H = 0.7 m and T = 3.4 s in a water depth of 10 m, the dispersion relation ω2 = gk tanh(kh) gives k = 0.349 rad/m, kh = 3.49, tanh(kh) = 0.998 and λ = 18.01 m; the wave is therefore effectively deep-water, so the bottom exerts no influence on it. The tank is 34 m long; 9 m wide, i.e., 3.5 times the capsule width; and 13 m high, with 10 m of water (h = 0.56λ, i.e., greater than λ/2) and 3 m of air. The length of the tank corresponds to 1.89 wavelengths, and a damping zone is applied at the downstream end to absorb the reflected wave.
Two quantitative checks show that this is adequate for the present purpose. First, the entry analysis covers only 0.5 s after contact, during which the wave crest travels 2.65 m at c = λ/T = 5.30 m/s, whereas a wave reflected at the downstream boundary would need at least 3.4 s to return to the structure even if the structure were placed only 9 m from that wall; a reflected wave therefore cannot reach the structure within the analysis window. Second, the incident wave recorded at the monitoring point 10 m from the piston is reproduced by linear theory to within 1.43% in elevation, which shows that the incident wave is not contaminated during the generation stage. A tank of about five wavelengths would be preferable for simulations of longer duration.
2.2.3. Wave Modeling
A numerical wave tank is established in LS-DYNA using a piston-type wave generator. The piston motion is prescribed using *PRESCRIBED_MOTION_RIGID.
The piston motion is prescribed by velocity–time functions, defined in Equations (5)–(8), to generate different wave conditions. In these equations, V(t) is the piston velocity, S denotes the piston stroke, and ω is the angular frequency. The other parameters include the wave number kp, regular-wave wavelength λ, wave height H, period T, still-water depth h for the target wave-generation zone, and gravitational acceleration g.
Once the target wave parameters—namely wavelength, height, and period—are specified, the piston motion equation can be determined.
V(t) is the horizontal velocity component of the piston along the x-axis and is a scalar function. Since the piston oscillates only along the x-direction, the velocity vector is v = (V(t), 0, 0).
ω2 = gkp ⋅ tanh(kph)
The time step of the numerical wave tank is automatically controlled by the CFL condition, and the output interval is 0.01 s. To verify the convergence of wave simulation, a sensitivity analysis of mesh and time step is conducted at the monitoring point 10 m from the flap. Three fluid meshes of 80 mm, 60 mm, and 40 mm, and three output intervals of 0.02 s, 0.01 s, and 0.005 s are compared. The relative errors of wave height and period are all less than 5%, indicating that the numerical wave tank in this study is converged.
All numerical simulations in this study are performed using the explicit dynamic solver in LS-DYNA. The computations are carried out on a high-performance computing cluster, with 64 CPU cores used in parallel for each case and a memory usage of approximately 32 GB. The computational time for a single still-water-entry case is about 12 h, while for a wave entry case it is about 28 h due to the larger mesh and longer simulation time. All cases adopt the same parallel efficiency and solver settings. The computational cost is acceptable and meets the requirements of the parametric study.
2.3. Validation of the ALE Method
To assess the accuracy and feasibility of the ALE method for simulating structural water-entry impact, a numerical model of a hollow wedge entering water was first established using the ALE approach. Corresponding physical tests were then conducted using a fabricated hollow wedge specimen. An accelerometer (DH186 IEPE piezoelectric accelerometer, Jiangsu Donghua Testing Technology Co., Ltd., Jingjiang, China; sensitivity 10 mV/g, measurement range ±50 g) and a high-speed camera (Revealer 2F04, Hefei Fuhuang Junda Hi-Tech Co., Ltd., Hefei, China; 2000 fps at a resolution of 1280 × 1024 pixels) were employed to measure the vertical acceleration and the deformation morphology of the wedge during water entry. The acceleration signal was acquired at a sampling rate of 10 kHz by a DH5922N dynamic signal acquisition system (Jiangsu Donghua Testing Technology Co., Ltd., Jingjiang, China). The numerical predictions were subsequently compared against the experimental measurements. The tests were carried out in a glass-walled tank filled with tap water at the Yantai Research Institute of Harbin Engineering University, Yantai, China. The hollow wedge specimen has a length of 0.3 m, width of 0.2 m, and height of 0.1 m. Its shell thickness is 0.005 m, deadrise angle is 45°, mass is approximately 5.5 kg, and the material is Q235 steel (Q235B, GB/T 700-2006; Baoshan Iron & Steel Co., Ltd., Shanghai, China). The initial water-entry velocity was about 1.95 m/s. Figure 2 presents the test setup and a comparison of the vertical acceleration histories obtained numerically and experimentally.
Figure 2.
A comparison of experimental and numerical vertical water-entry impact acceleration for the hollow wedge.
Figure 3 compares the numerical and experimental water-entry morphologies at three time instants (t = 0.250 s, 0.255 s, 0.265 s). As shown in Figure 2 and Figure 3, the acceleration curves and deformation patterns predicted by the ALE method agree well with the experimental data. The vertical acceleration rises sharply from the initial gravitational value of 9.8 m/s2 to a peak and then decays gradually. The peak acceleration measured experimentally is approximately 19.383 m/s2, while the ALE-predicted peak is about 19.173 m/s2, yielding a relative error of only 1.08%. These results demonstrate that the ALE method yields simulations consistent with experimental observations, confirming its suitability for modeling water-entry problems of structures.
Figure 3.
A comparison between experimental photographs and numerical simulations of the vertical water-entry morphology of the hollow wedge at different time instants.
To quantitatively evaluate the agreement between simulation and experiment, three representative time instants (t = 0.250 s, 0.255 s, and 0.265 s) are selected, and the experimentally measured water-entry depths of the wedge are compared with the numerical results. In the experiment, the water-entry depth is measured using a ruler, while in the simulation it is determined from the displacement of the lowest point of the wedge. The relative errors of water-entry depth at the three time instants are 0.81%, 1.19%, and 0.93%, respectively, all less than 3%. This indicates good agreement in both water-entry depth and timing.
It should be noted that the fine-scale structures and droplets observed in the experiment are not fully reproduced in the numerical simulation. This is mainly attributed to two reasons: first, due to computational resource constraints, the mesh cannot be further refined to resolve droplet breakup; second, the ALE method has inherent limitations in capturing strong fragmentation and splashing, with lower accuracy than meshless methods such as SPH. These local phenomena do not affect the main conclusions of this study regarding impact loads and overall motion response.
2.4. Validation of the Numerical Wave Tank
The geometric configuration of the wave tank is illustrated in Figure 4. It is mainly composed of the fluid domain and the piston, and the material of the fluid domain is consistent with that described above. To validate the numerical wave tank, the fluid domain is set to dimensions of 34 m in length, 9 m in width, and 13 m in height. The water region occupies the lower 10 m, while the air region fills the upper 3 m. The piston is modeled as a rigid steel body. A regular wave with a height of 0.7 m and a period of 3.4 s is generated using the piston-type wave generator. Substituting these parameters into Equations (6)–(8) yields a piston stroke of S = 0.355 m and an angular frequency of ω = 1.85 rad/s. The resulting piston motion equation is given as follows:
V(t) = 0.33 × cos(1.85t)
Figure 4.
Wave tank diagram.
It should be noted that the theoretical wave solution used for comparison is based on linear wave theory, which assumes an inviscid, incompressible fluid and neglects surface tension effects. These assumptions are consistent with those adopted in the numerical model (see Section 2.1, where the fluid is assumed to be inviscid and surface tension is neglected). Therefore, the comparison between the numerical and theoretical wave elevations is performed under identical physical assumptions, ensuring a consistent validation basis. Future work will focus on further validating the numerical wave tank using experimental data.
With the above parameter settings, a regular wave is generated in the numerical wave tank. The free-surface elevation was recorded at a monitoring point located 10 m from the flap. The measured time series was then compared with the theoretical wave profile, as shown in Figure 5. Figure 5 indicates that the generated wave elevation begins to stabilize at t = 25 s. After stabilization, the numerical wave matches the theoretical wave well in terms of period, though a slight discrepancy in wave height is observed. At the monitoring point, the trough elevation is approximately −0.345 m, and the crest elevation is about 0.348 m. The maximum relative errors for the trough and crest elevations are 1.43% and 0.57%, respectively. These results confirm that piston-type wave generation is feasible and yields acceptable accuracy, providing a reliable foundation for subsequent analyses.
Figure 5.
The time history of wave elevation at the monitoring point (10 m from the flap).
2.5. Verification of the CV Airbag Model
It should be stated at the outset that the benchmark used in this section is a verification rather than a validation of the airbag–water model. The reference of Huang et al. [46] is a numerical study of an airbag-equipped load landing on a rigid ground; it therefore verifies the implementation of the gas thermodynamics of the CV method and of the fabric membrane response, but it does not exercise the coupling between the airbag and the water. The coupling of the fluid solver with the Lagrangian structure is validated separately in Section 2.3 against the water-entry test of the hollow wedge. The two ingredients of the complete airbag–water model are thus verified/validated separately, but the complete system has not been validated against a dedicated airbag water-landing test, and this is stated as a limitation below.
To validate the effectiveness of the CV method for airbag simulation, a numerical model is established in LS-DYNA and compared with the existing literature [46]. The model mainly consists of two parts: the airbag and the landing equipment. The landing equipment is an upper rectangular block with dimensions of 4.5 m × 3.0 m × 0.4 m and a mass of 4685.2 kg, and it is set as a rigid body. The airbags are two lower cylindrical airbags, each with dimensions of 2.0 m × 1.0 m × 0.01 m. The airbag material is described using *MAT_FABRIC, and the material parameters are listed in Table 1. The lowest end of the airbag is 1.0 m above the ground, and the initial downward velocity is 5 m/s. The finite element model is shown in Figure 6.
Figure 6.
Airbag simulation model.
With the above parameter settings, the airbag simulation can be carried out in LS-DYNA, and the time-history curve of the internal airbag pressure can then be extracted. As shown in Figure 7, the internal airbag pressure curve obtained by the CV method agrees well with the literature data in terms of both variation trend and peak value. The internal airbag pressure gradually increases from its initial value to a peak, then decreases rapidly and tends to stabilize. This indicates that the CV method based on LS-DYNA can effectively simulate the airbag cushioning process. The simulation results are reliable and can serve as a foundation for subsequent research.
Figure 7.
Variation in internal airbag pressure.
It should be emphasized that, in the absence of a dedicated water-landing test of an airbag-equipped capsule, the present model relies on a composite argument: the fluid–structure coupling is validated against the water-entry test of Section 2.3, and the CV airbag model is verified against the published airbag benchmark of [46]. The lack of a direct airbag–water validation experiment is acknowledged as the main limitation of this study and is the primary direction for future work.
3. Numerical Simulation Analysis
Using the validated ALE method described above, this section addresses three main tasks. First, the cushioning performance of square, cylindrical, and raft-shaped airbags is compared under still-water conditions to identify the most effective configuration. Second, the effect of entry angle on airbag cushioning is examined. Third, the water-entry impact loads and motion responses of the airbag-equipped capsule under wave conditions are analyzed and compared with those in still water, to identify the effects of wave environment on the capsule’s behavior.
3.1. Airbag Configuration Selection and Cushioning Performance Evaluation
In an emergency, one deployment method for the high-pressure escape capsule from the mother ship is to lift it by crane and drop it vertically into the sea. The initial entry velocity, and thus the impact load, varies with the drop height. It is therefore essential to first investigate the vertical water-entry impact loads of the capsule at different drop heights. These results will serve as the baseline for subsequent studies of the airbag-equipped capsule. Based on a review of the typical dry-deck clearances of existing mother ships, four release heights are selected: 2 m, 7.5 m, 16.5 m, and 29.5 m. Two monitoring points are used throughout this paper. Point P1 is located on the square steel base, the lowest component of the capsule and the first to touch the water; it characterizes the local slamming load transmitted through the base. Point P2 is located on the floor of the capsule body directly beneath the crew seats; it characterizes the acceleration experienced by the occupants. Because the occupant tolerance must be judged at P2 whereas the local structural load is characterized at P1, both points are reported in Section 3.2 and every comparison is made between values at the same point. The corresponding initial vertical entry velocities are 6 m/s, 12 m/s, 18 m/s, and 24 m/s, respectively. Using these as initial conditions, the vertical acceleration histories of the capsule without airbags in still water are obtained numerically, as shown in Figure 8. The material and domain parameters are those listed in Table 1, Table 2 and Table 3. The total simulation duration is 0.2 s, and the output interval is 0.001 s. To accurately capture the slamming peaks and remove numerical noise, a 300 Hz low-pass filter was applied to the acceleration data.
Figure 8.
A comparison of acceleration time histories for the capsule without an airbag at different initial entry velocities in still water.
Figure 8 shows that the vertical acceleration time histories for different drop heights follow similar patterns. In each case, the acceleration rises to a distinct peak and then gradually decays to a steady level. A higher drop height leads to a larger initial entry velocity and consequently a higher peak acceleration. Specifically, for entry velocities of 6 m/s and 12 m/s, the peak accelerations at the crew position P2 are 176.18 m/s2 and 258.76 m/s2, respectively, both below the human tolerance threshold of 392 m/s2. This threshold corresponds to approximately 40 g. It should be noted that the crew is assumed to be in a supine posture (lying on their back), which is the standard seating arrangement for escape capsules. Consequently, the primary impact load acts along the chest-to-back axis, corresponding to the +Gx (chest-to-back) direction. Therefore, the 40 g/0.1 s limit from the Eiband curve is applicable for this specific axis. This value is based on the human tolerance data summarized by Eiband [47], which is widely adopted in aerospace crashworthiness design. For velocities of 18 m/s and 24 m/s, however, the peak values reach 402.64 m/s2 and 570.70 m/s2, exceeding this threshold. Entry at speeds above 18 m/s thus poses a serious threat to occupant safety. To protect personnel, two measures are therefore advisable: first, minimizing the capsule’s release height as much as possible; second, investigating the cushioning effect of equipping the capsule with an airbag.
To select the most effective airbag configuration, the cushioning performance of square, cylindrical, and raft-shaped airbags is compared under still-water conditions. The material parameters for the capsule, fluid domain, and airbags are given in Table 1, Table 2 and Table 3. The initial internal pressure of the airbag is set to PE = 1.013 × 10⁵ Pa, with a venting pressure threshold of Pvent = 1.5 PE.
The geometric parameters of the three airbag configurations are as follows. The square airbag measures 4.65 m in length, 2.55 m in width, and 1.15 m in height. Each cylindrical airbag has a length of 2.55 m and a diameter of 1.15 m. The raft-shaped airbag has an outer height of 1.8 m, an inner height of 1.3 m, an outer length of 5.0 m, and a skirt radius of 2.0 m. All three airbags use a uniform mesh size of 0.04 m. To simplify the analysis, only an initial entry velocity of 6 m/s is considered for the airbag-equipped capsule. Figure 9 compares the vertical acceleration time histories for the three airbag configurations against the no-airbag baseline. Figure 10 and Figure 11 present the corresponding vertical velocity and displacement time histories, respectively. The total simulation duration is 0.5 s, and the output interval is 0.01 s.
Figure 9.
A comparison of acceleration time histories for the capsule with three different airbag configurations in still water.
Figure 10.
A comparison of vertical velocity–time-history curves for the high-pressure escape capsule with three different airbag configurations in still water.
Figure 11.
A comparison of vertical displacement time-history curves for the high-pressure escape capsule with three different airbag configurations in still water.
As shown in Figure 10, the velocity histories for the three airbag configurations follow a similar trend. In each case, the velocity rises rapidly to a peak upon water entry and then decays quickly to a steady level. Compared with the no-airbag case, the capsule with an airbag exhibits a delayed peak velocity, and the impact duration is prolonged. This indicates that the airbag effectively mitigates the water-entry impact on the capsule. Figure 10 also shows that the three configurations yield similar peak arrival times but differ in peak magnitude. For the capsule body, the square airbag produces the highest peak velocity at 156 m/s, followed by the cylindrical airbag at 119 m/s, while the raft-shaped airbag gives the lowest at 88.89 m/s.
Figure 10 shows that the vertical velocity histories for the three airbag configurations follow a similar trend before 0.15 s. After water entry, the velocity decays rapidly. The raft-shaped airbag decelerates most quickly, reaching 0 m/s at 0.15 s. The square airbag reduces the velocity to 0.19 m/s at approximately 0.2 s, while the cylindrical airbag yields a minimum velocity of 1.63 m/s at the same time, after which the velocity recovers slightly. As seen in Figure 11, the capsules with square and cylindrical airbags exhibit positive vertical displacements throughout, indicating that they continue to sink. In contrast, the raft-shaped airbag enables the capsule to reach a secondary velocity peak of 3.35 m/s at about 0.24 s, followed by rapid deceleration to 0 m/s. At this instant, the displacement also returns to zero, implying that the capsule rebounds to the water surface. However, the displacement curves for the square and cylindrical airbags show no upward trend within the simulation duration. In summary, the raft-shaped airbag outperforms the other two configurations in cushioning effectiveness. It is therefore adopted exclusively in the subsequent analyses.
It should be noted that the different behavior of the three configurations in Figure 10 and Figure 11 has a simple buoyancy origin: among the three bags at their designed volumes, only the raft-shaped bag displaces enough water for the total buoyancy to exceed the weight of the capsule, so that the capsule is able to decelerate to rest and then return to the surface; the square and the cylindrical bags do not, and the capsule therefore continues to sink after the impact. The comparison in Figure 10 and Figure 11 is therefore not made on a like-for-like basis, and it does not by itself show whether the raft shape is beneficial, since size and shape vary together.
To separate the effect of shape from that of volume, two additional cases were computed at 6 m/s in still water, in which the square and the cylindrical bags were enlarged with geometric similarity so as to enclose the same cushion volume as the raft-shaped bag. At this volume the total buoyancy exceeds the weight for all three configurations, so that all three are able to float the capsule and the comparison becomes meaningful. The vertical velocity and displacement of the three equal-volume configurations are compared in Figure 12 and Figure 13, respectively. The raft-shaped bag still performs best: its maximum penetration is 0.64 m, against 0.81 m for the square bag and 0.86 m for the cylindrical bags, and it returns the capsule to the surface at 0.45 s, against 0.62 s and 0.66 s respectively. The superiority of the raft shape is therefore a genuine shape effect and is not a consequence of its larger volume; it is attributed to the downward skirt, which confines the displaced water and sustains the internal pressure while the wetted area decreases during the rebound, whereas the plain bags release the water laterally at their edges. The raft-shaped bag is thus adopted for the subsequent analyses, subject to the condition that the capsule remains afloat, which is the design requirement of the present application.
Figure 12.
A comparison of vertical velocity–time-history curves for the high-pressure escape capsule with three airbag configurations of equal cushion volume in still water.
Figure 13.
A comparison of vertical displacement time-history curves for the high-pressure escape capsule with three airbag configurations of equal cushion volume in still water.
To further evaluate the raft-shaped airbag’s performance, simulations are conducted for vertical water entry at initial velocities of 6, 12, 18, and 24 m/s in still water. Figure 12 and Figure 13 present the corresponding acceleration responses in the x- and y-directions, respectively.
Figure 14 and Figure 15 show that the peak accelerations in both the x- and y-directions increase significantly with increasing entry velocity. In the x-direction, the acceleration rises rapidly in the initial stage and then undergoes oscillatory damping, suggesting that the airbag provides horizontal cushioning and stabilization. In the y-direction, the peak acceleration is delayed relative to the no-airbag case, implying that the airbag effectively absorbs part of the vertical impact energy. Across all velocity cases, the y-direction peak acceleration with the airbag remains below the human safety threshold of 392 m/s2, confirming that the raft-shaped airbag offers robust cushioning protection in still water.
Figure 14.
A comparison of x-direction acceleration time histories for the capsule with a raft-shaped airbag in still water.
Figure 15.
A comparison of y-direction acceleration time histories for the capsule with a raft-shaped airbag in still water.
3.2. Effect of Entry Angle
Based on the preceding analysis, this section examines how entry angle influences the impact load and motion response of the airbag-equipped capsule in still water. To simplify the study, the initial velocity components in the x- and y-directions are both set to 6 m/s for all cases. The entry angle α is defined as the pitch attitude of the escape capsule, i.e., the angle between the longitudinal axis of the capsule and the horizontal plane, as shown in Figure 16. The entry angle is varied among 0°, 20°, 40°, and 60°. The mass properties, center of gravity (CG), and principal moments of inertia of the escape capsule are computed in LS-DYNA via *DATABASE_GLSTAT_MASS_PROPERTIES based on the shell-element mass distribution of the square steel base (712 kg), the round tube frame (895 kg), and the capsule pressure hull (14,550 kg), yielding a total structural mass of Ws = 16,157 kg within principal dimensions of length Ls = 5.81 m, width Bs = 2.55 m, and height Ds = 3.085 m. Taking the geometric center of the bottom plane of the square steel base as the local coordinate origin O(0, 0, 0) (with +x along the longitudinal axis, +y vertically upward, and +z along the transverse axis), the center of gravity of the escape capsule is located at (xG, yG, zG) = (0.000 m, 1.431 m, 0.000 m) (i.e., 1.431 m above the base bottom, or 2.731 m above the lowest point of the attached raft-shaped airbag). The principal moments of inertia about the center of gravity are Ixx = 1.756 × 10⁴ kg·m2 (roll, about the longitudinal x-axis), Iyy = 3.653 × 10⁴ kg·m2 (yaw, about the vertical y-axis), and Izz = 3.753 × 10⁴ kg·m2 (pitch, about the transverse z-axis, corresponding to a pitch radius of gyration of rz = 1.524 m). For each inclined water-entry case (α = 0°, 20°, 40°, and 60°), the model is rotated about the transverse z-axis prior to release with initial velocity components vx0 = 6.0 m/s and vy0 = −6.0 m/s.
Figure 16.
Definition of the entry angle α.
Figure 17 presents the peak acceleration as a function of entry angle for the capsule with and without the raft-shaped airbag. Figure 16, Figure 17 and Figure 18 show the time histories of the y-direction velocity, y-direction displacement, and internal airbag pressure, respectively, under the four entry angles.
Figure 17.
Peak acceleration versus entry angle for the capsule with and without the raft-shaped airbag in still water.
Figure 18.
The time histories of y-direction velocity at different entry angles for the capsule with a raft-shaped airbag in still water.
Figure 17 shows that the airbag has a notable effect on reducing the peak acceleration of the capsule during water entry. The percentages given below are all obtained by comparing the overall peak acceleration of the case without the airbag with that of the case with the airbag at the same entry angle. At 0°, the peak acceleration at the square steel base P1 decreases from 558.07 m/s2 without the airbag to 99.91 m/s2 with the airbag, a reduction of 82.1%; at the same angle the peak acceleration at the crew position P2 decreases from 176.18 m/s2 to 88.89 m/s2, a reduction of 49.5%. When the entry angle increases to 20°, 40° and 60°, the overall peak acceleration of the airbag-equipped capsule is respectively 53.8%, 40.0% and 35.9% lower than that of the corresponding no-airbag case at the same angle. These values are therefore reductions at a fixed angle, and they are not obtained by comparing the airbag-equipped capsule at one angle with the no-airbag capsule at another angle. The reduction at P2 is smaller than that at P1 because the airbag and the base filter the high-frequency slamming pulse before it reaches the capsule body; P2 is nevertheless the relevant point for the occupants and is therefore used for the safety assessment in what follows. While the airbag significantly reduces the overall peak acceleration, its effectiveness gradually diminishes as the entry angle increases.
Figure 18 shows that for the capsule with the raft-shaped airbag over the extended 1.0 s simulation duration, the y-direction velocity first increases downward to a negative peak (−6.20, −6.85, −7.29, and −7.73 m/s for 0°, 20°, 40°, and 60°, respectively), then decelerates to zero (at t = 0.15, 0.31, 0.53, and 0.68 s), after which it reverses direction, accelerates upward to a positive rebound peak (+3.34, +2.81, +2.15, and +1.52 m/s at t = 0.24, 0.40, 0.65, and 0.83 s), and finally decelerates toward zero as the capsule ascends. Larger entry angles delay these peak occurrences and yield larger downward velocity peaks but smaller upward rebound peaks due to the reduced initial wetted area of the airbag. Figure 19 shows that across all four entry angles, the capsule first descends to a maximum penetration depth (−0.67 m at 0.15 s for 0°, −1.68 m at 0.31 s for 20°, −2.63 m at 0.53 s for 40°, and −3.67 m at 0.68 s for 60°) and subsequently rebounds upward during the 1.0 s window.
Figure 19.
The time histories of y-direction displacement at different entry angles for the capsule with a raft-shaped airbag in still water.
As shown in Figure 20, over the 1.0 s simulation period, the internal airbag pressure histories at all entry angles complete a full compression–depressurization cycle, rising gradually to a peak and then declining back to the initial baseline level. Both the peak magnitude and arrival time depend on the entry angle: as the entry angle increases from 0° to 60°, the peak pressure decreases monotonically (0.343 MPa at t = 0.14 s for 0°, 0.314 MPa at t = 0.27 s for 20°, 0.262 MPa at t = 0.39 s for 40°, and 0.121 MPa at t = 0.47 s [or 0.186 MPa at t = 0.55 s] for 60°), while the pressure pulse is progressively delayed and broadened before stabilizing after t = 0.70 s. This behavior is attributed to the reduced wetted area between the airbag and the water surface at larger entry angles, which leads to a smaller slamming force during water entry. It is worth noting that the peak pressure of 0.134 MPa remains below the venting threshold of 0.152 MPa, so the airbag behaves as a closed gas spring throughout the impact, and the rebound discussed below is driven by the recovery of the compressed gas and by buoyancy.
Figure 20.
Time histories of internal airbag pressure at different entry angles in still water.
3.3. Effect of Waves
To examine the impact loads and motion responses of the capsule with raft-shaped airbag under wave conditions, a numerical wave tank is established in LS-DYNA using the piston-type wave-generation method to produce regular waves. The material parameters for the capsule, fluid domain, and airbag are listed in Table 1, Table 2 and Table 3. The simulation duration is 0.5 s, with the output interval is 0.01 s. The regular-wave height is fixed at 0.7 m and the period at 3.4 s. Simulations are performed at initial vertical velocities of 6, 12, 18, and 24 m/s. The results are compared with those obtained under still-water conditions to identify the effects of waves on the capsule’s impact loads and motion responses. Figure 21 and Figure 22 compare the acceleration time histories in the x- and y-directions, respectively, under both still-water and wave conditions for the four velocity cases. Figure 23 presents the corresponding internal airbag pressure time histories.
Figure 21.
Variation in x-direction acceleration at different entry velocities under still-water and wave conditions.
Figure 22.
Comparison of y-direction acceleration at different entry velocities under still-water and wave conditions.
Figure 23.
Internal airbag pressure time histories at different entry velocities under still-water and wave conditions.
Figure 21 shows that the x-direction acceleration under wave conditions exceeds the still-water peak at all velocity cases. This is attributed to the lateral wave forces. The wave-induced peak acceleration in the x-direction is more pronounced than in the no-wave case and increases significantly with entry velocity, and its arrival time advances progressively. Figure 22 indicates that the y-direction acceleration under wave conditions rises with increasing entry velocity, following similar trends to those in still water. The vertical acceleration peaks under wave conditions are higher than those in still water; however, the difference between the two decreases as entry velocity increases. This suggests that the effect of waves on the vertical acceleration peak diminishes at higher velocities, where the initial entry velocity becomes the dominant factor.
Figure 22 and Figure 23 show that the internal airbag pressure follows a similar trend to the y-direction acceleration over time, confirming that the airbag’s cushioning effect is primarily manifested in the vertical direction. Under wave conditions, the airbag pressure trend resembles that in still water: it rises from the initial pressure to a peak and then gradually returns to near the initial level. However, the peak pressure is higher under waves than in still water, and it increases with rising entry velocity. Meanwhile, the peak duration shortens and the peak arrival time advances as velocity increases. Moreover, the timing of the acceleration peak coincides well with that of the airbag pressure peak.
Figure 24 compares the vertical displacement of the airbag-equipped capsule under wave and still-water conditions across different entry velocities. The displacement trends are similar in both environments: the capsule first descends from the initial water level to a maximum depth and then rebounds back upward. As entry velocity increases, the maximum penetration depth grows, and the rebound displacement after the airbag pressure peaks also increases. The vertical displacement under wave conditions consistently exceeds that in still water; however, the difference in peak displacement diminishes at higher velocities. This indicates that the influence of waves on the vertical displacement of the airbag-equipped saturation escape capsule gradually weakens as velocity increases.
Figure 24.
Comparison of y-direction displacement at different entry velocities under still-water and wave conditions.
Figure 25 shows a comparison of peak acceleration in the x- and y-directions for the capsule with and without an airbag under wave conditions. Figure 25 shows that, in both directions, the peak acceleration with the airbag is lower than without it, confirming that the airbag provides effective cushioning—particularly in the y-direction at higher entry velocities. At 18 m/s and 24 m/s, the y-direction peak accelerations without the airbag reach 410.2 m/s2 and 580.4 m/s2, respectively, exceeding the human safety threshold. With the airbag, however, these values drop to 230.5 m/s2 and 350.8 m/s2, falling within the safe range.
Figure 25.
A comparison of peak acceleration in the x- and y-directions for the capsule with and without an airbag under wave conditions.
To further investigate the influence of wave height on the impact load, simulations were conducted under wave heights of H = 0.7 m, 1.5 m, and 2.0 m (with a constant period of T = 3.4 s). The corresponding parameters for the numerical wave generation are summarized in Table 4. Figure 26 illustrates the vertical acceleration time histories (y-direction) under these three wave conditions. It can be clearly observed that as the wave height increases, the peak vertical acceleration increases significantly. The maximum peak appears at H = 2.0 m, followed by H = 1.5 m, and the minimum at H = 0.7 m. This is because a larger wave height corresponds to a higher vertical orbital velocity of water particles and stronger wave nonlinearity, resulting in a more severe slamming effect during the water-entry process.
Table 4.
Parameters for numerical wave generation.
Figure 26.
Comparison of y-direction acceleration time histories under different wave heights.
Furthermore, to reveal the effect of the wave phase at the moment of impact, three phases were simulated: the wave crest, the front slope and the wave trough. The front slope is taken on the descending face ahead of the crest in the direction of wave propagation, i.e., the face on which the water surface is locally descending and the vertical orbital velocity is upward. Figure 27 shows that the peak vertical acceleration depends strongly on the phase: entry at the trough gives the highest peak, the front slope an intermediate one and the crest the lowest.
Figure 27.
Comparison of y-direction acceleration time histories under different wave phases.
It should be emphasized that, in linear wave theory, the vertical orbital velocity vanishes both at the crest and at the trough, and reaches at most aω = 0.65 m/s at mid-slope, which is only about 11% of the 6 m/s entry velocity; the ordering therefore cannot be attributed to the instantaneous vertical velocity. The phase dependence is governed instead by the geometry of the free surface at the contact point, for which the vertical acceleration of the surface, ∂2η/∂t2 = −aω2cos(kx − ωt), provides a direct indicator: it equals +aω2 = +1.2 m/s2 (upward) at the trough, −1.2 m/s2 (downward) at the crest and zero at mid-slope. At the trough the surface is concave and accelerating upward, i.e., it converges on the penetrating airbag, so the water displaced by the airbag is confined between the rising surfaces on both sides, the wetted area grows fastest and the rate of change in the added mass is largest. At the crest the surface is convex and accelerating downward, i.e., it recedes from the airbag, the displaced water escapes laterally and the wetted area grows more slowly. Since in the von Karman–Wagner formulation the slamming pressure is governed by the rate at which the wetted area grows, the peak load is highest at the trough and lowest at the crest, with the mid-slope in between because both the curvature and the surface acceleration vanish there.
4. Conclusions
In this study, a fluid–structure interaction numerical model is established using the ALE method combined with piston-type wave generation to simulate the water-entry impact of an airbag-equipped high-pressure escape capsule under wave conditions. The model is validated through water-entry tests of a hollow wedge. Numerical simulations are then performed to analyze the impact loads and motion responses of the capsule under regular waves. The effects of initial entry velocity, entry angle, airbag presence, and wave conditions are systematically compared. The main limitation of this study is the validation of the airbag–water model: the fluid–structure coupling is validated against a water-entry test and the CV airbag model is verified against a published airbag benchmark, but no dedicated water-landing test of an airbag-equipped capsule was available, so the complete airbag–water system has not been validated as a whole. Experimental work on this configuration is in progress. Compared with the ALE and control-volume study of Han et al. [5], the present results confirm their finding that wave-trough entry is the most severe condition, and extend it to a much larger capsule with three airbag configurations, an elastic hull, a wave-height series and a mechanism-based explanation of the phase effect. The main findings are summarized as follows:
- (1)
- Among the three configurations compared, only the raft-shaped bag is large enough for the total buoyancy to exceed the weight of the capsule, so that the capsule remains afloat and returns to the surface; the square and cylindrical bags, at the volumes that can be accommodated under the capsule, do not keep the capsule afloat and it continues to sink. Provided that the capsule remains afloat, the raft-shaped bag also performs best at equal cushion volume, giving both the smallest penetration and the earliest return to the surface. Without an airbag, the peak acceleration exceeds the human safety threshold of 392 m/s2 when the vertical entry velocity surpasses 18 m/s. With the raft-shaped airbag installed, the y-direction peak acceleration remains below this threshold across all simulated velocities, demonstrating effective cushioning performance for this floating configuration.
- (2)
- Entry angle significantly affects the capsule’s impact load and motion response. The peak impact acceleration decreases then increases with entry angle, reaching a minimum at 40°. In still water with the airbag, larger entry angles produce higher peak vertical velocities and displacements, but lower peak airbag pressures, and all peak arrival times are delayed. This is attributed to the reduced contact area between the airbag and seawater at larger angles, which weakens and delays the cushioning effect.
- (3)
- Waves influence the capsule’s impact load and motion response, particularly at lower entry velocities. The peak vertical acceleration, displacement, and airbag pressure under wave conditions all exceed their still-water counterparts. However, these differences diminish as entry velocity increases, indicating that wave effects weaken at higher speeds and the initial entry velocity becomes dominant. The timing of water entry also plays a critical role: entry at a wave trough produces the highest impact load and entry at a wave crest the lowest, because the concave trough surface converges on the penetrating airbag while the convex crest surface recedes from it, so that the wetted area grows fastest at the trough.
Author Contributions
Conceptualization, D.Y. and Y.J.; methodology, D.Y. and H.D.; software, H.D. and C.Z.; validation, D.Y., H.D. and Y.Z.; formal analysis, D.Y., H.D. and Y.Z.; investigation, H.D., C.Z. and Y.S.; resources, D.Y.; data curation, H.D. and C.Z.; writing—original draft preparation, D.Y.; writing—review and editing, D.Y., H.D. and Y.J.; visualization, Y.Z. and C.Z.; supervision, Y.J.; project administration, D.Y. and Y.J.; funding acquisition, Y.J. All authors have read and agreed to the published version of the manuscript.
Funding
This study was supported by the Key Research and Development program of Shandong Province, China (2022CXGC020509, 2024CXPT095).
Data Availability Statement
The data that supports the findings of this study are available from the corresponding author upon reasonable request.
Acknowledgments
The authors would like to express their sincere gratitude to the Key Research and Development Program of Shandong Province, China, for the financial support (Grant Nos. 2022CXGC020509 and 2024CXPT095).
Conflicts of Interest
The authors declare no conflicts of interest.
References
- Kageyama, N.; Sawamura, T. Effect of Hyperbaric Exposure on Cognitive Performance: An Investigation Conducting Numerical Stroop Tasks during a Simulated 440 m Sea Water Saturation Diving. J. Physiol. Anthropol. 2024, 43, 24. [Google Scholar] [CrossRef] [Scilit] [PubMed]
- Kapsenberg, G.K. Slamming of Ships: Where Are We Now? Philos. Trans. R. Soc. A 2011, 369, 2892–2919. [Google Scholar] [CrossRef] [Scilit] [PubMed]
- Lu, Q.X.; Ma, X.J.; Zhao, J.; Shen, L. A Review on Research of Load Reduction and Ballistic Stability during Cross-Media Water Entry Processes. J. Mar. Sci. Eng. 2025, 13, 703. [Google Scholar] [CrossRef] [Scilit]
- Wang, Z.; Feng, P.; Liu, G.; Zhao, X.; Qin, X. Load and Motion Behaviors of Ogive-Nosed Projectile during High-Speed Water Entry with Angle of Attack. Ocean Eng. 2022, 266, 112937. [Google Scholar] [CrossRef] [Scilit]
- Han, J.P.; Wu, S.Q.; Lei, J.L.; Huang, W.; Xie, H.; Zhang, Y. Numerical Study on Water Landing Characteristics of a Reentry Capsule with Airbag Cushioning under Calm Water and Regular/Irregular Waves. Chin. J. Aeronaut. 2025, 38, 103615. [Google Scholar] [CrossRef] [Scilit]
- Liu, X.; Luo, K.; Yuan, X.; Qi, X. Numerical Study on the Impact Load Characteristics of a Trans-Media Vehicle during High-Speed Water Entry and Flat Turning. Ocean Eng. 2023, 273, 113986. [Google Scholar] [CrossRef] [Scilit]
- Von Karman, T. The Impact of Seaplane Floats During Landing; NACA TN 321; National Aeronautics and Space Administration, Glenn Research Center: Cleveland, OH, USA, 1929.
- Wagner, H. Phenomena Associated with Impacts and Sliding on Liquid Surfaces. Z. Angew. Math. Mech. 1932, 12, 193–215. [Google Scholar]
- Chaudhry, A.Z.; Shi, Y.; Pan, G.; Liu, G. Mechanical Characterization of Flat-Faced Deformable AUV during Water Entry Impact Considering the Hydroelastic Effects. Appl. Ocean Res. 2021, 115, 102849. [Google Scholar] [CrossRef] [Scilit]
- Wang, L.G.; Gao, H.W.; Yang, S.Q.; Niu, W.D.; Ma, W.; Wang, C. Design, Analysis, and Local Structural Optimization of an Air-Droppable Underwater Glider under the Impact Load during Water Entry. Ocean Eng. 2024, 312, 119013. [Google Scholar] [CrossRef] [Scilit]
- Vepa, K.S.; Seetharamaiah, N. Performance Study of Different Numerical Methods for Modeling the Vertical Water Entry of a Wedge. Int. J. Interact. Des. Manuf. 2025, 19, 2431–2447. [Google Scholar] [CrossRef] [Scilit]
- Yin, Q.Z.; Wang, Z.T.; Yang, L.C.; Wei, X.H.; Nie, H. Research on Drop Shock Dynamic Performance of Air-Cushion Aircraft on Ground and Water Surface. Proc. Inst. Mech. Eng. Part G J. Aerosp. Eng. 2026, 240, 999–1019. [Google Scholar] [CrossRef] [Scilit]
- Yang, Q.Z.; Xu, F.; Yang, Y.; Wang, J.Y.; Wang, A.W.; Ma, C.H. Numerical Study on the Dynamic Characteristics of Water Entry of Cavity Body Using Two-Phase SPH Method. Acta Mech. Sin. 2021, 37, 1072–1089. [Google Scholar] [CrossRef] [Scilit]
- Zha, R.S.; Zhao, W.W.; Wan, D.C. Numerical Study on Water Entry of Projectiles with Various Head Shapes by a Multiphase Moving Particle Semi-Implicit Method. Int. J. Offshore Polar Eng. 2022, 32, 402–410. [Google Scholar] [CrossRef] [Scilit]
- Chang, Y.; Tong, A. A Numerical Study on Water Entry of Cylindrical Projectiles. Phys. Fluids 2021, 33, 093304. [Google Scholar] [CrossRef] [Scilit]
- Koue, J.; Abe, A. Analysis of Flow Fields around Projectiles with Different Tip Shapes Penetrating into Water. J. Ocean Eng. Mar. Energy 2026, 12, 359–372. [Google Scholar] [CrossRef] [Scilit]
- Cui, J.; Gu, C.J.; Chen, X.; Li, M.Y.; Masvaya, B. Numerical Study of Wedge Entry in Still Water and Waves Using Smoothed Particle Hydrodynamics Methods. Ocean Eng. 2023, 280, 114776. [Google Scholar] [CrossRef] [Scilit]
- Liu, Y.; Xiang, J.B.; Xue, Z.M.; Man, D.T.; Wang, X.G.; Xia, G.Q.; Pan, M.Y. Compressible Multiphase Model for Projectile-Induced Shock Waves and Cavitation Flows in High-Speed Water Entry. Int. Commun. Heat Mass Transf. 2025, 169, 109532. [Google Scholar] [CrossRef] [Scilit]
- Zhao, G.; Chen, T.; Guo, Z.; Zhang, W. Experimental Study on Ballistic Stability of Truncated Cone Projectile in High-Speed Oblique Water Entry. Ocean Eng. 2023, 283, 115078. [Google Scholar] [CrossRef] [Scilit]
- Sui, Y.T.; Ming, F.R.; Wang, S.P.; Han, R. Experimental Investigation on the Impact Force of the Oblique Water Entry of a Slender Projectile with Spring Buffer. Appl. Ocean Res. 2023, 138, 103631. [Google Scholar] [CrossRef] [Scilit]
- Meng, Q.C.; Huang, Y.H.; Xia, W.X.; Wang, C. Experimental Study on Cavity Evolution and Motion Stability during Oblique Water Entry of High-Speed Objects. AIP Adv. 2025, 15, 115033. [Google Scholar] [CrossRef] [Scilit]
- Hao, D.; Yu, J. Numerical Investigation on Water-Entry Impact Load of TMA Based on CEL Algorithm. J. Phys. Conf. Ser. 2021, 2012, 012055. [Google Scholar] [CrossRef] [Scilit]
- Li, Z.M.; Zan, Y.F.; Guo, R.N.; Zhang, N.B.; Qin, L.C. Investigation of Cavity and Jet Evolution Mechanisms during Porous Plate Water Entry under Different Velocities. Phys. Fluids 2025, 37, 087154. [Google Scholar] [CrossRef] [Scilit]
- Huang, Q.G.; Wang, C.; Shi, Y.; Pan, G.; Liu, G. Study of the Cavity and Hydrodynamic Characteristics of Water Entry for Projectiles with Different Wave Parameters. Ocean Eng. 2024, 313, 119441. [Google Scholar] [CrossRef] [Scilit]
- Wang, C.; Huang, Q.G.; Lu, L.; Pan, G.; Gao, S. Numerical Investigation of Water Entry Characteristics of a Projectile in the Wave Environment. Ocean Eng. 2024, 294, 116821. [Google Scholar] [CrossRef] [Scilit]
- Wang, K.; Ma, X.; Bai, W.; Qian, L.; Li, Z.; Li, Y.B. Two-Dimensional Numerical Simulation of Water Entry of a Cylinder into Waves Using OpenFOAM. Ocean Eng. 2023, 269, 113516. [Google Scholar] [CrossRef] [Scilit]
- Peng, T.S.; Shi, W.K.; Peng, Y.X.; Chen, C.; Shen, Y.M.; Chen, J.Q. Effects of Wave Conditions on the Impact Loads and Stability of a High-Speed Projectile during Oblique Water Entry. Phys. Fluids 2025, 37, 093612. [Google Scholar] [CrossRef] [Scilit]
- Liu, X.Y.; Xin, J.J.; Chang, X.; Shi, F.L.; Chen, Z.L.; Wu, Y.P. Dynamic and Ricochet Behaviors of a Projectile for Low-Speed Oblique Water Entry. Results Eng. 2025, 28, 107274. [Google Scholar] [CrossRef] [Scilit]
- Li, Z.; Hu, H.; Wang, C.; Xie, Z.; Chen, X.; Yuan, Z.; Du, P. Hydrodynamics and Stability of Oblique Water Entry in Waves. Ocean Eng. 2024, 292, 116506. [Google Scholar] [CrossRef] [Scilit]
- Zhou, B.; Zhao, Z.; Dai, Q.; Yao, W.; Liu, X.; Zhang, Y.; Wang, A.; Zhang, H. Numerical Study on the Cavity Dynamics of Water Entry and Exit for a High-Speed Projectile Crossing a Wave. Phys. Fluids 2024, 36, 212804. [Google Scholar] [CrossRef] [Scilit]
- Zhang, L.; Wang, Z.; Jia, H. Effect of Wave Phases and Heights on Supercavitation Flow Field and Dynamic Characteristics of Successively Fired High-Speed Projectiles. J. Mar. Sci. Eng. 2023, 11, 629. [Google Scholar] [CrossRef] [Scilit]
- Wei, J.; Sha, Y.; Hu, X.; Cao, Z.; Chen, D.; Zhou, D.; Chen, Y. Research on Aerodynamic Characteristics of Trans-Media Vehicles Entering and Exiting the Water in Still Water and Wave Environments. Drones 2023, 7, 69. [Google Scholar] [CrossRef] [Scilit]
- Liu, J.; Liu, M.Y.; Xiao, L.F.; Wei, H.D.; Li, X. Experimental Study on the Effect of Flare Barriers on Wave Run-Up and Motion Response of a Semi-Submersible Platform. Ocean Eng. 2023, 281, 114998. [Google Scholar] [CrossRef] [Scilit]
- Yu, Z.L. Water Impact Damage Considering Hydro-Plastic Interactions: Extensive Experimental and Numerical Validation, and Structural Design Recommendations. Mar. Struct. 2025, 101, 103766. [Google Scholar] [CrossRef] [Scilit]
- Wang, H.C.; Santo, H.; Taylor, P.H.; Dai, S.S.; Day, A.H.; Chan, E.S. Wave Impacts on a Solid Deck in Transient Wave Groups. J. Fluids Struct. 2022, 114, 103755. [Google Scholar] [CrossRef] [Scilit]
- Shen, L.; Zhao, B.W.; Zhang, H.C.; Ji, G.K.; Chen, Y. Experimental Investigation on Cavity Flow Structures and Impact Load Feature of Oblique Water Entry of Through-Hole Cylindrical Projectiles. Ocean Eng. 2026, 354, 124968. [Google Scholar] [CrossRef] [Scilit]
- Liu, L.X.; Chen, Y.; Li, J. Investigation on Cylinder Water Entry in Regular Wave Field Using Large Eddy Simulation. Int. J. Multiph. Flow 2024, 173, 104759. [Google Scholar] [CrossRef] [Scilit]
- Simon, C.; Gerry, M. Dytran Analysis of Helicopter Flotation Bag. In Proceedings of the MSC 1998 Users Conference, Universal City, CA, USA, 1998; MSC Software Corporation: Los Angeles, CA, USA, 1998; pp. 1–12. [Google Scholar]
- Marklund, P.O.; Nilsson, L. Simulation of Airbag Inflation Processes Using Coupled Fluid Structure Approach. Comput. Mech. 2002, 29, 289–297. [Google Scholar] [CrossRef] [Scilit]
- Zhi, M.Y.; Yan, G.J.; Sun, L.Q.; Wang, P.X. Investigation of Dynamic Characteristics about Vehicle with Airbags Structure during Water-Entry and Recovery. Chin. J. Theor. Appl. Mech. 2024, 56, 943–959. [Google Scholar]
- Jiang, Y.Y.; Tang, W.Y. Numerical Investigation on Water Entry of a Three-Dimensional Flexible Bag of an Air Cushion Vehicle. Ocean Eng. 2022, 247, 110653. [Google Scholar] [CrossRef] [Scilit]
- Jiang, Y.Y.; Tang, W.Y. Numerical Analysis of the Water Entry of Flexible Bags of Air Cushion Vehicles Considering a Diaphragm. Ocean Eng. 2022, 246, 110662. [Google Scholar] [CrossRef] [Scilit]
- Yuan, Y.C.; Xu, S.J.; Wei, J.H.; Guo, L.; Tang, W.Y. Wave Slamming Load Inversion Investigation of Air Cushion Vehicle Skirt Airbags Based on Impulse-Space Superposition Method. Mar. Struct. 2026, 108, 104040. [Google Scholar] [CrossRef] [Scilit]
- Zhuang, H.Y.; Xu, S.J.; Yuan, Y.C.; Tang, W.Y. CEL Method-Based Numerical Analysis on Hydrodynamic Load and Response of Skirt Inclined Water Entry for Air-Cushion Vehicles under Venting Conditions. Ocean Eng. 2025, 343, 123320. [Google Scholar] [CrossRef] [Scilit]
- Busto, S.; Dumbser, M. An Arbitrary-Lagrangian-Eulerian Hybrid Finite Volume/Finite Element Method on Moving Unstructured Meshes for the Navier-Stokes Equations. Appl. Math. Comput. 2023, 437, 127539. [Google Scholar] [CrossRef] [Scilit]
- Huang, G.; Huang, H.M.; Xu, X.L.; Li, W.J. Simulation on Impact Attenuation Capability of Bi-Cylinder Airbags. Chin. J. Comput. Mech. 2014, 31, 212–216. [Google Scholar]
- Eiband, A.M. Human Tolerance to Rapidly Applied Accelerations: A Summary of the Literature; NASA Memo 5-19-59E; National Aeronautics and Space Administration, Lewis Research Center: Cleveland, OH, USA, 1959.
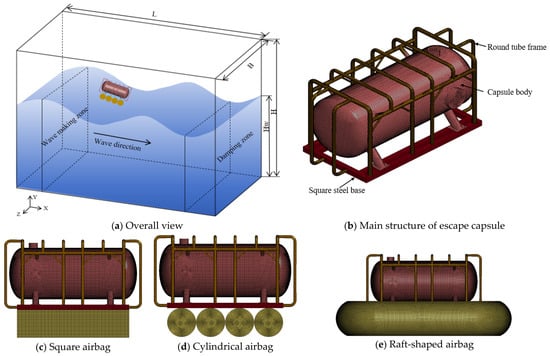
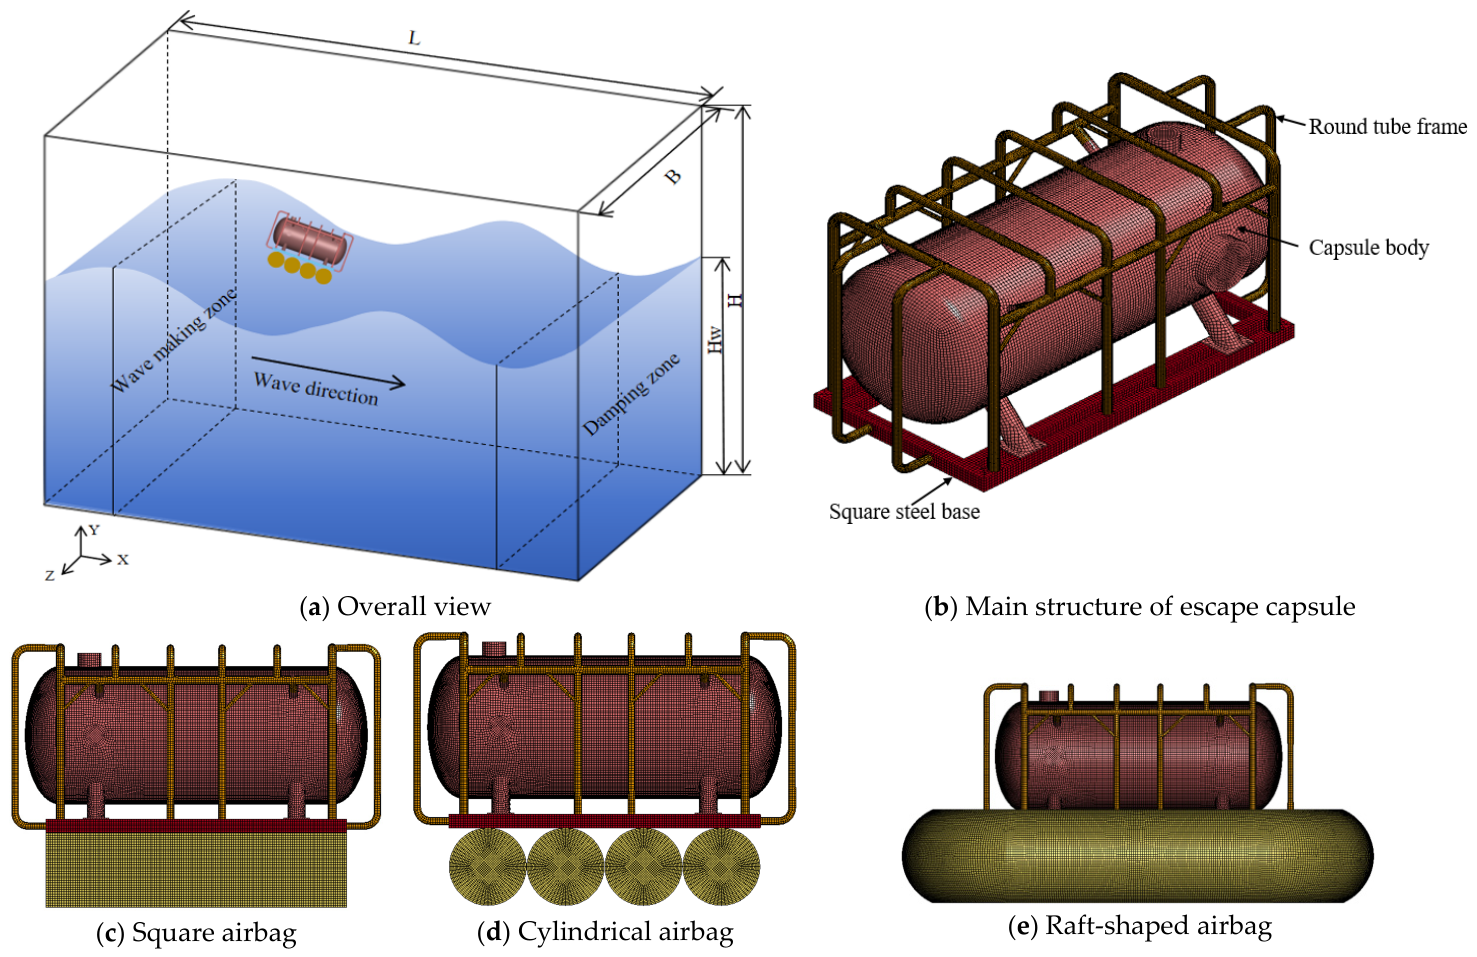
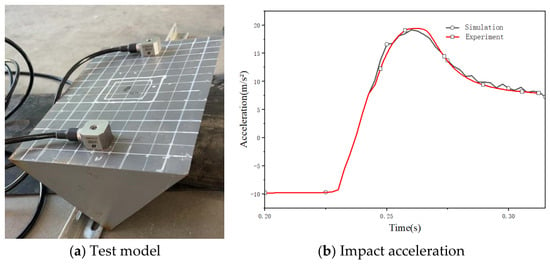
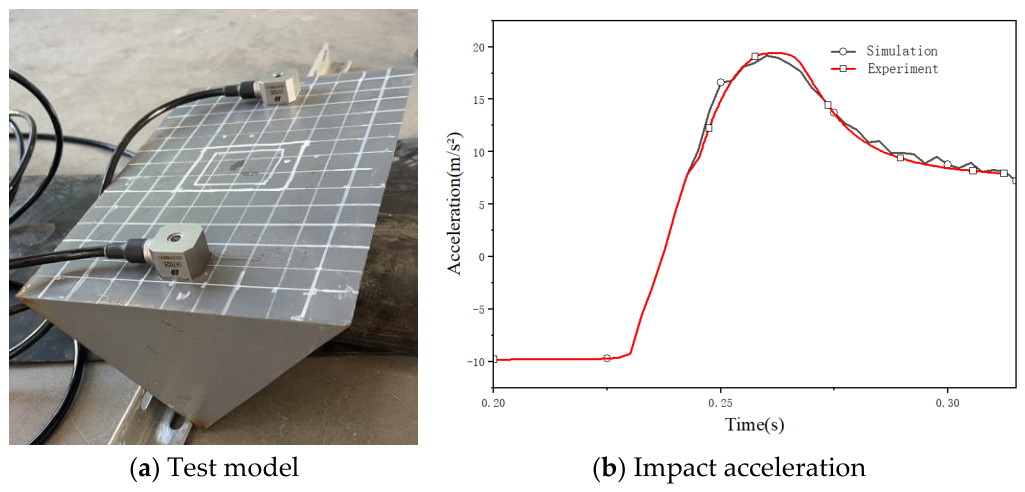
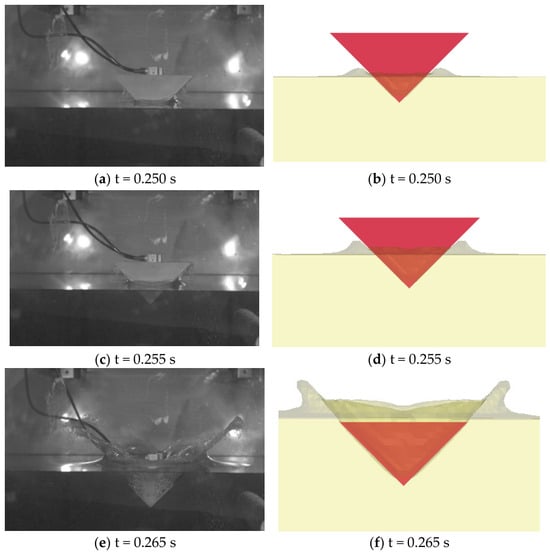
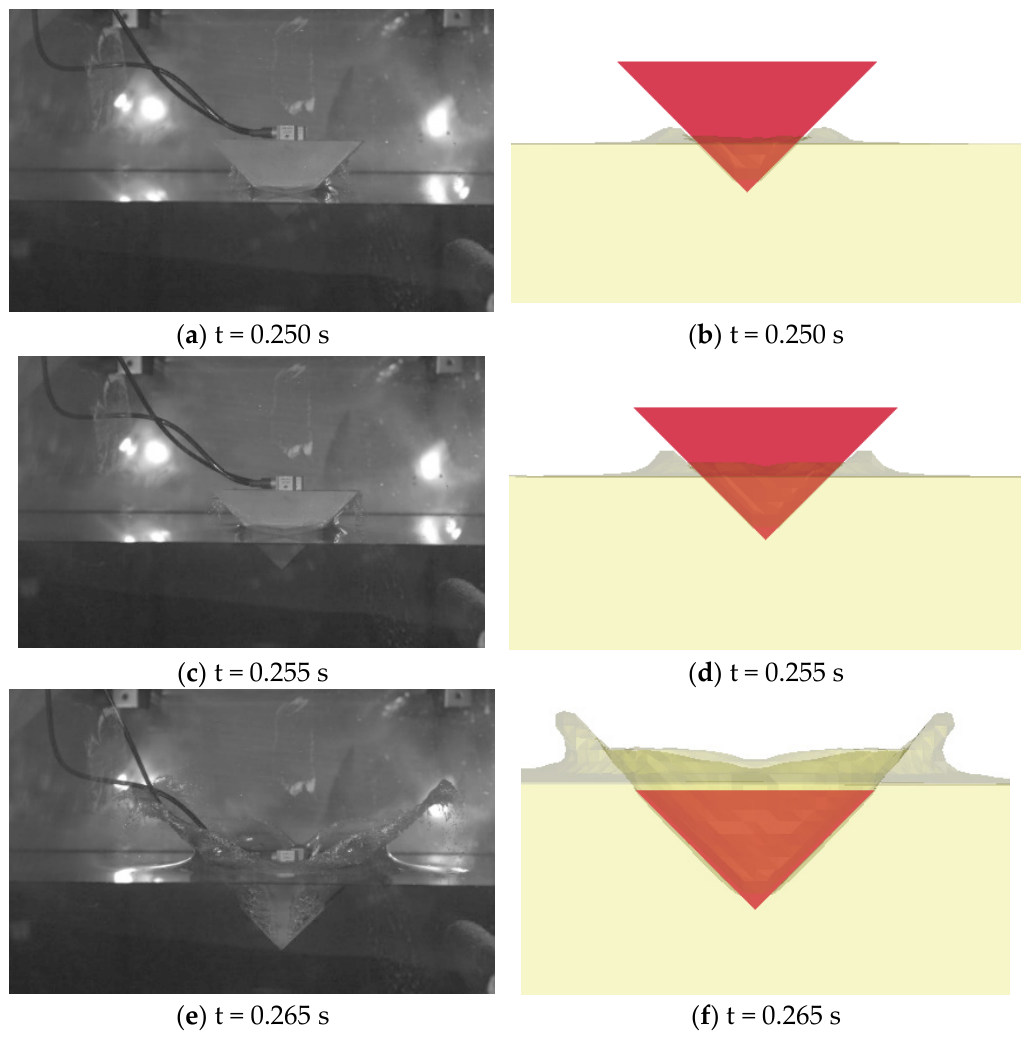
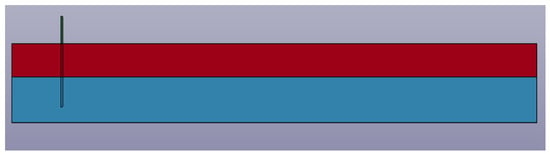
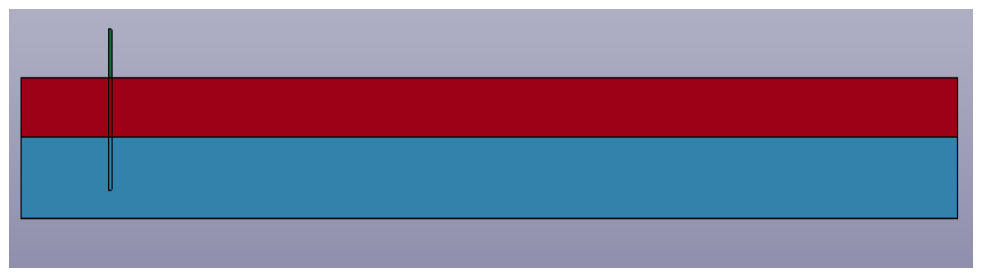
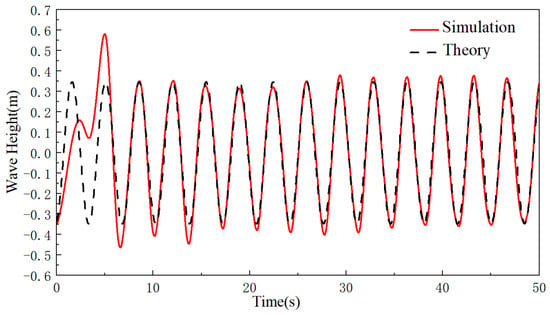
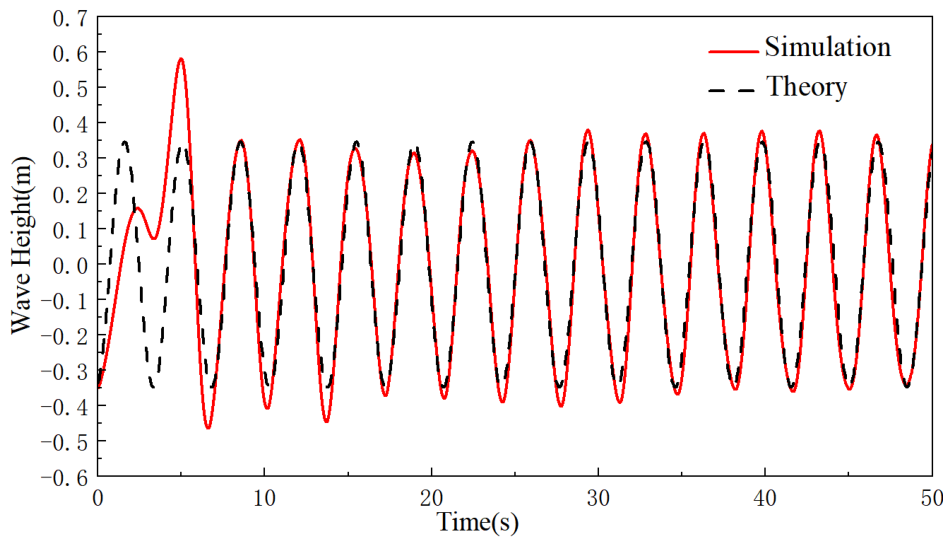
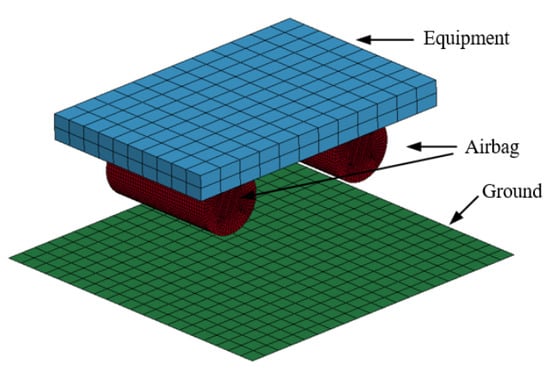
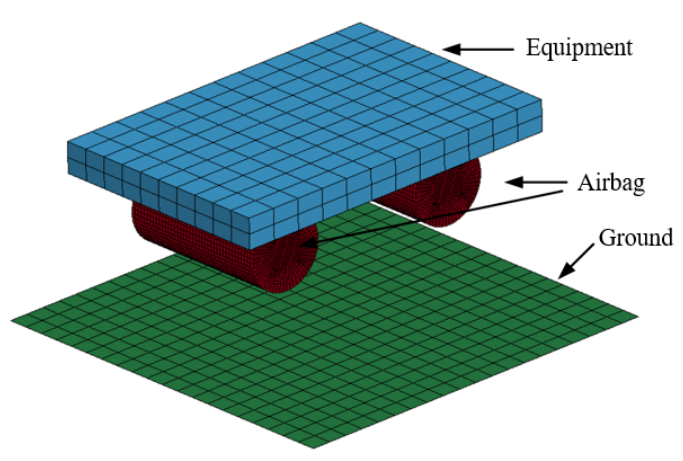
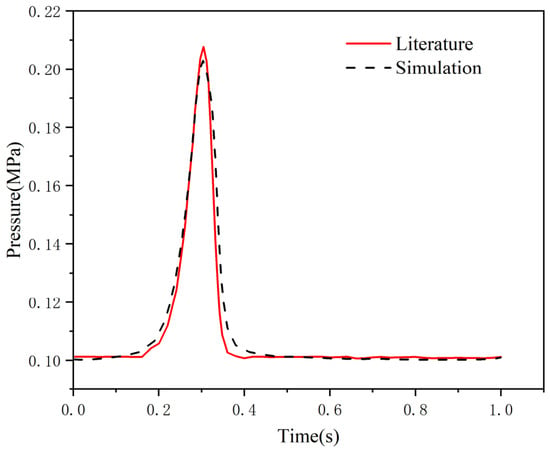
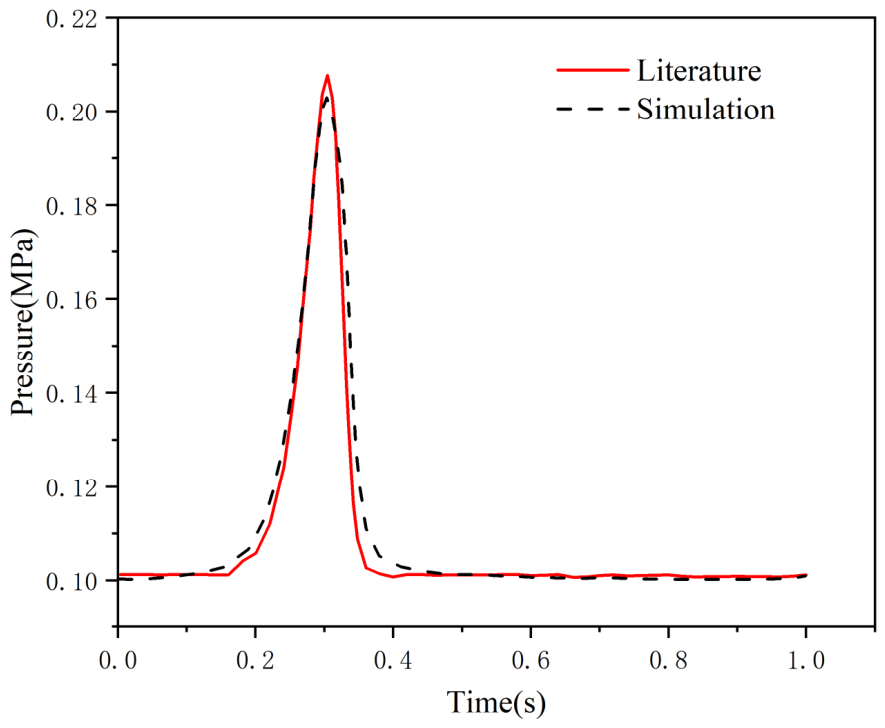
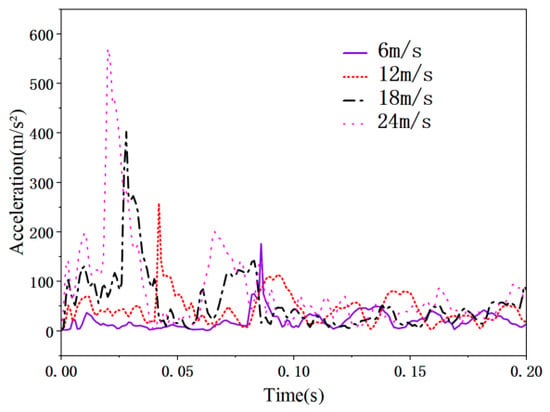
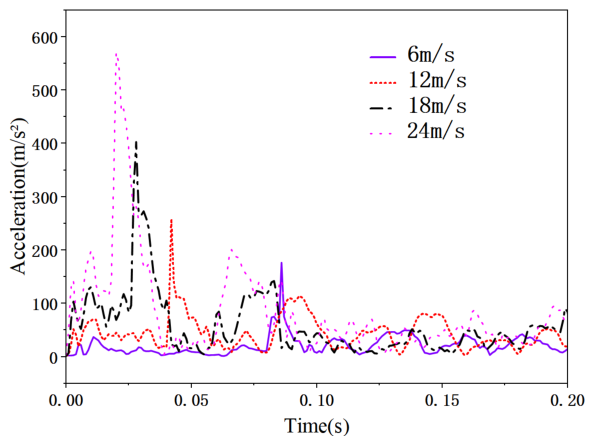
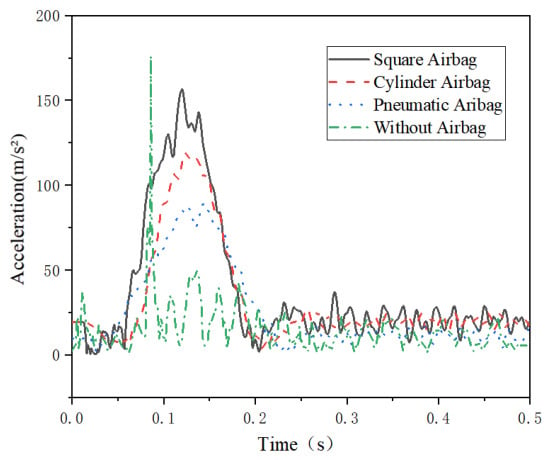
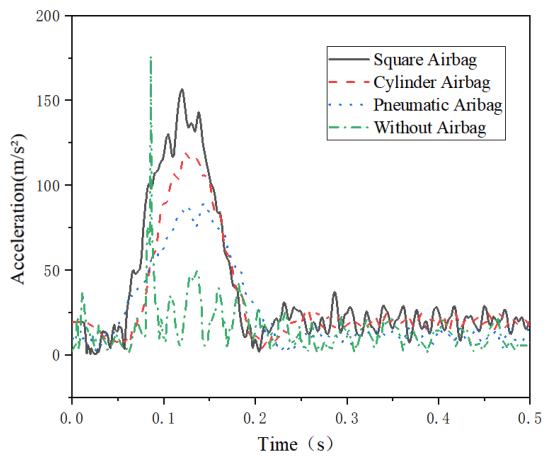
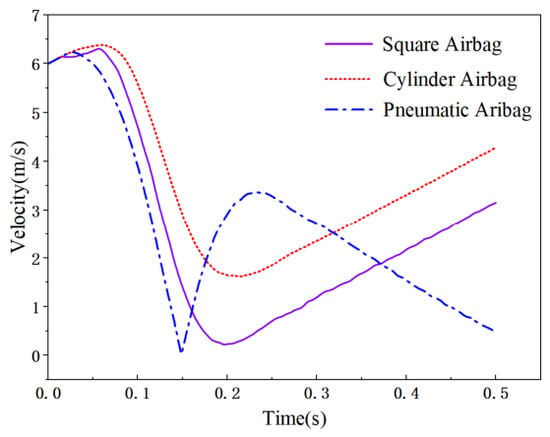
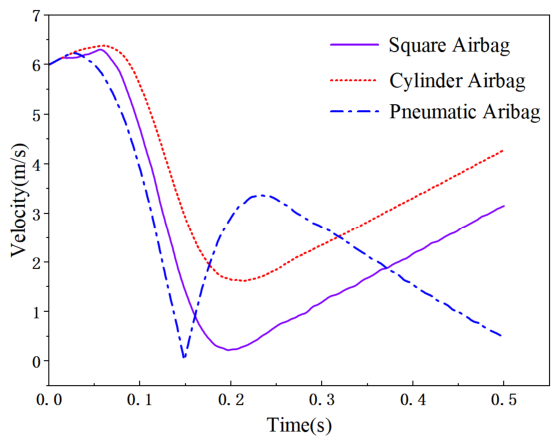
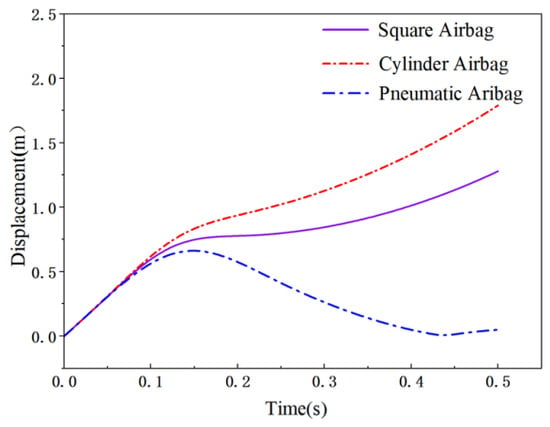
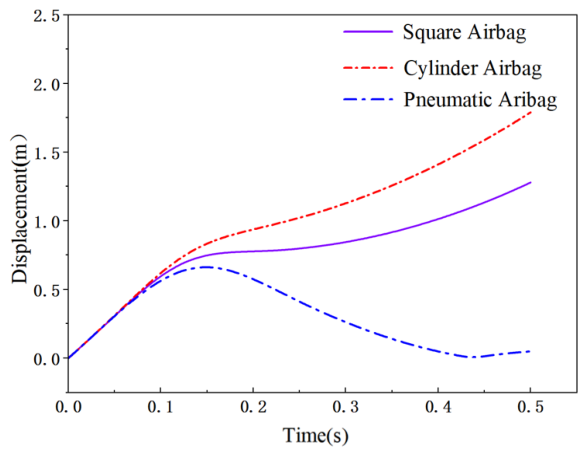
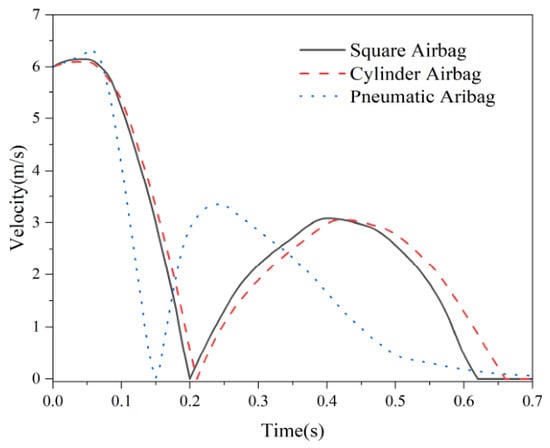
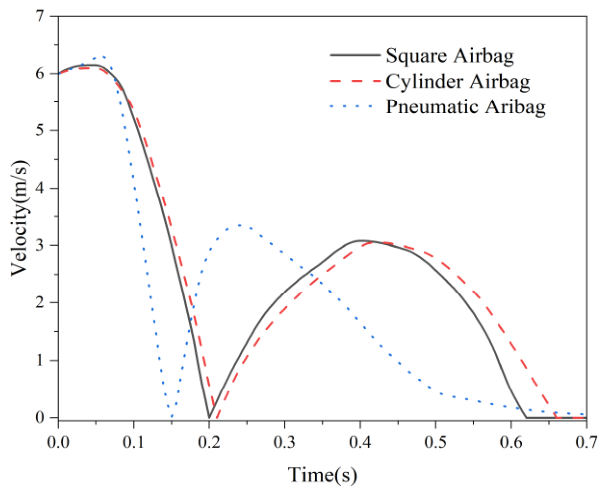
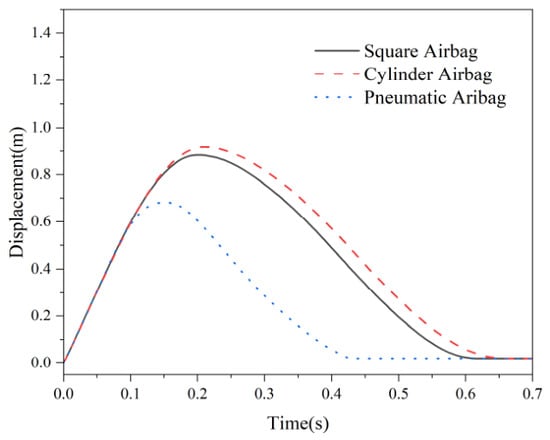
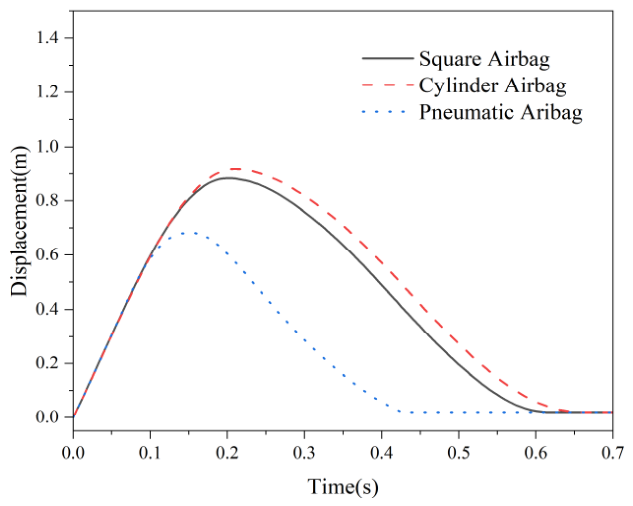
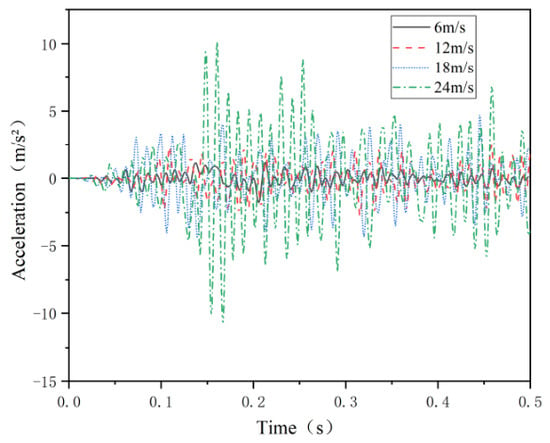
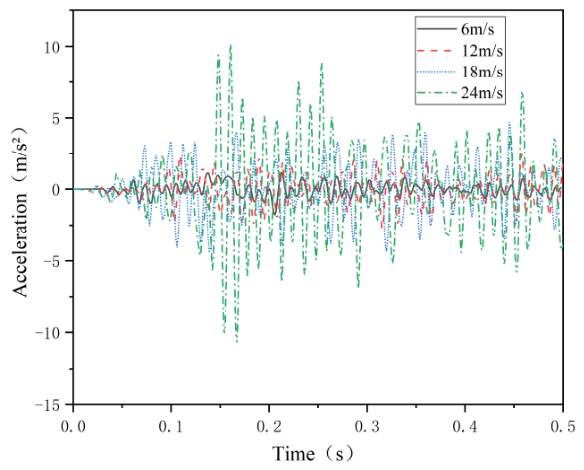
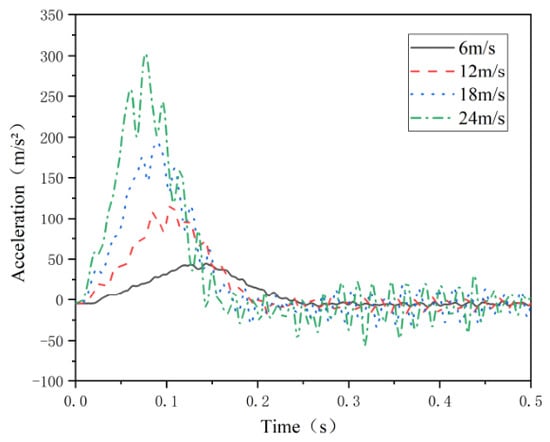
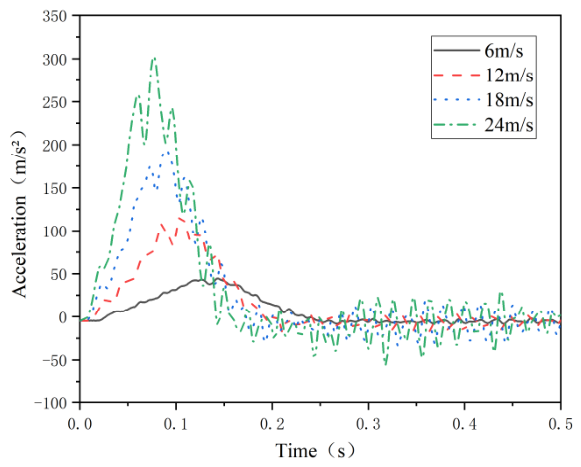
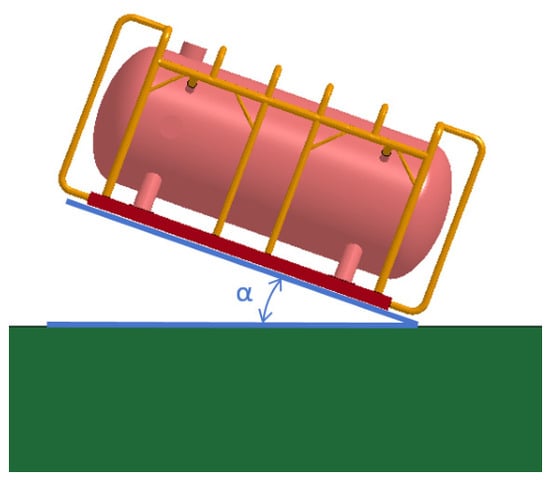
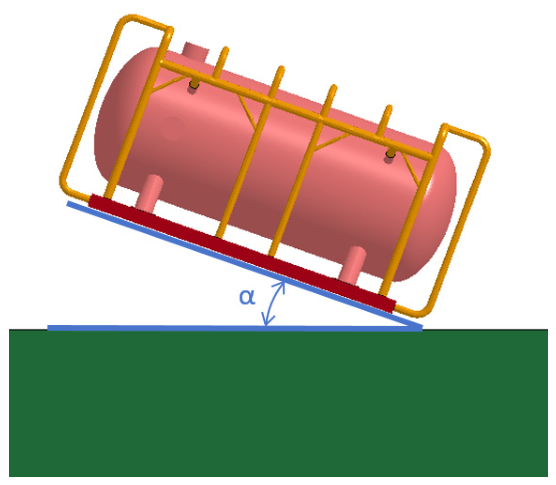
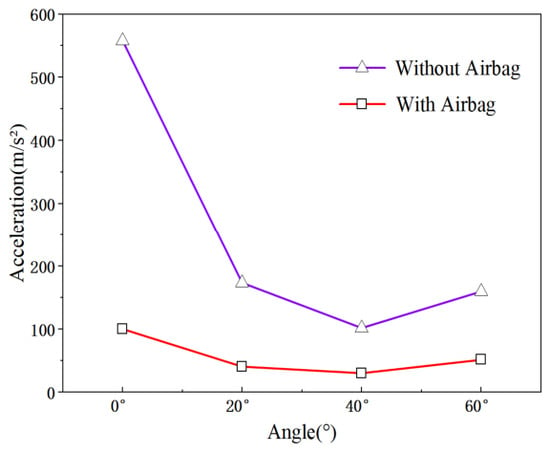
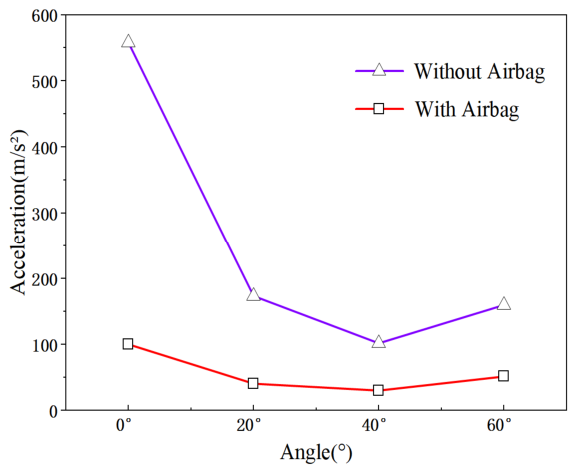
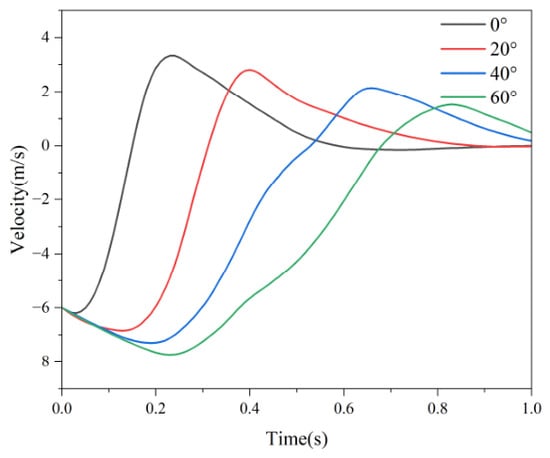
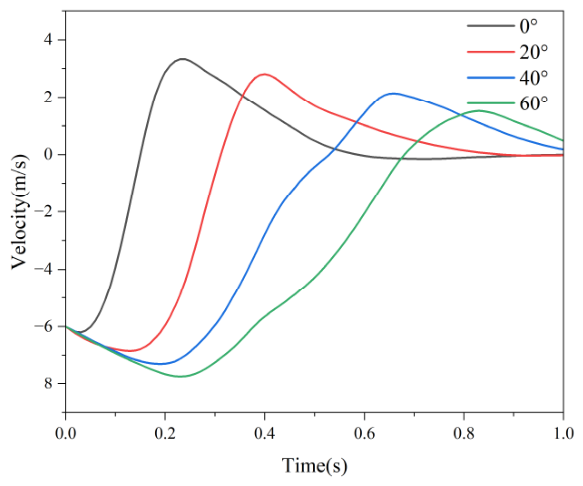
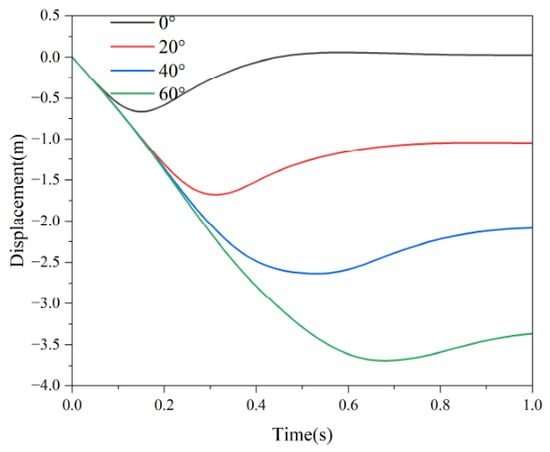
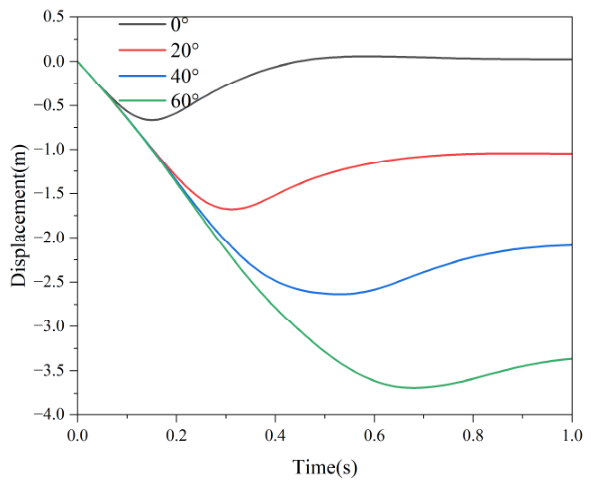
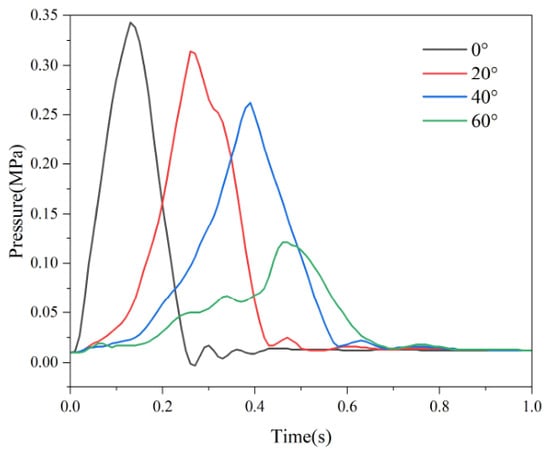
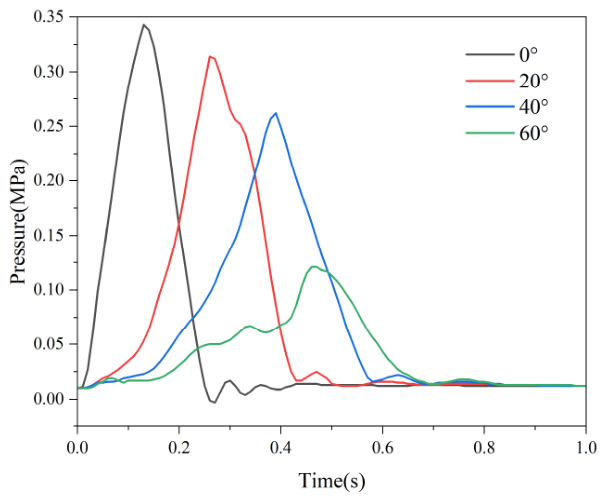
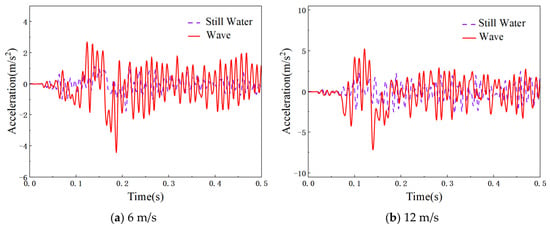
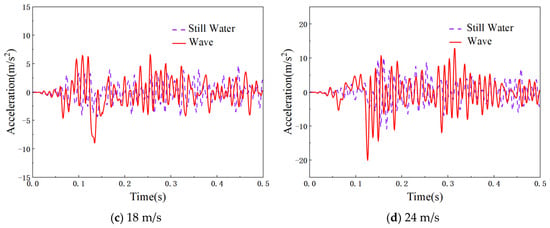
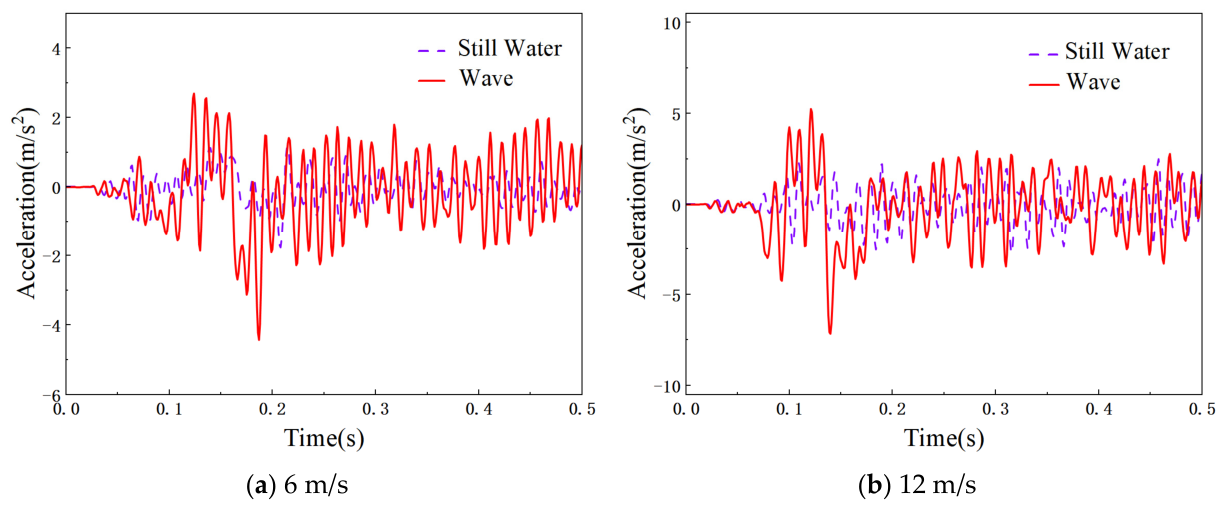
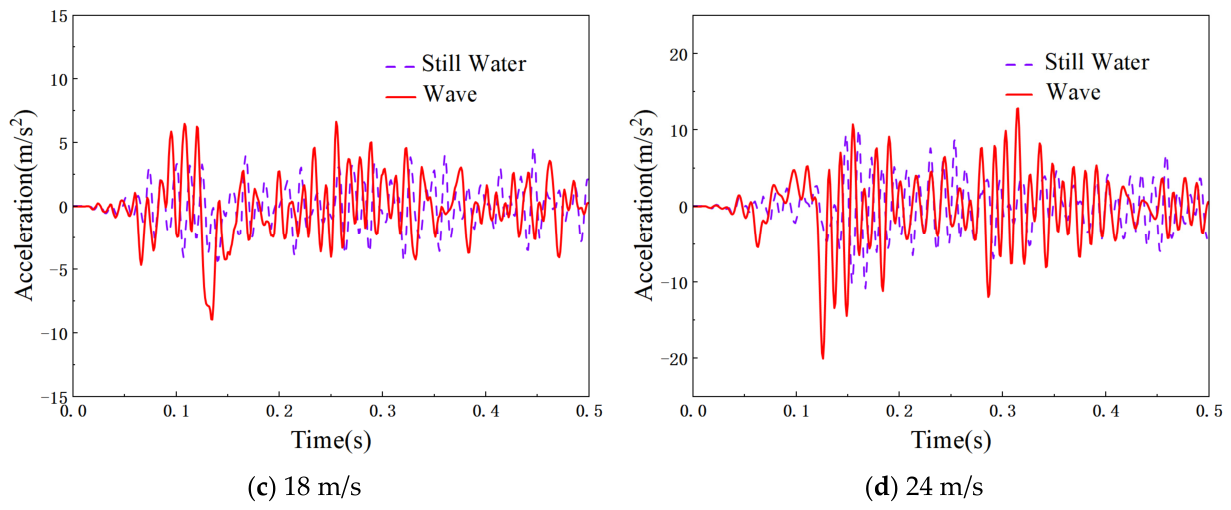
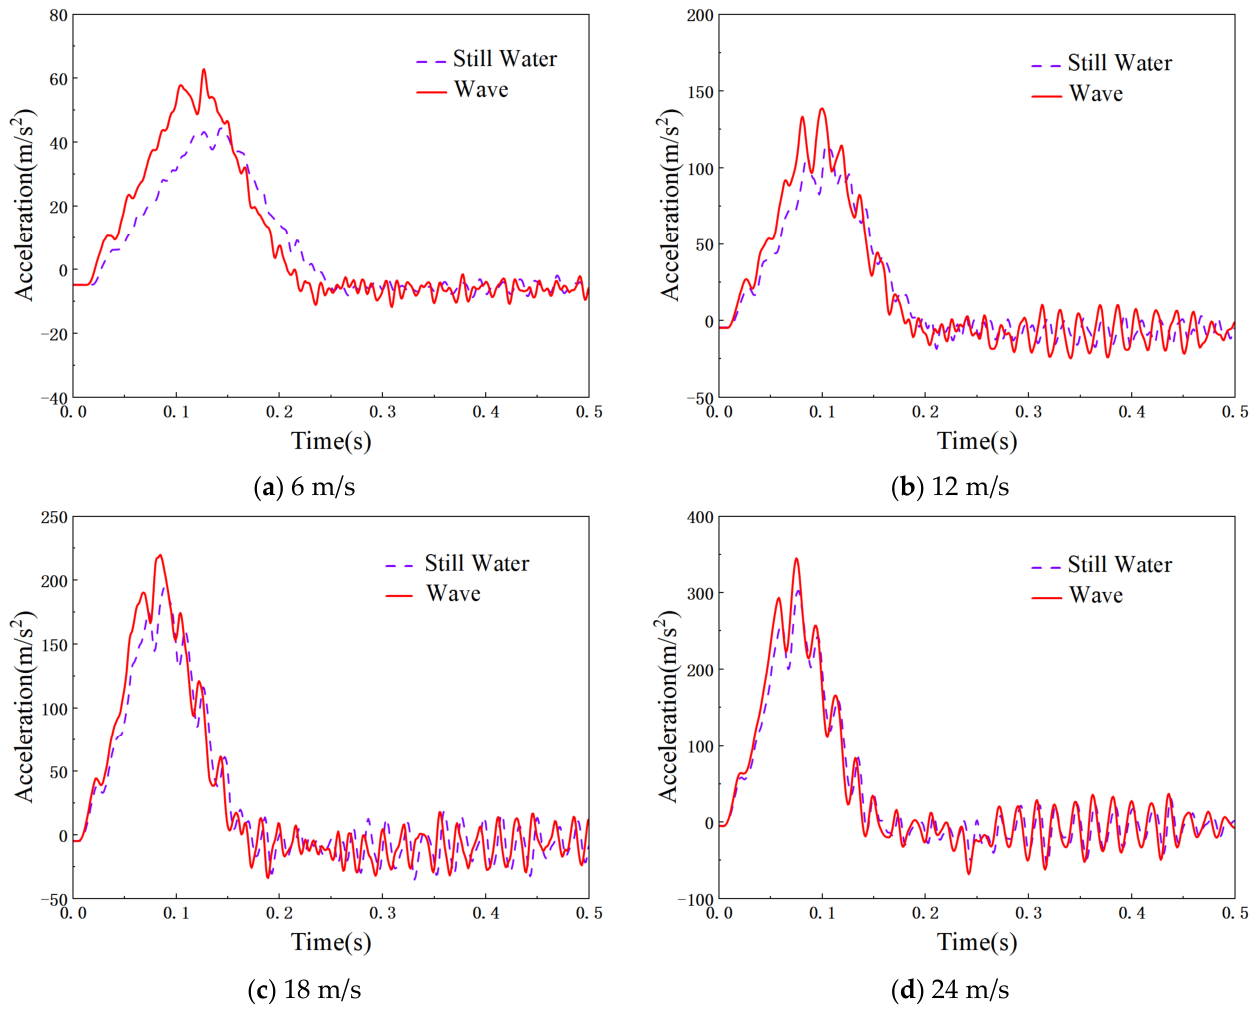
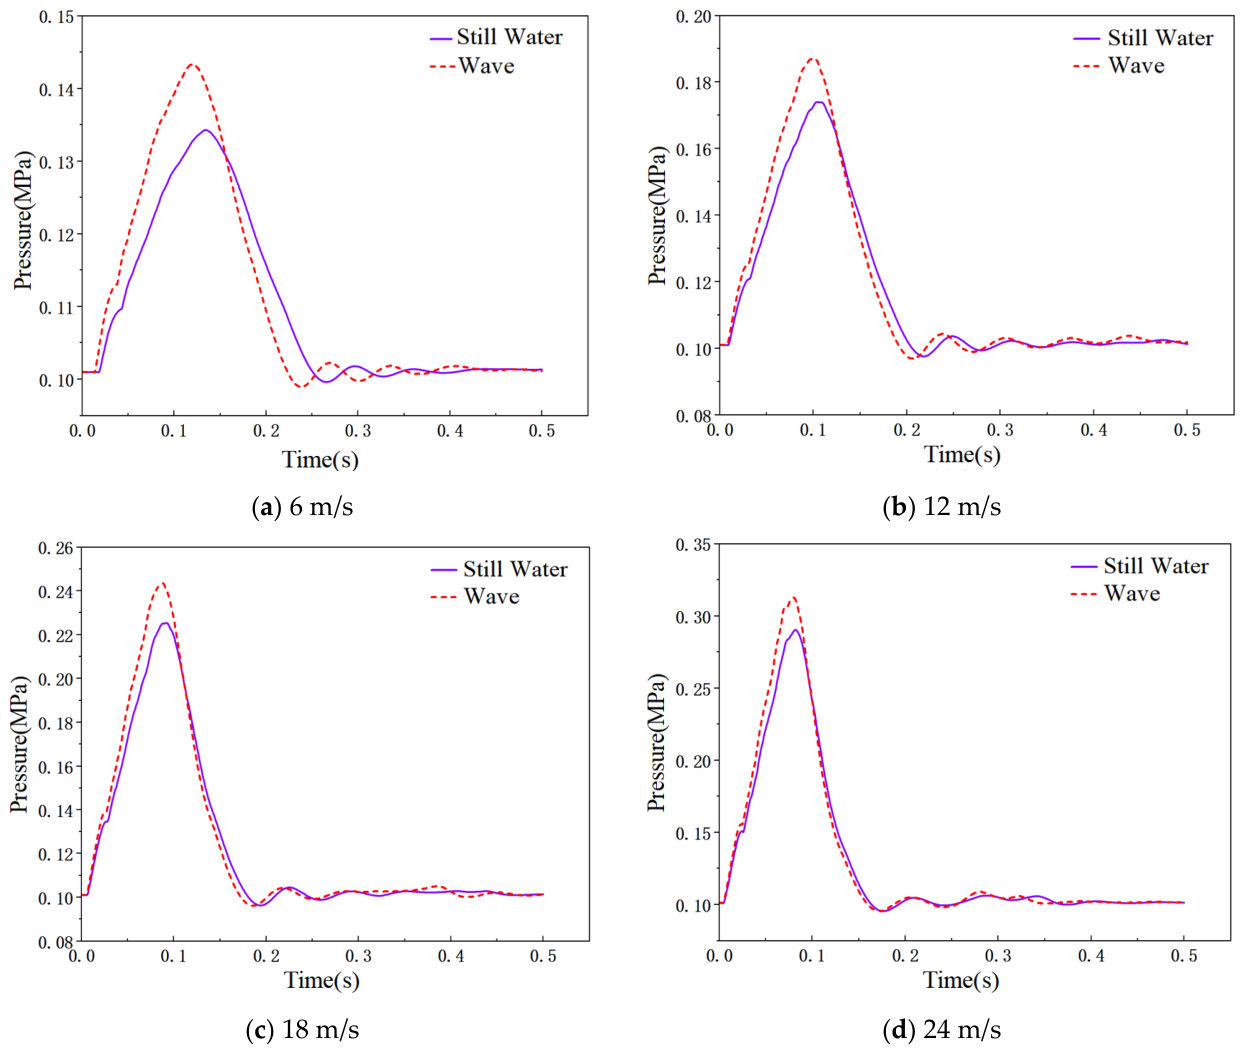
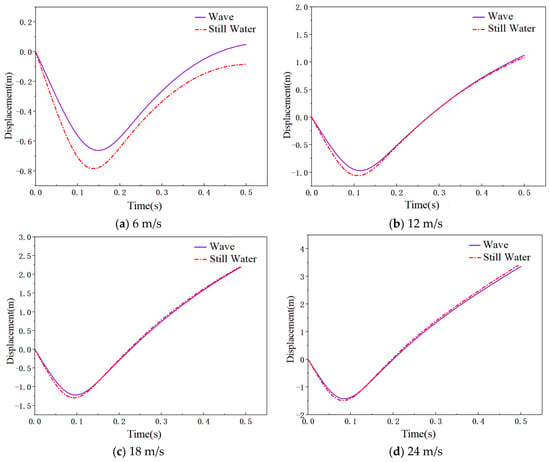
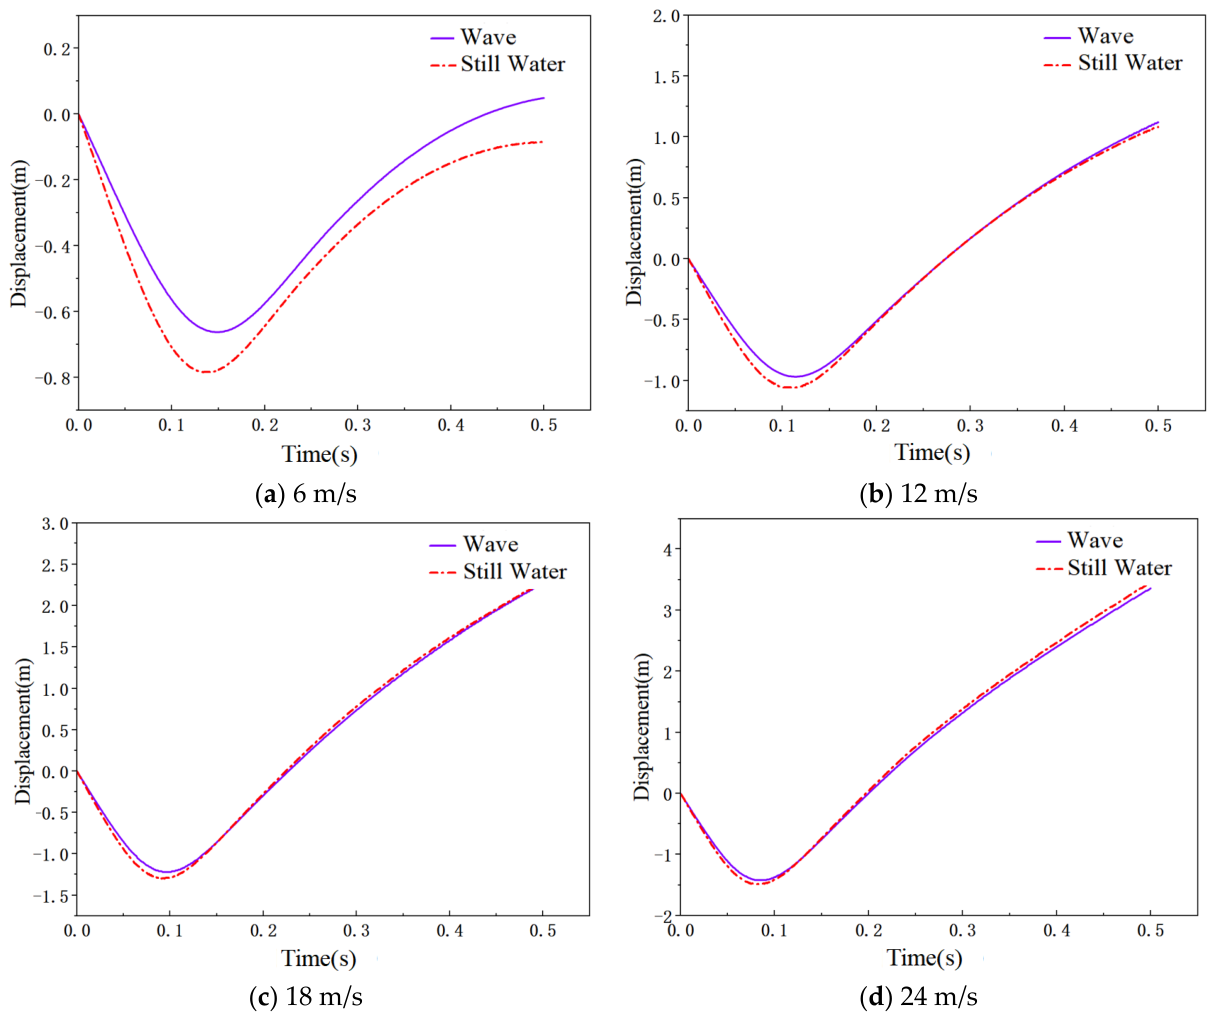
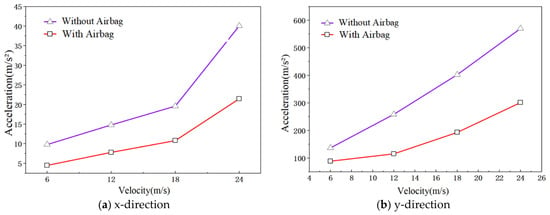
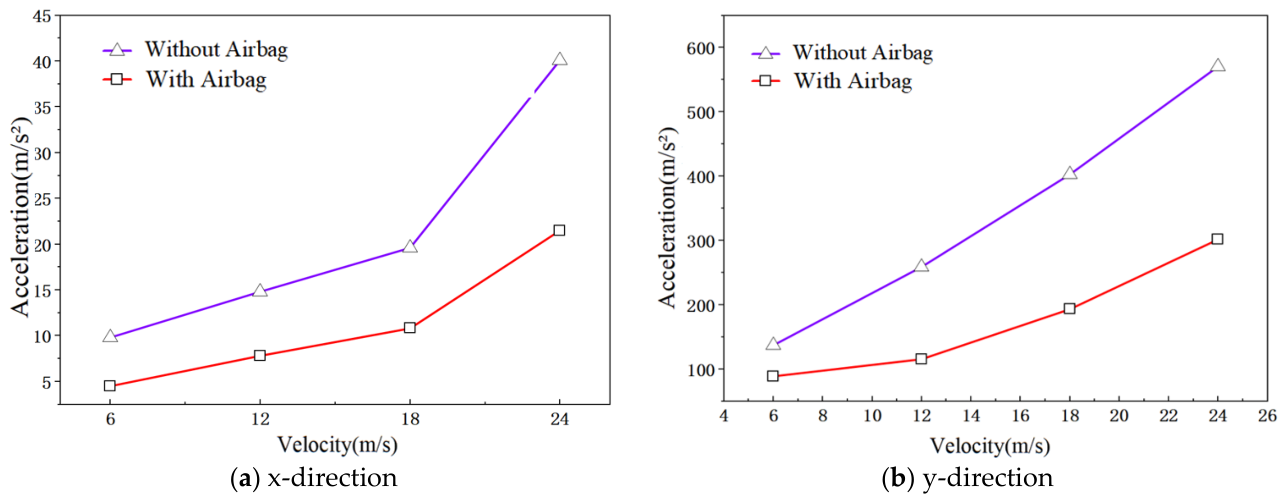
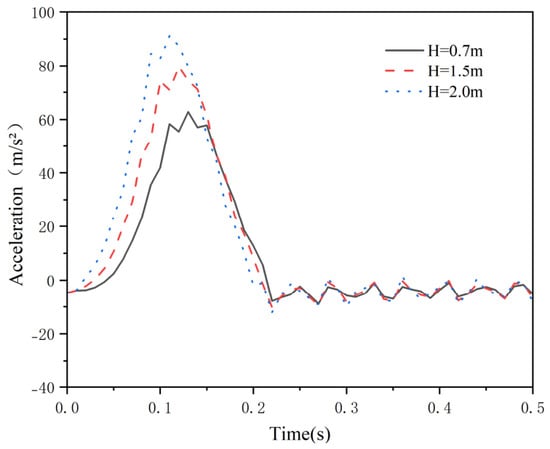
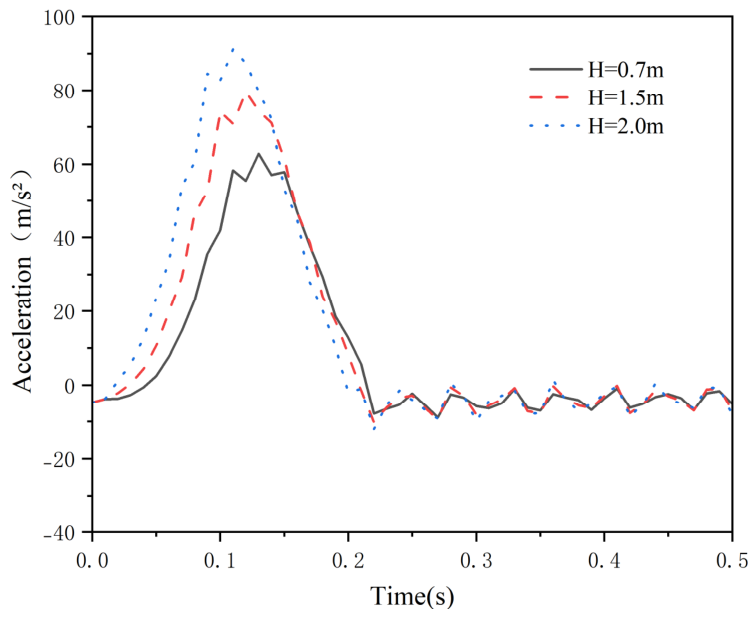
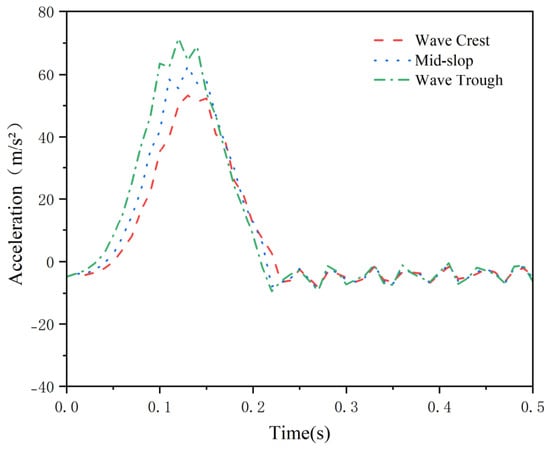
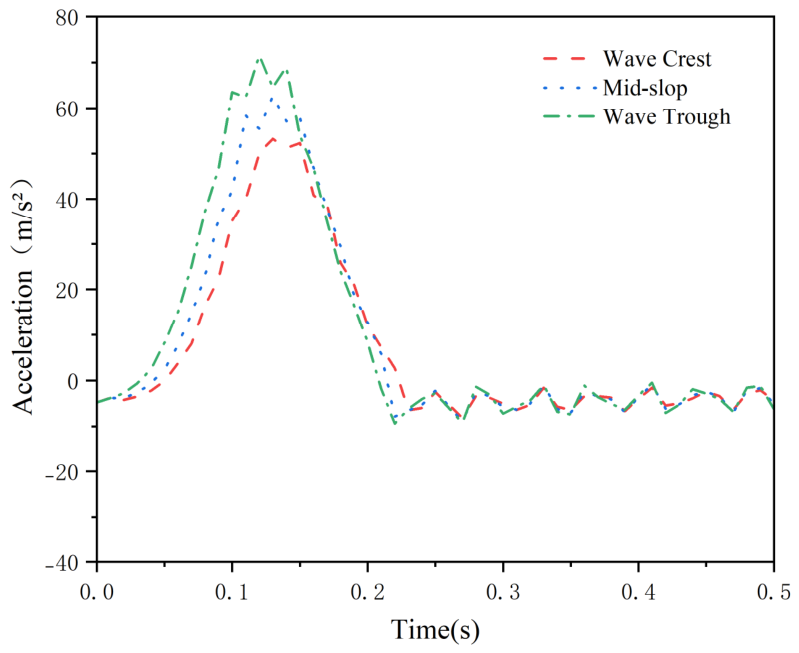

Disclaimer/Publisher’s Note: The statements, opinions and data contained in all publications are solely those of the individual author(s) and contributor(s) and not of MDPI and/or the editor(s). MDPI and/or the editor(s) disclaim responsibility for any injury to people or property resulting from any ideas, methods, instructions or products referred to in the content. |
© 2026 by the authors. Licensee MDPI, Basel, Switzerland. This article is an open access article distributed under the terms and conditions of the Creative Commons Attribution (CC BY) license.