


Abstract
Local rock-dumping protection (RDP) can modify the evolution of pre-existing scour pits around subsea pipelines. This study combines field bathymetric surveys with REEF3D simulations to examine post-protection scour at a pipeline in the East China Sea. The Reynolds-averaged Navier–Stokes model couples a k-ω turbulence closure with sediment transport and bed evolution and was validated against Mao’s pipeline scour experiment. Four field-derived cross-sections were simulated under constant unidirectional inflow at a range of 0.5–2.0 m/s for 30,000 s. Field surveys showed that erosion shifted downstream after RDP, with its distribution varying with downstream slope-toe coverage and the transition to the surrounding seabed. The simulations indicate that the pre-existing scour pit and rock-induced bed mounds jointly reorganize flow separation and recirculation, helping to explain this redistribution. Stronger inflow produced greater lowering of the minimum bed elevation, reaching a range of 0.65–1.24 m at 2.0 m/s after 30,000 s. Continued lowering at the representative section late in the higher-velocity simulations highlights the influence of flow duration. The findings provide a physical basis for positioning remedial RDP relative to existing scour pits and for extending monitoring to potential erosion zones beyond the protected area.
1. Introduction
With continued growth in global energy demand and the progressive development of offshore oil and gas resources, subsea pipelines have become critical infrastructure for offshore hydrocarbon transport, and their in-service safety has attracted increasing attention. Subsea pipelines are typically exposed to complex marine hydrodynamic environments, where waves and tidal currents produce complex flow structures around the pipeline and initiate, transport, and redeposit seabed sediment, ultimately forming local scour pits. Once scour depth and extent exceed certain thresholds, the pipeline may become free spanning, potentially leading to vibration and even structural failure, with considerable economic losses and potential environmental risks [1,2].
Rock-dumping protection (RDP) is used to protect subsea pipelines against scour. Placed rock can increase local bed resistance to erosion and modify the adjacent flow. Related scour-protection behavior has been studied at rubble-mound breakwaters [3]. Extensive research has addressed the initiation of pipeline scour, maximum scour depth, scour time scale, three-dimensional scour expansion, vibration–scour coupling, interactions among multiple pipelines, and scale effects [4,5]. Advances in computational fluid dynamics (CFD) have enabled the use of open-source numerical models such as OpenFOAM and REEF3D to investigate flow fields, vortex structures, sediment transport, and seabed morphodynamics around marine structures [6,7,8,9,10,11,12,13,14,15].
Existing studies of protective measures have considered various approaches to subsea-pipeline protection, including rock covers, riprap mattresses, geotextiles, and rock-dump layers. For example, experimental investigations have examined the shielding effect of rock covers under combined wave–current action and their effect on seabed pore-water pressure; numerical studies have evaluated the effects of rock-dump layers on pipeline stability and local scour [16,17]. In addition, studies of fall-pipe rock-dumping processes have used fluid–structure interaction approaches to analyze rock settling and flow-field evolution around the falling rocks [18].
However, existing studies have predominantly focused on protection performance where pronounced scour is absent or at the initial stage of scour, whereas local RDP applied after a distinct scour pit has formed remains relatively underexplored. In field applications, RDP does not always form a continuous, uniform protective layer; rather, its spatial extent, placement, and relationship to the pre-existing scour morphology often reflect site-specific conditions. Field observations further indicate that RDP does not necessarily halt seabed scour completely. Local scour may continue in some areas, whereas the zone of maximum scour may shift toward the RDP edge or farther downstream. This suggests that RDP can alter the spatial distribution of scour, not merely its depth. Accordingly, the scour redistribution induced by RDP in the presence of pre-existing scour pits warrants further investigation.
This study focuses on a subsea pipeline project in the East China Sea, China. Strong tidal currents produced a pronounced scour pit near the pipeline, prompting several rock-dumping operations to protect it. Under continued tidal forcing, local scour persisted within the RDP-covered area and the bed continued to evolve. Field bathymetric data and the REEF3D numerical model were therefore used to examine seabed morphology, velocity, vertical flow, recirculation, and turbulent kinetic energy before and after RDP, and to compare scour responses under different RDP layouts and flow velocities.
The objectives of this study are to: (1) analyze field-measured changes in seabed morphology before and after RDP; (2) identify the effects of local, spatially nonuniform RDP on near-field flow structures; (3) clarify the relationship among flow disturbance, pre-existing scour-pit morphology, and continuing scour; and (4) evaluate how scour evolution under different RDP layouts responds to changes in flow velocity. Particular attention is given to the effects of RDP location and downstream slope-toe coverage on local hydrodynamic disturbance and scour migration. This study aims to clarify the mechanisms governing the continued evolution of pre-existing subsea-pipeline scour pits after RDP and to inform assessments of seabed protection and the design of protection layouts.
2. Study Area
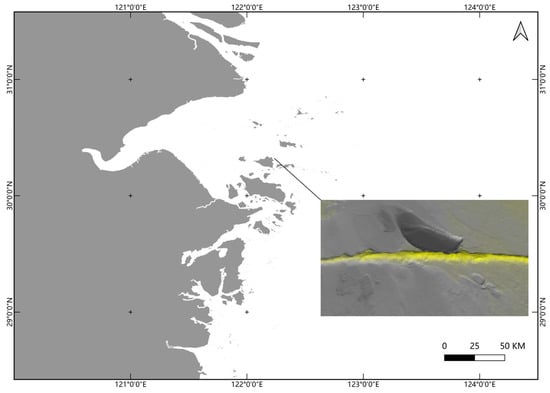
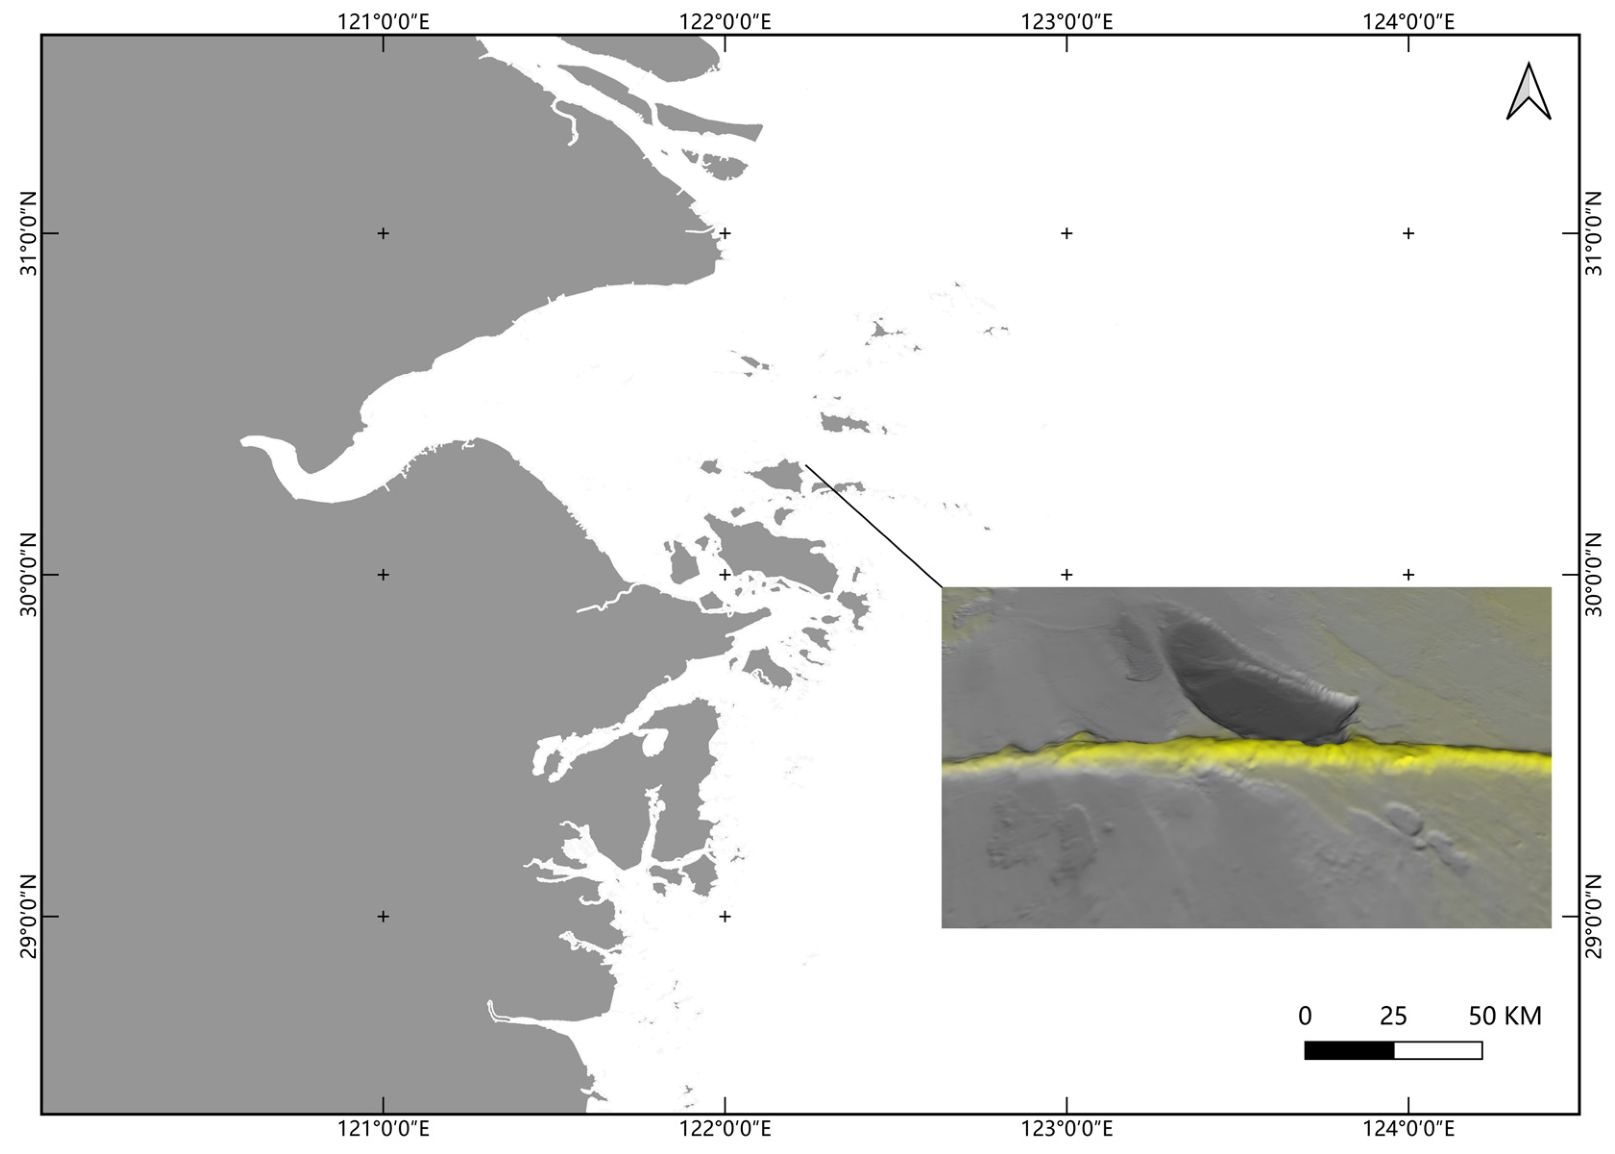
The study site comprises a subsea pipeline and the surrounding seabed in the East China Sea, China. Strong tidal currents have produced a pronounced local scour pit around the pipeline. As scour developed, seabed elevation around the pipeline declined, forming a depression of appreciable spatial extent (Figure 1). To reduce scour-induced threats to pipeline stability, emergency RDP operations were undertaken near the interface between the existing pipeline-protection structure and the scour pit. Constraints imposed by site bathymetry, the work area, and pre-existing scour morphology resulted in marked spatial variations in RDP width and elevation. The resulting protection was nonuniform in both thickness and extent. Repeated bathymetric surveys before and after the emergency operations were used to assess pipeline safety. This project therefore provides a case for investigating the relationships among local RDP, flow, and seabed evolution in the presence of a pre-existing scour pit.
Figure 1.
Location of the study area and schematic illustration of the subsea pipeline.
Seabed bathymetry was acquired using a multibeam sounding system, followed by tidal correction, vessel-motion correction, and data quality control. Based on the equipment specifications and post-processing checks, the overall uncertainty in the water-depth measurements was approximately ±0.08–0.12 m. This uncertainty bounds the detectable limit of seabed elevation change; small differences in bed elevation that fall within this range cannot be reliably distinguished from measurement noise. The repeated surveys captured seabed bathymetry at key stages before and after the emergency RDP operations, providing a basis for assessing seabed evolution around the pipeline with explicit consideration of this measurement uncertainty.
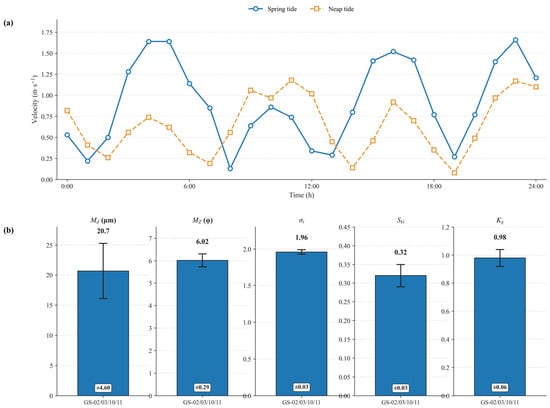
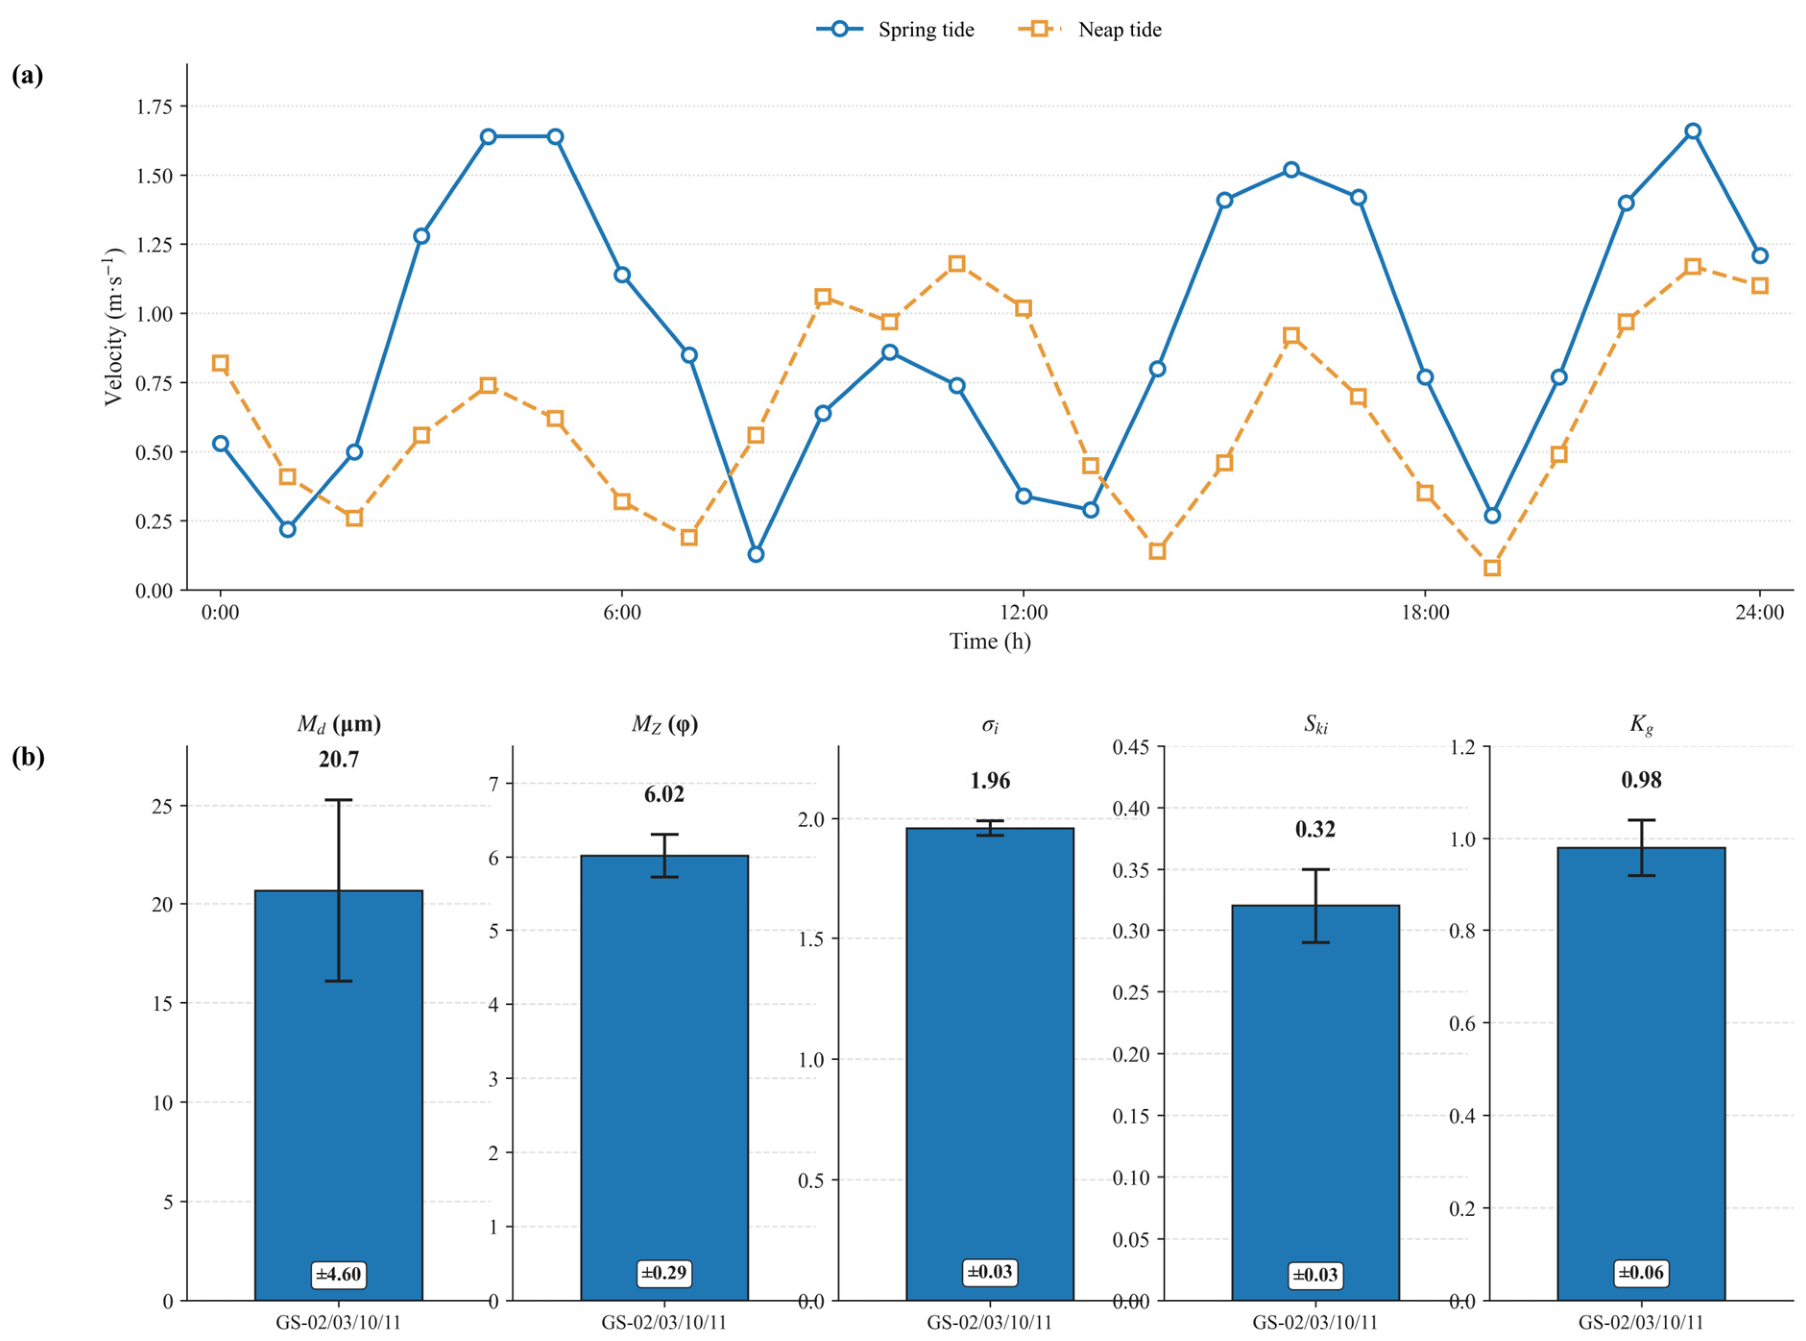
Field tidal-current observations show pronounced tidal variability at the study site (Figure 2a). During spring tides, the mean current velocity is approximately 1.0 m/s, with peak velocities exceeding 1.6 m/s; during neap tides, the mean current velocity is approximately 0.5 m/s, with a peak of approximately 1.2 m/s.
Figure 2.
Field observations of tidal-current velocity and sediment grain-size characteristics: (a) tidal-current velocity time series during spring and neap tides; (b) grain-size parameters of sediment samples collected near the scour pit.
Sediment samples collected near the scour pit (Figure 2b) were characterized using common grain-size parameters, including median grain size (Md), mean grain size (MZ), sorting coefficient (standard deviation, σi), skewness (Ski), and kurtosis (Kg). These parameters quantitatively describe sediment grain-size characteristics; their combined patterns can also provide important evidence for interpreting hydrodynamic conditions and depositional environments. The sediments at the site contain a relatively high fraction of fine particles, are poorly sorted, and do not show pronounced kurtosis, indicating complex depositional dynamics controlled by multiple factors. The pronounced bathymetric variation suggests that sedimentary processes are jointly governed by bathymetry and tidal currents, and that differences in bed sediment may be affected by local topography.
3. Numerical Model and Computational Methods
3.1. Hydrodynamic Model
The open-source computational fluid dynamics model REEF3D was used to simulate the coupled flow and sediment processes around the pipeline. The hydrodynamic field was governed by incompressible Reynolds-averaged Navier–Stokes (RANS) equations [19]. Equations (1) and (2) represent continuity and momentum equations, respectively.
In Equations (1) and (2), ui and uj are velocity components along coordinates xi and xj, t is time, p is pressure, ρ is fluid density, ν is fluid kinematic viscosity, νt is turbulent (eddy) viscosity, and gi is the gravitational acceleration component in the i-direction. Repeated indices imply summation. In Equation (2), the terms on the left represent local acceleration and convection; those on the right represent the pressure gradient, viscous and turbulent stress divergence, and gravity.
Reynolds averaging removes turbulent fluctuations from the resolved mean flow. Their influence is represented through the Reynolds-stress term, closed here with the Boussinesq eddy-viscosity hypothesis. The k–ω turbulence model [20] supplies the turbulent kinetic energy and specific dissipation rate used in this closure (Equations (3) and (4)).
In Equations (3) and (4), δij is the Kronecker delta, k is turbulent kinetic energy, and ω is the specific dissipation rate. The evolution of k and ω is governed by Equations (5) and (6), respectively.
In Equations (5) and (6), Pk denotes the production rate of turbulent kinetic energy. The coefficients σk and σω control the diffusion of k and ω, respectively; βk and β control their dissipation, while α multiplies the production term in the ω equation. The values used are α = 5/9, σk = 2, βk = 9/100, β = 3/40, and σω = 2. These coefficients follow the adopted k–ω closure [20] and are held constant across all simulation cases.
The model resolves the principal hydrodynamic features associated with the pipeline, RDP, and scour pit, including flow separation, wake development, vertical flow deflection, and recirculation, and provides the hydrodynamic input for sediment transport and seabed evolution.
3.2. Sediment Transport and Seabed Morphodynamic Model
The onset of sediment motion was assessed using the Shields criterion. Equation (7) expresses the dimensionless bed shear stress in terms of sediment and fluid properties.
In Equation (7), θ is the Shields parameter; τ is the bed shear stress; ρs and ρ are the sediment and fluid densities, respectively; g is gravitational acceleration; and d50 is the median sediment grain diameter. Sediment motion begins when θ exceeds the critical Shields parameter for the bed material.
Bed-load transport is represented by the van Rijn formula [21], which relates transport for each sediment size class to the excess of bed shear stress above the critical shear stress (Equation (8)).
In Equation (8), qb,i is the bed-load transport rate for size class i, di is the representative grain diameter of that class, and τc,i is its critical bed shear stress; τ and ν retain the meanings defined above. For suspended sediment, the van Rijn relation [22] provides the near-bed reference concentration used to calculate suspended-load transport (Equation (9)).
In Equation (9), cbed,susp.load,i denotes the near-bed reference concentration for sediment size class i, and a is the vertical distance from the bed surface to the concentration reference point. The excess-shear-stress term again reflects the threshold for sediment mobilization.
Changes in bed elevation are computed from sediment mass conservation using the Exner equation [23] (Equation (10)).
In Equation (10), λp is bed porosity, zb is bed elevation, qB,x and qB,y are sediment transport fluxes in the x and y directions, and Es and DA denote erosion (entrainment) and deposition rates. The negative flux-divergence terms describe bed-elevation change due to horizontal sediment transport; the remaining terms describe exchange between the bed and flow. A level-set method [24,25] tracks the bed interface as the zero contour, with F = ∂zb/∂t specifying its vertical motion due to erosion and deposition.
Together, the hydrodynamic solution, bed-load and suspended-load calculations, Exner update, and level-set tracking couple the flow field with evolving bed topography.
3.3. Numerical Discretization and Solver
The model uses a structured Cartesian grid and finite-difference spatial discretization. The convective terms in the RANS equations were discretized using the fifth-order conservative weighted essentially non-oscillatory (WENO) scheme of Jiang and Shu [26]. The convective terms in the turbulence-model equations and the level-set equation were discretized using the Hamilton–Jacobi WENO scheme of Jiang and Peng [27]. Time integration uses a third-order total variation diminishing Runge–Kutta (TVD-RK) scheme [28].
The pressure Poisson equation was solved using the biconjugate gradient stabilized (BiCGStab) solver in the HYPRE library [29], preconditioned with the parallel semicoarsening multigrid (PFMG) solver [30] to improve computational efficiency.
3.4. Boundary Conditions
A logarithmic inlet velocity profile was prescribed to represent the variation in current velocity with depth, and a zero-gradient condition was imposed at the outlet. The top and lateral boundaries were assigned symmetry conditions, and the seabed was assigned a no-slip wall condition. The same types of boundary conditions were used for all cases to support consistent comparisons of hydrodynamic and morphological responses.
The engineering-scale cases use constant unidirectional inflow to compare relative responses to different RDP layouts and flow velocities under controlled conditions. The RDP region is represented by STL surface geometry derived from the surveyed post-protection bathymetry, preserving its location and overall shape, and is assigned the same no-slip boundary condition as the seabed. This representation treats the rock layer as a macroscopic topographic feature that affects the external flow; individual rock arrangements and flow through the pore spaces are not explicitly resolved.
3.5. Validation Against a Classical Pipe-Scour Experiment
Before application to the engineering-scale subsea-pipeline case, the model was validated against Mao’s classical pipe-scour experiment [31,32]. In the validation case, the pipe diameter was D = 0.1 m, the inflow velocity was 0.35 m/s, the median sediment grain size was d50 = 0.36 mm, and the still-water depth was 0.35 m.
To maintain consistency with the laboratory conditions and reduce computational cost, a two-dimensional computational domain was used for the validation model. The domain was 30D long in the streamwise direction and 7D high in the vertical direction, with a single computational cell in the spanwise direction. The initial sediment layer was 0.2 m thick.
A structured Cartesian grid was used. The resolution around the pipe was checked using D/Δx ≥ 10 [14,33], where D is the pipe diameter and Δx is the local grid spacing. Coarse, medium, and fine grids contained 34,544, 64,295, and 202,345 computational cells, respectively. Scour depth S was normalized by D; after 30 min, the S/D values were 0.450, 0.400, and 0.408 (Table 1). The medium- and fine-grid results differed by approximately 2%, indicating a limited effect of further refinement on the predicted scour depth. Considering accuracy and computational cost, the medium grid was selected for the Mao validation case. The engineering-scale grid is described separately in Section 3.6.
Table 1.
Grid-sensitivity results for the Mao validation case.
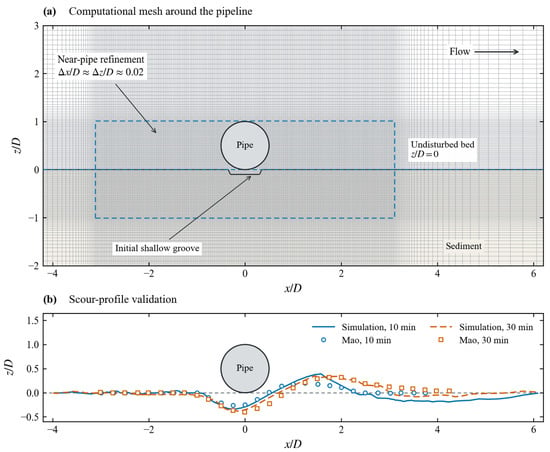
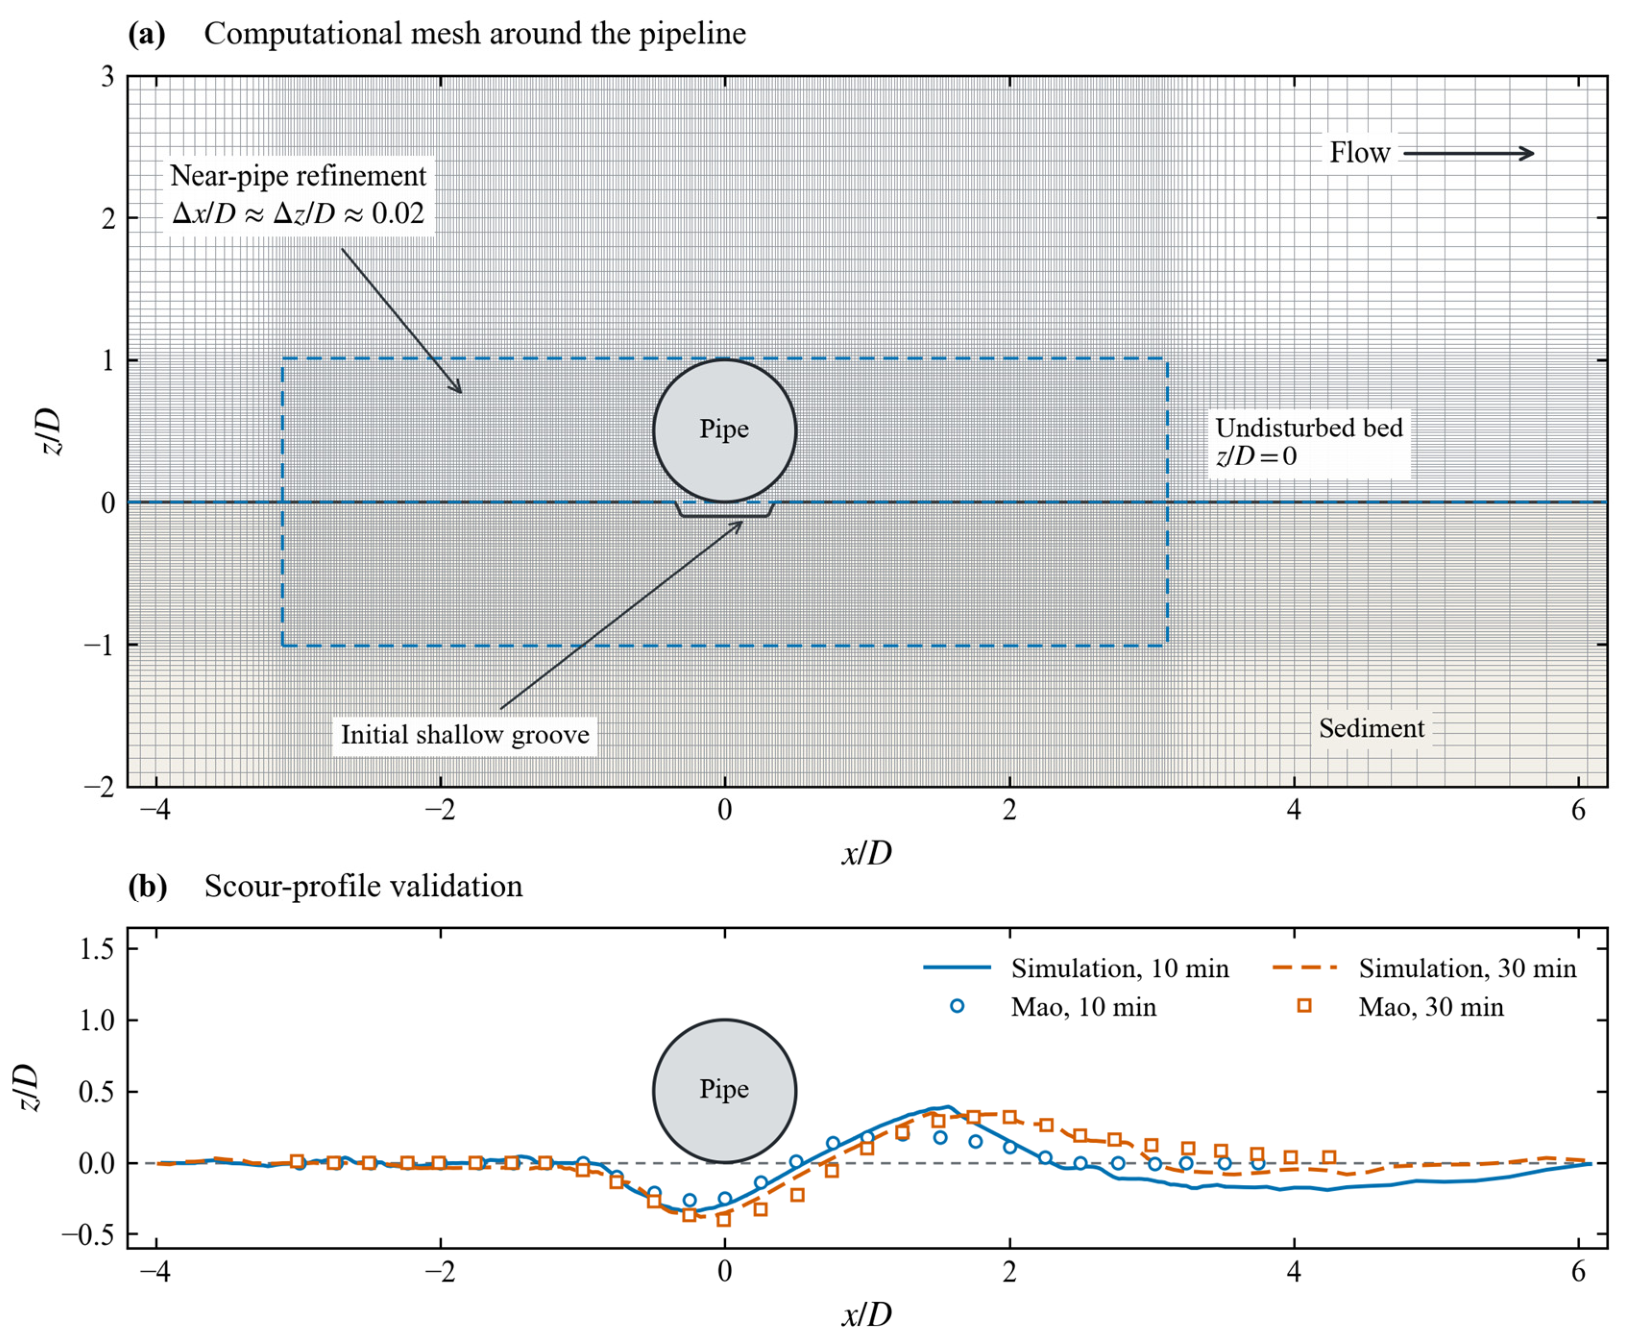
Figure 3a shows the locally refined medium Cartesian grid used for the validation case. Near the pipe, the grid spacing is approximately 0.02D in both the streamwise and vertical directions, where D is the pipe diameter.
Figure 3.
Mao pipeline scour benchmark: (a) local computational mesh; (b) simulated and measured bed profiles at 10 and 30 min. Coordinates are normalized by the pipe diameter, D = 0.10 m.
Figure 3b compares the simulated bed profiles with Mao’s experimental measurements at 10 and 30 min. The simulations reproduce the main scour depression beneath the pipe and the downstream deposition region. At 10 min, the predicted deposition mound at approximately x/D = 1−2 is higher and steeper than measured. This discrepancy may reflect differences in sediment properties, including the angle of repose, between the model and the experiment.
At 30 min, the predicted scour depression and downstream deposition mound are generally consistent with the measurements, although differences remain in the downstream profile. The comparison supports the model’s ability to reproduce the main features of local pipeline scour under benchmark conditions. Its application to field-scale RDP configurations remains subject to the assumptions described in Section 3.8.
3.6. Engineering-Scale Computational Domain and Seabed Topography
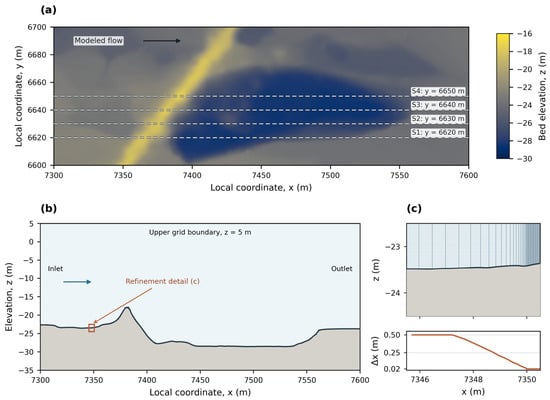
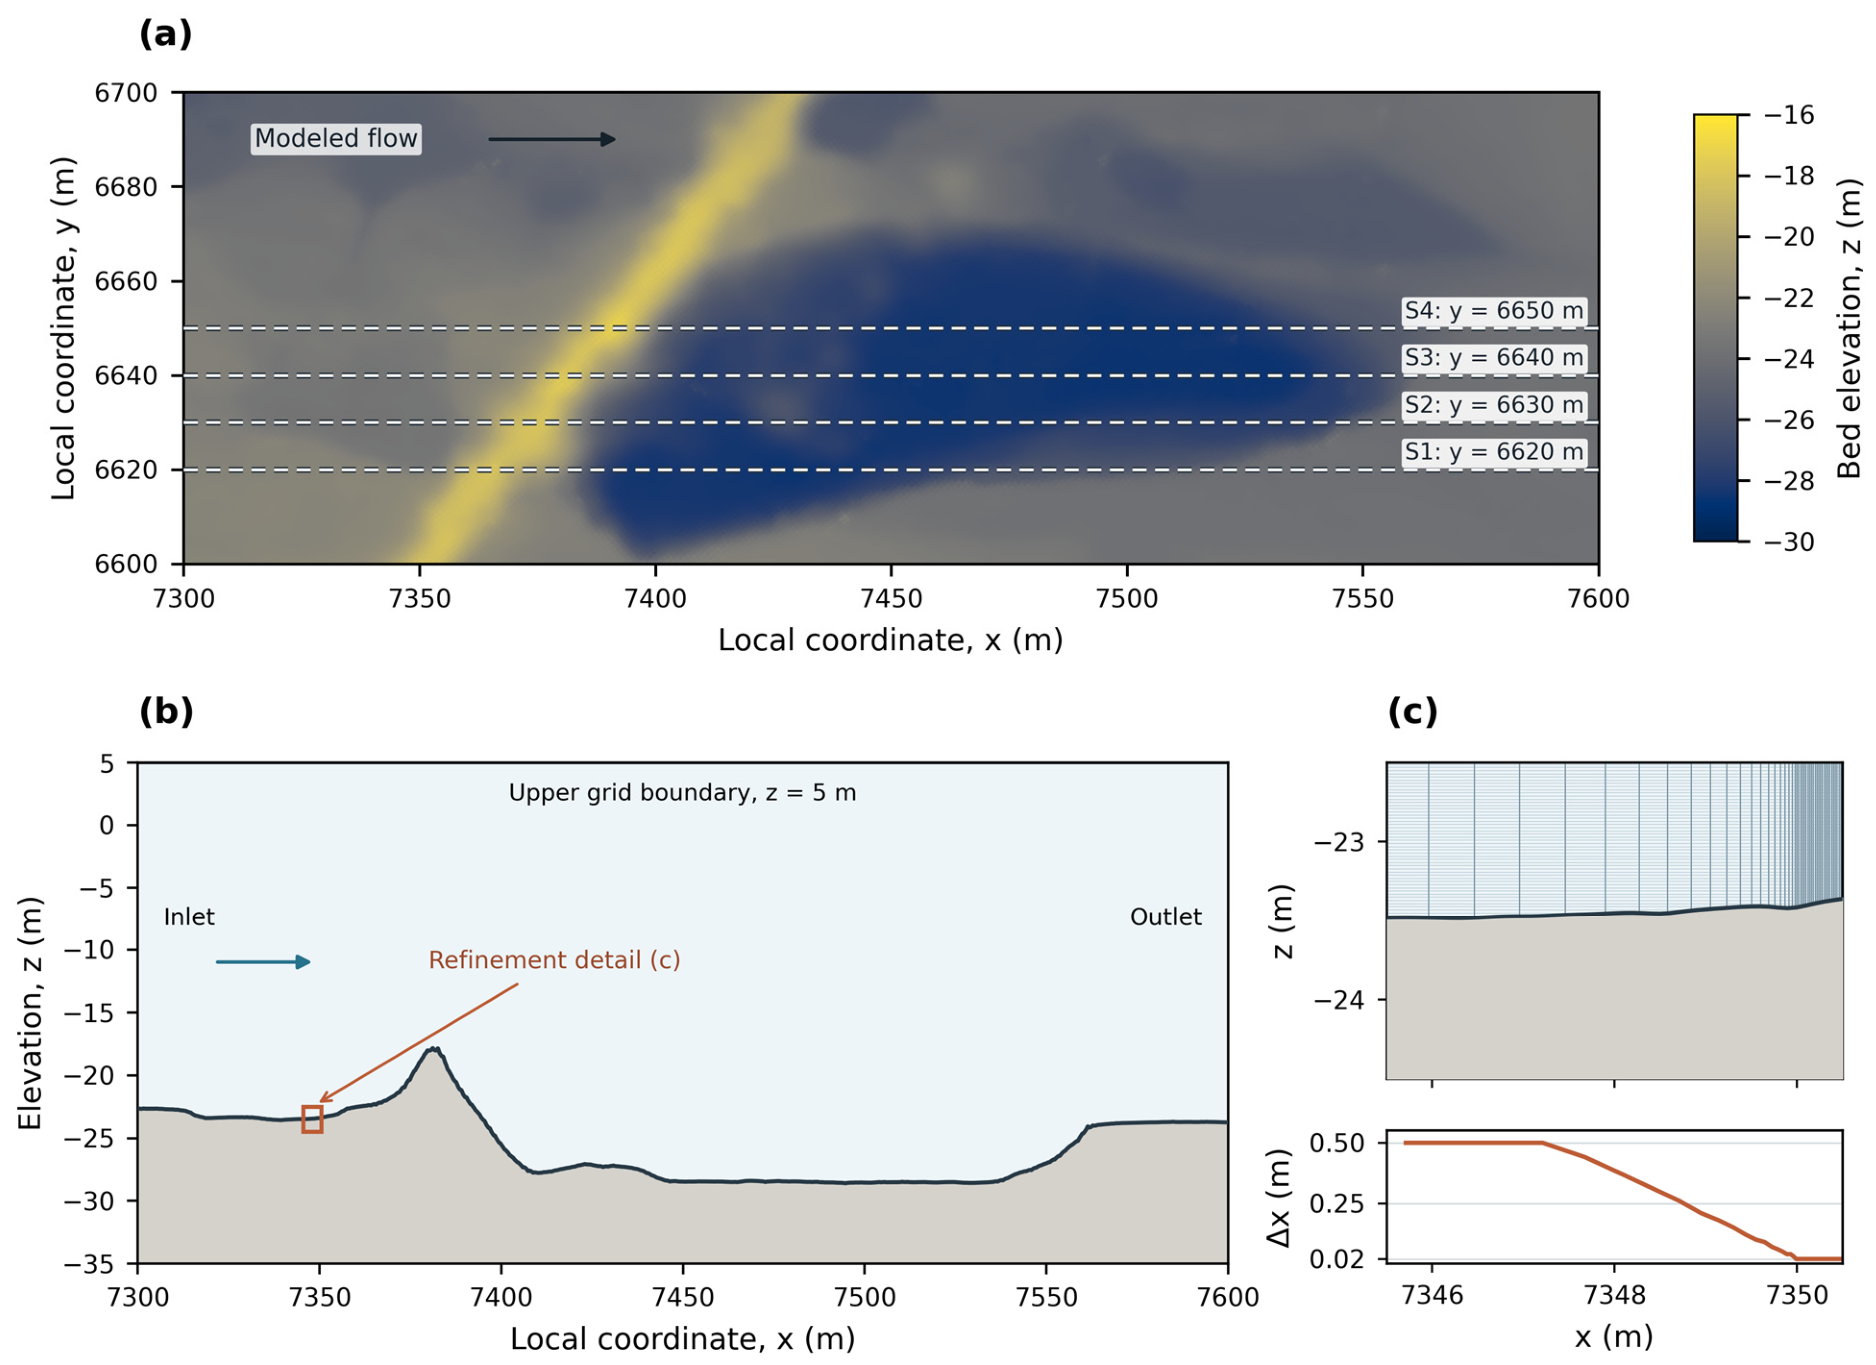
The engineering-scale computational domains were defined using multibeam bathymetry covering an approximately 300 m streamwise by 100 m transverse area around the pipeline (Figure 4a). The field-derived bathymetry preserves the pre-existing scour depression and surrounding seabed features, allowing the simulations to represent site-specific topographic conditions.
Figure 4.
Field-derived seabed morphology and sectional grid configuration. (a) Plan view of the seabed elevation measured after RDP over the 300 m × 100 m survey area. Dashed lines indicate the four streamwise sections at y = 6620, 6630, 6640, and 6650 m; the arrow indicates the imposed flow direction. (b) Bed profile after RDP and grid extent for the representative section at y = 6640 m. The box marks the area enlarged in (c). (c) Enlarged view of the grid-refinement transition at x = 7345.5–7350.5 m. The upper plot shows the rectilinear grid, and the lower plot shows the streamwise spacing Δx, which decreases from 0.50 to 0.02 m. The vertical spacing in the displayed region is approximately 0.02 m.
Four streamwise cross-sections were extracted at y = 6620, 6630, 6640, and 6650 m, with 10 m spacing between adjacent sections (Figure 4a). At each section, the bed profile before RDP represents the pre-existing scour topography, whereas the profile after RDP reflects the surveyed seabed after rock placement. The section-based domains were discretized using structured Cartesian grids. Figure 4b shows the bed profile after RDP and grid extent for the representative section at y = 6640 m; Figure 4c provides an enlarged view of a local refinement transition, where the streamwise spacing Δx decreases from 0.50 to 0.02 m.
The four cross-sections were spaced evenly with reference to the structure layout and principal flow direction, and their representativeness was checked against the measured bathymetry. The section at y = 6620 m represents insufficient downstream slope-toe coverage; that at y = 6630 and 6640 m represents locally raised bed features formed by toe backfilling; and that at y = 6650 m represents broader protection with a gentler transition to the surrounding seabed. Together, these sections cover the principal RDP layouts and topographic transitions in this case, allowing comparison of their effects on recirculation and the location of subsequent erosion. Each section is simulated in an independent two-dimensional domain that preserves the measured streamwise bed profile, focusing on local interactions among the protected area, the pre-existing scour pit, and the downstream slope. Cross-stream flow, three-dimensional vortex structures, and sediment exchange between sections are not represented.
The grid is locally refined near the RDP surface, at topographic transitions, and within the main scour zone, with coarser cells in the far field. Grid sensitivity was assessed using the same procedure as for the validation case, yielding a scheme in which the streamwise spacing transitions smoothly from 0.50 to 0.02 m. Three systematically refined grid levels (coarse, medium, fine) were examined for the representative U = 1.5 m/s test. The relative difference in the predicted maximum scour depth between medium and fine grids was within 4.0%, and the spatial pattern of the scour hole together with the temporal development of bed lowering showed good consistency. The expansion ratio between adjacent cells is less than 1.2, balancing local topographic resolution and overall computational efficiency (Figure 4b,c).
3.7. Numerical Simulation Cases
Field tidal-current observations indicate mean velocities of approximately 1.0 m/s during spring tides and 0.5 m/s during neap tides. Peak velocities exceed approximately 1.6 m/s during spring tides and reach approximately 1.2 m/s during neap tides. A velocity of 1.5 m/s was therefore selected as the reference simulation condition. Additional cases at 0.5, 1.0, and 2.0 m/s were included to assess the sensitivity of scour development to flow velocity. The 2.0 m/s case extends above the typical peaks in the present observations to examine scour under stronger hydrodynamic forcing.
At all four cross-sections, the seabed condition after RDP was simulated at flow velocities of 0.5, 1.0, 1.5, and 2.0 m/s. The condition before RDP was also simulated at 1.5 m/s, giving a total of 20 cases (Table 2). All engineering-scale cases were run to a morphodynamic simulation time of 30,000 s (approximately 8.33 h), allowing bed responses to be compared after the same duration of forcing. The reported maximum scour depths are instantaneous spatial maxima at that time.
Table 2.
Simulation cases.
The simulation matrix addresses two interrelated questions. First, the topographies before and after RDP are compared at 1.5 m/s to examine the associated hydrodynamic and seabed responses. Second, the topography after RDP is simulated at different velocities to assess the sensitivity of scour development to flow velocity.
3.8. Applicability and Limitations of the Engineering-Scale Model
The engineering-scale model uses field-measured bathymetry and thus preserves the spatial relationships among the pre-existing scour pit, RDP, and downstream slope. It is intended to analyze RDP-related changes in the local flow field and recirculation within the pit, compare the spatial scour response under different RDP layouts, and assess differences in scour development among flow velocities.
A single representative silt grain size was used in the engineering-scale model so that comparisons among cases focus on differences in initial topography, RDP layout, and inflow conditions. The actual seabed may contain coarser fractions and clay layers; sediment sorting, surface coarsening, armoring, and cohesive effects are therefore not fully represented. Rock size, placement, porosity, and the associated local flow within the RDP region were also simplified.
These simplifications may overestimate sediment mobility and allow scour to develop more rapidly than under field conditions. The model is therefore used primarily to interpret flow–topography interactions and compare relative responses among cases. It is not used to calibrate field scour rates or predict long-term seabed morphology.
4. Results
4.1. Measured Seabed Evolution Before and After RDP
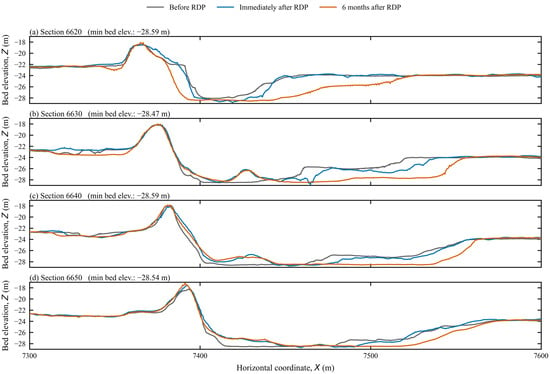
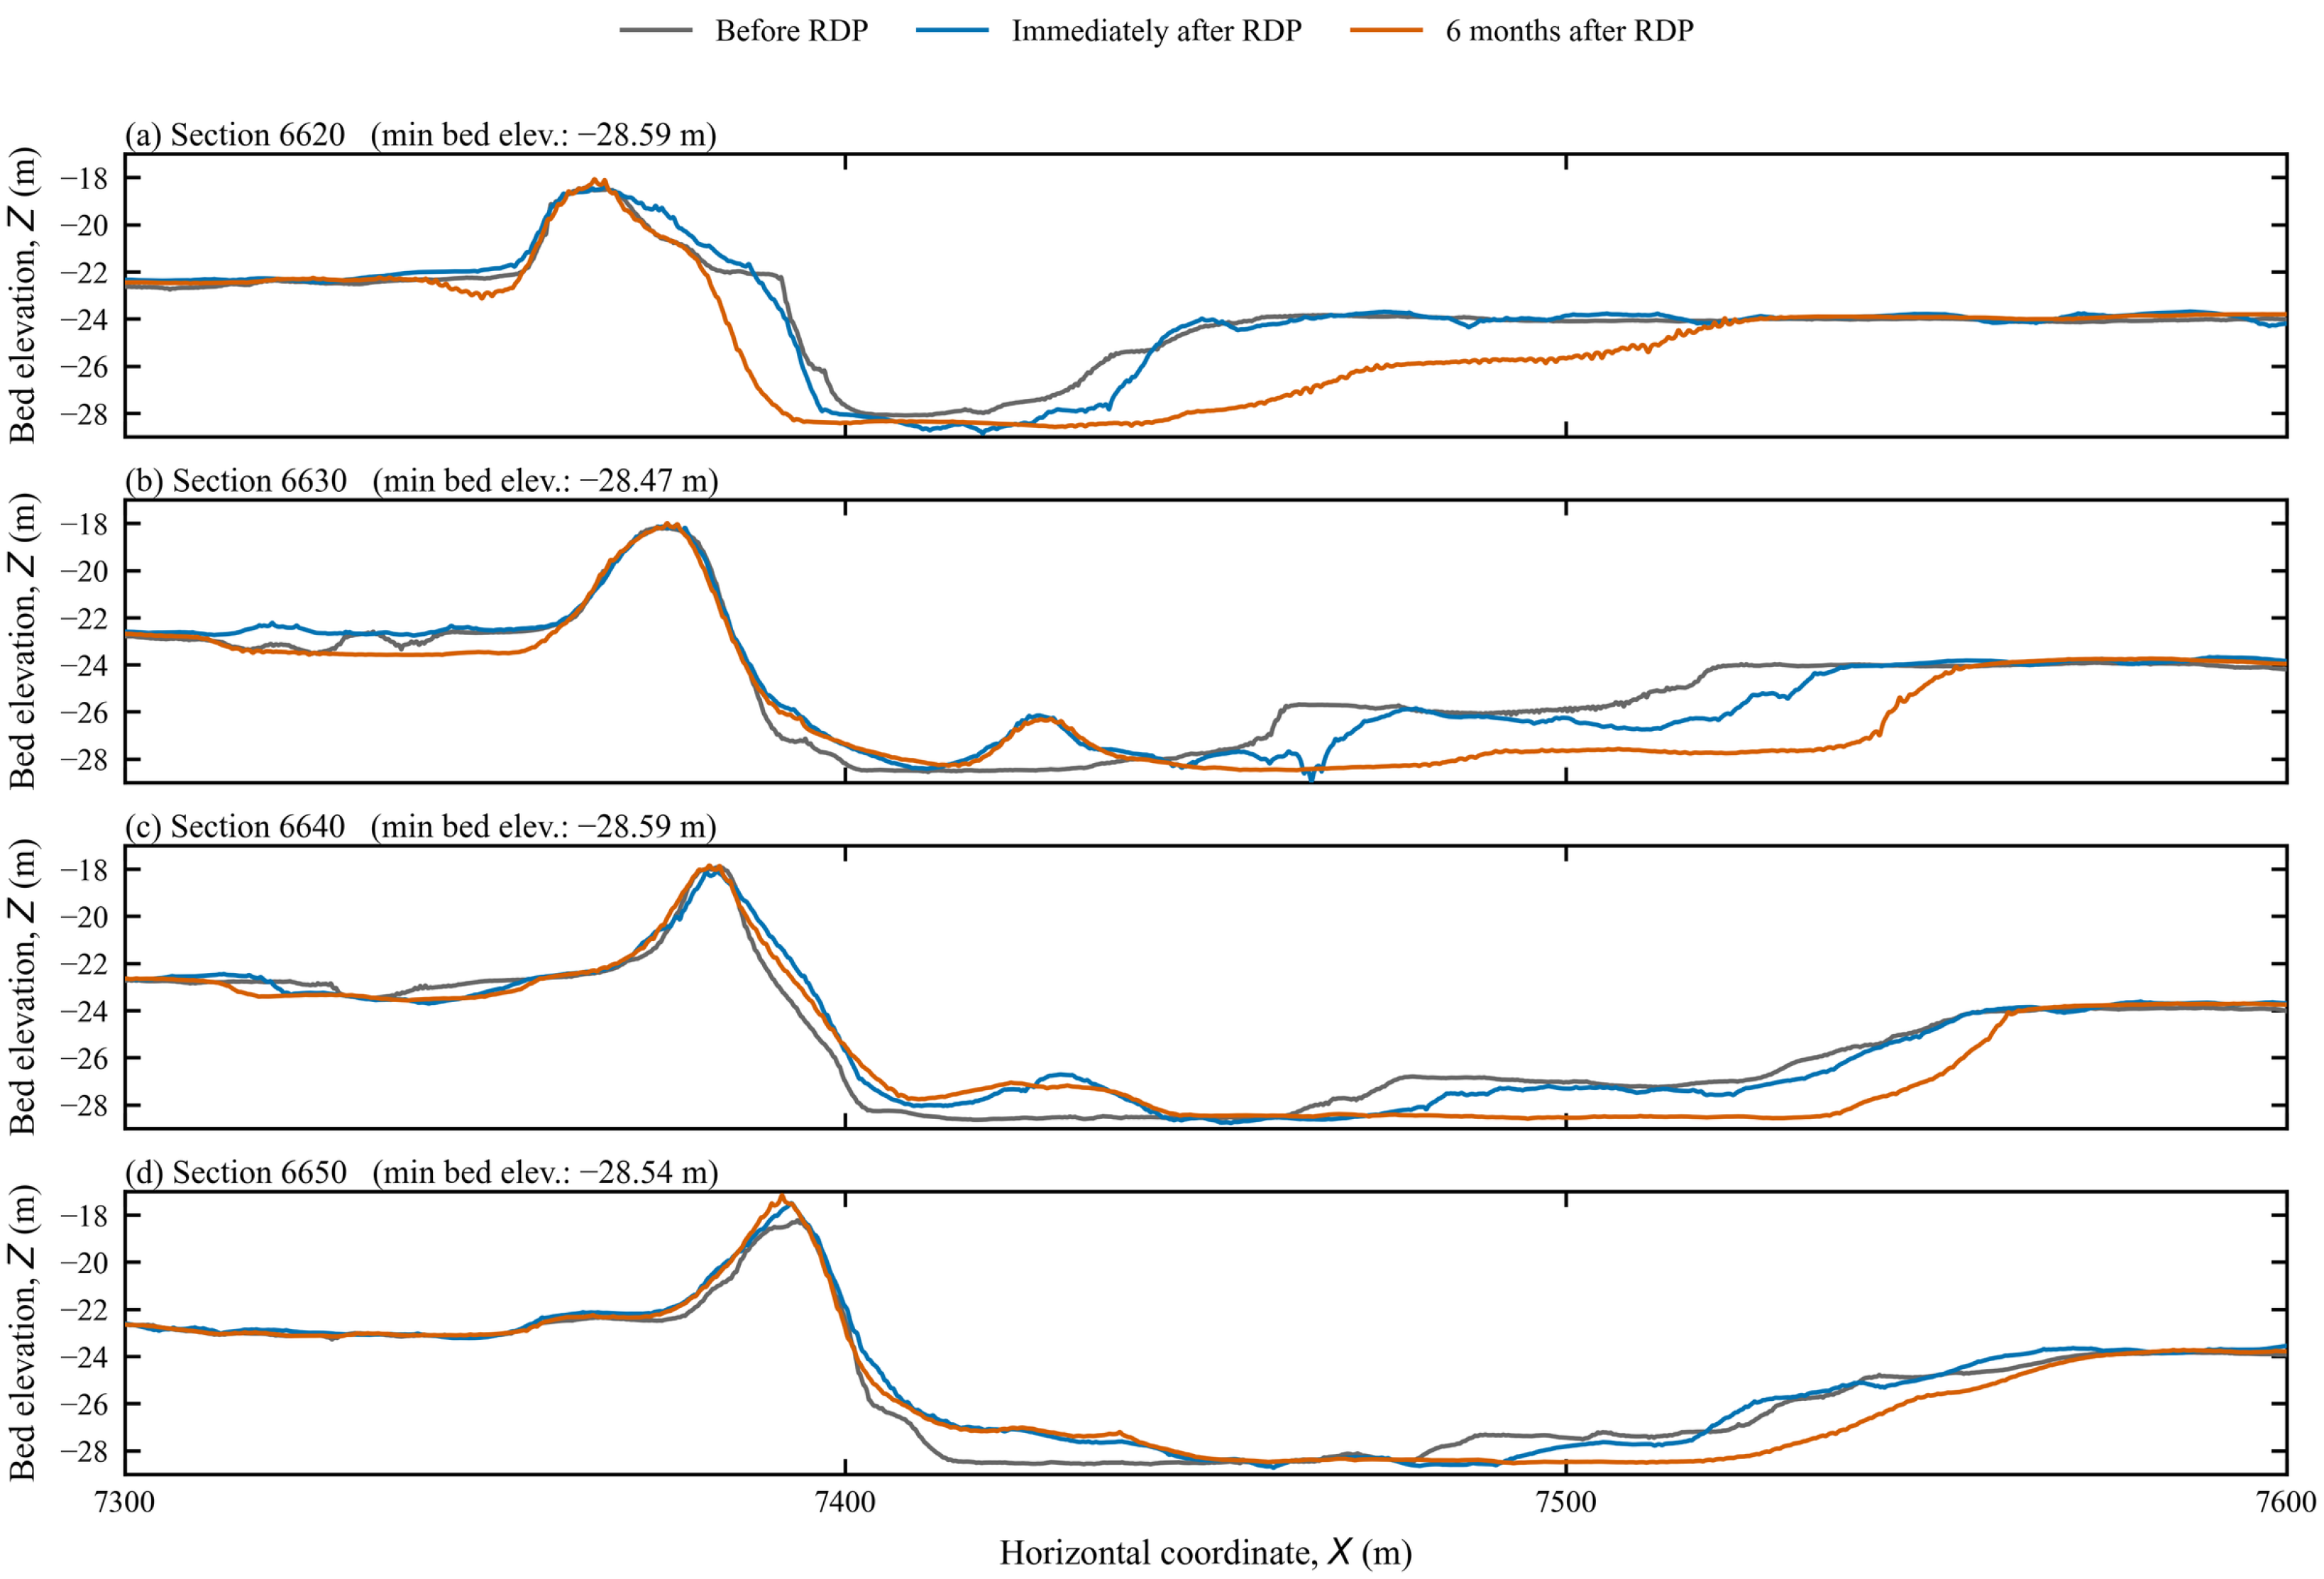
Figure 5 presents measured seabed profiles at the four cross-sections for three stages: before RDP installation, immediately after RDP completion, and six months after installation. Before RDP installation, distinct scour pits were present at all four cross-sections. Immediately after RDP completion, the scour pits deepened locally, indicating that scour continued during RDP placement. Six months after RDP installation, some areas remained relatively stable, whereas the scour locations generally migrated downstream.
Figure 5.
Measured seabed profiles at the four cross-sections before and after RDP.
At the y = 6620 m cross-section, RDP was approximately 13 m wide and was concentrated near the original pipeline, providing insufficient coverage of the toe of the severely scoured downstream slope. Marked erosion remained near the slope toe after RDP installation. At the y = 6630 and 6640 m cross-sections, RDP widths were approximately 20 and 28 m, respectively, covering the downstream slope toe and parts of the scour pit. Rock placement partially filled the original pit and created local bed mounds, producing double-peaked bed profiles. At the y = 6650 m cross-section, the RDP width was approximately 44 m, providing broader protection and a relatively smooth transition to the downstream seabed.
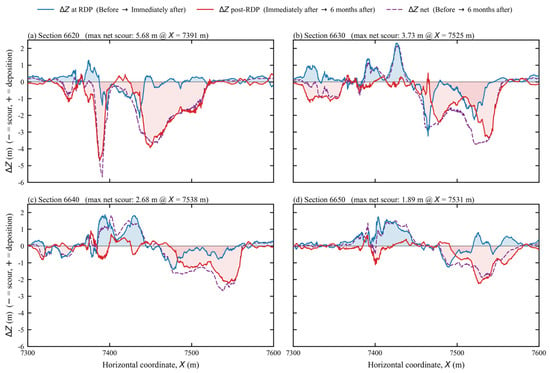
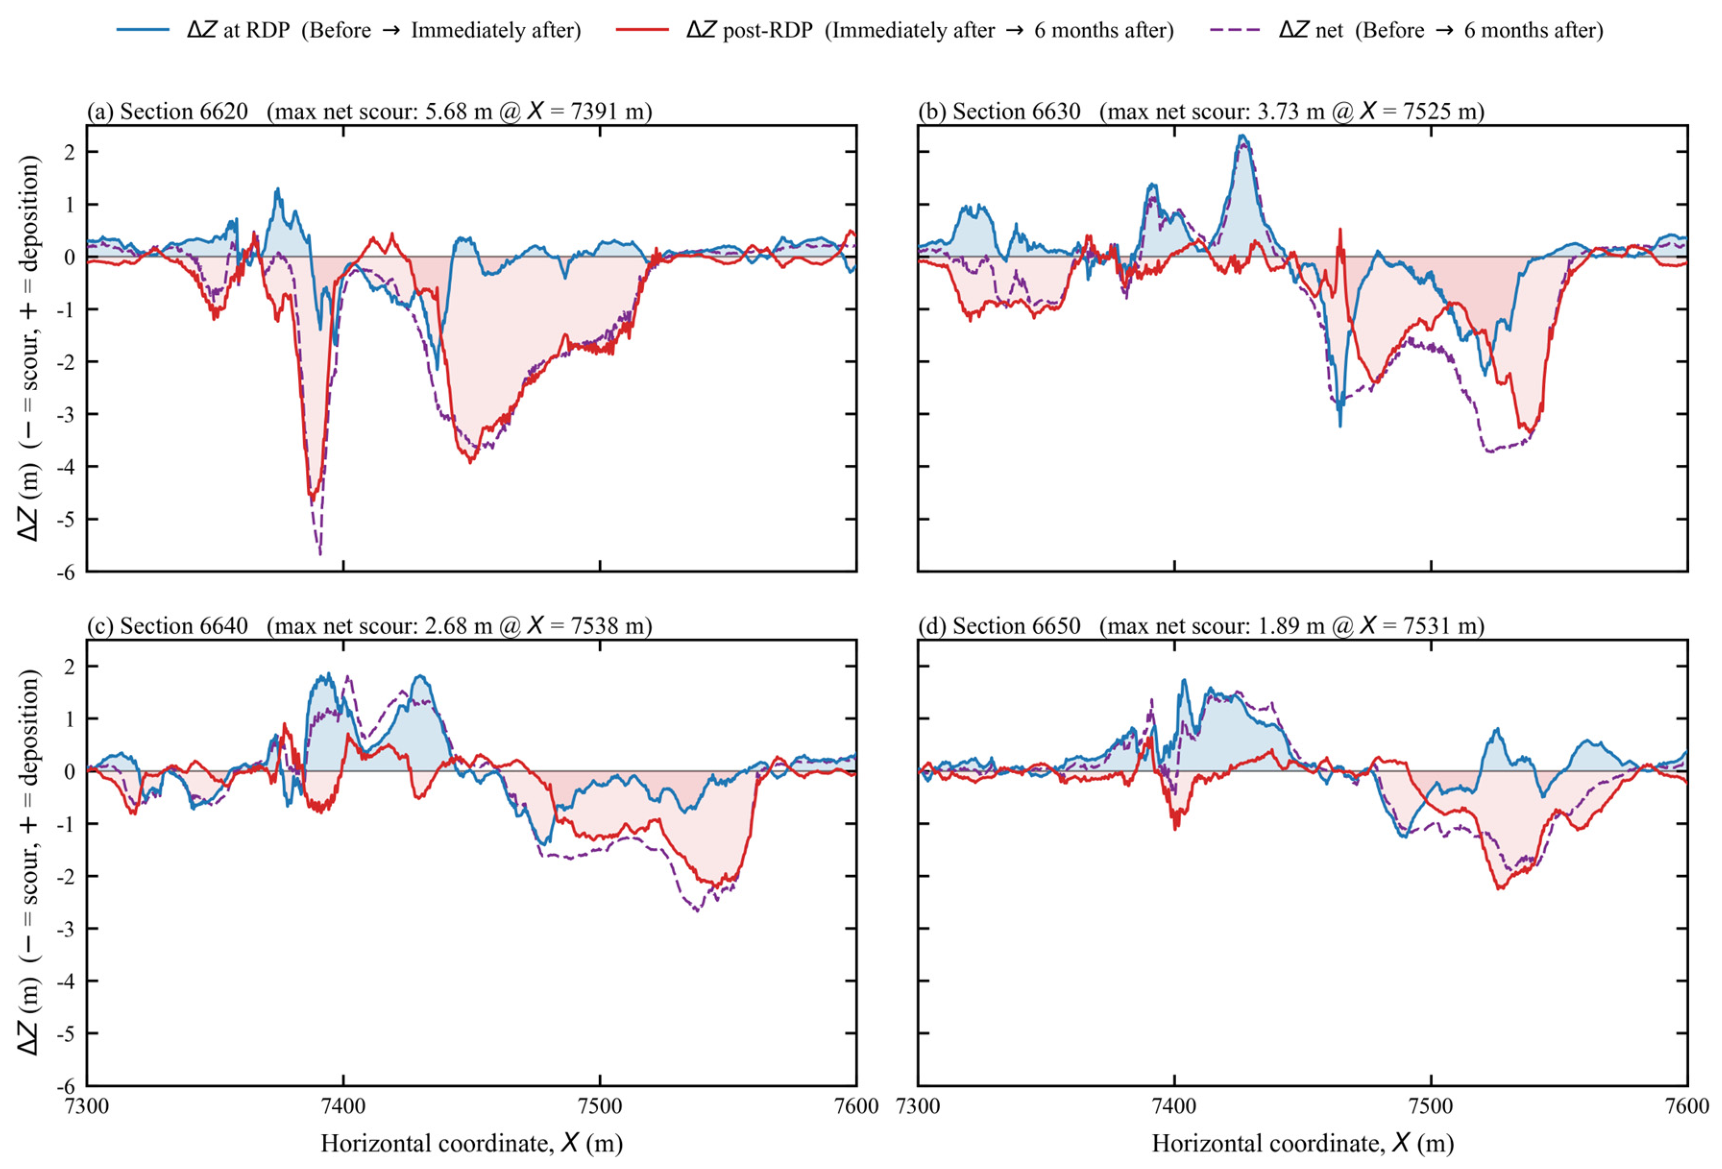
As shown in Figure 6, seabed changes during RDP installation differed markedly in spatial pattern from seabed evolution during the subsequent six months. Overall, RDP altered the morphology of the pre-existing scour pits rather than simply eliminating scour. In Figure 6, ΔZ denotes the change in seabed elevation between the survey stages being compared.
Figure 6.
Spatial distribution of net seabed-elevation change (ΔZ) at the four cross-sections.
4.2. Flow-Field Characteristics Before and After RDP
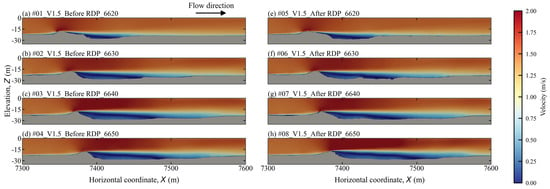
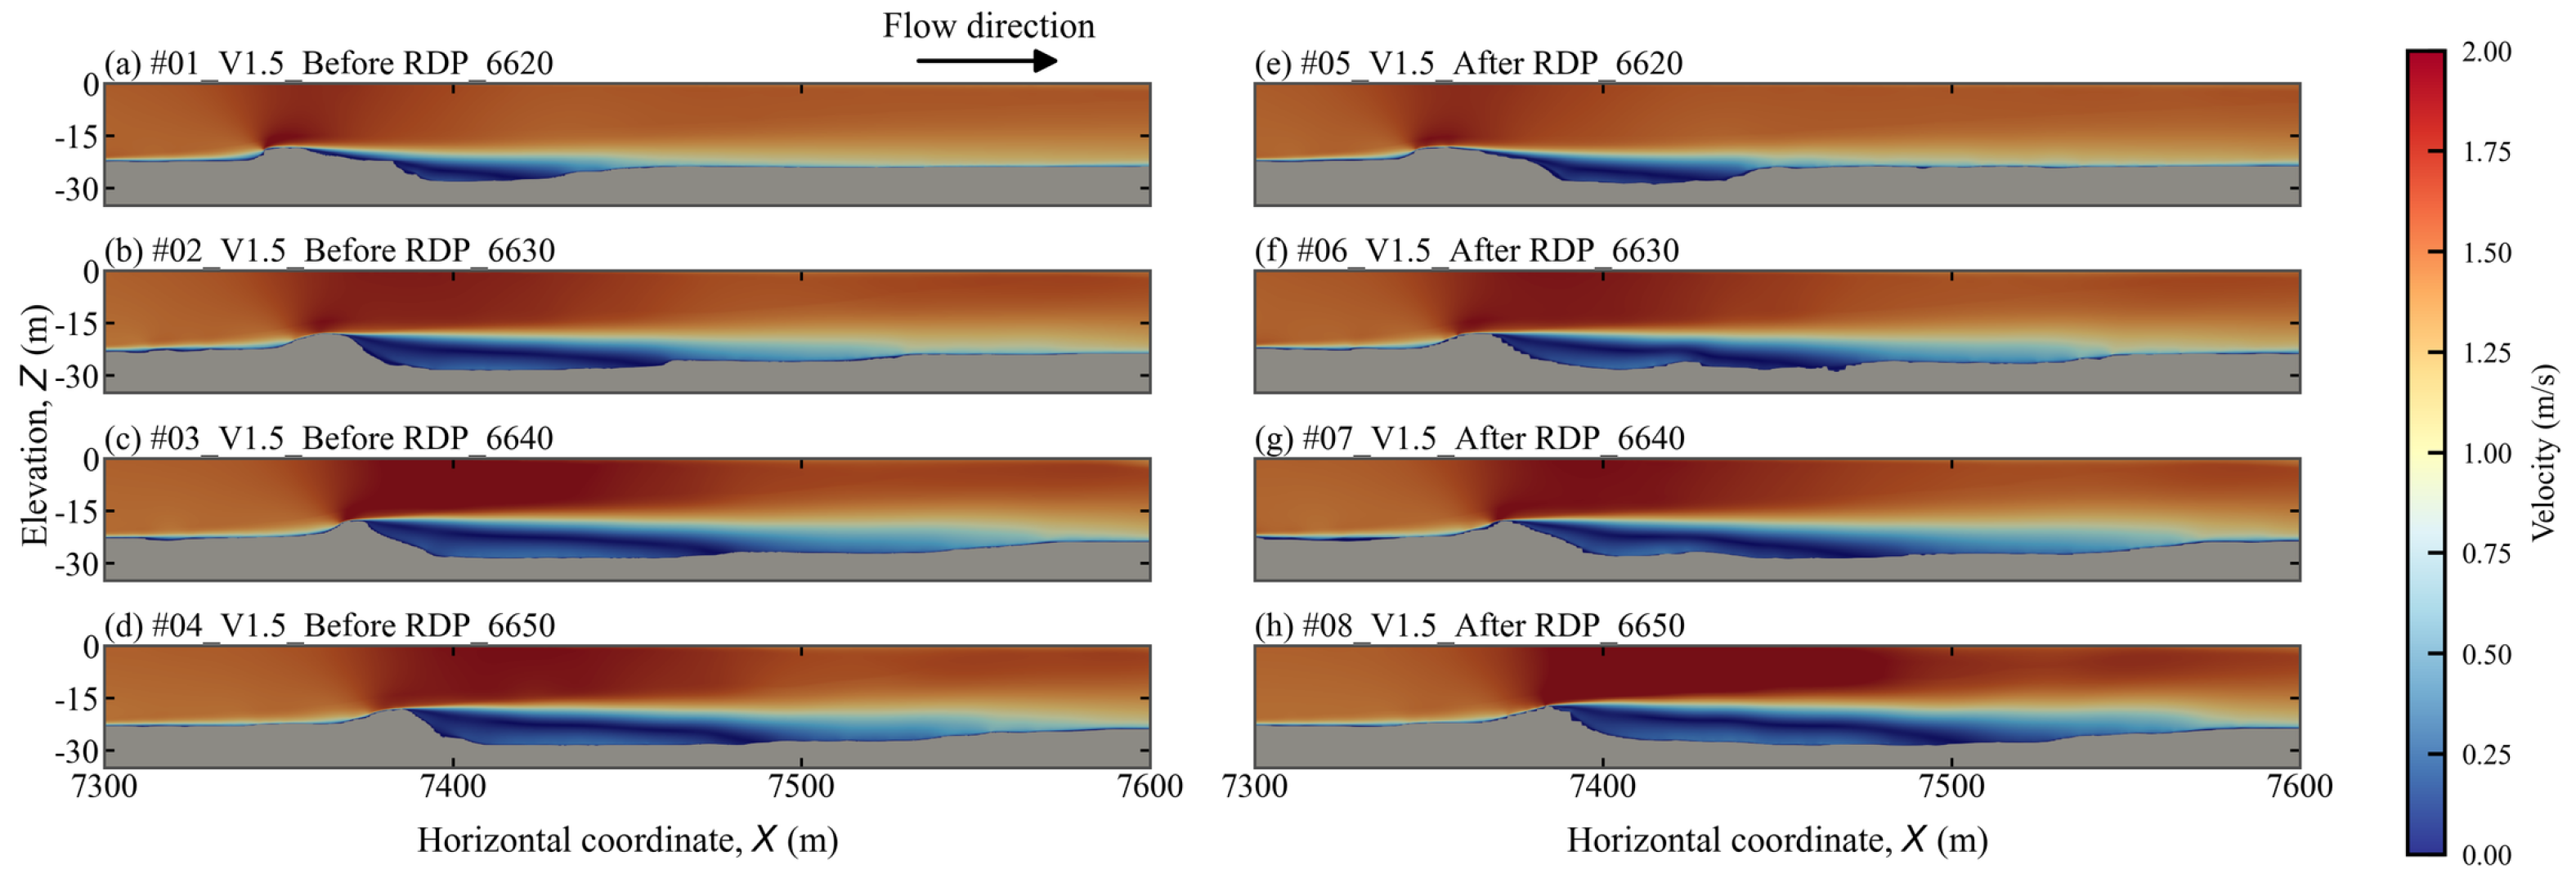
Figure 7 shows streamwise-velocity distributions at the four cross-sections. Overall, the flow patterns were similar among sections. The incoming flow accelerated over the bed mound above the pipeline and separated on its downstream side, producing a low-velocity wake in which velocities locally fell below 0.5 m/s.
Figure 7.
Streamwise-velocity distributions at the four cross-sections before and after RDP.
Within the scour pits, streamwise velocity was relatively low in the lower water column, whereas the upper water column retained substantial momentum. Downstream, the influence of the structure gradually weakened and velocity progressively recovered. Cross-sections with larger scour pits generally exhibited longer low-velocity wakes, indicating a clear connection between pre-existing scour-pit morphology and the downstream flow field.
RDP had limited influence on the overall velocity distribution through the water column but exerted more pronounced effects near the bed. At the y = 6630 and 6640 m cross-sections, bed mounds formed by rock placement caused appreciable local velocity disturbances downstream of the protected area.
4.3. Recirculation and Vertical-Flow Characteristics
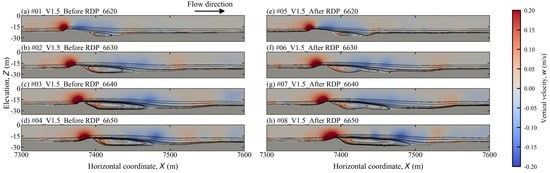
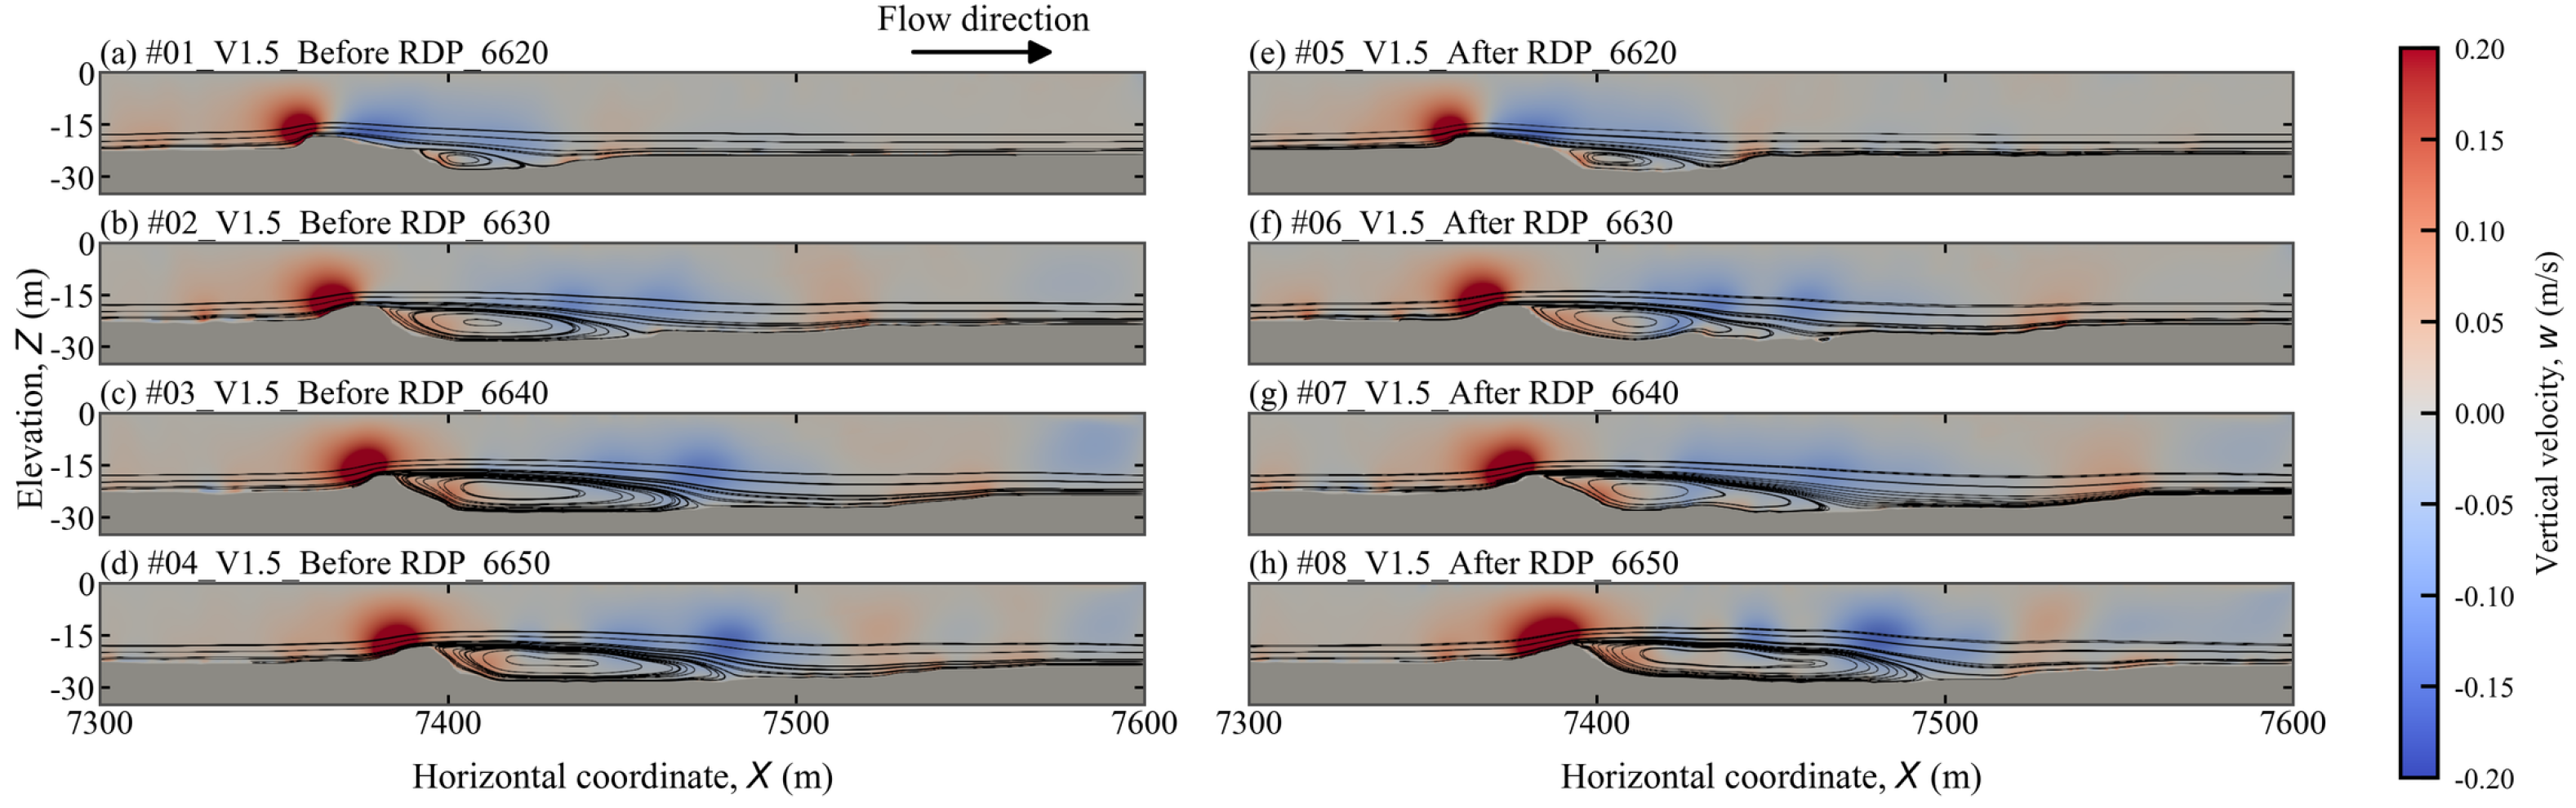
The vertical-velocity and streamline distributions in Figure 8 show that the bed mound above the pipeline and the pre-existing scour pit substantially deflected the flow. Upstream of the mound, the incoming flow was directed upward, producing positive vertical velocities of up to approximately 0.20 m/s.
Figure 8.
Streamlines and vertical-velocity distributions at the four cross-sections before and after RDP.
Downstream of the structure, the flow was clearly deflected downward, forming an extensive region of negative vertical velocity within the scour pit. Farther downstream, the downward-moving flow interacted with the scour-pit bed and turned upward, creating a near-bed upward flow. The flow then turned downstream and continued approximately parallel to the seabed.
A circulating flow dominated by a clockwise recirculation cell developed within the scour pit. Its core was primarily located near the bed and tended to occur near the downstream slope toe. Along the upper boundary of the recirculation region, streamlines were relatively smooth and continuous; as the flow moved downward toward the seabed, it turned upward in the downstream region. In the lower part of the recirculation region, streamlines conformed more closely to the scour-pit morphology.
RDP most strongly affected recirculation at the y = 6630 and 6640 m cross-sections. Splitting and turning of the sectional streamlines, together with changes in the regions of positive and negative vertical velocity, indicate that the rock-induced bed mounds deformed the primary clockwise recirculation cell and produced signs of local secondary recirculation cells. Upward flow was also locally enhanced downstream of these mounds and near the downstream slope toe.
At the y = 6650 m cross-section, RDP altered the shape and spatial extent of the primary clockwise recirculation zone, but the overall recirculation structure remained relatively continuous. At the y = 6620 m cross-section, the influence of RDP on the recirculation structure was relatively limited.
4.4. Turbulent Kinetic Energy Distribution
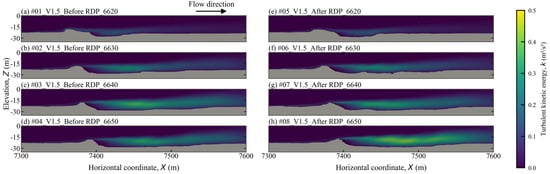
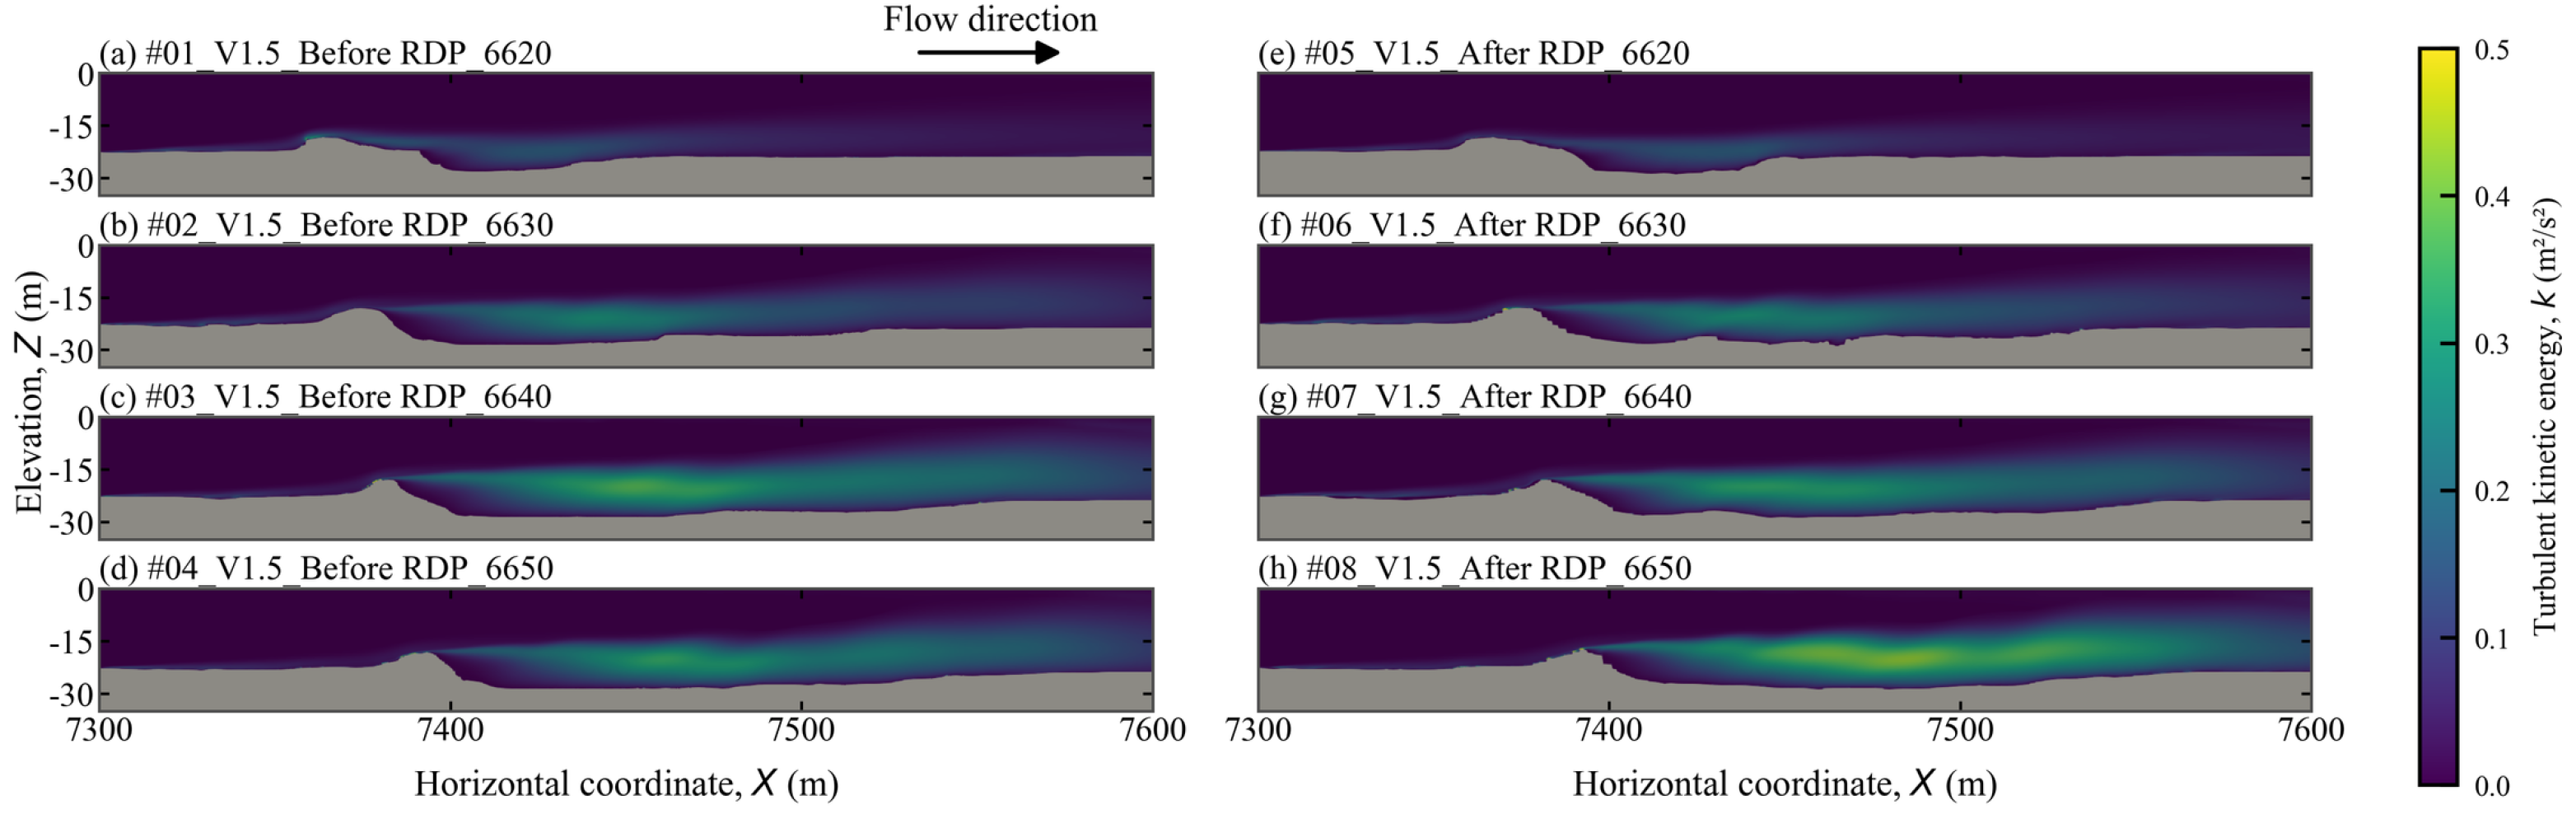
Figure 9 shows turbulent kinetic energy (TKE) distributions at the four cross-sections. High-TKE regions occurred mainly near the bed mound above the pipeline and within the downstream scour pits. These patterns are consistent with turbulence associated with flow separation, with its spatial extent also influenced by scour-pit size and morphology.
Figure 9.
Turbulent kinetic energy (TKE) distributions at the four cross-sections before and after RDP.
High-TKE regions broadly corresponded to the zones of strong flow deflection and recirculation in Figure 8. Larger scour pits offered more space for separated flow and recirculation to develop and thus produced more extensive high-TKE regions.
4.5. Scour Evolution Under Different RDP Layouts
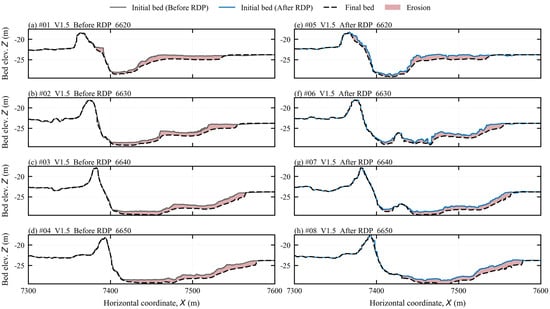
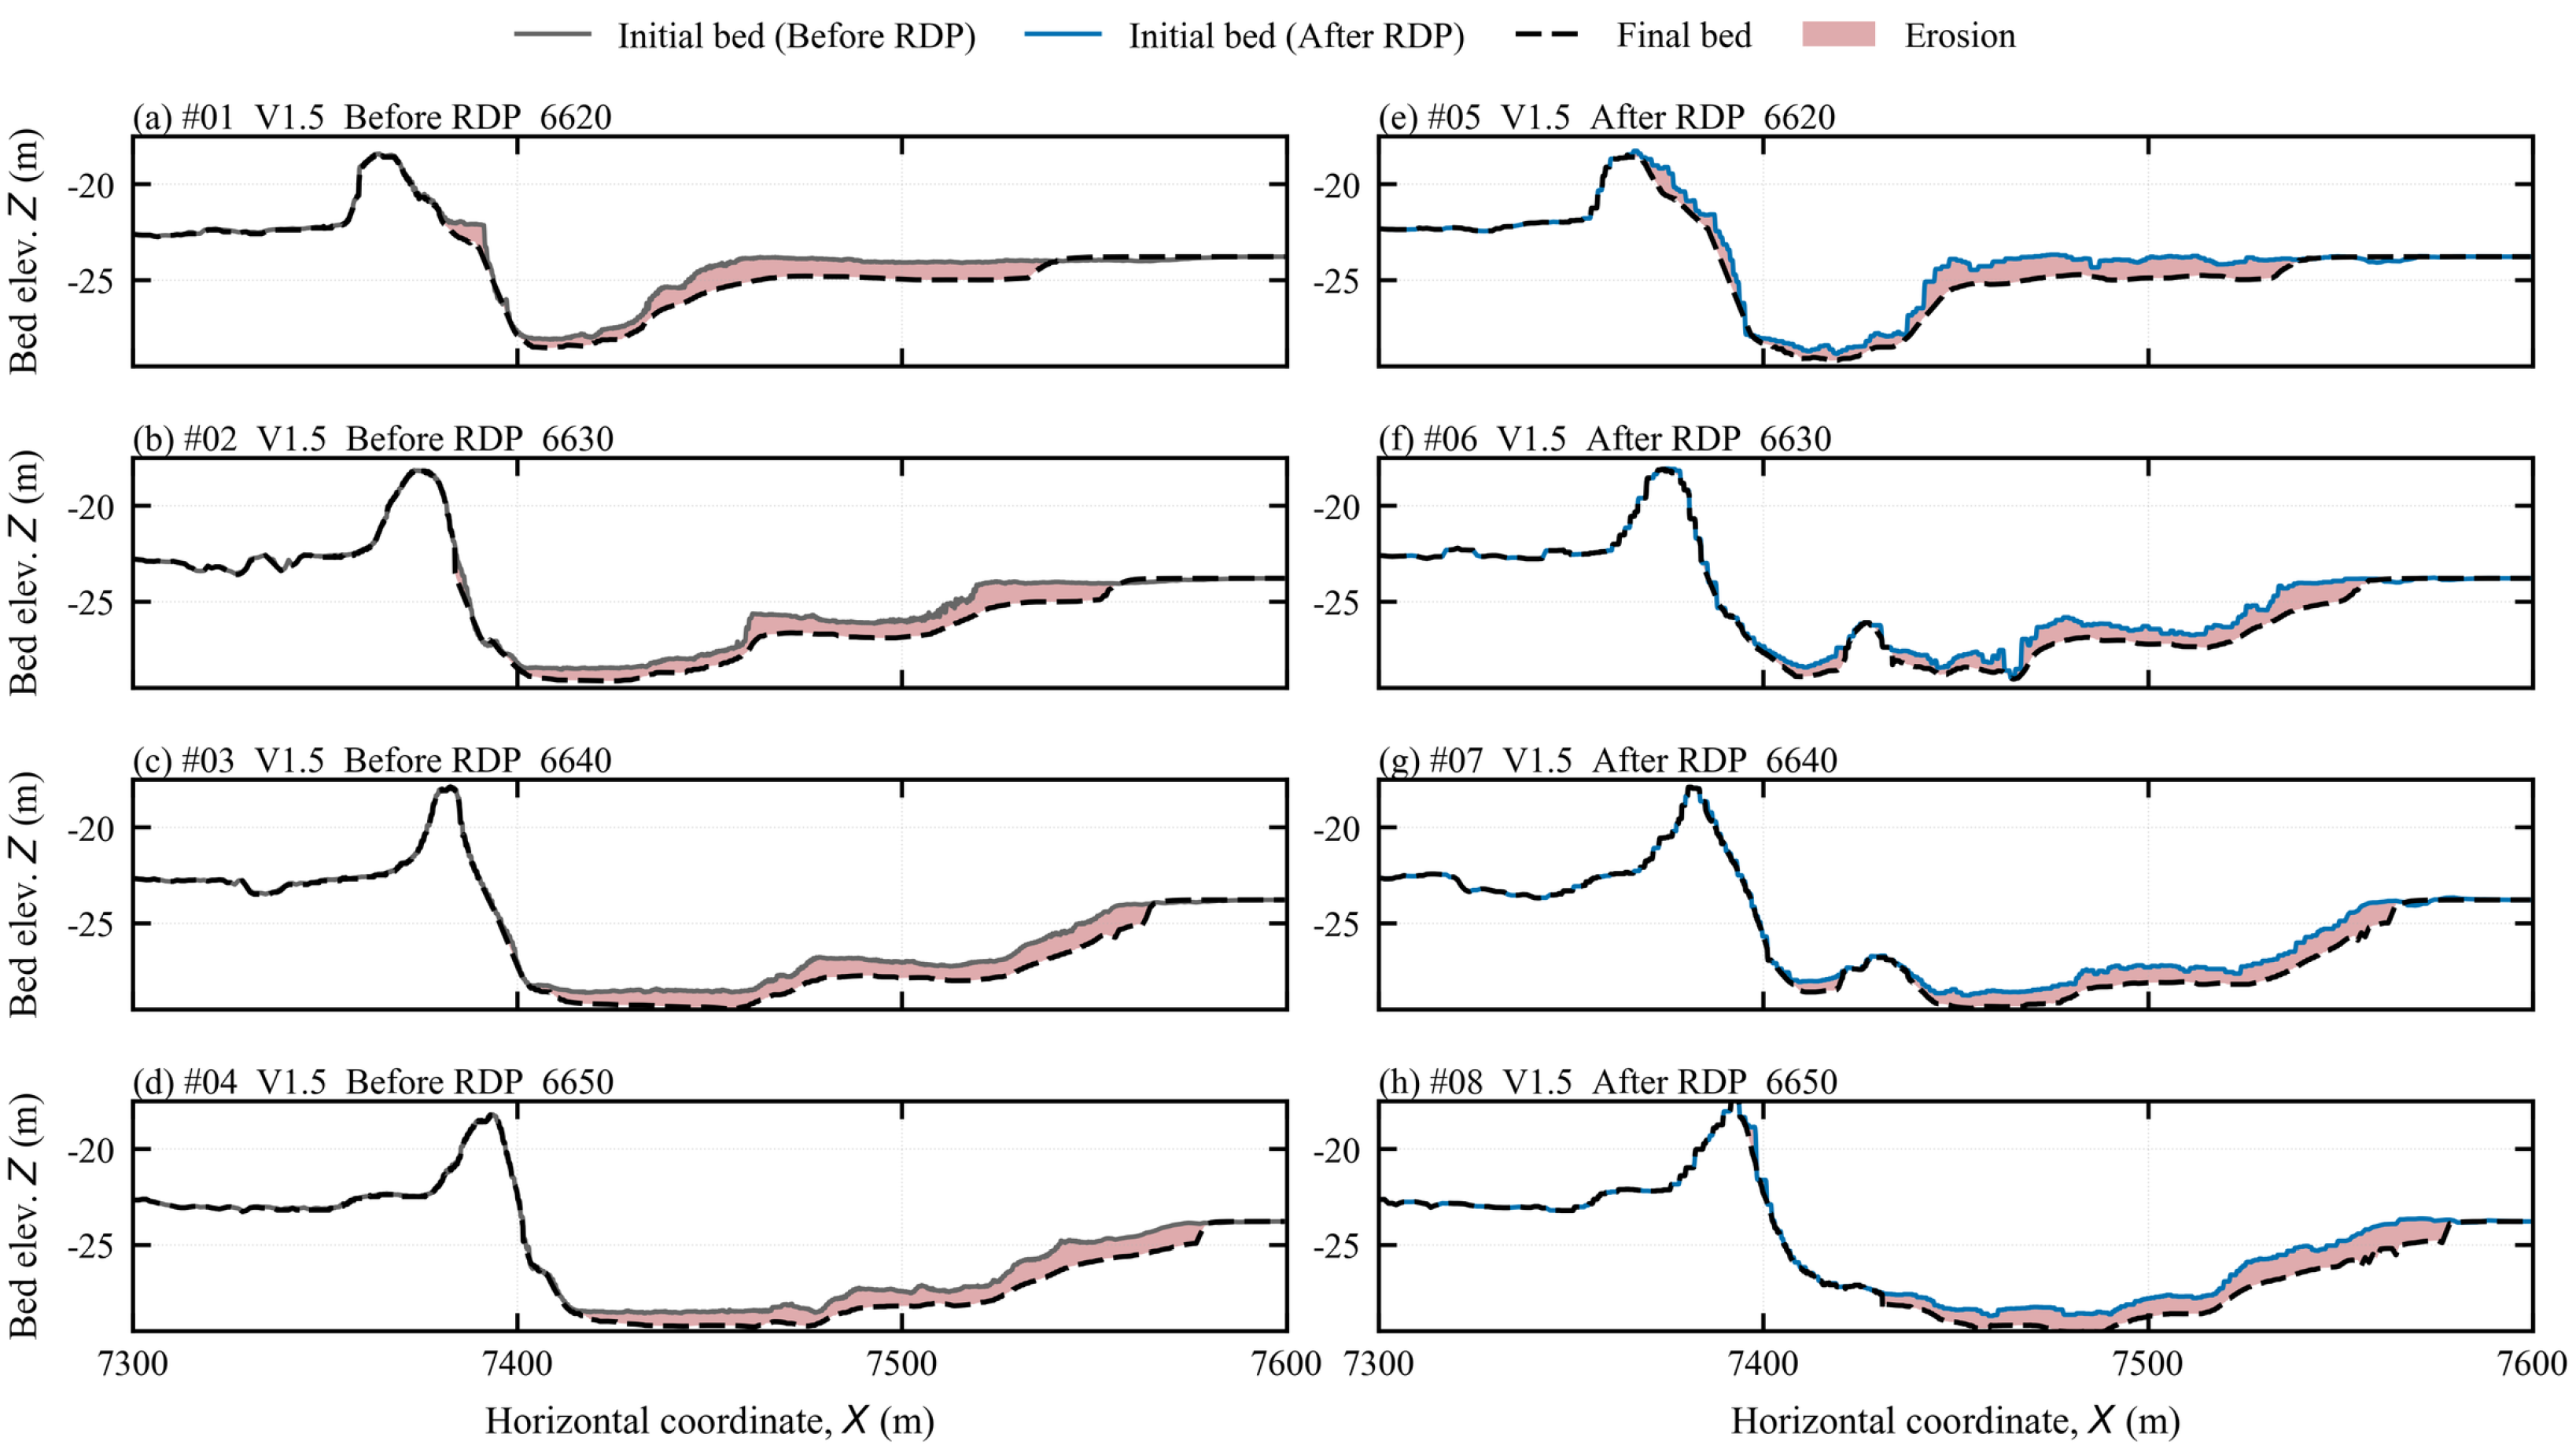
Figure 10 compares the initial and simulated bed profiles at 30,000 s for the conditions before and after RDP under an inflow velocity of 1.5 m/s.
Figure 10.
Initial and simulated bed profiles at 30,000 s for conditions before and after RDP at an inflow velocity of 1.5 m/s.
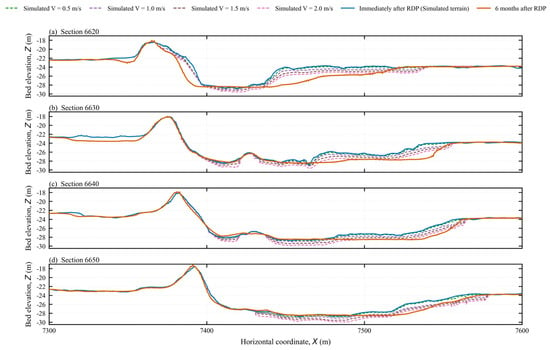
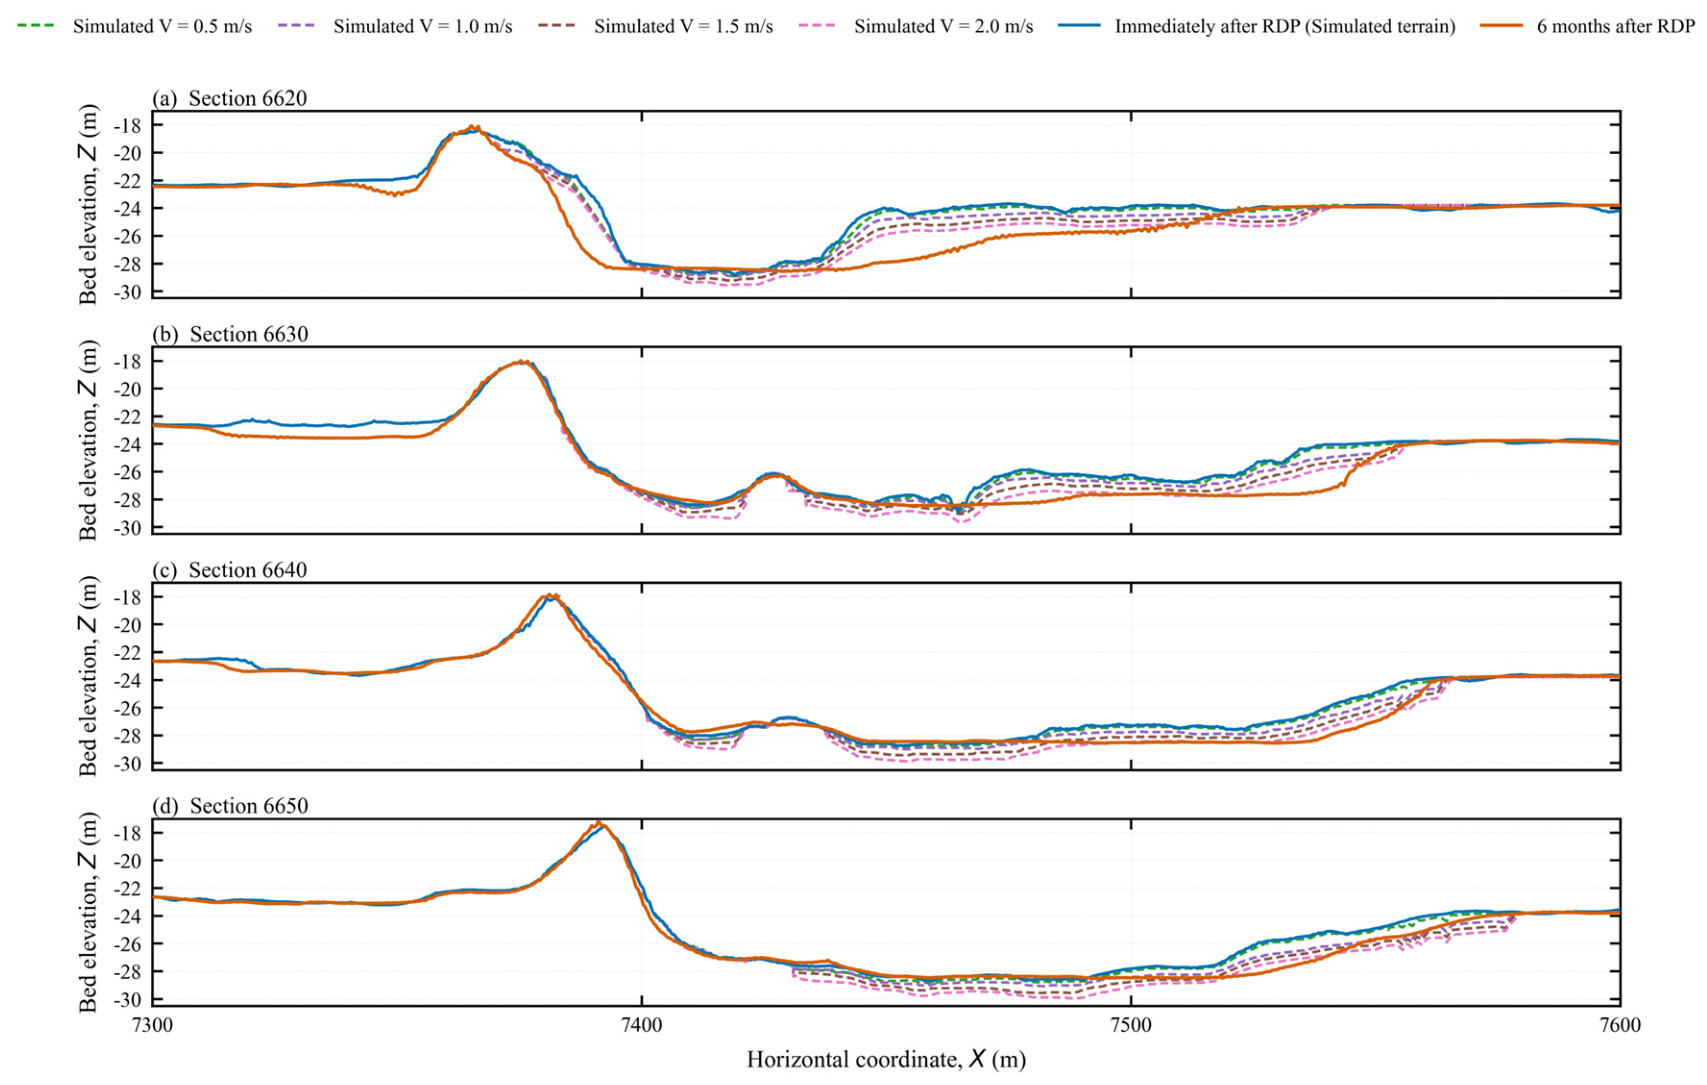
At the y = 6620 m cross-section, the downstream slope exhibited a stepped morphology before RDP, and continued erosion progressively smoothed the middle portion of the slope. After RDP, scour extended across a larger part of the downstream slope and developed toward the upstream side of the protected area. This change corresponded, to some extent, with field measurements. Because RDP at this cross-section was mainly concentrated near the crest of the downstream slope, coverage of the lower slope and its toe was insufficient; consequently, inadequately protected areas remained directly exposed to separated flow and recirculation.
At the y = 6630 and 6640 m cross-sections, rock placement backfilled and raised the original downstream slope toe, dividing the original scour depression into two depressions separated by the rock-dumping area. The simulations show erosion extending from the downstream slope toward the edge of the rock dump, a feature that was not clearly resolved in the measured profiles. This discrepancy may be related to the simplified representation of RDP geometry and sediment properties.
At the y = 6650 m cross-section, the RDP covered a wider area and provided more complete protection of the downstream slope toe, creating a smoother topographic transition between the protected area and the downstream seabed. The simulations show that the scour zone redistributed farther downstream rather than being concentrated immediately near the protected slope toe.
Figure 11 compares simulated bed profiles after 30,000 s of constant inflow at 0.5, 1.0, 1.5, and 2.0 m/s with measured profiles collected six months after RDP installation. The comparison shows broad agreement in the main erosion zones and downstream redistribution of scour. The simulations and field observations represent different forcing histories, so their agreement is interpreted in terms of morphological trends rather than scour rates. Differences may also reflect the use of a uniform silt grain size and the simplified treatment of coarser fractions, sorting, armoring, clay layers, and the RDP region.
Figure 11.
Simulated bed profiles at 30,000 s under four inflow velocities and measured profiles six months after RDP installation.
4.6. Influence of Flow Velocity on Scour Development
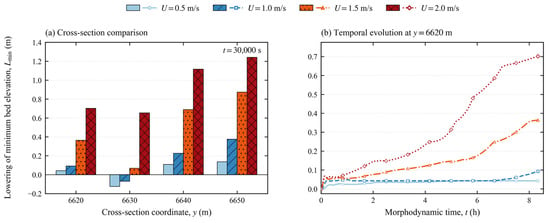
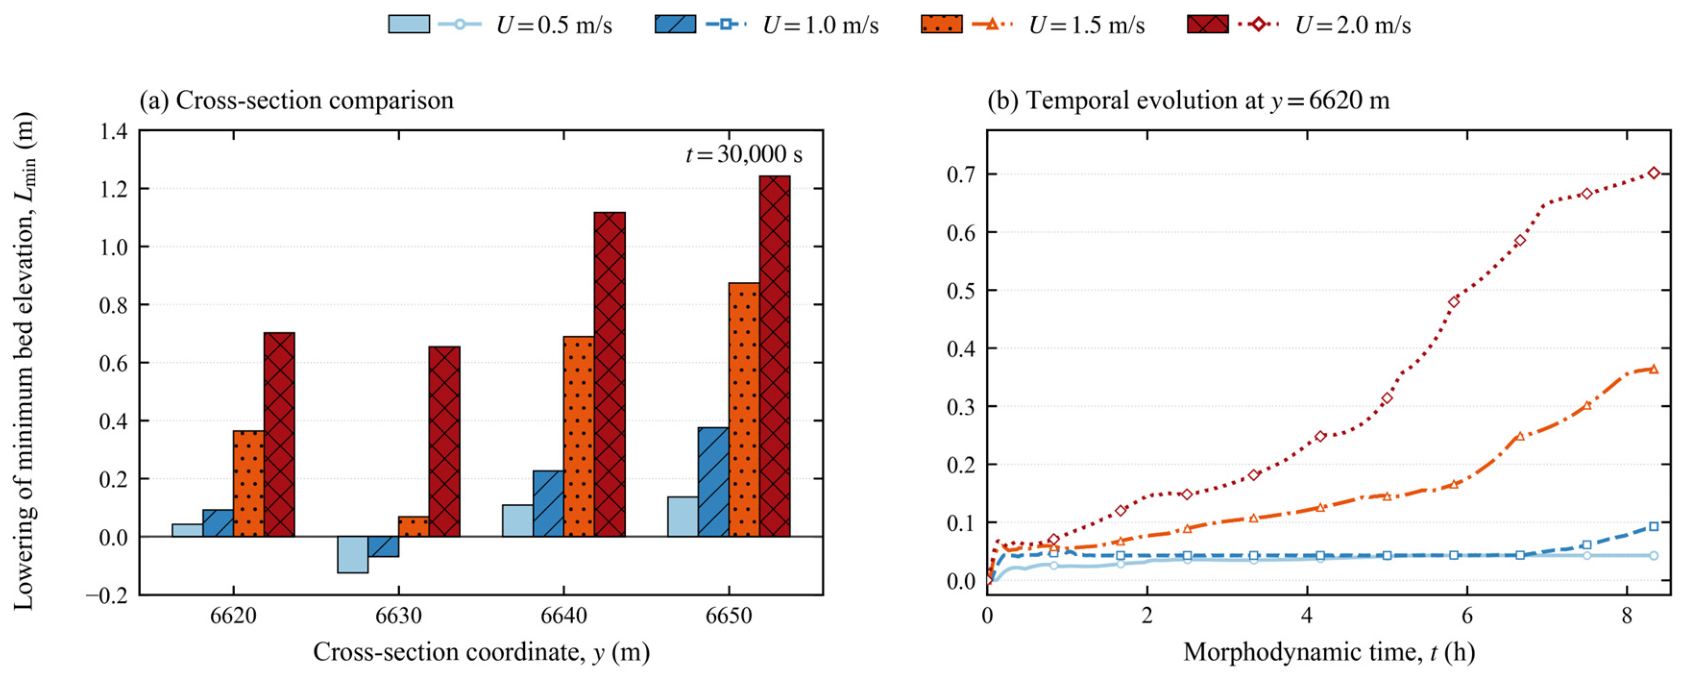
Figure 12 compares lowering of the minimum bed elevation at 30,000 s and its temporal evolution at y = 6620 m. At 0.5 m/s, the minimum bed elevation decreased by a range of approximately 0.04–0.14 m at y = 6620, 6640, and 6650 m, but rose by approximately 0.13 m at y = 6630 m. At 1.0 m/s, it decreased by a range of approximately 0.09–0.38 m at the former three sections and rose by approximately 0.07 m at y = 6630 m. At 1.5 and 2.0 m/s, lowering occurred at all four cross-sections, with values in the ranges of approximately 0.07–0.87 m and 0.65–1.24 m, respectively.
Figure 12.
Lowering of the minimum bed elevation under different inflow velocities: (a) comparison among four cross-sections at 30,000 s; (b) temporal evolution at y = 6620 m. Negative values indicate a rise in the minimum bed elevation relative to the initial condition.
At all four cross-sections, Lmin increased with inflow velocity over the tested range. The increments between successive velocity cases were unequal, indicating that the minimum-elevation response did not scale directly with velocity.
At y = 6620 m, Lmin reached approximately 0.04, 0.09, 0.36, and 0.70 m at 30,000 s (8.33 h) for inflow velocities of 0.5, 1.0, 1.5, and 2.0 m/s, respectively. The 0.5 m/s case changed little in the final stage, whereas further lowering remained evident late in the simulations at a range of 1.0–2.0 m/s.
The velocity comparison therefore indicates greater lowering of the minimum bed elevation under stronger inflow. Continued lowering late in the simulations also shows that the comparison depends on the duration of forcing. Assessments of bed evolution after local RDP should consider both velocity and duration, together with the spatial bed profiles.
5. Discussion
5.1. Hydrodynamic Mechanisms of Scour Under Local RDP Protection
The effect of RDP on scour evolution depends on its spatial relationship with the pre-existing scour pit. Sumer et al. [34] linked scour downstream of a pipeline to large coherent lee-wake vortices that are shed and advected downstream. Smith and Foster [35] simulated flow around a fixed cylinder over prescribed scoured-bed profiles and examined changes in mean flow and wake reattachment. These studies establish the relevance of wake dynamics and bed geometry, although their exposed-cylinder configurations differ from the configuration with a bed mound above a buried pipeline considered here. At the present site, RDP width and placement varied among cross-sections, producing different interactions between the modified topography and separated flow.
Figure 7, Figure 8 and Figure 9 show that the separated wake behind the bed mound above the pipeline connects with recirculation inside the scour pit. Downward flow in the downstream part of the pit turns upward near the bed. Upstream upward velocities reach approximately 0.20 m/s, and high-TKE regions broadly coincide with strong flow deflection and recirculation. The pre-existing pit therefore provides space for separated flow to develop and influences where near-bed flow changes direction. At y = 6630 and 6640 m, the rock-induced mounds deform the primary recirculation cell, with signs of local secondary recirculation cells and enhanced upward flow (Figure 8). Backfilling can thus reorganize recirculation paths within a section and shift the locations where flow acts on the protection edge and slope toe.
The pre-existing scour pit consequently forms part of the feedback between flow and bed evolution: its morphology influences the extent of recirculation and the locations of near-bed flow turning, while continued erosion modifies the interaction between the flow and bed. The effect of RDP therefore depends on how the placed rock integrates with the existing topography.
5.2. Roles of RDP Placement and Topographic Continuity
Comparisons among cross-sections indicate that protection width should be evaluated together with slope-toe coverage and topographic continuity. At y = 6620 m, the approximately 13 m-wide RDP area was concentrated near the original pipeline location, leaving the downstream slope toe inadequately covered and exposed to separated flow and recirculation. At y = 6630 and 6640 m, broader RDP covered the toe but also created local bed mounds that altered the original scour-pit morphology. The transition from the rock-dumping area to the erodible seabed may therefore remain an important location of flow–sediment interaction.
At y = 6650 m, the approximately 44 m-wide RDP area formed a gentler transition to the surrounding seabed, and the scour zone occurred farther downstream (Figure 10 and Figure 11). The association between broader toe coverage, a gentler transition, and downstream redistribution indicates that the assessment should include the bed outside the protected area. Both topographic continuity and the protection-edge location help explain the scour patterns in this case.
Related studies also emphasize the response of the surrounding bed. Sumer and Fredsøe [3] investigated wave-induced scour and stone-toe protection at a rubble-mound breakwater. Si et al. [16] examined hydrodynamics and oscillatory pore-water pressures around a pipeline with geotextile and stone-cover protection under combined waves and currents, while Chen et al. [17] considered seabed scour, liquefaction, and buried-pipeline stability in protection design. Petersen et al. [36] showed that primary-flow turbulence and three-dimensional secondary currents jointly contributed to scour at the stone–sand interface, with stone size and, to a lesser extent, berm side slope influencing the response. Separately, Roulund et al. [37] observed scour beside cable-protection rock berms and found a stronger response for higher berms in their tests; the measured scour had not reached equilibrium. These findings support evaluating protection together with the adjacent erodible bed and the local flow.
For pre-existing scour pits, RDP performance should therefore be assessed in relation to the pit geometry, downstream slope-toe coverage, the transition to the surrounding seabed, and local mounds created by rock placement. Rock volume and coverage width alone do not capture these spatial relationships.
5.3. Flow Disturbance and Downstream Migration of Scour
Field measurements indicate that the location of greatest erosion generally shifted downstream after RDP. The simulations show flow disturbance extending toward the downstream end of the pre-existing scour pit and interacting with the slope. Related evidence of erosion outside protected areas comes from different configurations. Petersen et al. [38] identified a near-bed three-dimensional wake-vortex pair downstream of a rock-protected monopile and compared laboratory edge-scour patterns with field observations. Whitehouse et al. [39] used repeated bathymetric surveys of a pipeline rock berm on soft clay in the shallow East China Sea under strong bidirectional tidal currents to document scour on both sides of the berm and expansion of its extent; they recommended a lower berm with protection extended to either side. These studies support considering the response of the surrounding bed, but do not directly validate the two-dimensional recirculation or downstream migration mechanism in the present case.
The simulated clockwise recirculation and associated vertical flow extended over a broad region of the scour pit. As the bed evolved, the locations of flow–bed interaction also shifted, providing a possible explanation for the redistribution of erosion. Where RDP backfilled the downstream slope toe, local protection and bed raising may have displaced stronger erosion toward the protection edge or farther downstream.
Therefore, downstream migration of a scour pit should not be interpreted simply as seabed recovery. Rather, it more likely reflects the spatial redistribution of erosion under the combined effects of RDP, pre-existing scour-pit morphology, and separated flow.
5.4. Flow-Velocity Dependence and Scour Evolution
Figure 12 shows that lowering of the minimum bed elevation increased with inflow velocity over the tested range. This response concerns the lowest bed level within each cross-section, whose location can change as erosion and deposition redistribute sediment. It should therefore be interpreted alongside the bed profiles in Figure 10 and Figure 11 when assessing the extent and location of erosion around RDP.
At y = 6620 m, the 0.5 m/s curve was nearly constant late in the simulation, whereas the 1.0–2.0 m/s range cases showed further lowering near 30,000 s. The continued lowering under stronger inflow indicates that the duration of strong currents is relevant to assessments of bed evolution after RDP.
5.5. Discrepancies Between Numerical Simulations and Field Seabed Morphology
The broad agreement between simulated and measured morphology in the principal erosion zones and downstream redistribution supports the proposed interpretation of scour after RDP. However, the 30,000 s constant-inflow simulations and six-month field observations represent different forcing histories. They are therefore compared in terms of morphological trends; the cumulative field erosion over six months is not a time-calibration target for these short-duration simulations.
The model uses independent two-dimensional sections, a single representative grain size, and macroscopic RDP geometry to examine interactions between streamwise topography and external flow. Sediment sorting, armoring, and cohesion may reduce sediment mobility in the field, while pore flow through the rock layer and cross-stream sediment transport may alter the erosion pattern. Bathymetric uncertainty also limits the interpretation of small elevation changes. Tidal reversals can modify recirculation and sediment redistribution, so upstream and downstream in this study are defined relative to the imposed inflow direction. These factors delimit the applicability of the sectional comparisons and identify priorities for future models with heterogeneous sediment, time-varying bidirectional tides, and three-dimensional flow.
5.6. Engineering Implications
Field observations and simulations indicate that local RDP around a pipeline with a pre-existing scour pit modifies both seabed morphology and the flow acting on the surrounding bed.
Protection of the downstream slope toe merits particular attention because incomplete coverage may leave it exposed to separated flow and recirculation. Mounds formed by rock placement can alter the primary recirculation cell and produce signs of local secondary recirculation cells. The transition between the protected area and surrounding bed also deserves consideration: in the present case, a gentler transition was associated with scour occurring farther downstream, whereas distinct local mounds produced stronger local flow disturbances.
RDP design for a pre-existing scour pit should consider placement, width, slope-toe coverage, topographic continuity, and tidal-current conditions together. Protection effectiveness should also account for erosion around the covered area. Because the higher-velocity simulations produced deeper and more persistent scour, the assessment should include strong-current conditions and their duration.
Post-construction monitoring should cover the full area influenced by the protection. At sites with strong currents, comparisons of protection layouts should consider both current magnitude and duration, and monitoring should track bed-elevation changes at the protection edges and downstream to identify any spatial redistribution of erosion.
6. Conclusions
Using field seabed survey data and REEF3D numerical simulations, this study investigated flow fields and seabed evolution in pre-existing scour pits around a subsea pipeline in the East China Sea under local RDP protection. The main conclusions are as follows:
1. The bed mound above the pipeline and the pre-existing scour-pit morphology substantially affect downstream flow. Flow separates behind the mound, forming a low-velocity wake and a predominantly clockwise recirculation cell within the pit. Downward flow near the downstream end turns upward close to the bed and subsequently develops downstream along the seabed.
2. RDP modifies near-bed flow through its effect on local topography. Its influence on the overall velocity distribution through the water column is limited, but the bed mounds formed at y = 6630 and 6640 m deform the primary clockwise recirculation cell and produce signs of local secondary recirculation cells.
3. RDP layout affects the location of subsequent erosion. At y = 6620 m, insufficient downstream slope-toe coverage leaves erosion concentrated in inadequately protected areas. At y = 6630 and 6640 m, toe backfilling changes the scour-pit morphology and creates local bed mounds. At y = 6650 m, broader protection and a gentler transition are associated with scour occurring farther downstream.
4. Higher inflow velocities produced greater lowering of the minimum bed elevation after RDP. At 30,000 s, the values ranged from −0.13 to 0.14 m at 0.5 m/s and from 0.65 to 1.24 m at 2.0 m/s. The minimum bed elevation rose at y = 6630 m under inflow velocities of 0.5 and 1.0 m/s, whereas further lowering remained evident late in the simulations at y = 6620 m in the 1.0–2.0 m/s range. These results indicate that assessments of bed evolution after RDP should consider both current velocity and forcing duration.
5. The simulations capture the main erosion zones and downstream redistribution seen in the field at a qualitative level. Differences in forcing history and simplified sediment and RDP representations limit direct comparisons of scour rates and long-term bed change. The model is therefore most useful for interpreting mechanisms and comparing relative responses among RDP layouts and inflow conditions.
This study combines repeated field bathymetry with sectional flow–sediment simulations under controlled inflow to link nonuniform local RDP, recirculation adjustment, and erosion redistribution around a buried pipeline with a pre-existing scour pit. Building on pipeline-wake studies [34,35], stone-cover and pile-protection studies [36,38], and rock-berm experiments and field observations [37,39], the analysis focuses on the position of the protection boundary relative to the original slope toe and the transition from backfilled mounds to the downstream slope. It provides a site-specific basis for comparing remedial RDP layouts and defining the extent of subsequent monitoring.
Author Contributions
Conceptualization, J.Z., X.L., and P.H.; methodology, J.Z.; software, J.Z.; validation, J.Z.; formal analysis, J.Z.; investigation, X.L.; resources, P.H.; data curation, J.Z.; writing—original draft preparation, J.Z.; writing—review and editing, X.L., P.H., and Z.C.; visualization, J.Z.; supervision, X.L. and P.H.; project administration, X.L. and P.H.; funding acquisition, P.H. All authors have read and agreed to the published version of the manuscript.
Funding
This research was funded by the General Program of the National Natural Science Foundation of China, grant number 52571309. The APC was funded by Panyang Huang.
Data Availability Statement
The raw data supporting the conclusions of this article will be made available by the authors on request.
Acknowledgments
We thank the EIT High-Performance Computing Platform for providing computational resources for this project.
Conflicts of Interest
The authors declare no conflicts of interest.
Abbreviations
The following abbreviations are used in this manuscript:
| BiCGStab | B iconjugate G radient Stabilized |
| CFD | Computational Fluid Dynamics |
| RDP | Rock-Dumping Protection |
| RANS | Reynolds-averaged Navier–Stokes |
| TKE | Turbulent Kinetic Energy |
| TVD-RK | Total Variation Diminishing Runge–Kutta |
| WENO | Weighted Essentially Non-Oscillatory |
References
- Sumer, B.M.; Whitehouse, R.J.S.; Tørum, A. Scour around coastal structures: A summary of recent research. Coast. Eng. 2001, 44, 153–190. [Google Scholar] [CrossRef] [Scilit]
- Zhao, M. A comprehensive review of the research on local scour below subsea pipelines under steady currents and waves. Ocean Eng. 2025, 318, 120114. [Google Scholar] [CrossRef] [Scilit]
- Sumer, B.M.; Fredsøe, J. Experimental study of 2D scour and its protection at a rubble-mound breakwater. Coast. Eng. 2000, 40, 59–87. [Google Scholar] [CrossRef] [Scilit]
- Duan, B.; Wang, D.; Qin, C.; Duan, L. Local Scour Around Marine Structures: A Comprehensive Review of Influencing Factors, Prediction Methods, and Future Directions. Buildings 2025, 15, 2125. [Google Scholar] [CrossRef] [Scilit]
- Zhao, M. A Review on Recent Development of Numerical Modelling of Local Scour around Hydraulic and Marine Structures. J. Mar. Sci. Eng. 2022, 10, 1139. [Google Scholar] [CrossRef] [Scilit]
- Ahmad, N.; Bihs, H.; Myrhaug, D.; Kamath, A.; Arntsen, Ø.A. Numerical modelling of pipeline scour under the combined action of waves and current with free-surface capturing. Coast. Eng. 2019, 148, 19–35. [Google Scholar] [CrossRef] [Scilit]
- Zhou, C.; Li, J.; Wang, J.; Tang, G. Numerical Study of Local Scour around a Submarine Pipeline with a Spoiler Using a Symmetry Boundary Condition. Symmetry 2021, 13, 1847. [Google Scholar] [CrossRef] [Scilit]
- Hu, K.; Bai, X.; Vaz, M.A. Numerical Simulation on the Local Scour Processing and Influencing Factors of Submarine Pipeline. J. Mar. Sci. Eng. 2023, 11, 234. [Google Scholar] [CrossRef] [Scilit]
- Subiyanto Tofany, N. Numerical Simulation of Pipeline Scour and Sedimentation around Submerged Pipelines with an Open-Source Multiphase-CFD Model. CFD Lett. 2024, 16, 150–165. [Google Scholar] [CrossRef] [Scilit]
- Zhang, F.; Zang, Z.; Zhao, M.; Zhang, J.; Xie, B.; Zou, X. Numerical Investigations on Scour and Flow around Two Crossing Pipelines on a Sandy Seabed. J. Mar. Sci. Eng. 2022, 10, 2019. [Google Scholar] [CrossRef] [Scilit]
- Li, Q.; Hao, Y.; Zhang, P.; Tan, H.; Tian, W.; Chen, L.; Yang, L. Numerical Study of the Local Scouring Process and Influencing Factors of Semi-Exposed Submarine Cables. J. Mar. Sci. Eng. 2023, 11, 1349. [Google Scholar] [CrossRef] [Scilit]
- Kamath, A.; Alagan Chella, M.; Bihs, H.; Arntsen, Ø.A. Evaluating wave forces on groups of three and nine cylinders using a 3D numerical wave tank. Eng. Appl. Comput. Fluid Mech. 2015, 9, 343–354. [Google Scholar] [CrossRef] [Scilit]
- Ahmad, N.; Bihs, H.; Kamath, A.; Arntsen, Ø.A. Three-dimensional CFD Modeling of Wave Scour Around Side-by-Side and Triangular Arrangement of Piles with REEF3D. Procedia Eng. 2015, 116, 683–690. [Google Scholar] [CrossRef] [Scilit]
- Ahmad, N.; Bihs, H.; Myrhaug, D.; Kamath, A.; Arntsen, Ø.A. Three-dimensional numerical modelling of wave-induced scour around piles in a side-by-side arrangement. Coast. Eng. 2018, 138, 132–151. [Google Scholar] [CrossRef] [Scilit]
- Yang, S.; Lai, X.; Huang, P.; Hu, T. Numerical simulation of local scour of submarine pipeline under reciprocating flow. Mar. Sci. Bull. 2022, 41, 342–348. [Google Scholar] [CrossRef]
- Si, W.; Wang, M.; Gao, Y.; Sun, K.; Chen, B.; Wang, R.; Cui, L.; Jeng, D.-S.; Zhao, H. Experimental Study of Submarine Pipeline with Geotextile and Stone Cover Protection Under the Superposition of Waves and Currents. J. Mar. Sci. Eng. 2024, 12, 2218. [Google Scholar] [CrossRef] [Scilit]
- Chen, E.; Yin, Z.; Zang, Z.; Li, Y.; Zhang, X.; Zhang, J. Stability Analysis and Protection Scheme of a Buried Subsea Pipeline with Soil Liquefaction and Seabed Scour. J. Pipeline Syst. Eng. Pract. 2025, 16, 04025033. [Google Scholar] [CrossRef] [Scilit]
- Zuo, M.; Zhou, X.; Tu, H.; Liang, Z.; Wei, Y.; Xia, K.; Zhu, H.; Han, H.; Su, J.; Qu, F. Hydrodynamic Study of a Fall Pipe Rock Dumping System. J. Mar. Sci. Eng. 2025, 13, 837. [Google Scholar] [CrossRef] [Scilit]
- Chorin, A.J. Numerical solution of the Navier-Stokes equations. Math. Comput. 1968, 22, 745–762. [Google Scholar] [CrossRef]
- Wilcox, D.C. Reassessment of the scale-determining equation for advanced turbulence models. AIAA J. 1988, 26, 1299–1310. [Google Scholar] [CrossRef] [Scilit] [PubMed]
- Van Rijn, L.C. Sediment transport, part I: Bed load transport. J. Hydraul. Eng. 1984, 110, 1431–1456. [Google Scholar] [CrossRef] [Scilit]
- Van Rijn, L.C. Sediment transport, part II: Suspended load transport. J. Hydraul. Eng. 1984, 110, 1613–1641. [Google Scholar] [CrossRef] [Scilit]
- Paola, C.; Voller, V.R. A generalized Exner equation for sediment mass balance. J. Geophys. Res. 2005, 110, F04014. [Google Scholar] [CrossRef] [Scilit]
- Osher, S.; Sethian, J.A. Fronts propagating with curvature-dependent speed: Algorithms based on Hamilton-Jacobi formulations. J. Comput. Phys. 1988, 79, 12–49. [Google Scholar] [CrossRef] [Scilit]
- Peng, D.; Merriman, B.; Osher, S.; Zhao, H.; Kang, M. A PDE-based fast local level set method. J. Comput. Phys. 1999, 155, 410–438. [Google Scholar] [CrossRef] [Scilit]
- Jiang, G.-S.; Shu, C.-W. Efficient implementation of weighted ENO schemes. J. Comput. Phys. 1996, 126, 202–228. [Google Scholar] [CrossRef] [Scilit]
- Jiang, G.-S.; Peng, D. Weighted ENO schemes for Hamilton–Jacobi equations. SIAM J. Sci. Comput. 2000, 21, 2126–2143. [Google Scholar] [CrossRef] [Scilit]
- Shu, C.-W.; Osher, S. Efficient implementation of essentially non-oscillatory shock-capturing schemes. J. Comput. Phys. 1988, 77, 439–471. [Google Scholar] [CrossRef] [Scilit]
- Van der Vorst, H.A. Bi-CGSTAB: A fast and smoothly converging variant of Bi-CG for the solution of nonsymmetric linear systems. SIAM J. Sci. Stat. Comput. 1992, 13, 631–644. [Google Scholar] [CrossRef] [Scilit]
- Ashby, S.F.; Falgout, R.D. A parallel multigrid preconditioned conjugate gradient algorithm for groundwater flow simulations. Nucl. Sci. Eng. 1996, 124, 145–159. [Google Scholar] [CrossRef] [Scilit]
- Mao, Y. The Interaction Between a Pipeline and an Erodible Bed; Series Paper No. 39; Institute of Hydrodynamics and Hydraulic Engineering, Technical University of Denmark: Lyngby, Denmark, 1987. [Google Scholar]
- Liang, D.; Cheng, L.; Li, F. Numerical modeling of flow and scour below a pipeline in currents. Coast. Eng. 2005, 52, 43–62. [Google Scholar] [CrossRef] [Scilit]
- Ahmad, N.; Kamath, A.; Bihs, H. 3D Numerical Modelling of Scour around a Jacket Structure with Dynamic Free Surface Capturing. Ocean Eng. 2020, 200, 107104. [Google Scholar] [CrossRef] [Scilit]
- Sumer, B.M.; Jensen, H.R.; Mao, Y.; Fredsøe, J. Effect of lee-wake on scour below pipelines in current. J. Waterw. Port Coast. Ocean Eng. 1988, 114, 599–614. [Google Scholar] [CrossRef] [Scilit]
- Smith, H.D.; Foster, D.L. Modeling of flow around a cylinder over a scoured bed. J. Waterw. Port Coast. Ocean. Eng. 2005, 131, 14–24. [Google Scholar] [CrossRef] [Scilit]
- Petersen, T.U.; Sumer, B.M.; Bøgelund, J.; Yazici, A.; Fredsøe, J.; Meyer, K.E. Flow and edge scour in current adjacent to stone covers. J. Waterw. Port Coast. Ocean Eng. 2015, 141, 04014044. [Google Scholar] [CrossRef] [Scilit]
- Roulund, A.; Larsen, S.M.; Sutherland, J.; Whitehouse, R.J.S. Scour at cable protection rock berms—Model test observations. In Scour and Erosion IX: Proceedings of the 9th International Conference on Scour and Erosion (ICSE 2018), Taipei, Taiwan, 5–8 November 2018; Yeh, K.-C., Ed.; CRC Press: London, UK, 2019; pp. 135–142. Available online: https://eprints.hrwallingford.com/id/eprint/1321/ (accessed on 21 October 2026).
- Petersen, T.U.; Sumer, B.M.; Fredsøe, J.; Raaijmakers, T.C.; Schouten, J.-J. Edge scour at scour protections around piles in the marine environment—Laboratory and field investigation. Coast. Eng. 2015, 106, 42–72. [Google Scholar] [CrossRef] [Scilit]
- Whitehouse, R.J.S.; Damgaard, J.S.; Parkes, J. Field observations of scour around a rock berm over a subsea pipeline on a clay seabed. In Proceedings of the 3rd International Conference on Scour and Erosion (ICSE-3), Amsterdam, The Netherlands, 1–3 November 2006; Verheij, H.J., Hoffmans, G.J., Eds.; CURNET: Gouda, The Netherlands, 2006; pp. 708–714. Available online: https://hdl.handle.net/20.500.11970/100086 (accessed on 21 October 2026).

Disclaimer/Publisher’s Note: The statements, opinions and data contained in all publications are solely those of the individual author(s) and contributor(s) and not of MDPI and/or the editor(s). MDPI and/or the editor(s) disclaim responsibility for any injury to people or property resulting from any ideas, methods, instructions or products referred to in the content. |
© 2026 by the authors. Licensee MDPI, Basel, Switzerland. This article is an open access article distributed under the terms and conditions of the Creative Commons Attribution (CC BY) license.