


Abstract
Twin-rotor floating offshore wind turbines (TwinFOWTs) exhibit significant potential for reducing the cost of floating wind technology, emerging as an advantageous alternative to conventional large-scale wind turbines. This study proposes a 10 MW floating TwinFOWT concept consisting of two inclined 5 MW wind turbines and the OO-Star prototype platform. To explore the effects of tower inclination on the dynamic behavior of the TwinFOWT and the fatigue damage at the tower base, the hydrodynamic responses of six TwinFOWT models with different tower inclination angles ranging from 35° to 45° are evaluated in SESAM under various environmental scenarios. The results indicate that larger tower inclination causes a slight reduction in the average power output for the below-rated wind conditions. The tower inclination angle significantly affects platform motions in operational states. The maximum relative differences in platform pitch and yaw among the six models are 32.73% and 58.58%, respectively. The uneven gravity distribution due to tower inclination results in notable local stress concentration, posing a potential risk for structural strength failure. Fatigue damage will decrease with increasing tower inclination angle. The accumulated fatigue damage of the 45° tower-inclination model is reduced by up to 28.84% compared to that of the 35° model. This study is expected to provide a reference for the design and improvement of the TwinFOWT concept with inclined towers.
1. Introduction
To address global issues of energy shortage and environmental degradation caused by excessive fossil fuel consumption, offshore wind energy has gained significant global attention because of its abundant resources and mature technology. In 2024, global offshore wind capacity additions reached 8 GW [1]. It is noted that the cost of energy from floating offshore wind turbines (FOWTs) is higher than that of fixed-bottom offshore wind turbines (OWTs) [2,3]. To tackle this challenge, enhancing the output power of wind turbines [4,5,6,7] has been recognized as a viable solution. However, this leads to an increase in rotor size, heightening the challenges of manufacturing and installation, as well as structural safety risks under extreme environmental conditions. In contrast, small- and medium-scale wind turbines may offer advantages in terms of compact size, lighter structural components, and easier manufacturing and installation. Therefore, arranging multiple small-capacity turbines on a single floating platform is a promising approach to addressing the above challenges and could serve as an alternative to a single FOWT of equivalent capacity [8].
Several studies have been conducted regarding the exploration of aerodynamic responses for the dual-rotor wind turbines (DRWT). Utilizing the actuator line method, Moghadassian et al. [9] analyzed the aerodynamic characteristics of an innovative DRWT model under neutral and weakly stable atmospheric conditions. The results indicated that the DRWT exhibited a 5% to 6% improvement in aerodynamic performance compared to a traditional single-rotor wind turbine (SRWT). Sundararaju et al. [10] explored the influence of different rotor spacings and operational conditions on power extraction capability and aerodynamic characteristics. The two rotors of a DRWT were modeled as independent actuator disks using linear momentum theory and computational fluid dynamics methods. The results indicated that optimal rotor spacing enhanced wind energy capture efficiency, whereas an excessively small rotor spacing could induce significant aerodynamic interference and reduce dynamic behaviors for wind turbines. Wu et al. [11] examined aerodynamic responses of the 5 MW–5 MW and 5 MW–750 kW DRWT models under surge and heave motions and found that platform heave and surge motions negatively influence the output power of the DRWT. Meanwhile, the structural analysis of DRWT has also been investigated. Wang et al. [12] investigated the power generation capacity and wake characteristics under the co-rotating and counter-rotating conditions. Three different DRWT configurations were developed by introducing an auxiliary rotor behind the main rotor, including 5 MW–5 MW, 5 MW–750 kW, and 750 kW–5 MW combinations. The results indicated that the addition of an auxiliary rotor significantly enhanced power generation but also increased aerodynamic thrust, necessitating a more robust support structure to maintain system stability. Saulescu et al. [13] found that in a tandem DRWT system, a higher transmission ratio results in better performance than that of SRWTs. However, power fluctuations become more pronounced at lower transmission ratios, imposing greater structural demands on the turbine components.
The above results indicate that a well-designed configuration of a DRWT system can enhance overall aerodynamic performance, albeit by a small margin of about 5% or more. However, unreasonable layouts can cause the coupling effects of the front rotor to negatively impact the aerodynamic performance of the rear rotor, resulting in inefficient operation. In addition, the tandem layout usually requires a complex mechanical transmission system to connect two rotors, which increases the complexity and maintenance difficulty of the system. The strong wake effects between the wind turbines can result in an enhanced blocking effect within the drivetrain, which may cause problems such as system vibration and resonance affecting the stability and lifetime of the wind turbine. On the contrary, the parallel layout positions the two wind turbines side by side, eliminating wake interaction and reducing mechanical complexity. This configuration decreases the probability of failure while simplifying the system, maintenance, and management.
Coupled modeling of parallel twin-rotor floating wind turbine (TwinFOWT) has attracted a lot of attention. Ismaiel et al. [14] developed an in-house aeroelastic tool combining blade element momentum theory and the virtual framework with a modal method. This tool created an aeroelastic interface between the tower, blades, and wind loads. The characteristics of a 2 × NREL 5 MW twin-rotor wind turbine were analyzed. It was also validated based on the comparison of its single-rotor results with FAST software outputs. Using MATLAB/Simulink, SIMPACK, third-party modules, as well as the user-defined force element, Xie et al. [15] proposed a time-domain analysis framework to investigate the hydrodynamic behavior of a four-rotor FOWT. It was found that the impact of an upper parked rotor is significantly larger than that of the lower one. In addition, the parked rotor could mitigate the tower-base fore-aft loads and fairlead tensions of the mooring lines. However, the fluctuation of the tower-base side-to-side loads can be observed to increase. By coupling the SeaFEM seakeeping dynamic solver with OpenFAST for analyzing a single wind turbine, Berdugo-Parada et al. [16] developed a fully coupled simulation tool to compute time-domain responses and output power for the multi-rotor systems. Meanwhile, a method was developed to numerically evaluate the dynamics of single- or multi-turbine offshore platforms. The rigid-body response amplitude operators (RAOs) were calculated and compared to the open-source software FAST and the hydrodynamic tool WAMIT for validation. Utilizing MATLAB, Elkodama et al. [17] investigated the yaw control mechanism and the active yaw method of a TwinFOWT. Various random signals of wind velocities and directions were inputted to each rotor to generate varying thrust, involving twisting moments on the main tower, and a yaw controller system was used to ensure that the turbine could consistently face the incoming wind to enhance power output capacity. Moreover, the overall performance of dual-turbine wind energy systems has also been investigated. Han et al. [18,19] analyzed the power production and coupling effect characteristics of a TwinFOWT by considering the influences of the three wind inflow directions and spacing ratios. It was found that the average output power of the twin-rotor system increased by up to 13% under surge motion compared with that of the single-rotor system. A lower spacing ratio enhanced the output power. Then the influences of yaw angle and surge motion on output power and thrust of the TwinFOWT were analyzed. The coupling effects with four different layouts were calculated and compared under complicated environmental loadings. According to the potential flow theory and free vortex wake method, Chen et al. [20] presented an aero-hydro coupling analysis method for a large floating TwinFOWT. The results show that the TwinFOWT design improves wake recovery and exhibits optimized properties with a rotor spacing ratio of 1.2 for the IEA 15 MW wind turbine. Beshbichi et al. [21] analyzed the influence of blade-pitch system faults and emergency shutdown on the dynamic behavior with TwinFOWT’s loads. The TwinFOWT concept combined two NREL 5 MW rotors with a tower installed on the OO-Star platform. It showed that the blade pitch fault induces sharp fluctuations in aerodynamic load, leading to an increase in platform loads. However, it is noted that the long arm supporting each rotor suffers severe gravitational loads, which leads to significant difficulty in ensuring the structural safety of the support system. In addition, fatigue damage of the tower enhanced by the two rotors has not been assessed yet.
The conventional vertical-tower twin-rotor systems (e.g., the Hexicon concept) typically require a massive platform to ensure sufficient clearance between the two rotors. To prevent mechanical collision and aerodynamic interference, the span of the platform must often exceed the rotor diameter. The single-rotor inclined-tower systems (e.g., the X1 Wind PivotBuoy) often necessitate a complete redesign of the wind turbine components. Because the inclined tower alters the fundamental coupling between the turbine and the platform, the towers and the bracing structure cannot be directly applied without mitigating the resulting aerodynamic interference and unbalanced loads.
Therefore, this paper proposes a V-configuration TwinFOWT model that draws inspiration from the Mingyang and Nezzy concepts. The TwinFOWT allows for a much more compact platform footprint. It utilizes a V-configuration tower arrangement to integrate two standard 5 MW horizontal-axis wind turbines onto a single platform without requiring a bespoke redesign of the blades, the internal control systems and the bracing structure.
It can be found that most of the studies reviewed above predominantly concentrated on the aerodynamic performance and wake characteristics of TwinFOWT concepts. The aero-hydro-servo-elastic coupled effects of TwinFOWT models with inclined towers were commonly ignored. In particular, varying the tower inclination angle directly alters the hub heights of the twin rotors, and changes the global mass distribution and lowers the center of gravity of the entire floating system, which directly affects the platform motion responses. Meanwhile, the eccentric gravitational loads induced by inclined towers generate uneven load distributions and localized stress concentrations at the tower-base and transition piece regions. In addition, the variation of hub height caused by different tower inclination angles modifies the inflow wind conditions and wind shear effects, thereby influencing the aerodynamic loading characteristics and fatigue evolution of the system. Compared with previous studies, this study fully considers the flexibility effects of the blades and tower, as well as the influence of the controller, to investigate the relationship between the dynamic responses of the TwinFOWT and tower-base fatigue.
The structure of this research is shown below: Section 2 details the TwinFOWT concepts with various layouts. Section 3 outlines the fully coupled analysis framework and corresponding fatigue analysis theory. Section 4 presents environmental conditions for integrated simulation analysis. Section 5 discusses the results obtained in this study, focusing on the dynamic response of the TwinFOWT. Last but not least, the significant results are listed in Section 6.
2. Description of TwinFOWT Concepts
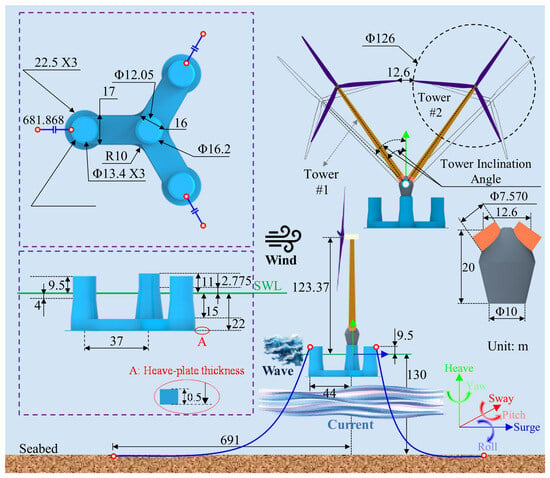
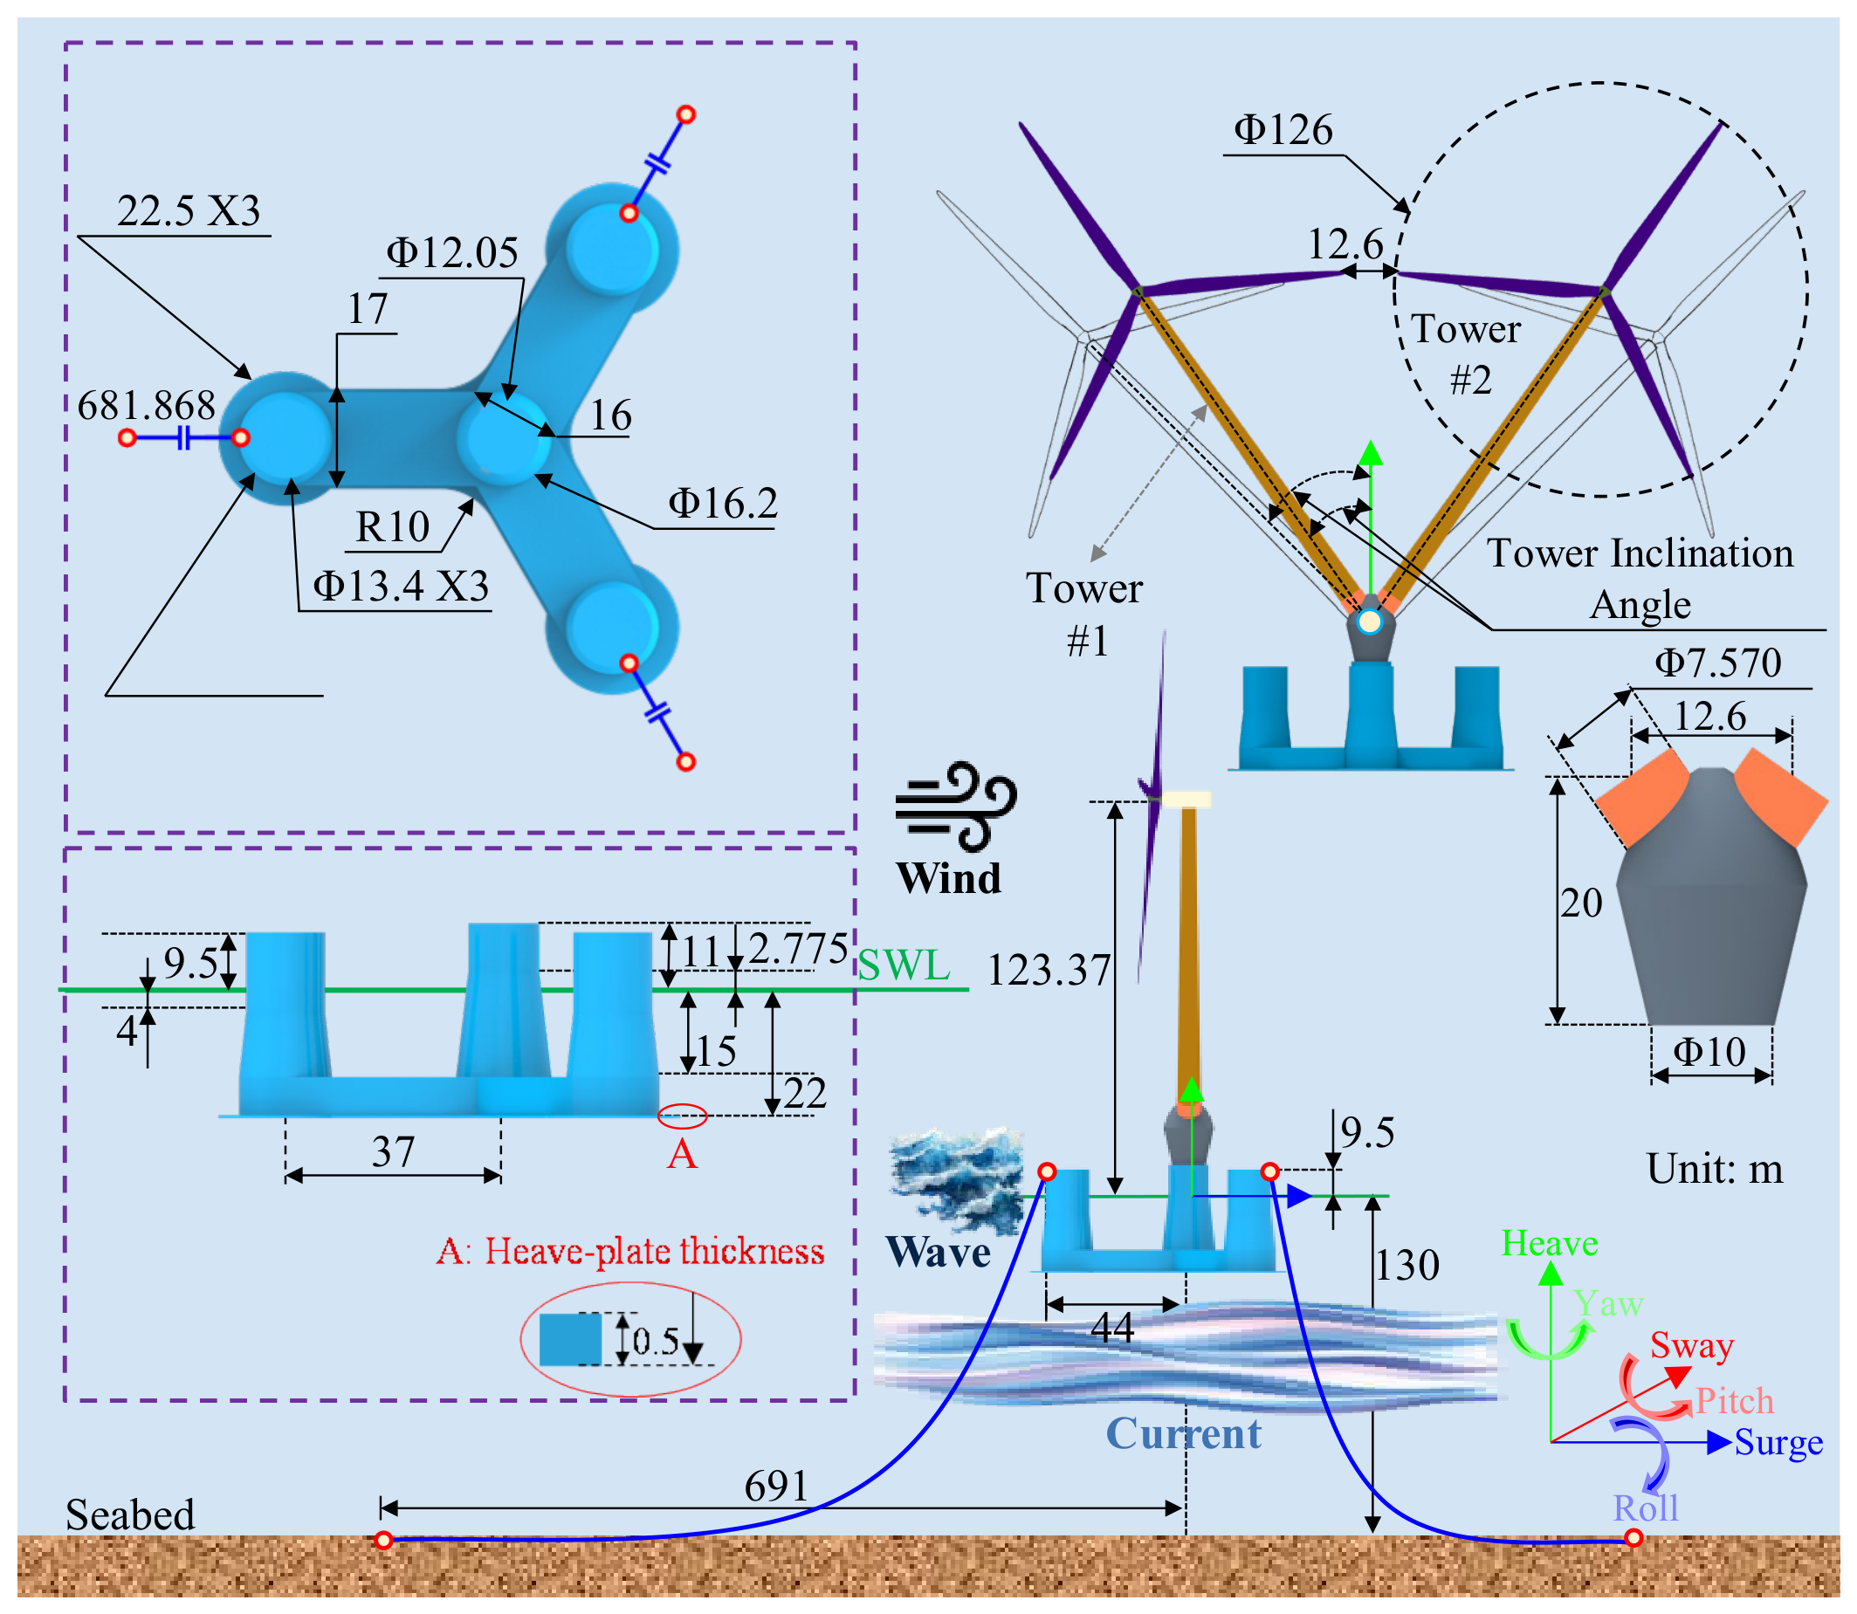
This paper proposes a TwinFOWT model that consists of the OO-Star platform and two NREL 5 MW wind turbines arranged in a V-configuration. A transition piece (TP) is installed on the OO-Star platform to support the two wind turbines. To avoid significant aerodynamic interaction caused by insufficient blade-tip spacing between the two rotors, the minimum blade-tip spacing is set to 10% of the rotor diameter. Figure 1 gives a schematic diagram of the proposed TwinFOWT concept with 35° tower inclination, in which the rotor spacing is 10% of the rotor diameter. As seen from Figure 1, the origin of the global reference coordinate system is defined at the cross point of the platform central line and the seawater level. Zero degrees of the wave, current and wind loadings are propagating in the positive x-direction.
Figure 1.
Configuration of the TwinFOWT model with tower inclination angle of 35°.
To explore the effects of different tower inclination angles on the overall dynamic behavior of the TwinFOWT, six models are designed with the same tower length and inclination angles varying from 35° to 45°. These models are named TI 35° to TI 45°.
2.1. NREL 5 MW Wind Turbine Model
The wind turbine adopted in the research was developed by the National Renewable Energy Laboratory (NREL) [22] of the United States to improve offshore wind technologies. To maintain a minimum blade-tip spacing of 10% of the rotor diameter, the tower is extended while keeping the top diameter and wall thickness unchanged. In addition, the original 5 MW tower design has certain limitations; using this tower for inclined installation and fatigue analysis may lead to unreliable results. Therefore, the tower base diameter is modified to 7.2 m, and the wall thickness is adjusted to 0.06 m in this paper. The parameters, center of mass (CM), and natural frequencies of both the modified and original towers are shown in Table 1.
Table 1.
Main design properties of the NREL 5 MW wind turbine.
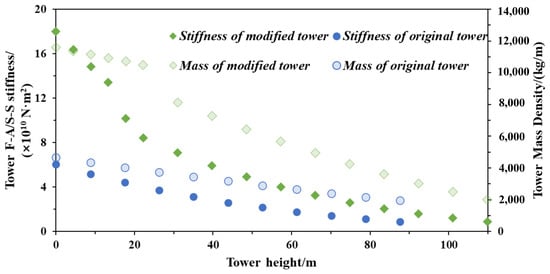
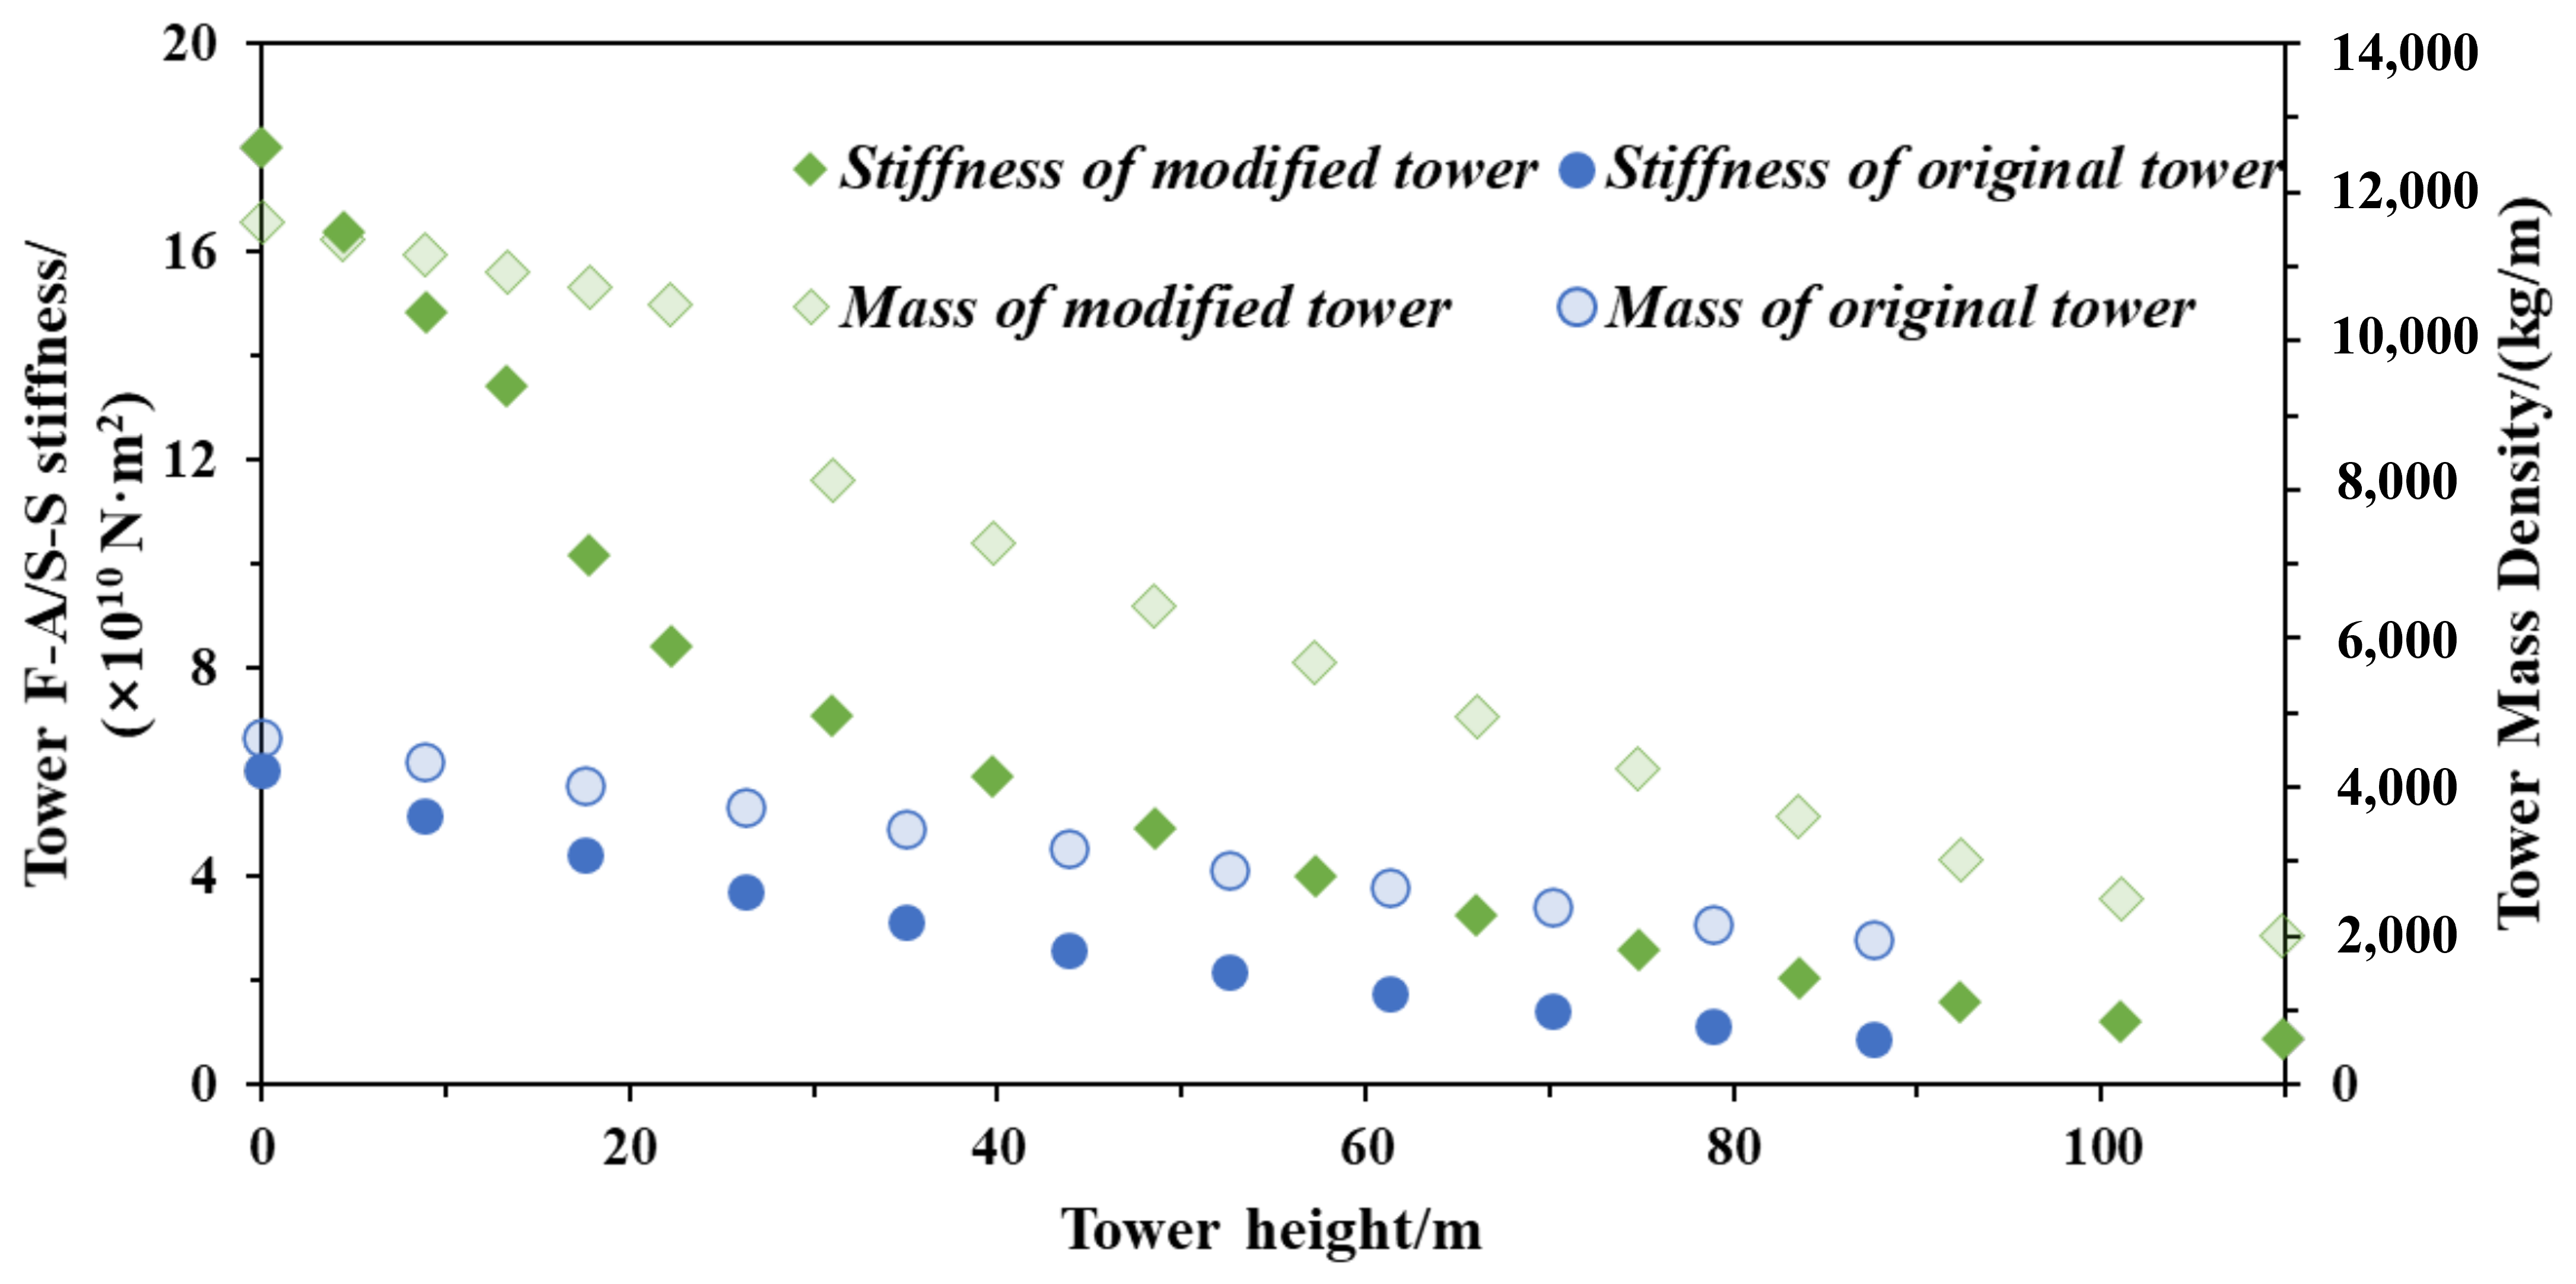
Six different inclination angle configurations were investigated using the same tower model in this study. To ensure the structural strength and reliability of the tower, a modified tower was designed based on the original 5 MW tower. To reduce the design complexity, the diameter and thickness of the tower sections used in this study were assumed to vary linearly from the tower base to the top. The resulting mass and stiffness distributions at different sections of the tower are presented in Figure 2.
Figure 2.
Design parameters of the modified tower.
2.2. Platform and Mooring System
The OO-Star platform designed for 10 MW wind turbines is selected in this study to support the two 5 MW wind turbines. The platform is constructed of post-tensioned concrete and designed for a water depth of 130 m, with a lower star-shaped pontoon. The platform consists of a central column and three offset columns, each with a cylindrical upper part and a conical lower part. The transition piece is rigidly connected to the top of the OO-Star platform at a height of 11 m, with a diameter of 10 m. It then branches into a V-shape to connect with the two inclined towers at a height of 31 m, where the connection section has a diameter of 7.57 m. The total mass of the transition piece is 100 t.
The TwinFOWT model employs a mooring system comprising three catenary lines for station-keeping. The total upper-structure mass of the TwinFOWT is 1741.72 t. In comparison, the upper-structure mass of the original single DTU 10 MW wind turbine is 1932.40 t. Since the total weight of the TwinFOWT is actually lower than that of the original single-turbine counterpart, mass compensation was required to maintain the designed draft and system stability. Instead of utilizing conventional concentrated clump weights, which induce severe stress concentrations at the connection points, we uniformly distributed the required ballast mass along the mooring lines by increasing their mass per unit length. In the initial baseline design, the floating platform exhibited relatively large surge motions. To suppress this dynamic response and adjust the system’s weight, mass reinforcement for the mooring system was performed. It is worth noting that, to reduce interference factors in the result analysis and obtain more meaningful results, the same ballast and mooring system configurations were adopted for all TwinFOWT cases with different inclination angles. The specific parameters for the platform and mooring system are detailed in Table 2.
Table 2.
Main parameters of the OOStar platform and the mooring system.
3. Fully Coupled Modeling of the TwinFOWT Concept
3.1. Aero-Hydro-Servo-Elastic Modeling
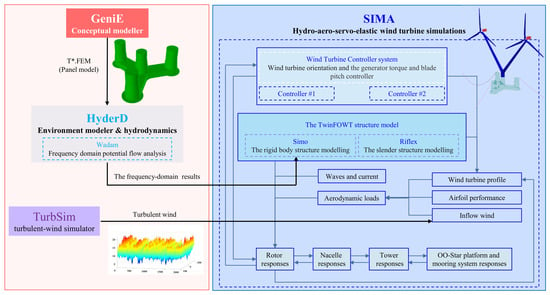
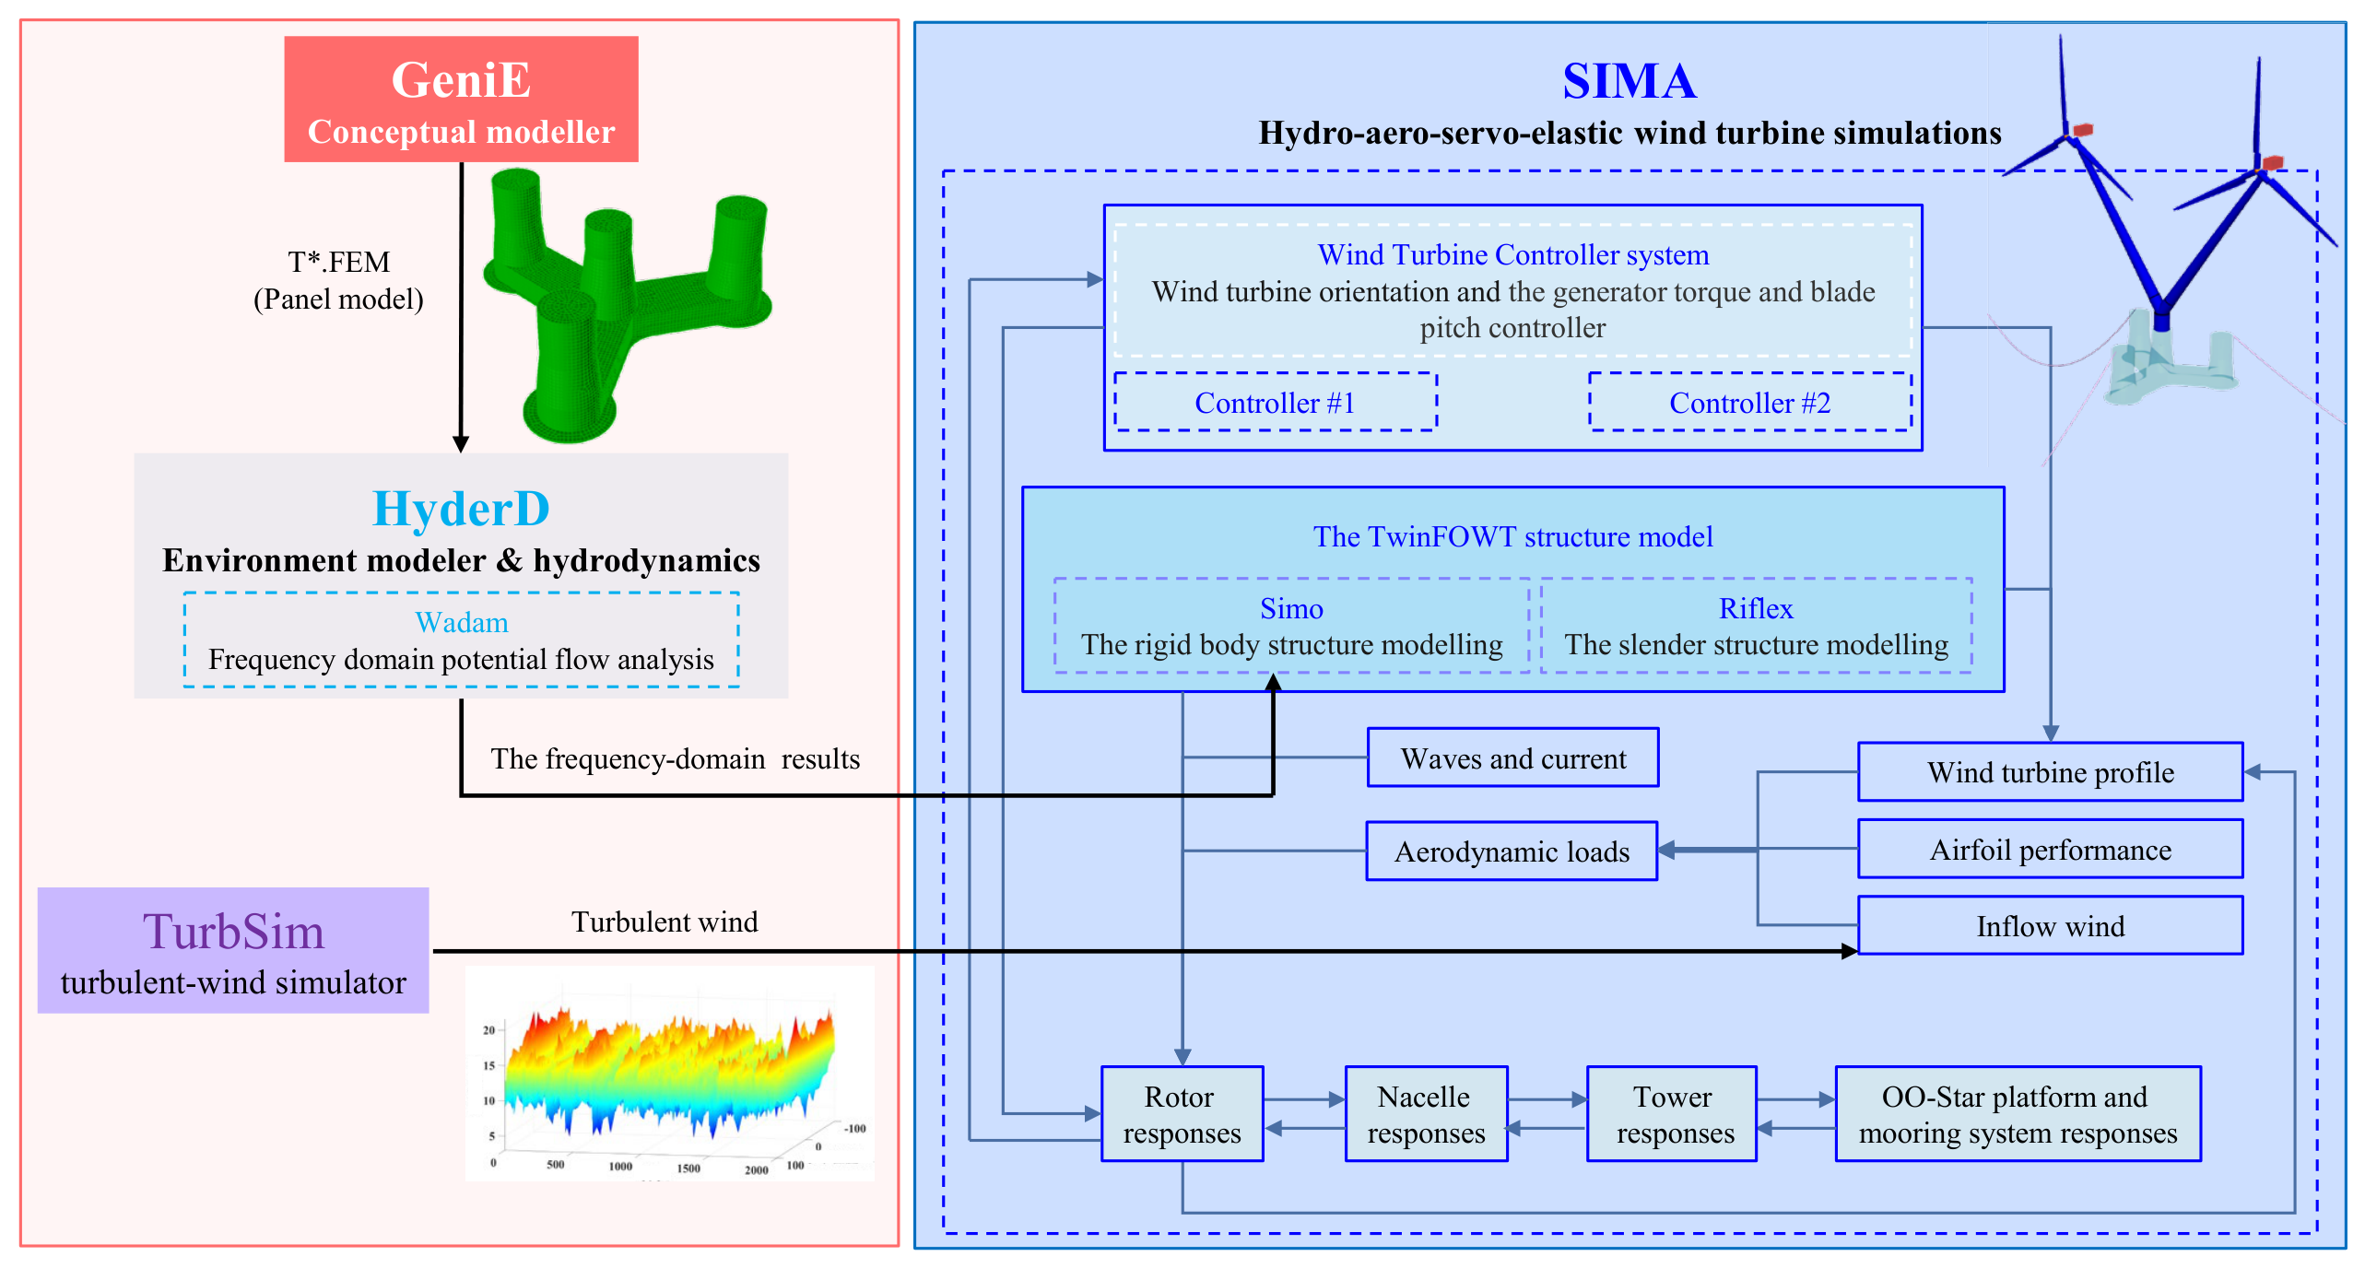
Unlike conventional FOWTs, which use a single rotor to generate electricity, the TwinFOWT consists of two individual wind turbines. To evaluate the fully coupled dynamic responses of the TwinFOWT, this study employs SESAM [23,24] to analyze its aero-hydro-servo-elastic dynamic behavior. Figure 3 presents the fully coupled modeling strategy of the TwinFOWT in SESAM.
Figure 3.
The fully coupled modeling framework of the TwinFOWT in SESAM.
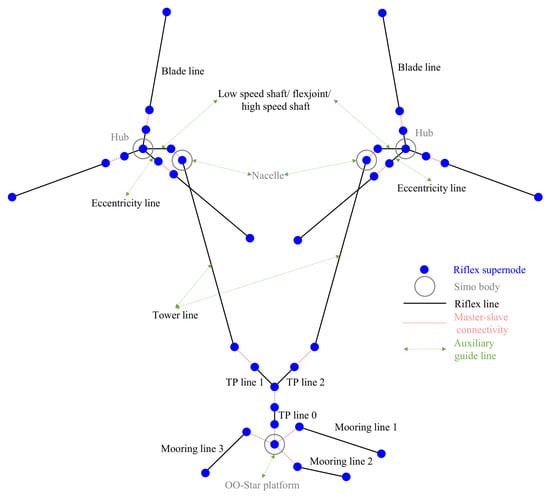
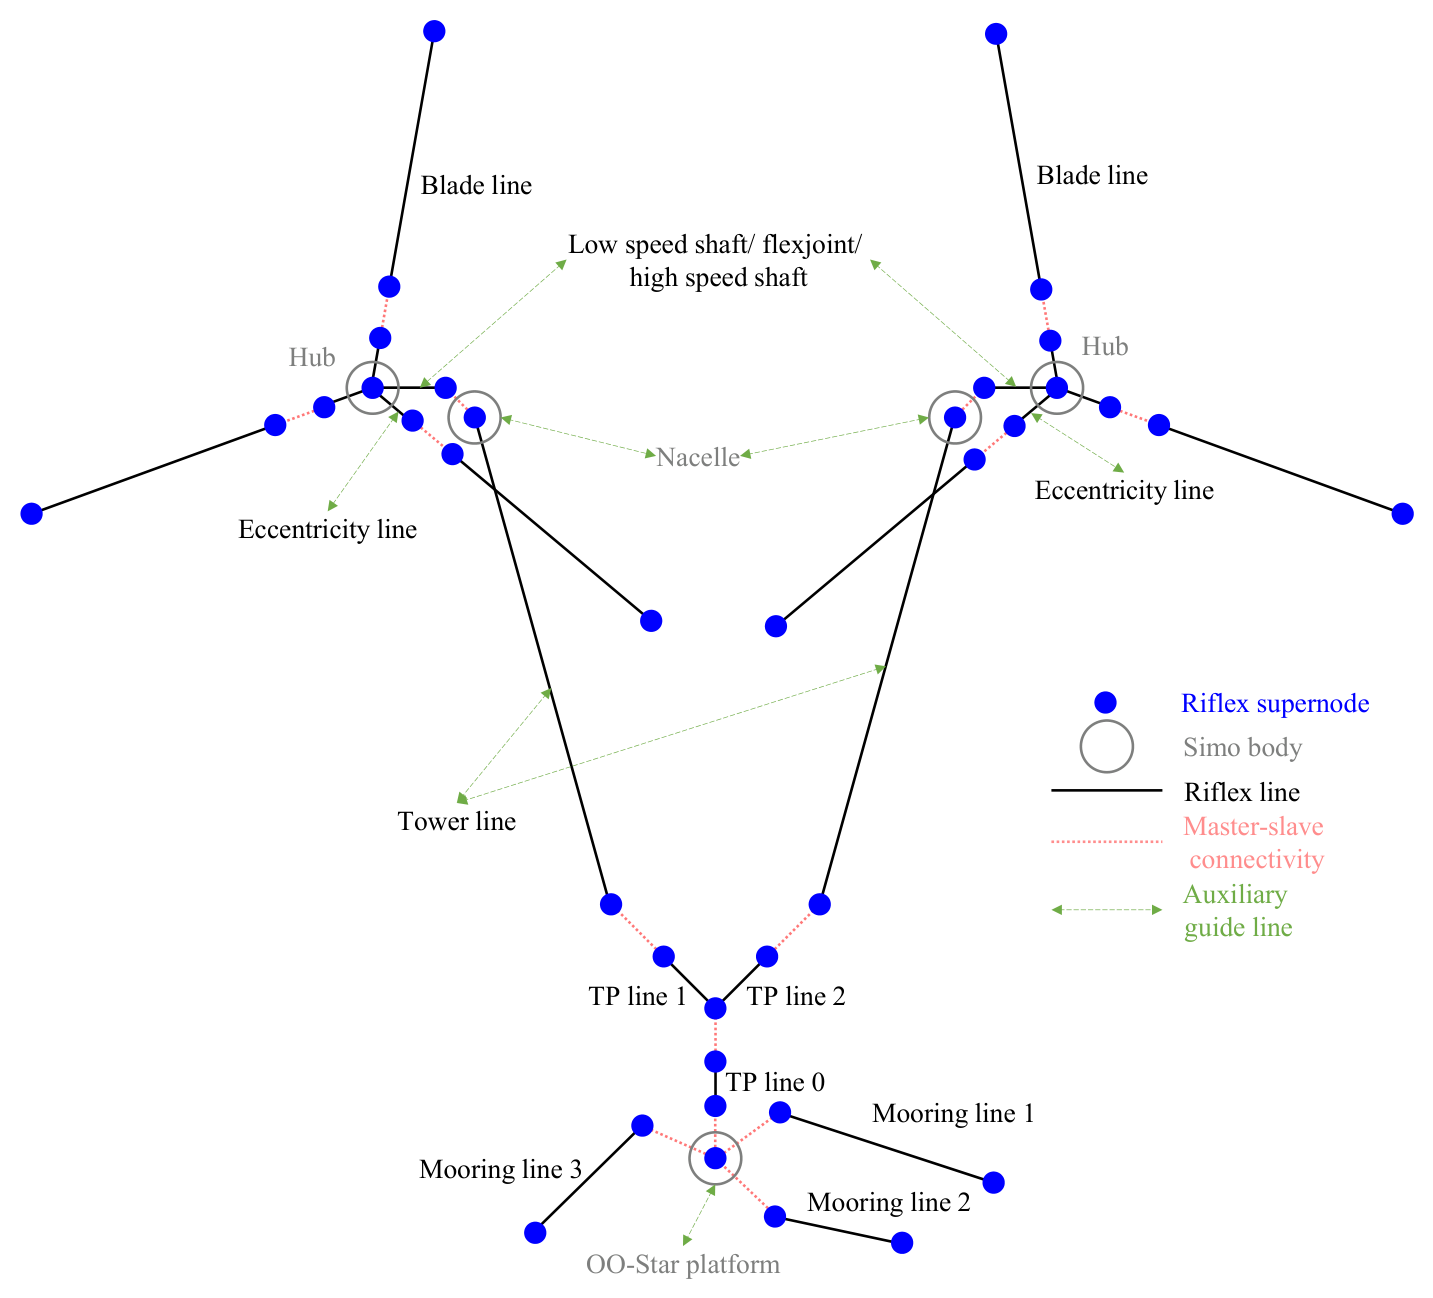
The TwinFOWT concept is modeled as flexible lines and rigid bodies in Riflex. The description of the TwinFOWT model is presented in Figure 4. Specifically, the OO-Star platform, nacelle and hub are modeled as rigid bodies. The other components, including the blade, shaft, tower, mooring lines, and transition piece, are designed as flexible bodies. A master-slave connectivity is used to link rigid bodies using supernodes. This configuration enables a fixed connection between the transition piece, the OO-Star platform, and the two wind turbines. The transition piece is divided into three parts, TP line 0, TP line 1 and TP line 2, which are all simulated using Riflex lines. The lower supernodes of TP line 1 and TP line 2 are rigidly connected to the upper supernodes of TP line 0 by master-slave connectivity, thereby establishing a rigid internal connection within the transition structure. The shaft is modeled with a two-segment line, with one segment representing the low-speed shaft and the other representing the high-speed shaft. A nodal “Flex Joint” component is included between the segments, which models the generator torque. A shared supernode at the hub connects the blades and the shaft. Each blade consists of two lines: the inner line represents eccentricity, and the outer line denotes the actual blade airfoil. The eccentricity lines are connected to the shaft and model imperfections in the blades. The master-slave connections in the blades are rigid-body connections between supernodes. The rigid supernode connection is subsequently used for blade pitch control.
Figure 4.
The TwinFOWT model.
The panel model of the platform is established using GeniE to carry out the frequency-domain analysis in HydroD for obtaining the hydrodynamic coefficients based on the boundary element method. SIMA [25] performs fully coupled time-domain analysis with aero-hydro-servo-elastic simulation. It integrates two core simulation tools: Riflex and Simo, which are both used in this study. Specifically, Riflex is a nonlinear finite element solver designed for slender floating structures, while Simo is a simulator for marine operations.
3.2. Validation of the Numerical Model
3.2.1. Hydrodynamic Modeling
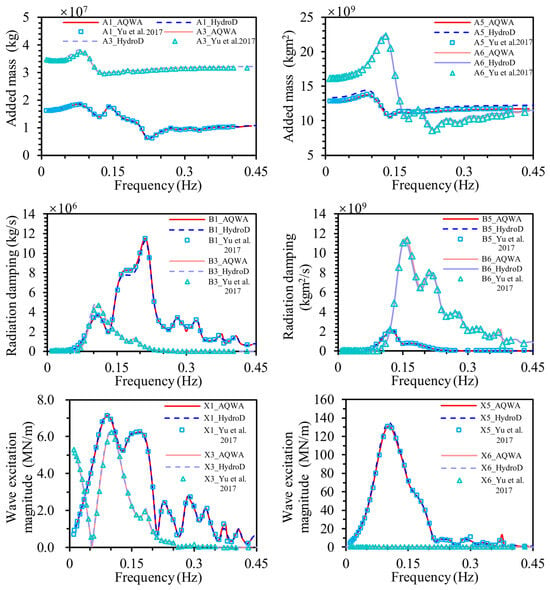
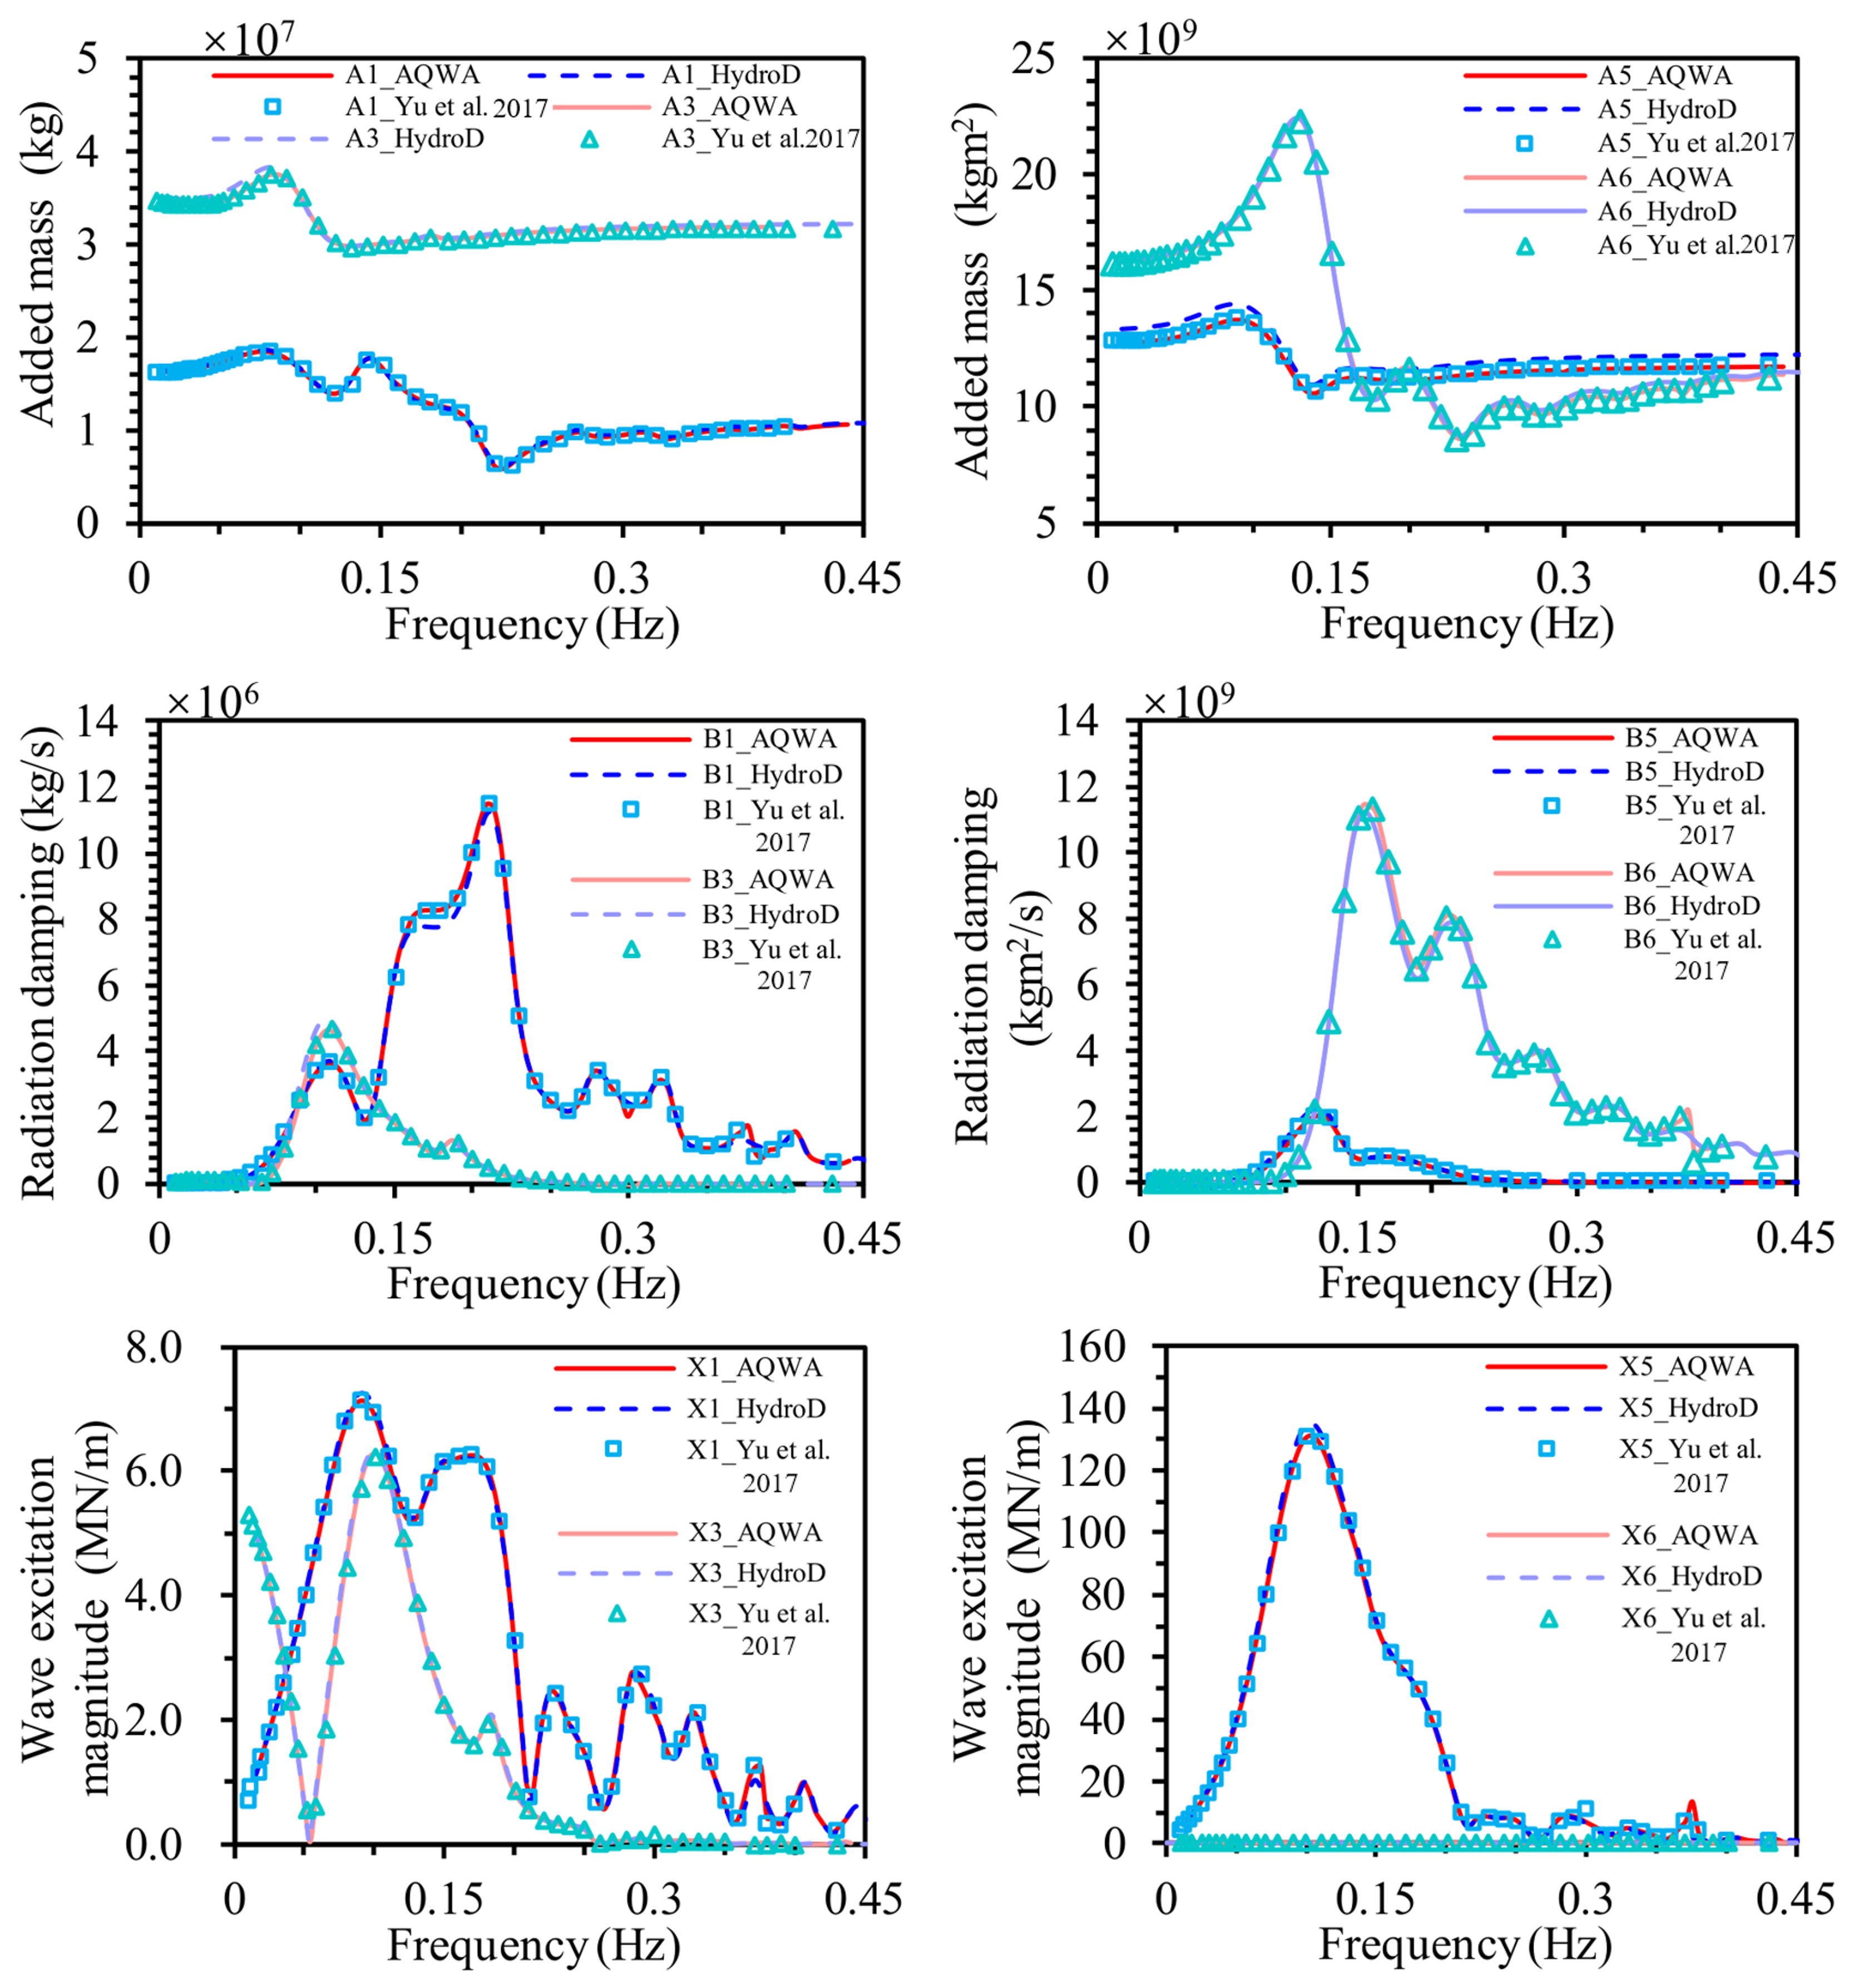
Figure 5 presents a comparison between the hydrodynamic coefficients obtained from HydroD in this study, those calculated using AQWA, and the corresponding results reported by Yu et al. [26]. The added mass, the radiation damping, and the wave excitation force are nearly identical, which validates the hydrodynamic model of the platform.
Figure 5.
The OO-Star semi-submersible platform hydrodynamic added mass [26].
3.2.2. Free-Decay Analysis
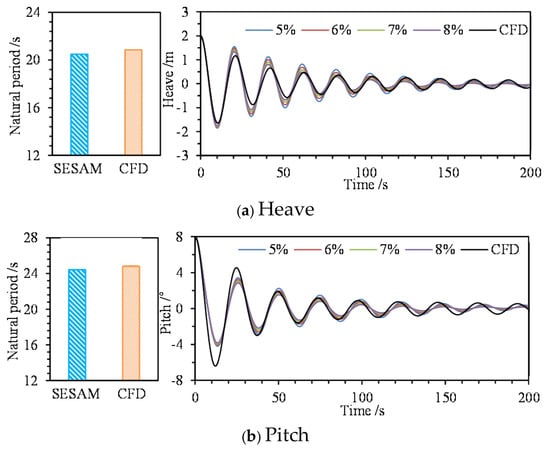
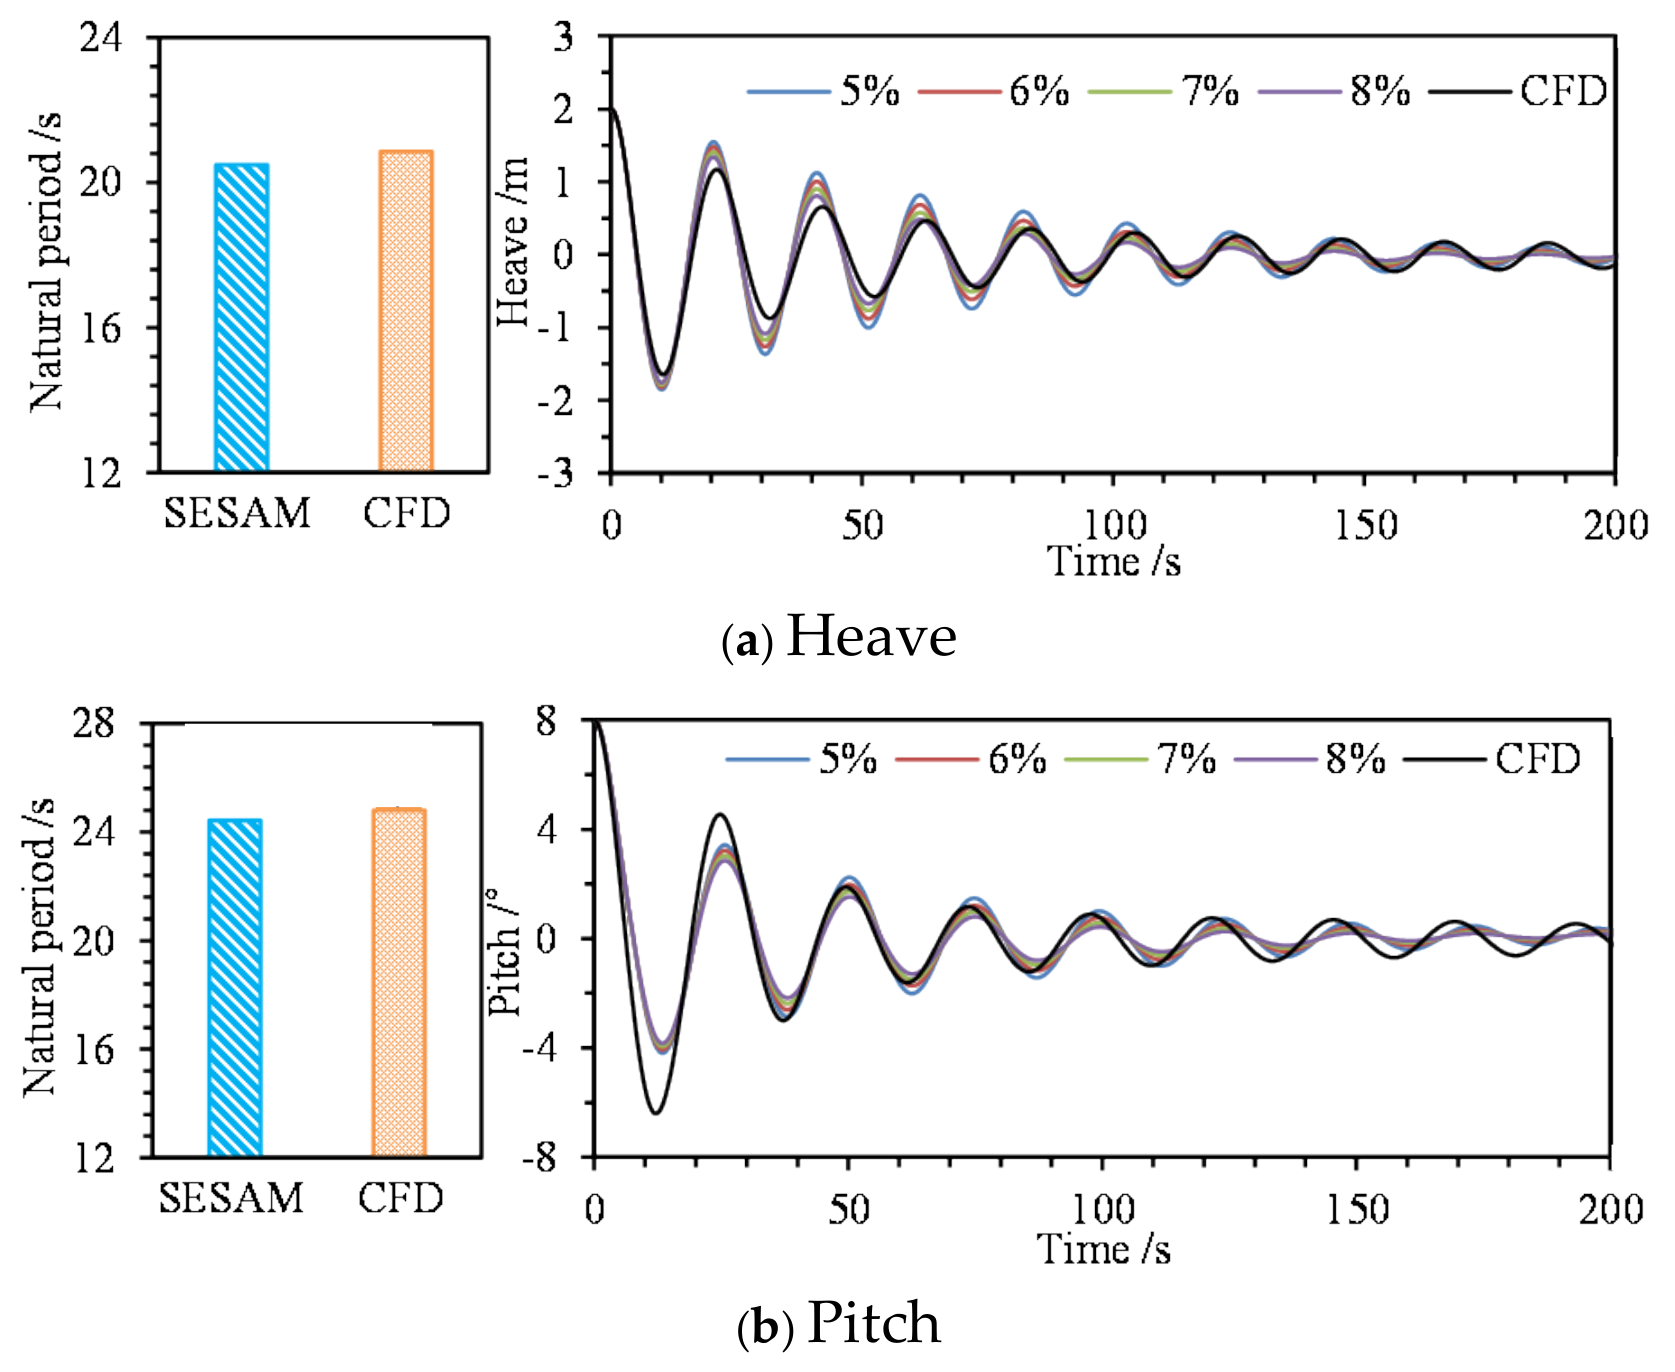
In this study, an added damping matrix is applied to correct the viscous effect. To validate the added damping, this study has performed free decay analysis for heave and pitch motions using SESAM software, and compared those results with high-fidelity Computational Fluid Dynamics (CFD) data [27], as shown in Figure 6. The natural periods of heave and pitch obtained from both methods show excellent agreement, with slight differences. While distinct discrepancies in the decay rate can be observed during the initial stages of the free-decay tests, the motion curves rapidly converge as the amplitude diminishes, showing identical natural frequencies. By applying the logarithmic decrement method to the free-decay curves, we extracted the total damping ratios of the TwinFOWT model: For the heave motion, the potential-flow model calibrated with a 7% critical damping ratio yields a system damping behavior that aligns most closely with the high-fidelity CFD benchmark results. Conversely, for the pitch motion, the CFD simulation indicates a system damping ratio closer to a 6% calibrated potential-flow baseline. Because the free-decay validation in this study was intended solely to assess the accuracy of the platform hydrodynamic model, the influence of the tower configuration was not considered. In the subsequent simulations, the heave and pitch damping ratios were kept identical across all tower configurations. This modeling assumption provides a consistent basis for comparing the six tower configurations.
Figure 6.
The natural periods, free-decay curves at various damping ratios, and the total damping ratios of the TwinFOWT model from the free-decay analysis.
3.2.3. Aerodynamic Verification
In this study, the aerodynamic performance of the wind turbine is simulated using the blade element momentum (BEM) theory and a dynamic stall model. The BEM theory is a widely used engineering method for calculating aerodynamic loads on wind turbine blades. The thrust T and torque Mr of an individual blade element can be expressed by Equations (1) and (2), respectively:
The relative velocity W of each blade element consists of the components of the wind speed and rotor rotational velocity. a represents the angle of attack, c is the chord length of the blade element, and r denotes the distance from the blade element to the hub center. ρ is the fluid density, while CL and CD represent the lift and drag coefficients, respectively.
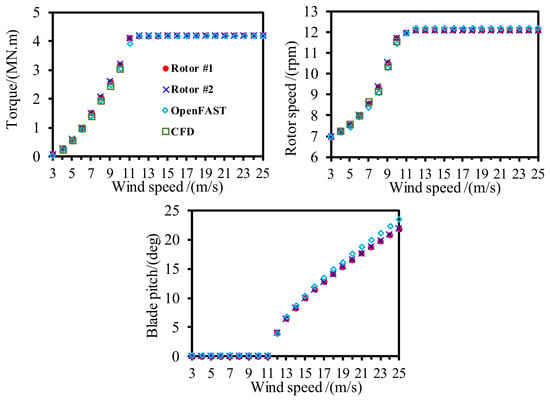
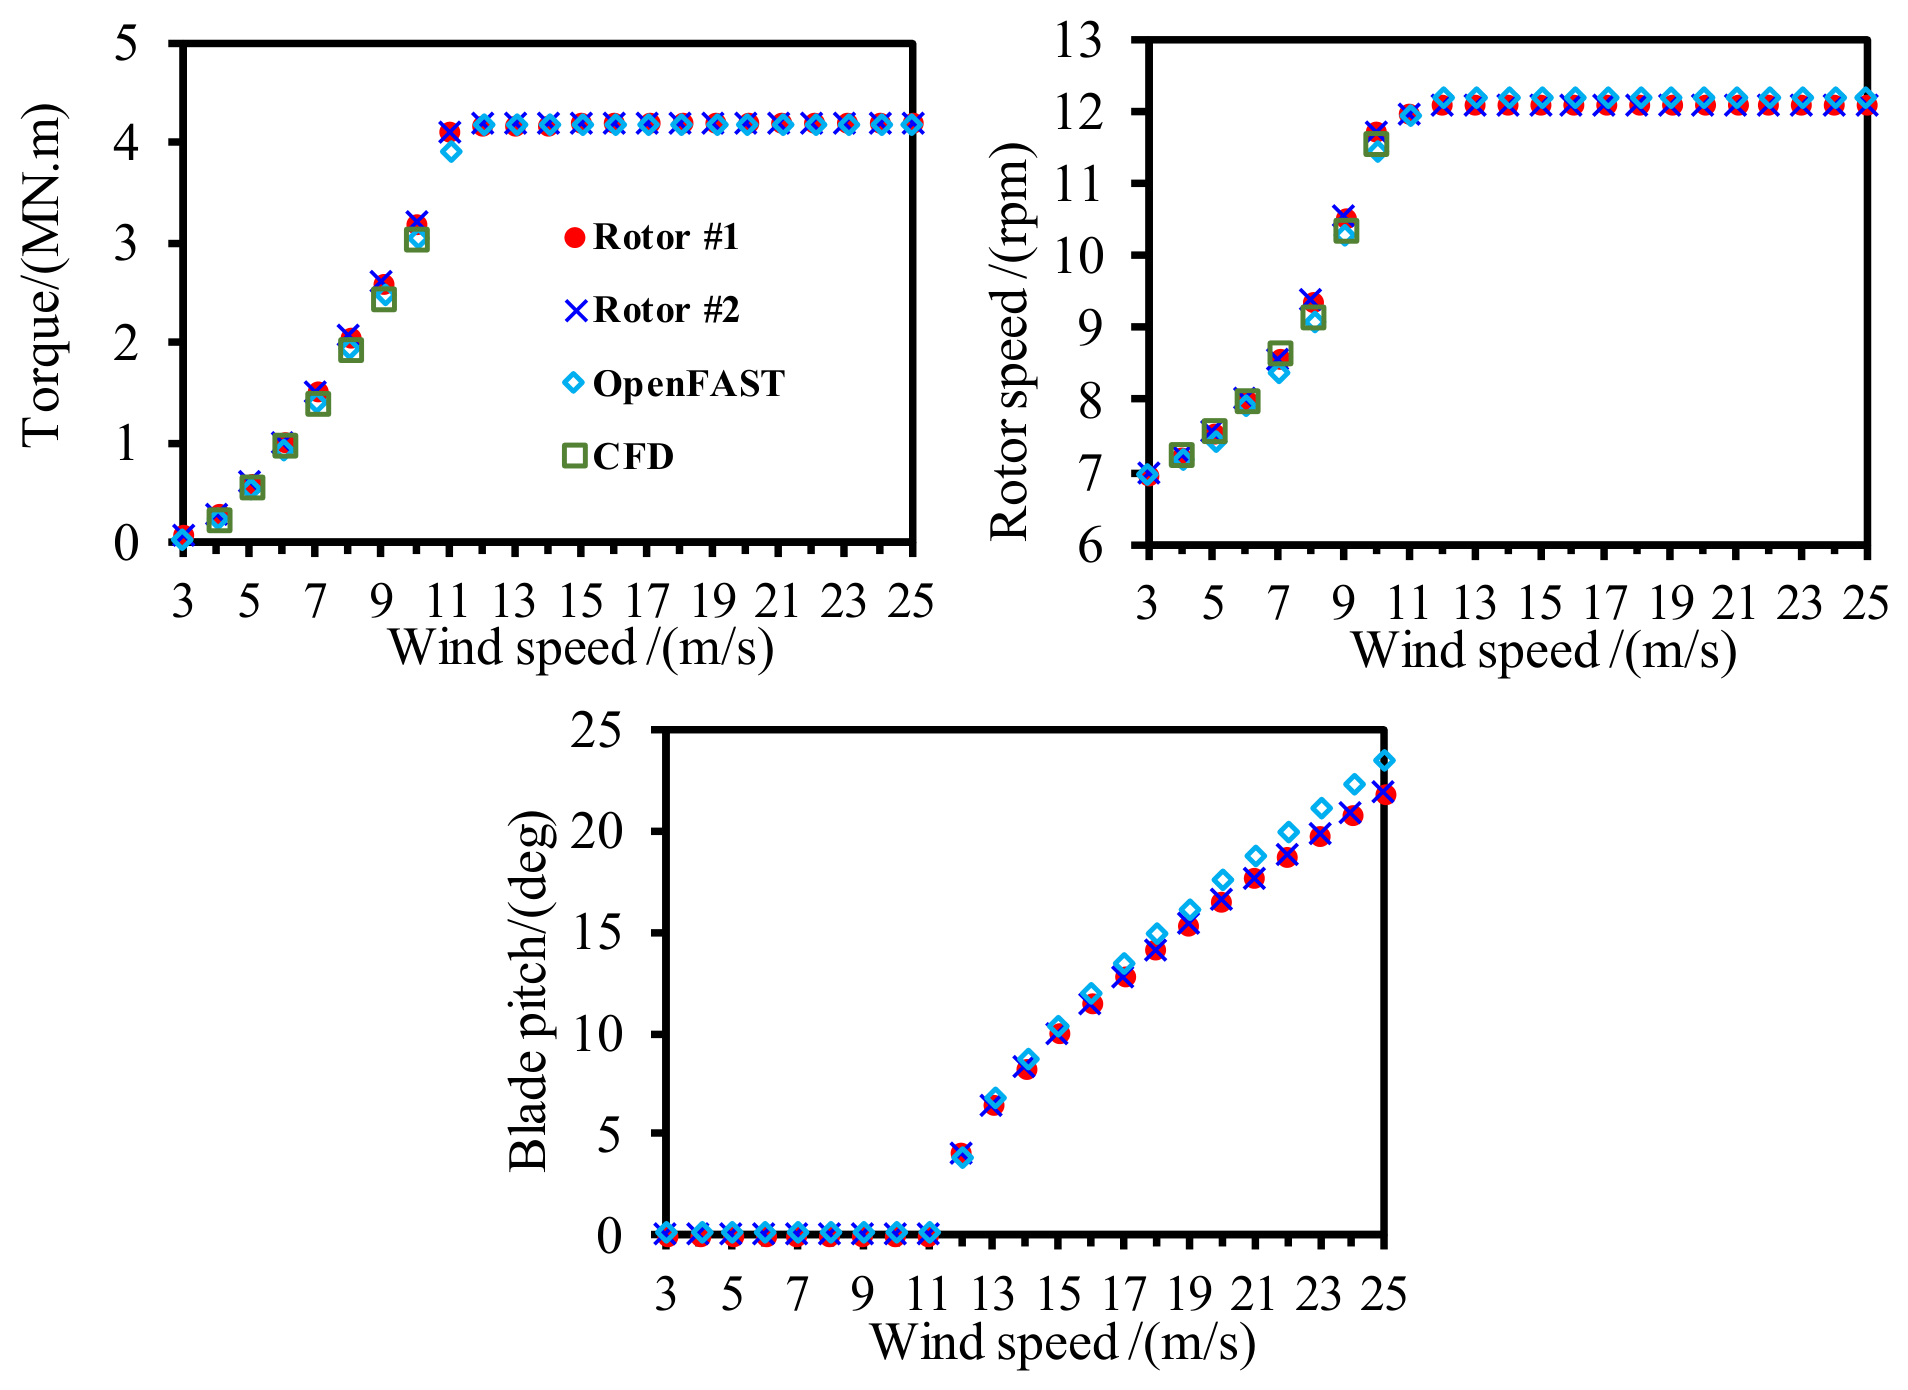
Figure 7 presents the statistical results of the aerodynamic performance of the wind turbines under different operating conditions, with comparisons among the developed model, CFD, and OpenFAST results. The comparison demonstrates that the established aerodynamic analysis model shows good agreement with both CFD and OpenFAST, with only minor differences in the mean values. Furthermore, the variation in blade pitch angle and rotor speed predicted by the present model is highly consistent with that from OpenFAST, with a maximum difference of only 1.57°. These results verify the accuracy of the aerodynamic modeling and controller implementation of the wind turbine. Finally, since this study primarily focuses on the fully coupled modeling and dynamic response analysis of TwinFOWT, the aerodynamic interaction between the two rotors is neglected, which is a limitation of the present study. It should be noted that no controller was included in the CFD simulations; therefore, only the mean torque results at low wind speeds were provided. In addition, the CFD simulations were conducted at fixed rotor speeds and wind speeds, and the comparison shown in Figure 7 is intended for illustrative purposes only.
Figure 7.
Statistical results of the aerodynamic torque and blade pitch under different conditions.
4. Fatigue Analysis Method
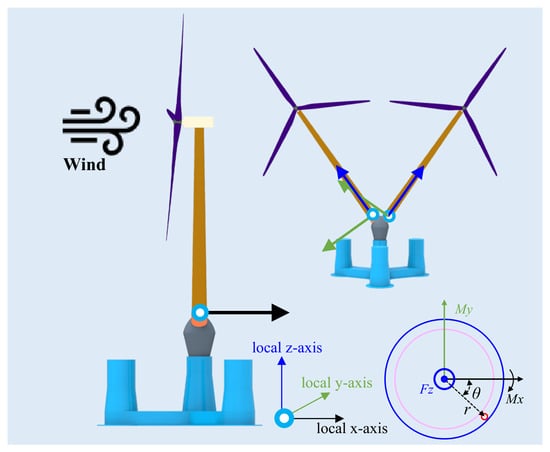
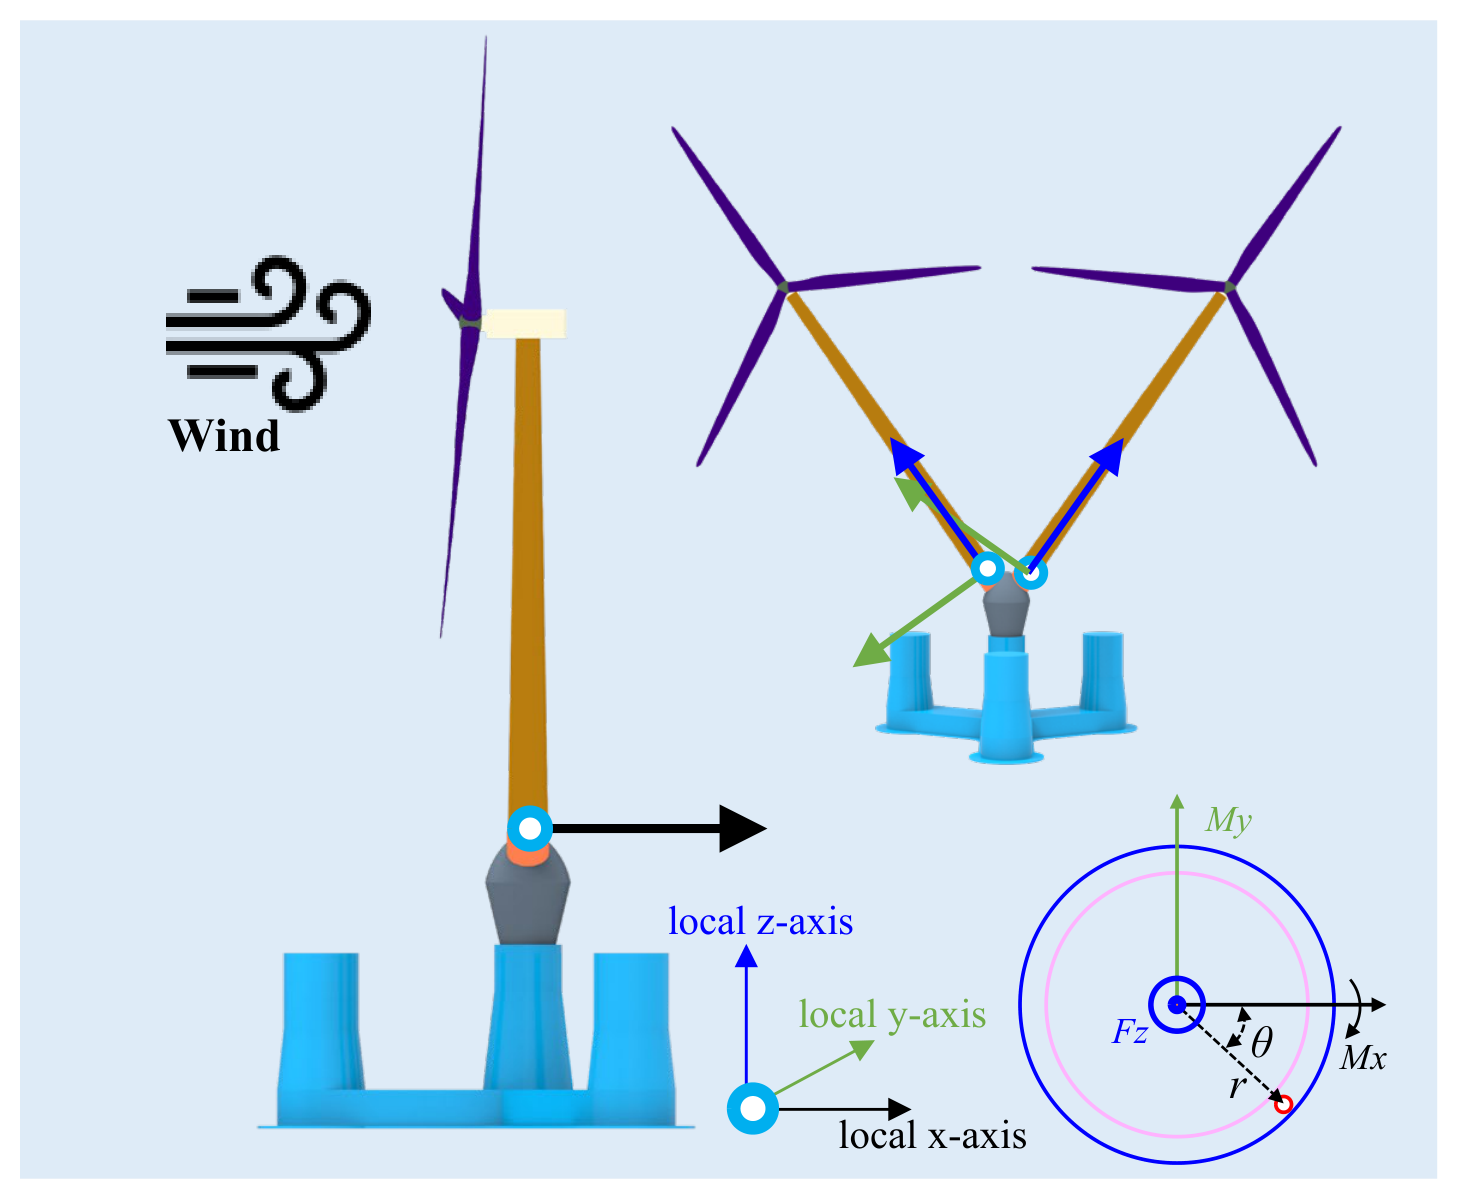
For the V-shaped TwinFOWT model, the tower base region is considered the fatigue-sensitive location, where the fatigue damage is mainly influenced by the bending moment and axial force induced by the combined effects of gravitational, inertial, and aerodynamic loads. Therefore, the nominal stress approach is adopted to evaluate the fatigue performance of the tower base section. The time-varying stress at the tower base is calculated from the bending moments and axial forces, as presented in Figure 8. The local coordinate system is defined as follows: the local X-axis is directed from the tower base towards the tower top, while the local Y-axis aligns with the 0° inflow wind direction and the local Z-axis is determined by the right-hand rule. The origin of this local coordinate system is located at the tower-base load output point. The stress evaluation was performed at the outer surface of the tower base cross-section, where the maximum tensile and compressive stresses occur under bending loading. The axial stresses at designated points on the outer surface of the tubular cross-section are calculated using (3) and (4) [28].
where σ is the axial stress. Fz is the axial force. A is the cross-sectional area. Iy and Ix are the second-order moments of the area about the local y-axis and x-axis, respectively. D and d represent the outer and inner diameters of the tower, respectively. r is the radius to the given point in the cross-section. θ represents the angle between the local x-axis and the line connecting a given point on the cross-section to the center point. M is the bending moment component, and positive Mx results in max compression for θ = 90° and max tension for θ = 270°; positive My results in max compression for θ = 0° and max tension for θ = 180°.
Figure 8.
The tower-base section and local coordinate system.
To consider the circumferential stress distribution of the tubular section, the tower base circumference was divided into 12 equally spaced points. The stress range at each circumferential position was calculated, and the maximum fatigue damage location was used for subsequent fatigue assessment. In addition, the mean stress effect was neglected in this study. This assumption is reasonable because the fatigue loading at the tower base is mainly dominated by cyclic environmental loads, where the stress range governs the fatigue damage.
The linear cumulative damage theory [29,30], known as the Miner rule, has been validated for engineering applications. The fundamental formula of the Miner rule adopted in this paper is presented as follows:
where Nt is the total number of stress cycles. ni is the number of constant amplitude stress range cycles Δσi in block i. Nf,i is the number of cycles to failure at a constant stress range Δσi that is calculated using (6).
The DNV-GL [31] E-class S-N curve was selected for fatigue assessment of the tower base. This curve represents typical welded tubular structural details commonly used in offshore structures. Since the weld geometry was not modeled in this study, the nominal stress approach combined with the DNV E-class S-N curve was adopted. The relevant parameters of the S-N curve are provided in Table 3.
where Δσ is the stress range. m is the negative slope of the S-N curve. k is the thickness exponent on fatigue strength. tref is the reference thickness. For tubular joints, the reference thickness is 32 mm. t is the thickness through which the potential fatigue crack grows, and t = tref is used if the thickness t is smaller than the reference thickness tref.
Table 3.
The parameters of the E-class S-N curve in air.
5. Environmental Conditions and Load Cases
This study aims to investigate the effect of the tower inclination on the TwinFOWT in both operational and parked states. The wind, wave, and current loadings will be examined. For the operational state, 25 typical load cases have been selected. For the parked state, the sea-states in one-year and 50-year return periods are considered. Specific settings for load cases are detailed in Table 4, and the reference height of the wind speed is the hub height of the TI35° case. The environmental conditions and the joint probability distributions presented in Table 5 are derived from a comprehensive and widely recognized met-ocean dataset measured at an eastern coastal site in the USA, as detailed in Stewart et al. [32], and this dataset has been successfully applied in recent studies on integrated floating energy systems [33,34]. This dataset provides a statistically correlated relationship between wind and wave parameters, which is a standard reference for offshore wind turbine simulations. It should be noted that all the operating conditions considered in this study involve aligned inflow conditions, and yawed inflow conditions were not considered.
Table 4.
Load cases of TwinFOWT under all the examined load cases.
Table 5.
Annual energy production and the fatigue damage.
In this study, the stochastic wind field is generated using TurbSim based on the Kaimal turbulent wind spectrum. The turbulence intensity is confirmed in accordance with the IEC 61400-3 standard. The turbulence characteristics are defined as Category C, which corresponds to a reference turbulence intensity of 0.12, and stochastic variations are generated using random seeds 6137456 and 789012. To account for the spatial variation of wind velocity, the wind shear effect is described using a power-law distribution with an exponent of 0.14. Irregular waves are generated according to the JONSWAP wave spectrum. Regarding the hydrodynamic current, a regular current profile is defined, and the current loads acting on the platform are evaluated by incorporating the corresponding hydrodynamic drag coefficients as expressed in Equations (7) to (11). The simulation length of each load case is 4200 s. To eliminate the influence of startup transients, the data from the first 600 s are omitted for statistical analysis.
where ρ is the fluid density; Cd denotes the current drag coefficient; represents the relative velocity between the current and structure; A represents the projected area; β represents the current heading angle; Zforce is the vertical coordinate of the center of current pressure; Z is the vertical coordinate of the reference point; xc is the longitudinal distance from the reference point to the center of current pressure.
MX = FY−current(Zforce − Z)
MY = −FX−current(Zforce − Z)
MZ = FY−currentxc
6. Results and Discussions
Different tower inclination angles result in changes in hub heights, consequently influencing the wind power production of the TwinFOWT model. Furthermore, tower inclination may lower the center of gravity of the TwinFOWT model, thereby potentially altering the dynamic behavior of the platform. Additionally, tower inclination has the potential to affect the stress distribution and fatigue load at the tower base, which may exert a significant impact on structural integrity and service life. To explore the influence of tower inclination angle on the dynamic characteristics of the TwinFOWT models, this section presents results and discussions of output power, platform motions, and the fatigue damage at the tower base.
6.1. Effect on the Platform Motions
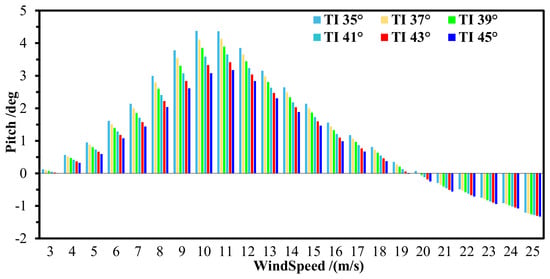
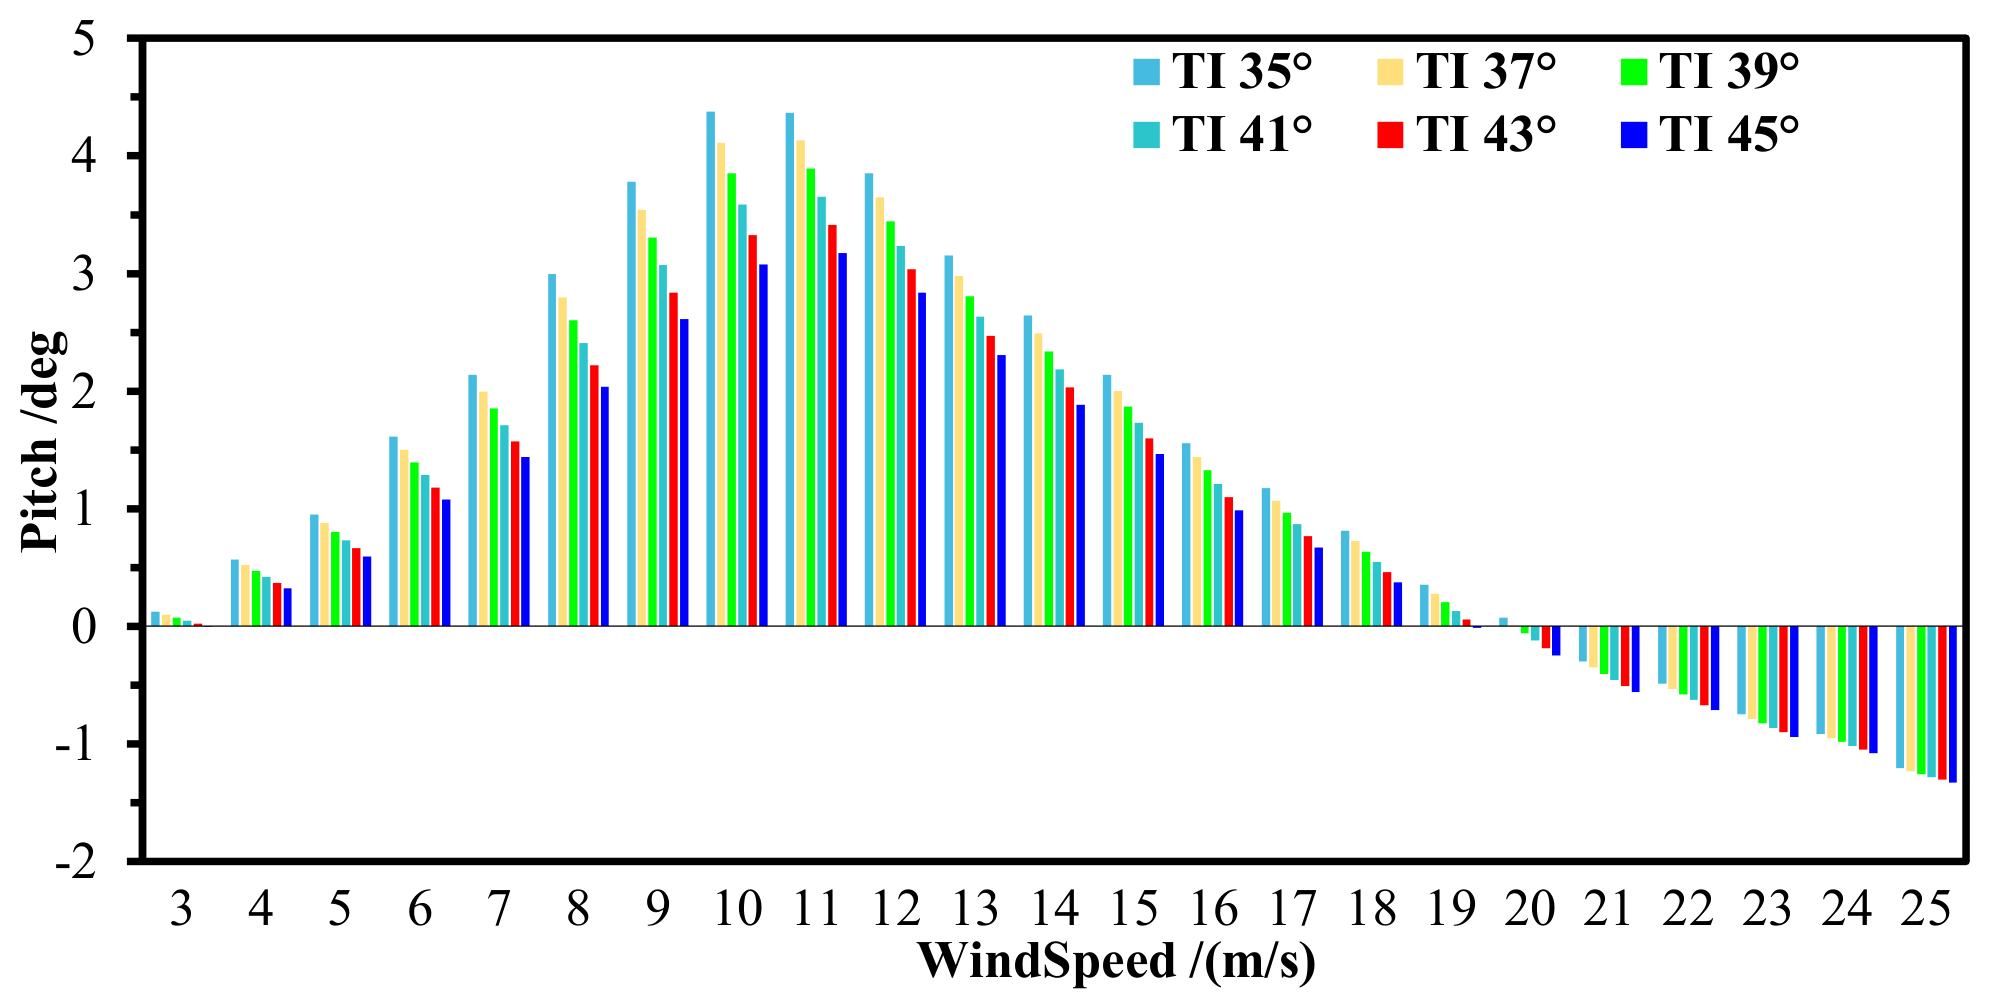
Figure 9 shows the statistical average pitch motion for the TwinFOWT under operational states for various tower inclination angles. It can be observed that as wind speed increases, the average pitch of the TwinFOWT model firstly increases, followed by a gradual decrease, and eventually reaches negative values, indicating a reverse tilt phenomenon. This behavior results from the combined effects of environmental loads and the control system response. Rotor thrust of the wind turbines operating in the below-rated conditions will be enhanced by the increase in wind speed, which is expected to raise the platform pitch. In addition, the hydrodynamic loads on the platform under these moderate sea states remain relatively limited in influencing the platform pitch. Under above-rated wind conditions, rotor thrust decreases as wind speed increases because blade-pitch control is activated to regulate aerodynamic torque and maintain rated power output. Consequently, the rotor thrust of each wind turbine is reduced, leading to a gradual decrease in the average pitch motion. Furthermore, the reduction in hub height decreases the aerodynamic loads acting on the TwinFOWT and shortens their moment arm about the platform. The resulting aerodynamic overturning moment is therefore reduced, causing the platform pitch response to decrease as the tower inclination angle increases.
Figure 9.
Statistics of the average pitch motion under operating states.
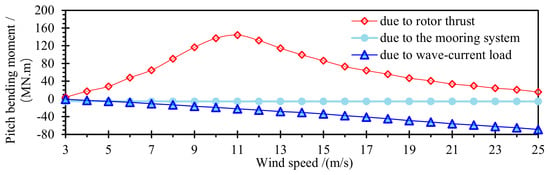
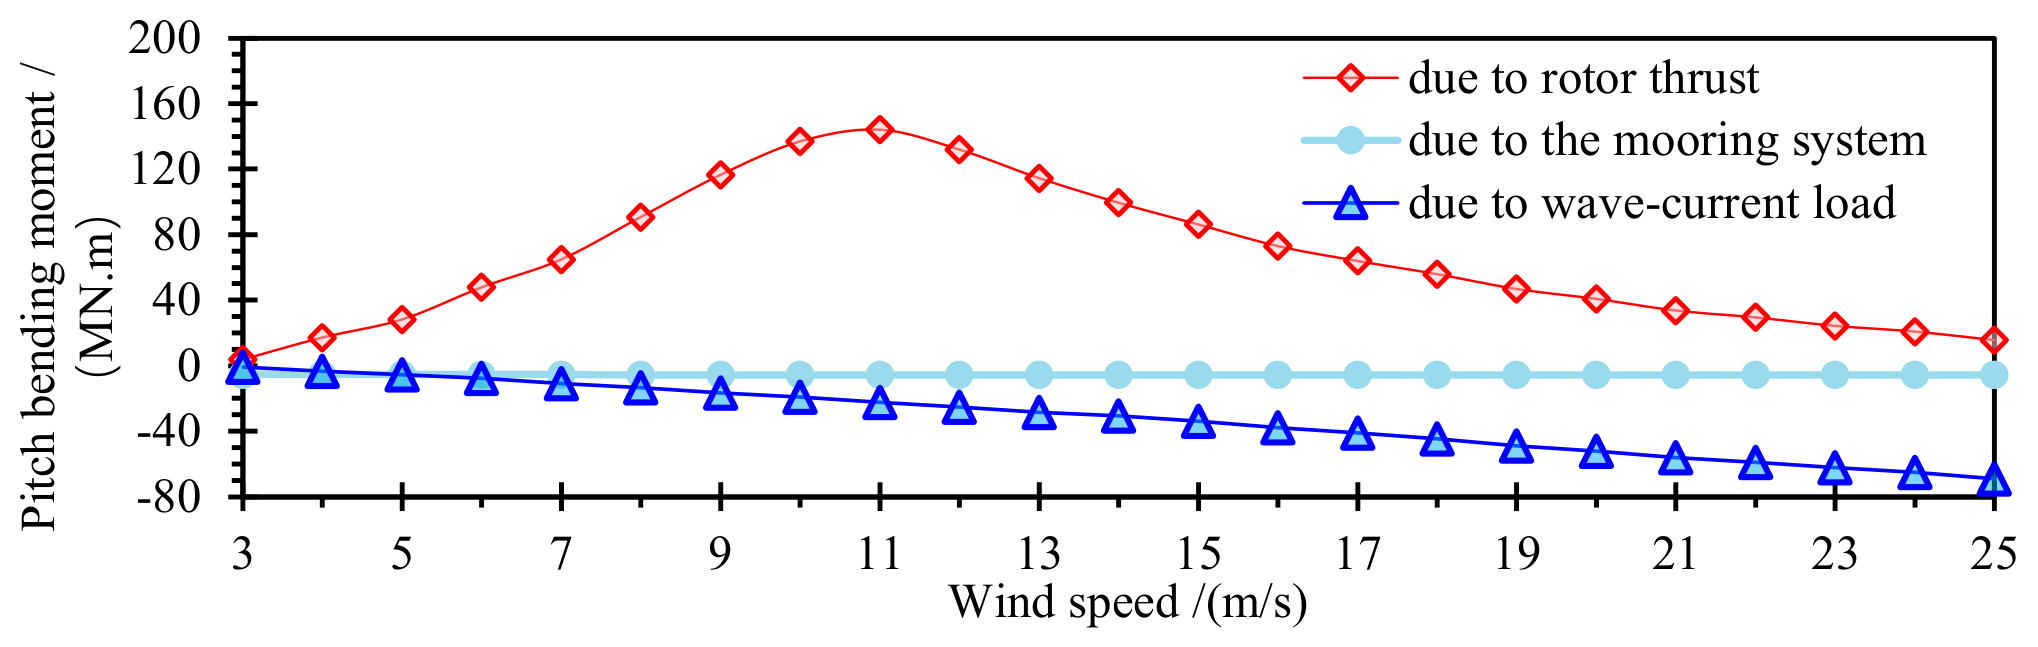
Moreover, the gravity center of the TwinFOWT model is located between the rotor and the platform. The bending moment produced by the rotor thrust acts in the opposite direction to that produced by the forces from wave and current loadings. Moreover, compared with a conventional FOWT, the TwinFOWT model has a higher center of gravity, making the influence of wave and current forces on the platform pitch motion more significant. As wind speed further increases, the bending moments due to current loading gradually become the primary factors affecting the pitch motion, causing the platform to tilt in the reverse direction, even with negative values.
Furthermore, when the wind speed is below 19 m/s, an increase in tower inclination angle leads to a reduction in the magnitude of the pitch motion, with peak differences of up to 32.73% in pitch direction compared to the results of the TI35°, thereby enhancing the platform resistance to overturning. However, when the wind speed exceeds 19 m/s, increasing the tower inclination angle results in more significant reversed pitch motion, thereby reducing the platform anti-overturning capability. The phenomenon where the mean pitch of the TwinFOWT becomes negative under high wind speed conditions is a result of the dynamic equilibrium between competing load components.
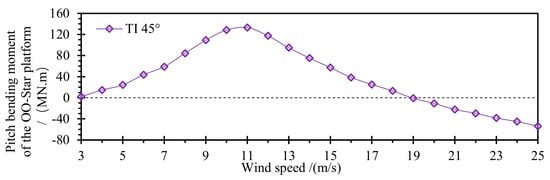
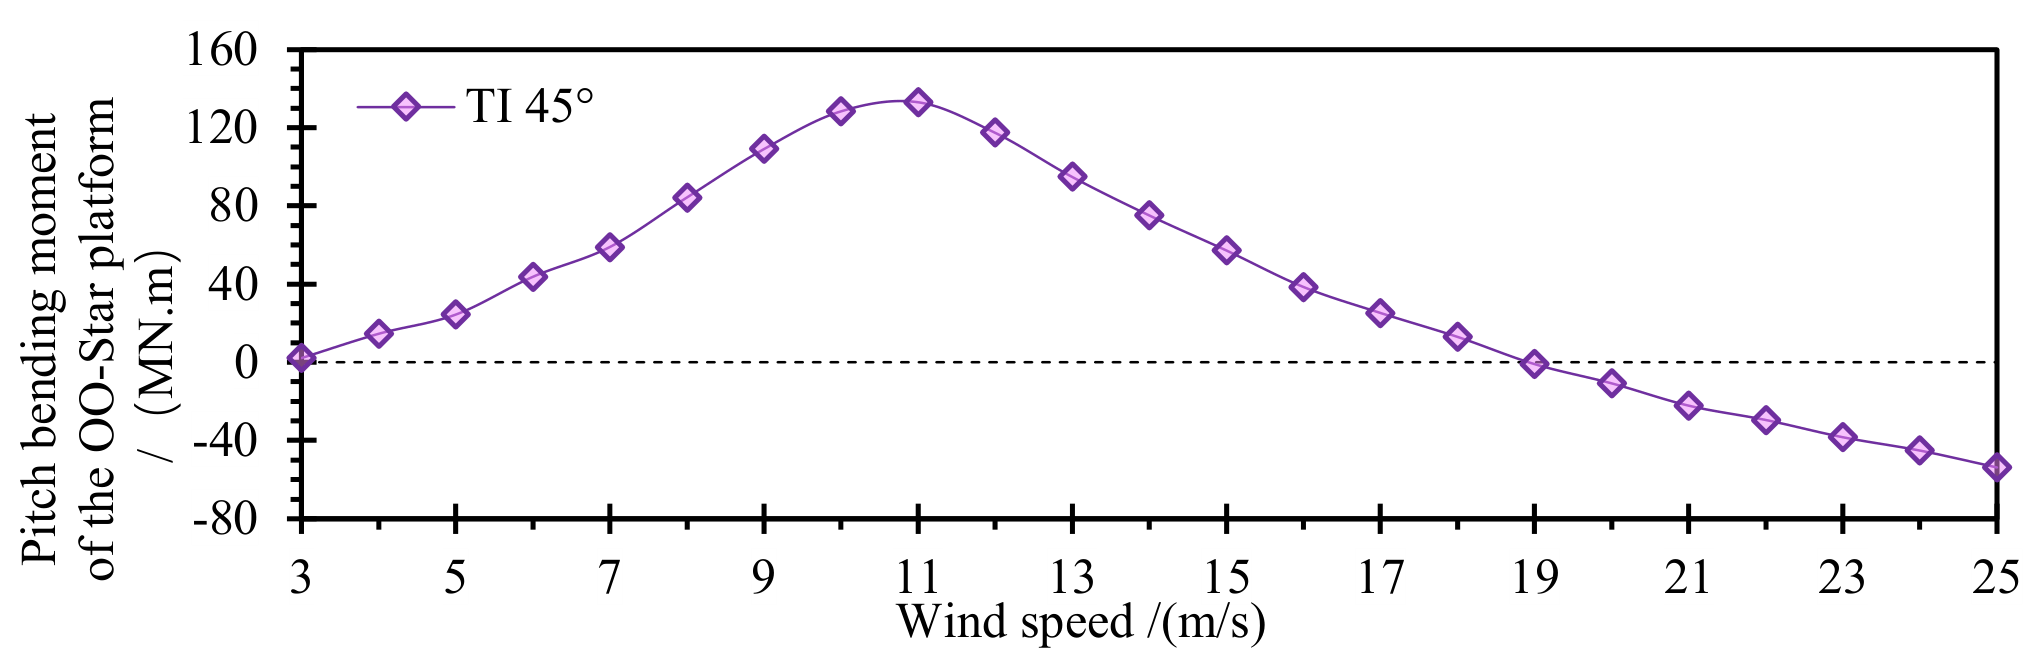
As illustrated in Figure 10, the total pitch bending moment acting on the platform is presented. Concurrently, we have quantified the percentage contributions of the pitch bending moments from the upper structure (aerodynamic load and gravity), the environmental loads acting on the OO-Star platform (wave and current), and the mooring system, as shown in Figure 11.
Figure 10.
The average overall pitch bending moment with 45° tower inclination.
Figure 11.
Percentage contributions of the three components to the pitch bending moment.
When the wind speed is below the rated wind speed, the control system maintains a constant blade pitch angle to maximize power capture. Consequently, the aerodynamic thrust increases with the square of the wind speed, leading to a steady increase in the moment proportion contributed by the upper structure. In the high wind speed region, the aerodynamic thrust is minimized by the controller, and the loads from waves and currents continue to increase in magnitude, thereby gradually increasing the proportion of the total pitch bending moment attributable to these loads. At a wind speed of 20 m/s, the rotor-thrust-induced pitch bending moment accounts for 47.77% of the total, while the environmental loads acting on the OO-Star platform and the mooring system account for 47.15% and 5.08%, respectively.
This effect occurs because a larger tower inclination angle corresponds to a lower hub, which decreases the input wind energy due to the shear effect and shortens the arm of the aerodynamic bending moment. As a result, the moment generated by the rotor thrust is diminished. When rotor thrust serves as the dominant driving force for pitch motion, increasing tower inclination angle helps suppress pitch oscillations of the platform. Nevertheless, at higher wind speeds, the dominant excitations shift to wave and current loads, and the influence of rotor thrust variations on the pitch motion becomes less significant.
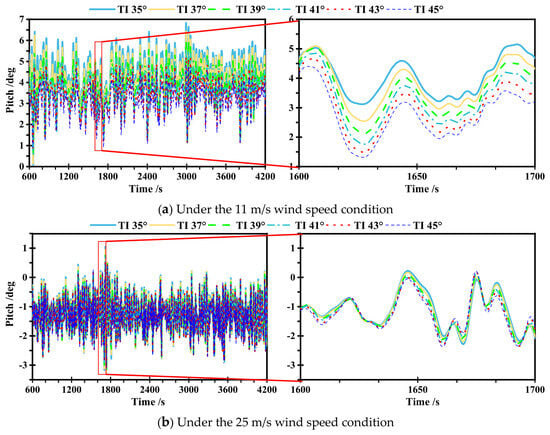
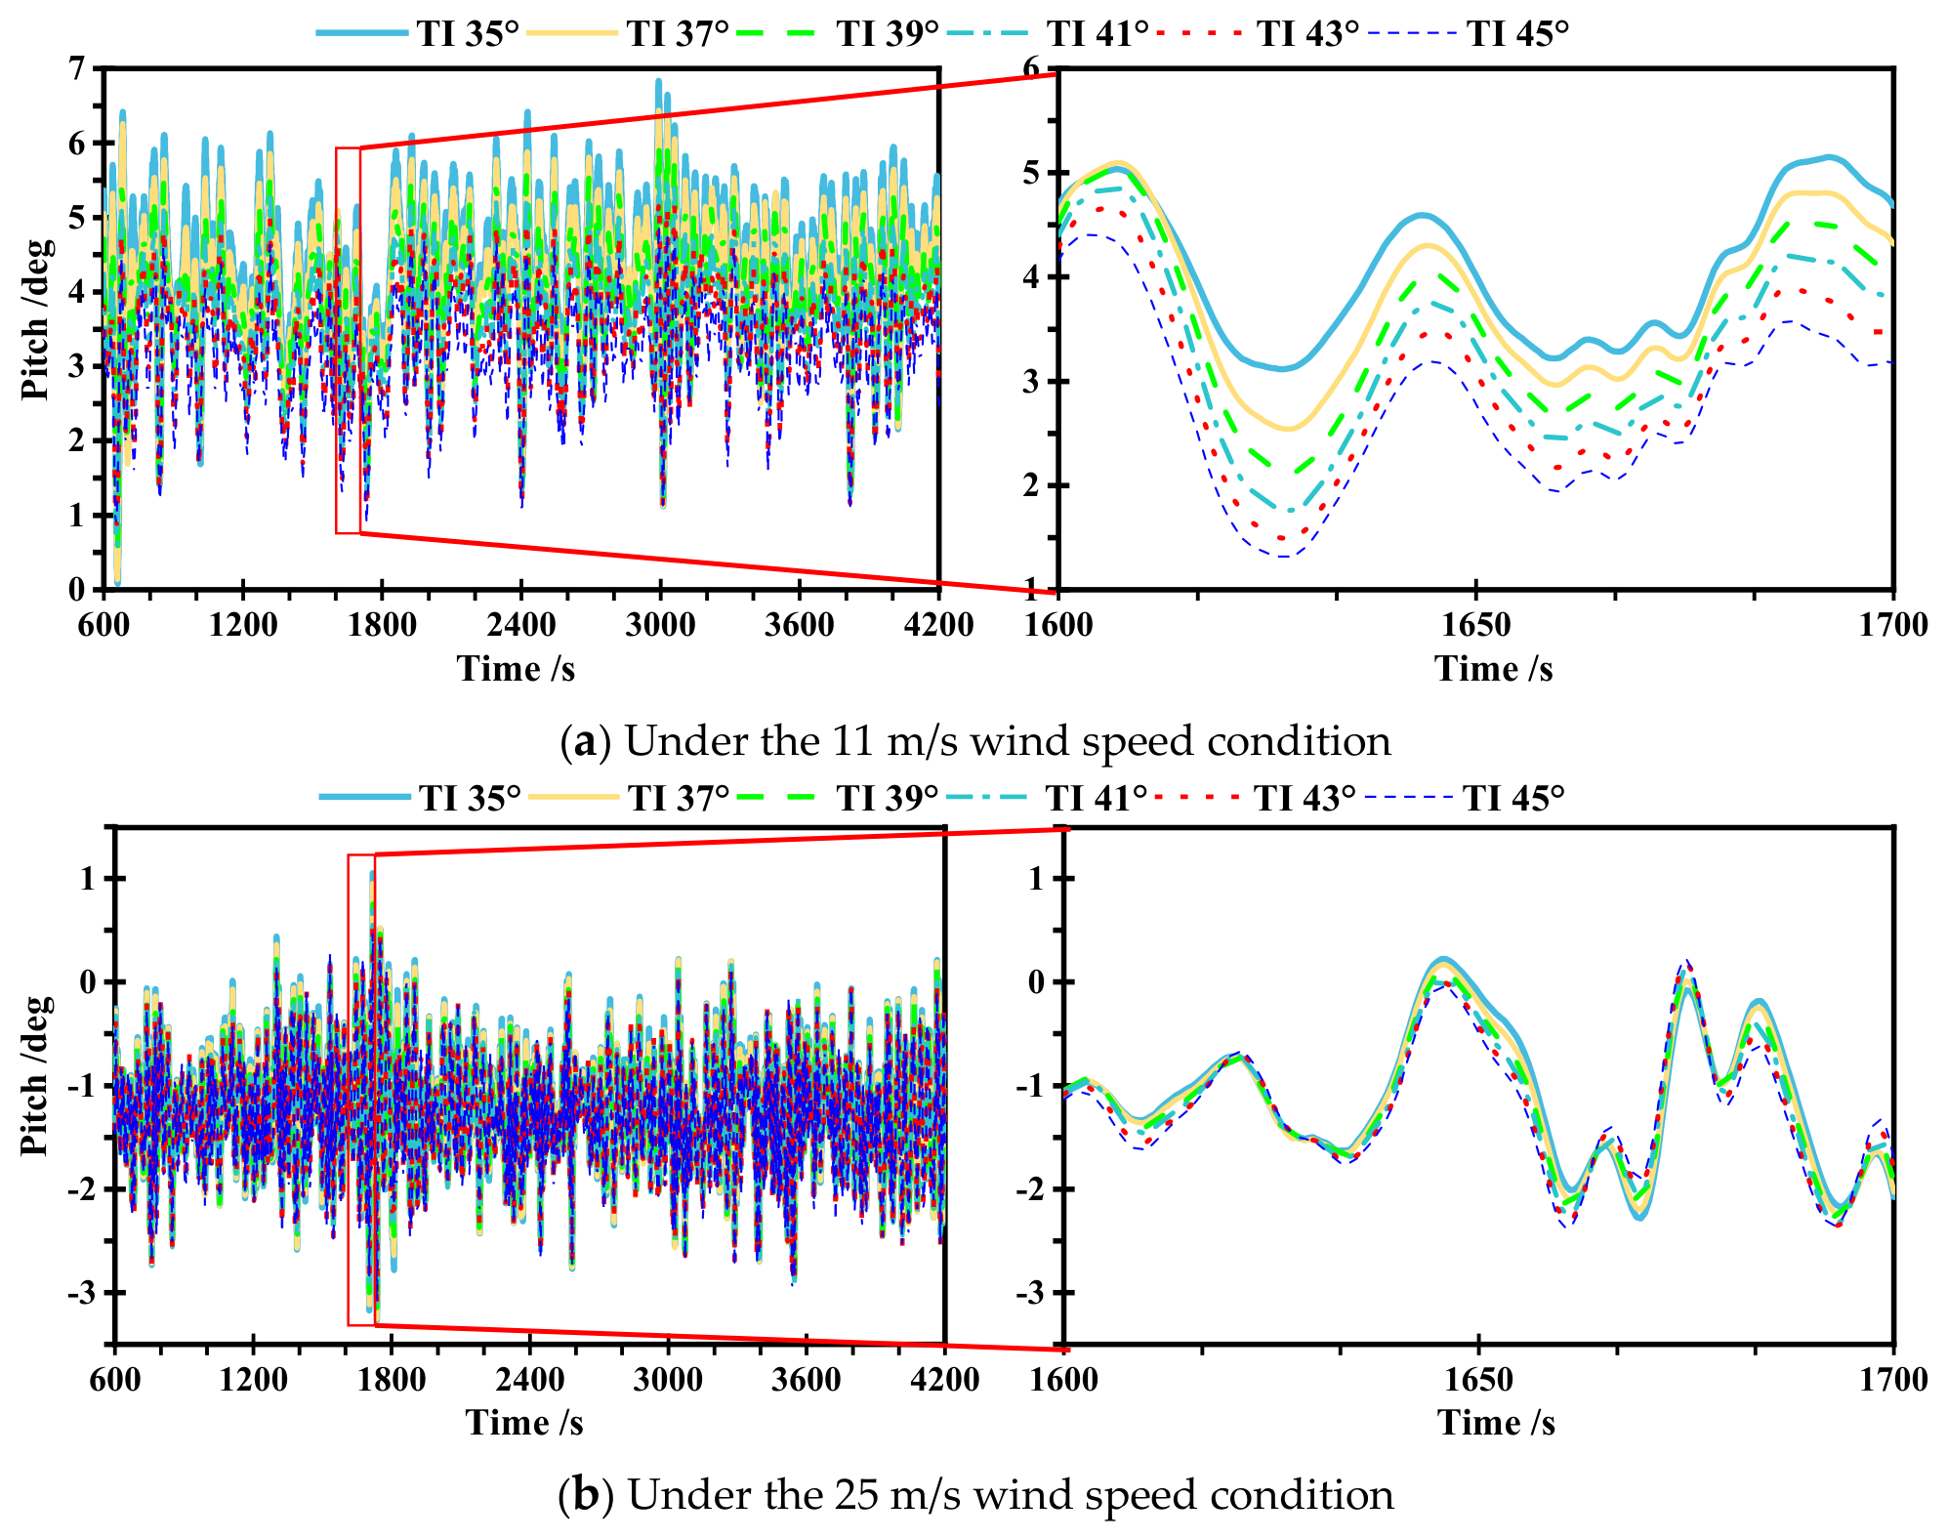
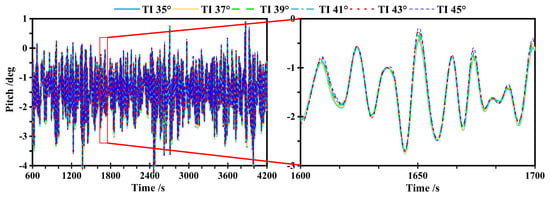
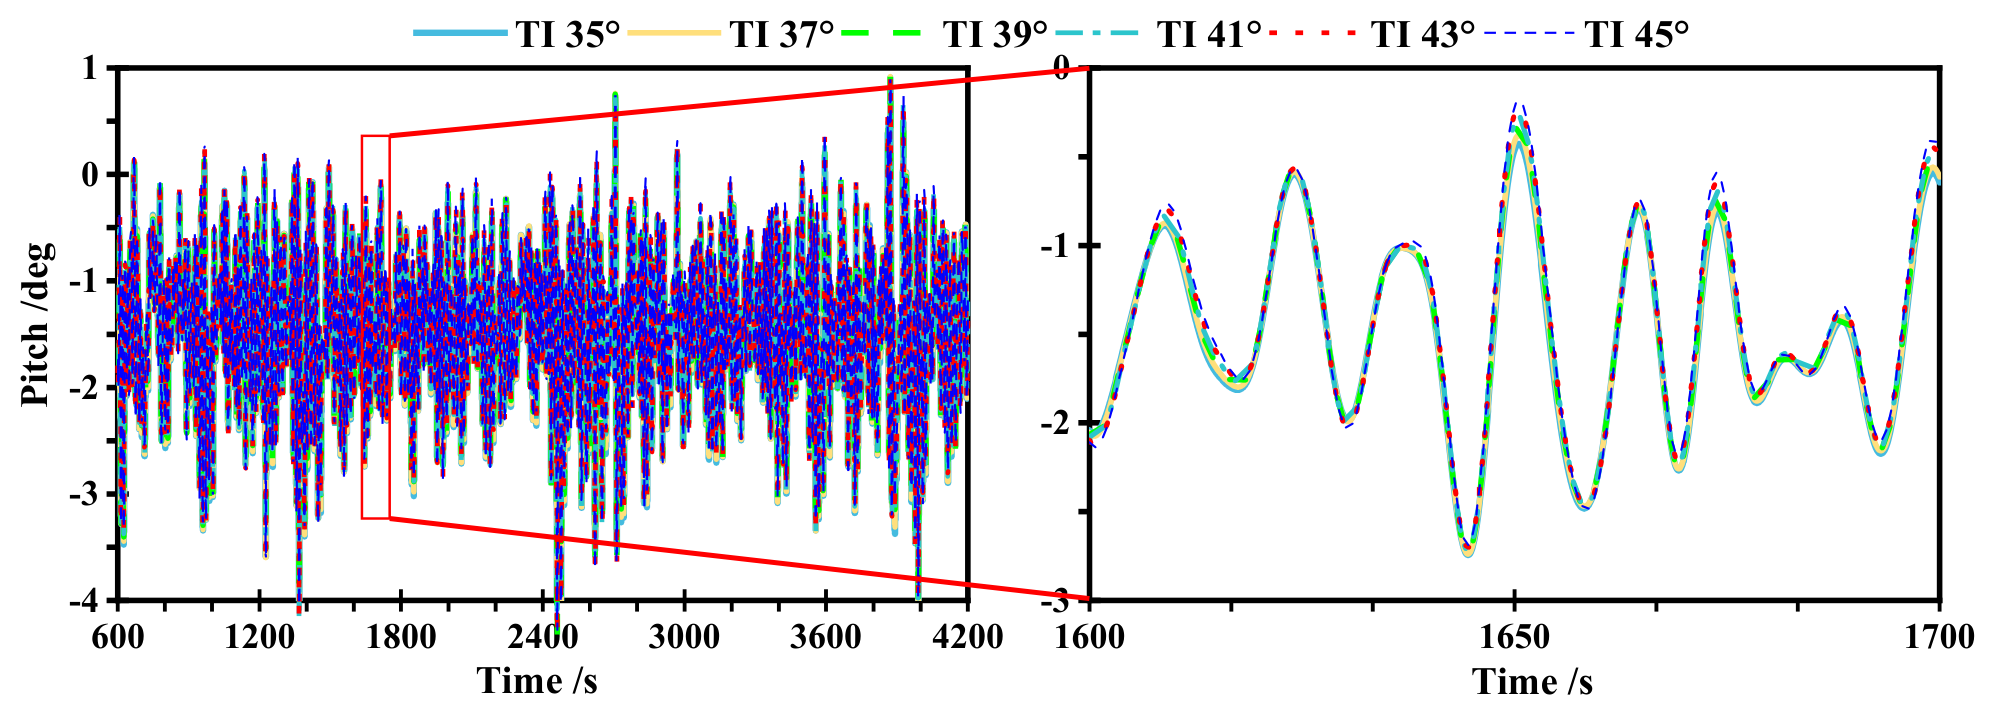
Under the 11 m/s and 25 m/s wind speed conditions, the time-varying pitch motion of the TwinFOWT models at different tower inclination angles is shown in Figure 12. Although the trend in pitch motion remains consistent, the corresponding values decrease with increasing tower inclination angle, reflecting a gradual weakening of the influence of rotor thrust-induced moment on the pitch. In contrast, under the cut-out wind conditions, the variations in pitch motion among different tower inclination models are minimal, suggesting that platform pitch motion of the TwinFOWT model is primarily driven by the hydrodynamic loads.
Figure 12.
Platform pitch for the various TwinFOWT concepts in operation states.
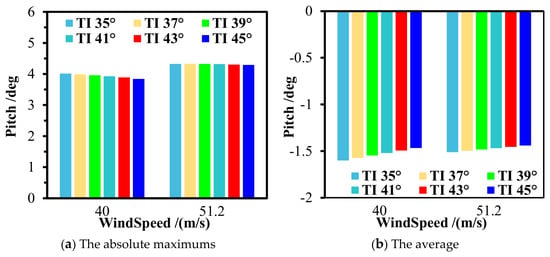
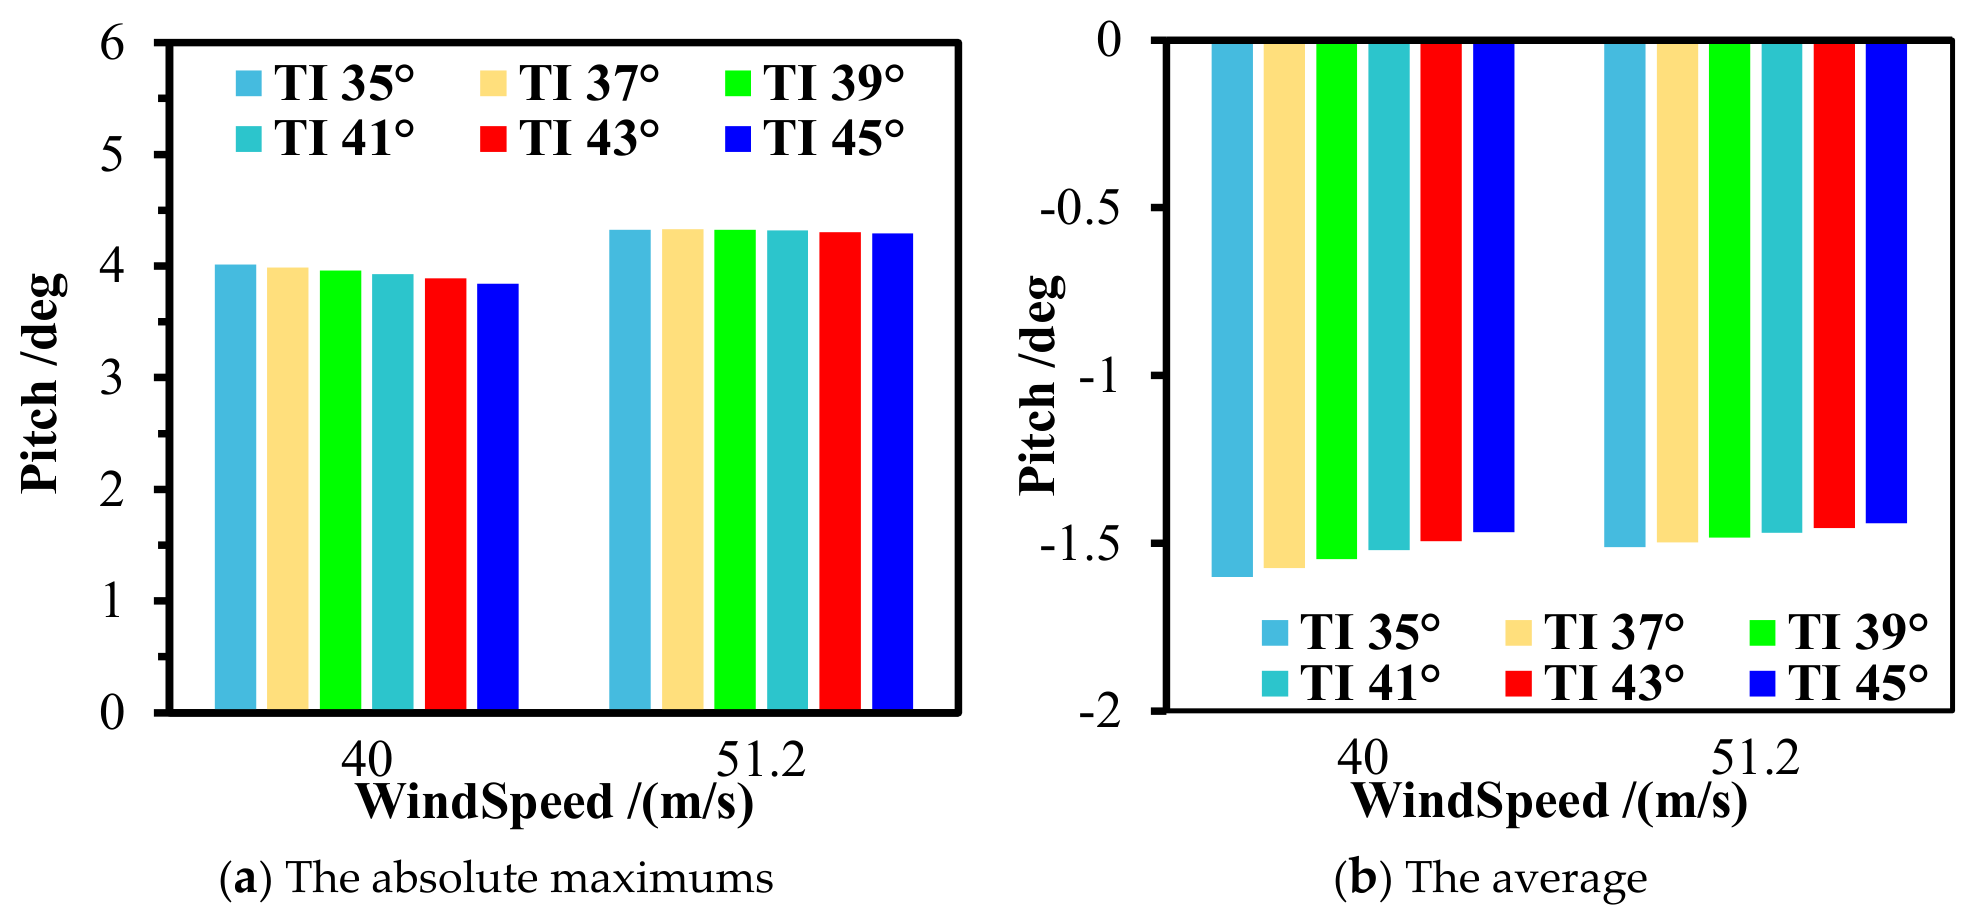
Figure 13 presents the peak and average results for the pitch motions under parked states. As can be observed, the differences in platform pitch among the various tower inclination angles are insignificant, which means that aerodynamic load has a relatively minor impact on the pitch motion, because the differences in rotor thrust due to tower inclination angles are not clearly reflected in the pitch motion. Under the 50-year extreme environmental conditions, the pitch motion shown in Figure 14 reveals that the overall trend remains almost unchanged for different tower inclinations, indicating that the effect of tower inclination angles on the TwinFOWT motion is almost negligible.
Figure 13.
Statistics of the pitch motion under parked states.
Figure 14.
The pitch motion of different TwinFOWT models under the 50-year extreme condition.
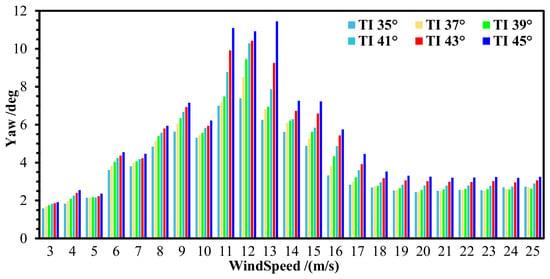
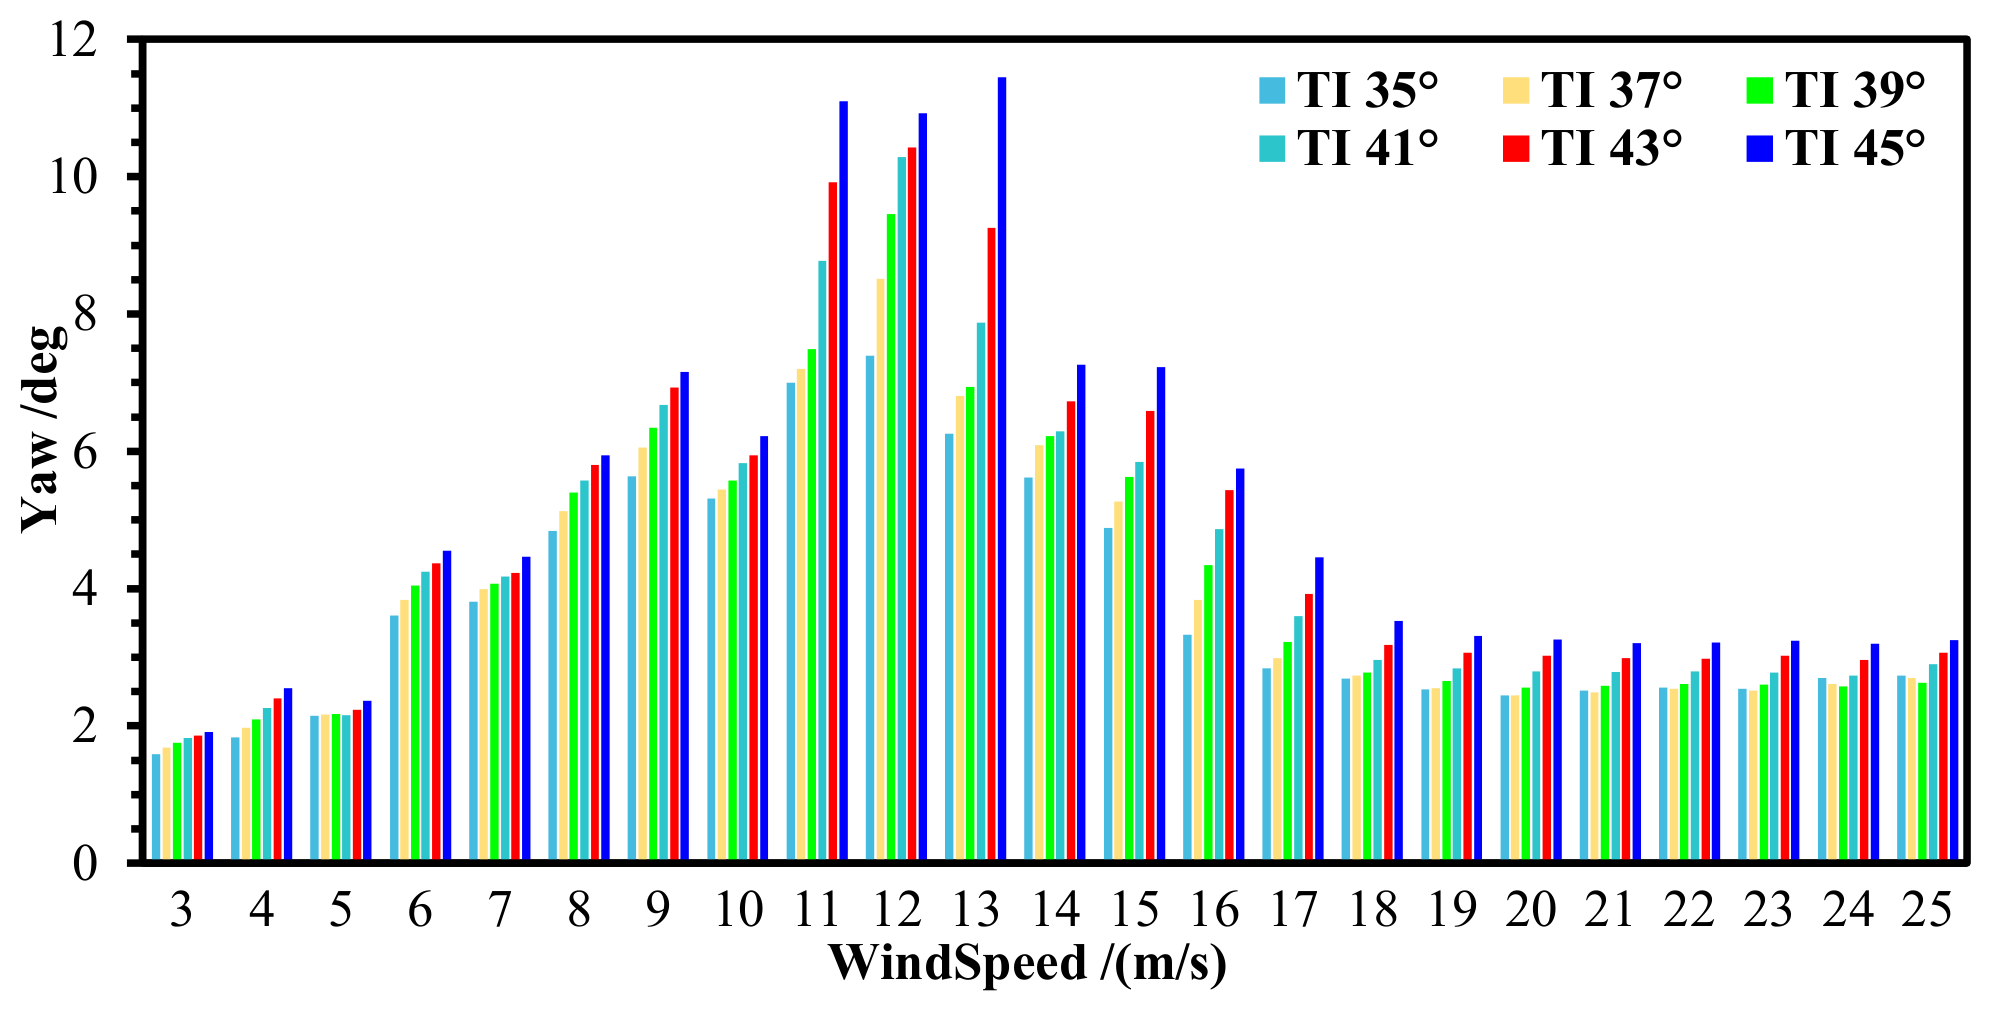
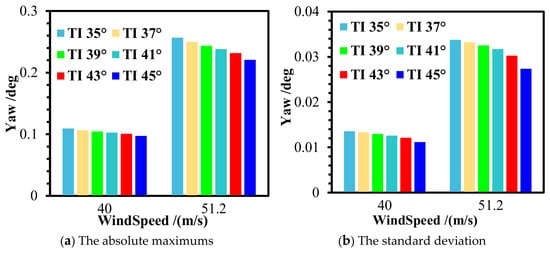
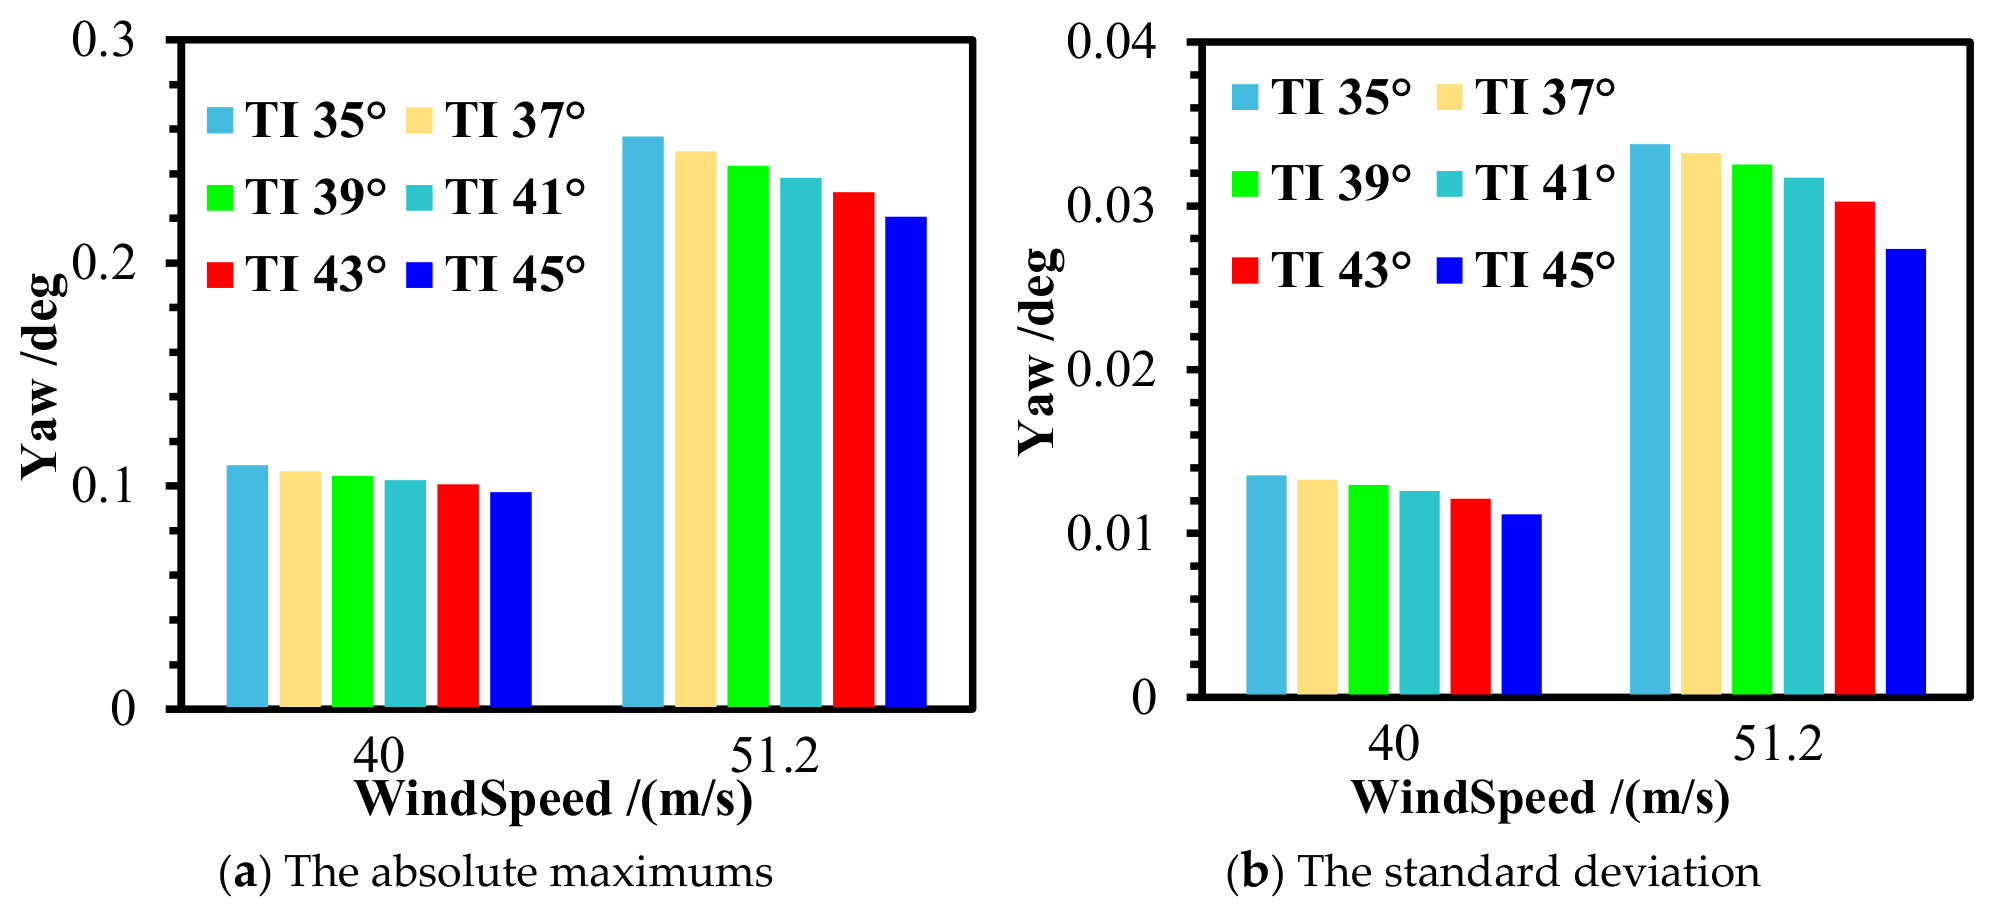
Figure 15 presents the absolute maximum yaw motion of the TwinFOWT under operational states for various tower inclination angles. It can be observed that as wind speed increases, the absolute maximum yaw first increases, followed by a gradual decrease. This behavior occurs because the rotor thrust of the TwinFOWT gradually increases with wind speed under below-rated conditions, enhancing the torsional effect on the TwinFOWT and increasing its yaw motion. The rotor thrust decreases with increasing wind velocities for over-rated conditions, since the blade-pitch control has been activated to adjust aerodynamic torque for maintaining rated power output. Consequently, the rotor thrust of each wind turbine is reduced, causing the yaw motion to gradually diminish.
Figure 15.
Statistics of the absolute maximum yaw motion under operation states.
Furthermore, the results show that the absolute peak yaw for the TwinFOWT gradually increases as the tower inclination angle increases, with peak differences of up to 58.58%. This is primarily because a larger tower inclination angle causes the hub to move farther outward along the global y-axis, increasing the lever arm of the rotor thrust and the platform yaw rotation. This effect is particularly pronounced near the rated wind velocity, where the rotor thrust reaches the peak value, making the impact of tower tilt most significant.
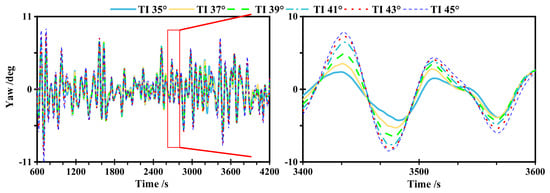
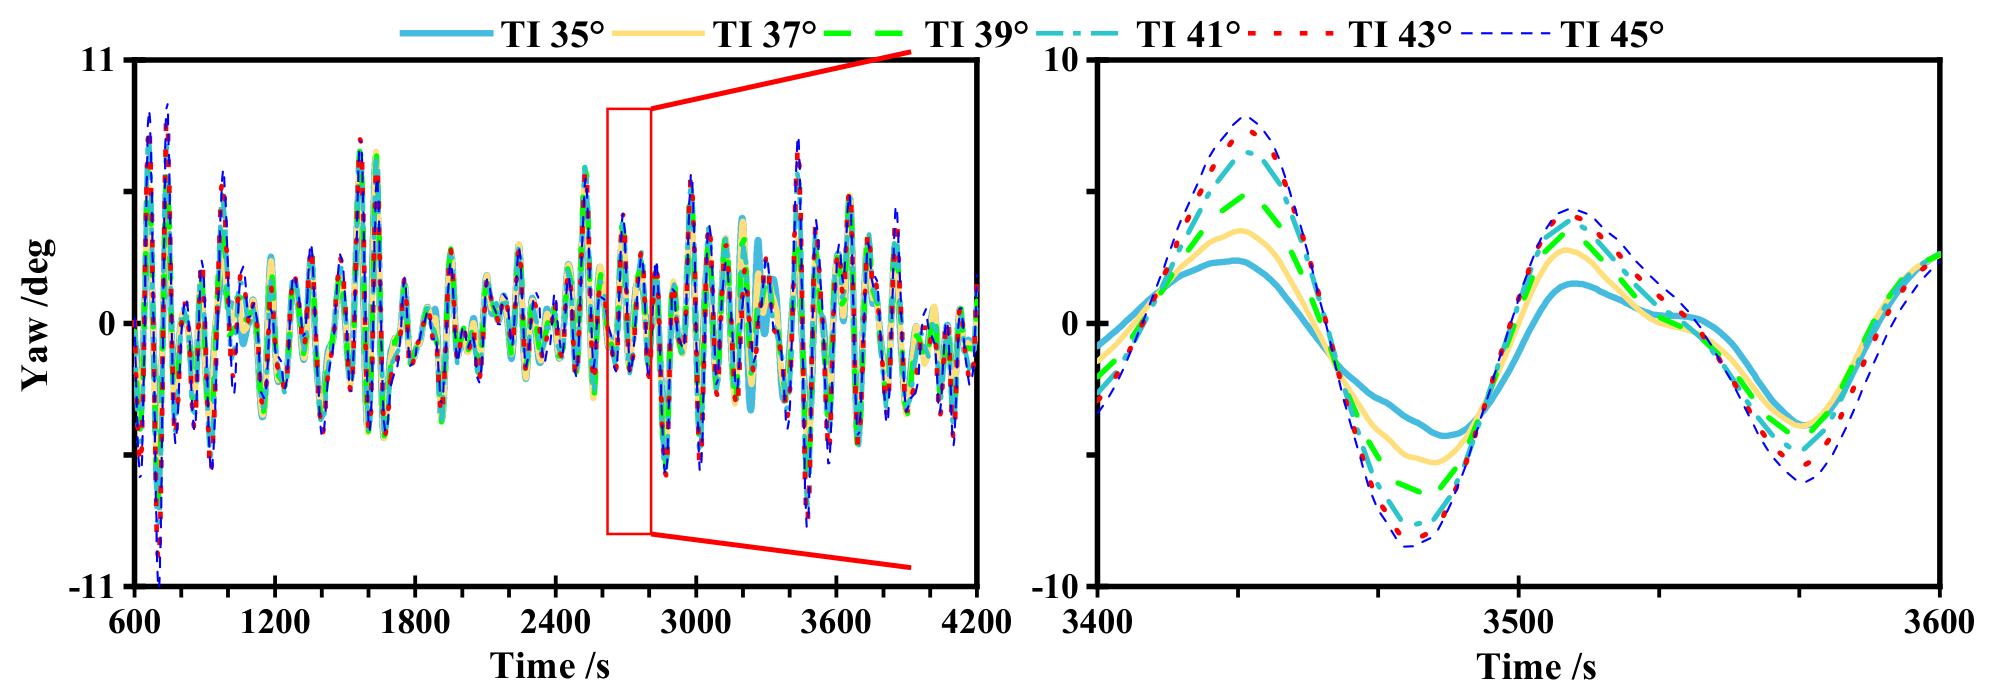
Figure 16 presents the yaw motion of the TwinFOWT model subjected to the 11 m/s wind speed for various tower inclination angles. It has been observed that the largest inclination angle achieves the highest absolute maximum yaw. At a wind speed of 11 m/s, the maximum yaw angle of the 35° tower inclination case is 7.00°, while the corresponding value for the 45° case is 11.10°. The difference between the two cases is 58.58%.
Figure 16.
The yaw motion of different TwinFOWT models under the 11 m/s wind speed condition.
Figure 17 presents the average and maximum yaw motions of the TwinFOWT models under parked scenarios. It is found that the differences in both the absolute maximum and average yaw of the TwinFOWT model across different tower tilt angles are negligible, due to the relatively small aerodynamic load under parked states.
Figure 17.
Statistics of the yaw motion under parked states.
6.2. Effect on the Structural Strength and Fatigue Damage at Tower-Base
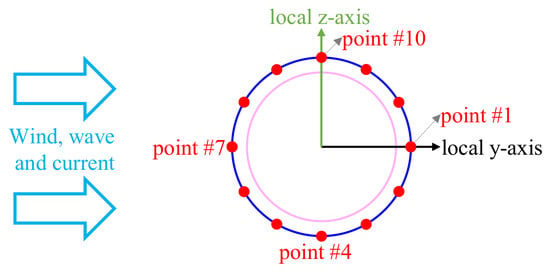
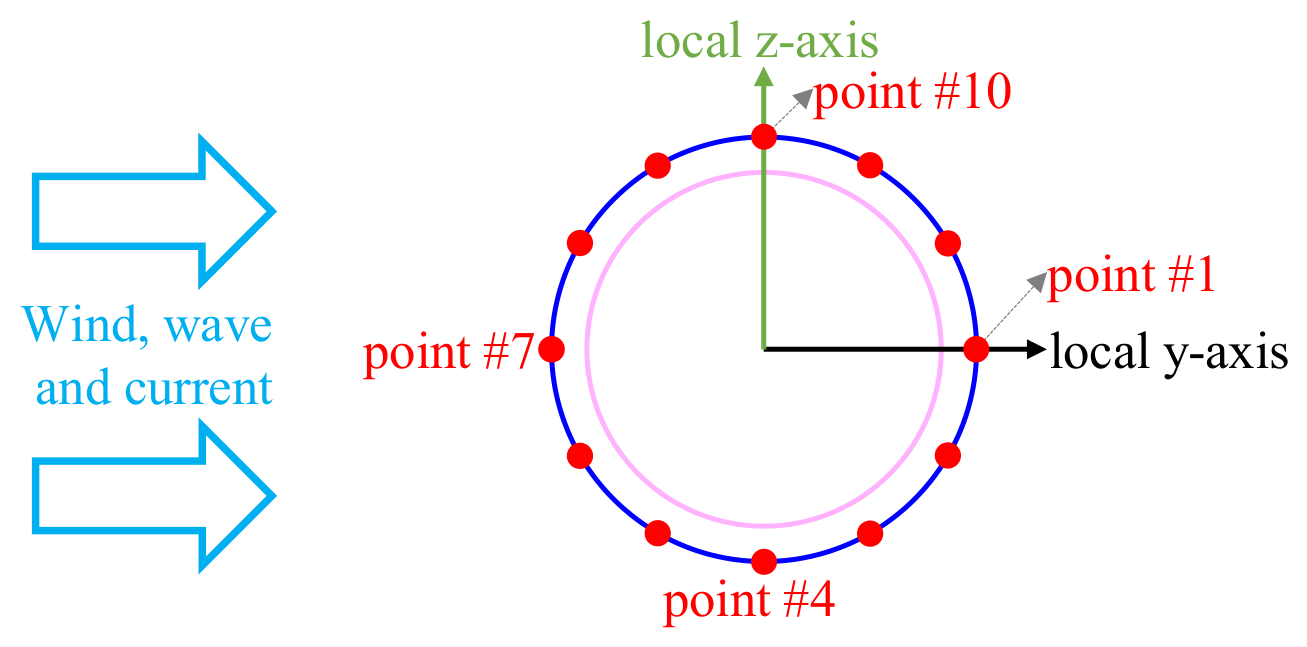
Figure 18 presents 12 stress analysis points at 30° intervals, located at the tower-base of the TwinFOWT models defined in Figure 8. Based on the stress time histories extracted from these structural points, the cycles of each stress range are subsequently determined using the rainflow-counting algorithm. Point #1 and point #7 are located at the downwind and upwind positions, respectively. Point #4 and point #10 correspond to the locations of maximum tensile and compressive deformation caused by tower inclination. It is worth noting that the stress time series from 600 to 4200 s were used for the fatigue assessment, with a sampling interval of 0.5 s. Fatigue damage was calculated using the built-in time-history fatigue module in SESAM, in which stress cycles are identified using the rainflow-counting method and accumulated according to the specified S–N curve. No user-defined stress-range binning or additional mean-stress correction was applied. The short-term damage was converted into annual fatigue damage using the occurrence probabilities defined in Section 5.
Figure 18.
Stress analysis hotspots of the tower base.
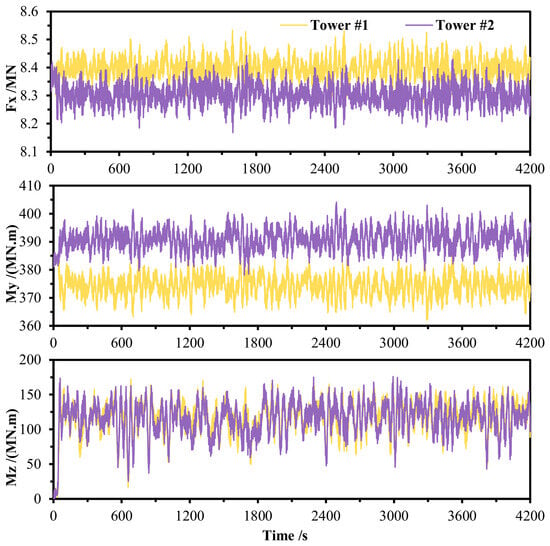
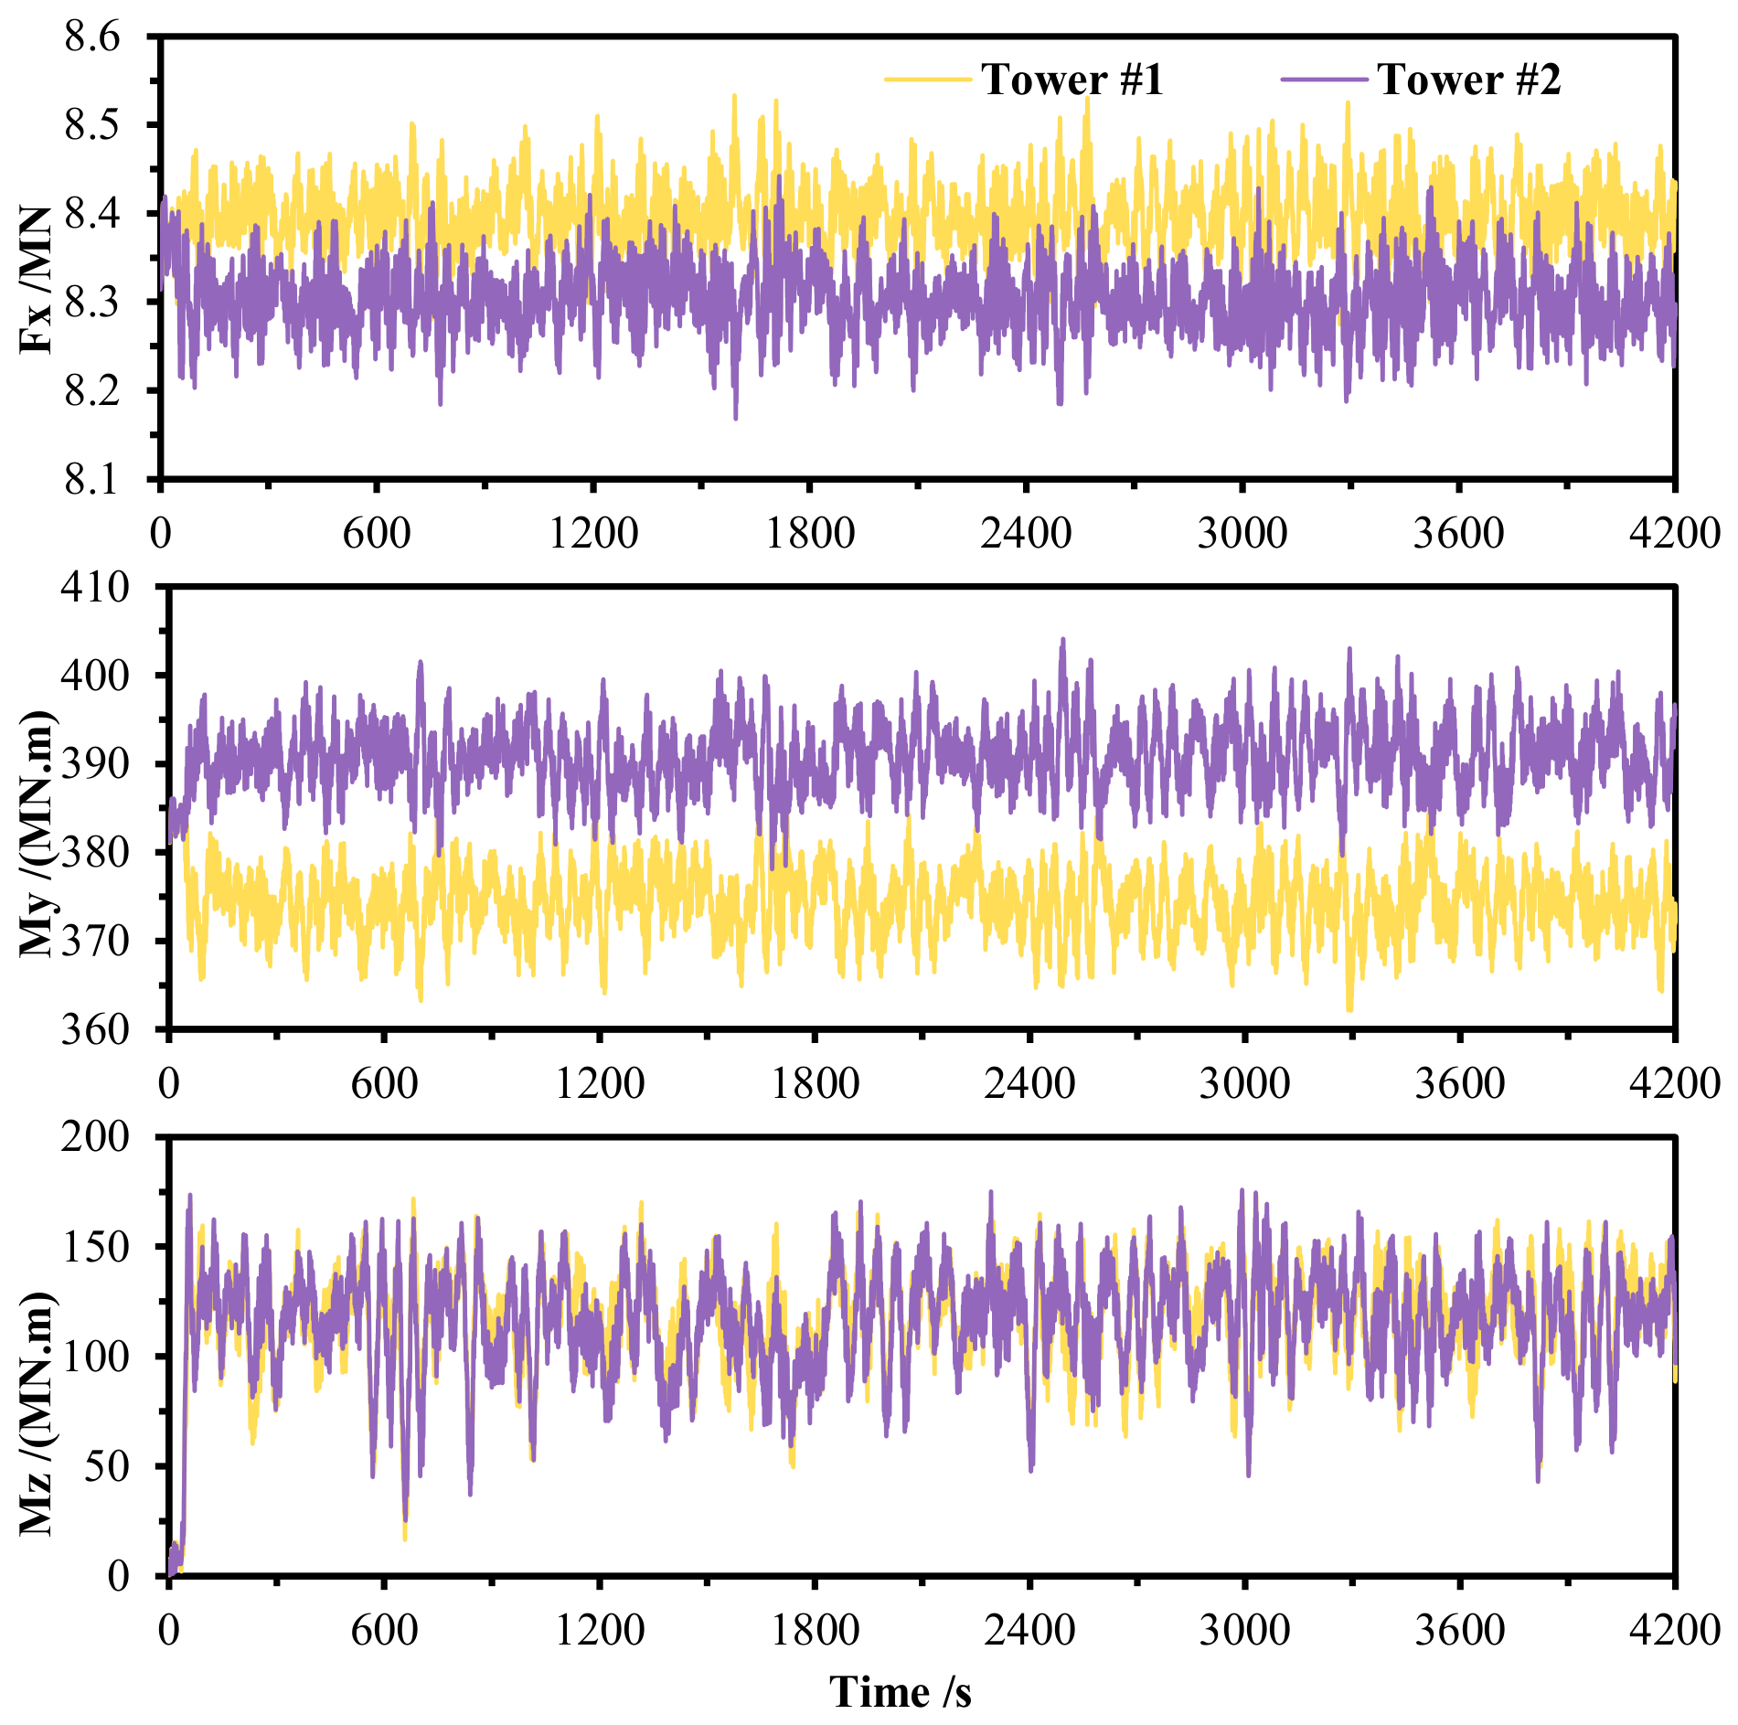
Figure 19 presents the axial forces and bending moments at a tower inclination angle of 35° under the wind speed of 11 m/s. It is observed that the axial forces of the two towers exhibit slight differences, with a relative error in average values of 1.1%. Due to the V-shape configuration, the pitching bending moments are opposite. The mean values are 374.4 MN·m and 390.9 MN·m for tower #1 and tower #2, respectively, corresponding to a relative difference of 4.2%. The bending moments about the local z-axis show a relative error of 1.4%. These discrepancies are primarily attributed to the motions of the OO-Star platform, which cause asymmetric dynamic coupling between the two towers and lead to deviations in the results.
Figure 19.
The tower-base load at a tower inclination of 35° under the wind speed of 11 m/s.
The two rotors rotate in the same direction under operational conditions. Consequently, the tangential aerodynamic forces acting on the blades are aligned in the same direction. As a result, the roll moments induced by the tangential aerodynamic forces are superimposed rather than canceled out, leading to a slight mean offset in the platform roll motion. This phenomenon further contributes to the asymmetric platform motion of the TwinFOWT model.
In addition, although the two wind turbines are arranged symmetrically in geometry, the turbulent wind fields generated using TurbSim are spatially varying stochastic wind fields based on the IEC Kaimal turbulence model. Therefore, the instantaneous inflow conditions experienced by the two rotors are not completely identical during the time-domain simulations. Combined with the coupled six-degree-of-freedom platform motions, these effects further amplify the transient asymmetric dynamic responses of the floating system.
Therefore, slight differences between the responses of Tower #1 and Tower #2 are physically reasonable for the fully coupled aero-hydro-servo-elastic analysis of the TwinFOWT model. The obtained relative differences, approximately 1.1% for axial force and 4.2% for pitch bending moment, remain relatively small compared with the overall load magnitudes.
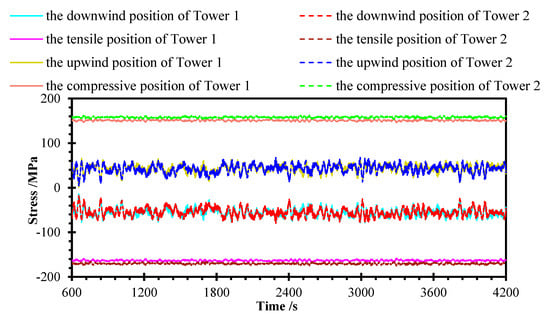
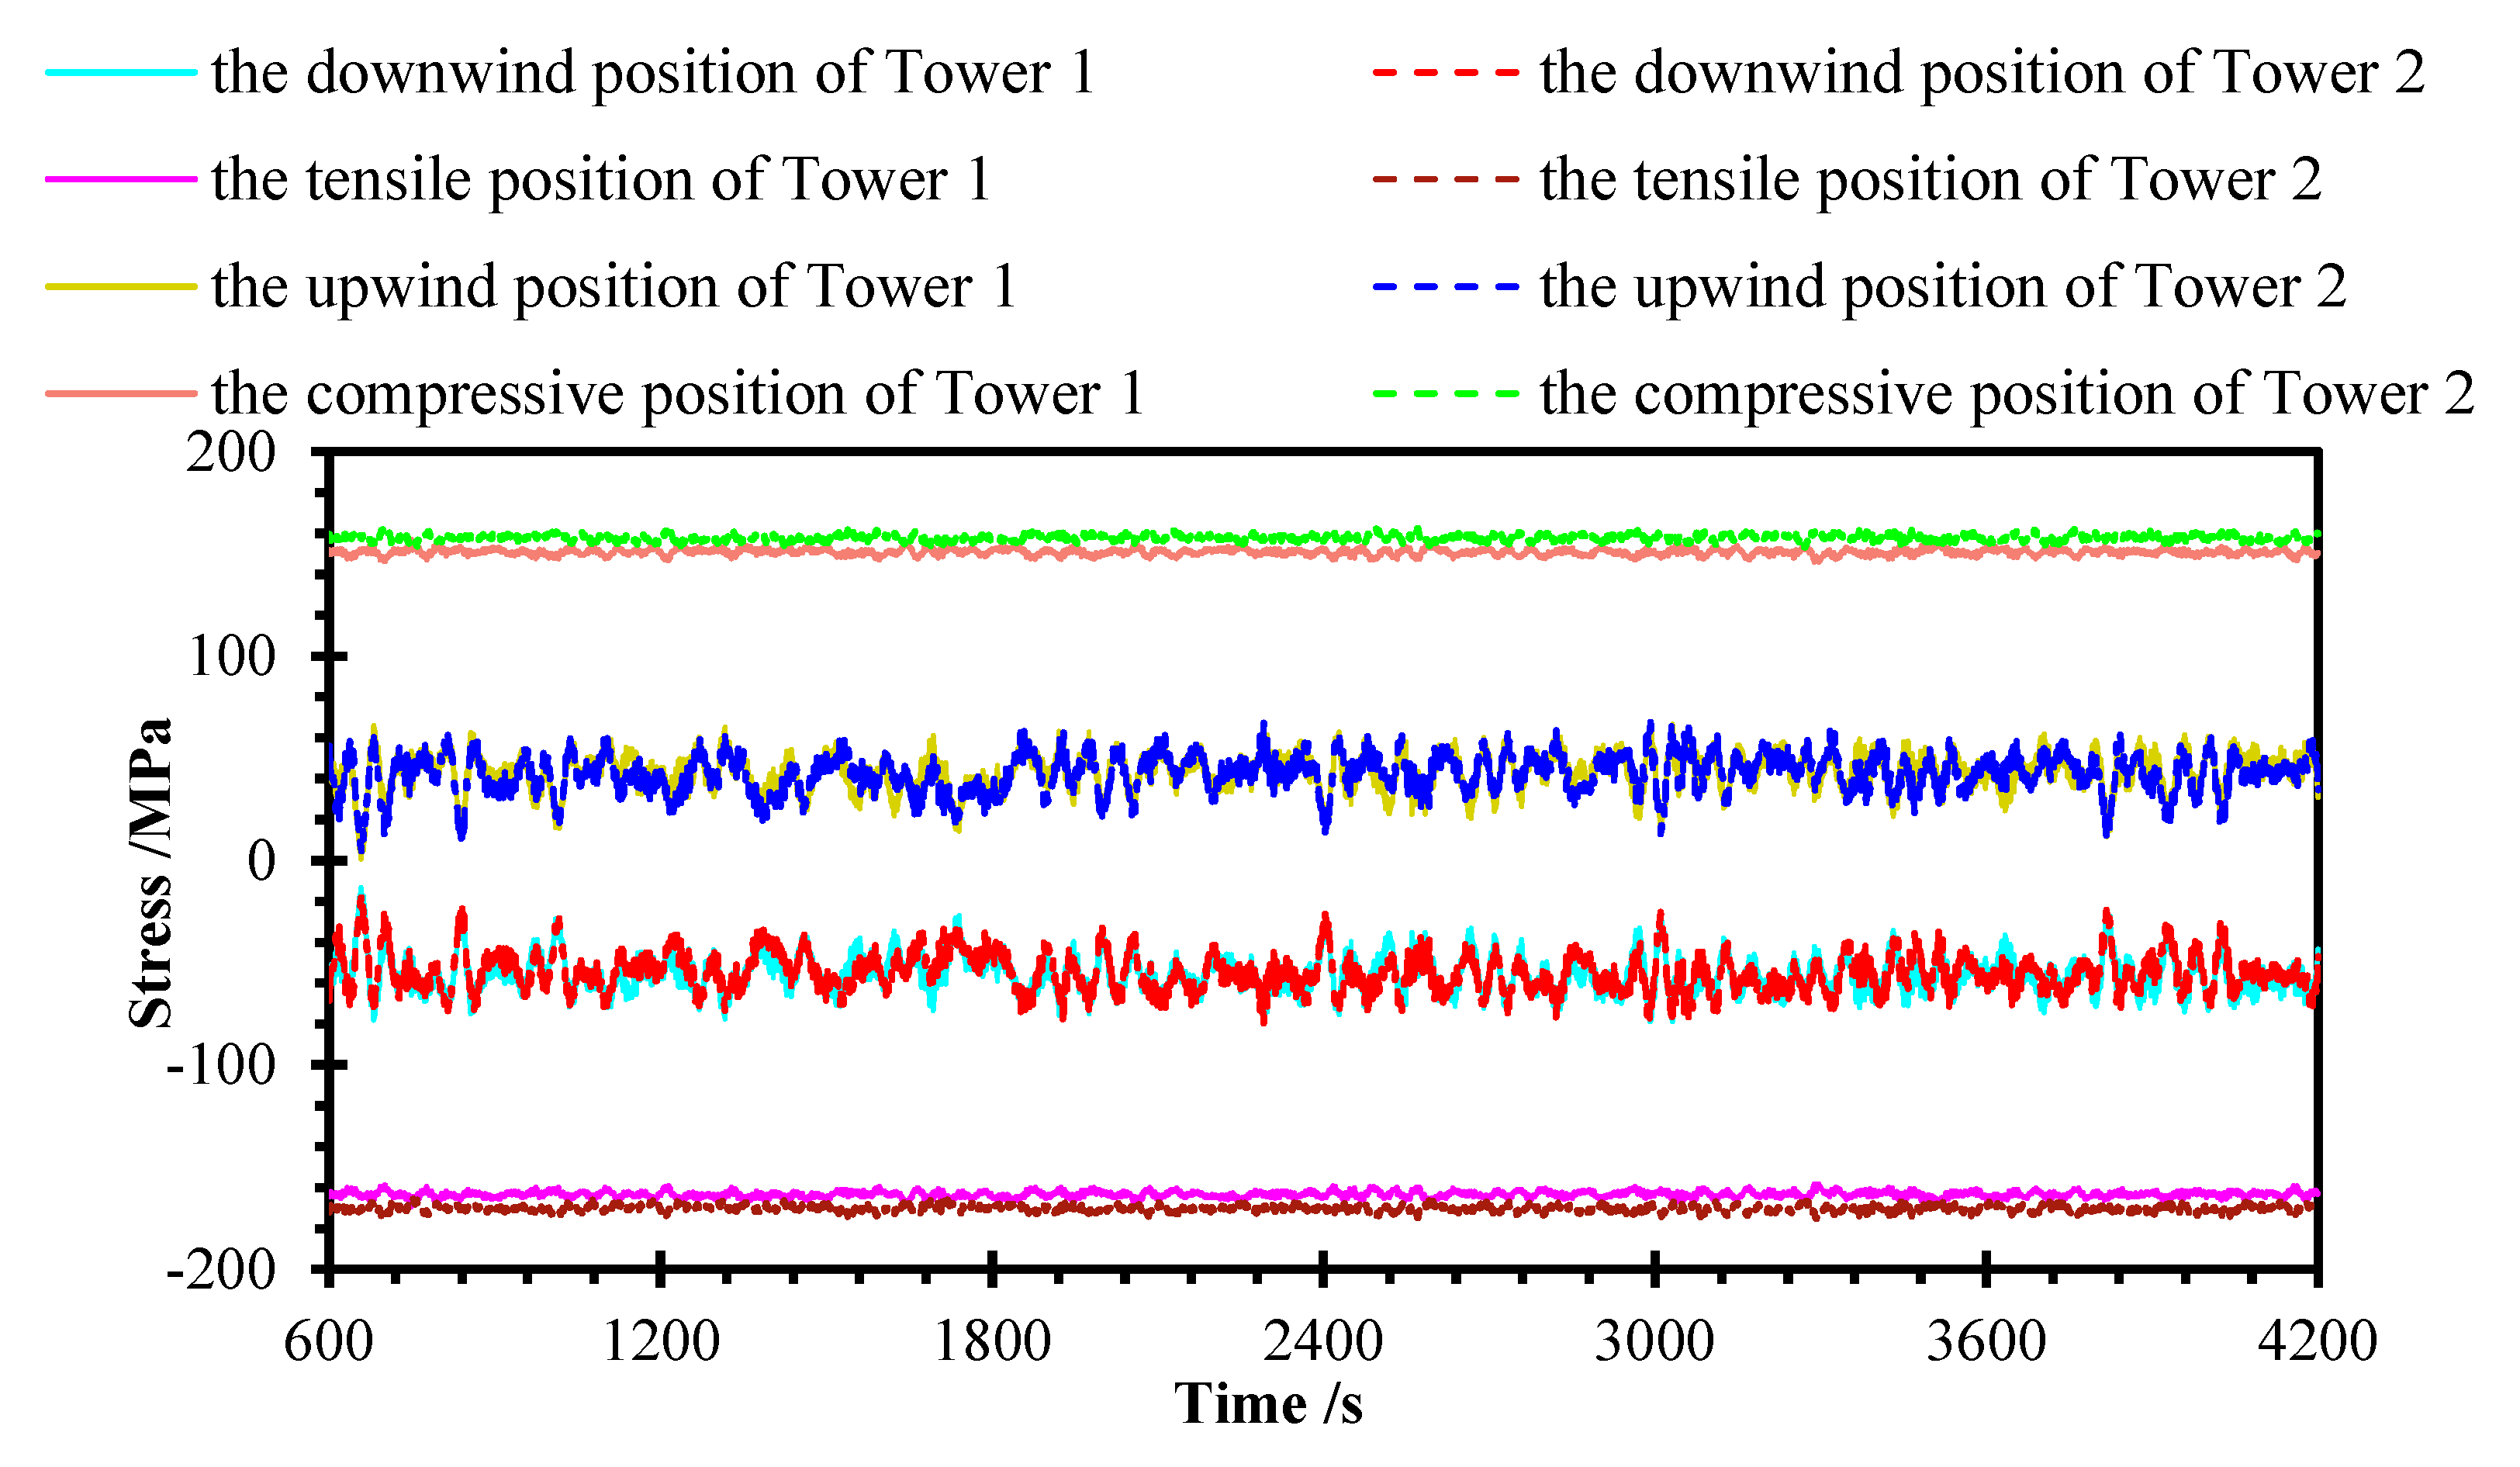
Based on Equations (3) and (4), the stress results at the positions of maximum tensile and compressive stress caused by tower inclination, as well as at the downwind and upwind positions, are presented in Figure 20 and Figure 21 for a tower inclination angle of 35°. For the TwinFOWT model analyzed under a 0° inflow wind condition, the labels in Figure 20 and Figure 21 refer to specific azimuth positions at the tower base. The upwind position (Point #7 in Figure 20) and downwind position (Point #1 in Figure 18) represent the windward and leeward wind vector intersections, while the tensile position (Point #4 in Figure 18) and compressive position (Point #10 in Figure 18) denote the maximum tensile and compressive deformation caused by tower inclination.
Figure 20.
Stress for towers 1 and 2.
Figure 21.
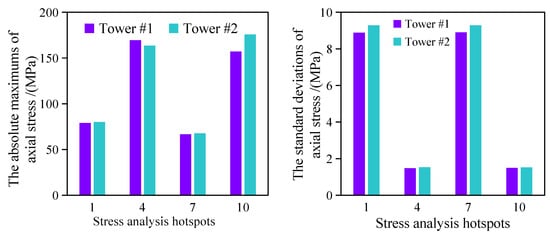
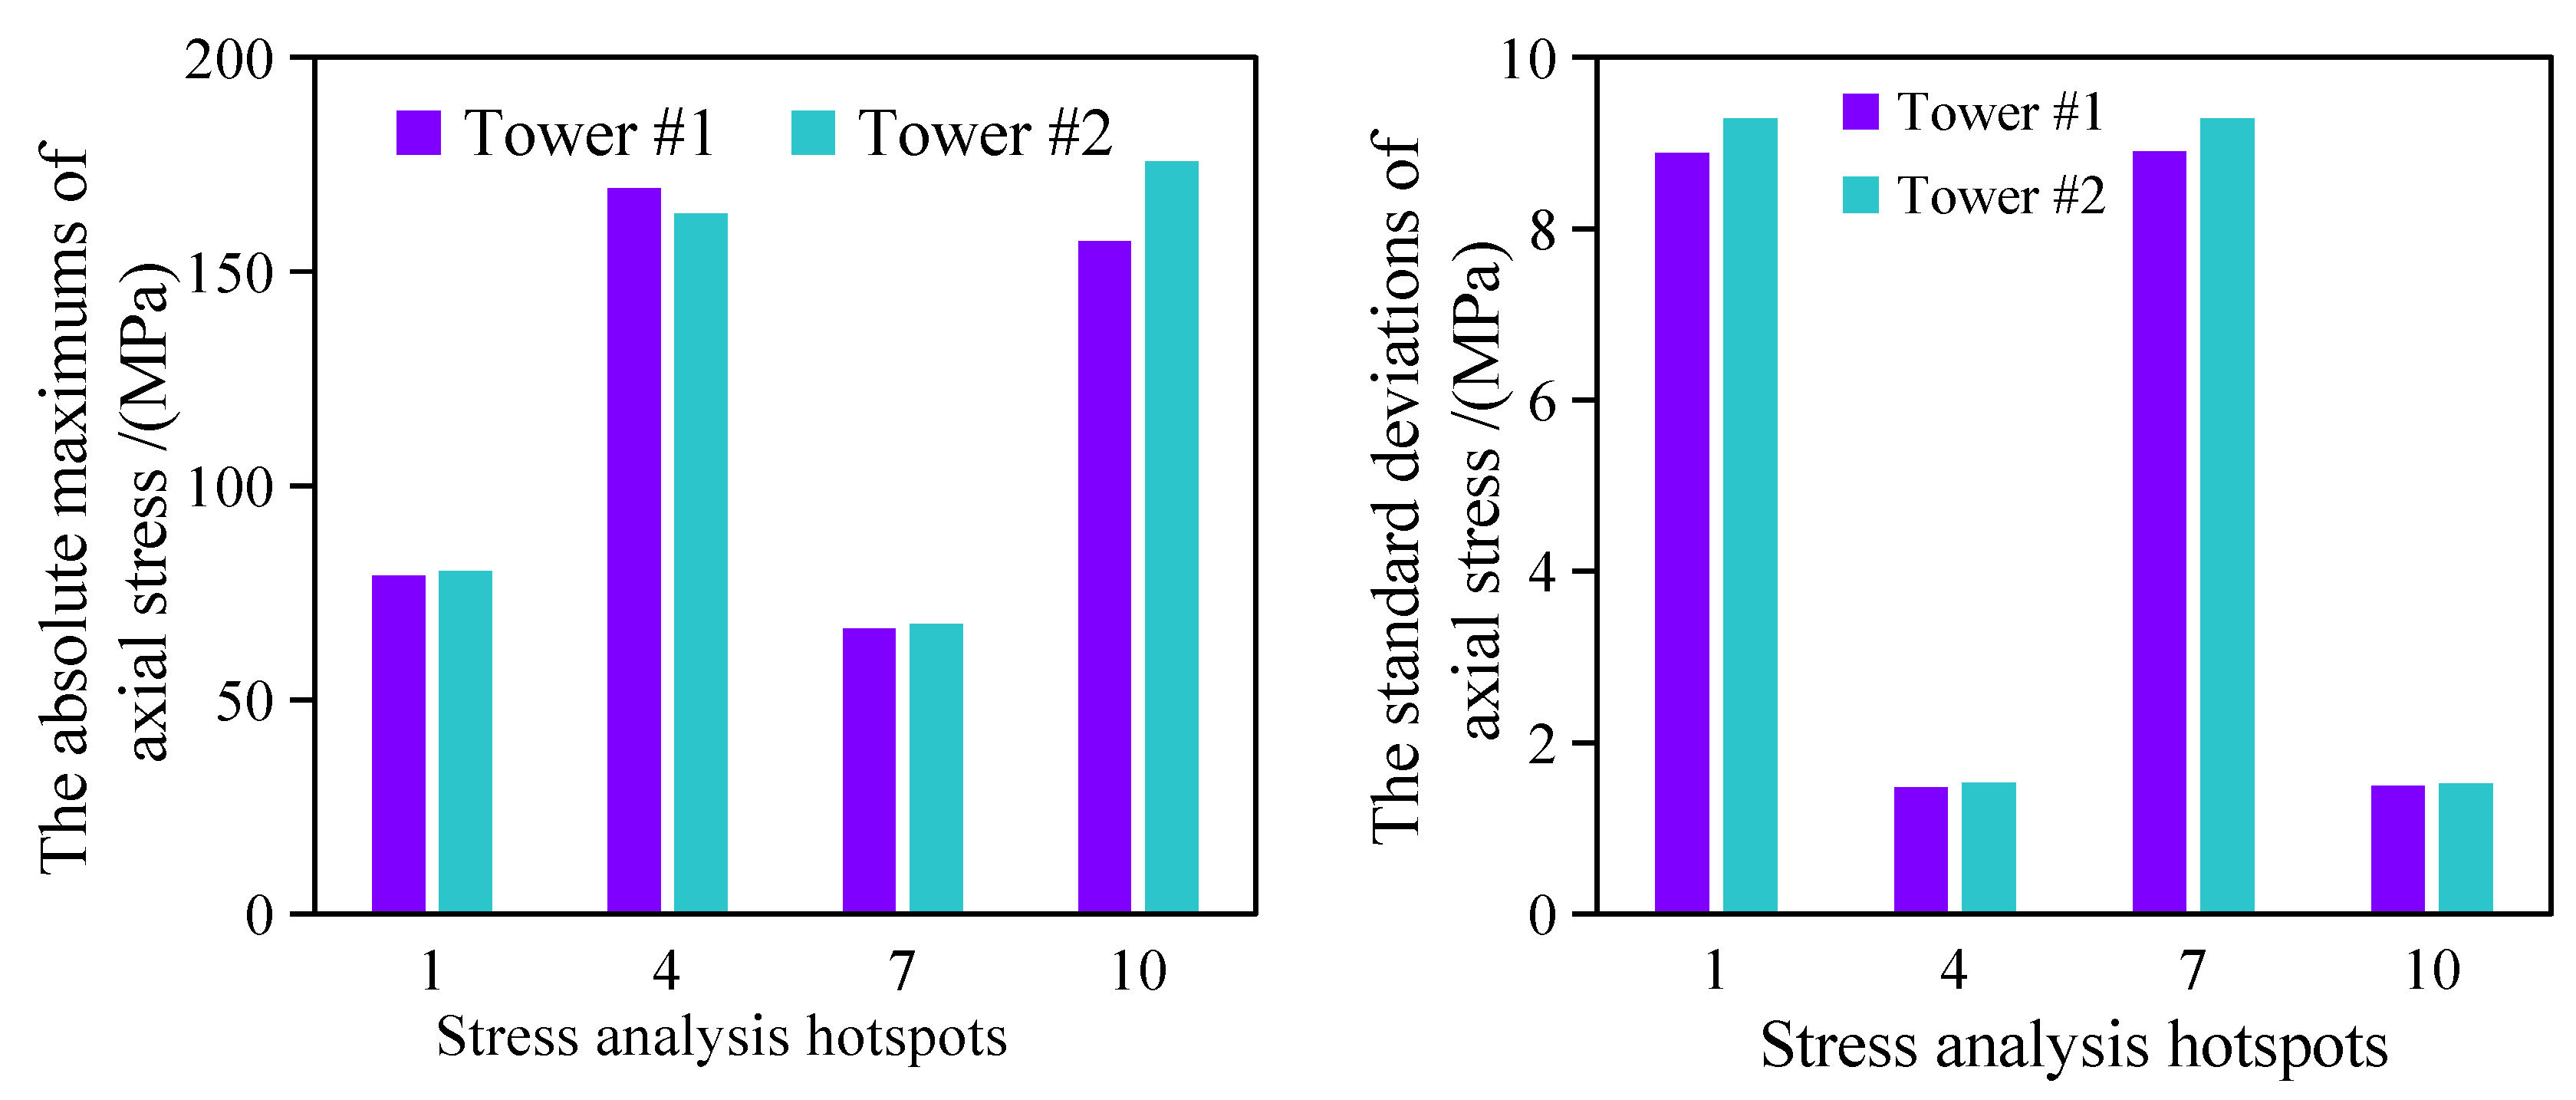
The statistical results of axial stress at a tower inclination of 35°.
It is demonstrated that locations for the maximum tensile and compressive deformation have more significant stress amplitudes with smaller fluctuations than the position in the windward direction, and the stress amplitudes at the maximum tensile stress position are greater than those at the compressive stress position. This is attributed to the weight of the tilted tower exerting tensile and compressive effects on the tower base. In the TwinFOWT model with tower inclination, the center of gravity of each tower no longer aligns with the vertical axis but instead shifts laterally in the global y-direction, and only the weight of the RNA itself causes the tensile and compressive effects around the position of the windward direction. Furthermore, the aerodynamic thrust is applied at the tower top aligned with the wind direction, generating cyclic bending moments at the position of the windward direction. These repeated bending cycles result in significant alternating tensile and compressive stresses at the tower base, making these positions exhibit significant stress fluctuations. It is observed that the stress of tower #1 is smaller than that of tower #2 at the position of maximum tensile and compressive deformation caused by tower inclination. This is because the lateral aerodynamic response is inverse to the inclination direction of the tower for the wind turbine #1, which leads to approximately 3.56% and 3.97% smaller stress compared to tower #2 in terms of the absolute maximum values.
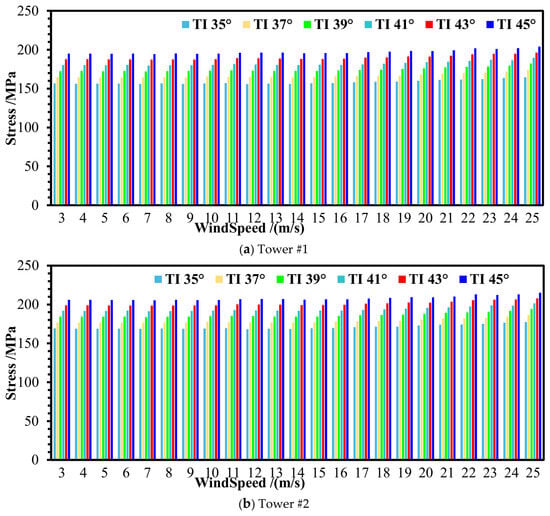
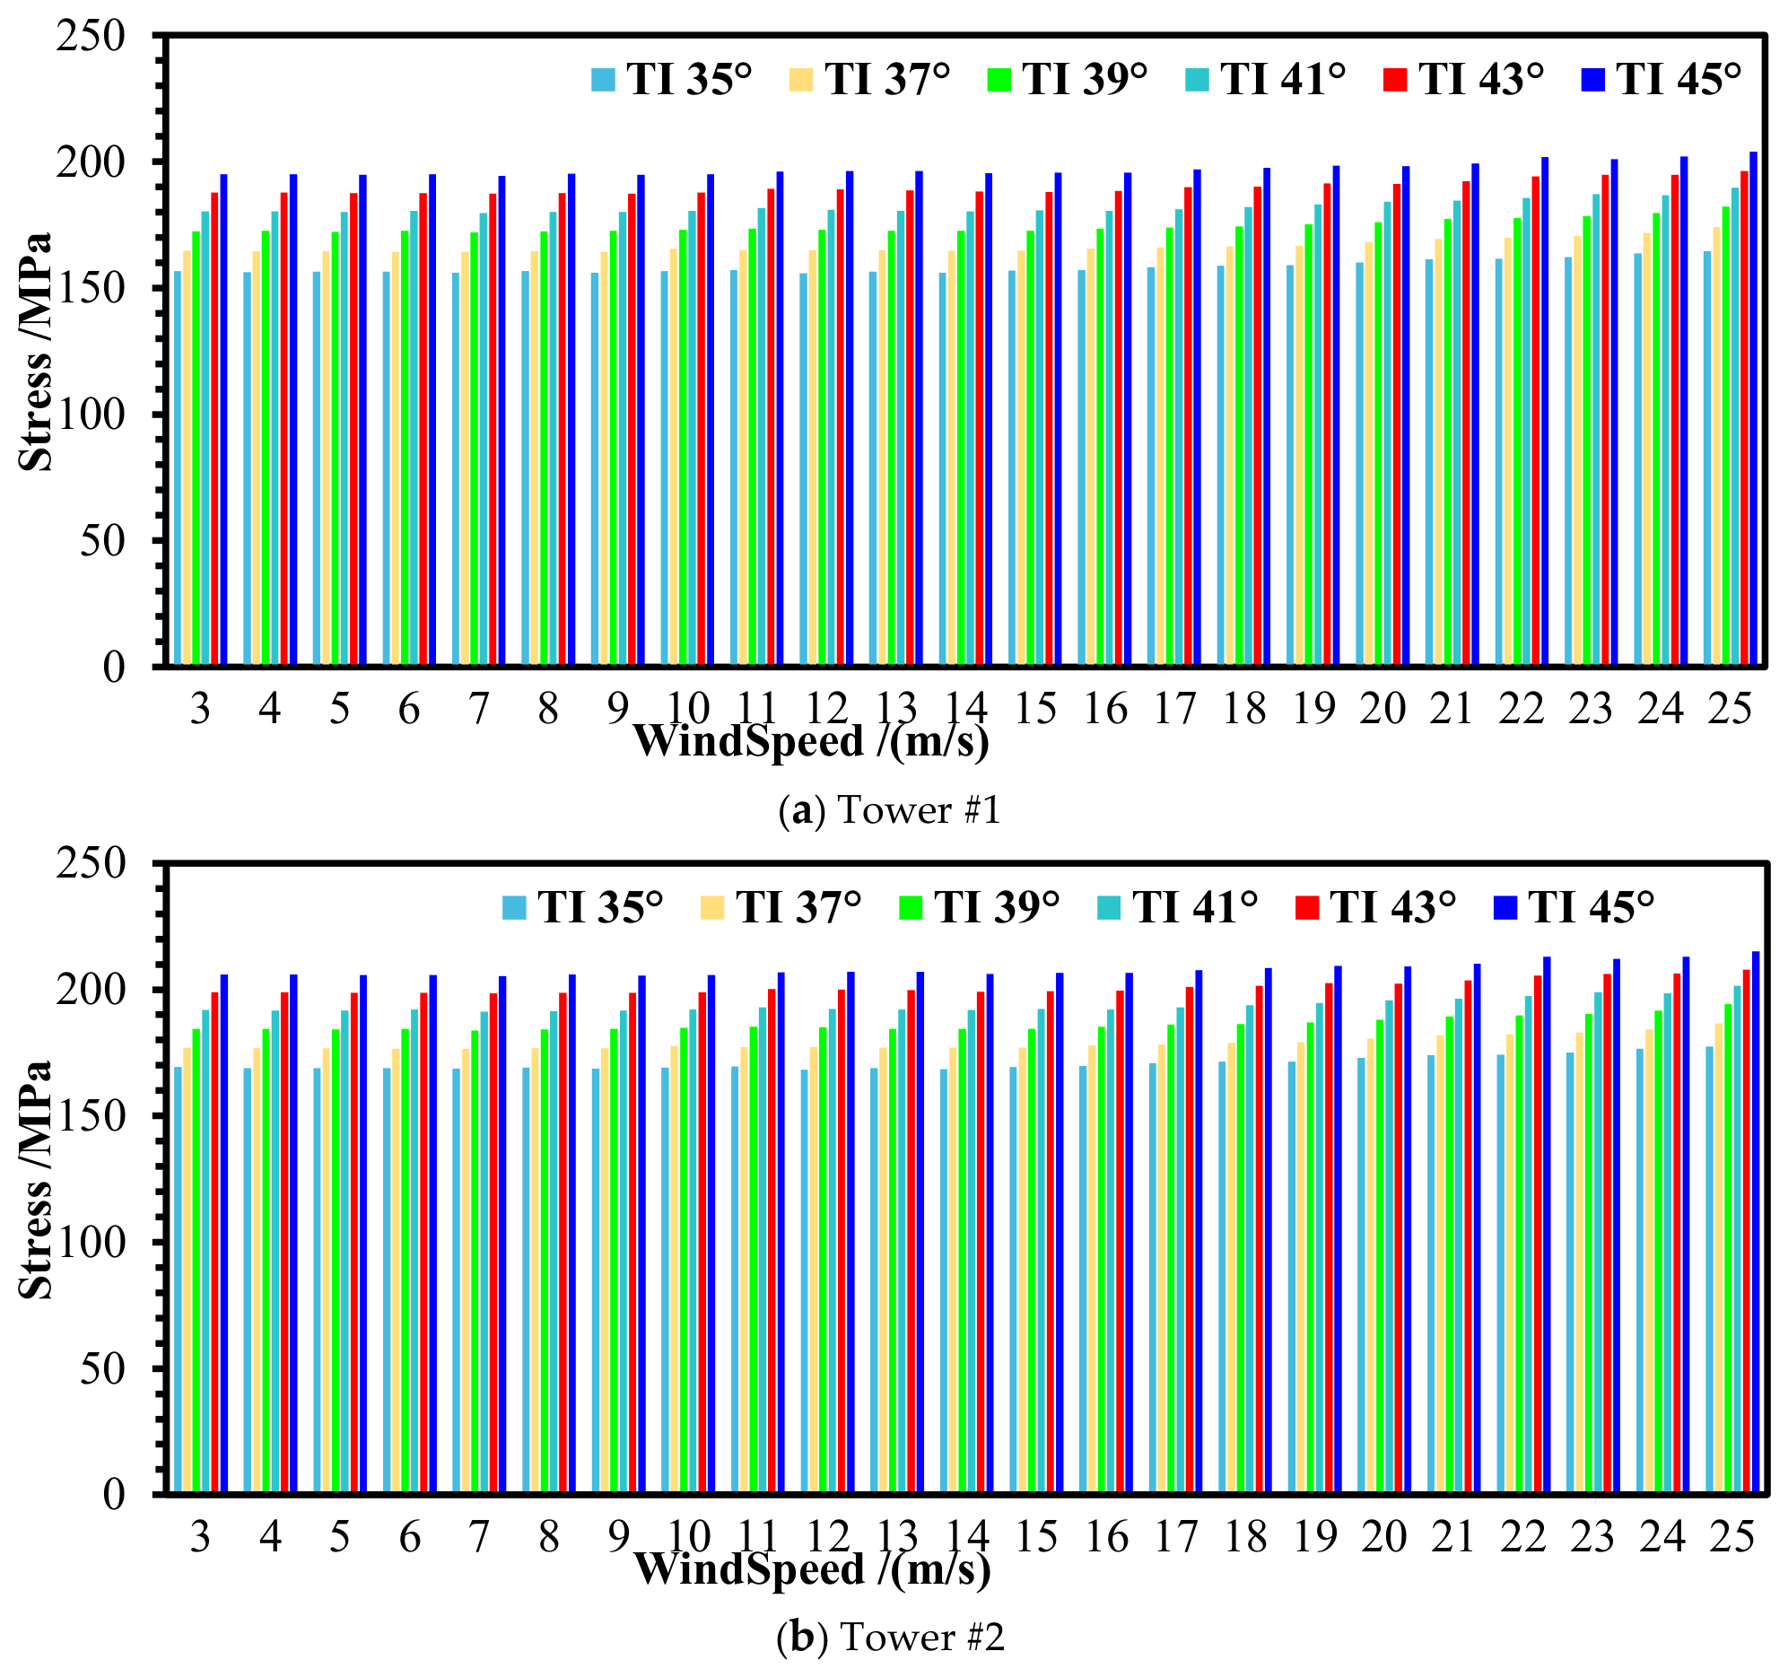
Figure 22 presents the absolute maximum stresses at the locations of maximum tensile stress (points #4 or #10) of the TwinFOWT models under operation states. The results indicate that the stress remains relatively stable for all operational states, where the tower-base stress remains largely insensitive to changes in wind speed, and the maximum stress at the locations of maximum tensile stress increases as the tower inclination angle increases, with a peak difference of up to 25.97%. The overturning moment induced by gravity becomes significantly larger as the tower inclination angle increases, resulting in an increased bending moment at the tower base and subsequently higher tensile stresses at the critical points. The dominant stress at the locations of maximum tensile stress arises from the constant gravity-induced bending moment associated with the inclined tower geometry, rather than from aerodynamic loads. The dynamic effects of aerodynamic thrust are mitigated by the OO-Star platform motion and further regulated by the active blade-pitch control system.
Figure 22.
The absolute maximum stress at the locations of maximum tensile stress (point #4 or #10).
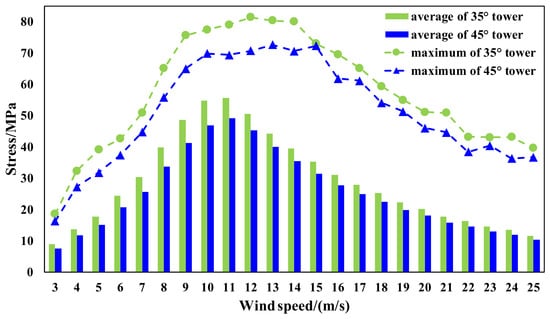
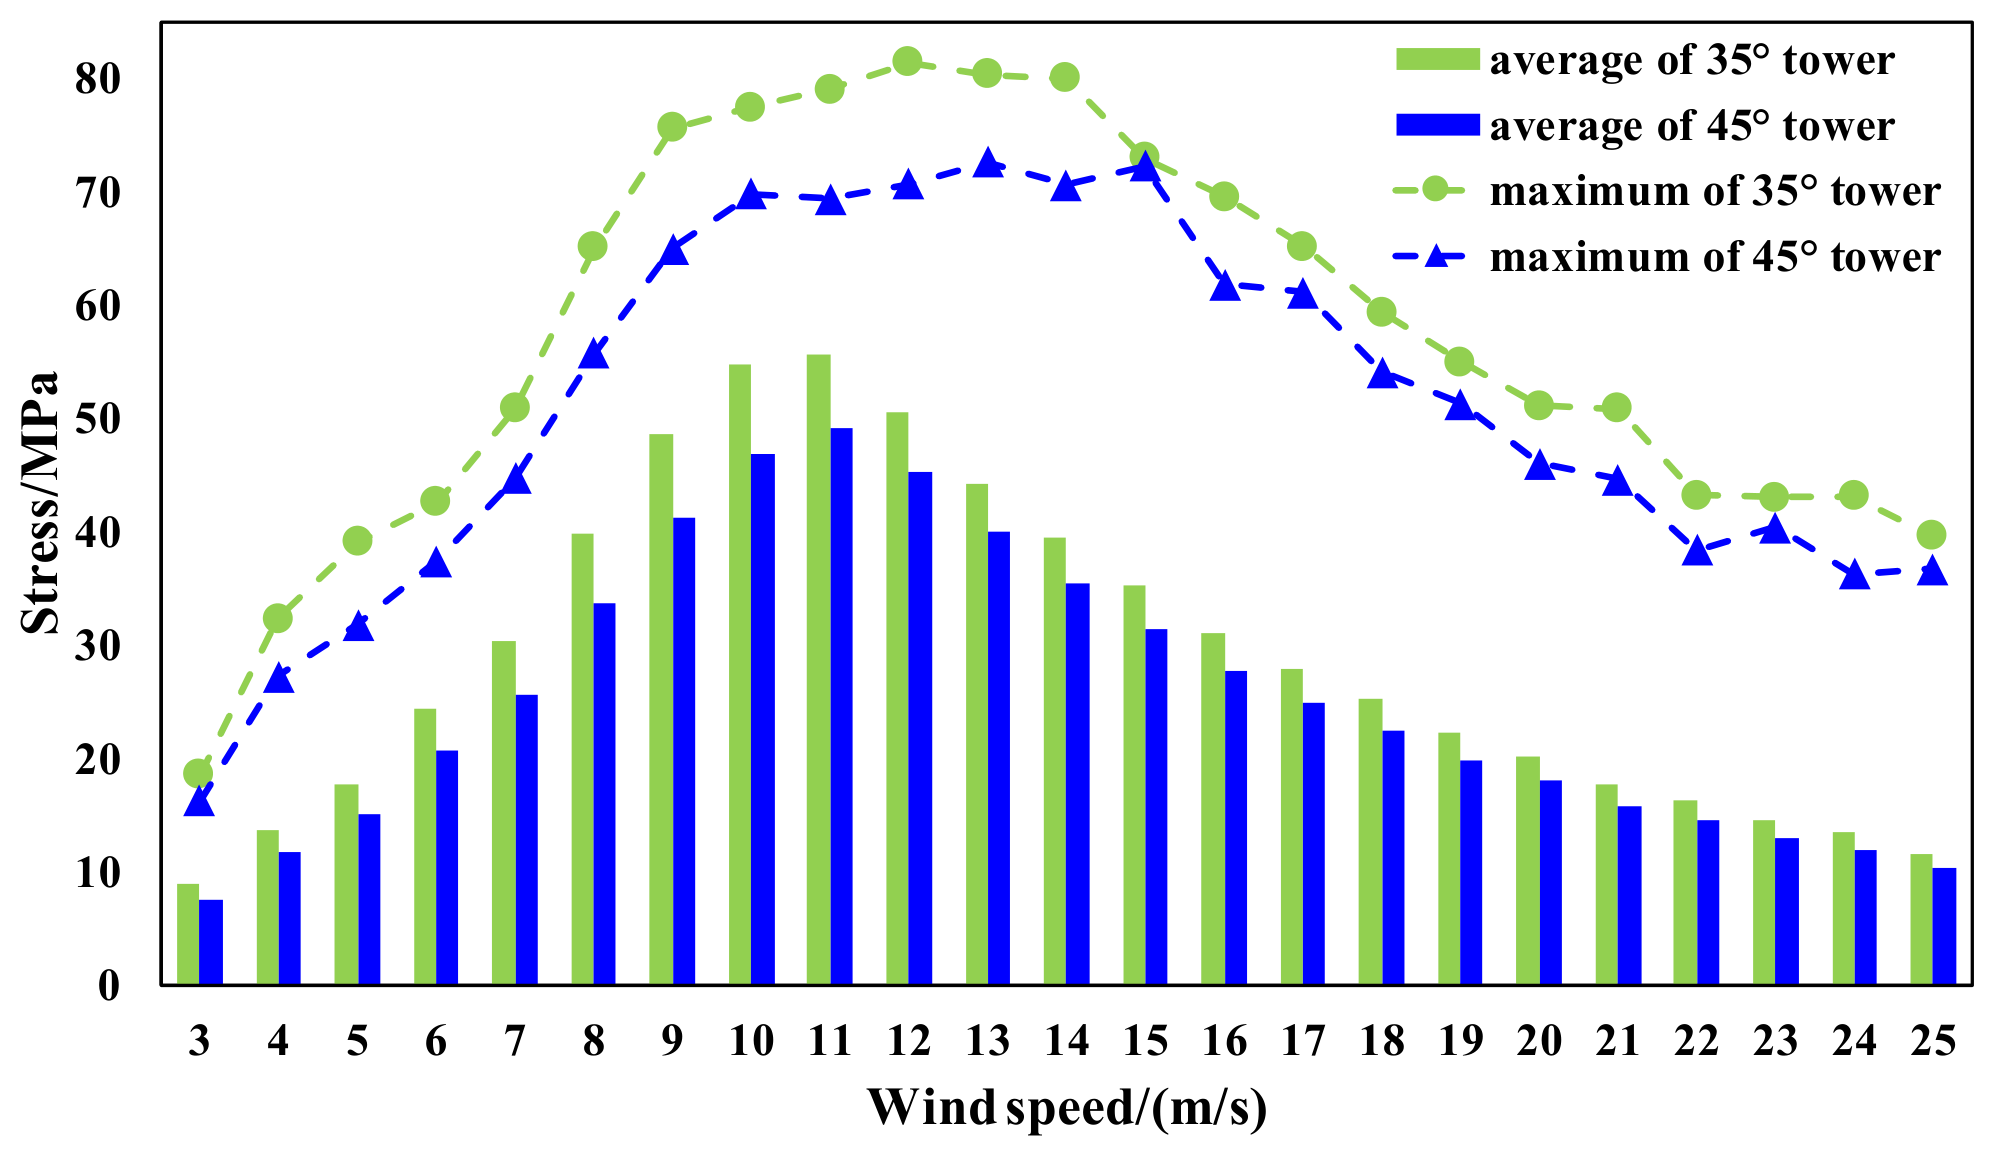
Figure 23 compares the average and maximum tower-base stresses at point #1 between the 35° and 45° tower inclination cases. The results indicate that both the average stress and the stress amplitude are greater in the 35° case than in the 45° case. At a wind speed of 11 m/s, the average and maximum stresses in the 35° and 45° tower inclination cases differ by 11.47% and 12.20%, respectively. Point #1 is located on the upwind side of the tower base and is more strongly affected by the dynamic responses of the TwinFOWT, resulting in greater fatigue damage. In contrast, although the stresses at points #4 and #10 discussed above are higher, they are primarily influenced by the tower’s own weight and exhibit very small fluctuations. Therefore, their contributions to fatigue damage are relatively limited.
Figure 23.
Comparison of average and maximum tower-base stresses at point #1.
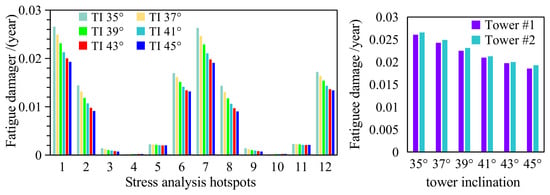
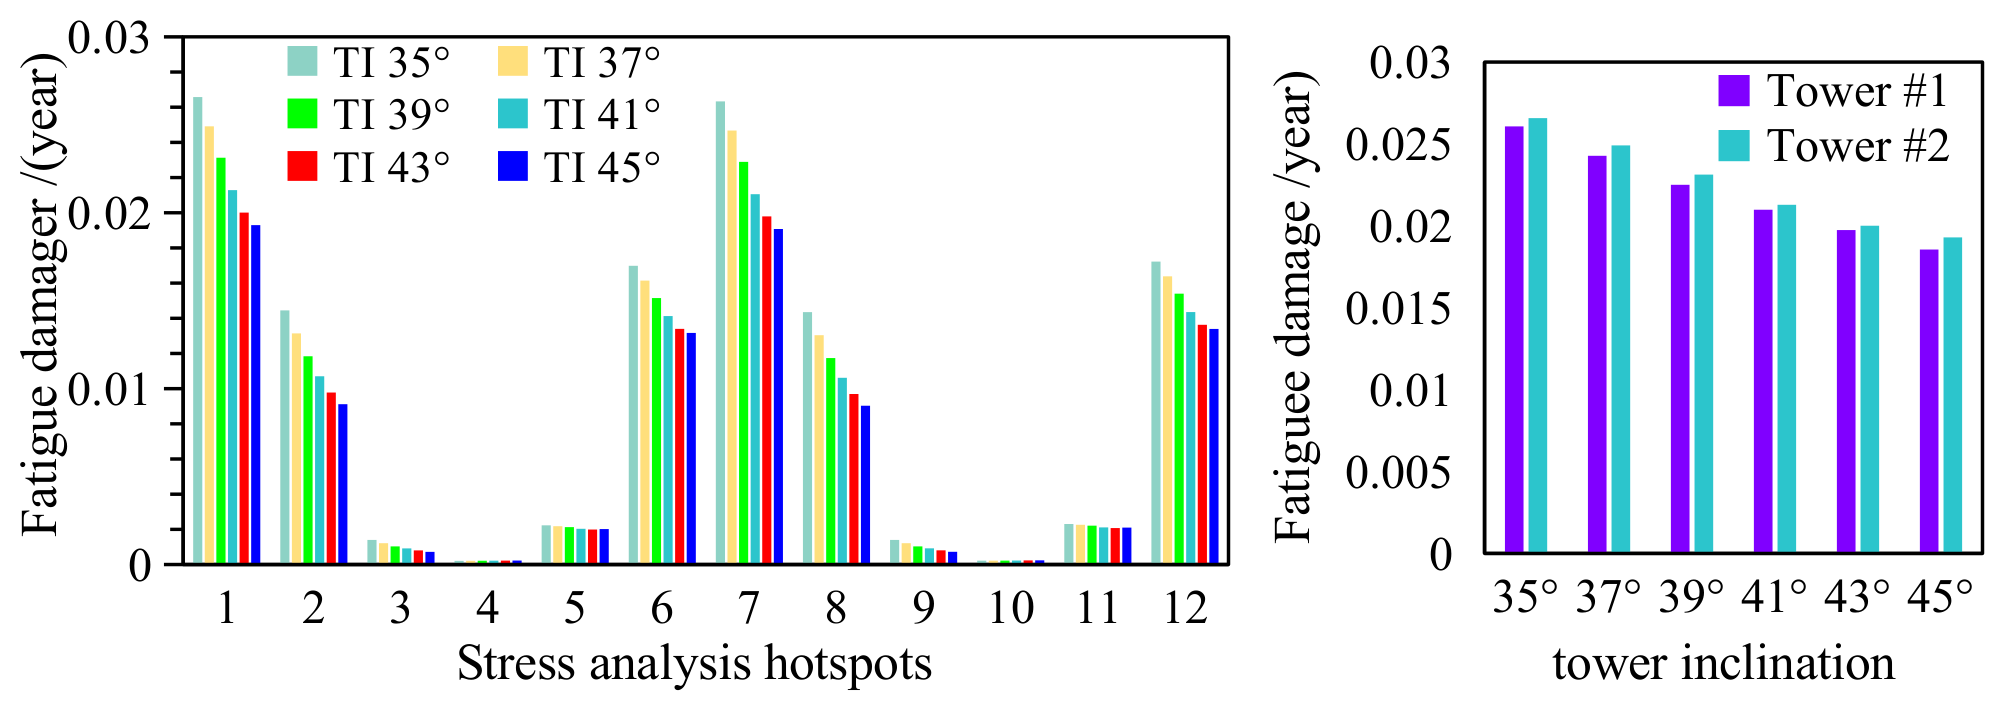
Figure 24 displays the fatigue damage at the different hotpot locations calculated using (5) and (6). The observation indicates that the fatigue damage is mitigated with increasing tower inclination angles; meanwhile, the maximum reduction is up to 28.84%. The hub height decreases as the tower inclination angle increases, which shortens the vertical interval between the rotor thrust line. The reduced pitch motion and rotor thrust of the TwinFOWT lead to lower tower-base shear forces and bending moments. Consequently, the fatigue damage at points #1 and #7 tends to decrease as the tower inclination angle increases. It is observed that the fatigue damage of the tower #2 is slightly significant than the tower #1, which the fatigue damage difference is 1.89% of the initial design with a tower inclination of 35° and 3.86% at the 45° tower inclination. Although these results indicate that increasing the tower inclination angle reduces fatigue damage at the tower base, this conclusion requires further substantiation through ultimate strength and buckling analyses under extreme parked conditions.
Figure 24.
Fatigue damage of different TwinFOWT models at different hotpots.
6.3. Effect on the Power Production
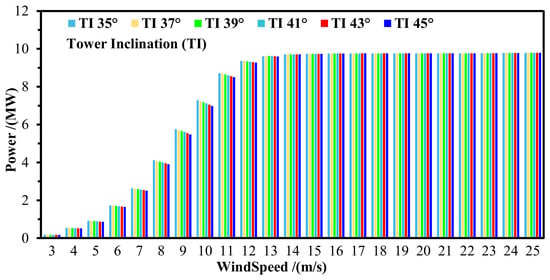
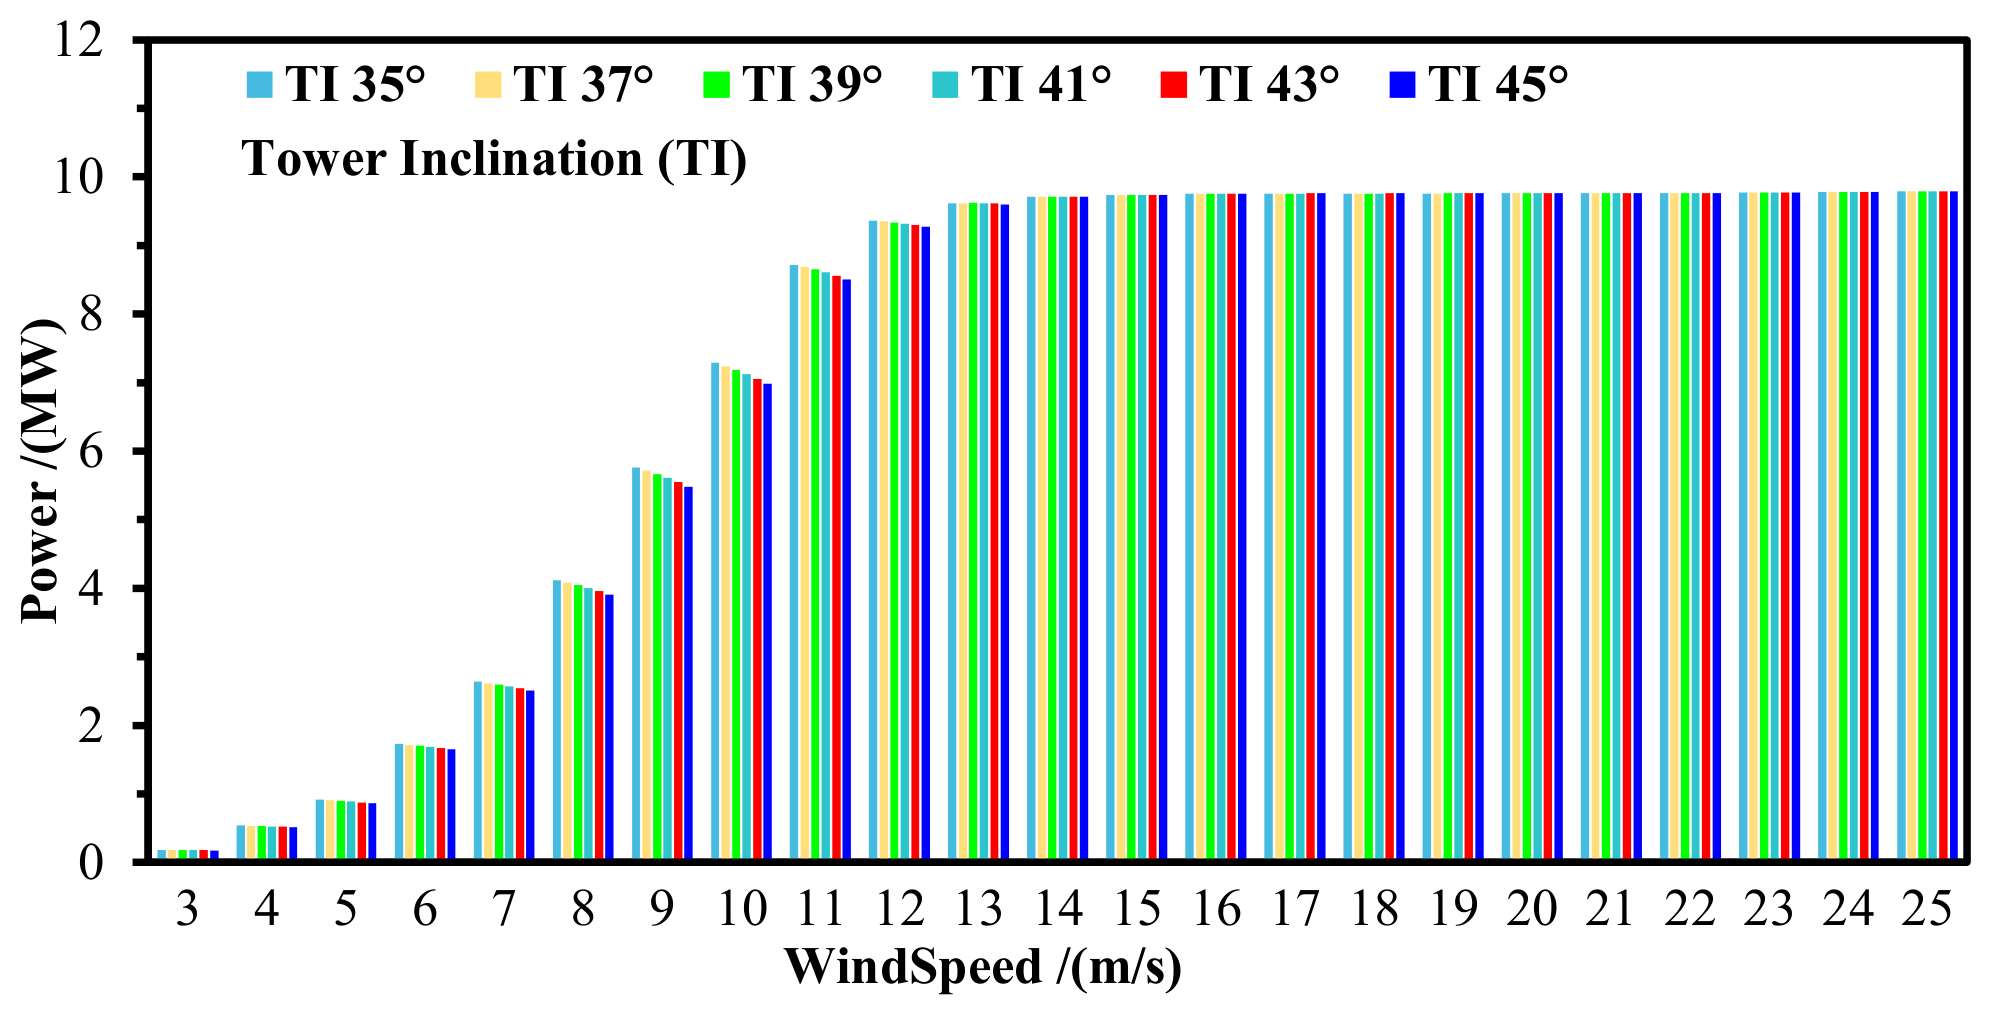
Figure 25 presents the power production statistics of the TwinFOWT model under operational states for different tower inclination angles. It can be observed that a larger tower inclination angle results in relatively lower average power production under below-rated wind conditions, while the influence of tower inclination is insignificant for over-rated conditions. The above observation is mainly because the hub height is lower at larger tower inclination angles, resulting in a lower average inflow wind speed. The blade pitch control strategy is activated to ensure overall safe operation under above-rated wind conditions. Thereafter, all the examined TwinFOWT models maintain a stable average power production regardless of changes in tower inclination angle.
Figure 25.
Statistics of the mean output power.
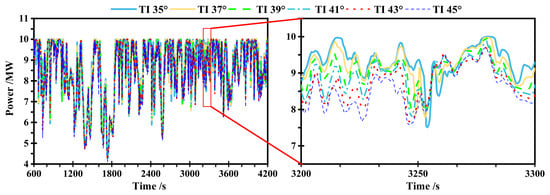
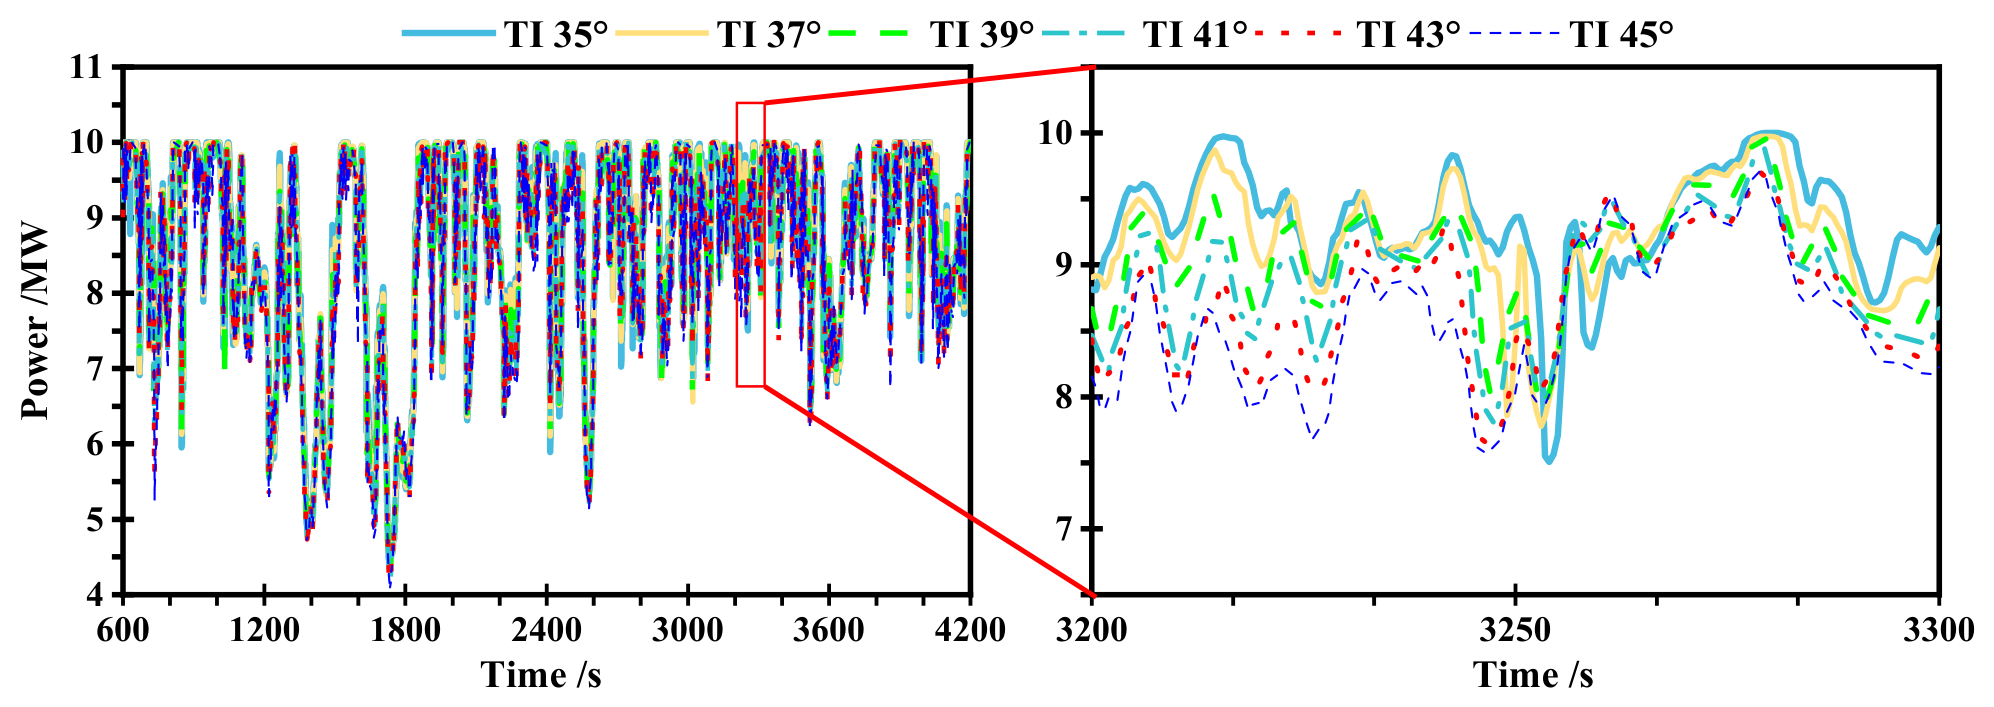
Under a wind speed of 11 m/s, the output power of the TwinFOWT model at different tower inclination angles is illustrated in Figure 26. The obtained data show that the mean power production capacity slightly decreased as the tower inclination angle increases. The average power production drops to 9.01 MW at 45° tower inclination, which is approximately 2.44% less than that of the initial design with a tower inclination of 35°.
Figure 26.
The output power of TwinFOWT under the 11 m/s wind speed.
Under below-rated conditions, the aerodynamic power capture is strongly dependent on the inflow wind speed. As the tower inclination angle increases from 35° to 45°, the hub height decreases from 123.37 m to 109.84 m, which slightly reduces the mean inflow wind speed according to the IEC wind shear profile. Consequently, the average power production decreases marginally for the larger inclination-angle models. For example, at the wind speed of 11 m/s, the average power output of the 45° model is approximately 2.44% lower than that of the 35° model.
The annual power production of each model is calculated using Equation (7), considering the possibility of each load case.
where Eannual is the lifetime energy production; p(vi) denotes the mean power production at the tower base under the specific wind speed bin vi; ηi represents the occurrence probability of the corresponding wind speed scenario.
Table 5 presents the annual energy production and the fatigue damage of different TwinFOWT models. The average energy was calculated as the probability-weighted sum of the mean power over all load cases, thereby enabling rigorous calculation of the annual power. It can be observed that the differences in annual average energy generation among the models are negligible. For example, the annual energy production is 59,673.51 MW·h for the 35° tower configuration and 58,791.64 MW·h for the 45° configuration, representing a difference of 1.48% relative to their mean. The annual fatigue damage is taken as the maximum value among all evaluated hotspots. In contrast to the reduction in annual energy production, the fatigue damage decreases by 27.39% as the tower inclination angle increases. This result suggests that, under the idealized assumption that no other components fail and that the service life is governed solely by the evaluated fatigue damage, the TwinFOWT with a 45° tower inclination may achieve a higher lifetime energy production.
7. Conclusions and Future Works
The research has analyzed the influence of tower inclination angles on the TwinFOWT model, comprising two NREL 5 MW wind turbines mounted on the OO-Star platform. The SESAM software package is adopted to investigate the fully coupled dynamic behaviors of the TwinFOWT model. The dynamic responses and fatigue damage of the TwinFOWT subjected to various environmental loadings are simulated with six different tower inclination angles under both operational and parked states of the wind turbine. The predominant findings are summarized below:
- (1)
- The output power of the TwinFOWT model is closely related to both the inclination angle of the tower and wind velocity. The average power production of the TwinFOWT reduces as the tower inclination angle increases under a below-rated wind speed condition.
- (2)
- With an increase in tower inclination, the platform pitch motion of the TwinFOWT model will be reduced due to the loss of overturning bending moment caused by the decrease in hub height. The maximum pitch of the 35° tower inclination TwinFOWT model is 32.73% higher than that of the 45° inclination model under the wind speed of 10 m/s. Meanwhile, the trend of platform yaw with the tower inclination is inverse to pitch motions, due to the interval between the aerodynamic load center and the system’s torsional axis. The maximum yaw motion increases by 58.58%, reaching 11.1° in the TwinFOWT model with a tower inclination angle of 45°, compared with the 35° model.
- (3)
- The load at the tower base at the positions of peak tensile and compressive deformation caused by tower inclination remains relatively stable across operational states. The tower-base stress remains largely insensitive to changes in wind speed, and the maximum stress at the locations of maximum tensile increases as the tower inclination angle increases, with a peak difference up to 25.97%.
- (4)
- The tower base fatigue at the downwind locations decreases with the increase of tower inclination, with a maximum reduction of 28.84%. A slight difference is observed between the tower-base fatigue damage for the two wind turbines with the same rotational direction, since the lateral aerodynamic force of wind turbine #1 produces a bending moment against the gravitational load at the tower base.
This study mainly investigates the relationship between the fully coupled dynamic responses of the TwinFOWT and tower fatigue. However, some limitations still exist. In future work, higher-fidelity aerodynamic models can be employed to capture the aerodynamic coupling effects between the two rotors, and cooperative control can be used to improve the dynamic response. Furthermore, a comprehensive fatigue strength assessment of the TwinFOWT tower and platform structures can be conducted. Furthermore, the effects of yawed inflow conditions on the dynamic responses of TwinFOWT also deserve further investigation.
Author Contributions
Conceptualization, S.L. and Y.Y.; methodology, C.H.; software, C.H.; validation, J.H., X.L. and C.H; formal analysis, S.L.; investigation, S.L. and C.H.; resources, Y.Y.; data curation, Q.L.; writing—original draft preparation, S.L. and C.H.; writing—review and editing, Q.L., Y.Y. and M.B.; visualization, C.H.; supervision, Y.Y. and M.B.; project administration, Y.Y.; funding acquisition, S.L. and Y.Y. All authors have read and agreed to the published version of the manuscript.
Funding
The authors are grateful for the financial support from the National Natural Science Foundation of China (Grant No.: 52409163, 52476205), Key R&D Program of Ningbo (2025Z023), National “111” Center on Safety and Intelligent Operation of Sea Bridge (D21013).
Data Availability Statement
The data that support the findings of this study are available from the corresponding author upon reasonable request. Due to the large volume of simulation data and the use of commercial software, the datasets are not publicly available but can be shared for academic research purposes.
Conflicts of Interest
Authorshuai Li and Jungang Hao were employed by the China Renewable Energy Engineering Institute; Xintong Luan was employed by the Shanghai Investigation, Design & Research Institute Co., Ltd. The remaining authors declare that the research was conducted in the absence of any commercial or financial relationships that could be construed as a potential conflict of interest.
References
- Global Wind Energy Council. Global Wind Report 2025; Global Wind Energy Council: Lisbon, Portugal, 2025. [Google Scholar]
- Amlashi, H.; Baniotopoulos, C. A probabilistic approach for the levelized cost of energy of floating offshore wind farms. Discov. Energy 2024, 4, 15. [Google Scholar] [CrossRef] [Scilit]
- Pham, T.Q.M.; Im, S.; Choung, J. Prospects and economics of offshore wind turbine systems. J. Ocean Eng. Technol. 2021, 35, 382–392. [Google Scholar] [CrossRef] [Scilit]
- Bak, C.; Zahle, F.; Bitsche, R.; Kim, T.; Yde, A.; Henriksen, L.C.; Natarajan, A.; Hansen, M. Description of the DTU 10 MW Reference Wind Turbine (DTU Wind Energy Report-I-0092); Technical University of Denmark: Kongens Lyngby, Denmark, 2013. [Google Scholar]
- Bortolotti, P.; Dykes, K.; Merz, K.; Sethuraman, L.; Zahle, F. IEA Wind Task 37 on System Engineering in Wind Energy, WP2–Reference Wind Turbines (NREL/TP-73492); National Renewable Energy Laboratory (NREL): Golden, CO, USA, 2019. [Google Scholar]
- Allen, C.; Viscelli, A.; Dagher, H.; Goupee, A.; Gaertner, E.; Abbas, N.; Hall, M.; Barter, G. Definition of the UMaine VolturnUS-S Reference Platform Developed for the IEA Wind 15-Megawatt Offshore Reference Wind Turbine (No. NREL/TP-5000-76773); National Renewable Energy Laboratory (NREL): Golden, CO, USA, 2020. [Google Scholar]
- Zahle, F.; Barlas, T.; Lonbaek, K.; Bortolotti, P.; Zalkind, D.; Wang, L.; Labuschagne, C.; Sethuraman, L.; Barter, G. Definition of the IEA Wind 22-Megawatt Offshore Reference Wind Turbine (No. NREL/TP-5000-88593); National Renewable Energy Laboratory (NREL): Golden, CO, USA, 2024. [Google Scholar]
- Liu, Y.; Hu, C.; Sueyoshi, M.; Yoshida, S.; Iwashita, H.; Kashiwagi, M. Motion response characteristics of a Kyushu-University semi-submersible floating wind turbine with trussed slender structures: Experiment vs. numerical simulation. Ocean Eng. 2021, 232, 109078. [Google Scholar] [CrossRef] [Scilit]
- Moghadassian, B.; Rosenberg, A.; Sharma, A. Numerical investigation of aerodynamic performance and loads of a novel dual rotor wind turbine. Energies 2016, 9, 571. [Google Scholar] [CrossRef] [Scilit]
- Sundararaju, H.; Lo, K.H.; Metcalfe, R.; Wang, S.S. Aerodynamics and CFD analysis of equal size dual-rotor wind turbine. J. Renew. Sustain. Energy 2017, 9, 043303. [Google Scholar] [CrossRef] [Scilit]
- Wu, X.D.; Lu, W.H.; Wang, K.; Hu, W.F.; Fang, J.H.; Zha, R.S. Numerical study on aerodynamic performance of floating dual-rotor wind turbines in heave and surge motions. China Ocean Eng. 2023, 37, 1011–1021. [Google Scholar] [CrossRef] [Scilit]
- Wang, K.; Liu, T.; Wan, Y.; Ong, M.C.; Wu, T. Numerical investigation on aerodynamic characteristics of dual-rotor wind turbines. J. Mar. Sci. Eng. 2022, 10, 1887. [Google Scholar] [CrossRef] [Scilit]
- Saulescu, R.; Neagoe, M.; Jaliu, C.; Munteanu, O. A comparative performance analysis of counter-rotating dual-rotor wind turbines with speed-adding increasers. Energies 2021, 14, 2594. [Google Scholar] [CrossRef] [Scilit]
- Ismaiel, A.; Yoshida, S. Aeroelastic analysis of a coplanar twin-rotor wind turbine. Energies 2019, 12, 1881. [Google Scholar] [CrossRef] [Scilit]
- Xie, S.; He, J.; Zhang, C.; Kan, Y.; Ma, J.; Zhang, Z. Aero-hydro-servo-elastic coupled modeling and dynamics analysis of a four-rotor floating offshore wind turbine. Ocean Eng. 2023, 272, 113724. [Google Scholar] [CrossRef] [Scilit]
- Berdugo-Parada, I.; Servan-Camas, B.; Garcia-Espinosa, J. Numerical framework for the coupled analysis of floating offshore multi-wind turbines. J. Mar. Sci. Eng. 2023, 12, 85. [Google Scholar] [CrossRef] [Scilit]
- Elkodama, A.; Abdellatif, A.; Shaaban, S.; Rushdi, M.A.; Yoshida, S.; Ismaiel, A. Investigation into the yaw control of a twin-rotor 10 MW wind turbine. Appl. Sci. 2024, 14, 9810. [Google Scholar] [CrossRef] [Scilit]
- Zhang, Z.; Kuang, L.; Zhao, Y.; Han, Z.; Zhou, D.; Tu, J.; Chen, M.; Ji, X. Numerical investigation of the aerodynamic and wake characteristics of a floating twin-rotor wind turbine under surge motion. Energy Convers. Manag. 2023, 283, 116957. [Google Scholar] [CrossRef] [Scilit]
- Zhang, Z.; Yang, H.; Zhao, Y.; Han, Z.; Zhou, D.; Zhang, J.; Tu, J.; Chen, M. A novel wake control strategy for a twin-rotor floating wind turbine: Mitigating wake effect. Energy 2024, 287, 129619. [Google Scholar] [CrossRef] [Scilit]
- Chen, H.; Zhao, C.; Tian, Y.; Liu, H.; Zhong, Y.; Kong, F. Research on the aero-hydro coupling characteristics of the floating twin-rotor wind turbine system. Ocean Eng. 2024, 312, 119344. [Google Scholar] [CrossRef] [Scilit]
- El Beshbichi, O.; Xing, Y.; Ong, M.C. Load response of a two-rotor floating wind turbine undergoing blade-pitch system faults. Wind Energy 2023, 26, 946–967. [Google Scholar] [CrossRef] [Scilit]
- Jonkman, J.; Butterfield, S.; Musial, W.; Scott, G. Definition of a 5-MW Reference Wind Turbine for Offshore System Development (No. NREL/TP-500-38060); National Renewable Energy Laboratory (NREL): Golden, CO, USA, 2009. [Google Scholar]
- DNV. Conceptual Modelling of Offshore and Maritime Structures—GeniE. 2022. Available online: https://www.dnv.com/services/conceptual-modelling-of-offshore-and-maritime-structures-genie-89128 (accessed on 6 February 2025).
- DNV. Hydrodynamic Analysis and Stability Analysis Software—HydroD. 2022. Available online: https://www.dnv.com/services/hydrodynamic-analysis-and-stability-analysis-software-hydrod-14492 (accessed on 6 February 2025).
- DNV. Marine Operations and Mooring Analysis Software—SIMA. 2022. Available online: https://www.dnv.com/services/marine-operations-and-mooring-analysis-software-sima-2324 (accessed on 6 February 2025).
- Yu, W.; Müller, K.; Lemmer, F.; Bredmose, H.; Borg, M.; Sanchez, G.; Landbo, T. Public Definition of the Two LIFES50+ 10 MW Floater Concepts (Deliverable No. 4, 012024); LIFES50+; University of Stuttgart: Stuttgart, Germany, 2017. [Google Scholar]
- Zhang, Z.; Yang, Y.; Yan, Y.; Liu, Q.; Yu, J.; Liu, W.; He, C.; Hu, G.; Lai, Y. Fully coupled aero-hydrodynamic analysis of a twin-rotor floating offshore wind turbine. Ocean Eng. 2026, 349, 124193. [Google Scholar] [CrossRef] [Scilit]
- Kvittem, M.I. Modelling and Response Analysis for Fatigue Design of a Semi-Submersible Wind Turbine. Doctoral Dissertation, Norwegian University of Science and Technology, Trondheim, Norway, 2014. [Google Scholar]
- Katsikogiannis, G.; Sørum, S.H.; Bachynski, E.E.; Amdahl, J. Environmental lumping for efficient fatigue assessment of large-diameter monopile wind turbines. Mar. Struct. 2021, 77, 102939. [Google Scholar] [CrossRef] [Scilit]
- Miner, M.A. Cumulative fatigue damage. J. Appl. Mech. 1945, 12, A159–A164. [Google Scholar] [CrossRef] [Scilit]
- DNV-GL. Fatigue Design of Offshore Steel Structures (DNVGL-RP-C203); DNV-GL: Høvik, Norway, 2016. [Google Scholar]
- Stewart, G.M.; Robertson, A.; Jonkman, J.; Lackner, M.A. The creation of a comprehensive metocean data set for offshore wind turbine simulations. Wind Energy 2016, 19, 1151–1159. [Google Scholar] [CrossRef] [Scilit]
- Yang, Y.; Shi, Z.; Fu, J.; Ma, L.; Yu, J.; Fang, F.; Li, C.; Chen, S.; Yang, W. Effects of tidal turbine number on the performance of a 10 MW-class semi-submersible integrated floating wind-current system. Energy 2023, 285, 128789. [Google Scholar] [CrossRef] [Scilit]
- Yang, Y.; Fu, J.; Shi, Z.; Ma, L.; Yu, J.; Fang, F.; Chen, S.; Lin, Z.; Li, C. Performance and fatigue analysis of an integrated floating wind-current energy system considering the aero-hydro-servo-elastic coupling effects. Renew. Energy 2023, 216, 119111. [Google Scholar] [CrossRef] [Scilit]

Disclaimer/Publisher’s Note: The statements, opinions and data contained in all publications are solely those of the individual author(s) and contributor(s) and not of MDPI and/or the editor(s). MDPI and/or the editor(s) disclaim responsibility for any injury to people or property resulting from any ideas, methods, instructions or products referred to in the content. |
© 2026 by the authors. Licensee MDPI, Basel, Switzerland. This article is an open access article distributed under the terms and conditions of the Creative Commons Attribution (CC BY) license.