


Abstract
Deep marine Longmaxi shales in the southern Sichuan Basin display pronounced pore heterogeneity even within a single stratigraphic target, but the pore-scale controls remain uncertain. We integrated large-area, high-resolution scanning electron microscopy (SEM), automated mineral mapping, and quantitative image analysis for 17 Long 111 core samples from four deep wells to evaluate relationships among organic matter (OM) populations, OM abundance, mineral fabric, and SEM-visible pore development. OM-hosted pores account for 70–97% of the segmented pore area. The total SEM-derived pore-area ratio ranges from 0.23% to 2.39%, and the image-derived apparent transformation ratio (ATR) of OM ranges from 2.40% to 18.78%. Migrated pyrobitumen (PB2) generally contains coarser pores and has a higher ATR than in-place pyrobitumen (PB1), although this contrast diminishes in some high-TOC shales. OM-hosted pore development varies nonlinearly with total organic carbon (TOC) and is commonly most favorable at intermediate TOC. Bulk quartz content is not systematically related to pore development, whereas carbonate-rich fabrics are associated with restricted OM occurrence and poorer pore preservation. These observations indicate that pore development reflects the coupled effects of OM abundance and occurrence, pyrobitumen population, available accommodation, and mineral framework support. We propose three end-member configurations, including framework-supported, OM-connected, and carbonate-restricted configurations, to explain pore heterogeneity within the target interval. The results show that OM–mineral spatial relationships provide additional information beyond bulk TOC and mineral composition for understanding pore heterogeneity in deep shales.
1. Introduction
The Lower Silurian Longmaxi Formation is a major target for shale gas exploration and production in the Sichuan Basin, particularly in southern Sichuan, where commercial development has progressively extended to depths greater than 3500 m [1,2,3]. Reservoir porosity and gas content, however, vary among structural blocks, wells, and stratigraphic intervals [4,5,6,7,8]. This regional variability is commonly attributed to differences in depositional facies, tectonic setting, formation pressure, and preservation conditions [4,5,8,9,10]. Pronounced heterogeneity nevertheless persists within relatively stable tectonic settings and even within the same organic-rich, siliceous target interval, where these first-order geological attributes are broadly comparable [7,9]. Bulk reservoir parameters may therefore obscure differences in the abundance, size distribution, and connectivity of micro- to nanoscale pores that contribute to fluid storage and flow capacity [11,12,13,14,15].
Organic matter (OM)-hosted pores constitute an important component of the nanoscale pore system in many black shales [16,17,18,19,20]. Their formation is closely associated with hydrocarbon generation and thermal alteration of OM [21,22,23,24], whereas burial compaction, tectonic deformation, and mineral precipitation can modify their preservation [25,26,27,28]. Pore development also varies among OM types [27,29,30,31]. Previous studies have shown that SEM-visible pores are commonly better developed in solid bitumen or pyrobitumen than in structured kerogen [18,31,32,33]. Even within a single mature shale, however, individual solid bitumen or pyrobitumen domains can exhibit markedly different pore structures [29,33,34,35]. The processes responsible for this heterogeneity within a narrowly defined target interval remain insufficiently resolved.
The surrounding mineral framework is also important for OM-hosted pore development [16,26,36,37]. Rigid, quartz-rich assemblages can support pore preservation by resisting mechanical compaction, whereas clay-rich matrices are generally more susceptible to deformation [37,38,39,40]. Carbonate minerals may either support or restrict pore preservation, depending on their abundance, texture, and occurrence [39,41,42]. These mineral effects cannot be considered independently of OM evolution because hydrocarbon generation, migration, secondary OM emplacement, and cracking occur within an evolving mineral framework. Although organic–inorganic interactions and their coevolution with pore development are increasingly recognized in shale systems [41,43], most previous studies compare different lithofacies or stratigraphic intervals. However, how OM properties and mineral fabric jointly affect pore development within the same shale lithofacies interval remains poorly understood.
This study examines shale samples from the basal member (Long 111 interval) of the Lower Silurian Longmaxi Formation from four deep wells in the Luzhou area, southern Sichuan Basin. Large-area, high-resolution SEM images; automated mineral maps; and quantitative image analysis were used to (1) document differences in OM-hosted pores among OM populations; (2) evaluate associations among OM abundance, spatial occurrence, mineral fabric, and SEM-visible pore development; and (3) develop an organic–inorganic coupling framework for the observed pore heterogeneity. While previous studies addressed OM-hosted porosity and pyrobitumen heterogeneity [7,35], this study focuses on how the contrast in pore development between different pyrobitumen populations varies among samples and how it relates to the spatial arrangement of OM and minerals. By constraining the comparison to one stratigraphic target, we seek to better understand pore-scale heterogeneity and provide additional insights for reservoir evaluation in deep shale systems.
2. Geological Setting
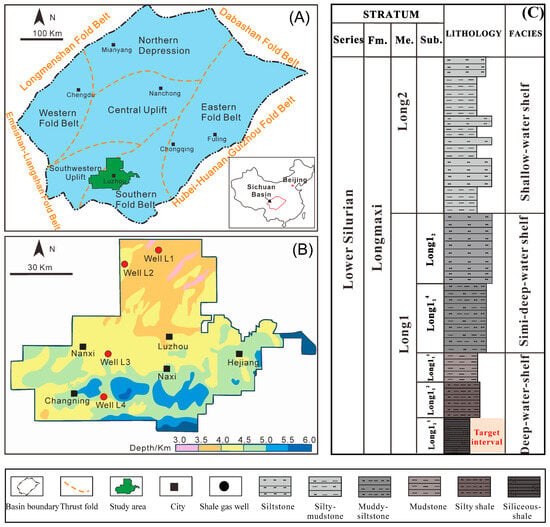
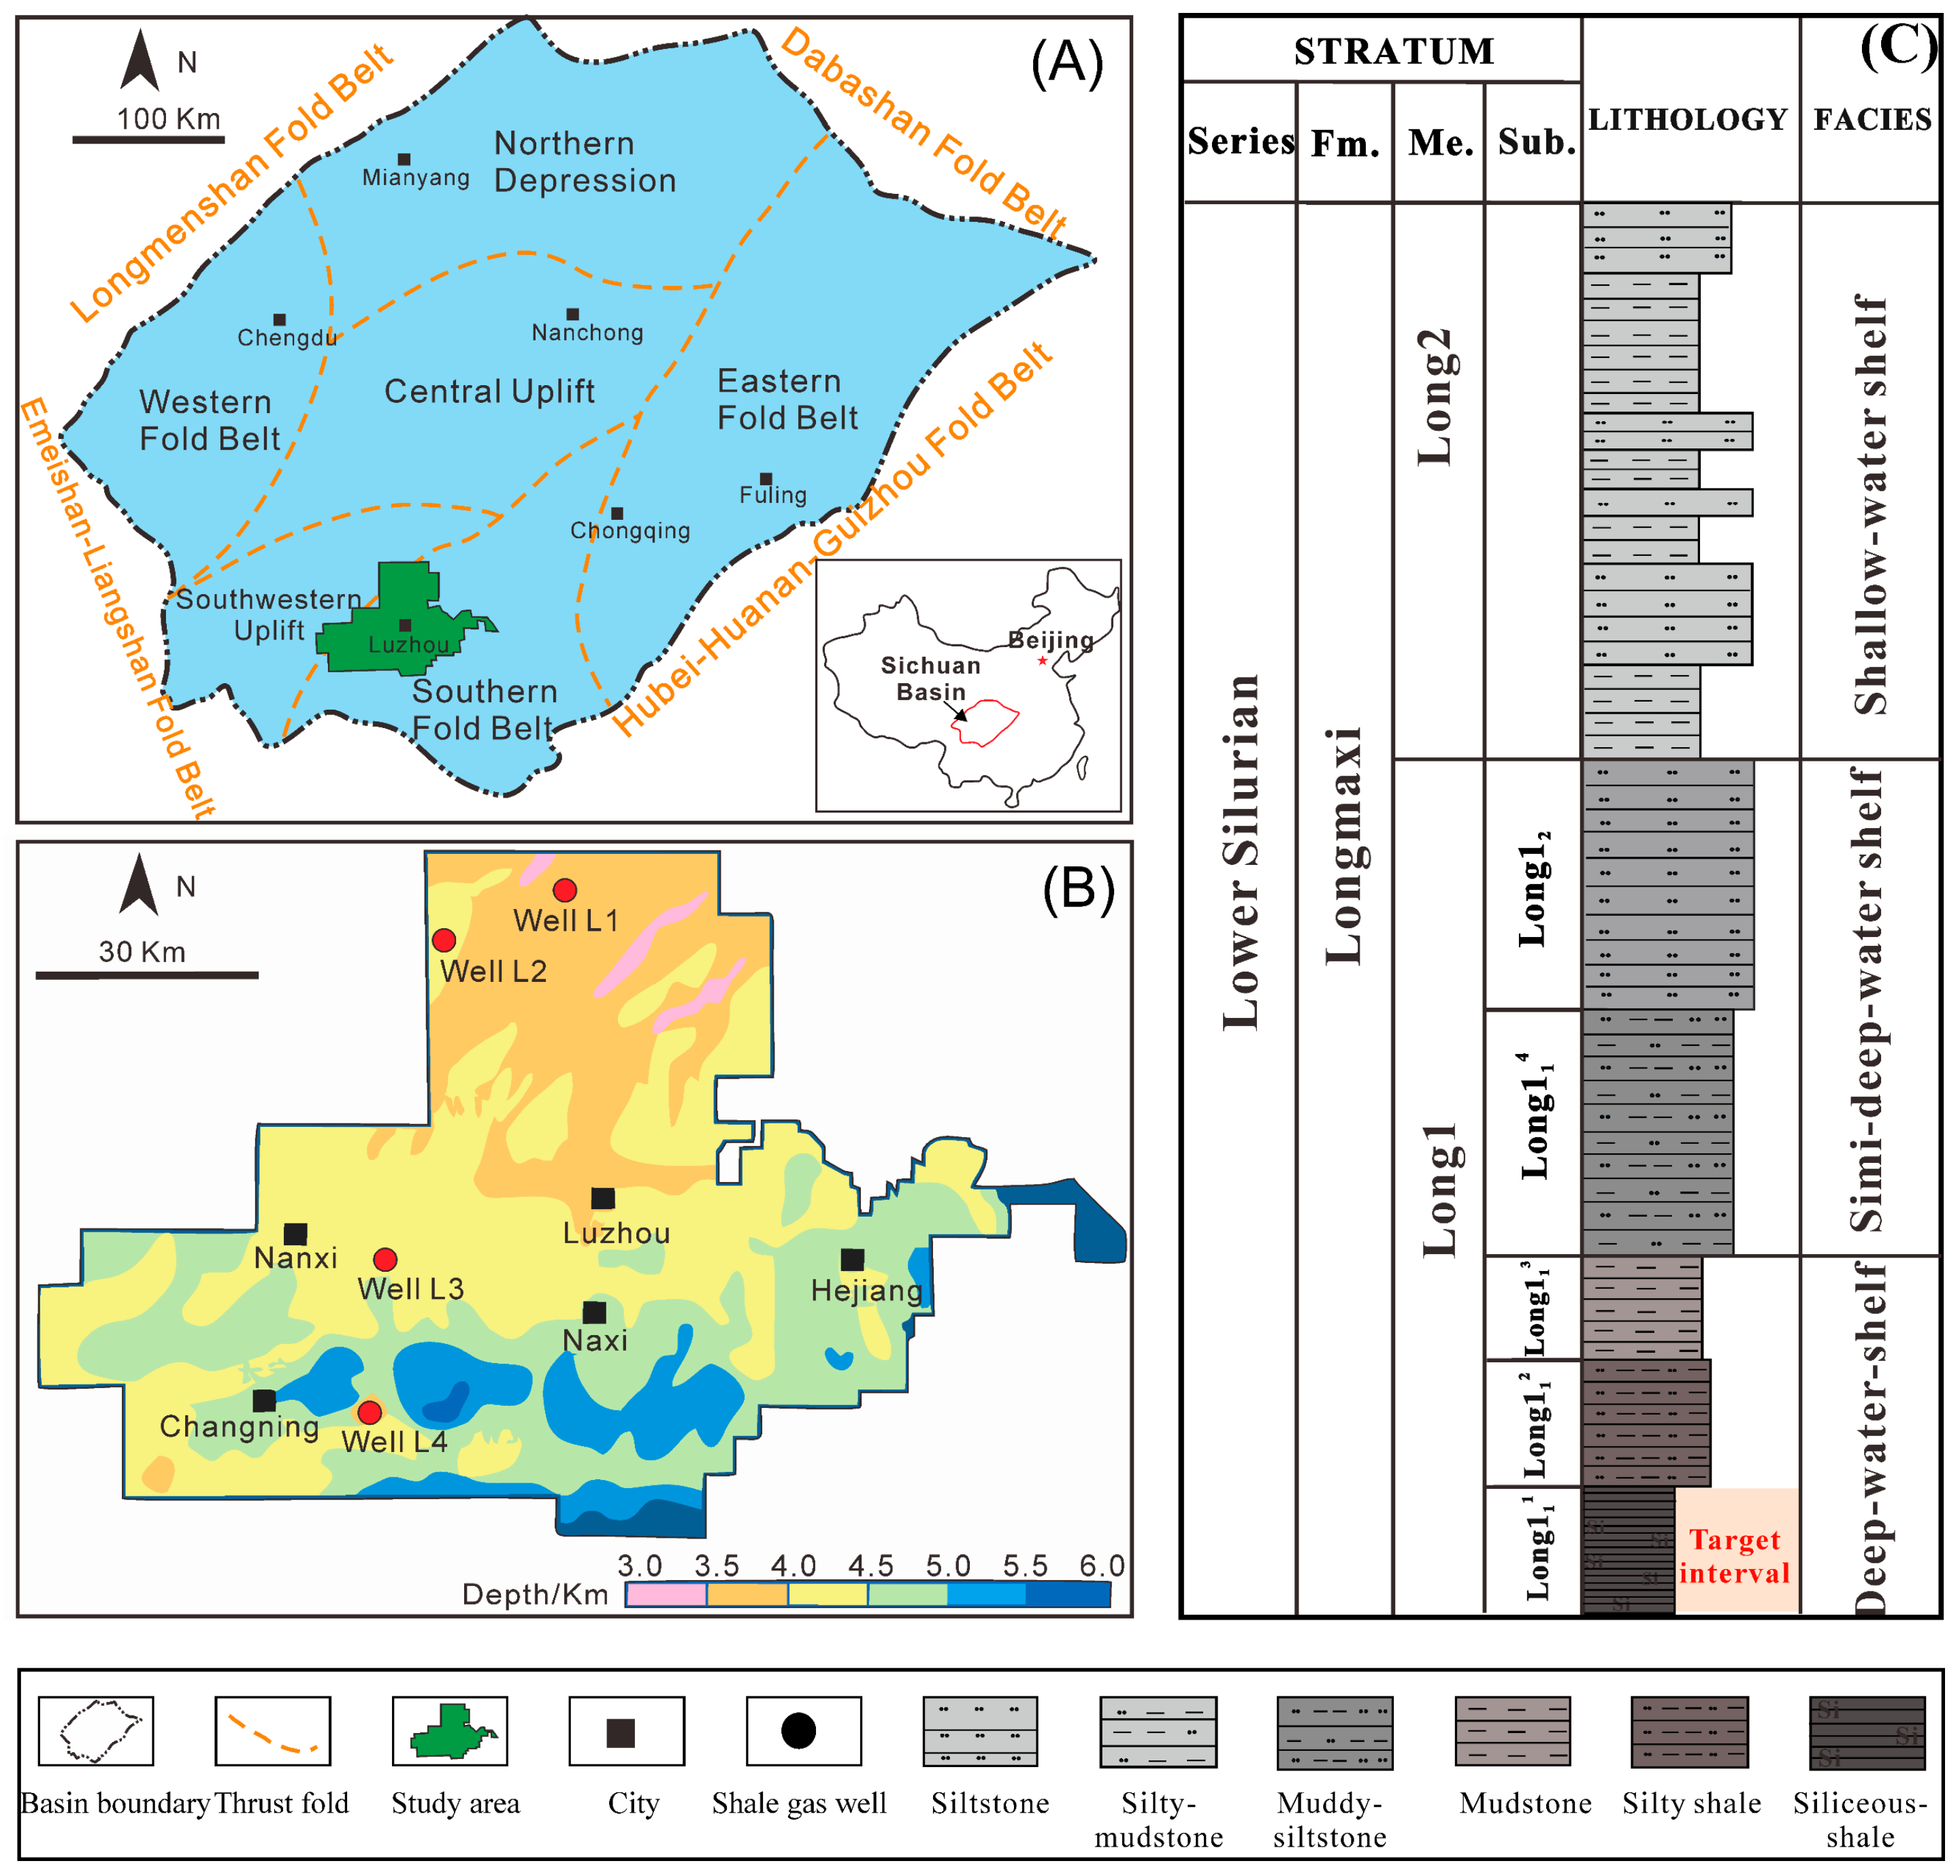
The Sichuan Basin is an intracratonic basin on the Upper Yangtze Platform. The Luzhou area lies near the transition between the southern Sichuan low-steep structural belt and the southwestern Sichuan low-fold belt (Figure 1A,B). Folding in this area is less intense than in the high-steep structural belts farther east [2]. During the Early Silurian, deep-water shelf conditions developed across southern and eastern Sichuan during deposition of the lower Longmaxi Formation [6,44]. In the Luzhou area, low-energy, reducing conditions favored the deposition and preservation of organic-rich siliceous shale [10,44].
Figure 1.
Geological setting and locations of the four examined wells in the Luzhou area, southern Sichuan Basin. (A) Tectonic setting of the Luzhou area. (B) Locations and burial depth distribution of the four examined wells. (C) Generalized stratigraphic column of the Longmaxi Formation (modified from [6]).
The Lower Silurian Longmaxi Formation comprises the lower Long 1 and upper Long 2 members, and the Long 1 member is subdivided into the Long 11 and Long 12 submembers (Figure 1C). On the basis of regional stratigraphic correlation, Long 11 is further divided into four layers (Long 111–Long 114) [45]. Black to dark-gray, organic-rich siliceous shale dominates the lower Long 11 deep-shelf succession, whereas silt and clay contents generally increase upward. The Long 111 layer is a principal shale gas target because it combines high OM and silica contents with a well-developed nanoscale pore system [6,45].
3. Materials and Methods
3.1. Sample Information
Seventeen core samples were collected from the Long 111 interval of four deep wells (L1–L4) in the Luzhou area (Figure 1). Present burial depths range from approximately 3450 to 4322 m, and formation pressure coefficients of 2.0–2.3 indicate over-pressured conditions. The Longmaxi shales in the Luzhou area are thermally overmature, with equivalent vitrinite reflectance (EqRₒ) values of 2.8–3.3% [9]. All samples were collected from the same stratigraphic interval, allowing pore heterogeneity to be examined under broadly similar geological conditions.
For each sample, mineral composition and occurrence, OM abundance and type, and SEM-visible pore characteristics were characterized using automated mineral mapping; large-area, high-resolution SEM imaging; and quantitative image analysis.
3.2. Large-Area, High-Resolution SEM Imaging and Mineralogical Analysis
Each sample was cut perpendicular to bedding, mechanically polished using an MCP polishing system, and then Ar-ion milled using an ArNanoFab 100 system (Baygon Scientific, Suzhou, China) to produce a surface suitable for high-resolution pore characterization. The ion-milled surfaces were initially imaged without a conductive coating to avoid masking nanoscale pore features.
Secondary-electron (SE) images were acquired with a Carl Zeiss Merlin field emission scanning electron microscope (Carl Zeiss Microscopy GmbH, Jena, Germany) at the Institute of Geology and Geophysics, Chinese Academy of Sciences, using an accelerating voltage of 1.5 kV and a probe current of 500 pA. Large-area stitched mosaics were collected with the ATLAS automated imaging system at a pixel size of 4 nm. Each mosaic comprised thousands of 1024 × 1024-pixel fields and covered approximately 450 × 450 μm2 per sample. This large imaging area was used to reduce sampling bias relative to conventional single-field SEM observations, following previous studies on the representative elementary area of shale [46] and large-area SEM-based pore quantification in Longmaxi shales [7]. Nevertheless, a single mosaic per sample cannot fully capture within-sample spatial variability.
Mineralogical composition and texture were characterized using automated mineralogy software (MaipSCAN v1), which combines backscattered-electron (BSE) imaging with energy-dispersive X-ray spectroscopy (EDS). Before mineral mapping, the polished surfaces were carbon coated to enhance electrical conductivity. Data were acquired at 20 kV and 2000 pA. Mineral phases were identified by matching segmented BSE domains and EDS spectra to a reference library. Mineral area fractions were converted to estimated weight percentages using assigned mineral densities. The resulting maps were used to quantify mineral assemblages and examine their spatial relationships with OM-bearing domains.
3.3. Quantitative Image Analysis of Pore Characteristics and OM Abundance
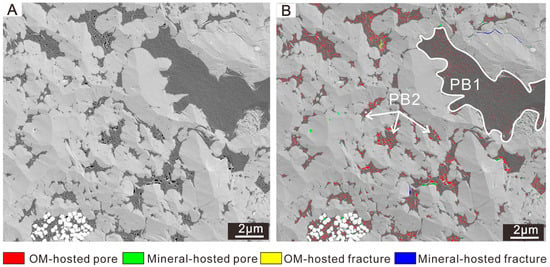
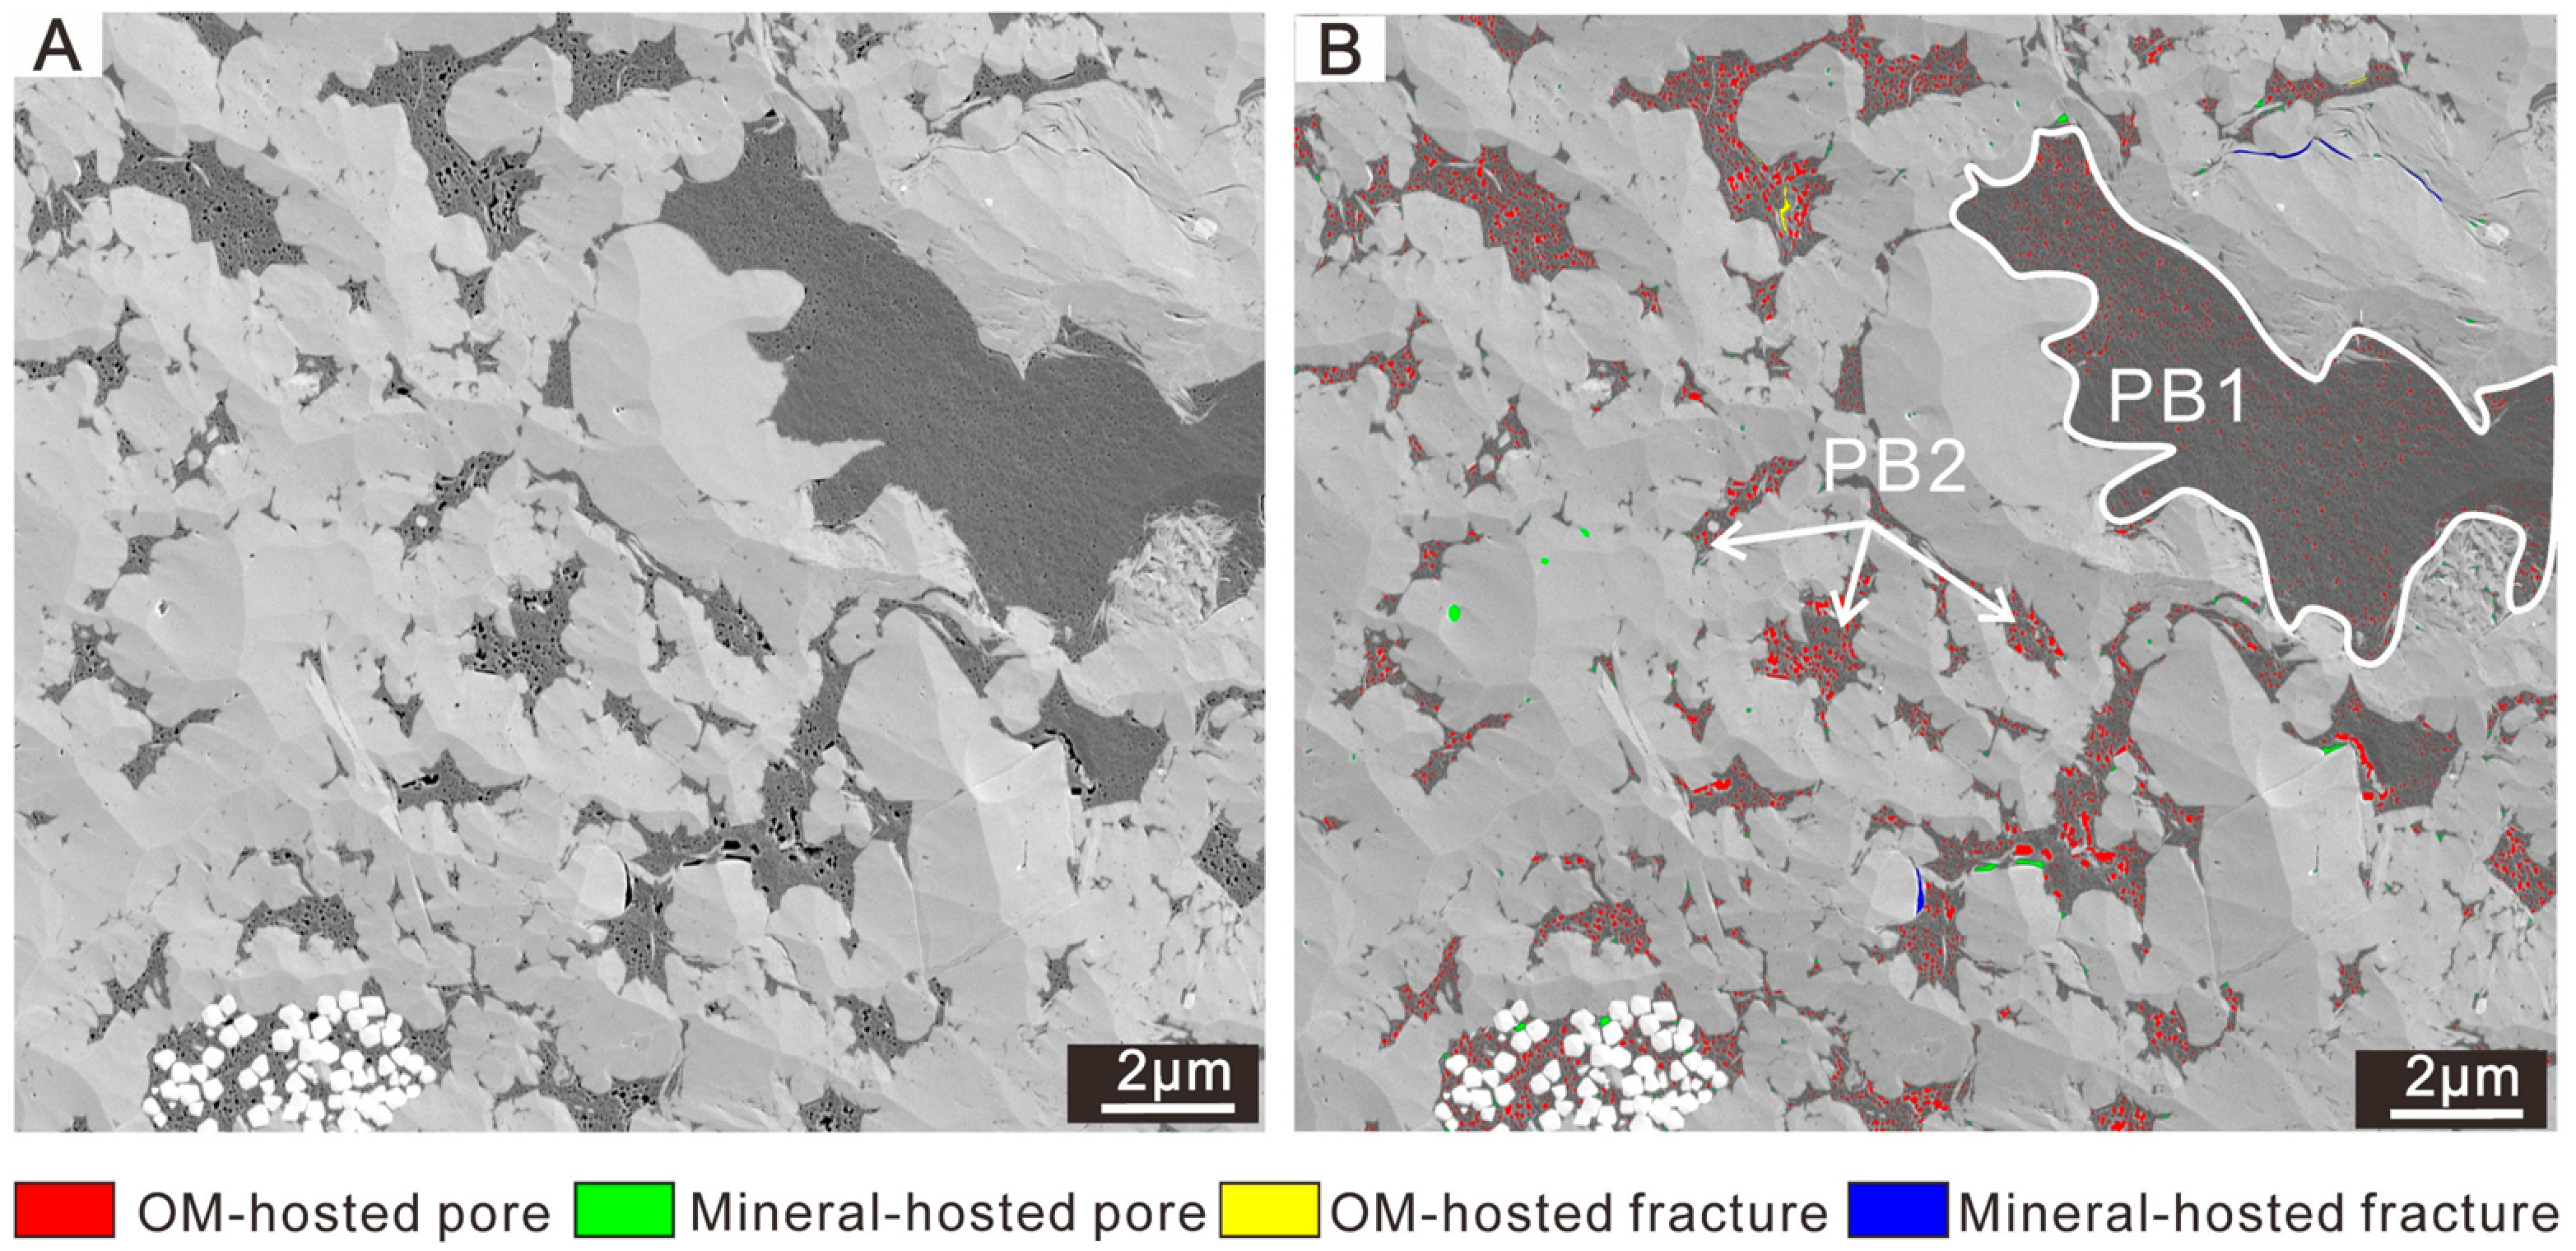
Pores and microfractures were segmented from the stitched SE mosaics using an in-house image analysis workflow based on Wang and Yang [47]. Briefly, grayscale thresholding was used to identify pores, mineral matrix, and OM, with manual refinement of ambiguous OM boundaries. Pores and microfractures were then classified according to their spatial relationships with OM and mineral domains. Thus, the procedure combines threshold-based segmentation, manual correction, and rule-based classification rather than relying on a trained classifier. Segmented features were assigned to OM-hosted pores, mineral-hosted pores, OM-hosted microfractures, or mineral-hosted microfractures (e.g., Figure 2). Their area ratios (the segmented pore area divided by the mosaic area), relative pore type proportions (the proportion of total segmented pore/fracture area represented by a class), and pore-size distributions were quantified. Throughout this study, SEM-derived porosity denotes the two-dimensional pore-area ratio measured in segmented SEM images and is not equivalent to bulk porosity.
Figure 2.
Representative SEM field of view extracted from a large-area mosaic to illustrate segmentation and identification of pore types and OM domains in a Long 111 shale (Sample 1, well L1). (A) Original SEM image. (B) Segmented image showing the identified pore types. Domains of in-place pyrobitumen (PB1) and migrated pyrobitumen (PB2) are outlined.
OM abundance was estimated from the area occupied by segmented OM in the SE mosaics. Assuming that the analyzed sections are representative of the bulk OM distribution, OM area fraction was treated as an estimate of OM volume fraction. Image-derived TOC was then calculated as follows:
where VOM is the OM volume abundance expressed in vol.%. Dividing VOM by 2 provides an approximate conversion to TOC in wt.% [48,49]. The simplified conversion assumes a carbon mass fraction of unity for the highly evolved OM, reflecting its progressive carbon enrichment during thermal maturation. This represents an approximation rather than a measured elemental composition. Here, the image-derived TOC values are used primarily to compare relative OM abundance among samples and have not been independently validated against bulk TOC for the present samples. Nevertheless, Wang and Yang [47] reported good agreement between this image-derived estimate and independently measured bulk TOC.
3.4. OM Classification and Apparent Transformation Ratio
For OM-specific comparisons, OM domains were classified as zooclasts, in-place pyrobitumen (PB1), or migrated pyrobitumen (PB2), following Wang and Yang [35]. PB1 generally occurs as relatively large, irregular OM domains enclosed within the mineral matrix, whereas PB2 typically fills interparticle spaces or microfractures and conforms to the surrounding mineral boundaries (e.g., Figure 2B).
The apparent transformation ratio (ATR) was defined as an image-based measure of the proportion of SEM-visible pores and microfractures within OM-bearing regions. For each sample, ATR was calculated as the area of OM-hosted pores and microfractures divided by the sum of this area and the area of remaining solid OM:
where AOM-hosted pore + microfracture is the total segmented area of pores and microfractures hosted by OM, and AOM is the area of the remaining solid OM in an SE mosaic. Sample-scale ATR therefore represents an area-weighted measure of SEM-visible pore and microfracture development across all OM domains in a sample. It is used here as a comparative image-based index and should not be interpreted as a direct measure of geochemical transformation.
For comparison of PB1 and PB2, ATR was calculated separately for individual domains of each pyrobitumen type. More than ten domains of each type were analyzed in every sample. The same area-based equation was applied within each domain, and the arithmetic mean of the domain-level ATR values was calculated separately for PB1 and PB2.
4. Results
4.1. Mineral Composition, Occurrence, and OM Abundance
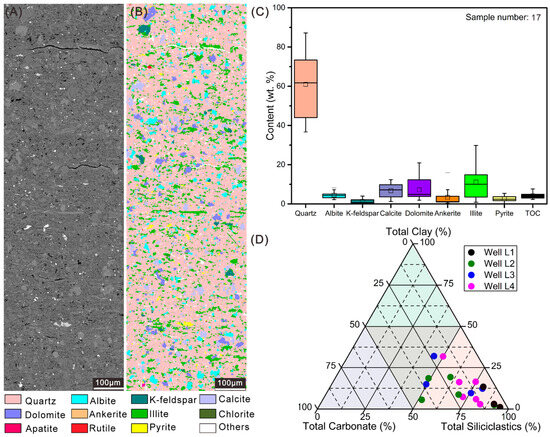
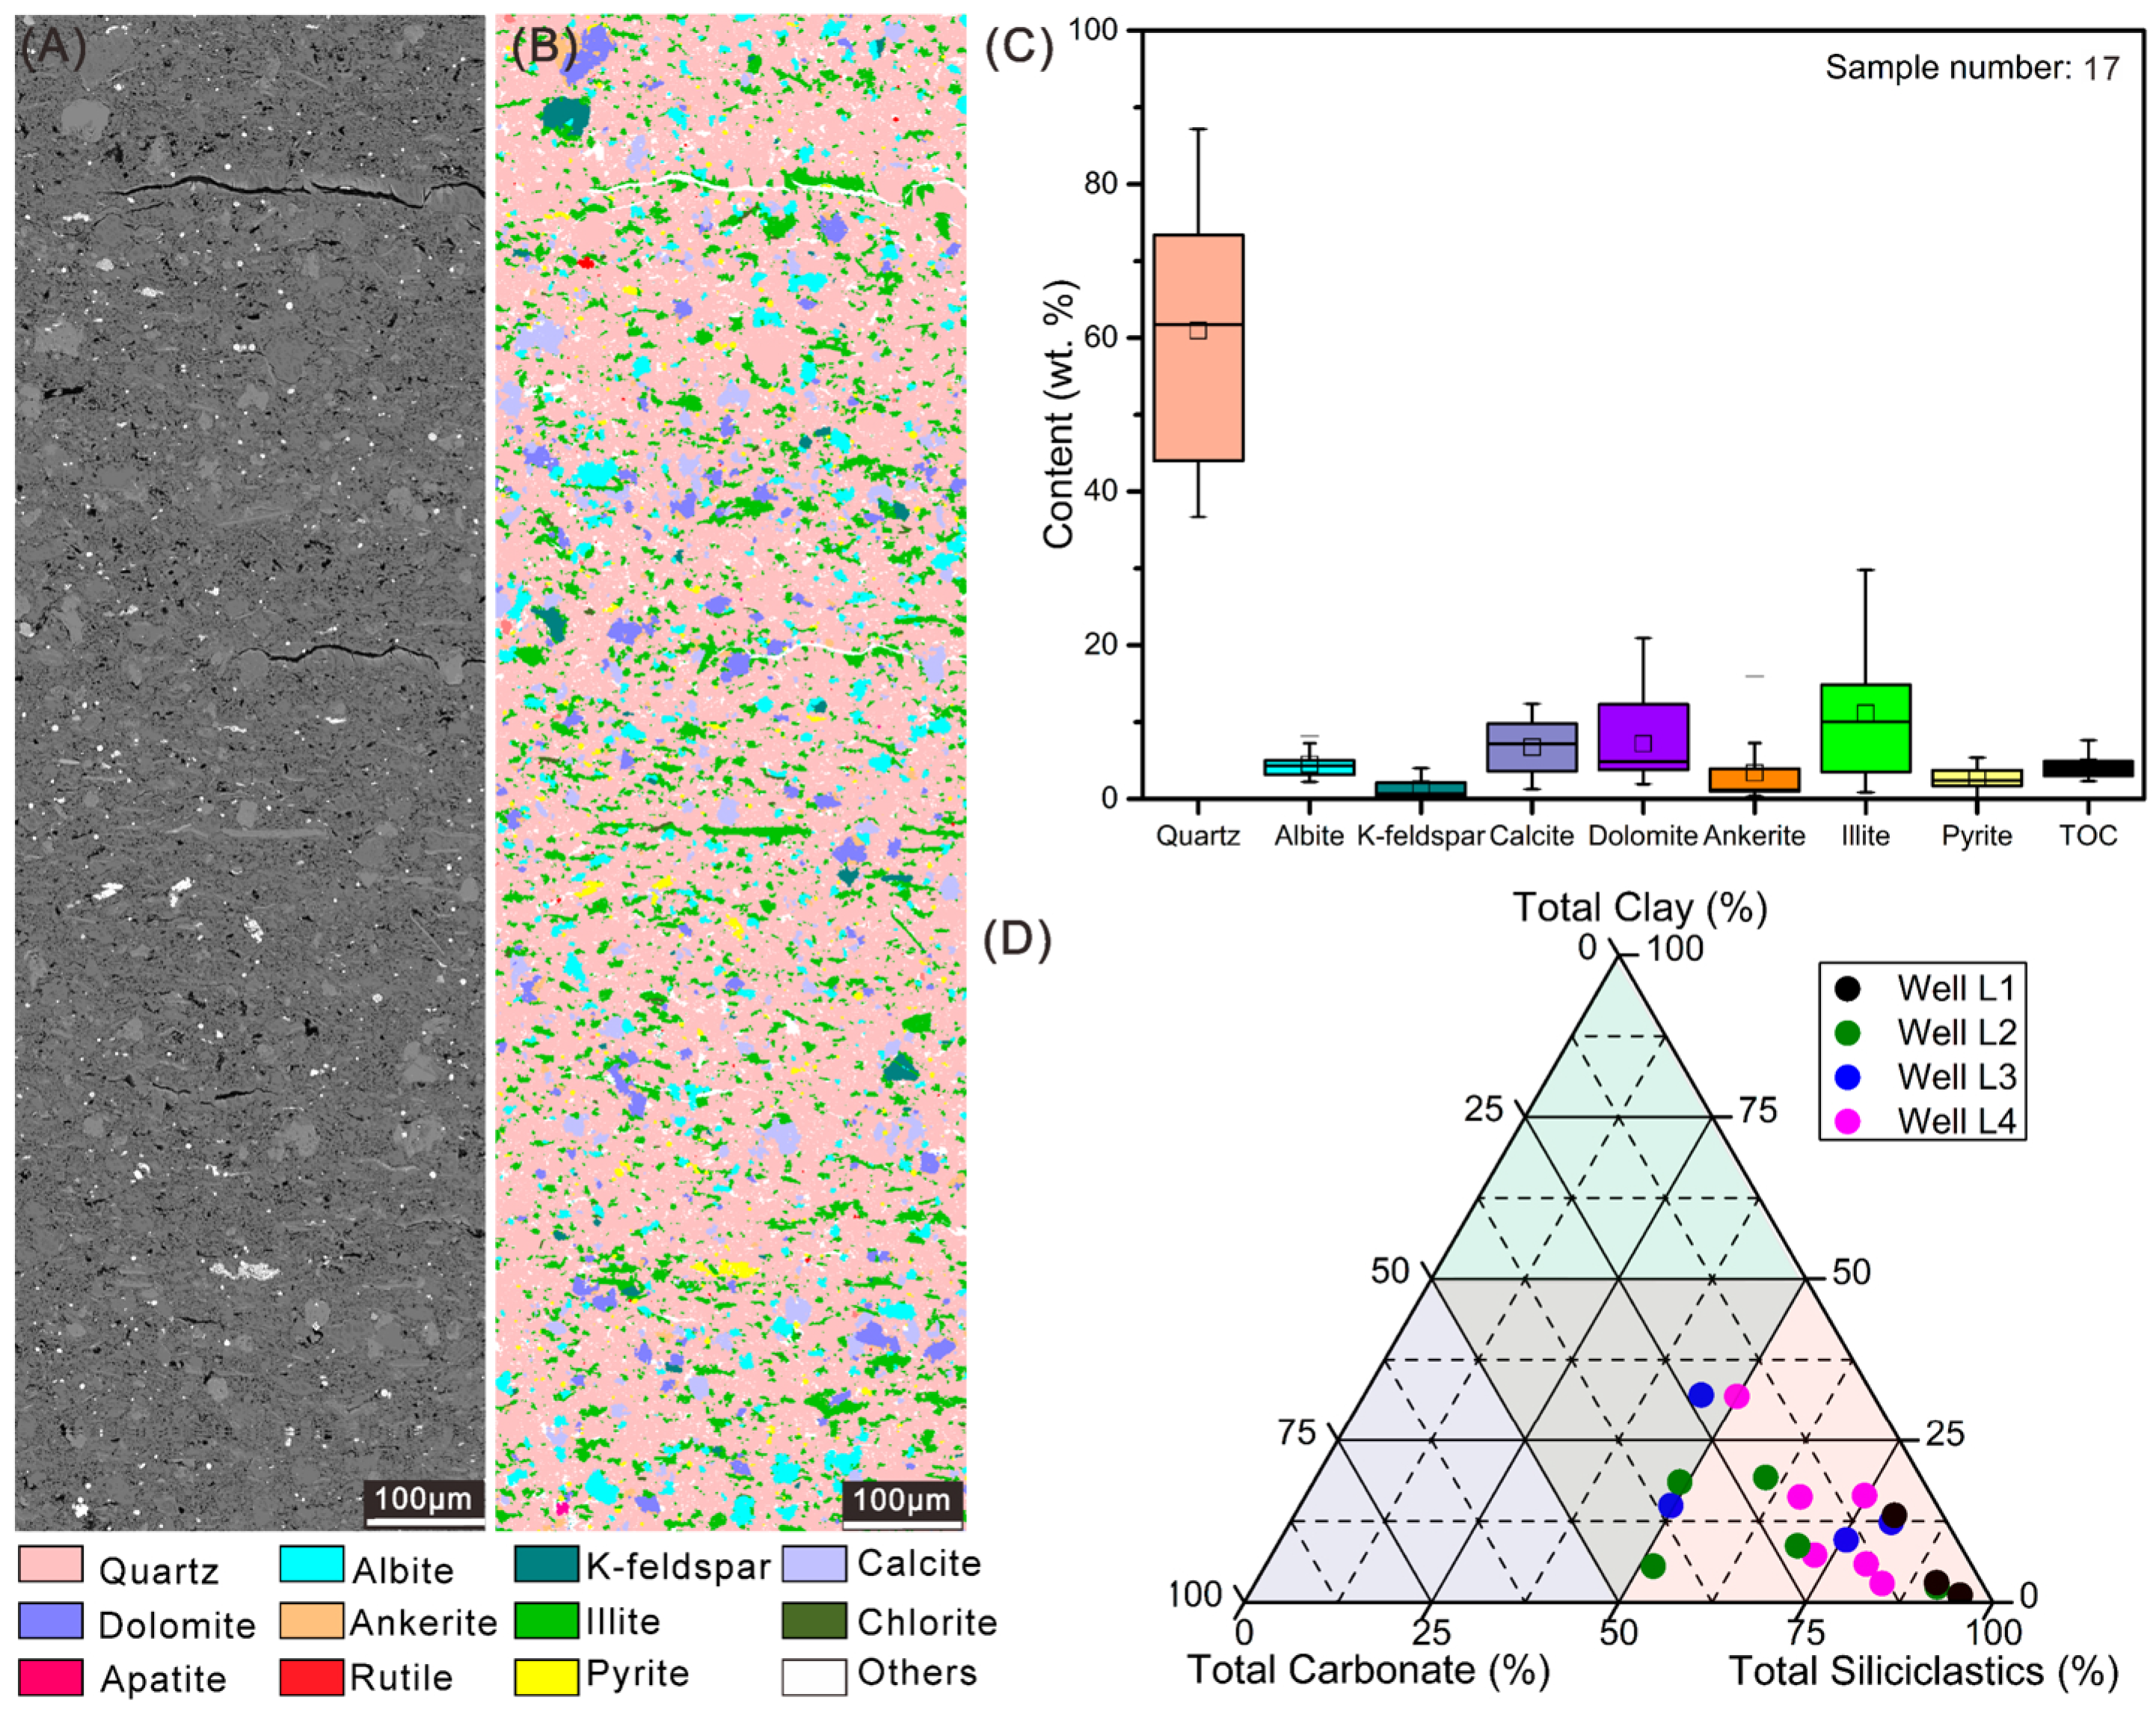
The examined Long 111 shales from Wells L1–L4 are dominated by quartz, with subordinate albite, K-feldspar, calcite, dolomite, ankerite, illite, chlorite and pyrite (Table 1; Figure 3). Quartz content ranges from 36.69 to 87.18 wt.%, whereas carbonate and clay contents vary widely among the 17 samples (Figure 3C). Large-area mineral maps also reveal differences in the occurrence of the major mineral phases (Figure 3A,B). Quartz occurs mainly as fine-grained to microcrystalline aggregates that are locally interconnected (Figure 3A). Carbonate minerals, principally calcite, dolomite, and ankerite, occur as dispersed euhedral to subhedral grains and blocky aggregates. Clay minerals are dominated by illite and chlorite and occur mainly as fine flakes or aggregates between quartz and carbonate grains.
Table 1.
Mineral composition and image-derived TOC of the examined shale samples.
Figure 3.
Mineral composition and occurrence in the examined Long 111 shale samples. (A) Representative backscattered-electron (BSE) image, sample 6, well L2. (B) Corresponding mineral map. (C) Distributions of mineral contents and image-derived TOC. (D) Mineral composition ternary diagram. Siliciclastics refers to silicate minerals including quartz, albite, and K-feldspar.
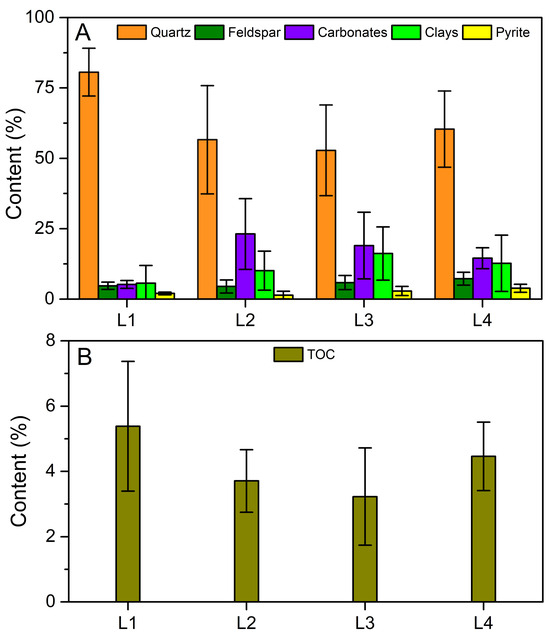
Most samples plot in the siliceous shale field (Siliciclastics content >50%) of the mineral composition diagram, but mineral abundances vary within and among wells (Figure 3D and Figure 4). Well L1 is consistently quartz rich, with a mean quartz content of 80.57 wt.% and mean carbonate and clay contents of 5.22 and 5.64 wt.%, respectively. Well L2 spans the widest range of carbonate abundance (6.08–40.58 wt.%), whereas Wells L3 and L4 show broad variations in both carbonate and clay contents. Thus, although all samples are from the same stratigraphic target (Figure 1C), they remain mineralogically heterogeneous.
Figure 4.
Well-scale mineral composition and image-derived TOC in the Long 111 samples. (A) Mean mineral contents. (B) Mean image-derived TOC. Error bars indicate variation among samples within each well.
Image-derived TOC ranges from approximately 2 to 8 wt.% across the dataset (Table 1), and mean values exceed 3.0 wt.% in all four wells. Substantial variation occurs both within and among wells. Well L1 has the highest mean image-derived TOC, whereas Wells L2–L4 show greater within-well variability. This variation provides a basis for evaluating relationships among OM abundance, OM occurrence, and SEM-visible pore development within the same target interval.
4.2. Characteristics of Different Pore Types
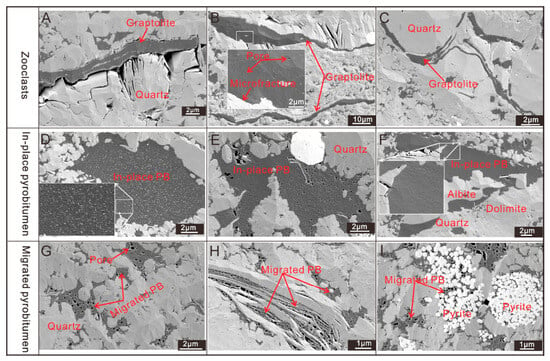
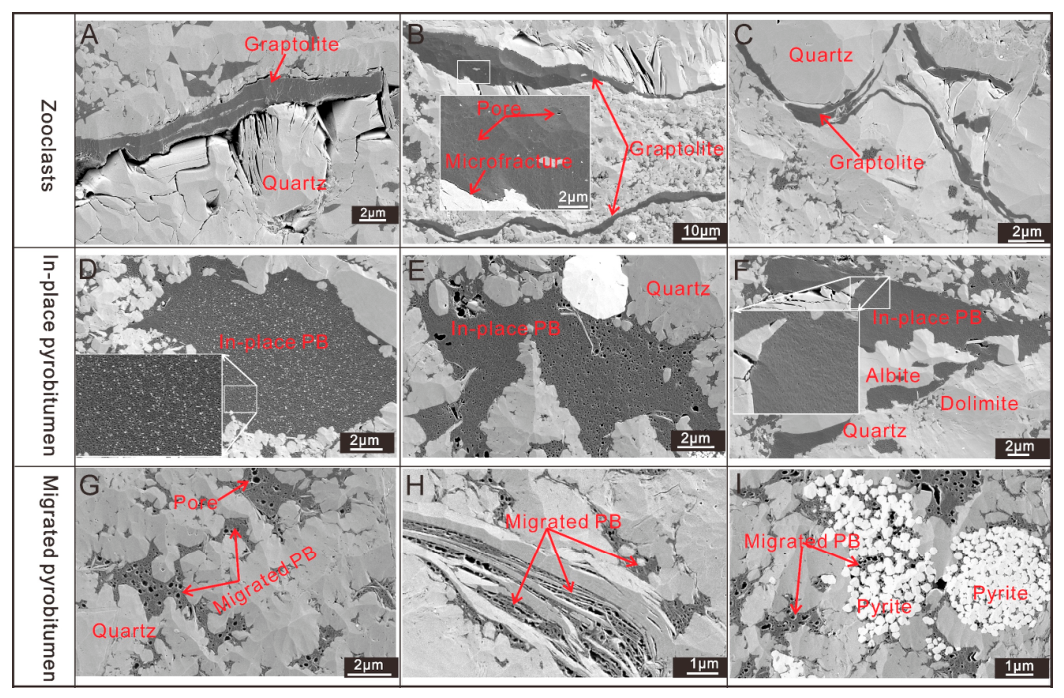
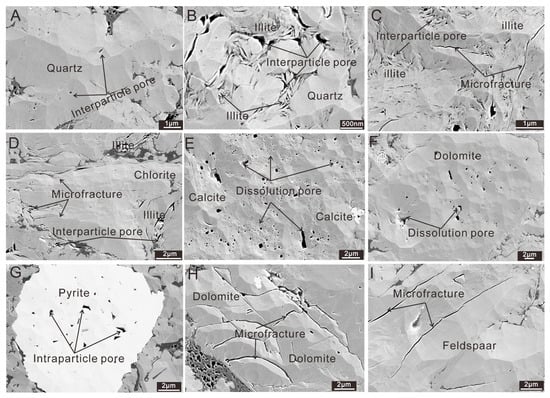
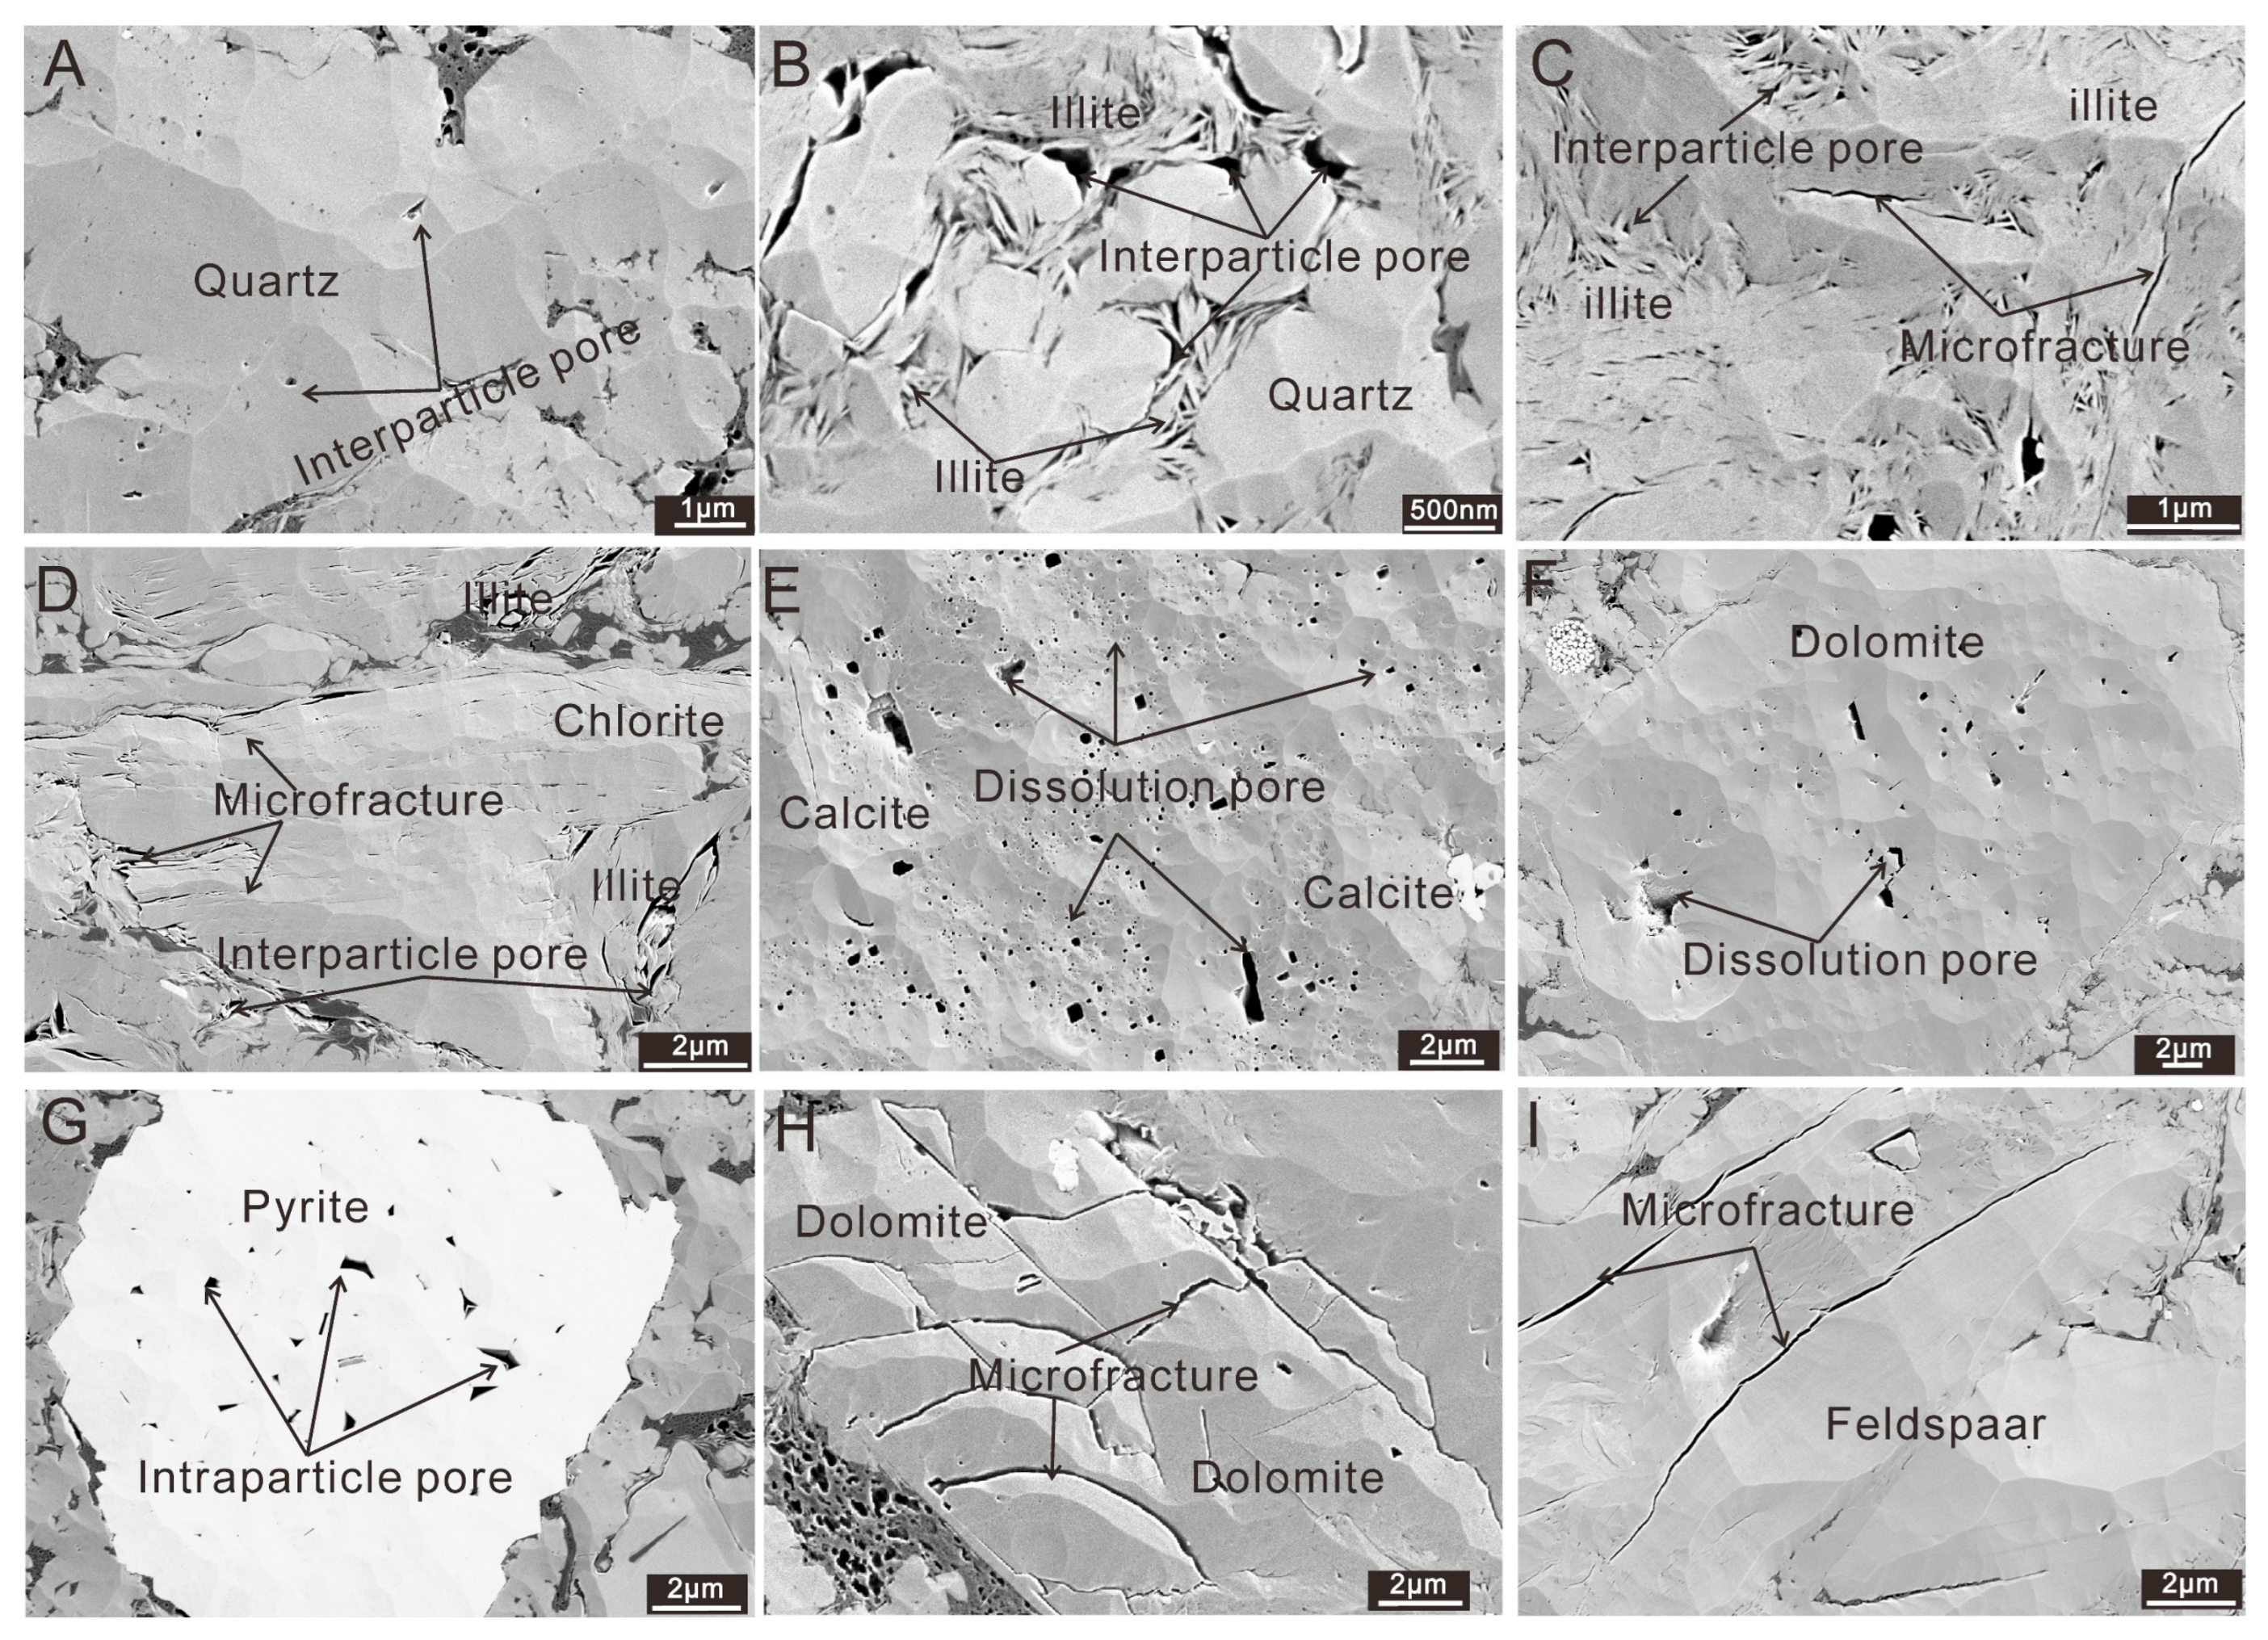
Large-area, high-resolution SEM mosaics reveal two principal pore categories in the investigated Long 111 shales: OM-hosted pores and mineral-hosted pores, together with locally developed microfractures (Figure 5 and Figure 6). OM-hosted pores are widespread and exhibit rounded, elliptical, irregular, or sponge-like morphologies. On the basis of host-OM occurrence, these pores are associated with zooclasts, in-place pyrobitumen (PB1), or migrated pyrobitumen (PB2).
Figure 5.
SEM images of pores in different OM populations in the examined Long 111 shales. (A–C) Graptolite-derived zooclasts with sparse visible pores, sample 14, well L4. (D–F) In-place pyrobitumen (PB1) with generally fine pores, sample 17, well L4. (G–I) Migrated pyrobitumen (PB2) with more variable pore sizes and morphologies, sample 14, well L4.
Figure 6.
SEM images of mineral-hosted pores and microfractures in the investigated Long 111 shales. (A) Interparticle pores between quartz grains, sample 14, well L4. (B–D) Interparticle pores and microfractures associated with clay minerals, sample 11, well L3. (E,F) Dissolution-related pores in calcite and dolomite, sample 5, well L2. (G) Intraparticle pores within pyrite, sample 14, well L4. (H,I) Microfractures in dolomite and feldspar, respectively, sample 14, well L4.
Zooclasts, represented mainly by graptolite-derived organic fragments, occur as elongated, ribbon-like, and locally stacked OM domains in SEM images (Figure 5A–C). They contain fewer visible pores than pyrobitumen, although isolated nanoscale pores and local microfractures are present. PB1 forms relatively large, irregular OM domains enclosed by the mineral matrix (Figure 5D–F) and contains mainly small, comparatively uniform nanoscale pores. By contrast, PB2 commonly occurs as pore- or fracture-filling OM and displays greater heterogeneity in pore distribution, a broader pore-size range, and more irregular pore morphologies (Figure 5G–I). These observations demonstrate distinct pore abundance and structure among the different OM populations.
Mineral-hosted pores comprise interparticle and intraparticle types and occur among or within quartz, clay minerals, feldspar, carbonate minerals, and pyrite (Figure 6). Interparticle pores commonly occur between mineral grains or within clay mineral aggregates and have irregular to slit-like morphologies (Figure 6A–D). Intraparticle pores are locally present within feldspar, carbonate, and pyrite grains, and some have irregular margins consistent with dissolution (Figure 6E–G). Microfractures occur within both OM domains and the mineral matrix. They commonly follow mineral boundaries, transect individual grains, or occur within and adjacent to OM domains (Figure 5A and Figure 6H,I).
4.3. Quantitative Heterogeneity of Pore Development
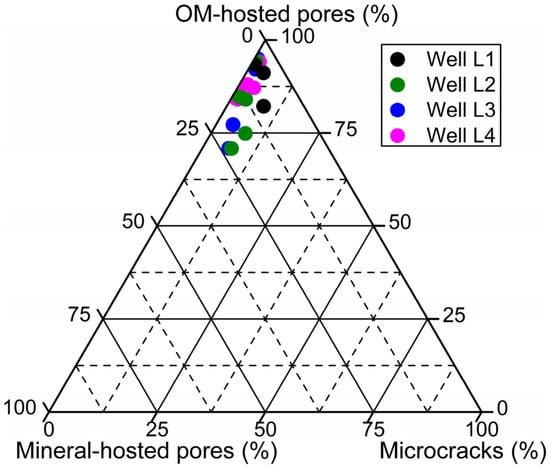
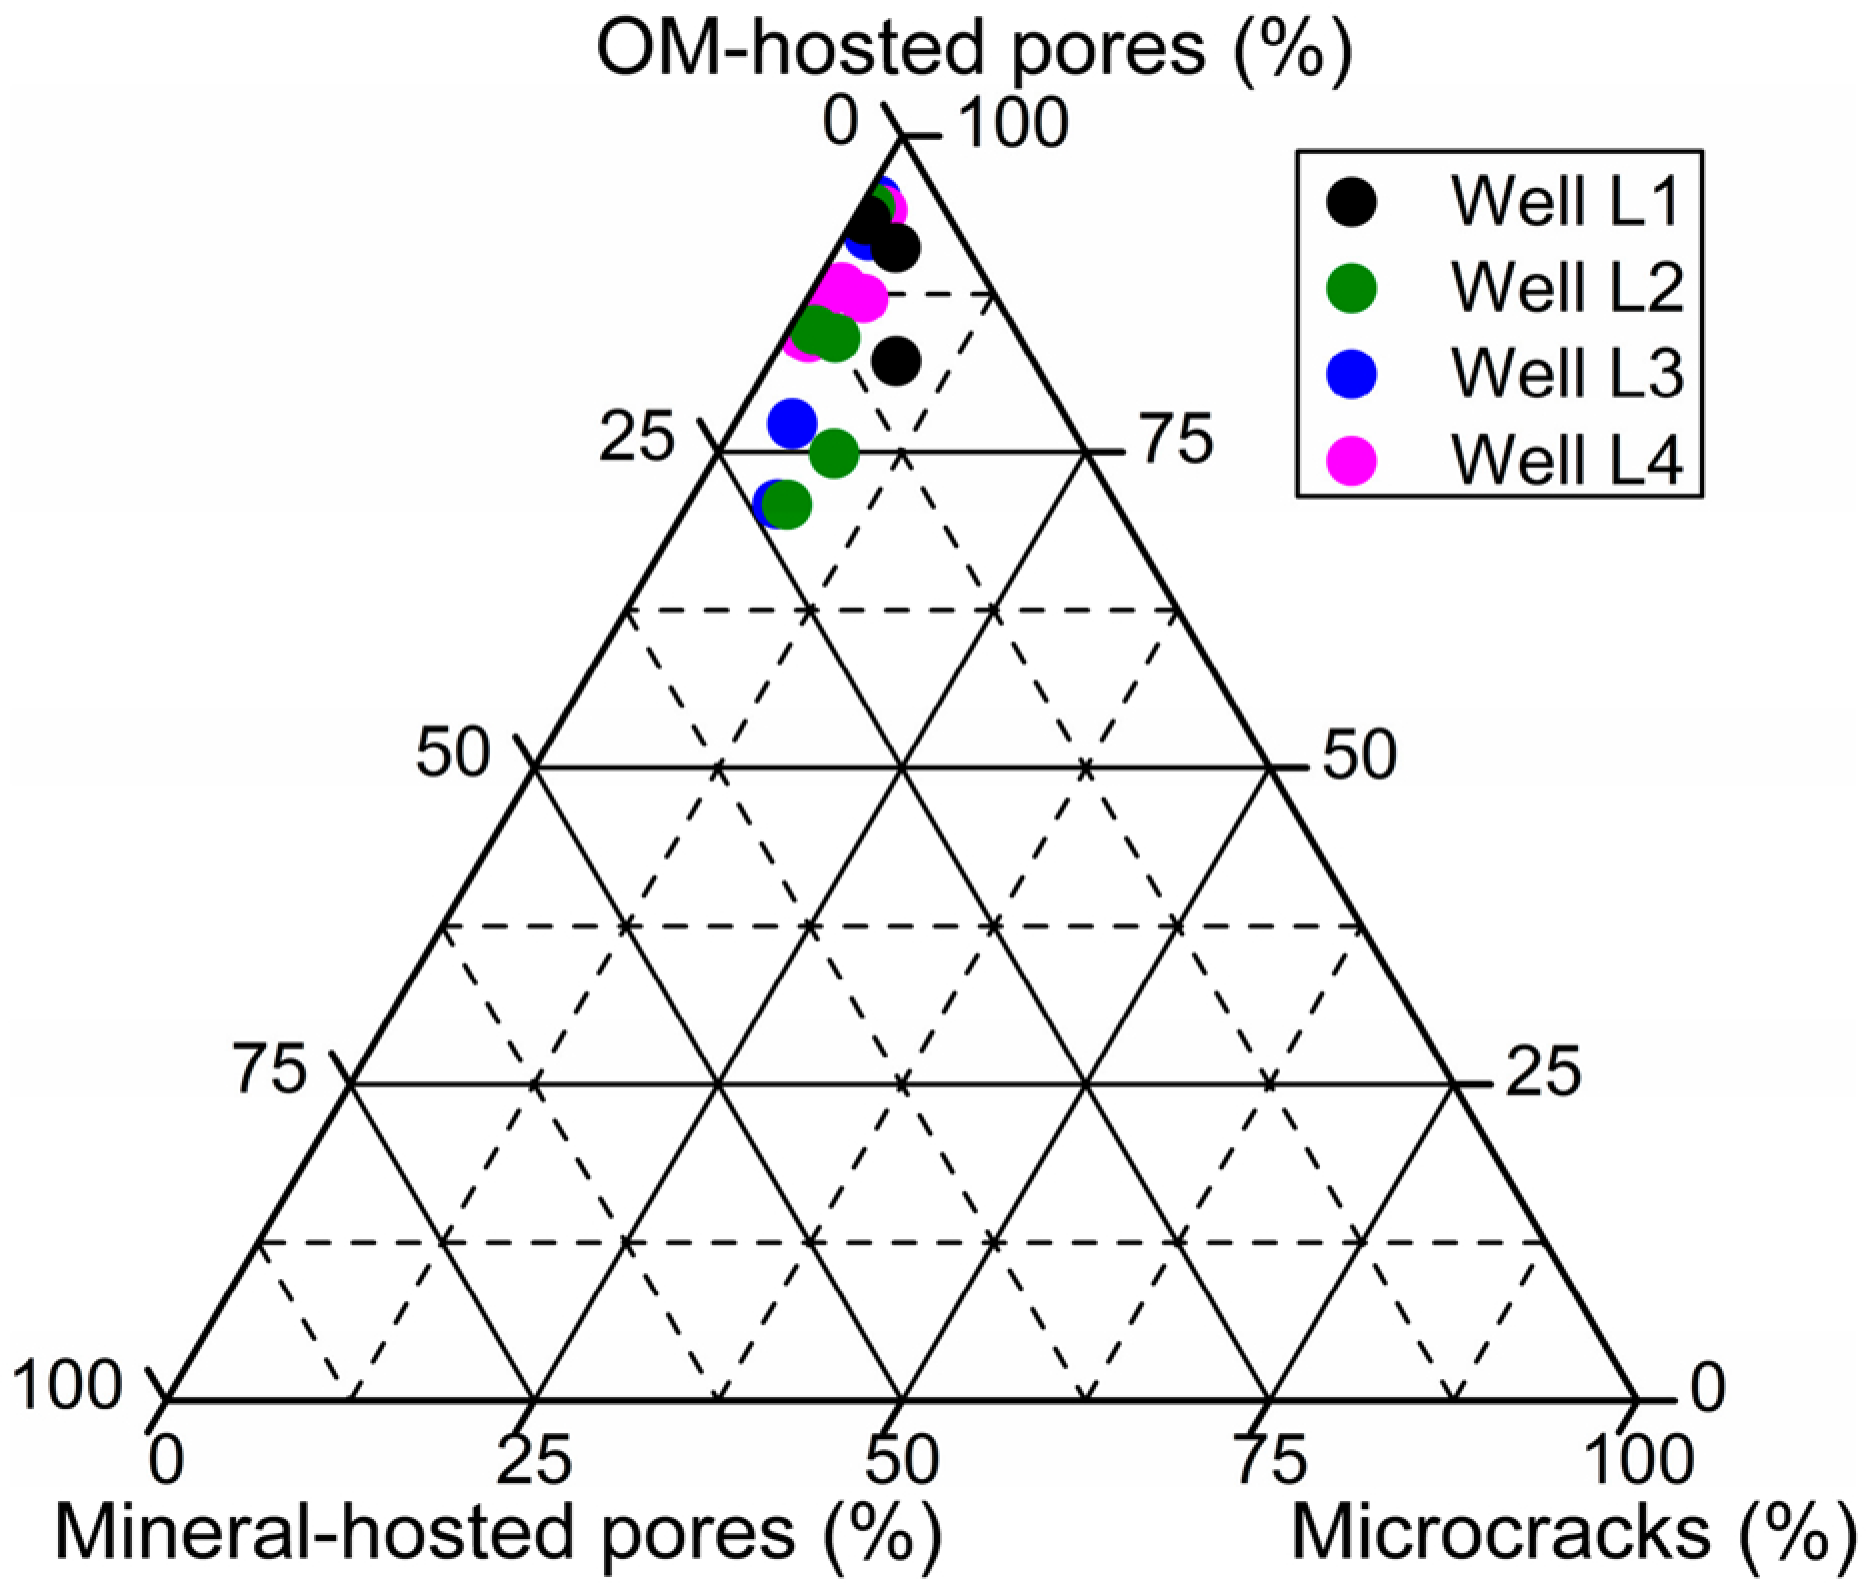
Quantitative analysis of the large-area SEM mosaics reveals substantial variation in two-dimensional pore-area ratios, relative pore-type proportions, and pore-size distributions within and among wells (Table 2; Figure 7, Figure 8 and Figure 9). The total SEM-derived pore-area ratio ranges from 0.23% to 2.39%, and OM-hosted pores account for approximately 70–97% of the segmented pore area (Figure 7). Mineral-hosted pores contribute approximately 2–23%, whereas microfractures contribute approximately 1–13%. OM-hosted pores therefore dominate the SEM-visible two-dimensional pore system, although their abundance varies among wells (Figure 8).
Table 2.
SEM-derived pore-area ratios and apparent transformation ratio (ATR) of OM in the examined Long 111 shales.
Figure 7.
Ternary diagram showing the relative area proportions of OM-hosted pores, mineral-hosted pores, and microfractures in the SEM-visible pore system of the Long 111 shale samples.
Figure 8.
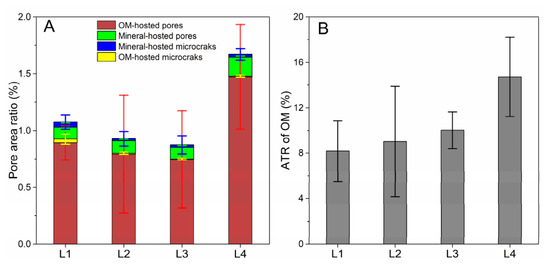
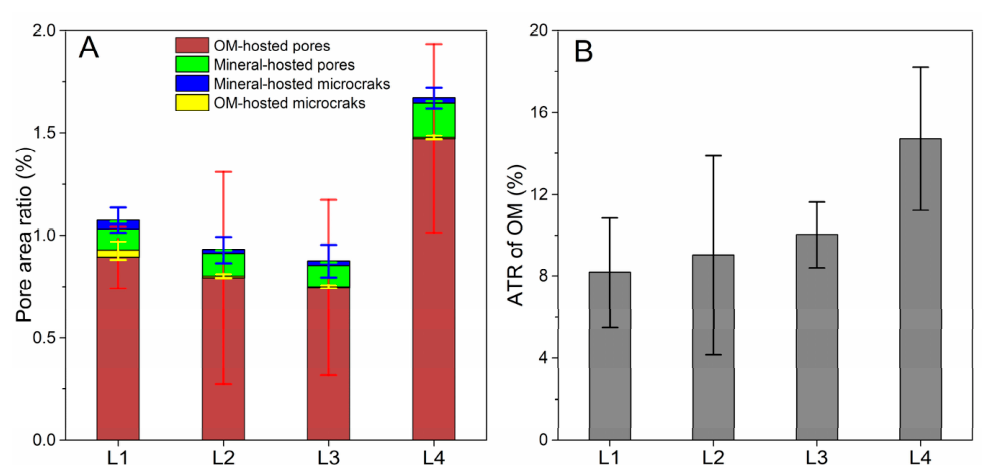
Well-scale variation in OM-hosted pore development. (A) SEM-derived area ratios of OM-hosted pores, mineral-hosted pores, and microfractures. (B) Mean apparent transformation ratio (ATR) of OM in the four wells. Error bars indicate within-well variation.
Figure 9.
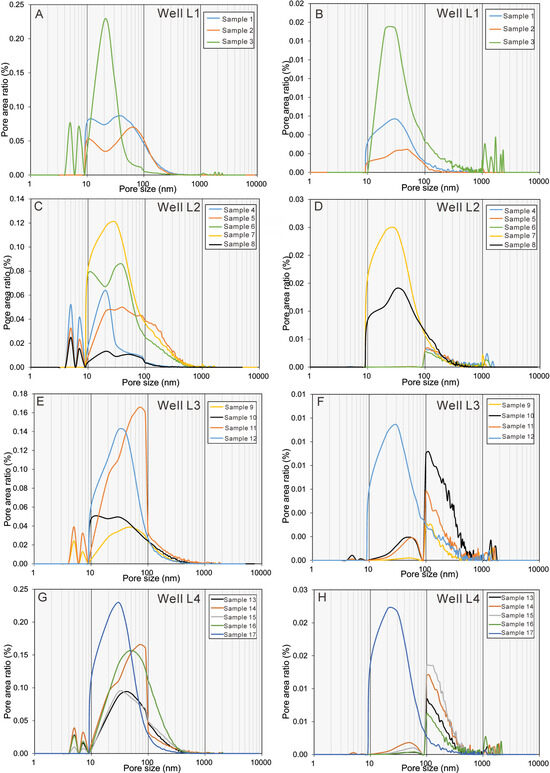
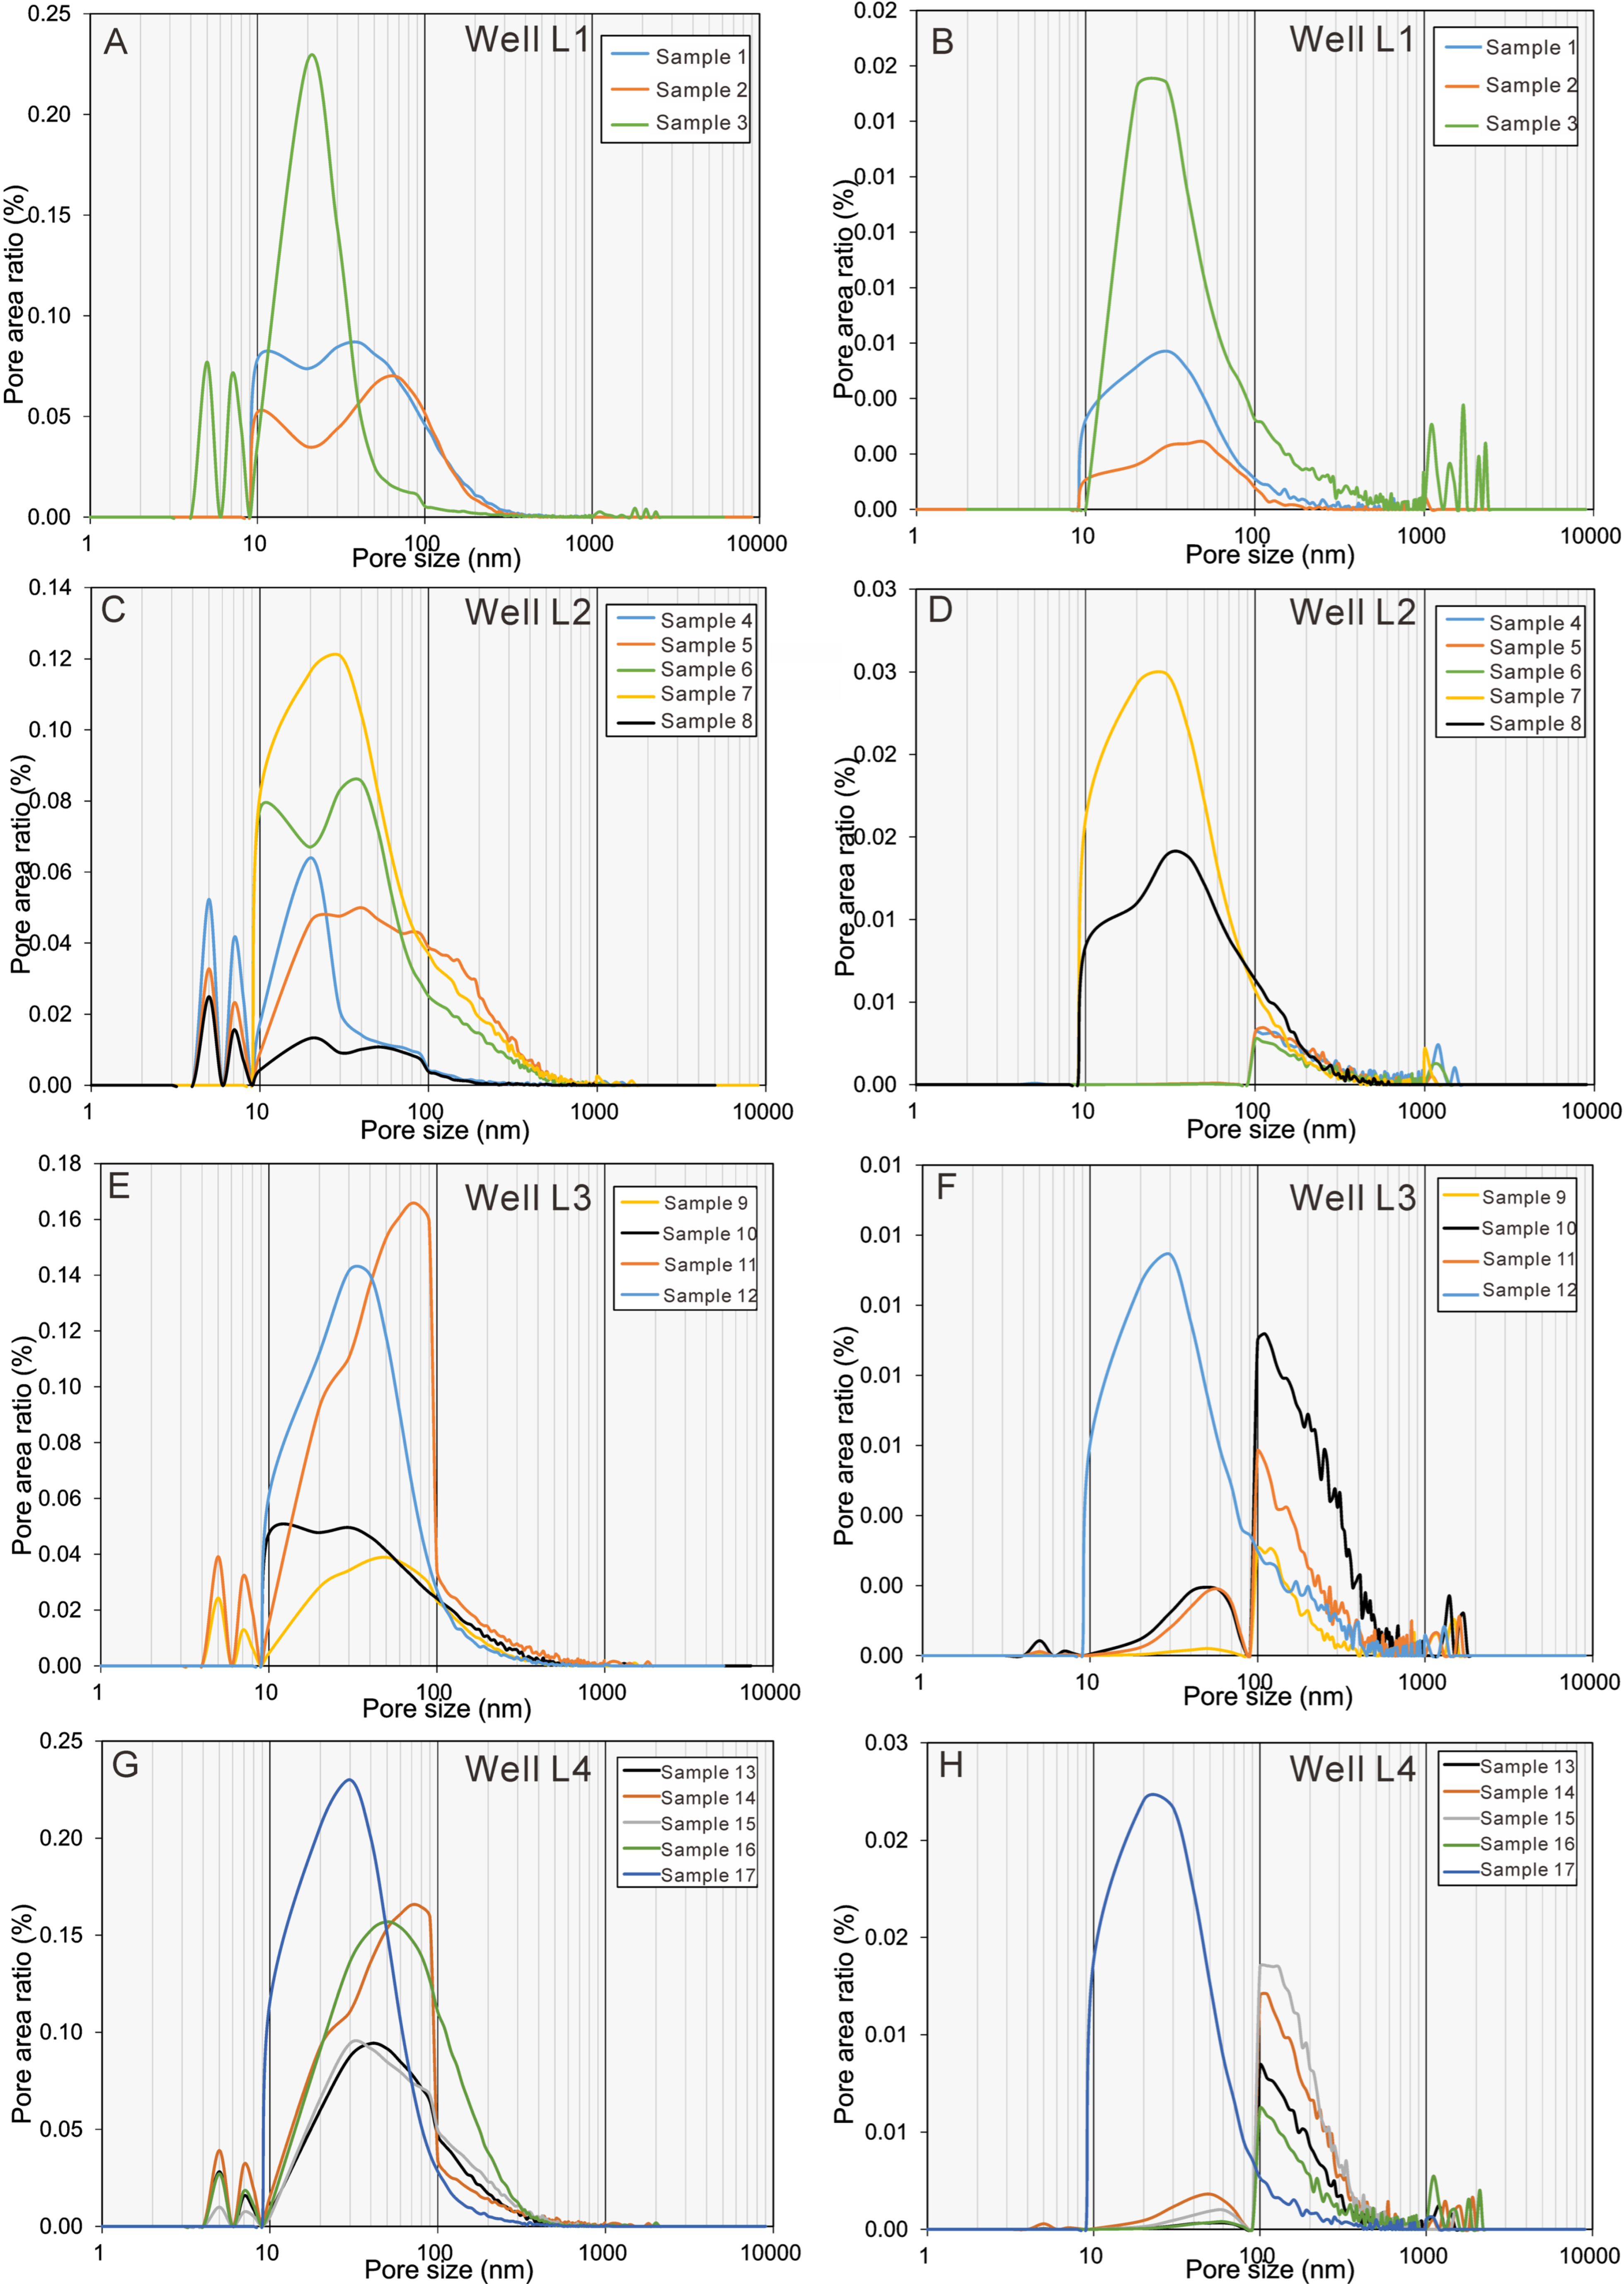
Pore-size distributions of OM-hosted and mineral-hosted pores in the investigated Long 111 shale samples. (A,C,E,G) OM-hosted pore-size distributions in Wells L1–L4. (B,D,F,H) Corresponding mineral-hosted pore-size distributions.
Well L4 has the highest mean total SEM-derived pore-area ratio (1.79%) and OM-hosted pore-area ratio (1.58%), with ATR values of 10.39–18.78% (Figure 8). Well L1 has the second-highest mean total pore-area ratio (1.14%) and OM-hosted pore-area ratio (0.92%) but the lowest mean ATR (8.39%), with individual values of 5.59–9.83%. Well L2 has mean total and OM-hosted pore-area ratios of 0.94% and 0.79%, respectively, and a broader ATR range of 2.40–14.51%. Well L3 has the lowest mean total pore-area ratio (0.81%) and OM-hosted pore-area ratio (0.66%), with a mean ATR of 9.33%. The lack of parallel variation between the OM-hosted pore-area ratio and ATR indicates that total OM-hosted pore area reflects both OM abundance and the extent of visible pore development within OM.
OM-hosted and mineral-hosted pores also differ in size distribution (Figure 9). OM-hosted pores are concentrated mainly at approximately 10–100 nm, although peak positions vary among samples. Samples from Wells L1–L3 commonly peak at several tens of nanometers and locally show tails above 100 nm (Figure 9A,C,E). Samples from Well L4 display broader contributions extending to approximately 200 nm (Figure 9G). Mineral-hosted pores span a wider size range, with some distributions peaking at several tens of nanometers and others near 100–300 nm or locally at the micrometer scale (Figure 9B,D,F,H). Their distributions also vary markedly among samples within the same well, but their total pore-area contribution remains substantially lower than that of OM-hosted pores. Given the 4 nm pixel size, pores smaller than approximately 10 nm cannot be resolved reliably and were therefore excluded from the quantitative calculations in Table 2. However, Figure 9 retains the original pore-size distributions, including the portion below 10 nm, which should be interpreted with caution.
4.4. Relationships Between Mineral Composition and OM-Hosted Pore Development
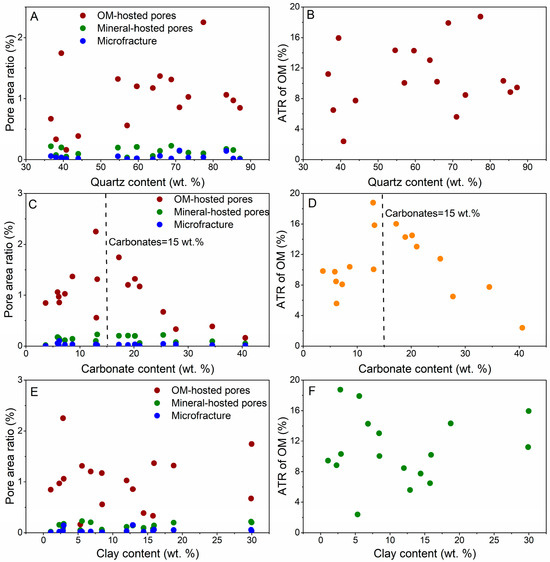
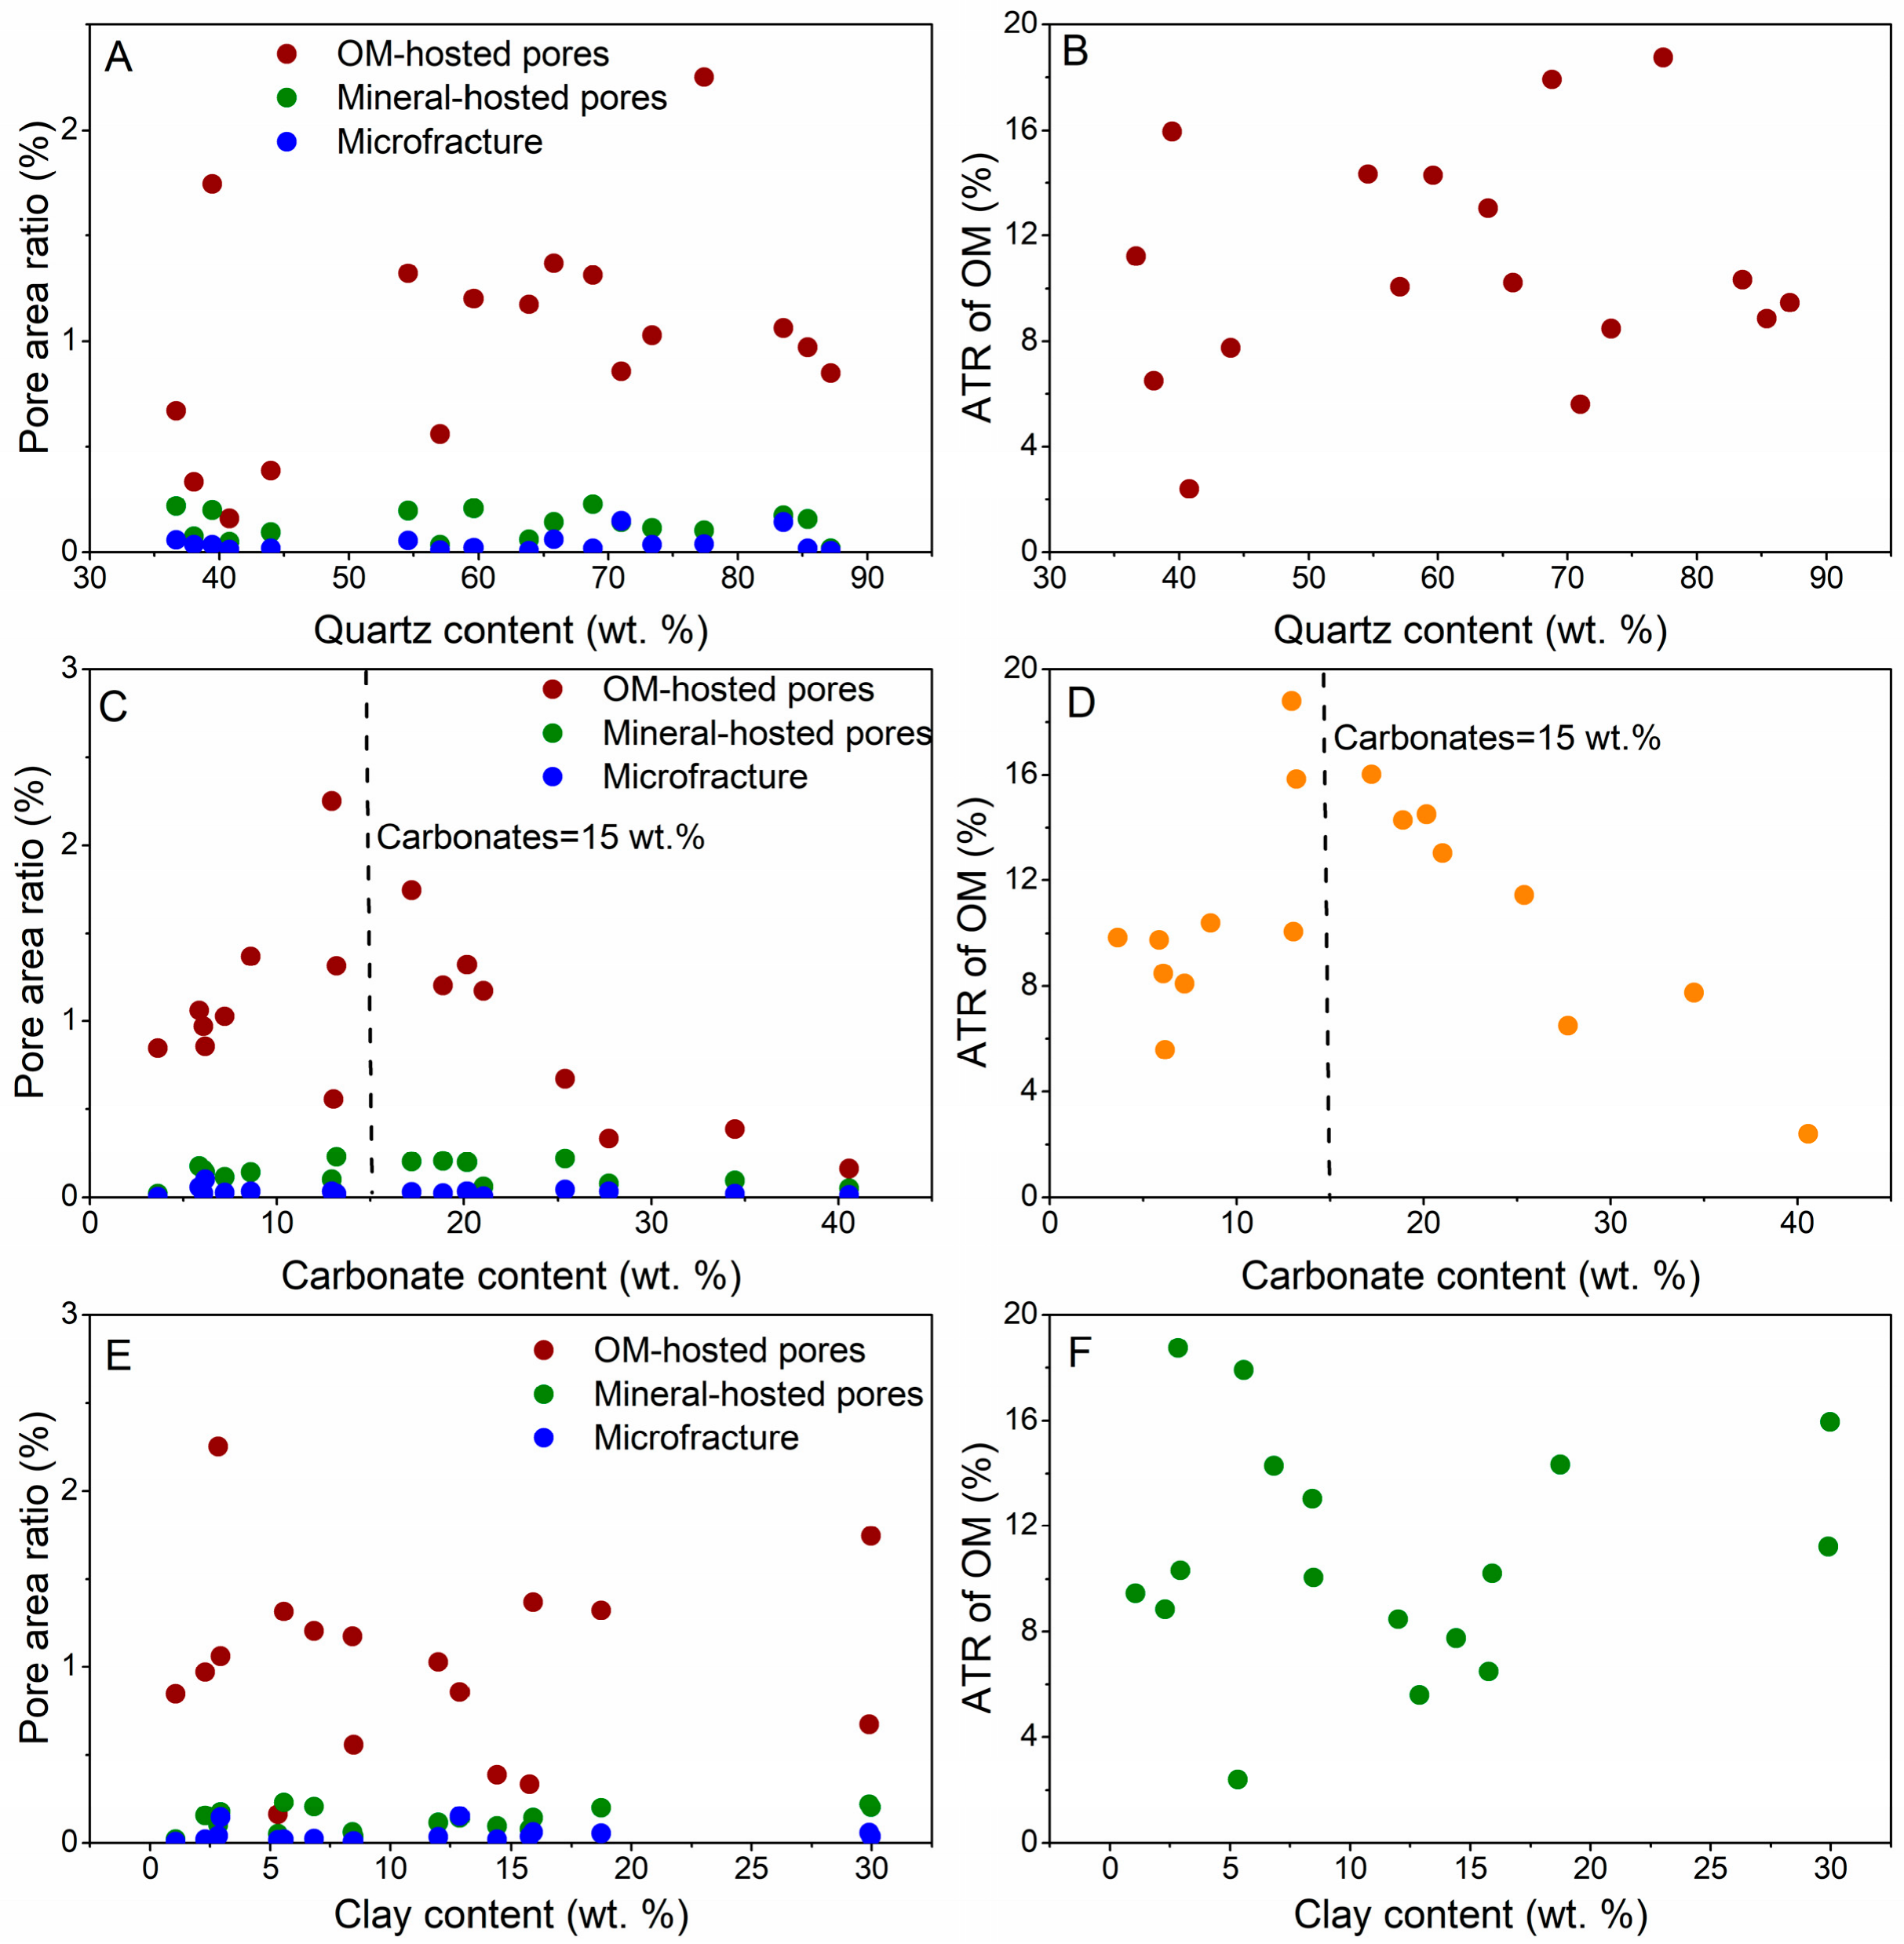
Bulk quartz content shows no consistent relationship with OM-hosted pore-area ratio or ATR (Figure 10A,B). Some carbonate-rich samples exhibit lower values of both parameters, whereas clay content shows no clear association with pore development (Figure 10C–F).
Figure 10.
Relationships between mineral composition and pore development in the investigated Long 111 shales. Pore-area ratios (A,C,E) and ATR of OM (B,D,F) are plotted against quartz, carbonate, and clay contents, respectively.
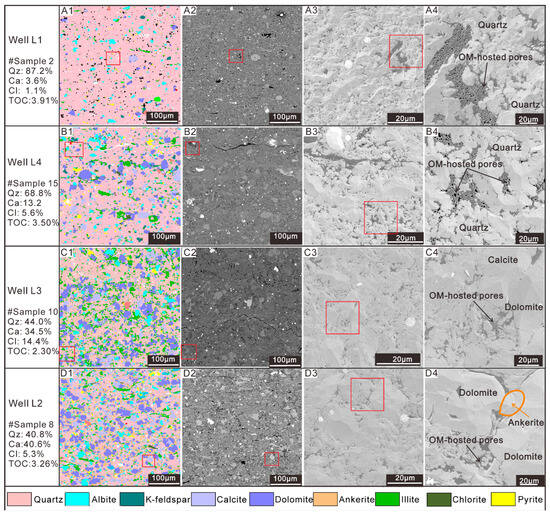
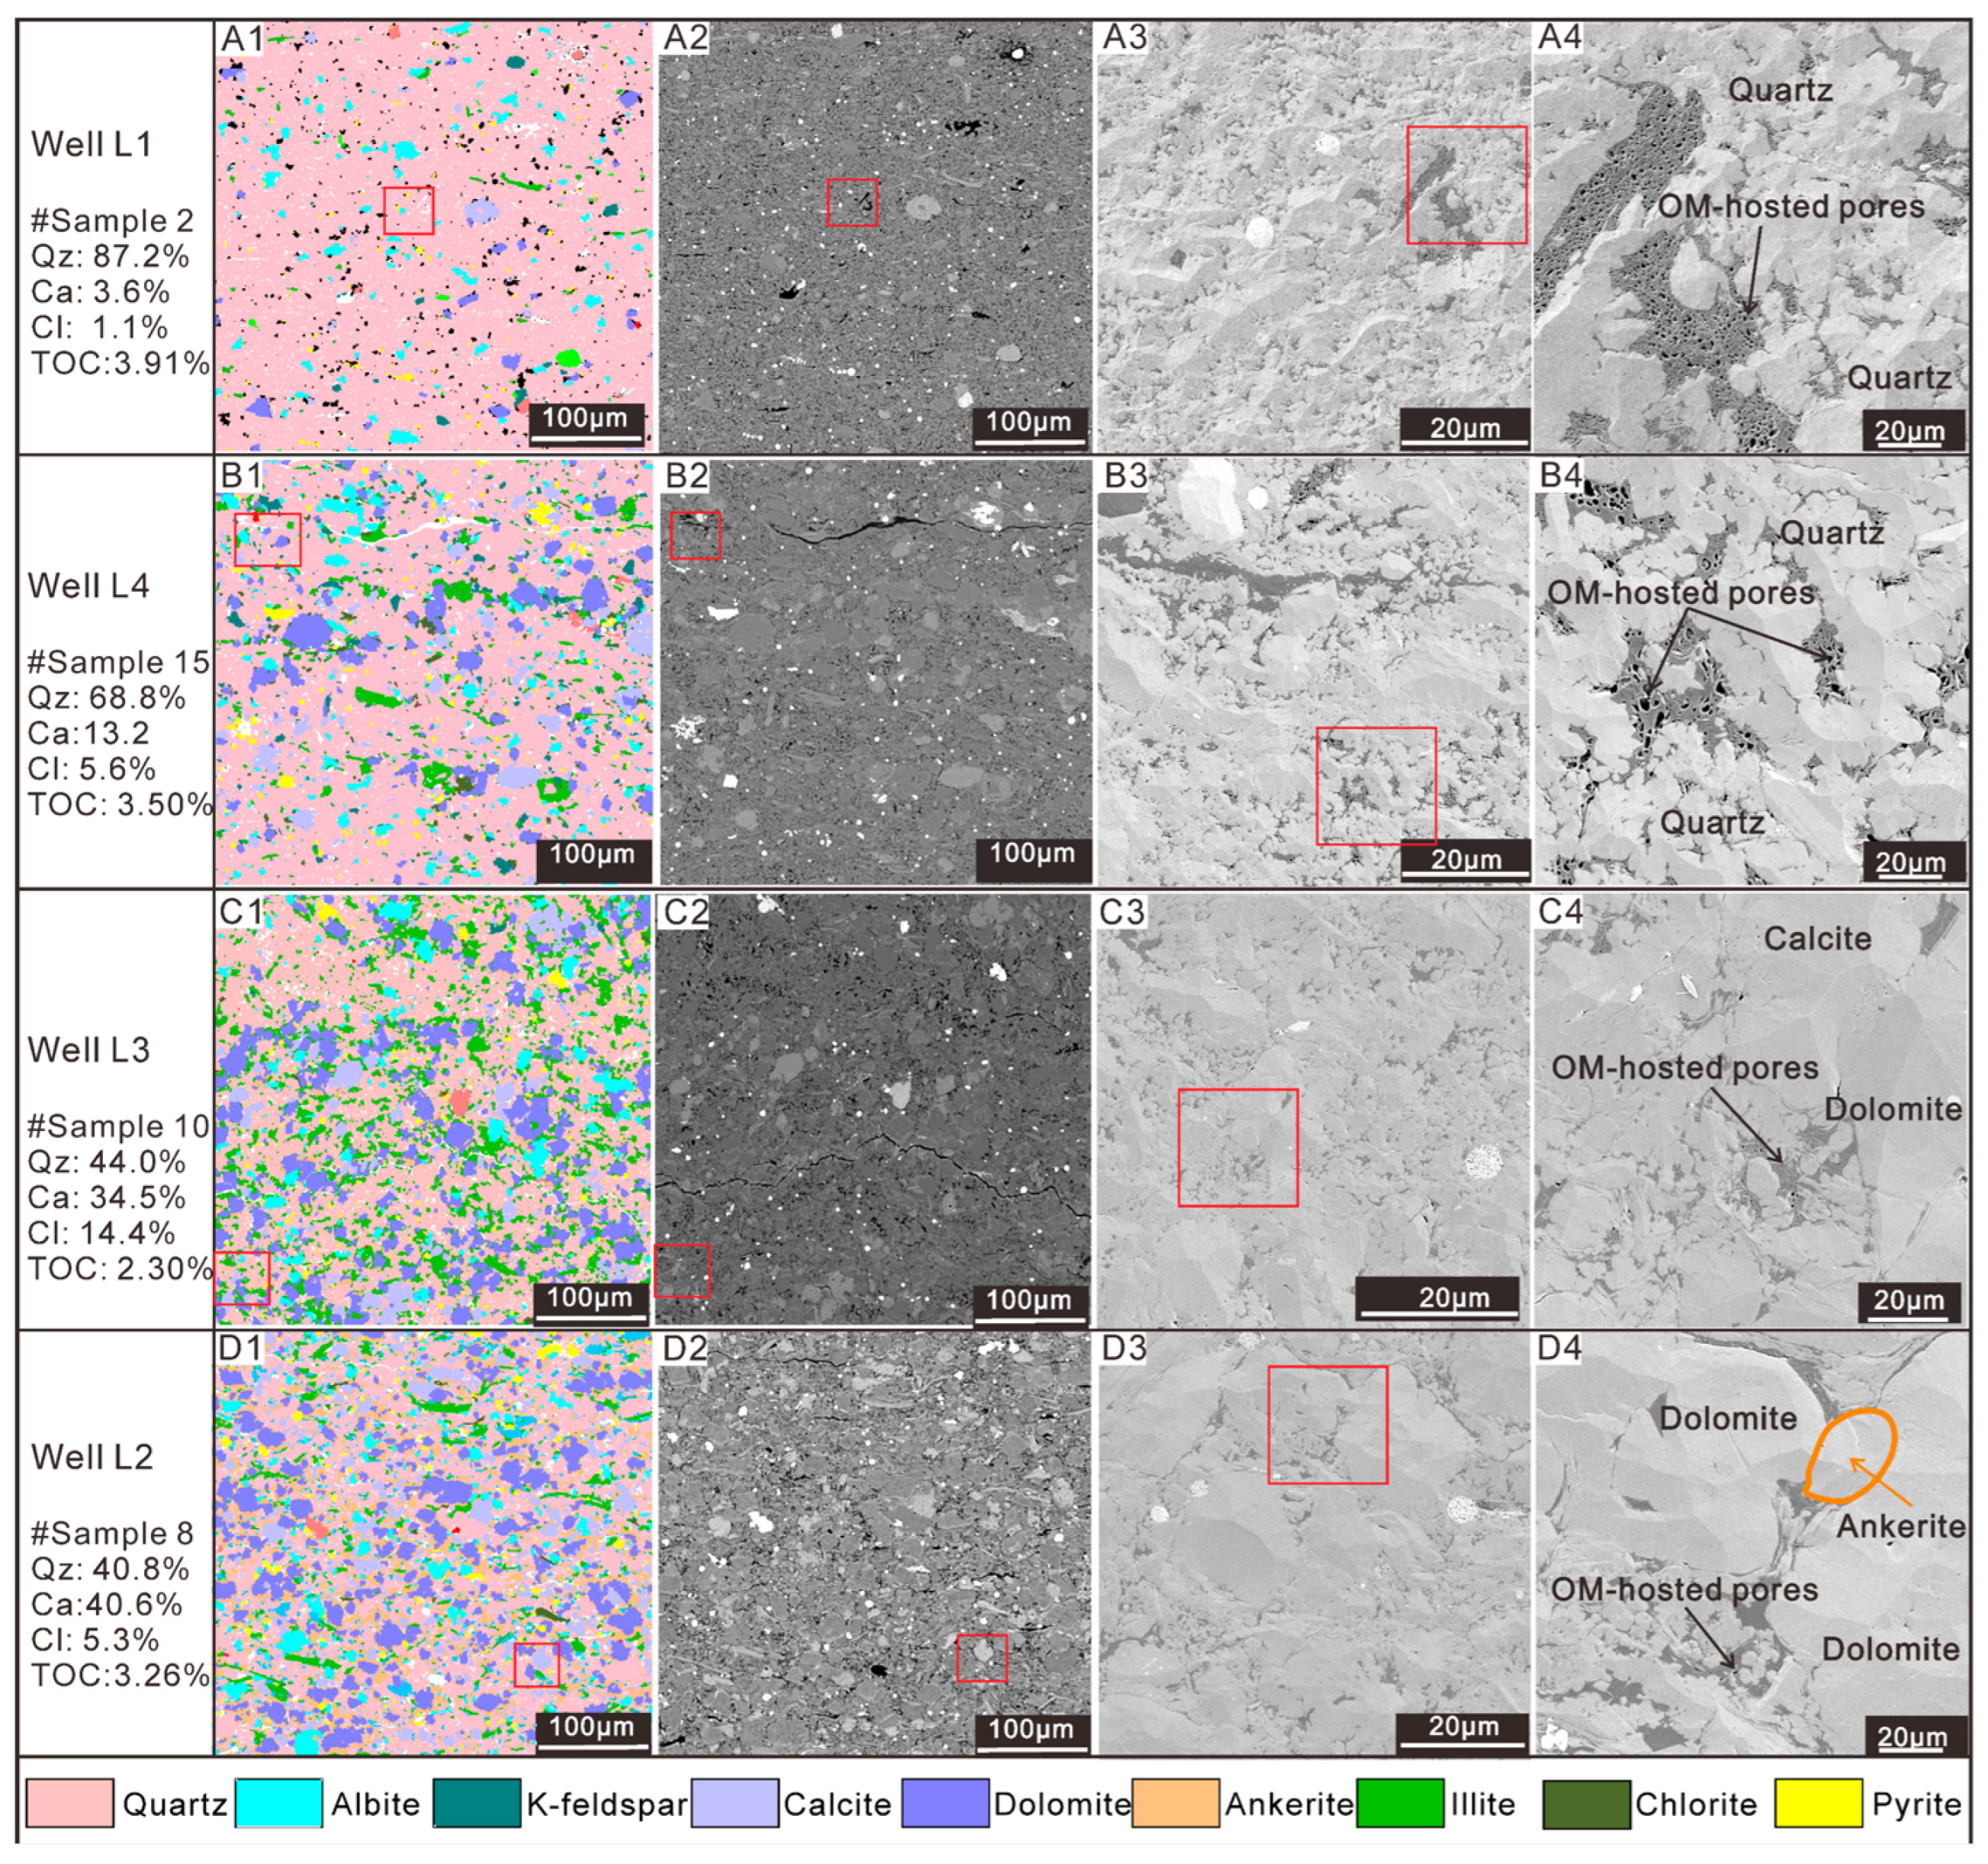
The mineral maps and SEM images show differences in OM occurrence among samples with contrasting carbonate contents (Figure 11). Among samples with similar TOC, increasing carbonate abundance is accompanied by less space occupied by porous OM. For example, samples with 3.5–3.9 wt.% TOC and <15 wt.% carbonate contain abundant porous OM within quartz-dominated matrices (Figure 11(A1–A4,B1–B4)), whereas a sample with similar TOC (3.26 wt.%) but 40.6 wt.% carbonate displays poorer OM-hosted pore development (Figure 11(D1–D4)). These observations show that samples with similar TOC can differ considerably in OM occurrence and pore development.
Figure 11.
Carbonate-associated changes in OM occurrence and pore development. Rows (A1–D4) show mineral maps and corresponding SEM images of samples with increasing carbonate content. Qz, quartz content; Ca, total carbonate content; Cl, total clay mineral content; TOC, total organic carbon.
4.5. Relationships Between OM Properties and OM-Hosted Pore Development
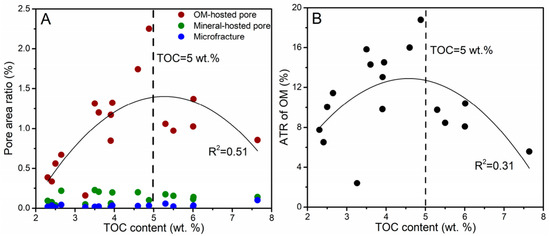
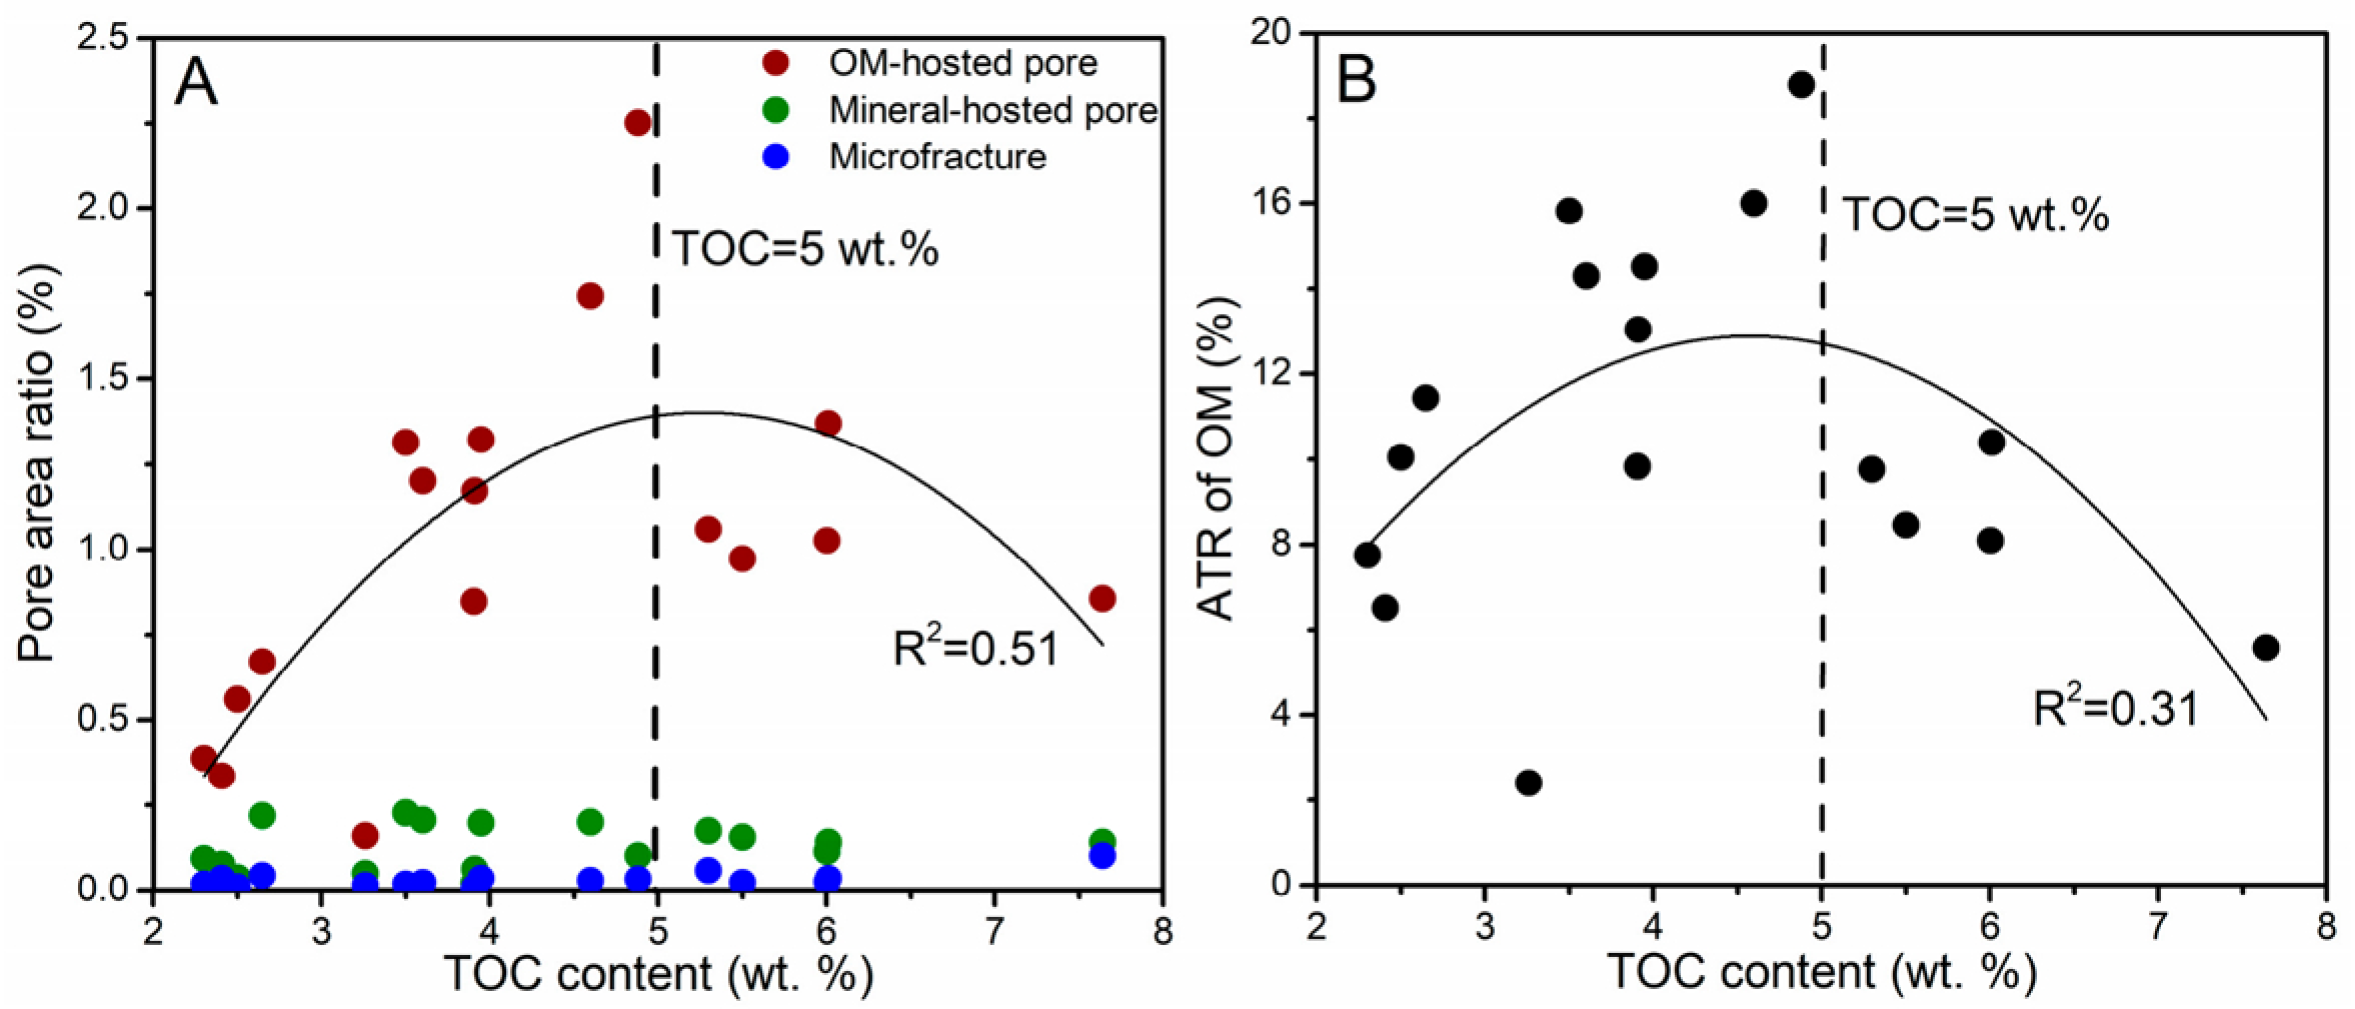
Across the examined Longmaxi shale samples, both OM-hosted pore-area ratio and ATR generally increase from low to intermediate image-derived TOC, but several samples above approximately 5 wt.% TOC have lower values (Figure 12A,B). Quadratic regression provided a better fit than linear regression for the OM-hosted pore-area ratio (R2 = 0.513 versus 0.184).
Figure 12.
Dependence of OM-hosted pore development on image-derived TOC in the investigated Long 111 shales. (A) SEM-derived pore-area ratios versus image-derived TOC. (B) Apparent transformation ratio (ATR) of OM versus image-derived TOC.
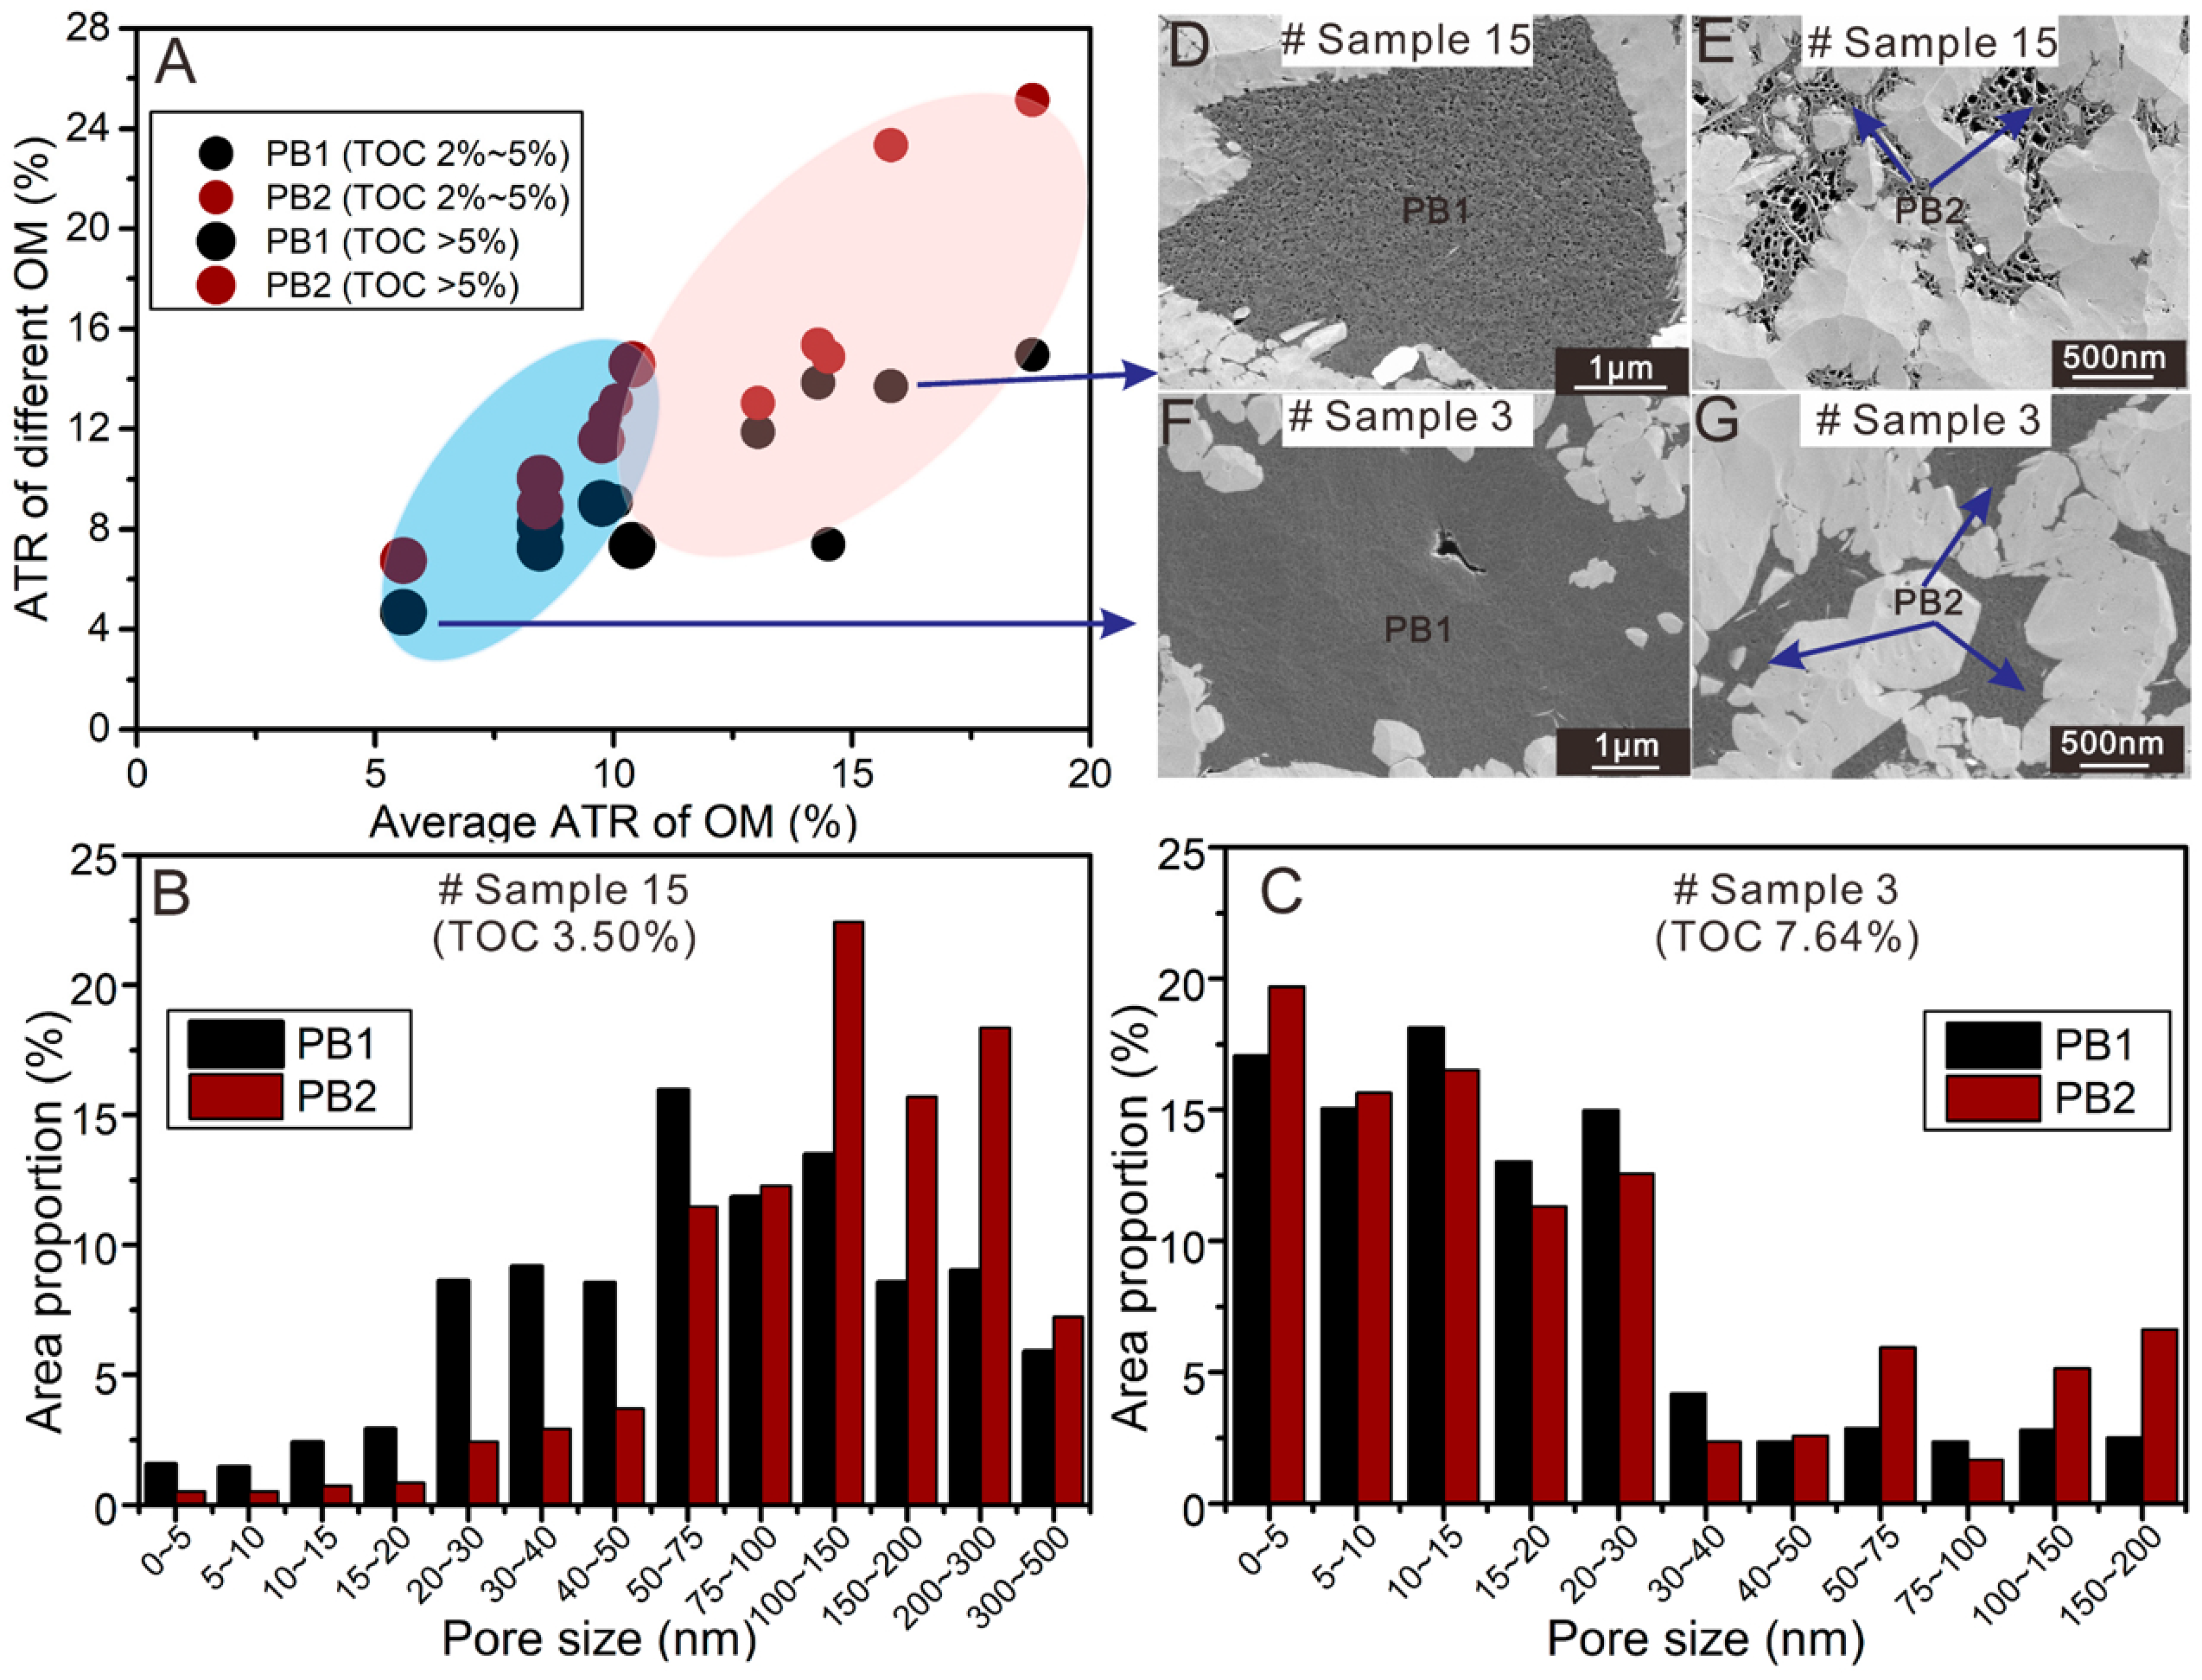
A sample-level paired comparison further showed that PB2 had higher mean ATR than PB1 in samples with available paired measurements (Figure 13A), with an average difference of 4.42 percentage points (95% CI: 2.51–6.33; Table S1). However, the magnitude of this difference varied considerably among samples (Table S1), as also illustrated in Figure 13B–G. In the intermediate-TOC Sample 15 (3.50 wt.%), PB2 contains abundant pores in the 100–300 nm range and is coarser than PB1 (Figure 13B,D,E). In the high-TOC Sample 3 (7.64 wt.%), both PB1 and PB2 display finer pore-size distributions and a less pronounced contrast (Figure 13C,F,G).
Figure 13.
Contrasting pore development in PB1 and PB2 at different TOC levels. (A) ATR of in-place (PB1) and migrated (PB2) pyrobitumen domains. The pink and blue shaded areas highlight samples with TOC contents of 2–5 wt.% and >5 wt.%, respectively. (B,C) Pore-size distributions of PB1 and PB2 in an intermediate-TOC sample (Sample 15, Well L4) and a high-TOC sample (Sample 3, Well L1), respectively. (D–G) SEM images of PB1 and PB2 in Samples 15 and 3.
5. Discussion
5.1. Influence of Mineral Framework on OM-Hosted Pore Preservation
The examined siliceous Longmaxi shales contain abundant quartz, predominantly as fine-grained to microcrystalline aggregates (Figure 3A), a texture widely interpreted as authigenic and partly derived from biogenic silica during early diagenesis [36,39,43]. Such quartz-rich frameworks can favor pore preservation by resisting compaction and maintaining accommodation for later hydrocarbon emplacement [37,38,40]. In this dataset, however, bulk quartz content shows no clear relationship with either the OM-hosted pore-area ratio or ATR (Figure 10A,B). Quartz may therefore provide a pervasive supporting framework, but its bulk abundance alone does not explain variation in OM-hosted pore development among samples with broadly siliceous mineralogy.
Carbonate minerals have contrasting effects on pore development, depending on their occurrence and degree of cementation. Individual carbonate grains can provide mechanical support, whereas abundant carbonate crystals and cements may occupy interparticle space and restrict OM occurrence [39,41,42]. This distinction helps explain the observed carbonate-related differences in pore development (Figure 10C,D). Moreover, petrographic comparisons provide microstructural context for the carbonate-related decline in OM-hosted pore development. In relatively carbonate-poor samples, porous OM commonly occurs between quartz-rich domains (Figure 11(A4,B4)). In carbonate-rich samples, OM is largely confined to narrow spaces among blocky carbonate crystals and contains fewer visible pores (Figure 11(C4,D4)). Such restricted space may limit the accumulation of migrated hydrocarbons and the subsequent development of pores within secondary OM.
The timing of carbonate cementation may further influence this process. Previous studies of the Longmaxi shales have identified different generations of carbonate minerals, including early calcite and dolomite and ankerite overgrowths on dolomite during deeper burial [39,41]. Carbonate cementation before hydrocarbon migration could reduce the space available for migrated OM (e.g., Figure 11(C3,C4)), whereas later ankerite overgrowths could occupy residual pores and modify the mineral framework surrounding existing OM (e.g., Figure 11(D3,D4)). Both processes may contribute to the restricted occurrence and poorer pore development of OM in carbonate-rich fabrics. However, the relative timing of carbonate cementation and hydrocarbon emplacement cannot be determined from the present two-dimensional observations alone.
Within this dataset, clay content shows no comparably clear association with OM-hosted pore development (Figure 10E,F). The stronger association with carbonate abundance may therefore reflect differences in how these minerals occupy space within the shale matrix. Overall, the SEM observations suggest that the occurrence and spatial arrangement of minerals, particularly carbonate grains and cements, are important in controlling the accommodation and preservation of porous OM.
5.2. Controls of OM Type and Abundance on Pore Development
Although OM-hosted pores dominate the pore system in all examined samples, their development is not a monotonic function of OM abundance (Figure 12). Similar nonlinear relationships between TOC and pore development have been reported in the Longmaxi Formation and other gas shales [19,50,51]. Previous studies attribute such patterns to the combined effects of OM-hosted pore generation, thermal evolution, compaction, and mineral-framework support [26,52,53]. The present data therefore indicate that TOC alone is insufficient to predict SEM-visible OM-hosted pore development.
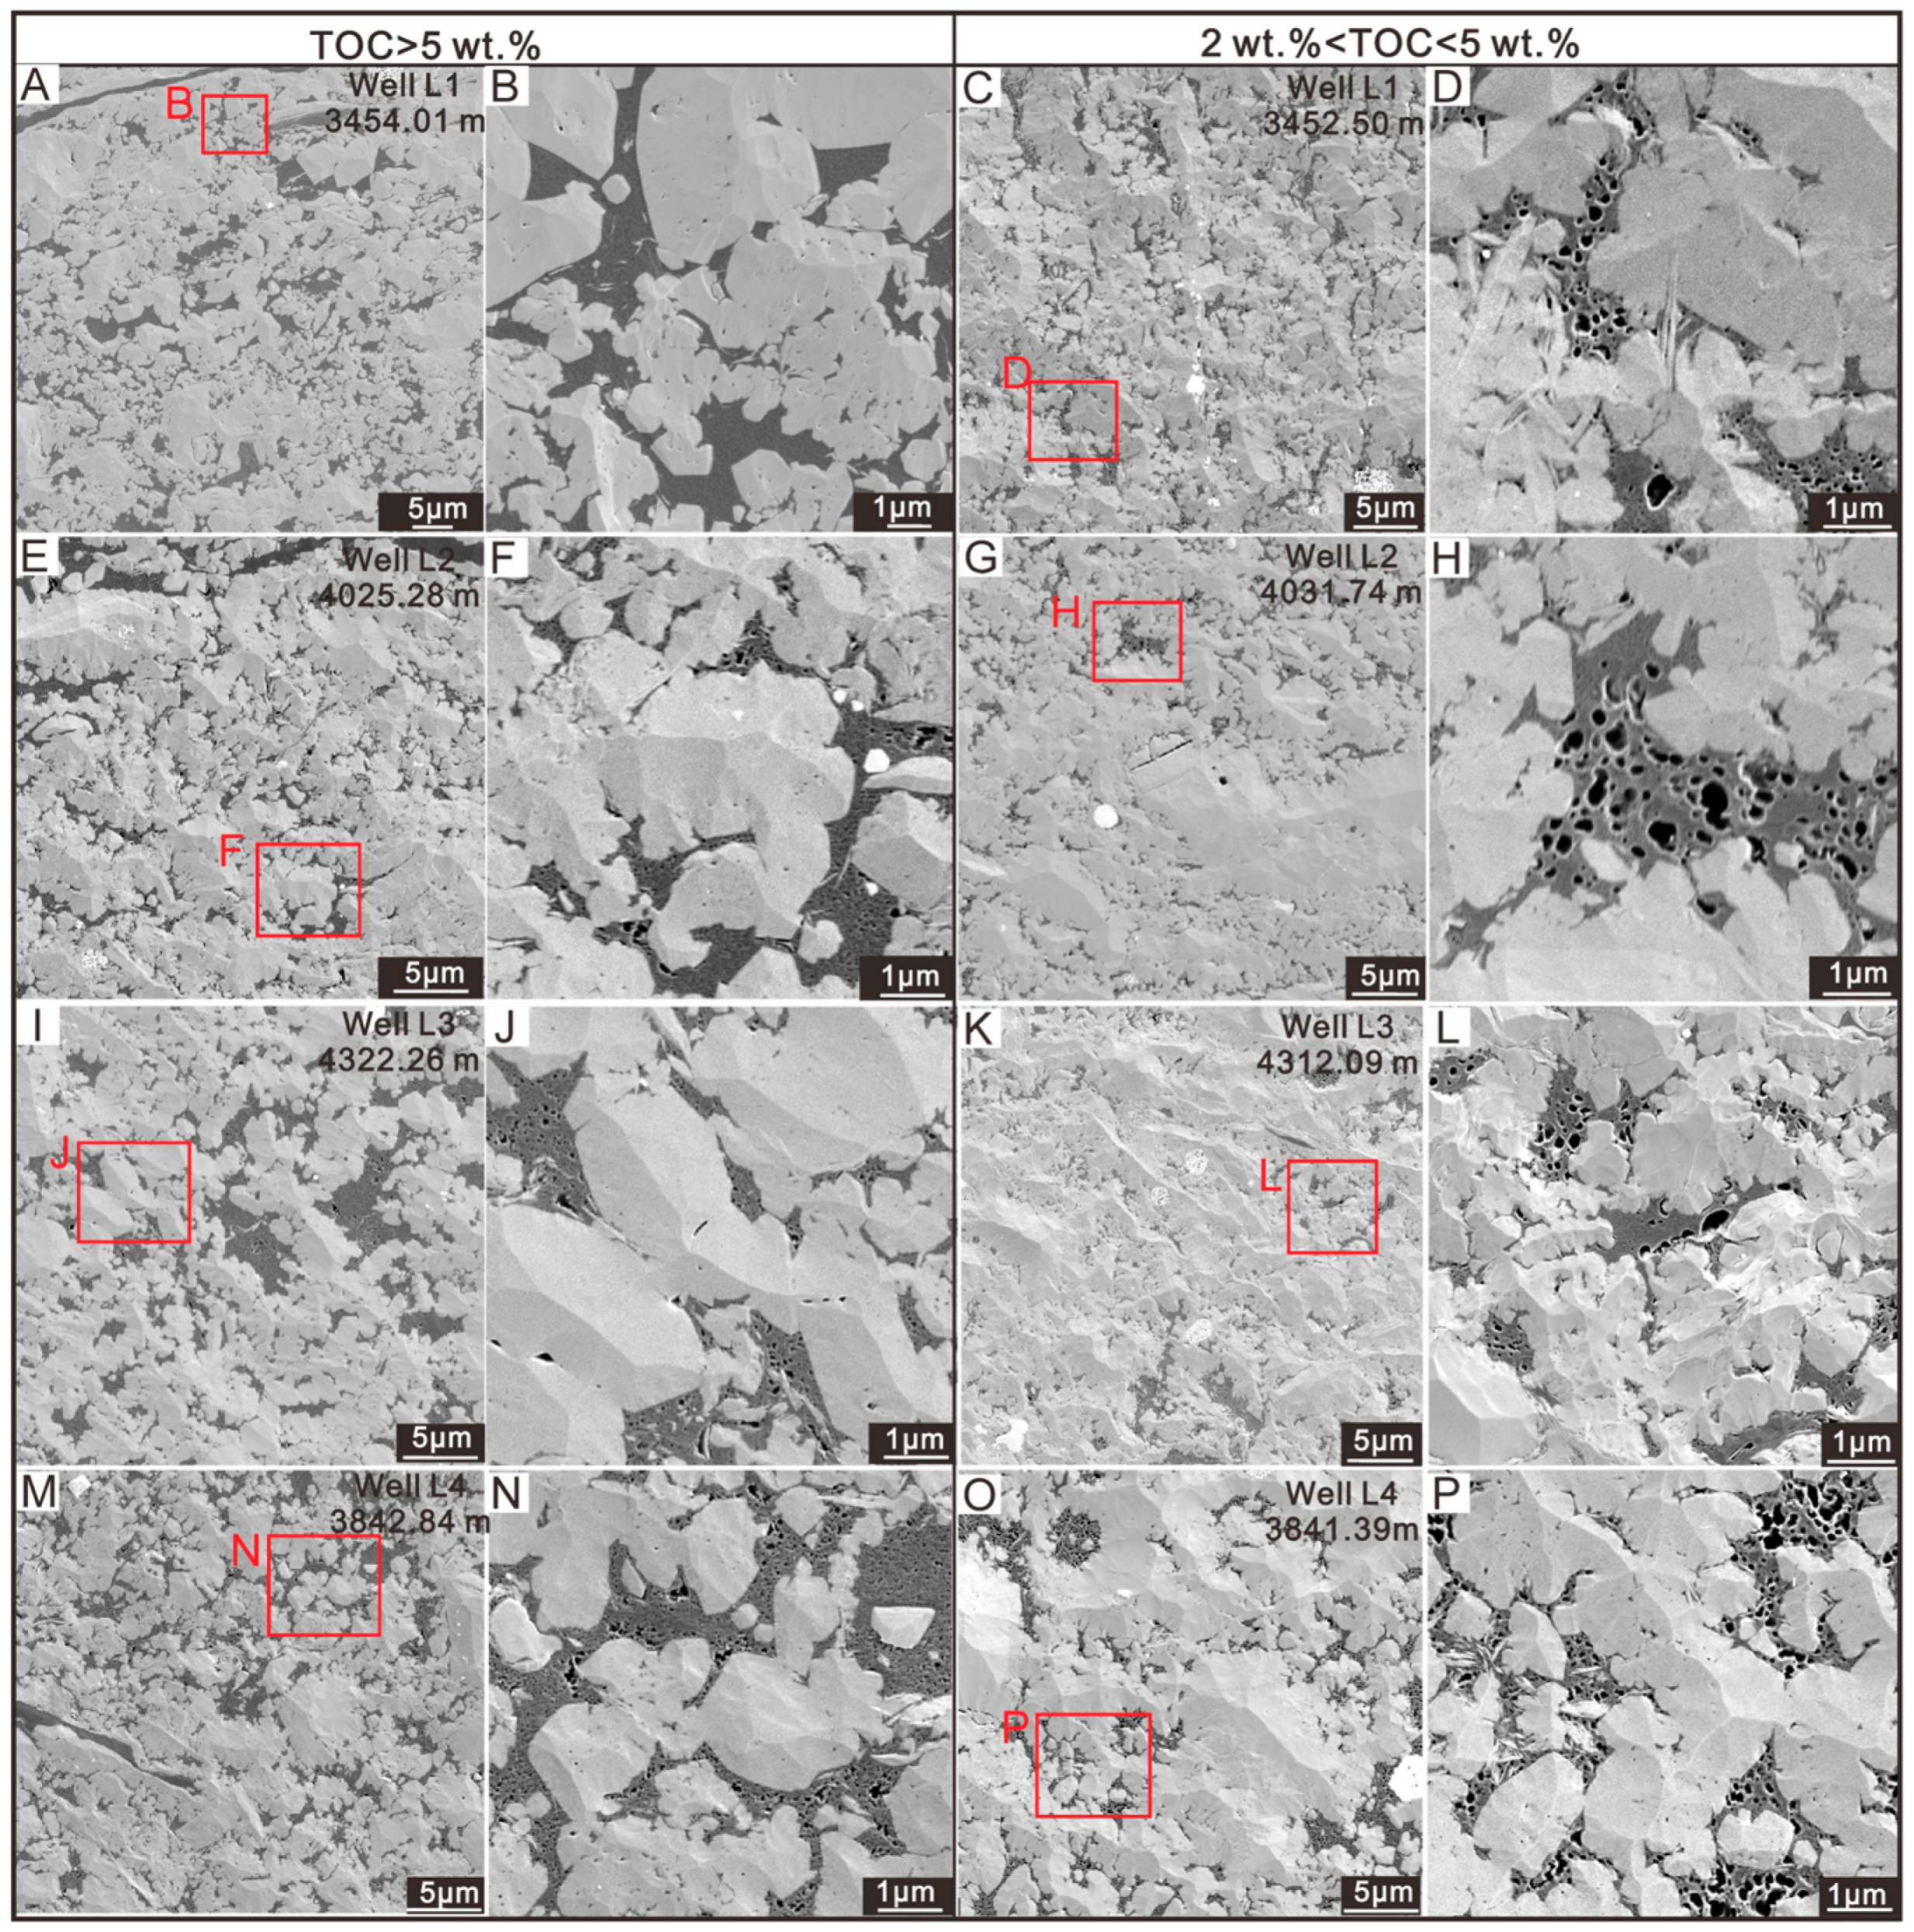
Differences between pyrobitumen populations provide further insight into this nonlinear TOC relationship. In the examined Longmaxi shales, migrated pyrobitumen (PB2) generally contains larger SEM-visible pores and has a higher ATR than coexisting in-place pyrobitumen (PB1) (Figure 5 and Figure 13A). Earlier studies documented pronounced textural and pore heterogeneity among solid-bitumen or pyrobitumen populations and related part of this variability to compositional differences produced by hydrocarbon migration and chromatographic fractionation [30,33,35]. The present observations further indicate that the contrast between PB1 and PB2 covaries with OM abundance and spatial organization. Across the four wells, highly porous, sponge-like OM is also observed more frequently in samples with 2–5 wt.% TOC than in samples with >5 wt.% TOC (Figure 14). Together, these observations suggest that pore heterogeneity between PB1 and PB2 is most pronounced at low to intermediate TOC within this dataset.
Figure 14.
Representative OM-hosted pore textures in higher- and lower-TOC examples from Wells L1–L4. (A,B,E,F,I,J,M,N) Higher-TOC examples (>5 wt.%). (C,D,G,H,K,L,O,P) Examples with 2–5 wt.% TOC. In each pair, the second image enlarges the boxed area in the first.
One possible explanation is that increasing OM abundance alters the spatial organization and mechanical behavior of the organic–mineral framework. At moderate OM abundance, pyrobitumen commonly occurs as discrete domains surrounded by mechanically rigid mineral grains such as quartz (e.g., Figure 14G,H). At higher abundance, OM domains may become more laterally continuous (e.g., Figure 14A,B) and occupy a larger proportion of the local load-bearing framework. Because mature OM generally has a substantially lower elastic modulus than rigid minerals such as quartz, continuous OM domains may be more susceptible to deformation during deep burial [54,55]. Such deformation could reduce preservation of larger OM-hosted pores and contribute to the finer pore-size distributions observed in some high-TOC samples (e.g., Figure 13F,G).
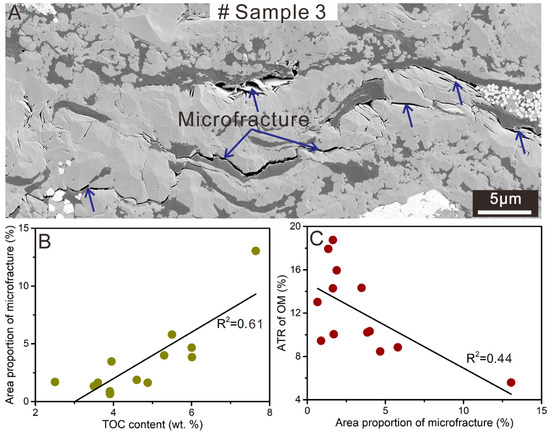
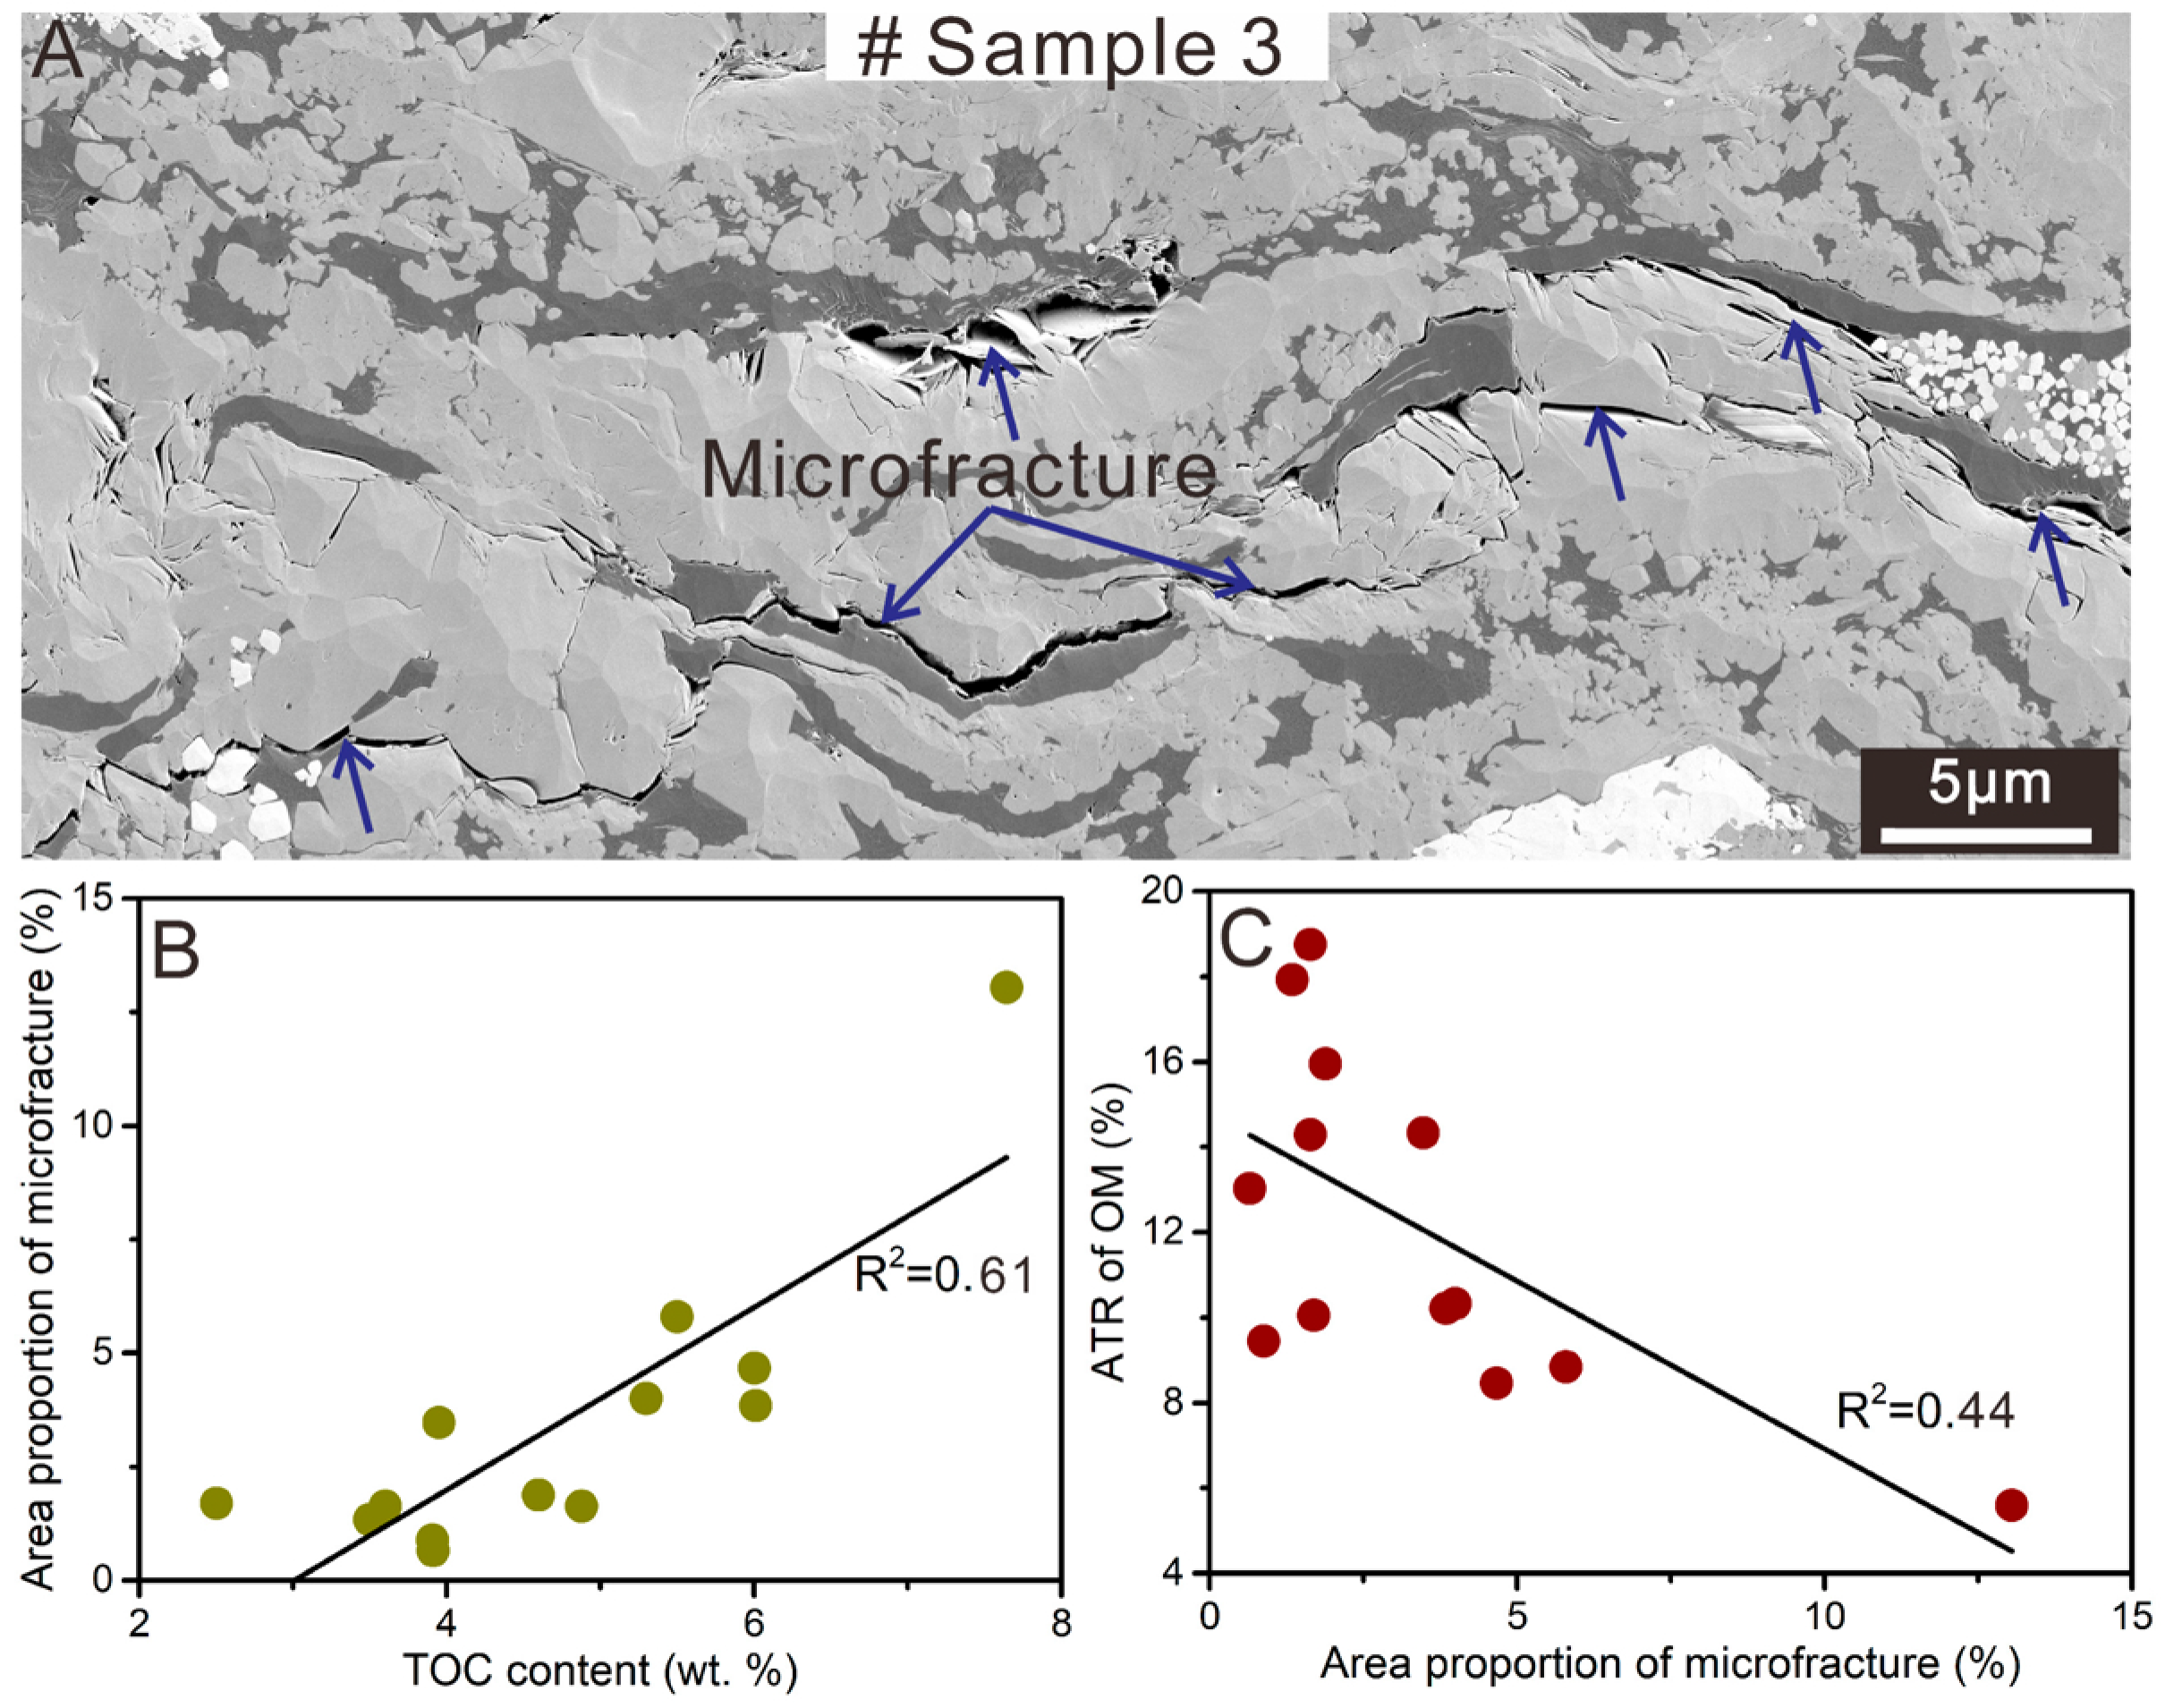
Fracture-assisted hydrocarbon expulsion may provide an additional explanation for reduced pore development in some high-TOC samples. Hydrocarbon generation and migration can promote microfracturing and create pathways for hydrocarbon expulsion [56,57,58]. In the present study, microfractures occur commonly along OM boundaries and locally extend through OM domains in the high-TOC Sample 3, Well L1 (Figure 15A). To reduce the potential influence of carbonate-rich mineral fabrics, the relationships among TOC, microfracture area proportion, and ATR were examined in 13 samples with carbonate contents below 25 wt.% (Figure 15B,C). The positive TOC–microfracture and negative microfracture–ATR relationships remain under alternative cutoffs of 20 and 30 wt.%, although the former becomes weaker at the higher cutoff. The 25 wt.% cutoff is therefore treated as an exploratory criterion rather than a geological threshold. These patterns are consistent with, but do not prove, the possibility that enhanced fracture-assisted expulsion reduces retention of the more mobile, aliphatic-rich hydrocarbons available for subsequent secondary cracking and pore formation [35].
Figure 15.
Microfracture occurrence and associations with TOC and ATR of OM. (A) Representative SEM image showing microfractures along OM boundaries in Sample 3. (B) Association between microfracture area proportion and image-derived TOC. (C) Association between apparent transformation ratio (ATR) and microfracture area proportion.
5.3. Organic–Inorganic Coupling Controls on OM-Hosted Pore Development
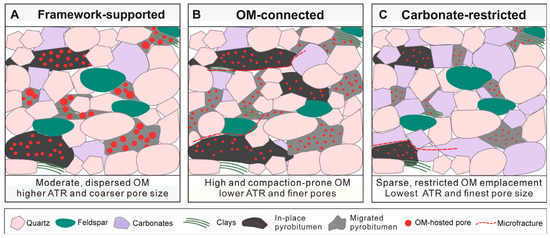
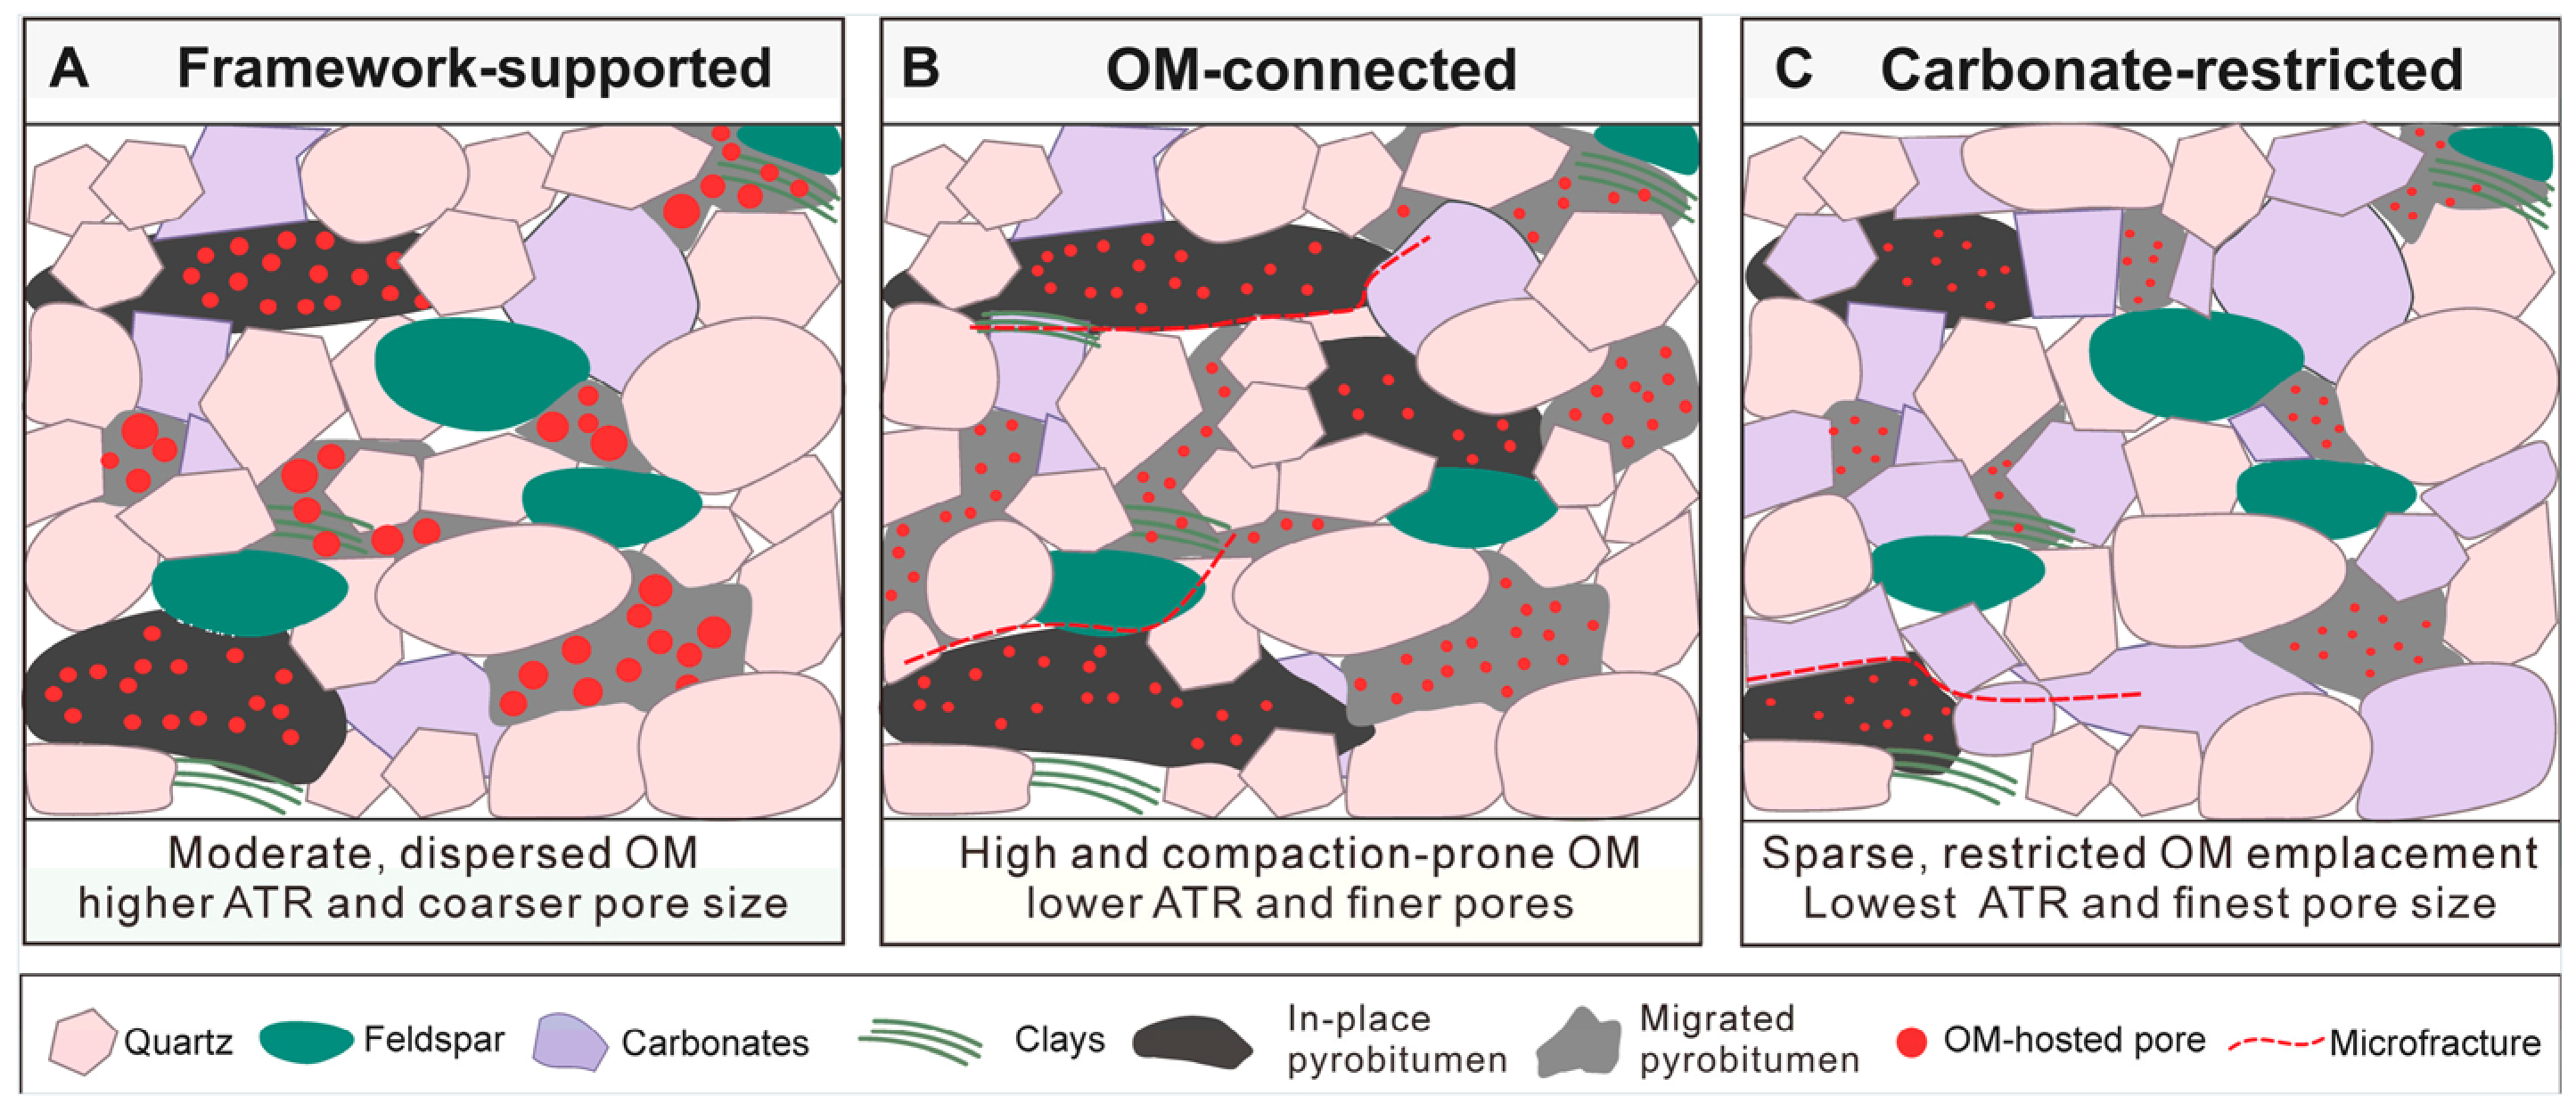
Although migrated pyrobitumen (PB2) generally exhibits greater pore development than in-place pyrobitumen (PB1), the magnitude of this difference depends on OM abundance and the surrounding mineral framework. The observed heterogeneity is therefore interpreted as the product of coupled organic evolution and inorganic diagenesis rather than either factor alone. On the basis of these two-dimensional observations, three end-member coupling configurations are proposed as a working hypothesis to explain the observed pore heterogeneity (Figure 16), rather than as a validated model of pore formation and preservation.
Figure 16.
Conceptual framework for OM-hosted pore heterogeneity within the broadly defined siliceous stratigraphic interval. (A) Framework-supported, (B) OM-connected, and (C) carbonate-restricted configurations.
In the framework-supported configuration (Figure 16A), moderate and relatively dispersed OM occurs within a microcrystalline quartz-rich framework with limited carbonate occupation. Residual interparticle accommodation permits emplacement of migrated OM, while rigid mineral grains such as quartz help preserve pores generated during subsequent cracking. Under these conditions, the greater pore development of PB2 is expressed most clearly, producing relatively high ATR and coarser OM-hosted pores. In the OM-connected configuration (Figure 16B), more continuous OM supplies abundant pore-forming material but also forms mechanically compliant domains that may deform during deep burial. Local fractures may further facilitate hydrocarbon expulsion and reduce the material available for subsequent pore generation. These effects are consistent with finer pores and a smaller contrast between PB1 and PB2 in some OM-rich samples. In the carbonate-restricted configuration (Figure 16C), abundant carbonate occupies residual interparticle space and confines OM to narrow spaces between carbonate grains and cements. PB2-associated pore development is then expressed less effectively, resulting in low ATR and poorly developed OM-hosted pores. These end members illustrate how contrasting OM–mineral spatial arrangements can produce different pore systems within the same stratigraphic target.
Although the examined samples differ in present burial depth, they share a broadly similar regional tectonic and thermal setting, with overmature OM and over-pressured conditions favorable for pore preservation. Notably, considerable pore heterogeneity also occurs within individual wells over narrow depth intervals (e.g., Well L2), suggesting that burial depth alone cannot explain the observed differences. Nevertheless, well-specific burial histories and compaction effects may also contribute to pore development and cannot be fully separated from organic–mineral interactions in the present dataset.
The proposed coupling framework provides a pore-scale perspective that may complement reservoir quality evaluation in deep shales. Regional exploration frameworks commonly emphasize favorable combinations of OM richness, siliceous mineralogy, bulk porosity, pressure and preservation conditions, and effective shale thickness [1,2,6]. These parameters are useful for identifying regionally favorable intervals, but they may not explain reservoir-quality variation within an already organic-rich and quartz-rich target. The present results suggest that favorable OM-hosted pore development requires both pore-prone OM, particularly migrated pyrobitumen, and sufficient accommodation and mechanical support from the mineral framework. In the investigated Longmaxi shales, this combination is represented by moderate OM abundance, a microcrystalline quartz-supported framework, and limited carbonate occupation of residual interparticle space. Because the reported metrics are two-dimensional, image-based indicators, they should complement rather than replace bulk porosity and reservoir-scale measurements.
6. Conclusions
This study examined pore heterogeneity in 17 deep Longmaxi shale samples from the same stratigraphic interval (Long 111 interval) of four wells in southern Sichuan by integrating large-area SEM imaging, automated mineral mapping, and quantitative image analysis. The principal conclusions are as follows:
- (1)
- OM-hosted pore development varies considerably among samples and cannot be explained by OM abundance or bulk mineral composition alone. The total SEM-derived pore-area ratio ranges from 0.23% to 2.39%, and OM ATR ranges from 2.40% to 18.78%. OM-hosted pores account for approximately 70–97% of the segmented pore area, but their development does not increase consistently with image-derived TOC. Migrated pyrobitumen (PB2) generally contains coarser and more extensively developed pores than in-place pyrobitumen (PB1), although the magnitude of this contrast varies among samples. These differences indicate that OM type and occurrence are important for understanding pore heterogeneity.
- (2)
- The surrounding mineral framework also plays an important role. Although bulk quartz content shows no clear relationship with pore development, quartz-rich frameworks may provide mechanical support for porous OM during burial. In contrast, carbonate-rich fabrics commonly restrict OM to the remaining spaces between mineral grains and are associated with poorer OM-hosted pore development. These observations suggest that mineral occurrence and spatial arrangement, rather than mineral abundance alone, influence the space available for OM and the preservation of its pores.
- (3)
- The spatial relationships between OM and minerals help explain differences in pore development within the same stratigraphic interval, even under broadly similar lithofacies and regional preservation conditions. Porous OM commonly occurs between quartz-rich domains, whereas in carbonate-rich fabrics, OM is largely confined to narrow residual spaces and contains fewer visible pores. Together with differences in OM abundance and occurrence, these observations form the basis of three conceptual configurations: framework-supported, OM-connected, and carbonate-restricted. These configurations provide a possible explanation for pore heterogeneity under broadly similar geological conditions, although the underlying processes cannot be fully established from two-dimensional SEM observations alone.
Supplementary Materials
The following supporting information can be downloaded at: https://www.mdpi.com/article/10.3390/jmse14212035/s1, Table S1: Sample-level paired ATR comparison of PB1 and PB2; Table S2: Sample-level paired inference.
Author Contributions
Y.W.: Conceptualization, methodology, Writing—original draft, writing—review and editing. J.W.: resources, validation, writing—review and editing. S.H.: investigation, resources, data curation. J.Y.: writing—review and editing, project administration, funding acquisition. All authors have read and agreed to the published version of the manuscript.
Funding
This research was supported by the National Science and Technology Major Project (Grant Nos. 2025ZD1404106 and 2024ZD1404901).
Data Availability Statement
The original contributions presented in this study are included in the article. Further inquiries can be directed to the corresponding author.
Acknowledgments
We thank Zhongming Du and Yuan Yuan of the Institute of Geology and Geophysics, Chinese Academy of Sciences, for assistance with sample preparation and image analysis.
Conflicts of Interest
Authors Jianfa Wu and Shan Huang were employed by the PetroChina Southwest Oil & Gasfield Company. The remaining authors declare that the research was conducted in the absence of any commercial or financial relationships that could be construed as a potential conflict of interest.
References
- Nie, H.; Li, P.; Dang, W.; Ding, J.; Sun, C.; Liu, M.; Wang, J.; Du, W.; Zhang, P.; Li, D.; et al. Enrichment characteristics and exploration directions of deep shale gas of Ordovician-Silurian in the Sichuan Basin and its surrounding areas, China. Pet. Explor. Dev. 2022, 49, 744–757. [Google Scholar] [CrossRef] [Scilit]
- He, X.; Chen, G.; Wu, J.; Liu, Y.; Wu, S.; Zhang, J.; Zhang, X. Deep shale gas exploration and development in the southern Sichuan Basin: New progress and challenges. Nat. Gas Ind. B 2023, 10, 32–43. [Google Scholar] [CrossRef] [Scilit]
- Zou, C.; Yu, R.; Dong, D.; Zhang, X.; Chen, Y.; Zheng, M.; Liu, H.; Gao, J. Geologic characteristics, development technologies and prospects of unconventional natural gas in China. Pet. Explor. Dev. 2026, 53, 770–786. [Google Scholar] [CrossRef] [Scilit]
- Guo, X.; Hu, D.; Huang, R.; Wei, Z.; Duan, J.; Wei, X.; Fan, X.; Miao, Z. Deep and ultra-deep natural gas exploration in the Sichuan Basin: Progress and prospect. Nat. Gas Ind. B 2020, 7, 419–432. [Google Scholar] [CrossRef] [Scilit]
- Jiang, Z.; Song, Y.; Tang, X.; Li, Z.; Wang, X.; Wang, G.; Xue, Z.; Li, X.; Zhang, K.; Chang, J.; et al. Controlling factors of marine shale gas differential enrichment in southern China. Pet. Explor. Dev. 2020, 47, 661–673. [Google Scholar] [CrossRef] [Scilit]
- Ma, X.; Xie, J.; Yong, R.; Zhu, Y. Geological characteristics and high production control factors of shale gas reservoirs in Silurian Longmaxi Formation, southern Sichuan Basin, SW China. Pet. Explor. Dev. 2020, 47, 901–915. [Google Scholar] [CrossRef] [Scilit]
- Wang, Y.; Yang, J. Gas-in-place prediction from quantifying organic matter- and mineral-hosted porosities in marine gas shales. AAPG Bull. 2024, 108, 751–776. [Google Scholar] [CrossRef] [Scilit]
- Zhang, Y.; Zhang, H.; Zhang, L.; Li, J.; Yan, Y. Pore-micro fracture structure, porosity and gas-bearing property of deep shale under lithofacies-formation pressure coupling. Sci. Rep. 2026, 16, 7303. [Google Scholar] [CrossRef] [Scilit] [PubMed]
- Li, J.; Li, H.; Yang, C.; Wu, Y.; Gao, Z.; Jiang, S. Geological Characteristics and Controlling Factors of Deep Shale Gas Enrichment of the Wufeng-Longmaxi Formation in the Southern Sichuan Basin, China. Lithosphere 2022, 2022, 4737801. [Google Scholar] [CrossRef] [Scilit]
- Ma, X.; Wang, H.; Zhou, S.; Shi, Z.; Zhang, L. Deep shale gas in China: Geological characteristics and development strategies. Energy Rep. 2021, 7, 1903–1914. [Google Scholar] [CrossRef] [Scilit]
- Ansari, R.; Merletti, G.; Gramin, P.; Armitage, P. More accurate quantification of free and adsorbed gas in shale reservoirs. Petrophysics 2019, 60, 560–584. [Google Scholar] [CrossRef] [Scilit]
- Chen, G.; Li, C.; Lu, S.; Guo, T.; Wang, M.; Xue, Q.; Zhang, T.; Li, Z.; Sun, Y.; Liu, J.; et al. Critical factors controlling adsorption capacity of shale gas in Wufeng-Longmaxi formation, Sichuan Basin: Evidences from both experiments and molecular simulations. J. Nat. Gas Sci. Eng. 2021, 88, 103774. [Google Scholar] [CrossRef] [Scilit]
- Meng, M.; Li, Z.; Hong, Z.; Bao, J.; Jiang, Q. Quantifying pore size distribution by nuclear magnetic resonance method in tight sandstones: Comparison between water-wet and oil-wet saturated fluids. Int. J. Hydrogen Energy 2026, 197, 152608. [Google Scholar] [CrossRef] [Scilit]
- Meng, M.; Li, X.; Li, Z. Characterization of rock fabric and its influence on water occurrence in tight gas reservoirs. Energy Fuels 2026, 40, 21602–21612. [Google Scholar] [CrossRef] [Scilit]
- Bao, J.; Meng, M.; Wang, Q.; Yu, S.; Yuan, M.; Hong, Z.; Jiang, Q. Comparison of square-root and logarithmic data treatment for pore connectivity by co-current spontaneous imbibition in lacustrine shales. Int. J. Hydrogen Energy 2026, 229, 154737. [Google Scholar] [CrossRef] [Scilit]
- Ji, W.; Hao, F.; Schulz, H.-M.; Song, Y.; Tian, J. The architecture of organic matter and its pores in highly mature gas shales of the lower Silurian Longmaxi Formation in the upper Yangtze platform, south China. AAPG Bull. 2019, 103, 2909–2942. [Google Scholar] [CrossRef] [Scilit]
- Ko, L.T.; Loucks, R.G.; Zhang, T.; Ruppel, S.C.; Shao, D. Pore and pore network evolution of Upper Cretaceous Boquillas (Eagle Ford-equivalent) mudrocks: Results from gold tube pyrolysis experiments. AAPG Bull. 2016, 100, 1693–1722. [Google Scholar] [CrossRef] [Scilit]
- Loucks, R.G.; Reed, R.M.; Ruppel, S.C.; Hammes, U. Spectrum of pore types and networks in mudrocks and a descriptive classification for matrix-related mudrock pores. AAPG Bull. 2012, 96, 1071–1098. [Google Scholar] [CrossRef] [Scilit]
- Milliken, K.L.; Rudnicki, M.; Awwiller, D.N.; Zhang, T. Organic matter-hosted pore system, Marcellus Formation (Devonian), Pennsylvania. AAPG Bull. 2013, 97, 177–200. [Google Scholar] [CrossRef] [Scilit]
- Wu, J.; Luo, C.; Zhong, K.; Li, Y.; Li, G.; Du, Z.; Yang, J. Innovative characterization of organic nanopores in marine shale by the integration of HIM and SEM. Energy 2023, 282, 128390. [Google Scholar] [CrossRef] [Scilit]
- Cavelan, A.; Boussafir, M.; Mathieu, N.; Laggoun-Défarge, F. Impact of thermal maturity on the concomitant evolution of the ultrafine structure and porosity of marine mudstones organic matter; contributions of electronic imaging and new spectroscopic investigations. Int. J. Coal Geol. 2020, 231, 103622. [Google Scholar] [CrossRef] [Scilit]
- Jarvie, D.M. Shale resource systems for oil and gas: Part 1—Shale-gas resource systems. In Shale Reservoirs—Giant Resources for the 21st Century; Breyer, J.A., Ed.; AAPG Memoir 97; American Association of Petroleum Geologists: Tulsa, OK, USA, 2012; pp. 69–87. [Google Scholar]
- Pommer, M.; Milliken, K. Pore types and pore-size distributions across thermal maturity, Eagle Ford Formation, southern Texas. AAPG Bull. 2015, 99, 1713–1744. [Google Scholar] [CrossRef] [Scilit]
- Hu, G.; Pang, Q.; Jiao, K.; Hu, C.; Liao, Z. Development of organic pores in the Longmaxi Formation overmature shales: Combined effects of thermal maturity and organic matter composition. Mar. Pet. Geol. 2020, 116, 104314. [Google Scholar] [CrossRef] [Scilit]
- Mastalerz, M.; Schimmelmann, A.; Drobniak, A.; Chen, Y. Porosity of Devonian and Mississippian New Albany Shale across a maturation gradient: Insights from organic petrology, gas adsorption, and mercury intrusion. AAPG Bull. 2013, 97, 1621–1643. [Google Scholar] [CrossRef] [Scilit]
- Katz, B.J.; Arango, I. Organic porosity: A geochemist’s view of the current state of understanding. Org. Geochem. 2018, 123, 1–16. [Google Scholar] [CrossRef] [Scilit]
- Wang, Y.; Wu, J.; Luo, Q.; Zhang, J.; Chen, Z.; Yang, J. Maceral-specific evolution of molecular structure and porosity from the early oil to dry gas window in black shales. Mar. Pet. Geol. 2025, 182, 107609. [Google Scholar] [CrossRef] [Scilit]
- Xiang, J.; Zhu, Y.; Wang, Y.; Chen, S.; Yu, S. Deformation and kerogen macromolecular structure transformations of the Wufeng–Longmaxi shale under the control of the detachment layer. Mar. Pet. Geol. 2024, 161, 106689. [Google Scholar] [CrossRef] [Scilit]
- Liu, B.; Mastalerz, M.; Schieber, J. SEM petrography of dispersed organic matter in black shales: A review. Earth-Sci. Rev. 2022, 224, 103874. [Google Scholar] [CrossRef] [Scilit]
- Stokes, M.R.; Valentine, B.J.; Hackley, P.C.; Jubb, A.M. Relating systematic compositional variability to the textural occurrence of solid bitumen in shales. Int. J. Coal Geol. 2022, 261, 104068. [Google Scholar] [CrossRef] [Scilit]
- Teng, J.; Liu, B.; Mastalerz, M.; Schieber, J. Origin of organic matter and organic pores in the overmature Ordovician-Silurian Wufeng-Longmaxi Shale of the Sichuan Basin, China. Int. J. Coal Geol. 2022, 253, 103970. [Google Scholar] [CrossRef] [Scilit]
- Liu, B.; Schieber, J.; Mastalerz, M. Combined SEM and reflected light petrography of organic matter in the New Albany Shale (Devonian-Mississippian) in the Illinois Basin: A perspective on organic pore development with thermal maturation. Int. J. Coal Geol. 2017, 184, 57–72. [Google Scholar] [CrossRef] [Scilit]
- Misch, D.; Gross, D.; Hawranek, G.; Horsfield, B.; Klaver, J.; Mendez-Martin, F.; Urai, J.L.; Vranjes-Wessely, S.; Sachsenhofer, R.F.; Schmatz, J.; et al. Solid bitumen in shales: Petrographic characteristics and implications for reservoir characterization. Int. J. Coal Geol. 2019, 205, 14–31. [Google Scholar] [CrossRef] [Scilit]
- Sanei, H. Genesis of solid bitumen. Sci. Rep. 2020, 10, 15595. [Google Scholar] [CrossRef] [Scilit] [PubMed]
- Wang, Y.; Yang, J. Origin of chemical structure and pore heterogeneity of over-matured organic matter in the Paleozoic marine shales, China. Int. J. Coal Geol. 2025, 303, 104742. [Google Scholar] [CrossRef] [Scilit]
- Dong, T.; He, S.; Chen, M.; Hou, Y.; Guo, X.; Wei, C.; Han, Y.; Yang, R. Quartz types and origins in the paleozoic Wufeng-Longmaxi Formations, Eastern Sichuan Basin, China: Implications for porosity preservation in shale reservoirs. Mar. Pet. Geol. 2019, 106, 62–73. [Google Scholar] [CrossRef] [Scilit]
- Knapp, L.J.; Ardakani, O.H.; Uchida, S.; Nanjo, T.; Otomo, C.; Hattori, T. The influence of rigid matrix minerals on organic porosity and pore size in shale reservoirs: Upper Devonian Duvernay Formation, Alberta, Canada. Int. J. Coal Geol. 2020, 227, 103525. [Google Scholar] [CrossRef] [Scilit]
- Milliken, K.L.; Esch, W.L.; Reed, R.M.; Zhang, T. Grain assemblages and strong diagenetic overprinting in siliceous mudrocks, Barnett Shale (Mississippian), Fort Worth Basin, Texas. AAPG Bull. 2012, 96, 1553–1578. [Google Scholar] [CrossRef] [Scilit]
- Zhao, J.; Jin, Z.; Jin, Z.; Hu, Q.; Hu, Z.; Du, W.; Yan, C.; Geng, Y. Mineral types and organic matters of the Ordovician-Silurian Wufeng and Longmaxi Shale in the Sichuan Basin, China: Implications for pore systems, diagenetic pathways, and reservoir quality in fine-grained sedimentary rocks. Mar. Pet. Geol. 2017, 86, 655–674. [Google Scholar] [CrossRef] [Scilit]
- Milliken, K.L.; Olson, T. Silica diagenesis, porosity evolution, and mechanical behavior in siliceous mudstones, Mowry Shale (Cretaceous), Rocky Mountains, U.S.A. J. Sediment. Res. 2017, 87, 366–387. [Google Scholar] [CrossRef] [Scilit]
- Chen, Y.; Zhao, J.-H.; Hu, Q.-H.; Liu, K.-Y.; Wu, W.; Luo, C.; Zhao, S.-H.; Zhang, Y.-Y. Origin of carbonate minerals and impacts on reservoir quality of the Wufeng and Longmaxi Shale, Sichuan Basin. Pet. Sci. 2023, 20, 3311–3336. [Google Scholar] [CrossRef] [Scilit]
- Zheng, Y.; Liao, Y.; Wang, J.; Xiong, Y.; Wang, Y.; Peng, P. Factors controlling the heterogeneity of shale pore structure and shale gas production of the Wufeng-Longmaxi shales in the Dingshan plunging anticline of the Sichuan Basin, China. Int. J. Coal Geol. 2024, 282, 104434. [Google Scholar] [CrossRef] [Scilit]
- Jin, Z.; Nie, H.; Liu, Q.; Zhao, J.; Wang, R.; Sun, C.; Wang, G. Coevolutionary dynamics of organic-inorganic interactions, hydrocarbon generation, and shale gas reservoir preservation: A case study from the Upper Ordovician Wufeng and Lower Silurian Longmaxi Formations, Fuling Shale Gas Field, Eastern Sichuan Basin. Geofluids 2020, 2020, 6672386. [Google Scholar] [CrossRef] [Scilit]
- Wang, Y.; Dong, D.; Li, X.; Huang, J.; Wang, S.; Wu, W. Stratigraphic sequence and sedimentary characteristics of Lower Silurian Longmaxi Formation in Sichuan Basin and its peripheral areas. Nat. Gas Ind. B 2015, 2, 222–232. [Google Scholar] [CrossRef] [Scilit]
- Wang, H.; Shi, Z.; Zhao, Q.; Liu, D.; Sun, S.; Guo, W.; Liang, F.; Lin, C.; Wang, X. Stratigraphic framework of the Wufeng-Longmaxi shale in and around the Sichuan Basin, China: Implications for targeting shale gas. Energy Geosci. 2020, 1, 124–133. [Google Scholar] [CrossRef] [Scilit]
- Cosenza, P.; Prêt, D.; Fauchille, A.-L.; Hedan, S. Representative elementary area of shale at the mesoscopic scale. Int. J. Coal Geol. 2019, 216, 103316. [Google Scholar] [CrossRef] [Scilit]
- Wang, Y.; Yang, J. Quantitative classification and analysis of porosity within different lithofacies of the Upper Ordovician-lower Silurian shales, China. AAPG Bull. 2022, 106, 1653–1678. [Google Scholar] [CrossRef] [Scilit]
- Tissot, B.P.; Welte, D.H. Petroleum Formation and Occurrence, 2nd ed.; Springer: Berlin/Heidelberg, Germany, 1984. [Google Scholar]
- Jarvie, D.M.; Hill, R.J.; Ruble, T.E.; Pollastro, R.M. Unconventional shale-gas systems: The Mississippian Barnett Shale of north-central Texas as one model for thermogenic shale-gas assessment. AAPG Bull. 2007, 91, 475–499. [Google Scholar] [CrossRef] [Scilit]
- Shi, Z.; Wu, J.; Dong, D.; Sun, S.; Guo, C.; Li, G. Pore types and pore size distribution of the typical Wufeng-Lungmachi shale wells in the Sichuan Basin, China. Earth Sci. Front. 2021, 28, 249–260. [Google Scholar]
- Wang, F.; Guan, J.; Feng, W.; Bao, L. Evolution of overmature marine shale porosity and implication to the free gas volume. Pet. Explor. Dev. 2013, 40, 819–824. [Google Scholar] [CrossRef] [Scilit]
- Curtis, M.E.; Cardott, B.J.; Sondergeld, C.H.; Rai, C.S. Development of organic porosity in the Woodford Shale with increasing thermal maturity. Int. J. Coal Geol. 2012, 103, 26–31. [Google Scholar] [CrossRef] [Scilit]
- Zhang, L.; Xiao, D.; Lu, S.; Jiang, S.; Chen, L.; Guo, T.; Wu, L. Pore development of the Lower Longmaxi shale in the southeastern Sichuan Basin and its adjacent areas: Insights from lithofacies identification and organic matter. Mar. Pet. Geol. 2020, 122, 104662. [Google Scholar] [CrossRef] [Scilit]
- Eliyahu, M.; Emmanuel, S.; Day-Stirrat, R.J.; Macaulay, C.I. Mechanical properties of organic matter in shales mapped at the nanometer scale. Mar. Pet. Geol. 2015, 59, 294–304. [Google Scholar] [CrossRef] [Scilit]
- Emmanuel, S.; Eliyahu, M.; Day-Stirrat, R.J.; Hofmann, R.; Macaulay, C.I. Impact of thermal maturation on nano-scale elastic properties of organic matter in shales. Mar. Pet. Geol. 2016, 70, 175–184. [Google Scholar] [CrossRef] [Scilit]
- Lash, G.G.; Engelder, T. An analysis of horizontal microcracking during catagenesis: Example from the Catskill delta complex. AAPG Bull. 2005, 89, 1433–1449. [Google Scholar] [CrossRef] [Scilit]
- Kobchenko, M.; Panahi, H.; Renard, F.; Dysthe, D.K.; Malthe-Sørenssen, A.; Mazzini, A.; Scheibert, J.; Jamtveit, B.; Meakin, P. 4D imaging of fracturing in organic-rich shales during heating. J. Geophys. Res. Solid Earth 2011, 116, B12201. [Google Scholar] [CrossRef] [Scilit]
- Teixeira, M.G.; Donzé, F.; Renard, F.; Panahi, H.; Papachristos, E.; Scholtès, L. Microfracturing during primary migration in shales. Tectonophysics 2017, 694, 268–279. [Google Scholar] [CrossRef] [Scilit]

Disclaimer/Publisher’s Note: The statements, opinions and data contained in all publications are solely those of the individual author(s) and contributor(s) and not of MDPI and/or the editor(s). MDPI and/or the editor(s) disclaim responsibility for any injury to people or property resulting from any ideas, methods, instructions or products referred to in the content. |
© 2026 by the authors. Licensee MDPI, Basel, Switzerland. This article is an open access article distributed under the terms and conditions of the Creative Commons Attribution (CC BY) license.