


Abstract
Bioethanol is evaluated as a retrofit marine fuel candidate through a comparative assessment against liquefied natural gas (LNG) and methanol (MeOH) under the Energy Efficiency Existing Ship Index (EEXI), Carbon Intensity Indicator (CII), and Greenhouse Gas Fuel Intensity (GFI) frameworks. Fuel consumption profiles are derived from a multi-year empirical dataset using a dual-fuel (DF) engine retrofit, and lifecycle emissions are quantified across corn, sugarcane, and green algae feedstocks under IMO lifecycle guidelines. All DF configurations achieve EEXI compliance, whereas very-low-sulphur fuel oil (VLSFO) fails. A structural divergence emerges between regulatory metrics: under the tank-to-wake CII framework, MeOH and ethanol degrade to a marginal ‘D’ rating by 2027, while under the well-to-wake GFI framework the same configurations generate compliance surpluses from 2028 onward. Feedstock selection proves as consequential as fuel type, with bioethanol GFI ranging from 7.5 gCO2eq/MJ for green algae to 56.4 gCO2eq/MJ for corn. Cumulative surpluses reach 70,556 t CO2eq for electro-fuels and 30,952 t CO2eq for green algae bioethanol, whereas grey MeOH and VLSFO incur remedial costs of USD 3.91 million and USD 2.61 million, respectively. Despite a favourable price ceiling of 557.06 to 615.03 USD/t, the most favourable bioethanol pathway remains above this threshold. Ethanol therefore emerges as significant but not yet commercially viable.
1. Introduction
The maritime industry continues to be pressured into decarbonisation under international climate agreements and the United Nations Sustainable Development Goals [1]. According to the International Maritime Organization (IMO) 2023 Strategy on Reduction of GHG Emissions from Ships, international shipping should reach net-zero GHG emissions by or around 2050, supported by indicative GHG reduction checkpoints for 2030 and 2040 relative to 2008 levels [1,2]. This target reinforces the need for both efficiency improvements and a progressive transition towards low-, zero-, and near-zero-GHG marine fuels.
Regulations such as the Energy Efficiency Design Index (EEDI), the Energy Efficiency Existing Ship Index (EEXI), and the Carbon Intensity Indicator (CII) further urge ship operators and designers to pursue low-carbon propulsion technologies and alternative fuels [3,4]. However, these instruments remain primarily focused on design efficiency or tank-to-wake (TtW) operational carbon intensity. In contrast, the emerging IMO Net-Zero Framework (NZF), for which draft legal text was finalised at Marine Environment Protection Committee (MEPC) 83, introduces a more comprehensive regulatory direction based on lifecycle GHG intensity and economic incentives. Although the formal adoption of the associated MARPOL Annex VI amendments remains subject to the IMO decision-making process, the proposed framework signals a transition from incremental efficiency regulation towards well-to-wake (WtW) fuel-based compliance.
Building on these established measures, this study considers the proposed IMO NZF, which, although not yet formally adopted, provides a forward-looking basis for assessing the potential implications of future regulatory developments. Centred on the Greenhouse Gas Fuel Intensity (GFI) metric, the proposed IMO NZF is expected to impose significantly more stringent lifecycle emissions constraints on the global fleet by mandating WtW GHG intensity reductions, thereby enabling an assessment of how fuels such as ethanol (EtOH) could perform should the framework be implemented [5]. Therefore, ship operators will increasingly need to evaluate not only onboard combustion emissions but also upstream fuel production pathways, supply chain emissions, and the economic implications of compliance deficits or surpluses [6].
Liquefied natural gas (LNG), methanol (MeOH), ammonia, hydrogen, and EtOH are currently the leading alternative fuels that are considered primary enablers toward a carbon-neutral shipping industry [7]. Each of these fuel candidates presents distinct thermodynamic [8], operational, safety [9], and environmental performance [10] that bear directly on their suitability for marine propulsion retrofit applications.
LNG has emerged as the most commercially mature alternative to conventional heavy fuel oil (HFO), with an established global bunkering network [10,11] and growing utilisation rates [11], although safety requirements are required [12]. On a TtW basis, dual-fuel (DF) LNG engines deliver clear reductions in carbon dioxide (CO2), sulphur oxides (SOx), and particulate matter (PM) compared with very-low-sulphur fuel oil (VLSFO) [13,14,15]. These local-emission benefits have been confirmed both in laboratory tests and in full-scale sea trials [16,17,18]. Nevertheless, methane (CH4) slip remains a significant drawback: measured slip rates of 1–3% can offset much of the CO2 advantage once a 100-year global warming potential (GWP100) factor of ~30 is applied [19,20,21]. Consequently, several recent assessments characterise LNG as a transitional rather than a terminal fuel pathway once upstream emissions and slip are fully accounted for [10,22].
MeOH benefits from an extensive existing port availability [23] and requires comparatively modest modifications [24] to existing onboard fuel systems [25]. Nevertheless, its lower calorific value (LCV) of roughly half that of HFO requires larger storage volumes or increased bunkering frequency [26], representing a non-trivial operational constraint for deep-sea voyages [27,28]. Critically, the WtW decarbonisation potential of MeOH is strongly production pathway-dependent: grey MeOH offers only marginal GHG benefits over VLSFO [29,30,31], whereas biomethanol (bioMeOH) and electro-methanol (e-MeOH) may achieve near-zero or net-negative WtW GHG intensities depending on feedstock, electricity source, and carbon-accounting assumptions [29,32,33].
Electro-ethanol (e-EtOH) shares several physicochemical and combustion similarities with MeOH [34,35,36], and its established global production infrastructure provides a relative supply chain advantage [23,37,38]. However, marine-specific evidence for an existing port and bunkering advantage for EtOH is limited, and shipping studies emphasise that its onboard storage, handling, and use remain insufficiently tested [8,37,39]. Additionally, its WtW decarbonisation potential is also strongly generation-dependent: conventional crop-based bioEtOH can exhibit relatively high well-to-tank (WtT) GHG intensities attributable to land-use competition, energy-intensive cultivation and processing requirements [23]. Whereas second- and third generations such as waste-derived pathways deliver progressively lower upstream emission intensities [8,23,40], E-EtOH produced via renewable power-to-liquid pathways can achieve very low—and in some configurations near-zero or potentially negative [41]—WtT GHG intensities under lifecycle assessment (LCA) frameworks, making it a potentially high-compliance-value fuel under the IMO NZF [6,42].
Although ammonia and hydrogen present compelling zero-carbon propulsion potential, both remain constrained by low Technological Readiness Levels, limited bunkering infrastructure [43,44,45], and significant onboard safety and storage challenges [44,46,47,48,49] that render them incompatible with the 2028–2033 assessment horizon [20] and were therefore excluded from the analysis.
Despite growing interest in alternative marine fuels, EtOH remains largely absent from the GFI-oriented compliance literature, revealing an EtOH research gap given its distinct positioning under IMO and EU maritime decarbonisation policies. Under the IMO LCA Guidelines [50] and FuelEU Maritime [51], sustainability-certified biofuels receive a zero TtW CO2 emission factor (EF), as combustion-derived CO2 is considered offset by atmospheric uptake during feedstock growth. This repositions bioEtOH as a fuel with near-zero TtW GHG intensity across all feedstock generations, conferring a compliance advantage absent under EEXI and CII frameworks. E-fuels, classified as Renewable Fuels of Non-Biological Origin (RFNBOs), further benefit from the 2× energy content multiplier under FuelEU Maritime until 31 December 2033 [52].
The characterisation of EtOH as underexplored within the GFI compliance literature refers specifically to the absence of quantitative, lifecycle-based GFI surplus and remedial cost modelling across multiple EtOH feedstock generations benchmarked against established alternative fuels under the IMO NZF, rather than an absence of EtOH-related maritime fuel literature in general. While recent industry and technical assessments have begun to address EtOH’s viability as a maritime fuel from operational, safety, and market perspectives [53,54], none of these contributions integrates feedstock-resolved WtW lifecycle emissions accounting, GFI-based compliance balance modelling, and techno-economic cost-competitiveness evaluation within a single framework, a gap the present work addresses.
This study evaluates EtOH as a marine fuel retrofit candidate for a case-study ship, benchmarking its regulatory performance against LNG and MeOH under the EEXI, CII, and GFI compliance frameworks. A multi-year empirical operational dataset drives simulated fuel consumption (FC) profiles for DF engine configurations, followed by a full WtW lifecycle emissions assessment covering bioEtOH pathways across three feedstock generations (corn, sugarcane, and green algae) alongside fossil LNG, grey MeOH, and their e-fuel counterparts. Compliance surpluses and deficits are quantified in financial terms under a GFI-oriented regulatory scenario, while the cost-competitiveness assessment additionally considers FuelEU Maritime provisions, including the RFNBO 2× multiplier, across the 2028 to 2033 reporting period. The overarching motivation is to reassess the decarbonisation potential of EtOH under the revised WtW regulatory paradigm introduced by the GFI framework, within which its biogenic and electro-synthetic pathways confer compliance advantages that are systematically underrepresented in the existing literature.
2. Methods
This section presents the mathematical framework and analytical procedure used in the study. Stages of the methodology are illustrated in Figure 1.
Figure 1.
Methodology flowchart.
The first stage aggregates a high-resolution, multi-year (≥5 years) empirical dataset of vessel operational data, capturing real-world variability in FC and engine performance. Table 1 demonstrates the statistical summary of the dataset utilised in the analysis.
Table 1.
Statistical summary of the multi-year operational dataset of the case-study Aframax tanker (2012–2018).
The operational dataset covers 3224 calendar days spanning October 2012 to February 2018 (approximately 5.37 years). Of these, 736 days recorded positive main-engine power and were therefore retained for the fuel consumption and emission calculations. On active steaming days the main engine (M/E) operated at a mean load of 49.2% MCR (median 50.8%), with engine speeds ranging from 60 to 95 rpm. Mean daily propulsion energy was 158.9 MWh, and mean daily HFO consumption was 47.1 t. The complete multi-year profile yields a total propulsion energy of 116,963 MWh and a total sailed distance of 269 471 nm, which form the basis for all subsequent DF consumption, EEXI, CII and GFI calculations.
In the second stage, these baseline parameters serve as inputs to simulate FC profiles for LNG, MeOH, and EtOH DF engine configurations, accounting for differences in lower heating values. The third stage conducts an LCA to quantify WtT and TtW emissions, benchmarking bioEtOH pathways against conventional options, including VLSFO, natural gas-derived MeOH (MeOH-NG), and fossil LNG.
The resulting environmental profiles are then mapped onto the selected regulatory compliance frameworks in the fourth stage. TtW CO2 emissions are used to assess EEXI compliance and CII ratings, while WtW GHG intensities are used to evaluate GFI-oriented compliance outcomes. Two regulatory accounting layers are considered. First, an IMO GFI-oriented scenario is used to evaluate WtW fuel-intensity compliance, surplus units, and remedial deficits under the draft IMO NZF. Second, FuelEU Maritime provisions are considered in the economic and compliance sensitivity assessment, including the temporary RFNBO 2× energy multiplier applicable until 31 December 2033. These two regulatory layers are treated explicitly to avoid conflating IMO and European Union (EU) compliance mechanisms. The fifth stage completes the framework with a techno-economic feasibility analysis, translating compliance surpluses or deficits into financial indicators by weighing the capital and operational costs of alternative-fuel adoption against the costs of regulatory non-compliance.
The reference case vessel selected for this study is an Aframax-class crude oil tanker built in 2009, with an overall length of 248.96 m, a beam of 43.80 m, and a deadweight tonnage (DWT) of 115,655 t. The operational dataset spans 2012–2018, during which the vessel was commercially employed as a conventional Aframax crude carrier. Detailed voyage-level route information was not available in the operational dataset. The vessel was therefore characterised according to its Aframax trading profile, while the simulations were based on its recorded power, operating hours, and FC.
The existing propulsion system burns VLSFO and is driven by a MAN B&W 6S60MC-C engine rated at a maximum continuous output of 13,560 kW. The retrofit scenario considers replacement with a MAN B&W 6S60ME-C10.7 DF engine, which operates on LNG via gas injection mode and on MeOH via liquid–gas injection mode [53]. The same injection configuration for MeOH is assumed to be applicable to EtOH. Full technical specifications of the case-study vessel are provided in Table A1 (Appendix A) [13,55].
The engine in the retrofit scenario is two-stroke, low-speed, electronically controlled (camshaft-less) M/E as the common platform for both fuel scenarios, with fuel injection timing and gas/liquid-fuel valve actuation governed by the ME hydraulic–mechanical control system via electronically controlled fuel injection valve activation. In the LNG scenario, the engine operates on the high-pressure gas injection (ME-GI) principle: natural gas (NG) is supplied through a common-rail high-pressure system and injected directly into an already-ignited combustion event initiated by a pilot fuel-oil charge, with gas-valve timing controlled by an electronically controlled gas injection valve. This diesel-cycle ignition strategy avoids the knock and pressure-fluctuation risks associated with premixed lean-burn gas combustion and allows any HFO/gas ratio to be burned once pilot ignition is established. In the MeOH scenario, the engine operates on the liquid–gas injection—MeOH (ME-LGIM) principle, a derivative of the ME-GI architecture adapted for liquid-phase injection: MeOH is injected at a nozzle diameter and rail pressure specific to its viscosity and compressibility (0.8 mm/569 bar, versus 0.5 mm/891 bar for the diesel pilot), following a pilot fuel-oil charge required to compensate for methanol’s low cetane number. In both modes, the engine starts and manoeuvres on conventional fuel oil before transitioning to gas or alcohol fuel mode. Detailed specific fuel/gas consumption (SFOC/SGC), specific pilot oil consumption (SPOC), and pilot fuel fraction data for each load point and fuel mode are provided in Table A2 (Appendix A) [53].
The use of a single case-study tanker reflects the availability of a high-resolution, multi-year empirical operational dataset, which is essential for capturing realistic variability in FC and engine load profiles rather than relying on design-stage or synthetic operational assumptions. Tankers were selected as the vessel class of focus given their substantial contribution to global fleet GHG emissions and their applicability to deep-sea voyage profiles, where alternative-fuel storage volume constraints are most acute. While the regulatory formulas applied (EEXI, CII, GFI) are ship-type-, capacity- and operation-dependent, the case study provides a representative retrofit-oriented screening of the relative behaviour of fuel pathways under lifecycle-based compliance. The absolute compliance balances, remedial costs, and cost-competitiveness thresholds should therefore be interpreted as vessel-specific. Extending this analysis across multiple vessel classes, ship sizes and operational profiles represents an important direction for future research.
The power profile and ship speed were held identical across all fuel scenarios, derived from the same dataset for the vessel’s actual operating conditions. This approach isolates the effect of fuel properties on volumetric storage requirements and emissions performance, without introducing confounding variation from differing operational profiles. It has been acknowledged that slower steaming could further reduce GHG emissions for some of the alternative fuels, particularly through improved combustion efficiency, and that speed–power optimisation specific to each fuel type represents a valuable extension of this work. However, this lies outside the scope of the present study, which focuses on comparative fuel storage and consumption characteristics under a fixed operational baseline.
FC is determined using specific fuel consumption (SFC) data for the DF engine across all considered fuel types, sourced from the Computer Engine Application System (CEAS) of Everllence SE (formerly MAN B&W) [56]. Given the structural similarity in combustion characteristics between MeOH and EtOH consumption and the associated specific pilot fuel consumption as marine diesel oil (MDO), FC data for EtOH are derived from the MeOH dataset [35,36].
The substitution of EtOH-specific FC data with the MeOH dataset is justified on the basis of the close physicochemical and combustion similarities between the two alcohols, both of which share comparable cetane numbers and ignition delay characteristics and require pilot fuel injection for compression ignition in DF engines [35,36]. At the time of writing, dedicated marine-grade SFC data for EtOH combustion in large-bore two-stroke DF engines are not publicly available from engine manufacturers, including Everllence SE, as EtOH has not yet reached the same commercial deployment stage as MeOH in marine propulsion applications. The substitution was scaled according to EtOH’s LCV relative to MeOH’s, ensuring that energy-equivalent fuel mass requirements are preserved, consistent with the approach adopted in prior comparative studies of alcohol fuel combustion in DF systems [57]. A ±10% sensitivity threshold is considered in swapping EtOH for MeOH [58]. This is acknowledged as a limitation of the present study, and the resulting consumption profiles should be interpreted as a first-order approximation pending the availability of dedicated EtOH engine performance data. The LCV and density (ρ) of the assessed fuel types are summarised in Table 2 [50].
Table 2.
LCV and density of the assessed fuels.
2.1. Volumetric Energy Density Calculation
To provide additional practical context, the storage volume required to meet the annual propulsion energy demand can be estimated by converting the equivalent energy demand into fuel mass using the LCV and then into tank volume using the fuel density. The volumetric energy density (EV) is calculated as [59,60]
Comparing the required storage volumes for LNG, MeOH and EtOH with the VLSFO baseline would indicate the potential cargo capacity penalty associated with adopting alternative fuels.
2.2. Emission Calculation
Emissions (E) for each examined configuration are calculated as the product of FC for configuration i and the EF for emission type j, as given by [61,62]
The EFs for all fuel types and emission species are listed in Table 3 [50,61,63,64,65]. For DF configurations, emissions attributable to the primary fuel and pilot fuel are calculated separately and summed to yield the total configuration emissions. Where EFs are expressed in units of g/kWh, the corresponding EF is multiplied by the energy output, denoted as Energyj, rather than the FC.
Table 3.
TtW and WtT emission factors.
CO2-equivalent values are calculated using GWP100 coefficients of 29.8 for CH4 and 273 for Nitrous Oxide (N2O), in accordance with the Intergovernmental Panel on Climate Change (IPCC) Sixth Assessment Report [66]. WtT emissions for EtOH are examined across three feedstock pathways: corn, sugarcane, and green algae, representing first-, second-, and third-generation biofuel production, respectively. As EtOH is the primary fuel of interest under investigation, only the NG-based Fischer–Tropsch-derived MeOH pathway is considered.
2.3. Regulatory Analysis
This section presents the mathematical formulations and underlying assumptions for the EEXI, CII, and GFI calculations.
2.3.1. Energy Efficiency Existing Index
The EEXI was mandated under MARPOL Annex VI and entered into force on 1 January 2023, applying to all vessels of 400 Gross Tonnage (GT) and above [67]. It is a design-based technical measure that quantifies CO2 emissions per unit of transport work as a function of installed main and auxiliary engine power, SFC, and a ship-type-dependent capacity parameter [68]. The attained EEXI must remain below a required EEXI value, which is derived from the EEDI reference line and expressed as a percentage reduction relative to the applicable baseline [69]. Attained EEXI is calculated as follows [70]:
For tankers, the capacity parameter is taken as the vessel’s DWT, and the reference speed (Vref) is set at 15 knots [22]. FC, expressed in g/h and the carbon EF, as listed in Table 3, is denoted as Cf in the formula. The required EEXI computation for the case-study ship is performed as follows [71]:
The applicable reduction factor (X) is set at 20% for the tanker vessel class, determined in accordance with vessel size and ship type.
2.3.2. Carbon Intensity Indicator
The CII is a mandatory operational measure, applicable to all vessels of 5000 GT and above from January 2023. It quantifies a ship’s annual carbon intensity as the ratio of total CO2 emissions to transport work, expressed in grams of CO2 per deadweight tonne-nautical mile (g CO2/DWT-nm) [72]. The attained CII is benchmarked against a required CII, which is derived from a 2019 ship-type-specific reference line and reduced annually by a prescribed reduction factor (Z%) through 2030. Ships are assigned a rating from A (superior) to E (inferior), with a minimum rating of C mandated for regulatory compliance [69]. The attained CII is calculated as follows [72]:
For tankers, the capacity parameter is again taken as DWT, and the distance sailed by the vessel is denoted as Dt, expressed in nautical miles (nm). The required CII is determined as [69]
In accordance with Resolution MEPC.400 (83), the Z values relative to the 2019 reference line are prescribed as 11% for 2026, 13.625% for 2027, 16.250% for 2028, 18.875% for 2029, and 21.500% for 2030, in alignment with the 2023 IMO GHG Strategy [73]. The comparative discussion of CII and GFI trends extending conceptually beyond 2030 is presented qualitatively rather than through extrapolated quantitative CII calculations, drawing on the established regulatory trajectory of progressively tightening reduction factors to characterise the expected direction of CII compliance pressure without asserting specific unconfirmed numerical values. CII projections beyond 2030 fall outside the scope of the present analysis, and the manuscript has been reviewed to ensure this distinction between confirmed quantitative results and a qualitative regulatory trend discussion is unambiguous throughout the relevant sections.
The CII rating boundaries are defined by four exponential reduction factors (d1, d2, d3, d4) applied to the required CII to delineate five performance bands [74]. For the tanker vessel class, these boundary factors are prescribed as d1 = 0.82, d2 = 0.93, d3 = 1.08, and d4 = 1.28. A vessel whose attained CII falls below the superior boundary, defined as d1 × Required CII, is assigned Rating A, denoting superior performance. The inferior boundary of Rating A and the superior boundary of Rating B are demarcated by d2 × Required CII, whilst the boundary separating Rating B from the moderate Rating C is defined by d3 × Required CII. Ratings D and E, representing minor and inferior performance, respectively, are separated by the d4 × Required CII boundary. A vessel is classified as Rating E and obligated to undertake corrective actions through an enhanced Ship Energy Efficiency Management Plan [69].
2.3.3. Greenhouse Gas Fuel Intensity
GFI is the regulatory metric introduced under the draft IMO NZF, for which legal text was approved at MEPC 83 in April 2025 and submitted for formal adoption through amendments to MARPOL Annex VI. The framework is intended to apply to ships above 5000 GT engaged in international voyages. GFI quantifies the greenhouse gas (GHG) emissions per unit of energy consumed on board, expressed in gCO2eq/MJ and assessed on a WtW basis [75]. It therefore differs fundamentally from the CII, which is a TtW CO2-only metric, in that it captures emissions from fuel extraction, processing, and transport in addition to onboard combustion [75].
The GFI calculation is treated as an IMO-oriented WtW compliance scenario. The FuelEU Maritime RFNBO 2x energy multiplier is applied only within the separate FuelEU Maritime accounting layer used for the cost-competitiveness assessment and is not applied in the GFI values reported here. These two regulatory layers are kept explicitly distinct throughout the analysis to avoid conflating IMO and EU compliance mechanisms.
IMO member states have agreed on GFI reduction targets for the period 2028 to 2035, anchored to a 2008 reference value (GFI2008) of 93.3 gCO2eq/MJ, with a 2040 Base Target (BT) representing a 65% reduction relative to this reference. The GFI framework operates through a two-tier compliance structure, comprising a BT and a Direct Compliance Target (DCT), with a minimum performance requirement of a 4% GFI reduction by 2028 and 30% by 2035 relative to 2008 levels. Ships performing below the DCT are not subject to penalties; instead, they accrue surplus units transferable to other vessels or bankable for up to two years, while non-compliant vessels are required to purchase remedial units, with revenues directed to the IMO Net-Zero Fund [6]. Target GFI values are calculated using Equation (7) below, and Table 4 illustrates the calculated BT and DCT values based on the reduction rates (ZT) from 2028 to 2033 as follows [75]:
Table 4.
DCT and BT values (gCO2eq/MJ).
The attained annual GFI of the vessel is computed using Equation (8), given below [6]. It is determined as the weighted sum of the GHG intensity contributions from all energy sources consumed during the reporting period, evaluated on a WtW basis to capture the full lifecycle emissions associated with each fuel.
The index j denotes an individual fuel type or energy source, and J represents the total number of distinct fuel types or energy sources utilised during the reporting period, as recorded in the IMO Ship Fuel Oil Consumption Database. The GHG emission intensity of fuel j, denoted by EIj and expressed in gCO2eq/MJ, quantifies the mass of CO2eq released per unit of energy delivered over the complete WtW pathway, encompassing extraction, processing, transportation, and onboard combustion stages [76]. The TtW and WtT GFI values adopted for each fuel type and production pathway are presented in Table 5.
Table 5.
TtW and WtT GFI values (gCO2eq/MJ) [52,63,64].
A notable feature of the biofuel pathways, namely, BioMeOH (cultivated wood and black liquor) and BioEtOH (corn, sugarcane, and green algae), is their TtW GFI value of 0 gCO2eq/MJ. This reflects the lifecycle accounting treatment of biogenic carbon, whereby the CO2 released during onboard combustion is balanced by the CO2 absorbed during biomass growth, resulting in zero net CO2 emissions at the TtW boundary [77]. Under the REDIII [78], biofuels must satisfy prescribed sustainability and GHG savings criteria, with compliant pathways assigned WtT EFs in accordance with Annex V of Directive (EU) 2018/2001 [64], as referenced in [51].
For RFNBOs, including e-MeOH, e-EtOH, and eLNG, the adopted EFs include negative WtT GFI values. These reflect the lifecycle accounting methodology applied in the selected FuelEU Maritime and EU Renewable Energy Directive III (RED III) emission-factor datasets [51,63,64,78], whereby renewable electricity is used for fuel synthesis, and the carbon source is assumed to originate from direct air capture (DAC). Under this approach, atmospheric CO2 incorporated into the synthetic fuel is treated as a carbon removal credit within the WtT boundary, resulting in negative upstream GHG intensities. This treatment differs from synthetic fuels produced using fossil or biogenic point-source CO2, which are subject to alternative lifecycle accounting methodologies. Summing the adopted TtW and WtT EFs from Table 5 yields a WtW GFI of 19.0 gCO2eq/MJ for each of the three electro-fuel pathways [51]. This value also aligns with the current regulatory threshold defining Zero- and Near-Zero fuels under the IMO NZF, providing a consistent basis for evaluating the compliance performance of e-fuel pathways [79].
The analysis horizon of this study is bounded in 2033 to align with the confirmed operative period of the RFNBO 2x energy multiplier under Regulation (EU) 2023/1805 [51], beyond which the regulatory treatment of RFNBO-derived fuels is contingent on the outcome of the mandatory RFNBO uptake review scheduled for the 2031 reporting period [51,80]. Extending the quantitative analysis beyond 2033 would require speculative assumptions regarding an as-yet-undetermined successor policy framework. The authors acknowledge that the e-fuel compliance performance reported here is structurally dependent on the multiplier and note that post-2033 GFI positioning will be governed solely by the intrinsic WtW GHG intensity of RFNBO pathways, which remains substantially negative and therefore favourable even in the absence of the multiplier, albeit to a reduced extent.
The annual GFI compliance status of the vessel is determined by evaluating the position of the GFIattained relative to the prescribed regulatory target boundaries given in Table 5. The compliance balance (GFIbalance), quantifying the margin between the attained and required GFI values, is computed as follows [81]:
GFIbalance = (DCT − GFIattained) × Energytotal
Positive values of the GFIbalance signify an emissions surplus, while negative values represent a regulatory deficit. When the attained GFI falls below the DCT, the vessel is deemed compliant and accrues surplus units proportional to the magnitude of the over-compliance margin, which may be banked or transferred to other vessels within the pooling mechanism [51]. Conversely, when the attained GFI exceeds the DCT, a compliance deficit (CD) is incurred that must be remediated through the acquisition of remedial units. The nature and severity of the CD are further differentiated by the position of the attained GFI relative to the BT. Where the GFIattained exceeds the DCT but remains below the BT, the deficit is classified as a Tier-1 CD, calculated using Equation (10) [80,81]. Where the GFIattained exceeds the BT, the vessel simultaneously incurs both a Tier-1 and a Tier-2 CD, reflecting a more severe departure from the prescribed regulatory thresholds. In this case, the total compliance deficit is the sum of the two tier-specific contributions, as presented in Equation (11) [80,82].
Tier-1 CD = (GFIattained − DCT) × Energytotal
Tier-1 CD = (BT − DCT) × Energytotal
Tier-2 CD = (GFIattained − BT) × Energytotal
Tier-2 CD = (GFIattained − BT) × Energytotal
Under the IMO NZF approved at MEPC 83, a Tier-1 compliance deficit may be remediated exclusively through the acquisition of Tier-1 remedial units from the IMO Net-Zero Fund, priced at USD 100 per tonne of CO2eq on a WtW basis for the initial reporting periods 2028 to 2030 [82]. A Tier-2 compliance deficit, by contrast, may be balanced through one of three mechanisms: the transfer of surplus units from vessels with a compliance surplus, the drawdown of surplus units banked within the two preceding calendar years, or the acquisition of Tier-2 remedial units from the IMO Net-Zero Fund. The Tier-1 and Tier-2 remedial unit prices of USD 100 and USD 380 per tonne CO2eq, respectively, are formally confirmed by the IMO NZF only for the initial 2028 to 2030 reporting periods, with the pricing mechanism for 2031 onward subject to MEPC review by 1 January 2028 [81].
The substantial differential between the Tier-1 and Tier-2 unit prices reflects the regulatory intent to incentivise vessels to attain at minimum the BT through fuel transition, while preserving a higher-cost backstop for those unable to do so. The pricing mechanism applicable from 2031 onwards is subject to review, with the MEPC mandated to determine the mechanism for defining Tier-1 and Tier-2 remedial unit prices for reporting periods from 2031 onwards by 1 January 2028, ensuring that unit prices remain calibrated to observed fleet decarbonisation trajectories and the evolving availability of alternative fuels [83]. In the absence of a confirmed successor pricing mechanism at the time of analysis, the initial 2028 to 2030 prices were held constant through 2033 as the most defensible baseline assumption, consistent with standard practice in techno-economic forecasting where no alternative authoritative figure exists.
2.4. Economic Performance Evaluation
Annual fuel costs, including GFI remedial penalties, were derived from bunker price data reported in Ship&Bunker [84]. These values were subsequently used to establish the cost-competitive price thresholds required for the bio- and electro-fuels (e-fuels) under examination. Bunker price records spanning 26 June 2025 to 26 June 2026 were adopted from the Port of Rotterdam, constituting a full 12-month reference period. The maximum, minimum, and mean values presented in Table 6 are applied to define the analytical bounds and assess the sensitivity of the results to fuel price volatility.
Table 6.
Fuel prices (USD/t).
Annual fuel costs were computed by multiplying the fuel unit prices specified above by the annual FC of each retrofit scenario. The resulting expenditure, calculated without GFI penalty, is designated as the ‘without GFI’ baseline. Remedial costs are subsequently added incrementally from 2028 through 2033 to reflect the progressive tightening of GFI compliance requirements over the analysis horizon.
The Port of Rotterdam was selected as the reference bunkering hub based on its position as one of the largest and most liquid bunker fuel markets globally, with continuously reported pricing data across all four fuel types examined under investigation over the full 12-month reference period. Rotterdam additionally represents a primary bunkering port for North Sea and Baltic trade routes relevant to the case-study vessel’s likely operational profile [85]. While a multi-port comparative analysis would strengthen the generalisability of the derived cost-competitiveness thresholds, such an analysis was beyond the scope of the present study, which prioritises establishing the underlying GFI-driven cost dynamics over an exhaustive geographic sensitivity assessment. This limitation is explicitly acknowledged, and the authors provide recommendations for future studies about this issue.
The production cost estimates applied for the discussion purposes for sugarcane (USD 59.29 per MWh), corn (USD 117.06 per MWh), and green algae (USD 2563.34 per MWh) bioEtOH feedstocks were sourced from established techno-economic assessments of biofuel production [86,87,88]. The sources represent the most comprehensive and consistently reported cost data available for these specific feedstock and conversion pathways at the time of writing. These figures capture the upstream production cost differential across feedstock generations, the primary driver of the comparative cost-competitiveness discussion presented in this study. The authors acknowledge that marine-grade fuel conditioning, dedicated bunkering infrastructure development, and long-haul transport to bunkering hubs would introduce additional cost components not captured in these production-stage figures, and that the absolute cost thresholds reported should therefore be interpreted as a lower-bound estimate of delivered marine fuel cost. This caveat has been made explicit in the recommendations for future studies. Additionally, incorporating dedicated marine fuel supply chain costing would refine these estimates.
3. Results
This section presents the results of the EtOH retrofit assessment for the case-study Aframax tanker. All fuel scenarios are evaluated using the vessel’s multi-year operational dataset as a common operational basis, with the power profile and voyage characteristics held constant to isolate the effect of fuel choice. The results are organised according to FC and storage requirements, lifecycle emissions, EEXI and CII compliance, GFI performance, compliance balances, and cost competitiveness over the 2028–2033 regulatory horizon. The conventional VLSFO configuration serves as the reference case against which LNG, MeOH, and EtOH pathways are compared.
3.1. Fuel Consumption and Storage Requirements
The vessel’s propulsion plant generated 116,963.09 MWh over 47,088 total operating hours, of which 23,362.7 h was attributed to M/E operation. The auxiliary engines produced 85,055.80 MWh across 54,117 operating hours, with MDO consumption held constant at 7170.98 t per scenario. FC values for each alternative-fuel scenario over the 5.38-year operational period, presented in Figure 2, were derived on the basis that the M/E undergoes a retrofit to a DF configuration in which the alternative fuel serves as the primary energy source.
Figure 2.
FC of cases.
Error bars denote an assumed ±10% uncertainty in EtOH consumption associated with the estimation of equivalent fuel demand. Regarding this, EtOH consumption can vary between 45,320 t and 55,390 t for the case-study vessel. DF-LNG exhibits the lowest primary FC among the alternative-fuel scenarios, attributable to the higher LCV of LNG relative to VLSFO, which reduces the mass of fuel required to deliver equivalent energy output. Conversely, DF-MeOH and DF-EtOH record substantially higher primary FC than the baseline, a direct consequence of their lower LCVs, which necessitate greater fuel mass to meet the same propulsive demand. The pilot fuel consumption, where MDO is used, follows the same trend, with DF-MeOH requiring the largest pilot injection quantity, reflecting the poor ignitability of MeOH under compression ignition conditions. Figure 3 presents the EV and required volume ratios of various alternative fuels relative to the VLSFO baseline.
Figure 3.
Volumetric energy density (a) and required volume for annual consumption (b) comparison.
VLSFO exhibits the highest EV at 39.84 GJ/m3, establishing the reference for comparison. LNG and EtOH display similar volumetric energy densities of 21.60 GJ/m3 and 21.07 GJ/m3, respectively, requiring approximately 84.4% and 89.1% greater storage volume than VLSFO. MeOH has the lowest EV and thus incurs the largest storage penalty, requiring approximately 151.5% more storage volume than conventional fuel.
Building on the EV comparison, Figure 3b presents the annual fuel volume consumed for each fuel option, accounting for actual vessel operating conditions. The annual FC values include pilot and main fuel demand of the DF M/E in addition to auxiliary engine MDO consumption. VLSFO records the lowest annual consumed volume at 9.93 thousand m3, while MeOH requires the highest volume at 17.90 thousand m3, corresponding to an 80.22% increase over VLSFO. LNG and EtOH require 14.19 and 13.82 thousand m3, respectively, representing volume differences of 42.90% and 39.17% compared to VLSFO.
These results confirm that the storage volume penalty identified in Figure 3a persists under realistic annual operating conditions, with direct consequences for tank sizing and voyage planning.
These findings highlight a critical design constraint for alternative-fuel retrofits. All three alternative fuels require substantially greater onboard storage volume than VLSFO, with implications for cargo capacity, vessel stability, and structural modifications to the fuel tank arrangement. Otherwise, the increased bunkering volume requirements would necessitate more frequent refuelling operations, fundamentally altering the vessel’s operational profile and port-call scheduling.
3.2. Emission Calculation Findings
Based on the FC values presented in Figure 2, TtW, WtT, and WtW emissions were quantified and are reported in Table 7.
Table 7.
Emissions from examined configurations.
A sensitivity analysis is performed by applying a ±10% variation to the EtOH FC while maintaining constant EFs. Under this assumption, the TtW CO2eq emissions range from 93,540.60 t to 114,347.40 t, relative to the baseline value of 103,944.30 t. For the green algae bioethanol (bioEtOH) pathway, the WtT CO2eq emissions range from 6603.30 t to 8104.04 t, resulting in total WtW CO2eq emissions between 100,134.52 t and 122,387.64 t. Corresponding proportional variations are also observed for the regulated air pollutants, with WtW SOx emissions ranging from 64.79 t to 79.19 t and WtW Nitrogen Oxides (NOX) emissions ranging from 384.86 t to 470.48 t. Despite these variations, the overall emissions profile and regulatory compliance trends remain unchanged, indicating that the environmental performance of the EtOH-fuelled configuration is robust to reasonable variations in FC estimates.
At the TtW boundary, DF-LNG achieves the most substantial reductions in CO2 and CO2eq relative to the Diesel-VLSFO baseline, reflecting the lower carbon content of NG per unit of energy delivered. DF-MeOH and DF-EtOH yield comparable TtW CO2 and CO2eq reductions to one another, both performing moderately better than the baseline. However, DF-LNG incurs a considerably higher CH4 emission burden due to CH4 slip, a well-documented limitation of DF engines that partially offsets its CO2 advantage. SOx emissions are reduced substantially across all alternative-fuel configurations, with DF-LNG recording the greatest reduction owing to the near-zero sulphur content of LNG. NOx and PM emissions follow a similar pattern, with all alternative fuels outperforming the VLSFO baseline, and DF-LNG again demonstrating the most pronounced improvements in both categories.
At the WtT boundary, the emission profile diverges considerably depending on the feedstock and production pathway. Within the fuel pathways reported in Table 7, DF-LNG and DF-EtOH-Green Algae record the lowest upstream CO2eq intensities, whereas DF-MeOH-NG and DF-EtOH-Corn exhibit upstream CO2eq penalties that exceed the VLSFO baseline, indicating that the carbon burden of fuel production and supply chains can negate combustion-side benefits. SOx and NOx upstream emissions vary considerably across pathways, with DF-EtOH-Green Algae and DF-LNG demonstrating the most favourable upstream profiles relative to the baseline.
On a full-lifecycle WtW basis, DF-LNG and DF-EtOH-Green Algae achieve the greatest overall CO2eq reductions relative to Diesel-VLSFO, confirming that production pathway selection is as consequential as combustion efficiency in determining net emission performance. DF-MeOH and DF-EtOH-Corn, despite their TtW advantages, yield comparatively modest WtW CO2eq reductions, with DF-EtOH-Corn performing closer to the baseline when upstream emissions are fully accounted for. SOx and NOx reductions are maintained across all configurations at the WtW level, though the magnitude varies by pathway.
3.3. EEXI and CII Compliance
Figure 4 outlines the attained EEXI and CII values under the current regulatory paradigm, which relies exclusively on a TtW CO2 boundary condition.
Figure 4.
Attained EEXI and CII values.
Under the sensitivity assumption at a ±10% variation, the attained EEXI ranges from 2.52 to 3.08, remaining below the required EEXI threshold of 3.30 in all cases, thereby demonstrating continued compliance despite the assumed variation. Similarly, the attained CII ranges from 3.65 to 4.47, compared with the baseline value of 4.06. These relatively small variations do not alter the overall performance trends, indicating that the energy efficiency and carbon intensity assessments of the EtOH-fuelled configuration remain robust under reasonable uncertainty in FC.
Regarding the EEXI, the Diesel-VLSFO fails to meet the required regulatory threshold, emphasising the urgent need for technical or operational interventions for standard conventional vessels. Conversely, all DF alternatives achieve significant EEXI reductions relative to the VLSFO baseline. The DF-LNG configuration delivers the most substantial reduction, comfortably positioning it well below the maximum allowable limit. The alcohol-based alternatives, DF-MeOH and DF-EtOH, exhibit comparable but slightly lower reduction efficiencies than LNG; nonetheless, both successfully comply with the required EEXI baseline mandate.
This variance in initial carbon intensity translates directly into their operational CII trajectories over time. When mapped against the tightening annual CII_R boundaries from 2026 to 2030, the conventional baseline remains locked at an unfavourable ‘E’ rating throughout the entire period, indicating a critical non-compliance status that would mandate immediate corrective action. While the DF-LNG option initially secures a favourable ‘B’ rating in 2026 due to its lower localised carbon factor, it degrades to a stable ‘C’ rating through 2030 as regulatory thresholds tighten. For DF-EtOH, the trajectory mirrors that of DF-MeOH, with both configurations beginning at a ‘C’ rating in 2026 before dropping to a marginal ‘D’ rating for the remainder of the decade. This behaviour for DF-EtOH is a direct consequence of its higher mass-based FC relative to VLSFO, which arises from ethanol’s LCV, thereby elevating the attained CII despite the fuel’s reduced sulphur and particulate emissions.
3.4. GFI Performance, Compliance Balances and Remedial Obligations
These trends indicate that while alcohol-based fuels offer measurable emission reductions relative to conventional marine fuel oils under TtW-based regulatory metrics, their long-term compliance viability remains constrained by the progressive tightening of international maritime carbon intensity targets. Furthermore, the emission analysis demonstrates that TtW-only assessments may substantially misrepresent the relative decarbonisation potential of alternative fuels, reinforcing the necessity of adopting the WtW methodology for rigorous lifecycle emission evaluation in the maritime context. Accordingly, the attained WtW GFI was calculated for all evaluated fuel configurations, including e-fuel variants, and the results are presented in Figure 5.
Figure 5.
Attained WtW GFI values.
Figure 5 presents the attained WtW GFI of each fuel configuration, expressed in gCO2eq/MJ, benchmarked against the 2028 DCT and BT. Lower values indicate lower lifecycle GHG intensity and therefore stronger regulatory compliance. The horizontal reference lines mark the 2028 DCT (77.4 gCO2eq/MJ) and BT (89.6 gCO2eq/MJ); configurations plotting below the DCT generate compliance surpluses, those between the DCT and BT incur a Tier-1 deficit, and those above the BT incur both Tier-1 and Tier-2 deficits.
Relative to the 2028 DCT, VLSFO and grey MeOH exceed the regulatory threshold and would incur compliance deficits from the outset, while LNG lies only marginally above the DCT with a limited compliance margin. In contrast, the bioEtOH and bioMeOH pathways remain below the 2028 DCT and generate compliance surpluses, with BioEtOH-Green Algae and BioMeOH-Black Liquor achieving the lowest GHG intensities. The three e-fuel configurations attain an identical WtW GFI of 19.0 gCO2eq/MJ, obtained by summing the adopted TtW and WtT EFs from the Sustainable Ships database [89]. This value represents the intrinsic lifecycle GHG intensity only; the FuelEU Maritime RFNBO 2× multiplier is not applied in the IMO NZF assessment and is treated separately in Figure 6 and Figure 7. Based on the attained WtW GFI values, the regulatory compliance balances, categorised as surplus and remedial units, have been quantified and are shown in Figure 6 and Figure 7, respectively.
Figure 6.
Annual surplus units (t CO2eq) generated by each marine fuel configuration over the 2028–2033 compliance period.
Figure 7.
Annual remedial units (a) (t CO2eq) and corresponding remedial costs (b) (USD) for each non-compliant marine fuel configuration, 2028–2033.
Among the biofuel pathways, BioEtOH-Green Algae and BioMeOH-BL generate the largest annual surpluses, while BioEtOH-Corn produces the most modest contribution, reflecting its comparatively higher WtW GFI. The e-fuel group collectively generates by far the largest surplus across all years, a consequence of both their exceptionally low WtW GFI values and the application of the RED III RFNBO 2× energy multiplier applicable until the end of 2033.
In aggregate terms, the total surplus CO2eq accumulated over the 2028–2033 period amounts to 70,556.42 t for the e-fuel group, 30,951.63 t for BioEtOH-Green Algae, 31,445.03 t for BioMeOH-BL, 22,138.51 t for BioEtOH-Sugarcane, 18,122.41 t for BioMeOH-CW, and 9288.76 t for BioEtOH-Corn. Within the FuelEU Maritime accounting layer, these accumulated surpluses may have strategic value because pooling allows compliance balances to be shared across vessels, subject to the conditions established by the regulation.
The pooling mechanism, one of the most innovative flexibility instruments introduced by the regulation, allows vessels to combine annual compliance balances, enabling surplus-generating vessels to offset the deficits from other less-compliant ships within or across fleets. Ships within or across companies can combine their annual compliance balances to offset deficits with surpluses, making the surplus CO2eq generated by an alternative-fuel retrofit on a single vessel directly transferable to less-compliant fleet members.
Furthermore, if a vessel reduces its GHG intensity beyond the required target, the surplus can be banked for use in the following reporting period, allowing over-compliant vessels to build a strategic reserve to offset future deficits as targets become more stringent. Consequently, the surplus volumes quantified here represent not merely an emissions accounting benefit but a tangible commercial asset, enabling fleet operators to defer capital investment in fuel transitions across less-compliant tonnage while maintaining regulatory compliance at the fleet level.
Figure 7 presents the remedial CO2eq obligations and the corresponding remedial costs for the conventional and biofuel configurations. These results are identical under both the proposed IMO NZF and FuelEU Maritime, as the differences between the two regulatory schemes arise only for RFNBOs, which are not included in the remedial unit comparison. For all configurations, the remedial CO2eq obligations and their associated financial penalties increase progressively from 2028 to 2033, reflecting the increasingly stringent GHG intensity targets over successive compliance periods. BioEtOH-Corn remains compliant throughout most of the assessment period, incurring a remedial obligation only in 2033 when the regulatory target becomes more stringent, indicating that its lifecycle GHG intensity lies close to the compliance threshold. In contrast, MeOH (NG) accumulates the largest remedial burden, with annual remedial CO2eq increasing steadily to a cumulative total of 15,236.64 t, reflecting its comparatively high WtW GFI. VLSFO represents the second most penalised configuration, with a cumulative remedial obligation of 11,815.94 t, whereas DF-LNG exhibits a more moderate but progressively increasing compliance burden, reaching 5332.12 t over the assessment period. As shown in Figure 7b, the increasing remedial CO2eq obligations translate directly into escalating compliance costs, with MeOH (NG) incurring the highest cumulative financial penalty, followed by VLSFO and DF-LNG.
The financial implications of these remedial obligations are considerable. MeOH (NG) incurs the highest cumulative remedial cost at approximately 3.91 million USD, followed by VLSFO at approximately 2.61 million USD and LNG at approximately 0.77 million USD. BioEtOH-Corn incurs a negligible remedial cost confined to the final reporting year. The year-on-year escalation in remedial costs across all non-compliant configurations underscores the increasing financial risk of continued reliance on fossil or fossil-derived fuels under the FuelEU Maritime compliance regime. These results demonstrate that deferring fuel transition carries a compounding financial penalty and that the remedial cost trajectory is structurally unfavourable for operators maintaining conventional fuel strategies beyond the near term.
The annual production cost varies substantially across the evaluated bioEtOH feedstock pathways. Sugarcane represents the most economically attractive option, with the lowest annual production cost at 1.53 million USD/year among all feedstocks examined, reflecting the high fermentable sugar yield and well-established large-scale processing infrastructure associated with this crop. Corn-based bioEtOH incurs a moderately higher annual production cost at 3.00 million USD/year, approximately twice that of the sugarcane pathway, attributable to the additional processing steps required for starch hydrolysis prior to fermentation. Green algae, by contrast, exhibits a disproportionately high annual production cost at 65.77 million USD/year, more than an order of magnitude greater than the sugarcane and corn pathways, owing to the energy-intensive cultivation, harvesting, and lipid extraction processes currently associated with microalgae-based biofuel production. These findings indicate that, although green algae-based bio-EtOH and e-fuels offer favourable WtW GFI characteristics, as demonstrated in Figure 5, their economic viability under current production technologies remains a significant barrier to near-term commercial deployment in the maritime fuel supply chain.
3.5. Fuel Costs and Cost-Competitiveness Thresholds
To address this cost-competitiveness constraint, annual fuel and carbon expenditure were computed using market prices for LNG, grey MeOH, VLSFO, and MDO as reference benchmarks. These calculations establish the upper-bound price thresholds within which the examined bio- and e-fuels must remain economically viable. Figure 8 illustrates the annual fuel costs of available marine fuels, including the remedial costs described above.
Figure 8.
Annual fuel costs including remedial costs.
VLSFO consistently incurs the highest annual fuel and remedial costs across all years, rising from approximately USD 7.5 million in the baseline (‘Without GFI’) case to around USD 8.3 million by 2033. This progressive increase reflects the compounding effect of GFI remedial penalties applied from 2028 onwards, with the error bars indicating moderate sensitivity to bunker price volatility.
LNG exhibits relatively stable annual costs throughout the analysis horizon, remaining in the range of approximately USD 7.2–7.6 million. The marginal year-on-year increase suggests that LNG incurs lower GFI remedial penalties than VLSFO, consistent with its reduced carbon intensity. Price uncertainty, as indicated by the error bars, is comparable to that of VLSFO.
Grey MeOH records the lowest annual costs in the baseline case at approximately USD 6.0 million, though costs rise gradually to approximately USD 6.9 million by 2033 as GFI penalties are applied. Despite this upward trend, MeOH retains a cost advantage due to its low price over both VLSFO and LNG throughout the entire compliance period.
The bunker prices adopted in this analysis are specific to the Port of Rotterdam. Grey MeOH prices at Rotterdam are comparatively lower than those reported at alternative bunkering hubs, which partly explains the cost advantage observed for grey MeOH in Figure 8. Readers should exercise caution when generalising these results to other port calls or trade routes where MeOH availability and pricing may differ substantially. Figure 9 presents the cost-competitive price thresholds for the bio- and e-EtOH examined, derived from the annual fuel and GFI remedial costs of VLSFO and grey MeOH as the upper and lower reference benchmarks, respectively. For each year in the compliance horizon, the threshold is computed by dividing the annual fuel and remedial expenditure of the reference fuel by the annual EtOH consumption of the retrofit scenario. BioEtOH-Corn was used as the conservative EtOH pathway for threshold comparison because it exhibited the highest GFI among the EtOH pathways evaluated.
Figure 9.
The cost-competitive price thresholds for the bio- and e-EtOH.
The VLSFO-based thresholds range from 557.06 USD/t in the baseline (‘Without GFI’) case to 615.03 USD/t by 2033, reflecting the progressive accumulation of GFI penalties on conventional fuel expenditure. The grey MeOH-based thresholds follow a parallel upward trajectory, rising from 432.43 USD/t to 507.64 USD/t over the same period, and consistently remain approximately 120–125 USD/t below the VLSFO-derived values, attributable to the lower bunker price of grey MeOH at the Port of Rotterdam. The error bars denote the sensitivity range derived from the minimum and maximum annual bunker prices reported in Table 6. The progressive increase in both thresholds across the 2028–2033 horizon reflects the tightening GFI penalty structure, which effectively raises the allowable price ceiling for alternative fuels as conventional fuel compliance costs escalate.
Nevertheless, current production costs for bio- and e-EtOH exceed the derived thresholds across most feedstock pathways, indicating that cost competitiveness has not yet been achieved under prevailing market conditions. Among the bioEtOH pathways examined, sugarcane-based production represents the closest approximation to commercial viability, while corn-based production incurs substantially higher unit costs, and green algae-based pathways remain economically prohibitive under current conversion technologies. It should be noted that the production cost estimates considered in the presented work exclude additional costs associated with marine fuel conditioning, transportation, distribution, bunkering infrastructure, and delivery to port. Consequently, the actual delivered cost of EtOH as a marine fuel is expected to be higher than the production cost values presented, suggesting that the economic competitiveness of these pathways may be further constrained under current market conditions. Therefore, for bio- and e-EtOH to attain cost parity within the derived thresholds, both substantial reductions in production costs and significant expansion of maritime fuel supply and bunkering infrastructure are required, enabling delivered fuel prices to converge toward the levels implied by the GFI compliance economics of conventional reference fuels.
4. Discussion
This section discusses the research findings, focusing specifically on the challenges, regulatory frameworks, and future directions for maritime decarbonisation in relation to the primary research questions.
For ease of reference, the principal quantitative outcomes of the fuel pathway assessment are consolidated in Table 8, which summarises the WtW GFI, compliance status relative to the 2028 DCT, cumulative surplus or deficit over 2028 to 2033, and cumulative remedial cost for each configuration assessed within the scope of the study. The discussion that follows refers to this table together with the detailed figures and tables presented in Section 3.
Table 8.
Consolidated comparison of assessed fuel pathways under FuelEU.
4.1. Model Validation, Experimental Evidence, and Uncertainty
The calculated results are grounded in an empirical vessel operational dataset covering approximately 5.37 years, including recorded main-engine power, operating hours, and FC, while the alternative-fuel consumption estimates use manufacturer-derived specific fuel consumption data. These inputs provide a realistic operational basis but do not constitute independent experimental validation of the simulated retrofit configurations. Experimental evidence nevertheless supports the feasibility of EtOH–diesel DF combustion: Nowak and Tutak [90] demonstrated operation with EtOH supplying up to 50% of the fuel energy in a single-cylinder compression ignition engine and assessed its effects on combustion stability and ignition behaviour. However, the engine scale, injection arrangement, and operating conditions differ from those of the large-bore, low-speed marine engine considered here, preventing direct validation of the predicted FC and emissions [91]. Independent validation would require load-resolved measurements of EtOH and pilot fuel consumption, shaft power, and exhaust emissions from a representative marine engine, together with pathway-specific inventory data for the upstream lifecycle assessment [92].
The principal source of uncertainty is the EtOH consumption estimate, which was obtained by scaling MeOH performance data according to EtOH’s LCV. The assumed ±10% consumption sensitivity analysis therefore assesses the consequences of this approximation rather than establishing an experimentally verified error bound. Although absolute emissions, EEXI, CII, GFI, and compliance outcomes vary within this range, the relative ranking of the fuel pathways and the main regulatory conclusions remain unchanged. Additional uncertainty arises from CH4 slip in LNG DF operation, which varies with engine load and technology and can differ from regulatory default assumptions [18,93,94], as well as from pathway-specific variation in WtT EFs [92,95]. Accordingly, the reported emissions, compliance outcomes, and cost thresholds should be regarded as robust in comparative terms, but conditional scenario estimates rather than experimentally confirmed predictions.
Similarly, the WtT EFs adopted for grey MeOH and e-MeOH production are drawn from generic pathway-level databases rather than plant-specific data, and reported WtT CO2eq intensities for MeOH synthesis routes vary considerably across feedstock and process configurations in the literature [29,96].
These additional sources of uncertainty were not propagated through the emissions and compliance calculations, as doing so would require pathway-specific variability data beyond the scope of the available dataset. Decision-makers should therefore interpret the relative ranking of fuel pathways in Table 7 and Figure 4 and Figure 5 as directionally robust, while treating the absolute magnitude of the reported CO2eq, CII, and GFI values for DF-LNG and DF-MeOH as subject to a similar order of uncertainty to that demonstrated for DF-EtOH.
4.2. Cargo Capacity Losses and Unseen Costs of Alternative Fuels
The EV results carry an economic dimension that the GFI-oriented scenario and CII metric do not capture. For a tanker, DWT is both the compliance denominator and the primary revenue-generating asset. Increasing fuel tank volume to accommodate LNG, EtOH, or MeOH reduces the capacity available for cargo, since retrofit vessels cannot be enlarged to compensate. Given the storage volume penalties calculated for LNG, EtOH, and MeOH as presented in Figure 3, the cargo capacity loss scales directly with the storage penalty and grows more severe for lower-density fuels [59].
This capacity loss is an unseen cost. It does not appear in bunker price comparisons or GFI remedial cost calculations, yet it directly affects the commercial viability of alternative-fuel retrofits. Reduced cargo intake per voyage lowers freight revenue, and this loss compounds over the vessel’s remaining service life, unlike the one-time capital cost of engine conversion [49,97]. Where alternative-fuel tanks displace cargo space rather than occupying existing double bottom or void spaces, retrofit economics shift unfavourably even when fuel costs and GFI compliance are favourable, as with the bioEtOH pathways identified as cost-competitive.
Increased storage volume also introduces further indirect costs. Larger tanks add structural steel weight. LNG requires cryogenic-rated containment and secondary barriers, while MeOH and EtOH require corrosion-resistant tank coatings given their solvent properties [53]. These modifications alter lightship weight and trim, affect stability calculations, and may require classification society re-approval. The derived fuel price and compliance cost thresholds do not account for any of these effects. Reduced fuel autonomy per tank volume also increases bunkering frequency, adding port time and potential off-hire exposure [26]. A comprehensive techno-economic assessment of alternative-fuel retrofits should therefore incorporate cargo capacity opportunity costs and structural modification costs alongside fuel price and regulatory compliance costs, representing an important direction for future research.
4.3. LNG CH4 Slip and Lifecycle Compliance
The lifecycle emission performance of LNG under the GFI-oriented scenario reveals a fundamental tension between its CO2 advantages and its CH4 slip liability [10,19,98]. On a CO2 basis, LNG delivers meaningful reductions relative to the VLSFO baseline at the TtW boundary, attributable to the lower carbon content of NG [99,100]. However, DF engine operation introduces CH4 slip, whereby unburned CH4 bypasses complete combustion and is discharged with exhaust gases, imposing a direct TtW GHG penalty [101,102]. This is evident in Table 7, where DF-LNG records a CH4 emission burden of 60.93 t at the TtW boundary. Given the considerably higher GWP100-weighted impact of CH4 in CO2eq accounting, even modest slip rates carry a disproportionate effect on TtW CO2eq intensity, which propagates through to the WtW boundary and undermines LNG’s compliance value [14,,103].
This penalty is further compounded by substantial upstream emissions arising from extraction, processing, liquefaction, and transport. As detailed in Table 5, the WtT of fossil LNG stands at 18.5 gCO2eq/MJ, representing an inherent structural limitation under comprehensive WtW accounting [104,105]. As regulatory targets tighten over time, LNG’s position deteriorates from a compliance perspective, which supports its characterisation as a transitional fuel rather than an end-state decarbonisation pathway [105,106]. In Figure 5, DF-LNG plots marginally above the 2028 DCT at 80.15 gCO2eq/MJ, leaving essentially no compliance margin. CH4-slip abatement through improved engine operation can strengthen LNG’s near-term performance, although deeper mitigation is still needed [19].
4.4. EtOH vs. MeOH: Compliance Positioning and Cost Structure
The comparative assessment of EtOH and MeOH reveals that alcohol fuels can display broadly comparable TtW behaviour when assessed primarily through onboard combustion metrics. However, their WtW and GFI-oriented compliance performance diverges substantially once production pathways, feedstocks, and electro-synthetic routes are considered. The divergence is most pronounced at the third-generation boundary, where green algae-derived bioEtOH and residue-based black liquor-derived bioMeOH achieve the lowest WtT GHG intensities among their respective variants. Notably, black liquor-derived bioMeOH attains a marginally lower WtT GFI value than green algae-based bioEtOH, as shown in Table 5, reflecting the lower upstream energy intensity of black liquor conversion relative to microalgae cultivation [95,107].
Beyond emissions, EtOH presents operationally significant advantages over MeOH that strengthen its case for maritime deployment. Its higher LCV reduces onboard storage requirements relative to MeOH, partially alleviating the tank volume penalty inherent to alcohol-based fuels, as indicated in Figure 3 [57]. EtOH’s visible combustion flame, in contrast to MeOH’s invisible daylight flame, simplifies fire detection and improves crew safety during handling operations [53,54]. MeOH’s classification as a severe neurotoxin further elevates occupational health risks relative to EtOH, which exhibits considerably lower acute toxicity [53]. Finally, EtOH’s mature global land logistics infrastructure, established through its extensive use in road transport fuel blending, provides a near-term supply chain readiness advantage. While MeOH’s dedicated bunkering network is progressively expanding within the maritime domain, EtOH’s established automotive supply chain could be effectively leveraged to accelerate its maritime adoption, potentially bridging the infrastructural gap with MeOH and LNG [53,54]. However, EtOH’s corrosive properties may require modifications or upgrades to engine components to prevent damage, a consideration that must be balanced against its safety advantages [53].
4.5. Economic and Regulatory Implications of Fuel and Feedstock Selection Under the GFI-Oriented Scenario
The GFI compliance balances quantified demonstrate that fuel and feedstock selection carries financial consequences extending well beyond procurement costs. The e-fuel group generates the largest cumulative surplus, driven by exceptionally low WtW intensities and the FuelEU Maritime RFNBO 2× multiplier, which confers a structural advantage unavailable to biofuel or fossil configurations. Among biofuels, third-generation feedstocks generate the largest surpluses while corn-based bioEtOH contributes most modestly, as illustrated in Figure 6. This confirms that feedstock selection exerts a regulatory influence comparable to that of the fuel type itself. These surpluses may have strategic compliance value under the FuelEU pooling mechanism. In contrast, fossil and grey pathways incur escalating remedial obligations, with grey MeOH and VLSFO accumulating the largest burdens, as demonstrated in Figure 7, reinforcing the economic case for early fuel transition.
This regulatory advantage, however, is time-limited and economically constrained. The RFNBO 2× energy multiplier under FuelEU Maritime expires on 31 December 2033, after which compliance of electro-fuels will depend solely on their intrinsic WtW GHG intensity. Consequently, the compliance advantage provided by the temporary RFNBO incentive will cease, placing greater emphasis on achieving low lifecycle emissions through fuel production pathways rather than regulatory accounting mechanisms. Meanwhile, the cost-competitive thresholds derived (557.06 to 615.03 USD/t on a VLSFO basis and 432.43 to 507.64 USD/t on a grey MeOH basis, as shown in Figure 9) widen progressively as GFI-oriented remedial penalties increase over successive compliance periods but remain substantially below the current production costs for most EtOH pathways as summarised in Table 8.
Among the bioEtOH pathways evaluated, sugarcane-based production is the closest to commercial viability [108,109], whereas corn-based bioEtOH remains above the derived thresholds [110], and both green algae-derived bioEtOH and e-EtOH continue to be economically prohibitive under present production technologies [111,112]. It should also be noted that these threshold prices are based on Rotterdam fuel market conditions, where conventional grey MeOH prices are comparatively low. Consequently, caution should be exercised when generalising these findings to other bunkering hubs, as regional variations in fuel availability, production pathways, logistics, and market prices may significantly influence the economic competitiveness of alternative marine fuels.
4.6. CII vs. GFI Divergence: A Regulatory Framework Mismatch
A notable and practically significant finding of this study concerns the divergence between CII and GFI compliance outcomes for alcohol-based fuel configurations. Under the CII framework, which applies a TtW CO2-only accounting boundary, both DF-MeOH and DF-EtOH configurations degrade to a D rating by 2027 and maintain this trajectory through 2030, as shown in Figure 4. This indicates regulatory underperformance relative to the tightening annual reduction factors. This outcome reflects the higher mass-based FC of alcohol fuels relative to VLSFO, a direct consequence of their lower LCVs, which elevates the CO2 intensity per unit of transport work under the CII metric despite the absence of sulphur and particulate emissions [28].
Under the GFI-oriented scenario, however, the same configurations generate material compliance surpluses from 2028 onwards, as depicted in Figure 5, owing to the biogenic zero TtW CO2 treatment and the favourable WtT emission intensities conferred by certified sustainable production pathways. This apparent contradiction, whereby a fuel configuration is simultaneously penalised under one regulatory framework and rewarded under another, exposes a structural inconsistency between TtW-only and WtW lifecycle metrics in the current maritime regulatory architecture.
The practical implication for vessel operators is that compliance strategies optimised for CII performance may not be congruent with those that maximise GFI compliance value, and that a dual-framework approach to regulatory planning is necessary to avoid suboptimal fuel transition decisions. More broadly, this finding reinforces the argument advanced in this study and elsewhere in the literature that TtW-only regulatory metrics systematically misrepresent the decarbonisation potential of alternative fuels, and that the transition toward WtW lifecycle accounting embodied in the GFI-oriented scenario represents a necessary and overdue correction to the maritime regulatory paradigm.
5. Conclusions
This study has reassessed EtOH as a marine fuel retrofit candidate for a case-study tanker, evaluating its regulatory and economic performance against LNG and MeOH under the EEXI-, CII-, and GFI-oriented WtW compliance frameworks. The findings demonstrate that the lifecycle accounting boundary fundamentally alters the relative ranking of alternative fuels. Under the TtW-only CII framework, the DF MeOH and DF EtOH configurations both degrade to a marginal ‘D’ rating by 2027 and remain there through 2030, whereas under the WtW-based GFI framework the same configurations generate material compliance surpluses from 2028 onwards. This divergence, in which a fuel is penalised under one metric and rewarded under another, exposes the structural inconsistency between TtW-only and WtW lifecycle accounting in the current maritime regulatory architecture and confirms that TtW-only metrics such as the CII systematically misrepresent the decarbonisation potential of alcohol-based fuels.
Feedstock and production pathway selection emerged as a determinant of compliance performance comparable in significance to that of the fuel type itself. Across the biofuel pathways assessed, the WtW GFI ranged from 7.5 gCO2eq/MJ for BioEtOH-Green Algae to 56.4 gCO2eq/MJ for BioEtOH-Corn, a spread of more than an order of magnitude within the same fuel family, confirming that the production route rather than the fuel molecule governs compliance performance. This ranking was reflected in the cumulative compliance surpluses accumulated over 2028 to 2033, which reached 70,556 t CO2eq for the e-fuel group and 30,952 t CO2eq for BioEtOH-Green Algae at the favourable end, compared with 9289 t CO2eq for BioEtOH-Corn at the unfavourable end. By contrast, the non-compliant configurations incurred escalating remedial costs, with grey MeOH and VLSFO facing cumulative penalties of approximately USD 3.91 million and USD 2.61 million respectively.
The cost-competitive price analysis established that, despite favourable GFI compliance characteristics, current production costs for advanced bioEtOH and e-EtOH pathways remain above the thresholds required for commercial viability within the 2028 to 2033 horizon. The allowable price ceiling for bio- and e-EtOH rose from 557.06 USD/t to 615.03 USD/t across the compliance period, yet even the most favourable bioEtOH pathway, sugarcane-based production at 1.53 million USD/year, remained above this threshold under prevailing market conditions.
Several limitations should be acknowledged. The economic analysis relies on bunker price data specific to the Port of Rotterdam, and the FC and emissions modelling are derived from a single case-study vessel, limiting generalisability to other vessel types and trading patterns. EtOH SFC data were derived from the structurally similar MeOH dataset in the absence of dedicated marine EtOH engine performance data, and the production cost figures were sourced from the existing techno-economic literature rather than primary cost modelling. Future research should prioritise dedicated marine engine performance data for EtOH combustion, extend the analysis across multiple bunkering hubs, and model e-fuel compliance positioning under successor post-2033 FuelEU Maritime and RFNBO accounting provisions once confirmed.
Author Contributions
Conceptualisation, O.Y., O.D. and M.B.; methodology, O.Y., M.B. and E.B.-D.; software, O.Y.; validation, O.Y., M.B. and O.D.; formal analysis, O.Y. and M.B.; investigation, O.Y., M.B. and O.D.; resources, L.A.D.-S.; data curation, O.Y. and M.B.; writing—original draft preparation, O.Y., M.B., O.D. and E.B.-D.; writing—review and editing, E.B.-D., L.A.D.-S., J.W.R. and C.G.-S.; visualisation, O.Y.; supervision, J.W.R. and C.G.-S.; project administration, J.W.R. and C.G.-S. All authors have read and agreed to the published version of the manuscript.
Funding
This research funded by the European Cooperation in Science and Technology (COST).
Data Availability Statement
The data presented in this study are available upon request from the author.
Acknowledgements
The authors gratefully acknowledge the support and endorsement of COST Action DeWaTra (CA23159—Decarbonising Waterborne Transportation), funded by the European Cooperation in Science and Technology (COST).
Conflicts of Interest
The authors declare no conflicts of interest.
Abbreviations
The following abbreviations are used in this manuscript:
| bioEtOH | Bioethanol |
| bioMeOH | Biomethanol |
| BT | Base Target |
| CD | Compliance Deficit |
| CII | Carbon Intensity Indicator |
| CO2eq | Carbon Dioxide Equivalent |
| DAC | Direct Air Capture |
| DCT | Direct Compliance Target |
| DF | Dual-Fuel |
| DWT | Deadweight Tonnage |
| EEDI | Energy Efficiency Design Index |
| e-EtOH | Electro-ethanol |
| EEXI | Energy Efficiency Existing Ship Index |
| EF | Emission Factor |
| eLNG | Electro-LNG |
| e-MeOH | Electro-methanol |
| EtOH | Ethanol |
| EU | European Union |
| EV | Volumetric Energy Density |
| FC | Fuel Consumption |
| GFI | Greenhouse Gas Fuel Intensity |
| GHG | Greenhouse Gas |
| GT | Gross Tonnage |
| GWP100 | 100-year Global Warming Potential |
| HFO | Heavy Fuel Oil |
| IMO | International Maritime Organization |
| IPCC | Intergovernmental Panel on Climate Change |
| LCA | Life Cycle Assessment |
| LCV | Lower Calorific Value |
| LNG | Liquefied Natural Gas |
| M/E | Main Engine |
| MARPOL | International Convention for the Prevention of Pollution from Ships |
| MDO | Marine Diesel Oil |
| MeOH | Methanol |
| MeOH-NG | Natural-Gas-Derived Methanol |
| MEPC | IMO Marine Environment Protection Committee |
| N2O | Nitrous Oxide |
| NG | Natural Gas |
| NOX | Nitrogen Oxides |
| NZF | Net-Zero Framework |
| PM | Particulate Matter |
| RED III | EU Renewable Energy Directive III |
| RFNBO | Renewable Fuel of Non-Biological Origin |
| SFC | Specific Fuel Consumption |
| SOx | Sulphur Oxides |
| TtW | Tank-to-Wake |
| VLSFO | Very-Low-Sulphur Fuel Oil |
| WtT | Well-to-Tank |
| WtW | Well-to-Wake |
Appendix A
Table A1.
Particulars of the case-study ship.
Table A2.
DF engine fuel data.
References
- Tadros, M.; Ventura, M.; Guedes Soares, C. Review of the IMO Initiatives for Ship Energy Efficiency and Their Implications. J. Mar. Sci. Appl. 2023, 22, 662–680. [Google Scholar] [CrossRef] [Scilit]
- Mohd Tamam, M.Q.; Dansoh, C.; Panesar, A. The Roadmap to Carbon Neutrality for the Maritime Industry: An Insight into Various Routes to Decarbonise Ship Engines. Energy Convers. Manag. X 2025, 27, 101184. [Google Scholar] [CrossRef] [Scilit]
- Kim, M.; Lee, J.-Y.; An, S.; Hwang, D.-J. Proposals on Effective Implementation of the Carbon Intensity Indication of Ships. J. Mar. Sci. Eng. 2024, 12, 1906. [Google Scholar] [CrossRef] [Scilit]
- Czermański, E.; Oniszczuk-Jastrząbek, A.; Spangenberg, E.F.; Kozłowski, Ł.; Adamowicz, M.; Jankiewicz, J.; Cirella, G.T. Implementation of the Energy Efficiency Existing Ship Index: An Important but Costly Step towards Ocean Protection. Mar. Policy 2022, 145, 105259. [Google Scholar] [CrossRef] [Scilit]
- International Maritime Organization (IMO). Marine Environment Protection Committee (MEPC 83), 7 to 11 April 2025. Available online: https://www.imo.org/en/mediacentre/meetingsummaries/pages/mepc-83rd-session.aspx (accessed on 14 May 2026).
- Bayraktar, M.; Bayramoğlu, K.; Yuksel, O. Evaluating the Greenhouse Gas Fuel Intensity of Marine Fuels Under the Maritime Net-Zero Framework. Sustainability 2026, 18, 184. [Google Scholar] [CrossRef] [Scilit]
- Shi, J.; Zhu, Y.; Feng, Y.; Yang, J.; Xia, C. A Prompt Decarbonization Pathway for Shipping: Green Hydrogen, Ammonia, and Methanol Production and Utilization in Marine Engines. Atmosphere 2023, 14, 584. [Google Scholar] [CrossRef] [Scilit]
- Bilgili, L. Comparative Assessment of Alternative Marine Fuels in Life Cycle Perspective. Renew. Sustain. Energy Rev. 2021, 144, 110985. [Google Scholar] [CrossRef] [Scilit]
- Zincir, B.A.; Arslanoglu, Y. Comparative Life Cycle Assessment of Alternative Marine Fuels. Fuel 2024, 358, 129995. [Google Scholar] [CrossRef] [Scilit]
- Balcombe, P.; Staffell, I.; Kerdan, I.G.; Speirs, J.F.; Brandon, N.P.; Hawkes, A.D. How Can LNG-Fuelled Ships Meet Decarbonisation Targets? An Environmental and Economic Analysis. Energy 2021, 227, 120462. [Google Scholar] [CrossRef] [Scilit]
- Hazar, C.; Yuksel, O.; Bayraktar, M. A Comprehensive Statistical and Regional Analysis of LNG-Powered Marine Vessels on GHG Mitigation Strategies Considering Existing Bunkering Stations and GWP Values. J. Mar. Sci. Technol. Taiwan 2026, 34, 3. [Google Scholar] [CrossRef]
- Abdelmalek, M.; Guedes Soares, C. Review of Risk Analysis Studies in the Maritime LNG Sector. J. Mar. Sci. Appl. 2023, 22, 693–715. [Google Scholar] [CrossRef] [Scilit]
- Yuksel, O. A Comprehensive Feasibility Analysis of Dual-Fuel Engines and Solid Oxide Fuel Cells on a Tanker Ship Considering Environmental, Economic, and Regulation Aspects. Sustain. Prod. Consum. 2023, 42, 106–124. [Google Scholar] [CrossRef] [Scilit]
- Balcombe, P.; Brierley, J.; Lewis, C.; Skatvedt, L.; Speirs, J.; Hawkes, A.; Staffell, I. How to Decarbonise International Shipping: Options for Fuels, Technologies and Policies. Energy Convers. Manag. 2019, 182, 72–88. [Google Scholar] [CrossRef] [Scilit]
- Laskar, I.I.; Giang, A. Policy Approaches to Mitigate In-Use Methane Emissions from Natural Gas Use as a Marine Fuel. Environ. Res. Infrastruct. Sustain. 2023, 3, 025005. [Google Scholar] [CrossRef] [Scilit]
- Lehtoranta, K.; Vesala, H.; Flygare, N.; Kuittinen, N.; Apilainen, A.-R. Measuring Methane Slip from LNG Engines with Different Devices. J. Mar. Sci. Eng. 2025, 13, 890. [Google Scholar] [CrossRef] [Scilit]
- Sagot, B.; Defossez, R.; Mahi, R.; Villot, A.; Joubert, A. An Engine Load Monitoring Approach for Quantifying Yearly Methane Slip Emissions from an LNG-Powered RoPax Vessel. J. Mar. Sci. Eng. 2025, 13, 1379. [Google Scholar] [CrossRef] [Scilit]
- Kuittinen, N.; Koponen, P.; Vesala, H.; Lehtoranta, K. Methane Slip and Other Emissions from Newbuild LNG Engine under Real-World Operation of a State-of-the Art Cruise Ship. Atmos. Environ. X 2024, 23, 100285. [Google Scholar] [CrossRef] [Scilit]
- Utama, Y.P.; Setiyawati, R.; Rochmansyah, R.; Wahyuni H., N.; Mulyana, F. LNG as Marine Fuel under LGF Code: A Meta-Analysis of Emission Reduction, Economic Viability and Safety Performance. Dinasti Int. J. Digit. Bus. Manag. 2026, 7, 352–356. [Google Scholar] [CrossRef] [Scilit]
- Bayramoğlu, K.; Bayraktar, M.; Seyhan, A.; Yuksel, O. Evaluation of Techniques to Reduce Carbon Emissions from Ships within the Scope of Revised Greenhouse Gas Emission Targets for 2030, 2040, and 2050. Ocean Eng. 2025, 334, 121605. [Google Scholar] [CrossRef] [Scilit]
- Vuskovic, B.; Rudan, I.; Sumner, M. Fostering Sustainable LNG Bunkering Operations: Development of Regulatory Framework. Sustainability 2023, 15, 7358. [Google Scholar] [CrossRef] [Scilit]
- Seyhan, A.; Bayraktar, M.; Yüksel, O.; Sevgili, C. Scenario-Based LCOE Assessment for Bulk Carriers within the Scope of EU ETS Encompassing Carbon Tax, Fuel Prices and GHG Emissions. Clim. Change 2026, 179, 16. [Google Scholar] [CrossRef] [Scilit]
- Xing, H.; Stuart, C.; Spence, S.; Chen, H. Alternative Fuel Options for Low Carbon Maritime Transportation: Pathways to 2050. J. Clean. Prod. 2021, 297, 126651. [Google Scholar] [CrossRef] [Scilit]
- Zheng, Q.; Sun, L.; Chang, S.; Xing, H. Techno-Economic Analysis of Multi-Purpose Heavy-Lift Vessels Using Methanol as Fuel. J. Mar. Sci. Eng. 2025, 13, 1234. [Google Scholar] [CrossRef] [Scilit]
- Esfandiari, H.; Muri, H.; Kramel, D. Biomethanol as a Marine Fuel Within Land Use Sustainability Boundaries. Clean Technol. 2025, 7, 101. [Google Scholar] [CrossRef] [Scilit]
- Yuksel, O.; Blanco-Davis, E.; Fuentes, G.; Takvam, T.; Tsoulakos, N. Hybrid Propulsion and Alternative Fuels in Maritime Transport: A Panama Canal-Centred Assessment. J. Mar. Eng. Technol. 2026, 1–31. [Google Scholar] [CrossRef] [Scilit]
- Huang, J.; Fan, H.; Xu, X.; Liu, Z. Life Cycle Greenhouse Gas Emission Assessment for Using Alternative Marine Fuels: A Very Large Crude Carrier (VLCC) Case Study. J. Mar. Sci. Eng. 2022, 10, 1969. [Google Scholar] [CrossRef] [Scilit]
- Bayraktar, M.; Yuksel, O.; Pamik, M. An Evaluation of Methanol Engine Utilization Regarding Economic and Upcoming Regulatory Requirements for a Container Ship. Sustain. Prod. Consum. 2023, 39, 345–356. [Google Scholar] [CrossRef] [Scilit]
- Adami, G.; Figari, M. Feasibility Analysis of a Methanol Fuelled Bulk Carrier. Model. Optim. Ship Energy Syst. 2023, 4. [Google Scholar] [CrossRef] [Scilit]
- Law, L.; Foscoli, B.; Mastorakos, E.; Evans, S. A Comparison of Alternative Fuels for Shipping in Terms of Lifecycle Energy and Cost. Energies 2021, 14, 8502. [Google Scholar] [CrossRef] [Scilit]
- Parris, D.; Spinthiropoulos, K.; Ragazou, K.; Giovou, A.; Tsanaktsidis, C. Methanol, a Plugin Marine Fuel for Green House Gas Reduction—A Review. Energies 2024, 17, 605. [Google Scholar] [CrossRef] [Scilit]
- de Fournas, N.; Wei, M. Techno-Economic Assessment of Renewable Methanol from Biomass Gasification and PEM Electrolysis for Decarbonization of the Maritime Sector in California. Energy Convers. Manag. 2022, 257, 115440. [Google Scholar] [CrossRef] [Scilit]
- Tomos, B.A.D.; Stamford, L.; Welfle, A.; Larkin, A. Decarbonising International Shipping—A Life Cycle Perspective on Alternative Fuel Options. Energy Convers. Manag. 2024, 299, 117848. [Google Scholar] [CrossRef] [Scilit]
- Deniz, C.; Zincir, B. Environmental and Economical Assessment of Alternative Marine Fuels. J. Clean. Prod. 2016, 113, 438–449. [Google Scholar] [CrossRef] [Scilit]
- Chen, Z.; He, J.; Chen, H.; Geng, L.; Zhang, P. Comparative Study on the Combustion and Emissions of Dual-Fuel Common Rail Engines Fueled with Diesel/Methanol, Diesel/Ethanol, and Diesel/n-Butanol. Fuel 2021, 304, 121360. [Google Scholar] [CrossRef] [Scilit]
- Saccullo, M.; Nygren, A.; Benham, T.; Denbratt, I. Alcohol Flexible HD Single Cylinder Diesel Engine Tests with Separate Dual High Pressure Direct Fuel Injection. Fuel 2021, 294, 120478. [Google Scholar] [CrossRef] [Scilit]
- Mukherjee, A.; Bruijnincx, P.; Junginger, M. A Perspective on Biofuels Use and CCS for GHG Mitigation in the Marine Sector. iScience 2020, 23, 101758. [Google Scholar] [CrossRef] [Scilit] [PubMed]
- Davis, G.W. Addressing Concerns Related to the Use of Ethanol-Blended Fuels in Marine Vehicles. J. Sustain. Dev. Energy Water Environ. Syst. 2017, 5, 546–559. [Google Scholar] [CrossRef] [Scilit]
- Bilgili, L. A Systematic Review on the Acceptance of Alternative Marine Fuels. Renew. Sustain. Energy Rev. 2023, 182, 113367. [Google Scholar] [CrossRef] [Scilit]
- Maity, S.; Mallick, N. Trends and Advances in Sustainable Bioethanol Production by Marine Microalgae: A Critical Review. J. Clean. Prod. 2022, 345, 131153. [Google Scholar] [CrossRef] [Scilit]
- Hossein Arabnejad, M.; Thies, F.; Yao, H.-D.; Ringsberg, J.W. Life Cycle Assessment Method for Ship Fuels Using a Ship Performance Prediction Model and Actual Operation Conditions—Case Study of Wind-Assisted Cargo Ship. Energies 2025, 18, 4559. [Google Scholar] [CrossRef] [Scilit]
- Edwards, R.; Hass, H.; Larive, J.-F.; Lonza, L.; Maas, H.; Rickeard, D. Well-to-Wheels Report Version 4.a: JEC Well-to-Wheels Analysis; Publications Office of the European Union: Luxembourg, 2014. [Google Scholar]
- Jang, H.; Mujeeb-Ahmed, M.P.; Wang, H.; Park, C.; Hwang, I.; Jeong, B.; Zhou, P.; Mickeviciene, R. Regulatory Gap Analysis for Risk Assessment of Ammonia-Fuelled Ships. Ocean Eng. 2023, 287, 115751. [Google Scholar] [CrossRef] [Scilit]
- Duong, P.A.; Ryu, B.R.; Song, M.K.; Nguyen, H.V.; Nam, D.; Kang, H. Safety Assessment of the Ammonia Bunkering Process in the Maritime Sector: A Review. Energies 2023, 16, 4019. [Google Scholar] [CrossRef] [Scilit]
- Bedekar, K.; Oterkus, E.; Oterkus, S. Ammonia Bunkering—Infrastructure, Finance, Insurance and Regulatory Issues: A Review. Sustain. Mar. Struct. 2025, 7, 104–131. [Google Scholar] [CrossRef] [Scilit]
- Bayraktar, M.; Sokukcu, M.; Pamik, M.; Yuksel, O. Evaluating Ammonia as a Marine Fuel: Review and Illustration. Environ. Model. Assess. 2025, 30, 779–803. [Google Scholar] [CrossRef] [Scilit]
- Fan, H.; Enshaei, H.; Jayasinghe, S.G.; Tan, S.H.; Zhang, C. Quantitative Risk Assessment for Ammonia Ship-to-ship Bunkering Based on Bayesian Network. Process Saf. Prog. 2022, 41, 395–410. [Google Scholar] [CrossRef] [Scilit]
- Yuksel, O.; Blanco-Davis, E.; Hitchmough, D.; Shagar, G.V.; Spiteri, A.; Di Piazza, M.C.; Pucci, M.; Tsoulakos, N.; Armin, M.; Wang, J. Integrated Approach to Ship Electrification Using Fuel Cells and an Ammonia Decomposition System. J. Mar. Sci. Eng. 2025, 13, 977. [Google Scholar] [CrossRef] [Scilit]
- Yuksel, O.; Blanco-Davis, E.; Spiteri, A.; Hitchmough, D.; Shagar, V.; Di Piazza, M.C.; Pucci, M.; Tsoulakos, N.; Armin, M.; Wang, J. Optimising the Design of a Hybrid Fuel Cell/Battery and Waste Heat Recovery System for Retrofitting Ship Power Generation. Energies 2025, 18, 288. [Google Scholar] [CrossRef] [Scilit]
- International Maritime Organization (IMO) 2024. Guidelines on Life Cycle GHG Intensity of Marine Fuels (2024 LCA Guidelines); International Maritime Organization: London, UK, 2024. [Google Scholar]
- European Parliament and Council of the European Union Regulation (EU) 2023/1805 of the European Parliament and of the Council of 13 September 2023 on the Use of Renewable and Low-Carbon Fuels in Maritime Transport, and Amending Directive 2009/16/EC. Available online: https://eur-lex.europa.eu/eli/reg/2023/1805/oj/eng (accessed on 20 June 2026).
- Adjei, M.; Van Leeuwen, J.; Pereira, H. Towards Decarbonising Shipping: Governance Challenges and Barriers to the Implementation of EU Emission Trading System (ETS). Marit. Stud. 2026, 25, 23. [Google Scholar] [CrossRef] [Scilit]
- Repo, J.; Alkio, J.; Juoperi, K.; Portin, K.; Wideskog, M.; Asplund, T. Ethanol: A viable alternative fuel option. In Proceedings of the 31st CIMAC World Congress, Zurich, Switzerland, 19–23 May 2025; Available online: https://papers2025.cimaccongress.com/pdf/CIMAC_paper_080.pdf (accessed on 2 October 2026).
- Chatterton, C. Ethanol & Methanol as Maritime Fuels—Technical Viability, Market Dynamics, and Regulatory Considerations; GCGF: Singapore, 2026. [Google Scholar]
- American Bureau of Shipping Search ABS Record. Available online: https://absrecord.eagle.org/#/absrecord/search (accessed on 1 April 2026).
- Everellence CEAS Engine Calculations. Available online: https://www.everllence.com/marine/products/planning-tools-and-downloads/ceas-engine-calculations (accessed on 25 February 2026).
- Jamrozik, A.; Tutak, W.; Gnatowska, R.; Nowak, Ł. Comparative Analysis of the Combustion Stability of Diesel-Methanol and Diesel-Ethanol in a Dual Fuel Engine. Energies 2019, 12, 971. [Google Scholar] [CrossRef] [Scilit]
- Örs, İ.; Sayin, B.; Ciniviz, M. A Comparative Study of Ethanol and Methanol Addition Effects on Engine Performance, Combustion and Emissions in the SI Engine. Int. J. Automot. Sci. Technol. 2020, 4, 59–69. [Google Scholar] [CrossRef] [Scilit]
- Silva, C.J.d; Vale, A.T.d. Energy Density Model for Forest Species from Cerrado. Rev. Caatinga 2018, 31, 396–404. [Google Scholar] [CrossRef] [Scilit]
- Noord Marine Service Volumetric Energy Density of Alternative Marine Fuels. Available online: https://marine-service-noord.com/en/products/alternative-fuels-and-technologies/volumetric-energy-density/ (accessed on 17 July 2026).
- Kuzu, S.L.; Bilgili, L.; Kiliç, A. Estimation and Dispersion Analysis of Shipping Emissions in Bandirma Port, Turkey. Environ. Dev. Sustain. 2021, 23, 10288–10308. [Google Scholar] [CrossRef] [Scilit]
- Yuksel, O.; Koseoglu, B. Numerical Simulation of the Hybrid Ship Power Distribution System and an Analysis of Its Emission Reduction Potential. Ships Offshore Struct. 2023, 18, 78–94. [Google Scholar] [CrossRef] [Scilit]
- Fuel, E.U. Directive (EU) 2018/2001 of the European Parliament and of the Council of 11 December 2018 on the Promotion of the Use of Energy from Renewable Sources (Recast) (Text with EEA Relevance); European Union: Brussels, Belgium, 2024. [Google Scholar]
- Fuel EU. Proposal for a Regulation of the European Parliament and of the Council on the Use of Renewable and Low-Carbon Fuels in Maritime Transport and Amending Directive 2009/16/EC; European Union: Brussels, Belgium, 2021. [Google Scholar]
- Gilbert, P.; Walsh, C.; Traut, M.; Kesieme, U.; Pazouki, K.; Murphy, A. Assessment of Full Life-Cycle Air Emissions of Alternative Shipping Fuels. J. Clean. Prod. 2018, 172, 855–866. [Google Scholar] [CrossRef] [Scilit]
- Masson-Delmotte, V.; Zhai, P.; Pirani, A.; Connors, S.L.; Péan, C.; Berger, S.; Caud, N.; Chen, Y.; Goldfarb, L.; Gomis, M.I.; et al. (Eds.) IPCC Annex IX: Contributors to the IPCC Working Group I Sixth Assessment Report. In Climate Change 2021: The Physical Science Basis. Contribution of Working Group I to the Sixth Assessment Report of the Intergovernmental Panel on Climate Change; Cambridge University Press: Cambridge, UK; New York, NY, USA, 2021; pp. 2267–2286. [Google Scholar]
- Yuksel, O.; Goksu, B. Effects of Transportation of Electric Vehicles by a RoPax Ship on Carbon Intensity and Energy Efficiency. Sustain. Energy Technol. Assess. 2025, 75, 104238. [Google Scholar] [CrossRef] [Scilit]
- Kock, F.; Kjelsaas, C.; Adams, S. EEXI and CII Calculations—DNV’s Way Forward; Det Norske Veritas (DNV): Høvik, Norwey, 2021. [Google Scholar]
- Bayraktar, M.; Yuksel, O. A Scenario-Based Assessment of the Energy Efficiency Existing Ship Index (EEXI) and Carbon Intensity Indicator (CII) Regulations. Ocean Eng. 2023, 278, 114295. [Google Scholar] [CrossRef] [Scilit]
- Díaz-Secades, L.A. Enhancement of Maritime Sector Decarbonization through the Integration of Fishing Vessels into IMO Energy Efficiency Measures. J. Mar. Sci. Eng. 2024, 12, 663. [Google Scholar] [CrossRef] [Scilit]
- Ersoy, A.E.; Çelebi, U.B.; Yuksel, O.; Bayraktar, M. Predictive Analysis of Engine Power Limitations for Fuel Reduction in a Tanker Ship Using a Rule-Based Machine Learning Technique. J. Clean. Prod. 2025, 507, 145535. [Google Scholar] [CrossRef] [Scilit]
- International Maritime Organization. 2021 Guidelines on Operational Carbon Intensity Indicators and the Calculation Methods (CII Guidelines, G1). Available online: https://wwwcdn.imo.org/localresources/en/KnowledgeCentre/IndexofIMOResolutions/MEPCDocuments/MEPC.336(76).pdf (accessed on 2 October 2026).
- International Maritime Organization. Amendments to the 2021 Guidelines on the Operational Carbon Intensity Reduction Factors Relative to Reference Lines (CII Reduction Factors Guidelines, G3). MEPC.400(83). Available online: https://wwwcdn.imo.org/localresources/en/KnowledgeCentre/IndexofIMOResolutions/MEPCDocuments/MEPC.400(83).pdf (accessed on 2 October 2026).
- International Maritime Organization. 2022 Guidelines on the Operational Carbon Intensity Rating of Ships (CII Rating Guidelines, G4). MEPC.354(78). Available online: https://wwwcdn.imo.org/localresources/en/KnowledgeCentre/IndexofIMOResolutions/MEPCDocuments/MEPC.354(78).pdf (accessed on 2 October 2026).
- Kang, H.J. The Maritime Net Zero Framework Matters Far beyond Shipping. Commun. Earth Environ. 2026, 7, 264. [Google Scholar] [CrossRef] [Scilit]
- Calvin, K.; Dasgupta, D.; Krinner, G.; Mukherji, A.; Thorne, P.W.; Trisos, C.; Romero, J.; Aldunce, P.; Barrett, K.; Blanco, G.; et al. IPCC, 2023: Climate Change 2023: Synthesis Report. Contribution of Working Groups I, II and III to the Sixth Assessment Report of the Intergovernmental Panel on Climate Change [Core Writing Team, H. Lee and J. Romero (Eds.)]; Arias, P., Bustamante, M., Elgizouli, I., Flato, G., Howden, M., Méndez-Vallejo, C., Pereira, J.J., Pichs-Madruga, R., Rose, S.K., Saheb, Y., et al., Eds.; IPCC: Geneva, Switzerland, 2023. [Google Scholar]
- Carvalho, F.; O’Malley, J.; Osipova, L.; Pavlenko, N. Key Issues in LCA Methodology for Marine Fuels; International Council on Clean Transportation: Washington, DC, USA, 2023. [Google Scholar]
- European Parliament and of the Council of the European Union. Directive (EU) 2023/2413 of the European Parliament and of the Council of 18 October 2023 Amending Directive (EU) 2018/2001, Regulation (EU) 2018/1999 and Directive 98/70/EC as Regards the Promotion of Energy from Renewable Sources, and Repealing Council Directive (EU) 2015/652; European Union: Brussels, Belgium, 2023. [Google Scholar]
- Global Maritime Forum IMO’s Reward Mechanism to Drive the Energy Transition. Available online: https://globalmaritimeforum.org/insight/imos-reward-mechanism-to-drive-the-energy-transition/ (accessed on 16 June 2026).
- Draft Revised MARPOL Annex VI 2025; International Maritime Organization (IMO): London, UK, 2025.
- ClassNK. What Is the IMO’s Mid-Term Measures and How It Works; NIPPON KAIJI KYOKAI Green Certification Department: Tokyo, Japan, 2025. [Google Scholar]
- DNV. IMO MEPC 83: GHG Requirements Approved, Taking Effect from 2028. Available online: https://www.dnv.com/news/2025/imo-mepc-83-ghg-requirements-approved-taking-effect-from-2028/ (accessed on 8 April 2026).
- The Liberian Registry. IMO MEPC 83 Meeting Summary; Liberian International Ship & Corporate Registry: Dulles, VA, USA, 2025. [Google Scholar]
- Ship and Bunker Global Average Bunker Price Bunker Prices—Ship & Bunker. Available online: https://shipandbunker.com/prices/av/region/av-eme-emea-average (accessed on 23 May 2026).
- The Maritime and Port Authority of Singapore Rotterdam and Singapore Strengthen Collaboration on Green and Digital Shipping Corridor|Maritime and Port Authority of Singapore. Available online: https://www.mpa.gov.sg/media-centre/details/rotterdam-and-singapore-strengthen-collaboration-on-green-and-digital-shipping-corridor (accessed on 21 June 2026).
- Cavalcanti, E.J.C.; da Silva, D.R.S.; Mota, F.A.S.; Lima, A.A.S.; Carvalho, M.; Palacios-Bereche, R. Integrated Exergy, Exergoeconomic, and Exergoenvironmental Evaluations of Ethanol Production Using a Sugarcane Bagasse Cogeneration System. Int. J. Energy Res. 2026, 2026, 4193901. [Google Scholar] [CrossRef] [Scilit]
- Manochio, C.; Andrade, B.R.; Rodriguez, R.P.; Moraes, B.S. Ethanol from Biomass: A Comparative Overview. Renew. Sustain. Energy Rev. 2017, 80, 743–755. [Google Scholar] [CrossRef] [Scilit]
- Quinn, J.C.; Davis, R. The Potentials and Challenges of Algae Based Biofuels: A Review of the Techno-Economic, Life Cycle, and Resource Assessment Modeling. Bioresour. Technol. 2015, 184, 444–452. [Google Scholar] [CrossRef] [Scilit] [PubMed]
- SustainableShips. Emission Properties for EU ETS, FuelEU and IMO Net-Zero. Available online: https://www.sustainable-ships.org/stories/2025/fuel-emissions-properties (accessed on 2 October 2026).
- Nowak, Ł.; Tutak, W. Combustion Stability of Dual Fuel Engine Powered by Diesel-Ethanol Fuels. Combust. Engines 2019, 178, 155–161. [Google Scholar] [CrossRef] [Scilit]
- Eimontas, J.; Striūgas, N.; Zakarauskas, K.; Kiminaitė, I. Catalytical Thermal Conversion of Waste Fishing Nets for a Higher Added Value Energy Products Generation and Caprolactam Recovery. Fuel 2023, 334, 126735. [Google Scholar] [CrossRef] [Scilit]
- Roux, M.; Lodato, C.; Laurent, A.; Astrup, T.F. A Review of Life Cycle Assessment Studies of Maritime Fuels: Critical Insights, Gaps, and Recommendations. Sustain. Prod. Consum. 2024, 50, 69–86. [Google Scholar] [CrossRef] [Scilit]
- Balcombe, P.; Heggo, D.A.; Harrison, M. Total Methane and CO2 Emissions from Liquefied Natural Gas Carrier Ships: The First Primary Measurements. Environ. Sci. Technol. 2022, 56, 9632–9640. [Google Scholar] [CrossRef] [Scilit] [PubMed]
- Lehtoranta, K.; Kuittinen, N.; Vesala, H.; Koponen, P. Methane Emissions from a State-of-the-Art LNG-Powered Vessel. Atmosphere 2023, 14, 825. [Google Scholar] [CrossRef] [Scilit]
- Masum, F.H.; Tan, E.C.D.; Kolodziej, C.P.; Hawkins, T.R. Life Cycle Assessment of Methanol from Fossil, Biomass, and Waste Sources, and Its Use as a Marine Fuel in Dual-Fuel Engines. Environ. Sci. Technol. 2025, 59, 23239–23250. [Google Scholar] [CrossRef] [Scilit] [PubMed]
- Zamboni, G.; Scamardella, F.; Gualeni, P.; Canepa, E. Comparative Analysis among Different Alternative Fuels for Ship Propulsion in a Well-to-Wake Perspective. Heliyon 2024, 10, e26016. [Google Scholar] [CrossRef] [Scilit] [PubMed]
- Seithe, G.J.; Bonou, A.; Giannopoulos, D.; Georgopoulou, C.A.; Founti, M. Maritime Transport in a Life Cycle Perspective: How Fuels, Vessel Types, and Operational Profiles Influence Energy Demand and Greenhouse Gas Emissions. Energies 2020, 13, 2739. [Google Scholar] [CrossRef] [Scilit]
- Lindstad, E.; Rialland, A. LNG and Cruise Ships, an Easy Way to Fulfil Regulations—Versus the Need for Reducing GHG Emissions. Sustainability 2020, 12, 2080. [Google Scholar] [CrossRef] [Scilit]
- Lindstad, E.; Eskeland, G.S.; Rialland, A.; Valland, A. Decarbonizing Maritime Transport: The Importance of Engine Technology and Regulations for LNG to Serve as a Transition Fuel. Sustainability 2020, 12, 8793. [Google Scholar] [CrossRef] [Scilit]
- Ejder, E.; Dinçer, S.; Arslanoglu, Y. Decarbonization Strategies in the Maritime Industry: An Analysis of Dual-Fuel Engine Performance and the Carbon Intensity Indicator. Renew. Sustain. Energy Rev. 2024, 200, 114587. [Google Scholar] [CrossRef] [Scilit]
- Sharafian, A.; Blomerus, P.; Mérida, W. Natural Gas as a Ship Fuel: Assessment of Greenhouse Gas and Air Pollutant Reduction Potential. Energy Policy 2019, 131, 332–346. [Google Scholar] [CrossRef] [Scilit]
- Grönholm, T.; Mäkelä, T.; Hatakka, J.; Jalkanen, J.-P.; Kuula, J.; Laurila, T.; Laakso, L.; Kukkonen, J. Evaluation of Methane Emissions Originating from LNG Ships Based on the Measurements at a Remote Marine Station. Environ. Sci. Technol. 2021, 55, 13677–13686. [Google Scholar] [CrossRef] [Scilit] [PubMed]
- Spoof-Tuomi, K.; Niemi, S. Environmental and Economic Evaluation of Fuel Choices for Short Sea Shipping. Clean Technol. 2020, 2, 34–52. [Google Scholar] [CrossRef] [Scilit]
- Jang, H.; Jeong, B.; Zhou, P.; Ha, S.; Nam, D. Demystifying the Lifecycle Environmental Benefits and Harms of LNG as Marine Fuel. Appl. Energy 2021, 292, 116869. [Google Scholar] [CrossRef] [Scilit]
- Al-Douri, A.; Alsuhaibani, A.S.; Moore, M.; Nielsen, R.B.; El-Baz, A.A.; El-Halwagi, M.M. Greenhouse Gases Emissions in Liquified Natural Gas as a Marine Fuel: Life Cycle Analysis and Reduction Potential. Can. J. Chem. Eng. 2022, 100, 1178–1186. [Google Scholar] [CrossRef] [Scilit]
- Arabnejad, M.H.; Thies, F.; Yao, H.-D.; Ringsberg, J.W. Zero-Emission Propulsion System Featuring, Flettner Rotors, Batteries and Fuel Cells, for a Merchant Ship. Ocean Eng. 2024, 310, 118618. [Google Scholar] [CrossRef] [Scilit]
- Zang, G.; Sun, P.; Elgowainy, A.; Wang, M. Technoeconomic and Life Cycle Analysis of Synthetic Methanol Production from Hydrogen and Industrial Byproduct CO2. Environ. Sci. Technol. 2021, 55, 5248–5257. [Google Scholar] [CrossRef] [Scilit] [PubMed]
- Reijnders, L. Microalgal and Terrestrial Transport Biofuels to Displace Fossil Fuels. Energies 2009, 2, 48–56. [Google Scholar] [CrossRef] [Scilit]
- Joshikumar, N.; Noor, A.; Pant, K.K.; Botha, F.; Henry, R.J. Economic Assessment and Life Cycle Analysis of Sugarcane Bagasse Valorization to Bioethanol via One-pot Deep Eutectic Solvent Pretreatment. Biofuels Bioprod. Biorefining 2026, 20, 1475–1491. [Google Scholar] [CrossRef] [Scilit]
- Dees, J.; Oke, K.; Goldstein, H.; McCoy, S.T.; Sanchez, D.L.; Simon, A.J.; Li, W. Cost and Life Cycle Emissions of Ethanol Produced with an Oxyfuel Boiler and Carbon Capture and Storage. Environ. Sci. Technol. 2023, 57, 5391–5403. [Google Scholar] [CrossRef] [Scilit] [PubMed]
- Soleymani, M.; Rosentrater, K. Techno-Economic Analysis of Biofuel Production from Macroalgae (Seaweed). Bioengineering 2017, 4, 92. [Google Scholar] [CrossRef] [Scilit] [PubMed]
- Müller, C.; Scapini, T.; Rempel, A.; Abaide, E.R.; Camargo, A.F.; Nazari, M.T.; Tadioto, V.; Bonatto, C.; Tres, M.V.; Zabot, G.L.; et al. Challenges and Opportunities for Third-Generation Ethanol Production: A Critical Review. Eng. Microbiol. 2023, 3, 100056. [Google Scholar] [CrossRef] [Scilit] [PubMed]
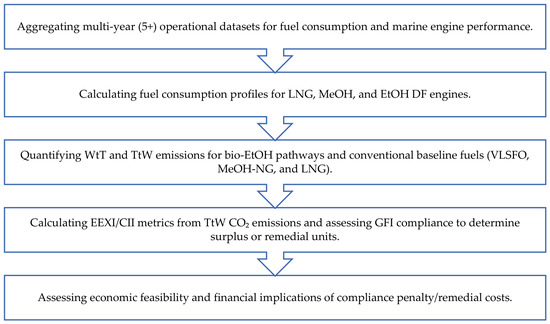
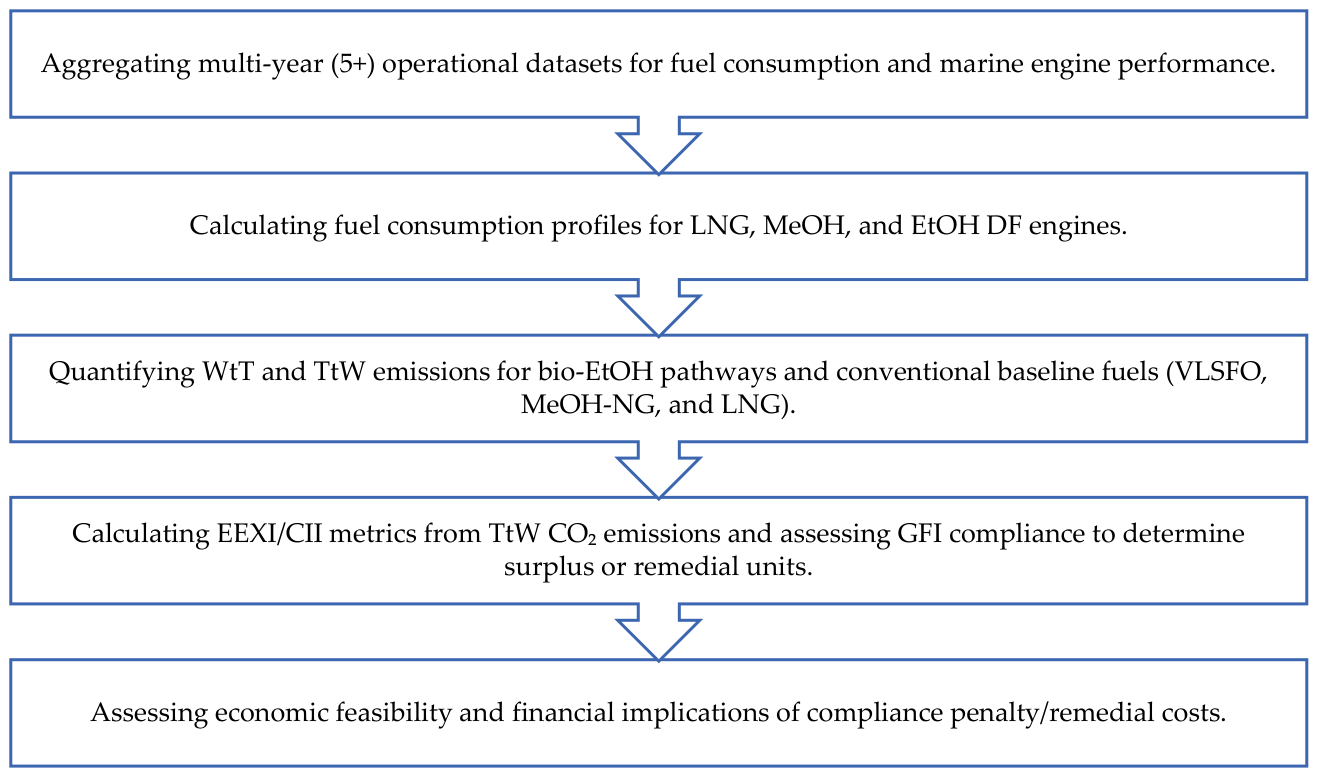
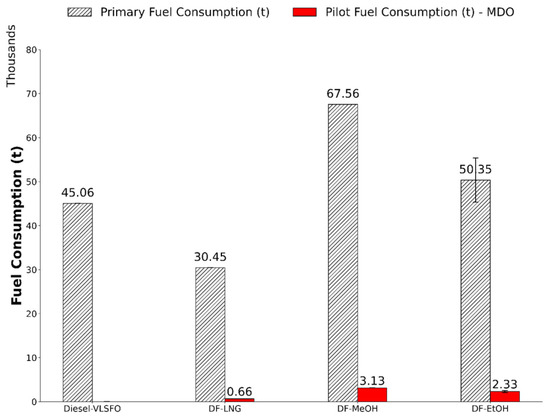
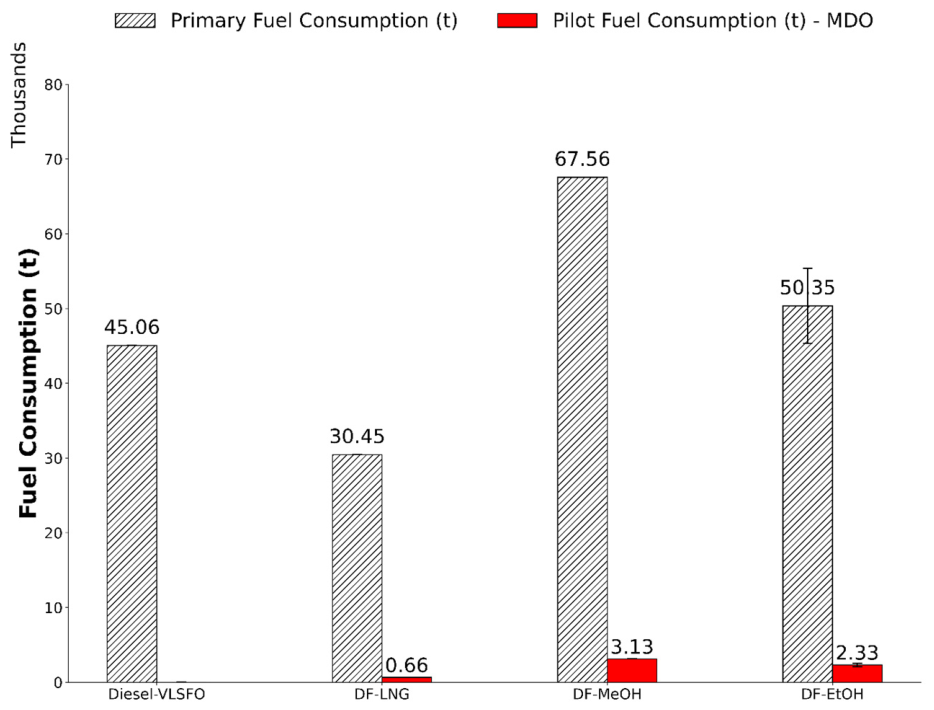
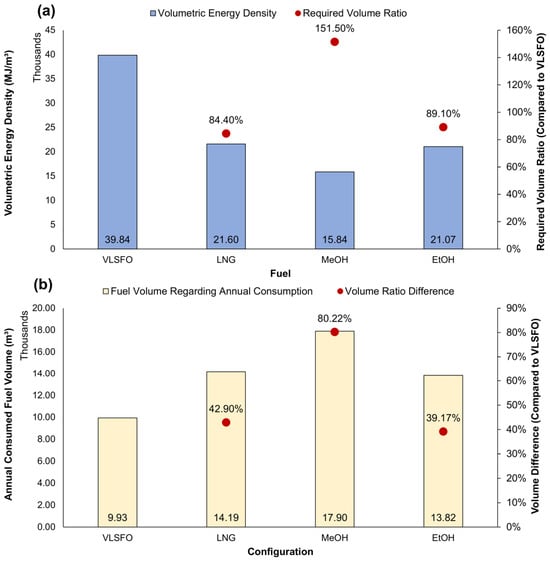
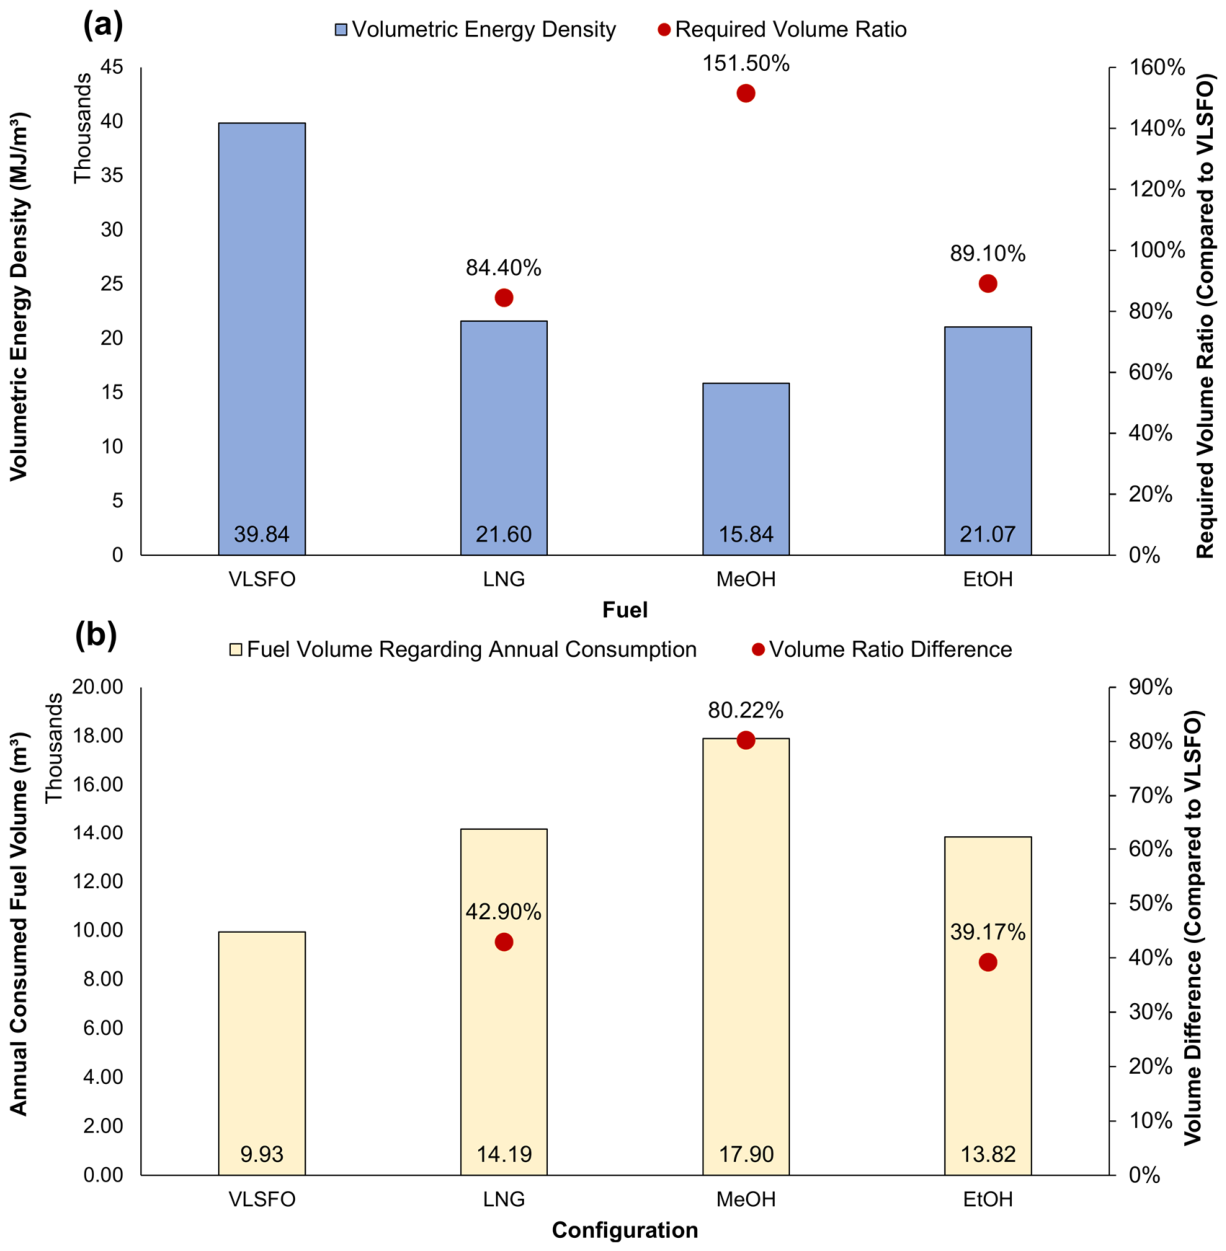
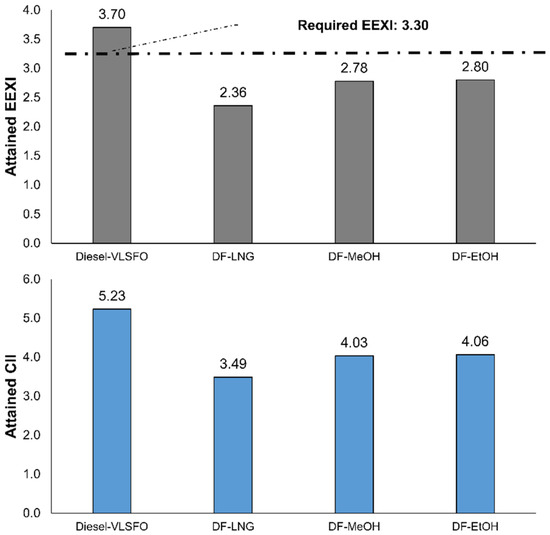
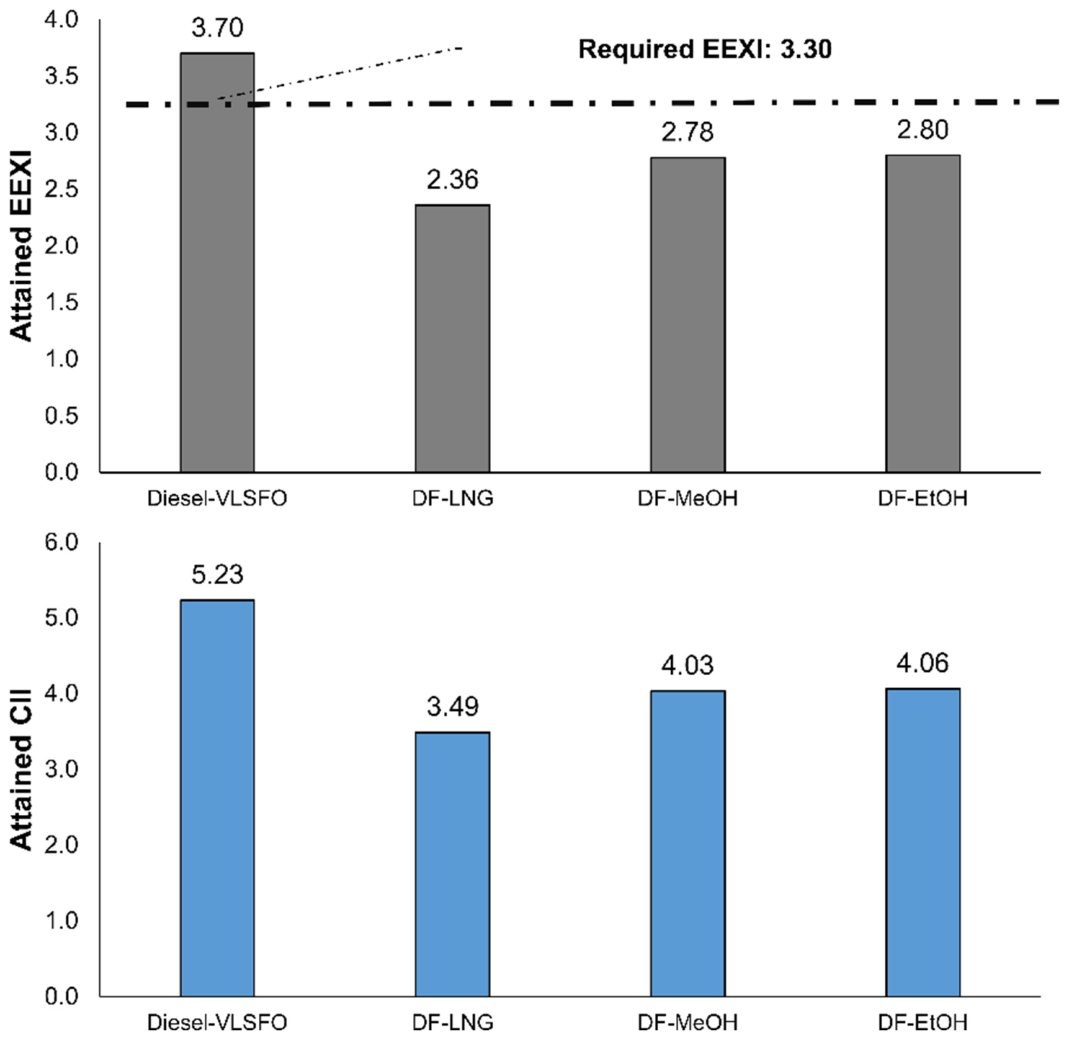
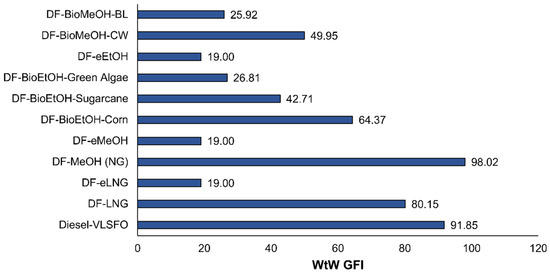
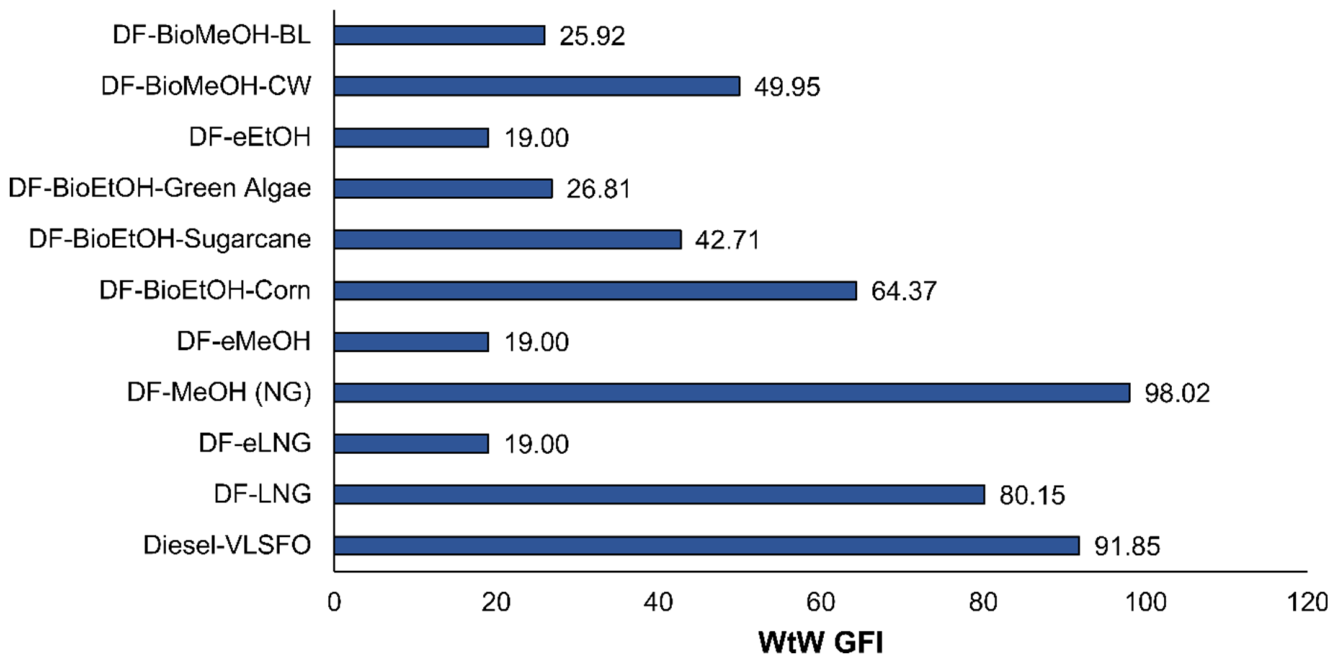
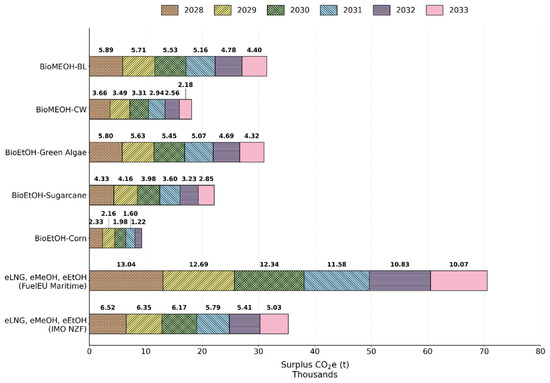
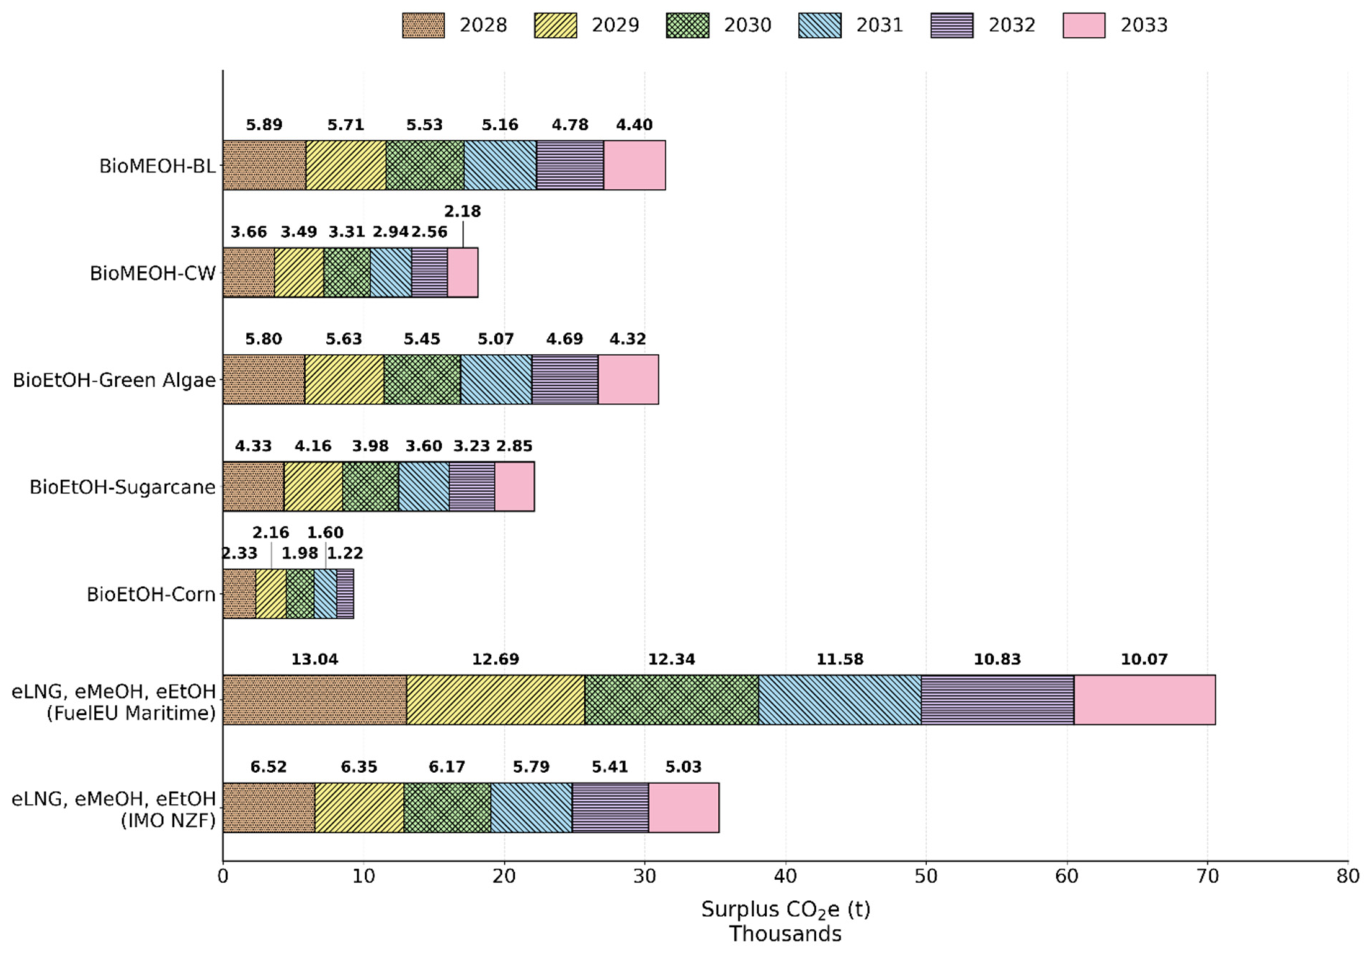
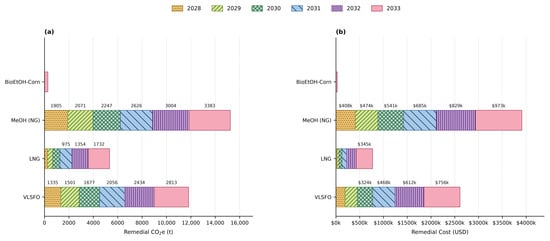
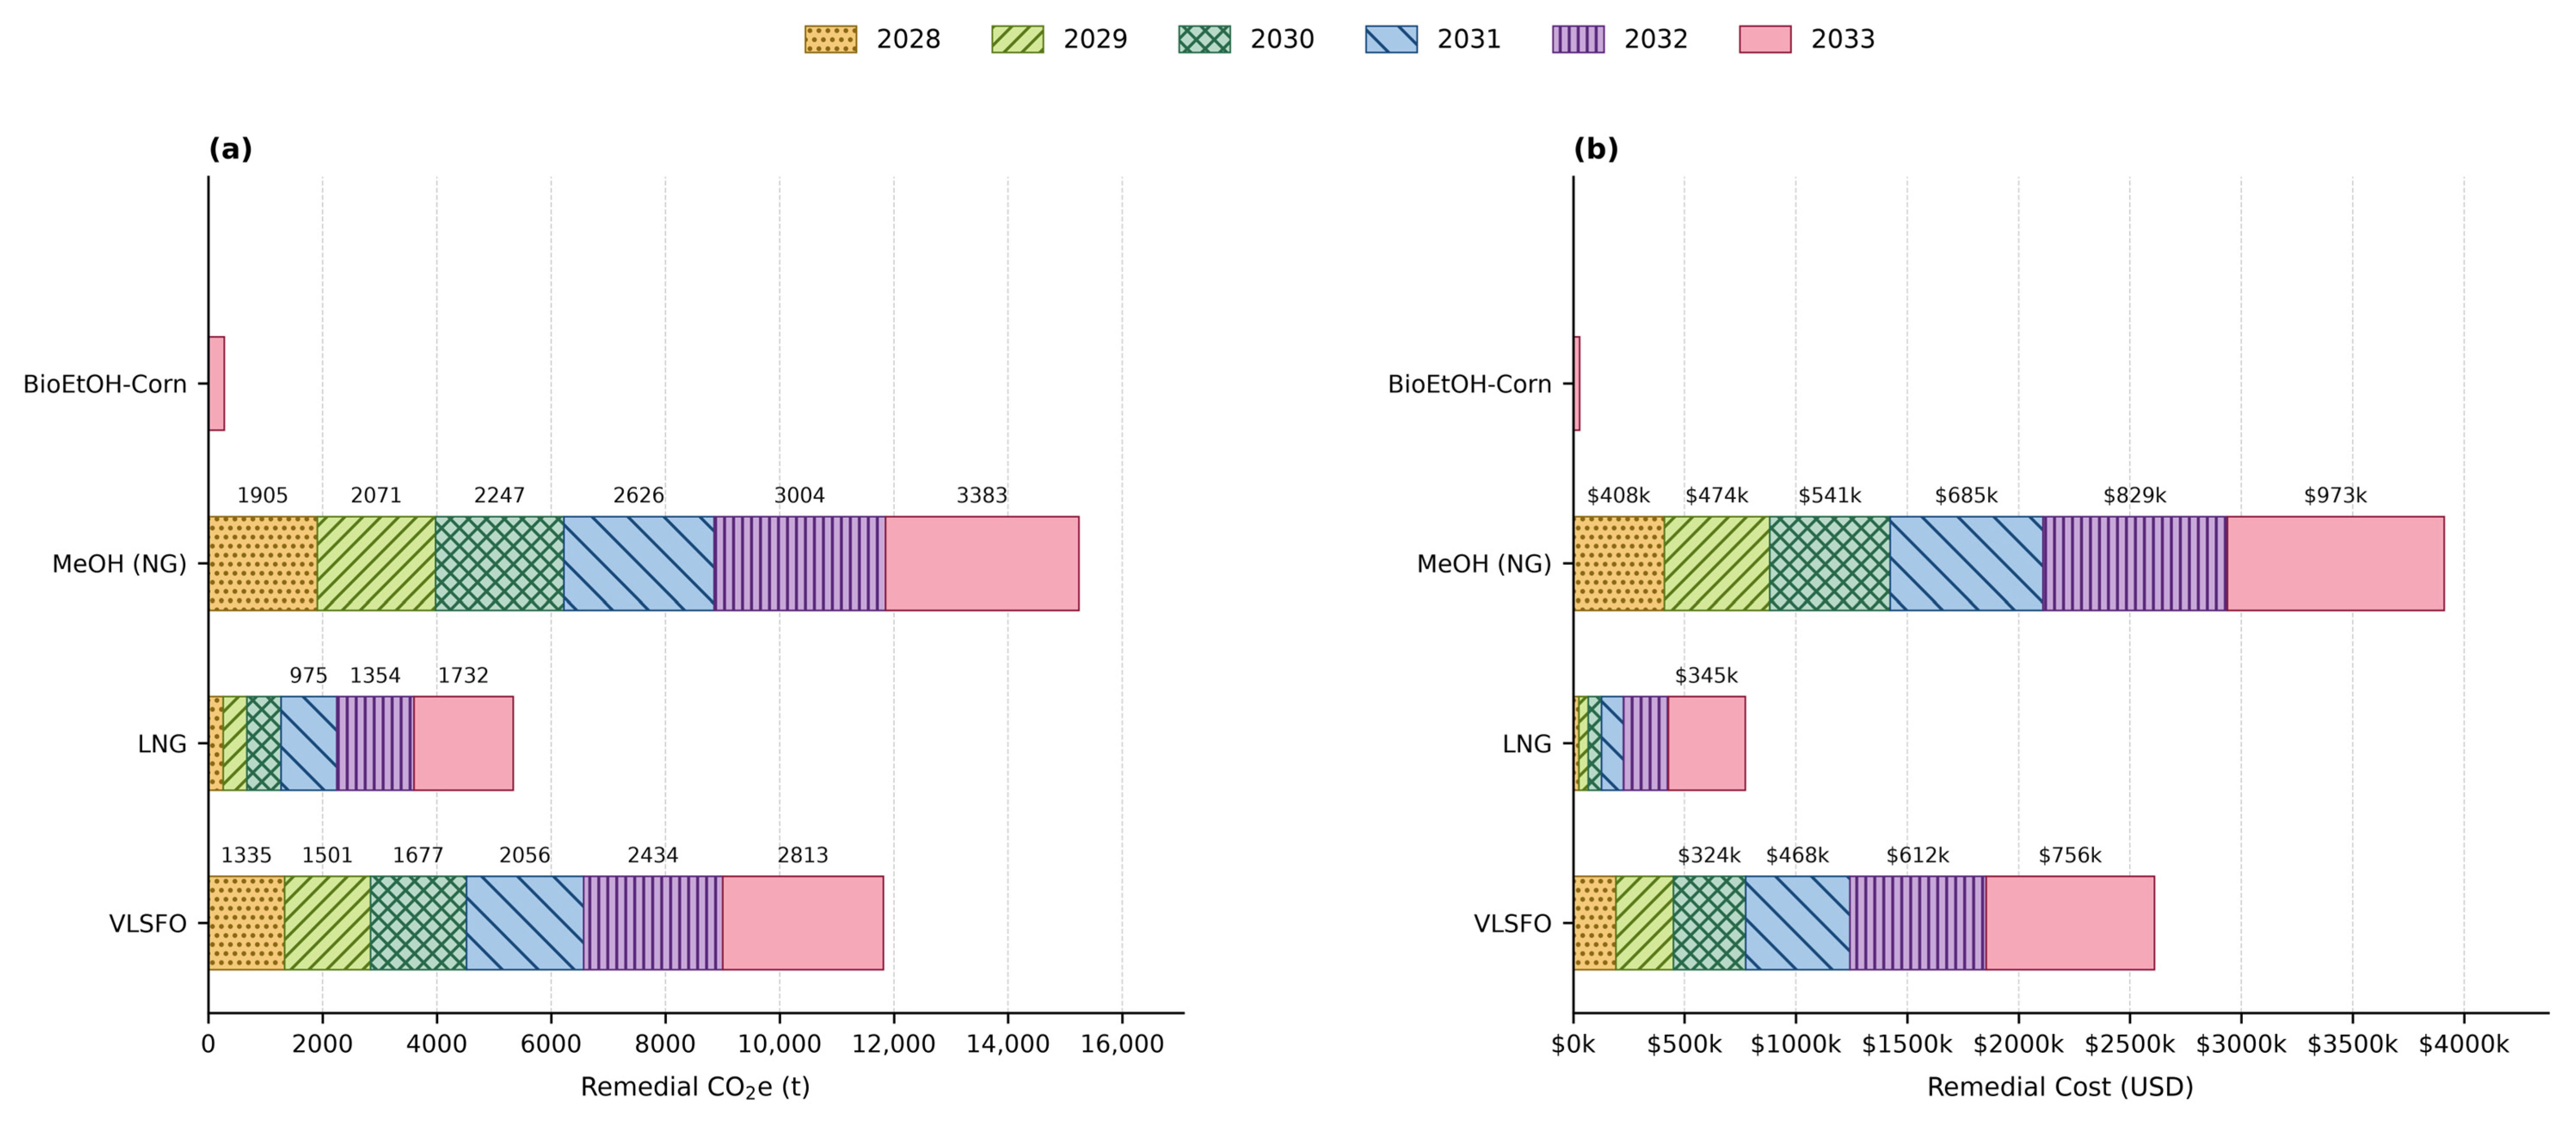
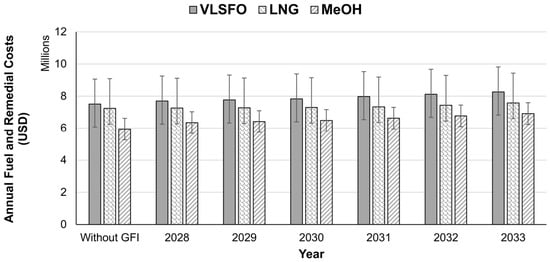
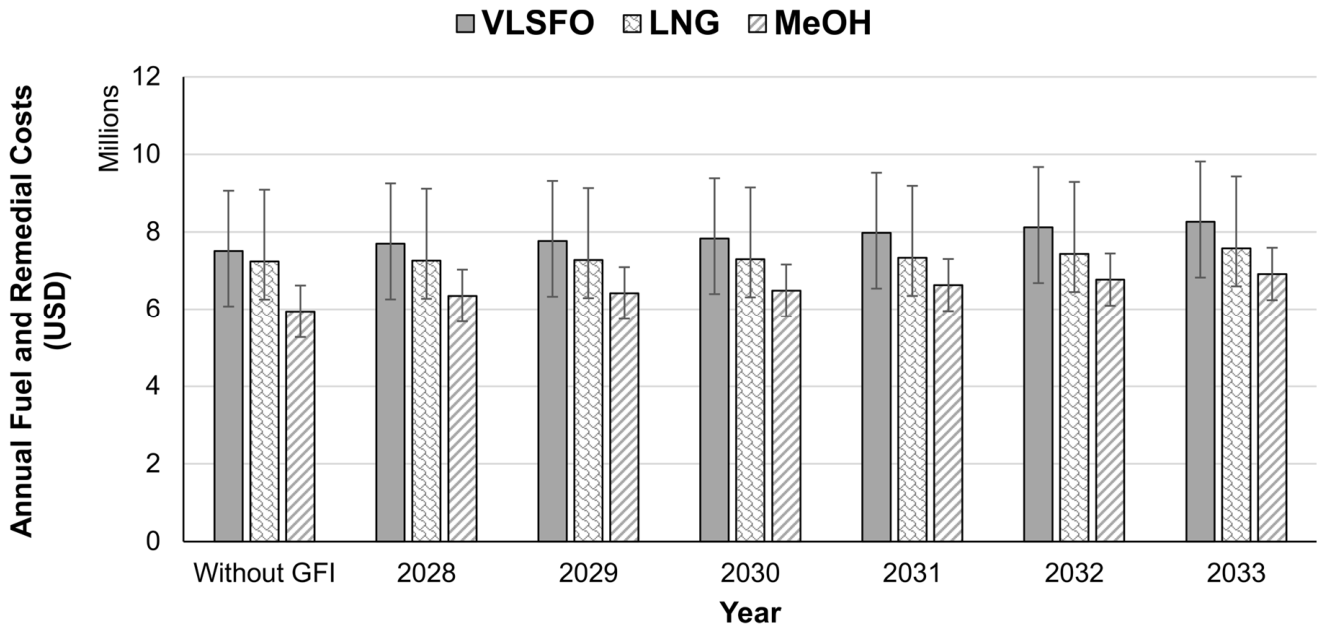
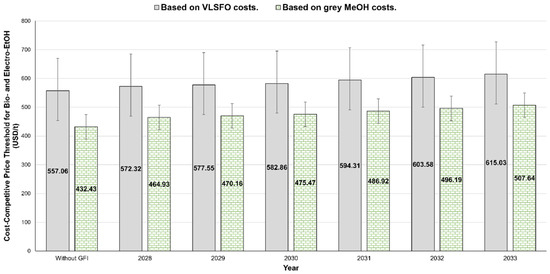

Disclaimer/Publisher’s Note: The statements, opinions and data contained in all publications are solely those of the individual author(s) and contributor(s) and not of MDPI and/or the editor(s). MDPI and/or the editor(s) disclaim responsibility for any injury to people or property resulting from any ideas, methods, instructions or products referred to in the content. |
© 2026 by the authors. Licensee MDPI, Basel, Switzerland. This article is an open access article distributed under the terms and conditions of the Creative Commons Attribution (CC BY) license.