


Abstract
Maritime Autonomous Surface Ships (MASSs) require a safety regime that expresses the state of a vessel continuously rather than monitoring each hazard in isolation. No such measure is currently in operational use, and the reason is not that the wrong way of combining hazards has been chosen: a continuous, multi-domain measurement of the ship’s state has not been available. This paper proposes High-Frequency Composite Safety Index (HF-CSI) computed from operational data already generated onboard. Weather, collision, machinery health, and grounding risk are normalized onto a common 0–10 scale using externally referenced thresholds so that a given value carries the same meaning across voyages and vessels, and they are combined through a non-compensatory weighted-maximum rule that prevents a critical hazard in one domain from being masked by favorable conditions elsewhere. The domain responsible for the value is reported alongside it, meaning any degradation is immediately attributable to a specific domain. Machinery health assessment uses operating-mode-conditional baselines, derived from the engine telegraph signal, to eliminate false anomalies from normal propulsion-mode changes. The framework was evaluated using full-scale data from a large ocean-going container ship in commercial service over a 6.5-day voyage (1858 samples, 5 min resolution). The voyage-mean HF-CSI was 8.01 (SD 3.15), with 68.2% Normal-grade samples, consistent with an incident-free voyage. The dominant risk shifted by sea area—weather in the Bay of Biscay, grounding in the North Sea, machinery health in the English Channel—with no single domain explaining more than 65% of risk-bearing samples. Against compensatory averaging, non-compensatory fusion avoided underestimating hazards, correctly flagging a heavy-weather segment that averaging rated Normal. Sensitivity analysis across 10 conditions kept HF-CSI within 7.58–8.44. Synthetic head-on encounters generated on the recorded track confirmed that the collision component separates decisive, minimal, and absent avoidance behavior, including a case that satisfied COLREG Rule 14 yet produced a risk comparable to non-compliance.
1. Introduction
Maritime transport carries more than 80% of global trade by volume [1,2], and its safety has traditionally been governed by an extensive framework of international regulations. The International Convention for the Safety of Life at Sea (SOLAS) specifies physical and functional requirements for ship structure, stability, fire protection, life-saving appliances, navigation, and communication systems. In parallel, the International Safety Management (ISM) Code, made mandatory under SOLAS Chapter IX, requires shipping companies to establish a Safety Management System covering maintenance, crew competence, emergency preparedness, operating procedures, and organizational responsibility [3]. This conventional regime is fundamentally condition- and compliance-oriented: it verifies whether the ship and its equipment satisfy prescribed requirements and whether qualified personnel operate them in accordance with established procedures.
The emergence of Maritime Autonomous Surface Ships (MASSs) challenges this underlying premise. As navigational perception, risk interpretation, and decision-making progressively shift from the human master to autonomous and remotely supervised systems, the central safety question also changes. Conventional regulation primarily asks whether the ship, its equipment, and its crew are in an acceptable state. Autonomous operation must additionally determine whether the decision being produced by the system at a given instant is sufficiently safe. Confirming that radar, the Automatic Identification System (AIS) [4,5,6] propulsion, and steering equipment are functioning does not establish that an autonomous system has correctly interpreted the surrounding traffic, recognized an emerging hazard, selected an appropriate maneuver, or maintained an acceptable safety margin under simultaneous environmental, machinery, sensing, and communication degradation.
Safety assurance for MASSs must therefore extend beyond equipment integrity to the continuous assessment of operational judgment. This requires evaluating when the system identifies a situation as hazardous, why one maneuver is selected over another, how uncertainty affects the decision, and when autonomous control should be restricted, suspended, or transferred to a human operator. The resulting problem is dynamic rather than static: it concerns the real-time quality of autonomous operation rather than only the certified condition of the vessel [7,8,9].
The ability to quantify this operational safety state is relevant not only to accident prevention but also to operating efficiency. Underestimation of risk may lead to unsafe maneuvers or accidents, whereas excessive conservatism may produce unnecessary speed reduction, route deviation, interruption, or human intervention. Such responses can increase fuel consumption, voyage duration, off-hire time, and operational cost. A practical MASS safety framework must therefore provide a continuous and interpretable measure that distinguishes acceptable operation from both unsafe and unnecessarily conservative behavior.
International regulation has begun to respond to this transition. In May 2026, the International Maritime Organization adopted the non-mandatory MASS Code through Resolution MSC.595(111), with effect from 1 July 2026 [10]. The Code introduces a goal-based framework covering risk assessment, connectivity, remote operation, human factors, emergency response, and the responsibilities of relevant stakeholders [11,12]. It is particularly significant because it addresses operating configurations in which onboard human presence may be reduced or absent. The current non-mandatory Code is intended to support practical implementation and experience-building before the planned development of mandatory requirements under SOLAS [13].
The MASS Code nevertheless defines safety primarily at the level of objectives. It requires hazards to be identified and mitigated and expects autonomous ships to demonstrate a level of safety equivalent to that of existing merchant ships. However, it does not prescribe a common quantitative method for determining the instantaneous safety state of a vessel, deciding when autonomous operation should continue or be restricted, or combining heterogeneous operational risks into a unified measure. Regulation therefore establishes what must be achieved, while the real-time measurement of whether that objective is being achieved remains an open research problem.
1.1. Integrated Safety Assessment
Attempts to express maritime safety as a single figure are not new, but they have addressed different questions from the one considered here. Formal safety assessment, as adopted by the IMO, evaluates risk at the level of a ship type or a regulatory option, combining frequency and consequence estimates over a fleet or a design lifetime [14]. Port state control and vessel risk profiling rank ships by inspection history, age, flag, and deficiency records in order to allocate inspection effort [15]. Both are aggregate measures computed from historical or administrative data, and neither describes the state of a particular ship at a particular moment.
Closer to the present problem are studies that combine multiple hazards for autonomous ships. Chang et al. [16] assess the operational risks of MASSs across several categories; Cheng et al. [17] and Du et al. [18] combine causal factors for collision through fuzzy and multi-scale models. These studies establish which hazards matter and how they interact, but they operate on scenario or system-design timescales. Their inputs are failure probabilities, expert judgments, and structural relationships rather than measurements taken during a voyage, and their outputs inform design and regulation rather than operation.
Where several quantities are combined into one figure in operational settings, the aggregation is typically compensatory, whether by weighted sum, arithmetic mean, or weighted score. This is appropriate where the quantities represent contributions to a common objective, but not where they represent independent hazards, since a severe condition in one is then offset by favorable conditions in the others. The distinction between compensatory and non-compensatory aggregation is established in multi-criteria decision analysis [19], though it has seen limited application in maritime safety.
What has not been proposed is a measure that is computed continuously from onboard measurements, expresses the safety state of an individual ship at an individual instant, and combines heterogeneous hazards without allowing them to offset one another. Table 1 summarizes how the present work relates to the categories above.
Table 1.
Position of this work relative to existing approaches to maritime safety assessment.
1.2. Research Gap and Contributions
To address these limitations, this paper proposes High-Frequency Composite Safety Index (HF-CSI) and an associated integrated assessment framework for Maritime Autonomous Surface Ships (MASSs), which are ships capable of operating with varying degrees of independence from human interaction [11]. HF-CSI combines weather, collision, machinery health, and grounding risk into a single ship-level indicator. Each domain is normalized onto a common scale using externally defined operational or statistical criteria rather than the observed range of the evaluation dataset, preserving a consistent interpretation of the index across voyages and avoiding thresholds that shift with the statistical properties of a particular dataset. The proposed fusion is non-compensatory. Instead of averaging heterogeneous domain risks, HF-CSI is determined by the largest weighted risk contribution, so a critical condition in one domain cannot be concealed by favorable conditions in the others. The framework also identifies the dominant risk domain responsible for the composite value, retaining interpretability and supporting operational decision-making.
The proposed framework is evaluated using full-scale operational data collected at 5 min intervals during a 6.5-day voyage of a large ocean-going container ship. Although the present dataset is not yet sampled at the one-second rate ultimately envisioned for high-frequency autonomous monitoring, it provides real measurements from multiple operational domains and enables the proposed integration, normalization, and dominant-risk fusion strategy to be assessed under full-scale voyage conditions.
HF-CSI provides an overview of the assessed ship-level safety state, while the domain-specific sub-indices retain information on the underlying risks using a common risk scale. The composite index and domain-specific values are calculated concurrently and presented together with the corresponding safety grade and governing risk domain. This combined representation is intended to support operators in recognizing changes in the overall safety state, identifying the risk domain requiring attention, and consulting the relevant domain-specific information when considering an appropriate response. The main contributions of this paper are summarized as follows:
- We show that a domain-integrated safety measure can be computed continuously from operational data already generated onboard, which is the condition that has so far prevented such a measure from existing.
- High-Frequency Composite Safety Index (HF-CSI), which integrates weather, collision, machinery health, and grounding risk into a single, continuously updated ship-level safety measure.
- A non-compensatory, weighted-maximum fusion strategy that prevents a critical risk in one domain from being offset by lower risks elsewhere, while reporting the dominant risk alongside the index.
- A domain-independent normalization scheme based on external operational, regulatory, and statistical thresholds rather than voyage-specific data ranges, preserving a consistent index meaning across datasets.
- A mode-conditional machinery baseline, using the engine telegraph signal as an operating-mode label, that reduces false anomalies caused by normal propulsion-mode transitions.
- An integrated framework spanning onboard data acquisition through composite-index generation, demonstrated using full-scale data from a large ocean-going container ship.
The remainder of this paper is organized as follows. Section 2 reviews related work on maritime safety assessment, domain-specific risk monitoring, the use of high-frequency onboard data, and integrated safety assessment. Section 3 presents the proposed HF-CSI framework, including the system model, domain-specific risk models, normalization scheme, non-compensatory risk fusion, and safety-grade classification. Section 4 describes the full-scale voyage dataset and presents the experimental results, including fusion-scheme comparison, sensitivity analysis, collision-risk case studies, operational applications, and remaining limitations. Section 5 concludes the paper and outlining directions for future research.
2. Related Work
This subsection reviews existing work in each of the four risk domains, then in the use of high-frequency onboard data, and finally in integrated safety assessment. The organization is by domain because that is how the field itself is organized: methods have developed separately, for different purposes and on different timescales.
Among the principal operational risk domains, collision-risk assessment has received the greatest attention. Imazu [20] introduced representative multi-ship encounter scenarios that subsequently became widely used for testing autonomous collision-avoidance systems. Later studies developed quantitative Collision Risk Indices (CRIs), commonly using the Distance at the Closest Point of Approach (DCPA), Time to the Closest Point of Approach (TCPA), relative motion, encounter type, and ship-domain concepts. Sawada et al. [21] and related studies used such measures to evaluate collision-avoidance algorithms under standardized scenarios. Classification societies, including DNV and ClassNK, have also proposed structured test scenarios covering head-on, crossing, overtaking, and multi-vessel encounters [21,22]. Consequently, scenario-based evaluation has become an established component of autonomous collision-avoidance validation.
Although these approaches provide repeatable benchmarks, their operational applicability remains limited. Many studies assume that target trajectories and motion states are continuously and accurately observed, whereas real shipboard observations may be delayed, intermittent, noisy, or incomplete. AIS messages may be irregular or unavailable, radar tracks may fluctuate, and target intentions cannot always be inferred from measured kinematics alone. Moreover, the International Regulations for Preventing Collisions at Sea (COLREGs) do not unambiguously allocate avoidance responsibility in all complex multi-ship situations [23]. Actual maneuvering decisions may depend on vessel maneuverability, traffic density, local practice, communication between ships, environmental conditions, and the expected intentions of other operators. A collision-risk value derived from an idealized encounter therefore does not necessarily represent the operational safety state of a vessel under real-world uncertainty.
The limitations are greater in other risk domains because most existing methods were developed for planning, diagnostics, or retrospective assessment rather than continuous ship-level safety evaluation. In machinery management, ship operators have progressively moved from time-based maintenance toward condition-based and predictive maintenance. The Planned Maintenance System, commonly integrated within a Vessel Management System, supports maintenance scheduling and regulatory compliance, while modern condition-monitoring methods use sensor measurements and diagnostic models to detect abnormal equipment behavior [24,25,26]. These methods can improve fault detection and maintenance planning, but they often require extensive instrumentation, equipment-specific models, and expert interpretation. More importantly, their outputs are rarely converted into a quantitative measure of how current machinery condition affects the immediate safety of ship operation.
Weather-related decision support has similarly evolved from reliance on the master’s experience toward numerical forecasting, commercial weather-routing services, and shore-based operational assistance [27]. These systems are primarily intended to support route optimization, fuel efficiency, schedule reliability, and avoidance of severe conditions. Weather exposure may also be evaluated retrospectively after a voyage. However, weather risk is generally not expressed as a continuously updated contribution to an integrated measure of the vessel’s instantaneous safety state.
Grounding risk is predominantly addressed through pre-departure passage planning, electronic navigational charts, safety-depth settings, route validation, and operational under-keel-clearance requirements. These practices are essential for safe navigation, but they are largely based on predefined routes and planning assumptions. Autonomous operation requires the system to assess grounding exposure continuously as position, draft, tide, squat, bathymetry, route deviation, and maneuvering decisions change. Existing approaches have not yet been widely incorporated into an integrated real-time safety measure [16].
The literature therefore contains mature or developing methods for individual domains, but these remain fragmented. Collision risk [17,18,28] is typically assessed for scenario validation, machinery health for maintenance planning, weather for routing and efficiency, and grounding risk for passage planning. Because each domain uses different variables, scales, time horizons, and decision objectives, their outputs cannot be directly interpreted as a unified measure of ship-level safety, and a low value in one domain cannot compensate for a critical condition in another. These methods are applied independently of one another. No measure exists that tells an operator how safe a ship is at a given moment. The reason is not that the wrong way of combining risks was chosen; it is that such a value could not be computed at all.
Integration has not been attempted and found wanting. The measurement it would require has simply not been available. A ship-level safety state is meaningful only if it is evaluated continuously, and that requires the condition of the ship to be observed and retained at a matching resolution. Voyage-level summaries and post-incident records cannot support such a measure, and what cannot be measured cannot be managed.
Use of High-Frequency Onboard Data
A further limitation concerns temporal resolution and the use of onboard data [29]. Much of the existing literature relies on simulations, synthetic collision scenarios, AIS sampled at intervals of seconds to minutes, or weather and machinery indicators aggregated over voyages or maintenance cycles [30,31,32,33]. This does not necessarily reflect an absence of data: shipboard automation systems continuously acquire navigational, environmental, machinery, and control measurements, often at roughly one-second resolution, but only a limited subset is routinely preserved and exploited for integrated safety analysis.
Alarm and Monitoring Systems [34] are designed primarily to issue alerts when predefined limits are exceeded and may not retain complete time-series records of variables within normal range. The Voyage Data Recorder similarly stores only a prescribed subset of navigational, communication, and equipment data for accident investigation, sufficient to reconstruct what occurred but often insufficient to explain the evolving interactions among weather, navigation, machinery, and control states that caused risk to increase. A substantial gap therefore exists between the data generated onboard and the data actually used for continuous safety assessment.
This gap in temporal resolution matters because hazardous conditions can develop faster than voyage-level or maintenance-cycle analyses can capture. Minute-level or aggregated data may suit strategic route planning or long-term maintenance, but abrupt machinery anomalies, close-quarters encounters, rapid environmental deterioration, or approach to shallow water can evolve within seconds. An operational MASS safety framework must therefore process continuous high-frequency measurements and translate them into a stable, interpretable, domain-integrated assessment.
3. Proposed High-Frequency Composite Safety Index (HF-CSI)
3.1. System Model and Design Principles
3.1.1. Problem Formulation
The objective of the proposed framework is to convert high-frequency, multi-source onboard observations into a single, continuously updated, real-time safety indicator for a Maritime Autonomous Surface Ship (MASS). Formally, at each sampling instant t, the framework takes as input a synchronized multivariate observation vector drawn from navigation equipment, the engine Alarm and Monitoring System (AMS), the Bridge Maneuvering System (BMS), and external weather-information services, and produces as output (i) a composite safety index , (ii) a categorical safety grade, and (iii) the identity of the dominant risk domain driving that grade. The framework is subject to three operating constraints: it must update continuously at the native sampling rate of onboard systems rather than at voyage- or maintenance-cycle granularity; it must remain interpretable, in that any degradation of the index must be traceable to a specific risk domain; and it must be ship-agnostic, in the sense that a given index value carries a consistent physical meaning regardless of vessel or voyage. These three constraints motivate the three design principles below. Figure 1 summarizes the safety design philosophy underlying the proposed framework.
Figure 1.
Overview of the safety design philosophy for a MASS.
3.1.2. Design Principle 1: Non-Compensatory Risk Fusion
A significant risk in one safety domain must not be offset by a safe condition in another: a ship in severe heavy weather must be assessed as unsafe even if its machinery is normal and under-keel clearance is ample, and a ship on the verge of grounding must be assessed as unsafe even under favorable weather. Composite indices based on weighted sums or arithmetic means violate this requirement, since a high risk level in one domain can be diluted by low levels in the others – for example, if one of four domains reaches maximum risk while the remaining three are safe, an arithmetic mean rates the overall risk as merely moderate, failing to reflect that a single severe risk can dominate a ship’s overall safety state. HF-CSI therefore disallows cross-domain compensation, letting the dominant risk, the single risk with the greatest influence at each instant, determine the overall safety level.
3.1.3. Design Principle 2: Externally Referenced Normalization
Combining risk variables of differing units and physical meaning, such as significant wave height, wind speed, Mahalanobis distance, and under-keel clearance, into a single index requires conversion onto a common scale. Data-driven schemes such as min–max scaling or standardization yield results that depend on the range and distribution of the observed data, so the same physical state could be expressed as a different risk level depending on vessel, voyage, or analysis period, precluding direct cross-voyage comparison. We instead define, for each domain, an onset threshold and a saturation threshold from physical, operational, or statistical external criteria, and convert the state between them onto a common risk scale. Under this scheme, a risk level of 0 denotes a physical or normative safe state as defined by a pre-established criterion, not the minimum value observed in a particular dataset, so the same risk level carries a consistent interpretation across vessels and voyages.
3.1.4. Design Principle 3: Mode-Conditional Normality
The normal operating state of a ship’s machinery is not a single fixed distribution. Main-engine rotational speed, load, and temperature differ structurally between ocean cruising and port approach/departure maneuvering. Applying a baseline formed under one operating mode uniformly to another can cause a normal change in operating point to be misjudged as a machinery anomaly, an effect we quantify empirically later. Machinery health assessment therefore learns the normal distribution independently for each operating mode and compares each instant’s state against the baseline corresponding to that mode, removing structural differences due to operating condition while preserving sensitivity to genuine deviation within a mode.
These three principles are implemented, respectively, as non-compensatory risk fusion, externally-referenced normalization, and mode-conditional machinery anomaly scoring.
3.2. Framework Architecture
Figure 2 shows the framework within a MASS voyage as a closed-loop lifecycle spanning pre-departure voyage authorization, real-time in-operation safety monitoring, and post-arrival assessment with adaptive feedback for continuous safety improvement. The remainder of this section formalizes the in-operation monitoring stage of this lifecycle as a four-layer processing architecture, shown in Figure 3, that transforms raw onboard data into the real-time outputs defined earlier.
Figure 2.
Operational lifecycle of the proposed High-Frequency Data-Driven State Assessment Framework for Maritime Autonomous Surface Ships (MASSs), illustrating the closed-loop workflow comprising pre-departure voyage authorization, real-time in-operation safety monitoring, and post-arrival assessment with adaptive feedback for continuous safety improvement.
Figure 3.
High-Frequency Data-Driven State Assessment Framework for Maritime Autonomous Surface Ships (MASSs).
3.2.1. Layer 1: Data Acquisition
The first layer collects fixed-interval time-series data from navigation equipment (GPS, echo sounder, and wind speed/direction sensor), the engine AMS, the BMS, and external weather-information services. Data from these sources are synchronized to a common time reference, yielding the multivariate observation vector referenced earlier. Figure 4 details the sensor-to-shore path realizing this layer end to end, from onboard sensing to the point at which data becomes available for shore-based assessment.
Figure 4.
Sensor-to-shore data acquisition path for MASSs, illustrating the end-to-end flow of high-frequency operational data from onboard sensing to shore-based safety assessment.
3.2.2. Layer 2: Domain-Specific Risk Computation
The second layer transforms the collected observations into four safety domains: Weather Risk Index (WRI), Collision Risk Index (CRI), Machinery Health Risk Index (MHRI), and Grounding Risk Index (GRI). Each domain has a distinct physical unit and computational structure but is converted onto a common scale, where 0 denotes an absence of manifested risk and 10 a predefined maximum-risk state.
3.2.3. Layer 3: Non-Compensatory Risk Fusion
The third layer applies a consequence-severity coefficient to each normalized domain risk level and computes HF-CSI from their maximum, simultaneously identifying the domain that produced this maximum as the dominant risk at that instant.
3.2.4. Layer 4: Safety Grading and Decision Support
The fourth layer converts the continuous HF-CSI into an operator-interpretable safety grade for display on the bridge or at a shore-based remote operation center, with the dominant risk displayed alongside the index.
Layers 1 and 2 require access to raw data and equipment interfaces and are therefore best executed onboard, whereas Layers 3 and 4 can be executed onboard or ashore. Because the domain risk levels produced by Layer 2 involve substantially less data volume than raw sensor streams, the ship and a shore-based remote operation center can share an identical safety state even under limited ship-to-shore communication bandwidth. Figure 5 consolidates these four layers into the deployed technical architecture, showing how onboard computation (Layers 1 and 2) and shore-side computation (Layers 3 and 4) map onto physical system components.
Figure 5.
Layered technical architecture of the proposed High-Frequency Data-Driven State Assessment Framework for Maritime Autonomous Surface Ships (MASSs).
3.3. Domain Risk Quantification
3.3.1. Common Normalization Scheme
All domain risk levels follow a common normalization structure based on an onset threshold and a saturation threshold . For a domain in which risk increases with the characteristic quantity v, the normalized risk level x is
where constrains the input to . That is, gives risk 0, gives risk 10, and risk increases linearly between the thresholds. For quantities such as under-keel clearance, where risk increases as v decreases, the conversion direction is reversed:
The essential feature of both equations is that the thresholds are determined from external criteria, not from the observed data’s own range. Thresholds for weather risk are set from the World Meteorological Organization (WMO) sea-state and Beaufort wind-force scales [35], for grounding risk from operational practice regarding minimum under-keel clearance [36], and for machinery health risk from percentiles of the chi-squared distribution [37]. Table 2 summarizes the domain-specific thresholds and their bases.
Table 2.
Domain-specific risk thresholds and their basis.
The threshold values are those appropriate to a large ocean-going container ship, and they are not universal. A vessel of a few thousand deadweight tonnes would begin heavy-weather preparation at a lower sea state; a shallow-draft vessel in confined waters would apply a different under-keel clearance criterion; and a smaller, more maneuverable ship would require less time to execute an avoiding action, so the collision time threshold would be shorter. What does not change with ship type is the structure: the onset–saturation form of the conversion, the requirement that thresholds be fixed from external criteria rather than from the data, the non-compensatory combination, and the mode-conditional treatment of machinery. Adapting the framework to another vessel class is a matter of re-specifying the values in this table, not of altering the method. A quantitative differentiation of thresholds by ship type would require accident-consequence statistics across multiple classes, which the single-vessel dataset used here cannot provide, and is left as future work.
3.3.2. Weather Risk Index
WRI jointly evaluates the effect of waves and wind on ship operation. The wave component is a composite significant wave height combining wind-sea and swell components on an energy basis, while the wind component is the true wind speed corrected for own-ship speed and heading. The saturation threshold corresponds to Sea State 7 (significant wave height 7 m; wind speed 45 kt), a high-wave condition under which even large merchant ships may require deceleration, course alteration, or heavy-weather maneuvering. The onset threshold (wave height 4 m, wind speed 27 kt, and the lower bound of Beaufort Force 7) is interpreted as the point at which heavy-weather preparation and heightened surveillance become warranted. The two components are each converted to , and WRI is their maximum
applying the non-compensation principle within the domain: even with low wave height, a strong wind alone drives WRI to a high value.
3.3.3. Machinery Health Risk Index
MHRI is computed from the deviation of the machinery’s multivariate operating state from its normal distribution, using the Mahalanobis distance to account for the covariance structure among variables and capture correlation-level anomalies that univariate thresholds miss.
(1) Operating-Mode Identification: The normal distribution is learned separately for each operating mode, using the BMS engine telegraph signal (Navigation Full, Full Ahead, Half Ahead, Slow Ahead, Dead Slow Ahead) as the mode label. Unlike post-hoc mode inference from rotational speed or load, this directly reflects the operator-commanded state and requires no separate clustering or operating-point boundary definition.
(2) Subsystem Decomposition: The machinery system is decomposed into Main Engine (ME), shafting, and Generator Engine (GE) subsystems, with the Mahalanobis distance computed independently for each, preserving fault-location information and allowing each subsystem’s degrees of freedom to be set according to its own variable count. Boilers are excluded due to their discontinuous start/stop operating behavior, which is incompatible with the continuous-normal-distribution assumption underlying this method.
For subsystem s under mode m, with observation vector , normal-state mean , and covariance :
Under multivariate normality, follows a chi-squared distribution with degrees of freedom equal to the subsystem’s variable count. The onset and saturation thresholds are accordingly set to the 95th and 99.9th percentiles of that distribution, placing subsystems of differing dimensionality on the same scale.
(3) Subsystem Fusion and Mode-Transition Handling: MHRI is the maximum across subsystems:
Immediately following a telegraph mode change, the machinery passes through a transient operating state that can deviate substantially from the new mode’s normal distribution despite being a normal transition. MHRI computation is therefore suspended for 15 min following a mode transition, analogous to the temporary suppression of alarms immediately following an operating-state transition in engine monitoring systems.
3.3.4. Grounding Risk Index
GRI is computed from the under-keel clearance,
where is the echo-sounder depth reading, and is the ship’s draft (conservatively taken as the larger of forward and aft draft), rather than from electronic-chart depth combined with cross-track error, avoiding sensitivity to chart data quality (CATZOC), survey currency, and route-plan availability, at the cost of no lookahead beyond the current position. The threshold is defined on the UKC-to-draft ratio
with an onset threshold of and a saturation threshold of , set with reference to operational practice on minimum under-keel clearance in deep-water navigation:
Echo-sounder readings smaller than the ship’s draft are treated as invalid, since such readings are physically implausible for a large container ship underway; these are attributed to the sounder exceeding its effective range in deep water and assigned .
3.3.5. Collision Risk Index
CRI is computed from the relative position and motion between the own ship and a target ship, using DCPA and TCPA as primary variables. Let and denote the distance and time to the closest point of approach for target ship i, let and denote the safe separation distance and safe time margin, and let and denote the saturation thresholds of each component. Each component follows the decreasing-risk conversion of Equation (2) and is expressed as a dimensionless factor in :
Here, expresses how closely the target will pass and how imminent that passage is. Where is negative, that is, where the closest point of approach has already been passed and the vessels are separating, . The collision risk index is the product of the two factors, maximized over all detected targets:
The two components are combined by a product rather than a maximum. Waves and wind in the weather domain are independent hazards, either of which alone can imperil navigation, so a maximum is appropriate there. DCPA and TCPA, by contrast, are not independent hazards but two aspects of a single encounter geometry: a collision requires that the target pass close and that it do so soon. Under a maximum, a target passing safely at 3 NM would saturate the index whenever the closest point of approach became imminent because approaches unity; the product removes this. Across target ships, the maximum is retained, since navigational safety is determined by the single most hazardous target rather than by an average over all detected targets. CRI is 0 when no target ship is detected.
The formulation uses DCPA and TCPA because they are the two quantities that determine whether an encounter is hazardous under a constant-velocity assumption, and because they are recoverable from any tracking source. Relative bearing rate and range may be added as further factors within the same product structure where the tracking quality supports them; this is a refinement of the present formulation rather than a departure from it.
The thresholds were set to NM (saturating at NM) and min (saturating at min). The 40 min safe-time margin reflects the interval a large container ship requires to perceive an encounter, execute a course change, and have that change take effect.
The full-scale dataset used in this study does not include dynamic AIS information for target ships; accordingly, the full-voyage HF-CSI time series is computed from the weather, machinery health, and grounding domains, while the computability and fusion feasibility of CRI are confirmed separately using synthetic head-on encounter scenarios generated with the DNV Ship Traffic Generator [22] on the own ship’s recorded track. Once target-ship AIS or radar-tracking data is available, all four domains can be applied directly within the same fusion structure (Appendix A).
3.4. Non-Compensatory Risk Fusion
3.4.1. Composite Index Definition
Let be the normalized risk level of domain i at time t and its consequence-severity coefficient. HF-CSI is defined as
HF-CSI , with larger values indicating greater safety; it expresses the remaining safety margin rather than a sum or average of domain risks. means all domains are at or below their onset thresholds; means at least one domain with has reached saturation risk.
3.4.2. Consequence-Severity Coefficients
satisfies and represents the relative severity of the consequences expected if domain i’s risk were realized as an accident, normalized so that the domain with the most severe consequences on the vessel in question has . We deliberately do not normalize , a common convention in weighted-sum fusion: under maximum-based fusion, such normalization caps every individual coefficient and compresses the index’s effective range—e.g., with four domains at , even a risk level of 10 yields a maximum weighted risk of only , confining HF-CSI to roughly and eroding discriminative power between safety grades. Because a single container ship is the subject of this study, and weather, collision, loss of machinery function, and grounding can each lead to a serious accident, all are set to 1 in the baseline analysis; differentiating by ship type requires accident-frequency and consequence statistics across multiple ship types and is left as future work.
3.4.3. Dominant Risk Identification
The domain with the largest weighted risk at time t is the dominant risk,
reported alongside HF-CSI so that operators can directly attribute any degradation of the composite index to weather, collision, machinery health, or grounding. Under weighted-sum fusion, the index itself aggregates multiple risks, so the single dominating risk is not structurally identifiable from the index alone; maximum-based fusion preserves this explainability by construction.
In operational use, the index is never displayed alone. Figure 6 shows the display at two instants of the evaluated voyage. The value, the safety grade, the governing domain, and the individual domain levels appear together, so that a degradation and its cause are read in the same glance. An operator seeing “HF-CSI 0.00/dominant risk: MHRI” requires no further analysis to know where to direct attention. This is structural rather than an added feature: it follows from the index being defined by a maximum. Under weighted-sum fusion, the contribution of each domain is absorbed into the total, and the single risk responsible for a low value cannot be recovered from the value itself.
Figure 6.
Operator dashboard at two voyage instants: Bay of Biscay (Warning, weather-dominated) and peak machinery risk (Critical). The dashboard shows the HF-CSI, safety grade, governing domain, and individual domain levels; collision risk is unavailable due to missing target-ship data.
3.5. Safety Grade Classification
Table 3 converts the continuous HF-CSI into four operator-facing safety grades to support situational awareness and response decisions.
Table 3.
HF-CSI safety grade system.
With , corresponds to a dominant risk level of 2, and to a dominant risk level of 6. From the standpoint of a MASS, this grade system serves as more than an alarm display: it acts as a quantitative basis for deciding whether to continue or restrict autonomous function, or to transfer control to a human supervisor, providing a traceable, quantifiable measure of the “sufficiently safe state” that the MASS Code sets only as a qualitative goal (Appendix B).
4. Experimental Results Using Full-Scale High-Frequency Voyage Data
4.1. Target Vessel and Voyage
To evaluate the proposed index under full-scale operating conditions, operational data collected from a large ocean-going container ship were used. The target voyage departed from Algeciras, Spain, and proceeded through the Strait of Gibraltar, along the western coast of the Iberian Peninsula, across the Bay of Biscay, through the English Channel, and across the North Sea to Bremerhaven, Germany, during the winter season. The exact voyage dates are withheld in accordance with a confidentiality agreement with the data provider.
This route provides a suitable testbed for evaluating the proposed integrated safety framework for two main reasons. First, it encompasses sea areas with markedly different operational characteristics within a single voyage. These include an open-ocean segment along western Iberia, the heavy-weather-prone Bay of Biscay, the high-traffic-density and geographically constrained English Channel, and the comparatively shallow waters of the North Sea and German Bight. The sequential occurrence of these operating environments enables safety conditions governed by different risk domains to be examined within the same voyage. Second, as a winter passage through the North Atlantic region, the voyage encountered actual heavy-weather conditions, providing substantial variation in weather-related risk despite the voyage being incident-free overall. Table 4 summarizes the main specifications of the full-scale dataset.
Table 4.
Full-scale dataset specifications.
In this paper, the term “high-frequency” is used relative to voyage-level or maintenance-cycle safety summaries commonly employed in maritime safety assessment. The intended real-time implementation of the proposed framework updates the safety assessment whenever synchronized operational measurements become available, rather than prescribing a fixed sampling interval. In the present evaluation, records sampled at 5 min intervals are used, reflecting the temporal resolution of the available full-scale operational dataset. This resolution enables repeated assessment of changing multi-domain safety conditions throughout the voyage and is therefore suitable for demonstrating the proposed data integration, normalization, and composite-index generation process under full-scale operating conditions. However, the use of 5 min records in this study does not imply that a 5 min update interval is sufficient for every MASS operational response, particularly for rapidly developing situations that may require substantially higher-frequency monitoring. The framework itself is independent of the sampling interval and can be updated at the rate at which synchronized input measurements are made available.
Table 5 presents summary statistics of representative onboard variables used in the safety assessment. These variables illustrate the range of environmental, navigation, and machinery information available within the dataset and subsequently used to construct the corresponding domain-specific risk indices.
Table 5.
Summary statistics of representative onboard variables used in the safety assessment.
4.2. Data Composition and Preprocessing
Table 6 lists the input variables for each domain index. Machinery health is decomposed into three subsystems, with the number of variables in each subsystem determining the degrees of freedom of its Mahalanobis distance.
Table 6.
Domain-specific input variables.
(1) Distribution of Operating Modes: The telegraph signal was distributed across five operating points. Table 7 shows the distribution of samples across these operating points. Navigation Full accounted for half of all samples, with the remainder corresponding to deceleration operation for port approach/departure and narrow-channel transit. All modes exceeded the minimum sample count of 30 required for conditional baseline learning, so an independent baseline was learned for all five modes.
Table 7.
Distribution of operating mode (Telegraph).
(2) Validity of Echo-Sounder Readings: Of the 1858 total samples, 916 (49.3%) had depth readings exceeding the draft and were classified as valid measurements. The remaining 942 samples were either deep-water segments, where the echo sounder failed to detect the seabed, or reading errors and were assigned a grounding risk level of 0. Among these, 116 samples recorded depths of 3–7 m, while the draft was 14 m, a physical contradiction judged to be a measurement error.
Data Quality Control
The dataset comprises 881 recorded channels, of which 11 are used by the framework: 2 wave heights and 1 wind speed for WRI, 10 machinery variables across three subsystems for MHRI, 3 depth and draft variables for GRI, and the engine telegraph as the operating-mode label. All channels are recorded at a common five-minute interval and carry a shared UTC timestamp, so no resampling or interpolation was applied. Three quality issues were identified in the record and handled as follows.
Missing intervals. The record spans nine days but contains 1858 samples, equivalent to 6.45 days of continuous recording. The difference of 58.9 h is distributed across nine gaps, of which three exceed 10 h. In all three, the latitude is unchanged across the gap, indicating that the vessel was stationary or drifting while recording was interrupted. Samples adjacent to a gap are excluded from any calculation that depends on the interval between successive samples, specifically the identification of course alterations and the detection of operating-mode transitions. Domain risk values, which are computed independently at each sample, are unaffected.
A corrupted course channel. The recorded course over ground was found to be unusable. Over segments in which the vessel was demonstrably steady—latitude increasing uniformly, longitude fixed, and the distance between successive positions constant—the channel varied by more than 150 degrees between adjacent samples. Heading was validated against the bearing derived from successive GPS positions and agreed to a median of 0.24 degrees, so heading was used wherever a direction was required, and course over ground was discarded. This affects only the identification of maneuvers for the collision case study; no domain index uses either channel.
Invalid echo-sounder readings. As noted above, 116 samples record depths of 3–7 m against a draft of 14 m. Such readings are physically impossible for a laden container ship under way and were treated as measurement failures. More generally, any reading smaller than the draft was classified as invalid, which removes both these errors and the deep-water segments in which the sounder does not reach the bottom (Table 8).
Table 8.
Data quality issues identified in the record and their treatment.
4.3. Domain-Specific Results
Table 9 shows the risk computation results for the three domains. All three domains have a median of 0, indicating that no domain exceeded its onset threshold over most of the incident-free voyage and confirming that the threshold-based normalization behaves as intended, in contrast to min–max normalization, which always yields some value dependent on the data’s own distribution.
Table 9.
Domain-specific risk computation results (0 = Safe, 10 = Maximum Risk).
(1) Weather Risk Index: Weather risk rose sharply upon entering the Bay of Biscay on the third day of the voyage. Weather risk rose on two occasions: along the northbound leg off the Iberian coast and in the Bay of Biscay. The maximum over the whole voyage was 8.67, at which point the composite significant wave height was 6.60 m, while the true wind speed was only 6.7 m/s, so that the wave component alone determined the risk value. In the Bay of Biscay, the maximum was 8.59, where the relation was reversed: a measured true wind speed of 21.8 m/s (42 kt) dominated, while the composite significant wave height was 5.40 m. The latter corresponds to Beaufort Force 9, typical of winter-heavy weather in the Bay of Biscay. That the two maxima originate in different components shows that taking the maximum of the wave and wind components, as specified in Section 3.3.2, captures genuinely different situations. Weather risk subsequently declined upon entering the English Channel and remained at 0 throughout the North Sea segment.
(2) Machinery Health Risk Index: Figure 7 shows the effect of the mode-conditional baseline. When a single cruising baseline was applied across the entire voyage, machinery health risk reached its maximum value in effectively all deceleration segments corresponding to telegraph settings 1–4. The squared Mahalanobis distance during Dead Slow segments exceeded 28,000 relative to the cruising baseline, misjudging as anomalous a normal operating state whose rotational speed was only one-third of cruising speed. Applying mode-specific baselines normalized the mean risk level to the range 0.30–0.77 across all five modes, consistent with the fact that no machinery fault was present in the source data. Table 10 shows the mean subsystem risk level by operating mode.
Figure 7.
Effect of operating-mode-conditional baselines. (a) Mean MHRI by operating mode under a single cruising baseline (saturating at 10 for all maneuvering modes) versus the mode-conditioned baseline (normalized to 0.30–0.77 across all modes). (b) Number of baseline-training samples available per operating mode (telegraph settings 1–5). (c) Count of MHRI saturation events before and after transient-state suppression, with the share occurring within min of a mode change (55% before suppression versus 22% after, approaching the 10% chance level).
Table 10.
Mean subsystem risk level by operating mode.
Figure 7 also shows the effect of suspending computation for 15 min following a mode transition. Before suppression, 141 samples reached maximum machinery risk, of which 78 (55%) fell within 15 min before or after a mode transition. Given that mode-transition proximity accounts for only 10% of all samples, this represents a 5.5-fold concentration, suggesting that more than half of detected anomalies were transient artifacts of operating-point transition rather than faults. After suppression, the number of maximum-risk samples fell to 81, of which 18 (22%) fell within 15 min of a mode transition, a concentration approaching the 10% chance level. The remaining anomalies are therefore interpretable predominantly as genuine machinery deviation rather than transient effects.
(3) Grounding Risk Index: Grounding risk remained at 0 throughout the voyage except when approaching the North Sea and German Bight, rising only in that segment. UKC fell below 50% of the draft in 112 samples, of which 55 exceeded a risk level of 6. These samples were located between 53–56° N, consistent with the shallow-water approach channel to Bremerhaven. Grounding risk remaining at 0 throughout open-ocean segments is physically plausible and shows that the index correctly reflects sea-area characteristics.
4.4. Composite Safety Index
Figure 8 shows the full-voyage time series of the composite index fusing the three domains. The voyage-wide composite safety index averaged 8.01 (SD 3.15), with a median of 10.00. A median coinciding with the scale’s upper bound means that, for more than half of the voyage duration, none of the three domains exceeded its onset threshold.
Figure 8.
Composite safety index dashboard across the full voyage. (a) Weather Risk Index, with onset/saturation thresholds at m/27 kt and 7 m/45 kt (WMO Sea State 7). (b) Machinery Health Risk Index under mode-conditioned Mahalanobis distance, thresholded at the and percentiles. (c) Grounding Risk Index from echo-sounder-based UKC, with onset/saturation at 50% and 10% of draft. (d) Composite Safety Index with safety-grade bands (Normal , Caution , Warning , Critical ). (e) Dominant risk domain over voyage time, shown separately for WRI, MHRI, and GRI.
Table 11 shows the safety grade distribution, which is consistent with an incident-free voyage assessment. A total of 68.2% of samples fall in Normal; the 26.7% distributed across Warning and Critical are concentrated mainly in the Bay of Biscay heavy-weather segment and the North Sea shallow-water segment. This is not inconsistent with the fact that no incident occurred: a decline in safety grade denotes a reduction in safety margin, not the occurrence of an accident, and these segments were indeed states in which operational responses such as deceleration or heightened watch-keeping were warranted.
Table 11.
Safety grade distribution ().
This point marks an important contrast with a non-thresholded approach. In a preliminary analysis using threshold-free normalization and a single cruising baseline, the same voyage’s proportion at Warning or above reached 89.6%. An index that classifies most of an incident-free voyage as an alarm state is not practically usable. Introducing threshold-based normalization and mode-conditional baselines resolved this over-classification.
4.5. Segment-Wise Analysis: The Dominant Risk Changes by Sea Area
The voyage was divided into four latitude-based segments. Table 12 and Figure 9 show the results, which are the central finding of this study.
Table 12.
Composite Safety Index and domain risk by voyage segment.
Figure 9.
(a) Mean domain risk level (WRI, MHRI, GRI) by voyage leg, showing that each leg is governed by a different dominant domain. (b) Dominant-domain composition among risk-bearing samples within each leg.
Of the 1858 total samples, 1186 (63.8%) had all three domains below their onset thresholds, corresponding to a composite index at the scale’s upper bound of 10; the dominant risk is undefined in this regime and is therefore computed only over the 672 samples in which risk actually manifested. Weather dominated 437 samples (65.0%), machinery health 125 samples (18.6%), and grounding 110 samples (16.4%). That all three domains dominate a meaningful share of samples means that no single domain alone can account for safety across the whole voyage.
The dominant domain changes by segment. In the Bay of Biscay, weather risk at 4.56 overwhelmed the other two domains, pulling the composite index down to 5.42; in the North Sea/German Bight, weather risk was 0, while grounding risk rose to 1.56, lowering the index to 7.44. In the English Channel, both were low, while machinery health played the relatively largest role.
This observation directly supports the validity of non-compensatory fusion. A system monitoring only a single domain would have had Bay of Biscay heavy weather caught by weather surveillance and North Sea shallow water caught by navigational surveillance separately, but no single indicator would have continuously represented safety across the entire voyage. Conversely, had weighted-sum fusion been used, the Bay of Biscay’s weather risk of 4.56 would have been buried beneath the other two domains’ low values, and the index decline would not have appeared clearly. Maximum-based fusion reflects the dominant risk directly in the index while simultaneously reporting which domain it originated from.
Figure 10 shows the voyage track colored by composite safety index, indicating that the index’s spatial distribution is consistent with sea-area characteristics.
Figure 10.
(a) Voyage track colored by composite safety index, showing the sequence Algeciras—Gibraltar/Iberian coast—Bay of Biscay—English Channel—North Sea/German Bight—Bremerhaven. (b) Safety-grade composition by voyage leg, with the leg-mean composite safety index annotated for each segment.
4.6. Comparison of Fusion Schemes
Non-compensatory fusion disallows cross-domain offsetting. To confirm what difference this makes on real data, the same three risk levels were combined using two schemes: the most obvious candidate, averaging multiple risks into a single value (weighted mean), and the scheme proposed in this paper (weighted maximum). Averaging is the alternative most likely to be adopted by default, and it therefore serves as a natural reference for examining the proposed rule. No integrated index is in operational use at present, so the comparison below explains a design choice rather than refuting current practice. Weights were set equal in both cases.
Table 13 shows that, under the weighted mean, the voyage-average index rises to 9.32, and the proportion at Critical falls to 0.1%, just 2 of the 1858 samples. On the surface, this appears safer, but the difference arises not because safety actually improved, but because risk was buried in the average.
Table 13.
Comparison of the two fusion schemes ().
The two schemes disagreed on grade in 589 samples (31.7%). Notably, in all 589 disagreeing samples, the weighted mean judged the safer grade, with not a single case in the opposite direction, indicating that the mean-based scheme’s error is not random but systematically biased toward underestimating risk.
Table 14 demonstrates this directly. For the 176 samples in which at least one of the three risks exceeded 8, that is, instants at which that risk was near its maximum, the weighted mean classified 168 samples (95.5%) as Caution and only a single sample as Critical; this is because when the other two risks are low, the average offsets a risk that has reached the scale’s maximum.
Table 14.
Safety grade assigned by weighted mean for the 176 Samples in which at least one risk exceeded 8.
The clearest case occurs approximately 0.9 days into the voyage, where machinery health risk was at the scale’s maximum of 10.00, while weather and grounding risk were both 0. The proposed scheme yields a composite safety index of 0.00, Critical. The weighted mean instead computes as risk, giving an index of 6.67, Caution. The moment machinery deviated maximally from normal behavior is downgraded to a merely “watch-required” level.
The problem is more pronounced at the segment level. The Bay of Biscay segment’s mean index is 5.42 under the proposed scheme but 8.43 under the weighted mean. The weighted mean classifies a heavy-weather segment with 5.4 m significant wave height and 42 kt wind as Normal. The segment-wise shift in dominant risk identified earlier likewise does not appear under the weighted mean, since each segment’s dominant risk is buried beneath the low values of the other domains, narrowing the four segments’ indices to the range 8.43–9.59.
If an integrated measure is meant to identify hazardous moments, averaging works against that aim: it dilutes exactly when one domain approaches its maximum. Non-compensatory fusion is therefore a requirement of any integrated safety index, not one option among equals. In current practice, the alternative is not a different fusion rule, but no fusion at all, and Section 4.5 shows the cost. Weather surveillance alone would have caught the Bay of Biscay. Navigational surveillance alone would have caught the North Sea shallows. Neither would have described the safety of the voyage as a whole. Figure 11 shows the full-voyage time series under both fusion schemes, together with the resulting grade distributions and the leg-mean comparison described above.
Figure 11.
Comparison of non-compensatory (weighted-maximum, proposed) and compensatory (weighted-average) fusion. (a) Full-voyage time series under both schemes, annotated with the instant at which MHRI reached its maximum (10.00), classified Critical (0.00) by the proposed scheme versus Caution (6.67) by averaging, and with the Bay of Biscay segment mean (5.42 proposed versus 8.43 averaged). (b) Resulting safety-grade distributions. (c) Safety grade assigned by averaging to the 176 samples in which at least one domain risk exceeded 8; a total of 95% are classified Caution and none Normal. (d) Leg-mean composite safety index under each fusion rule, with the Normal threshold (CSI = 8) marked.
4.7. Sensitivity Analysis
The proposed index depends on design values, namely per-risk thresholds and consequence-severity coefficients. To confirm that the choice of these values does not drive the conclusions, the index was recomputed under nine conditions, each varying one parameter individually. Table 15 and Figure 12 show the results.
Table 15.
Sensitivity to design-value changes.
Figure 12.
Sensitivity of the composite safety index to design-value changes. (a) Voyage mean CSI across 10 conditions, remaining within 7.58–8.44 against a baseline of 8.01. (b) Leg-mean CSI for all four voyage segments across the same conditions, showing that the Bay of Biscay remains the least-safe leg in nine of the 10 cases.
The voyage-average composite safety index remained within the range 7.58–8.44 across all conditions, a maximum deviation of 0.43 from the baseline value of 8.01, or 4.3% of the 10-point scale. Identification of the lowest-safety segment agreed with the Bay of Biscay in 9 of the 10 conditions. The single exception occurred under the most permissive weather onset threshold (5 m wave height), where the Bay of Biscay’s index rose to 7.53, narrowly reversing rank order against the North Sea’s 7.44. Even here, however, the difference between the two segments was only 0.09, remaining clearly distinct from the other two segments (8.88, 9.02).
Across the three conditions varying consequence-severity coefficients, setting one domain to 1.0 and the remaining two to 0.8, segment rank order was fully preserved in every case. The segment-wise shift in dominant risk observed earlier is therefore a property of the data itself, not an artifact of a particular weight setting.
4.8. Case-Study Validation of the Collision Risk Index
The present dataset does not include target-ship AIS information, so the collision risk index cannot be computed as a measured time series over the full voyage. It is therefore validated through a dedicated case study using synthetic encounter scenarios synthesized on the recorded track of the present voyage, confirming that the collision domain can be computed and that all four domains integrate within the same non-compensatory fusion structure.
4.8.1. Scenario Construction
Own-ship position, speed, and heading are taken directly from the present voyage, and only the target ship is synthesized, using a head-on encounter geometry adapted from the DNV Ship Traffic Generator’s baseline encounter scenarios [22]. The head-on encounter is the basic situation explicitly governed by COLREG Rule 14 and is widely used in the verification of autonomous collision avoidance.
At the start of the encounter, the target is placed on a reciprocal course at constant speed, aimed at the point own ship would reach if it maintained its course, following the head-on geometry defined in the DNV baseline scenario set [22]. The two vessels are therefore on an exact collision course at the outset, and the outcome is determined solely by the maneuver the own ship actually performed; the target maintains course and speed throughout.
Own-ship maneuvering behavior was identified from the measured data. The 30 min cumulative change in heading was computed and cross-checked against the change in track bearing derived from successive GPS positions; only cases in which the two agreed within 10° were accepted as genuine course alterations. Data gaps and position-reading errors were excluded. From the alterations so identified, six instants of differing character were selected. Table 16 gives the initial conditions of the six encounter scenarios.
Table 16.
Initial conditions of the six encounter scenarios identified on the recorded track (Turn is the 30 min cumulative heading change; Positive is to starboard).
Each encounter is arranged so that the nominal closest point of approach occurs 20 min after the start and is evaluated at 30 s resolution over a 60 min window from 30 min before to 30 min after that point. The thresholds were set to a safe separation distance NM with saturation at NM and a safe time margin min with saturation at min. The 40 min time threshold reflects the interval a large container ship requires to perceive an encounter, execute a course change, and have that change take effect.
4.8.2. Results by Encounter
Table 17 gives the minimum separation and peak collision risk index by encounter, and Figure 13 and Figure 14 show the corresponding encounter trajectories and risk evolution.
Table 17.
Minimum separation and Peak Collision Risk Index by encounter (grade obtained from CRI alone).
Figure 13.
Six head-on encounter scenarios synthesized on the recorded track. Navy denotes the measured own-ship track, and the colored line denotes the synthetic target ship. Stars mark the closest point of approach; the dashed line indicates the separation at that instant.
Figure 14.
(a) Evolution of the collision risk index through each encounter; (b) peak index by encounter; (c) encounter outcomes in the space of minimum separation and time to the closest point of approach.
The three encounters in which the own ship took decisive avoiding action (ENC-01, 02, and 03) opened the minimum separation to between 5.95 and 7.52 NM, holding the collision risk index between 0.00 and 2.90. The two encounters in which no action was taken (ENC-05, 06) closed to 0.21 NM and 0.26 NM, driving the index to 9.19 and 8.18. The index separates the two behaviors clearly.
ENC-03 reached 2.90 because, although the avoiding action was ample, it was initiated comparatively late, so that risk rose briefly during the encounter and then resolved. This shows that the index reflects not only the final outcome but the risk that develops as the encounter unfolds.
4.9. Integrated Safety Assessment and Operational Applications
The encounter analysis highlights the distinction between regulatory compliance and operational safety. ENC-04 formally satisfied COLREG Rule 14 through a starboard alteration; however, under a significant wave height of 5.4 m and true wind speed of 14.7 m/s, the course change was only 10.0°, and the minimum separation decreased to 0.38 NM. Its collision risk reached 6.89, substantially higher than the decisive compliant encounters (0.00–2.90) and close to the non-compliant cases (8.18 and 9.19). Thus, binary compliance alone does not represent the safety margin achieved during an encounter. Figure 14a further shows that elevated risk was identifiable approximately 10 min before CPA, indicating the potential of the continuous index for early warning.
The common 0–10 scale also enables collision risk to enter HF-CSI directly. At ENC-04, the weather risk was 4.71, and the collision risk was 6.89; collision therefore became the governing domain, and the composite safety index decreased to 3.11. This demonstrates the feasibility of integrating heterogeneous hazards under the same non-compensatory formulation. However, because the target ship in the encounter analysis is synthetic, validation using a fully measured four-domain time series remains open for future work.
Beyond instantaneous assessment, HF-CSI provides a compact voyage-level risk profile. Weather governed 65.0% of the risk-bearing samples, machinery health 18.6%, and grounding 16.4%, indicating that weather exposure was the principal operational constraint during this voyage. The mean index, grade distribution, and dominant-risk composition can therefore summarize both the safety margin and its principal causes over an entire voyage.
Because the normalization thresholds are defined using external criteria rather than the observed range of an individual voyage, the framework can also support comparison across vessels and voyages. Figure 15 illustrates this concept by combining voyage-level HF-CSI values with dominant-risk composition. The integrated index provides a common basis for comparing operational safety margins, while the governing domain identifies the principal source of risk. This preserves severe individual hazards that could otherwise be obscured by compensatory averaging.
Figure 15.
Concept of a fleet-level safety dashboard. (a) Fleet ranked by voyage mean index; only the vessel measured in this study carries actual values, with the remainder being illustrative. (b) Dominant-risk composition of the lower-ranked vessels. (c) Comparison between integrated and compensatory safety assessment.
The use of a conventional vessel provides an initial evaluation of operational hazards that are also relevant to MASSs. Weather, machinery health, and grounding risks are evaluated using measured operational data, while collision risk is assessed using synthetic target encounters. The most immediate intended applications of the present framework are therefore onboard and remote safety monitoring. Potential applications across different operating arrangements are summarized in Table 18. Application to autonomous decision-making and crewless operation, however, requires separate validation under representative MASS operating conditions.
Table 18.
Potential applications of the index across operating arrangements.
Nevertheless, the present study evaluates a single voyage of one commercial vessel. Fleet-level comparison, longitudinal safety profiling, and application to autonomous or crewless operation have therefore not yet been experimentally demonstrated. Further validation across multiple vessels, routes, seasons, traffic conditions, and operating arrangements is required.
4.10. Extensions and Remaining Limitations
Several limitations indicate directions for further development. First, the grounding index relies on measured under-keel clearance and therefore represents the present condition rather than hazards ahead. A short-range lookahead based on ENC charted depths along the projected track could complement the echo sounder. The more severe of the measured and predicted clearances could then govern the grounding index, combining direct measurement with advance warning while accounting for chart uncertainty.
Second, the collision index was evaluated using synthetic targets with exact motion. In practice, DCPA and TCPA are affected by tracking noise and delay, which may propagate into the index and, because the most hazardous target governs the result, allow an unstable track to produce excessive risk. Short-window temporal smoothing and track-confidence weighting could reduce this effect without suppressing genuine collision threats. Validation using measured multi-ship encounters is therefore required.
Third, operation at higher sampling rates introduces autocorrelation and computational considerations. At 1 Hz, successive machinery measurements are strongly correlated and should not all be treated as independent observations when learning statistical baselines. Baselines could instead be estimated from thinned samples or block summaries while retaining high-frequency risk scoring. Future work will compare alternative update intervals, including 1, 2, and 5 min intervals and finer resolutions where required, according to the risk domain, operating situation, and intended response. Since only the four domain-risk values need to be transmitted, edge computation can keep communication requirements small even at higher sampling rates.
Finally, intermittently operated auxiliary systems such as boilers, purifiers, compressors, and pumps are not included in the present machinery index because their start–stop behavior does not satisfy a single continuous operating distribution. These systems could be incorporated through mode-specific baselines, analogous to the operating-mode treatment used for the main engine, with transition periods excluded or separately handled.
These extensions do not alter the HF-CSI formulation itself but broaden the quality and range of information supplied to its individual domains. Their evaluation using measured multi-vessel and multi-voyage data remains an important direction for future work.
5. Conclusions
This paper proposes High-Frequency Composite Safety Index (HF-CSI) for the continuous safety assessment of Maritime Autonomous Surface Ships and evaluates it using full-scale operational data from a large container ship. Four principal findings were obtained.
First, an integrated safety state can be computed continuously from onboard measurements, demonstrating the feasibility of voyage-scale safety assessment at five-minute resolution. Second, non-compensatory fusion is necessary to prevent severe risk in one domain from being masked by favorable conditions in others. Weather, grounding, and machinery governed 65.0%, 16.4%, and 18.6% of risk-bearing samples, respectively, while averaging changed the safety grade in 589 samples, always toward a safer assessment.
Third, externally defined thresholds are essential for meaningful normalization. With fixed criteria, the domain-risk medians were zero, and the HF-CSI median was 10, consistent with an incident-free voyage, whereas threshold-free normalization classified 89.6% of the same voyage as Warning or above. Fourth, machinery assessment requires mode-specific baselines. Accounting for telegraph settings and suppressing assessment for 15 min after transitions reduced saturation events from 141 to 81.
The study is limited to one incident-free voyage, while the collision domain was evaluated using synthetic target encounters. Future work should therefore validate the framework using measured accidents and near-misses, multiple vessels and voyages, AIS/radar target tracks, and ENC-based grounding lookahead. Such validation will also enable assessment of the proposed HF-CSI for fleet-level safety comparison and increasingly autonomous ship operations.
Author Contributions
Conceptualization, J.K. (Jaewoo Kim) and J.J.; methodology, J.K. (Jaewoo Kim) and J.K. (Junaid Khan); software, J.K. (Jaewoo Kim); validation, J.K. (Jaewoo Kim) J.K. (Junaid Khan) and J.J.; formal analysis, J.K. (Jaewoo Kim) and J.K. (Junaid Khan); investigation, J.K. (Jaewoo Kim) and J.K. (Junaid Khan); resources, J.J.; data curation, J.K. (Jaewoo Kim) and J.K. (Junaid Khan); writing—original draft preparation, J.K. (Jaewoo Kim) and J.K. (Junaid Khan); writing—review and editing, J.K. (Jaewoo Kim), J.K. (Junaid Khan) and J.J.; visualization, J.K. (Jaewoo Kim); supervision, J.J.; project administration, J.J.; funding acquisition, J.J. All authors have read and agreed to the published version of the manuscript.
Funding
This research was funded by the Technology Innovation Program (RS-2026-25620819, Development of AI-Based Intelligent System for Port-to-Port Operations) of the Ministry of Trade, Industry and Resources (MOTIR), Republic of Korea.
Data Availability Statement
The data used in this study are confidential and are not publicly available due to proprietary and confidentiality agreements.
Acknowledgments
During the preparation of this manuscript, the authors used Claude (Anthropic) to improve the language, clarity, and readability of the text. The authors reviewed and edited the AI-assisted content as needed and take full responsibility for the content of this publication.
Conflicts of Interest
Authors Jaewoo Kim and Junaid Khan were employed by the company Samsung Heavy Industries. The remaining author declares that the research was conducted in the absence of any commercial or financial relationships that could be construed as a potential conflict of interest.
Appendix A. Formulation of the Collision Risk Index
Section 3.3.5 and Section 3.4 define WRI, MHRI, and GRI with their equations given in the main text. This appendix presents the formulation of the Collision Risk Index (CRI), validated separately using synthetic encounter scenarios rather than the full-voyage dataset.
Let and denote the distance and time to the closest point of approach for target ship i, let and denote the safe separation distance and safe time margin, and let and denote the saturation thresholds of each component. Each component follows the decreasing-risk conversion of Equation (2) and is expressed as a dimensionless factor in :
Here, expresses how closely the target will pass and how imminent that passage is. Where is negative, that is, where the closest point of approach has already been passed and the vessels are separating, .
The two components are combined by a product rather than by a maximum. The non-compensatory character of Design Principle 1 forbids offsetting between mutually independent hazards, and waves and wind in the weather domain are independent in this sense: either alone can imperil navigation. DCPA and TCPA are not two independent hazards but two aspects of a single encounter geometry, since a collision requires that the target pass close and that it do so soon. Applying a maximum would give an inappropriate result: a target passing safely at 3 NM would saturate the index whenever the closest point of approach became imminent, because approaches unity. The product removes this, since the index is zero whenever either factor is zero. Across target ships, the maximum is retained, as navigational safety is determined by the single most hazardous target rather than by an average over all detected targets. CRI is 0 when no target ship is detected.
For the case study, the thresholds were set to NM with saturation at NM, and min with saturation at min. As with the other three domains, these values derive from navigational practice rather than from the observed data. Differentiation by ship type and maneuverability is left for future work.
References
- Rodrigue, J.P.; Notteboom, T. Concept 4. Maritime transportation. In The Geography of Transport Systems; Routledge: New York, NY, USA, 2024; p. 147. [Google Scholar]
- Song, D.P. Container Logistics and Maritime Transport; Routledge: Oxfordshire, UK, 2021. [Google Scholar]
- Kostadinov, O.D. The international safety management (ISM) code in merchant shipping: Structure, implementation, and functional analysis. Ger. Int. J. Mod. Sci. 2025, 54. [Google Scholar] [CrossRef]
- Khan, J.; Zaman, U.; ul Hassan, A.; Hussain, S.; Lee, E.; Kim, K. Enhanced Vessel Trajectory Prediction with Novel Mamdani Fuzzy Inference System-Based Alpha–Beta Filter Using AIS Data. IEEE Trans. Intell. Transp. Syst. 2026, 27, 7534–7548. [Google Scholar] [CrossRef] [Scilit]
- Khan, J.; Lee, E.; Kim, K. Optimizing the performance of Kalman filter and alpha-beta filter algorithms through neural network. In 2023 9th International Conference on Control, Decision and Information Technologies (CoDIT); IEEE: Piscataway, NY, USA, 2023; pp. 2187–2192. [Google Scholar]
- Zaman, U.; Khan, J.; Lee, E.; Balobaid, A.S.; Aburasain, R.Y.; Kim, K. Deep learning innovations in South Korean maritime navigation: Enhancing vessel trajectories prediction with AIS data. PLoS ONE 2024, 19, e0310385. [Google Scholar] [CrossRef] [Scilit] [PubMed]
- Ramos, M.A.; Thieme, C.A.; Utne, I.B.; Mosleh, A. Human-system concurrent task analysis for maritime autonomous surface ship operation and safety. Reliab. Eng. Syst. Saf. 2020, 195, 106697. [Google Scholar] [CrossRef] [Scilit]
- Cheng, T.; Utne, I.B.; Wu, B.; Wu, Q. A novel system-theoretic approach for human-system collaboration safety: Case studies on two degrees of autonomy for autonomous ships. Reliab. Eng. Syst. Saf. 2023, 237, 109388. [Google Scholar] [CrossRef] [Scilit]
- Bolbot, V.; Bergström, M.; Rahikainen, M.; Banda, O.A.V. Investigation into safety acceptance principles for autonomous ships. Reliab. Eng. Syst. Saf. 2025, 257, 110810. [Google Scholar] [CrossRef] [Scilit]
- International Maritime Organization. IMO Adopts First Global Code for Autonomous Ships. 22 May 2026. Available online: https://www.imo.org/en/MediaCentre/PressBriefings/Pages/IMO-adopts-MASS-Code.aspx (accessed on 11 October 2026).
- International Maritime Organization. Autonomous Shipping. Available online: https://www.imo.org/en/MediaCentre/HotTopics/Pages/Autonomous-shipping.aspx (accessed on 11 October 2026).
- International Maritime Organization. Maritime Safety Committee (MSC 111): Meeting Summary. 2026. Available online: https://www.imo.org/en/MediaCentre/MeetingSummaries/Pages/MSC-111.aspx (accessed on 11 October 2026).
- Guevara, D.; Dalaklis, D. Understanding the interrelation between the Safety of Life at Sea Convention and Certain IMO’s Code. TransNav Int. J. Mar. Navig. Saf. Sea Transp. 2021, 15, 381–386. [Google Scholar] [CrossRef] [Scilit]
- MSC-MEPC, I. M. O. 2/Circ. 12/Rev. 2. Revised Guidelines for Formal Safety Assessment (FSA) for Use in the IMO Rule Making Process; International Maritime Organization: London, UK, 2018; Volume 9. [Google Scholar]
- Paris MOU. Paris Memorandum of Understanding on Port State Control. In The Legal Order of the Oceans; 2021. Available online: https://www.isprambiente.gov.it/files/pubblicazioni/documenti-tecnici/DOCTEC_2016_BALMAS_Reg_book_2016_addendum.pdf (accessed on 11 October 2026).
- Chang, C.H.; Kontovas, C.; Yu, Q.; Yang, Z. Risk assessment of the operations of maritime autonomous surface ships. Reliab. Eng. Syst. Saf. 2021, 207, 107324. [Google Scholar] [CrossRef] [Scilit]
- Cheng, K.; Li, W.; Zhou, Y.; Shi, G.; Wang, X. A novel fuzzy comprehensive evaluation method for ship collision risk. Ocean Eng. 2025, 332, 121462. [Google Scholar] [CrossRef] [Scilit]
- Du, J.; Weng, J.; Xi, Y.; Zhu, Q.; Ding, H.; Shi, K. Multi-scale collision risk assessment in restricted waters considering ship trajectory uncertainty. Reliab. Eng. Syst. Saf. 2025, 265, 111511. [Google Scholar] [CrossRef] [Scilit]
- Munda, G.; Nardo, M. Noncompensatory/nonlinear composite indicators for ranking countries: A defensible setting. Appl. Econ. 2009, 41, 1513–1523. [Google Scholar] [CrossRef] [Scilit]
- Imazu, H. Marine traffic simulation and collision avoidance studies using standard encounter scenarios. J. Jpn. Inst. Navig. 1987, 77, 69–79. [Google Scholar]
- Sawada, R.; Sato, K.; Minami, M. Framework of safety evaluation and scenarios for automatic collision avoidance algorithm. Ocean Eng. 2024, 300, 117506. [Google Scholar] [CrossRef] [Scilit]
- DNV, Ship Traffic Generator: Baseline_Situations_Generated (JSON Scenarios). GitHub Repository. Available online: https://github.com/dnv-opensource/ship-traffic-generator/tree/main/data/baseline_situations_generated (accessed on 1 June 2026).
- Lyu, H.; Ma, X.; Tan, G.; Yin, Y.; Sun, X.; Zhang, L.; Kang, X.; Song, J. Identification of complex multi-vessel encounter scenarios and collision avoidance decision modeling for MASSs. J. Mar. Sci. Eng. 2024, 12, 1289. [Google Scholar] [CrossRef] [Scilit]
- Karatuğ, Ç.; Arslanoğlu, Y.; Soares, C.G. Review of maintenance strategies for ship machinery systems. J. Mar. Eng. Technol. 2023, 22, 233–247. [Google Scholar] [CrossRef] [Scilit]
- Zhang, P.; Gao, Z.; Cao, L.; Dong, F.; Zou, Y.; Wang, K.; Zhang, Y.; Sun, P. Marine systems and equipment prognostics and health management: A systematic review from health condition monitoring to maintenance strategy. Machines 2022, 10, 72. [Google Scholar] [CrossRef] [Scilit]
- de Jonge, B.; Teunter, R.; Tinga, T. The influence of practical factors on the benefits of condition-based maintenance over time-based maintenance. Reliab. Eng. Syst. Saf. 2017, 158, 21–30. [Google Scholar] [CrossRef] [Scilit]
- Zis, T.P.; Psaraftis, H.N.; Ding, L. Ship weather routing: A taxonomy and survey. Ocean Eng. 2020, 213, 107697. [Google Scholar] [CrossRef] [Scilit]
- Cook, A.S.; Salkanovic, E.; Masden, E.; Lee, H.E.; Kiilerich, A.H. A critical appraisal of 40 years of avian collision risk modelling: How have we got here and where do we go next? Environ. Impact Assess. Rev. 2025, 110, 107717. [Google Scholar] [CrossRef] [Scilit]
- Del Prete, R.; Salvoldi, M.; Barretta, D.; Longépé, N.; Meoni, G.; Karnieli, A.; Graziano, M.D.; Renga, A. Enhancing maritime situational awareness through end-to-end onboard raw data analysis. IEEE J. Sel. Top. Appl. Earth Obs. Remote Sens. 2025, 18, 16997–17018. [Google Scholar] [CrossRef] [Scilit]
- Wang, W.; Liu, K.; Chen, L.; Yu, Y.; Tong, Y.; Wu, X.; Yuan, Z. Dynamic traffic encountering scenario generation for testing of ship collision avoidance algorithm. Ocean Eng. 2026, 345, 123691. [Google Scholar] [CrossRef] [Scilit]
- Kostecka, E.; Miller, T.; Durlik, I.; Nerć, A. Artificial Intelligence in Floating Offshore Wind Turbines: A Critical Review of Applications in Design, Monitoring, Control, and Digital Twins. Energies 2025, 18, 5937. [Google Scholar] [CrossRef] [Scilit]
- Hwang, T.; Hwang, T.; Youn, I.H. Distribution-driven generation model of collision risk scenarios for MASS collision avoidance system verification. J. Int. Marit. Saf. Environ. Aff. Shipp. 2026, 10, 2613467. [Google Scholar] [CrossRef] [Scilit]
- Liu, Z.; Zhou, D.; Zheng, Z.; Wu, Z.; Soares, C.G. A multi-dimensional formulation for assessing regional collision risk based on AIS data. Appl. Ocean Res. 2025, 161, 104612. [Google Scholar] [CrossRef] [Scilit]
- Bouanani, O.; Sandabad, S.; Allal, A.A.; Ech-Chhibat, M.E.H. Design and challenges of an autonomous ship alarm monitoring system for enhanced maritime safety. Inform. Autom. Pomiary Gospod. Ochr. Środowiska 2025, 15, 70–76. [Google Scholar] [CrossRef] [Scilit]
- World Meteorological Organization. Manual on Codes: International Codes (WMO-No. 306, Vol. I.1, Part A—Alphanumeric Codes). 2019. Available online: https://community.wmo.int/en/activity-areas/wis/publications/306-vI.1 (accessed on 29 July 2026).
- Qiu, S.; Sun, Y.; Wang, S. Dynamic assessment and layered output of ship under-keel clearance based on the S-129 mechanism: A case study of the North Channel in the Yangtze River Estuary. In Fifth International Conference on Intelligent Traffic Systems and Smart City (ITSSC 2025); SPIE: Bellingham, WA, USA, 2025; Volume 13792, pp. 789–795. [Google Scholar]
- Majumdar, S. Maximization of the two-parameter multivariate normal likelihood avoiding logarithm and differentiation. Res. Stat. 2026, 4, 2665938. [Google Scholar] [CrossRef] [Scilit]
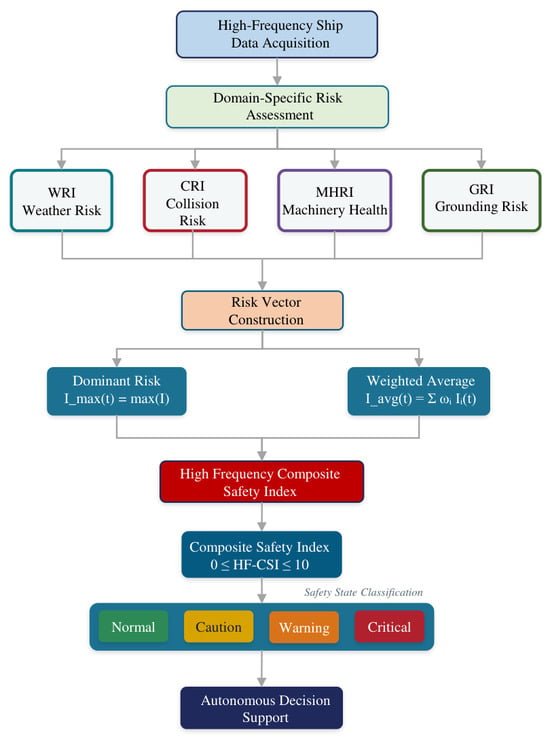
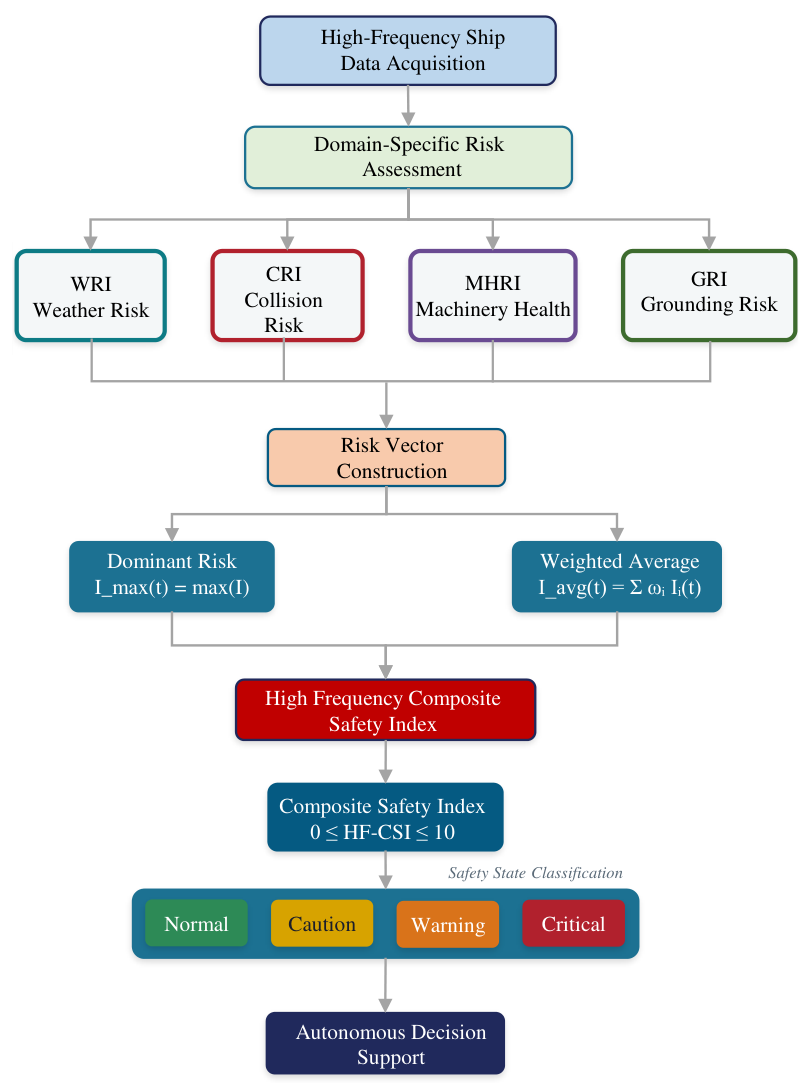
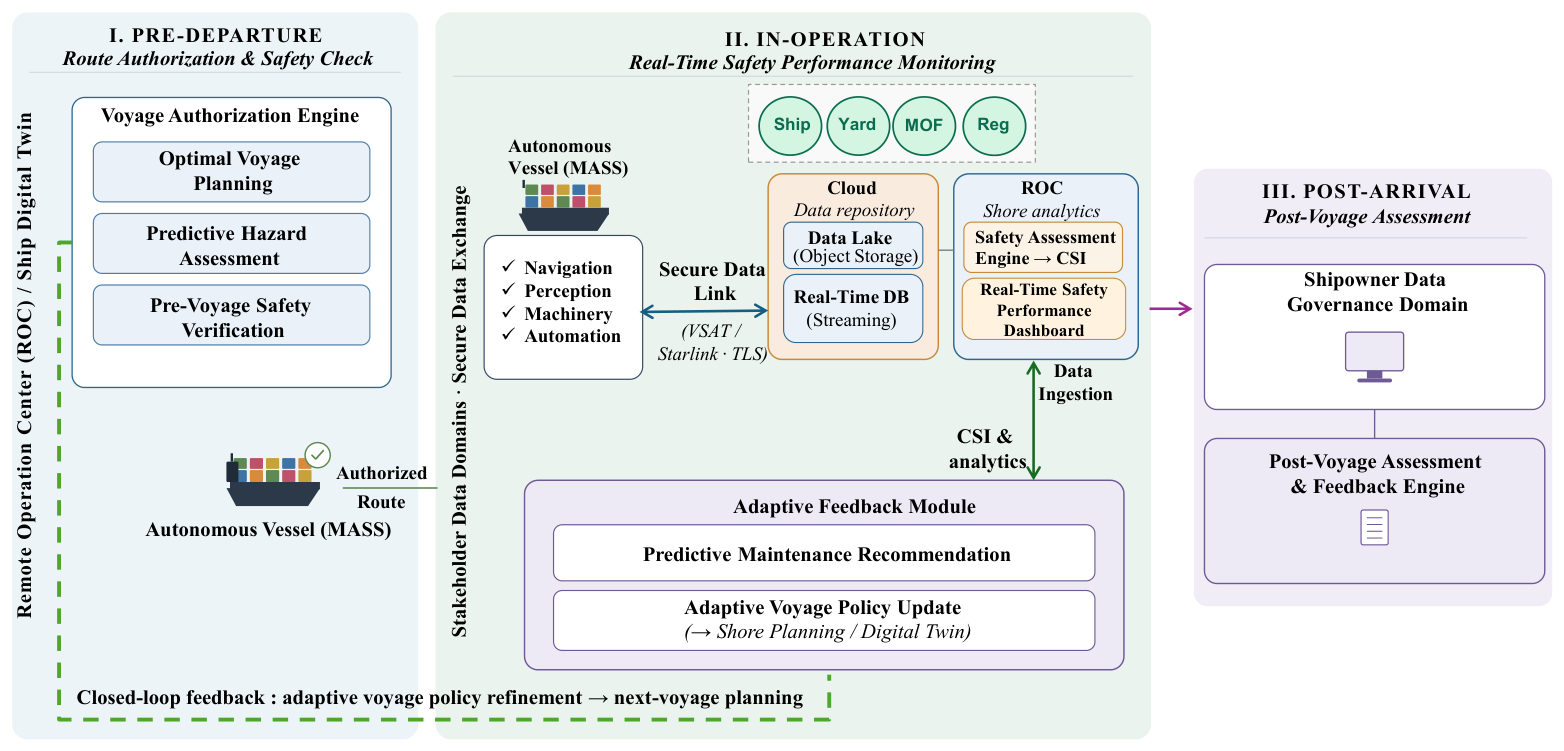
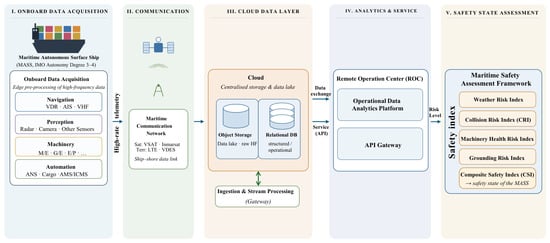
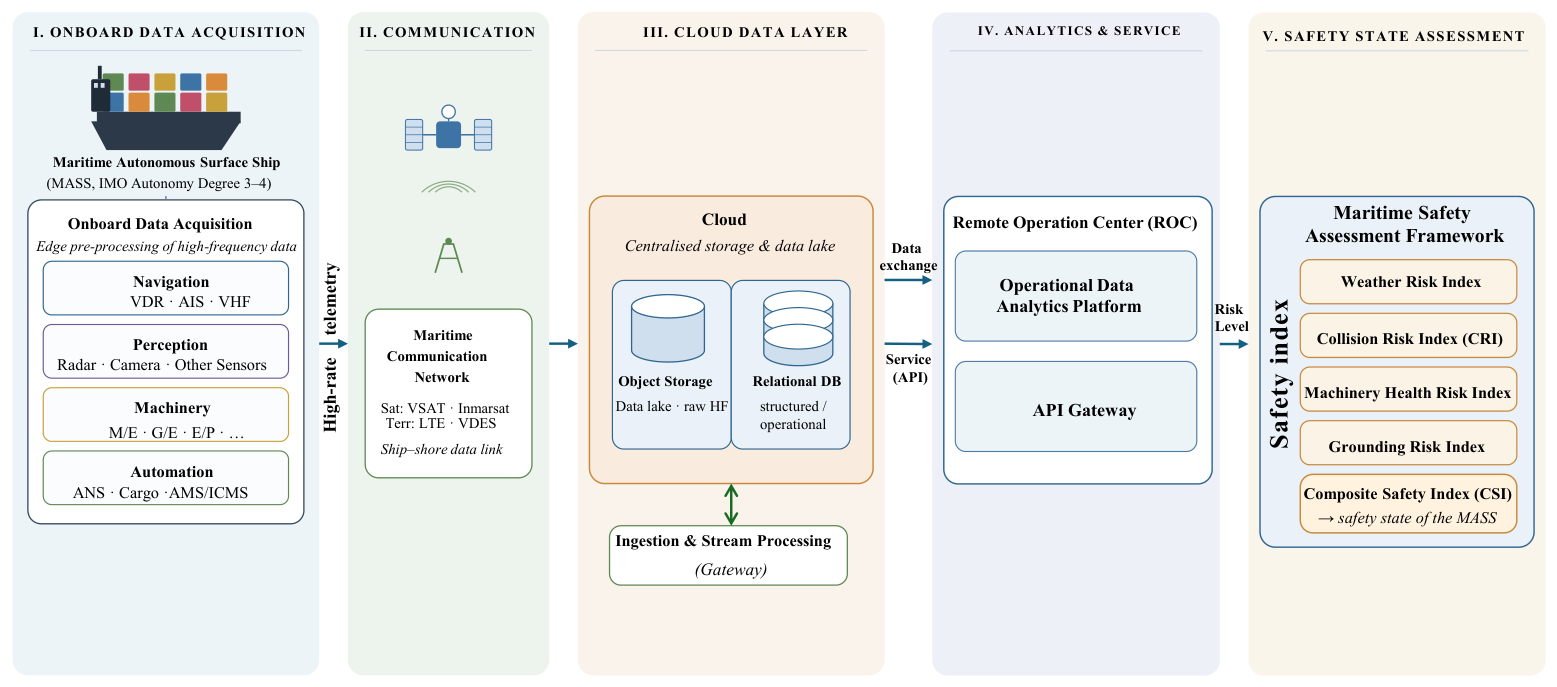
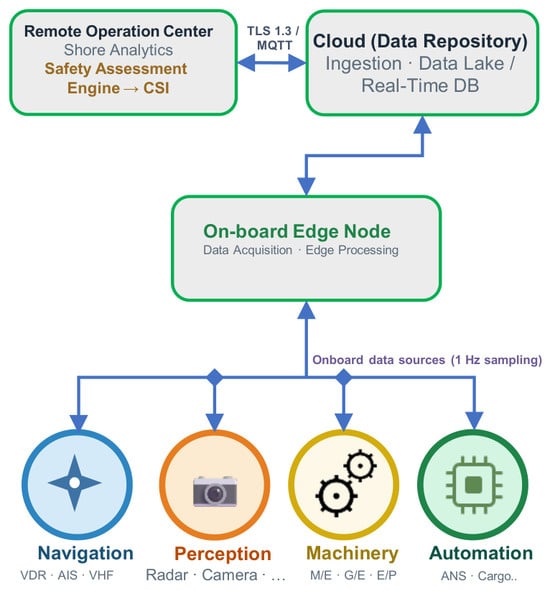
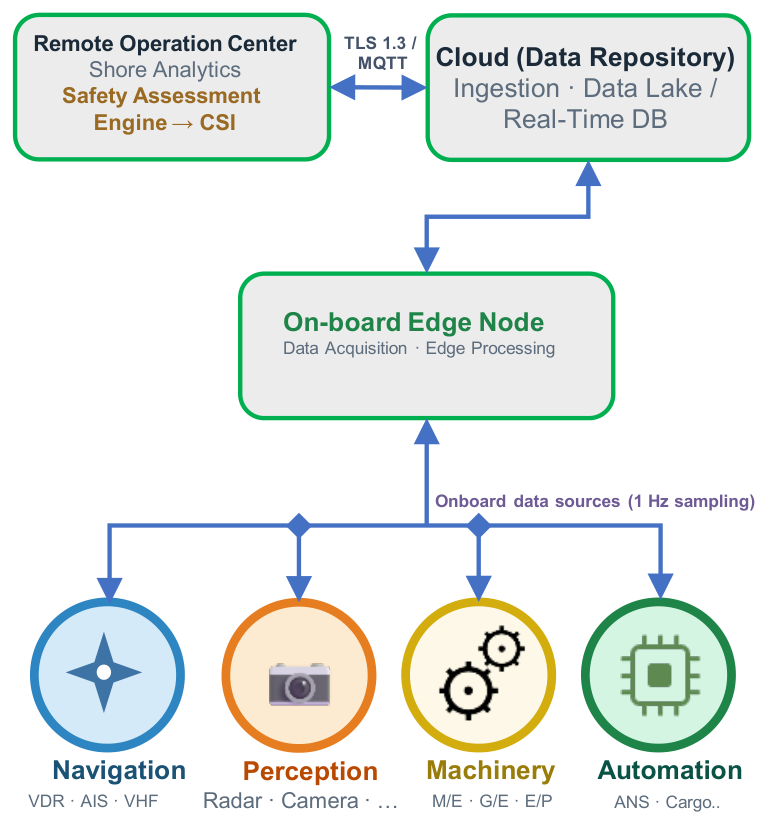
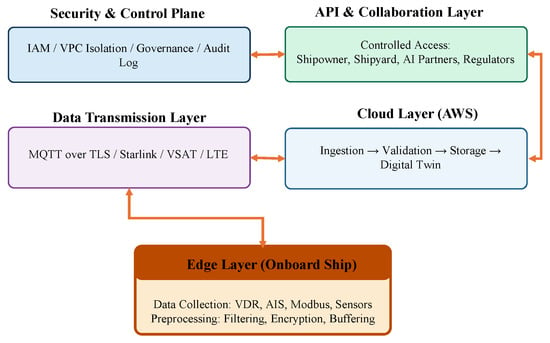
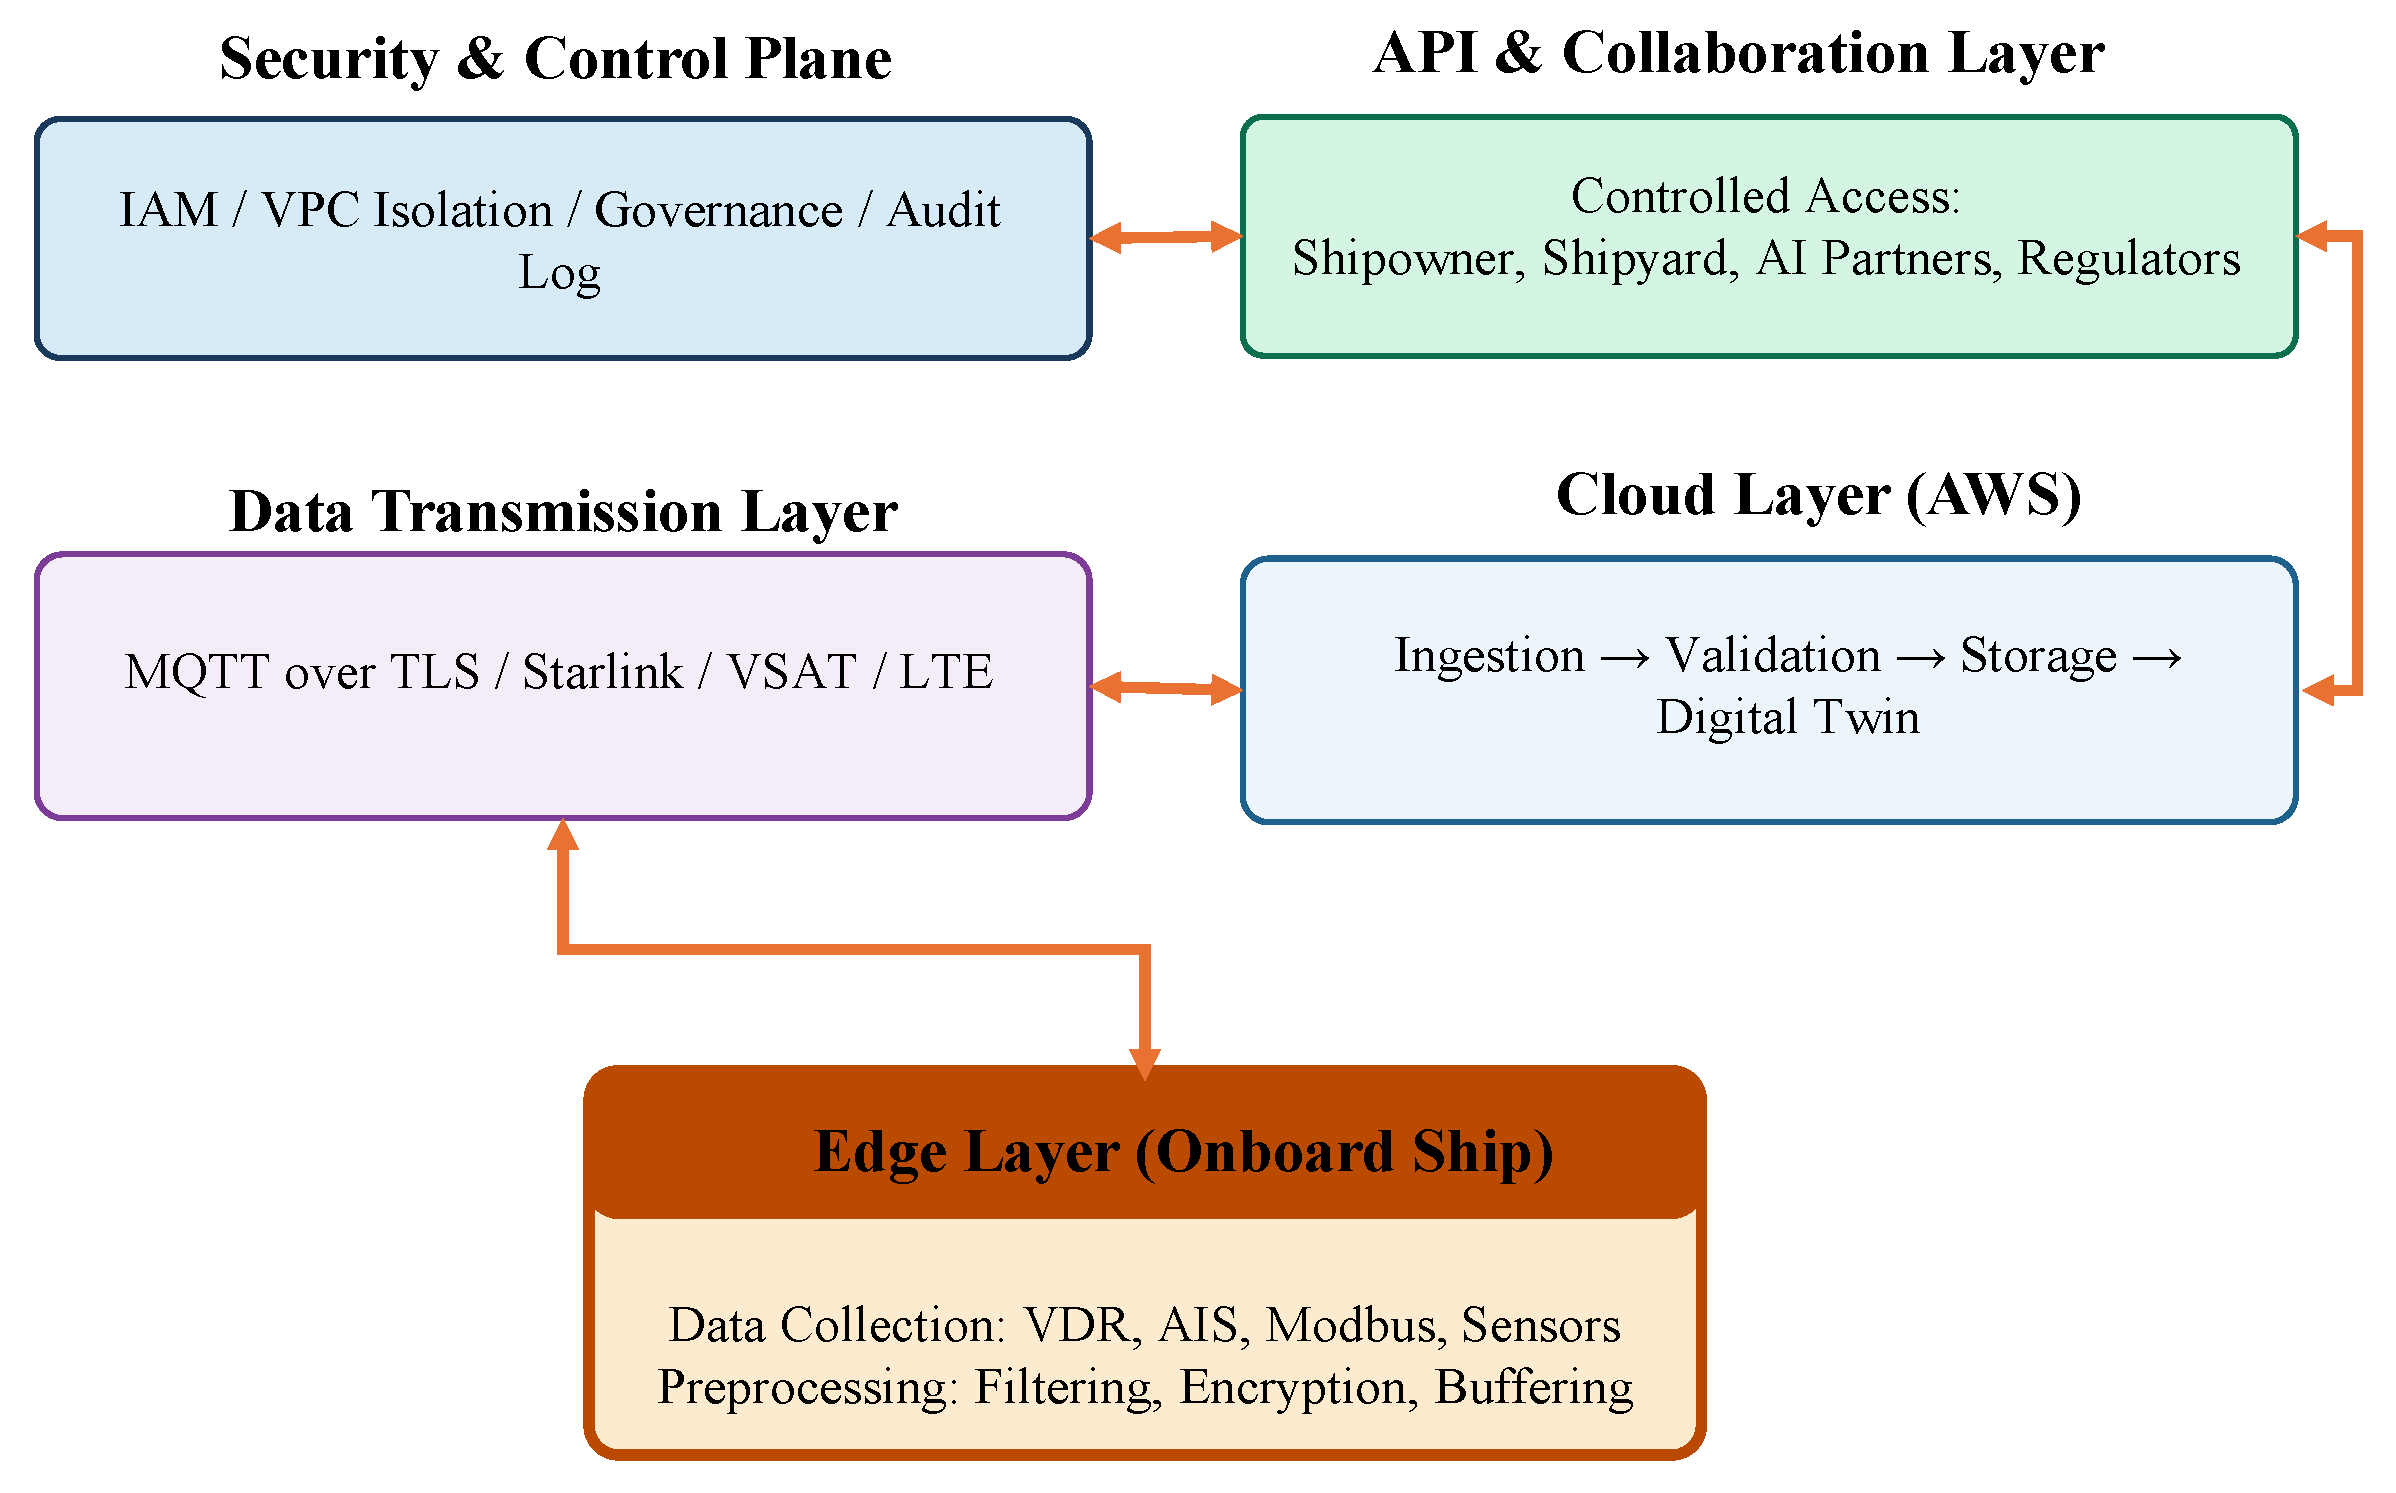
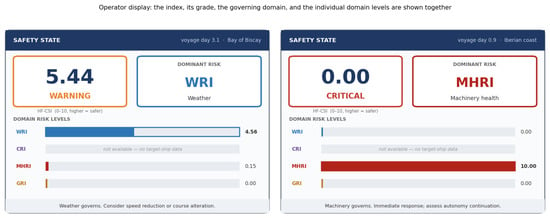
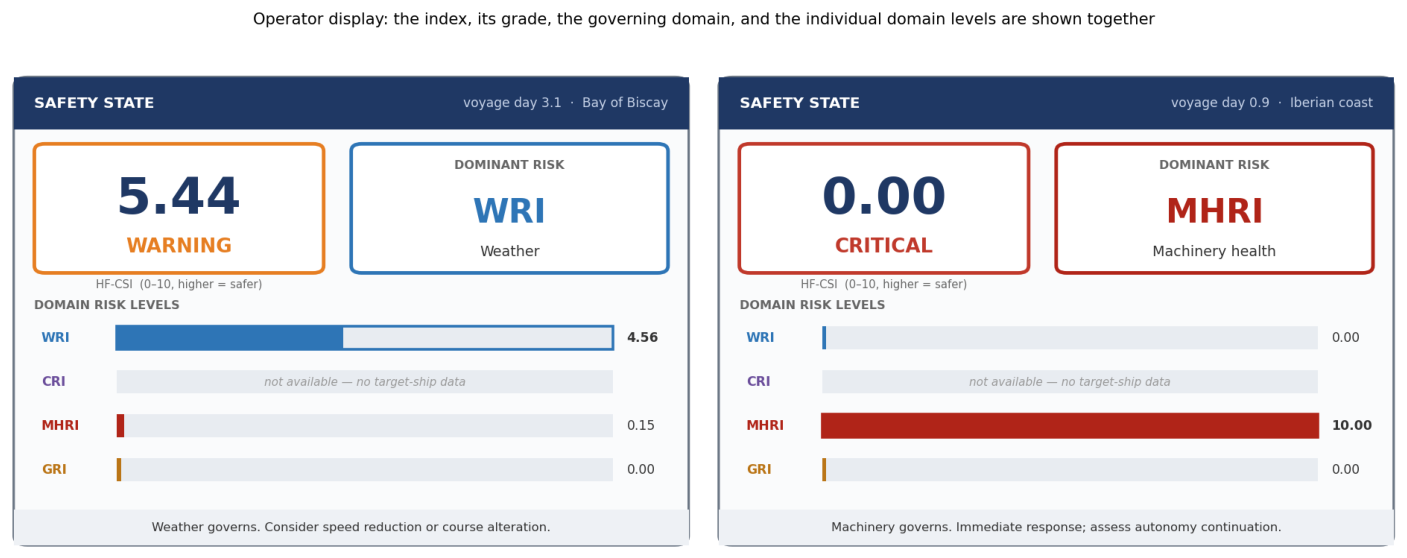
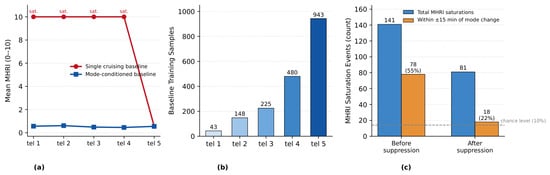
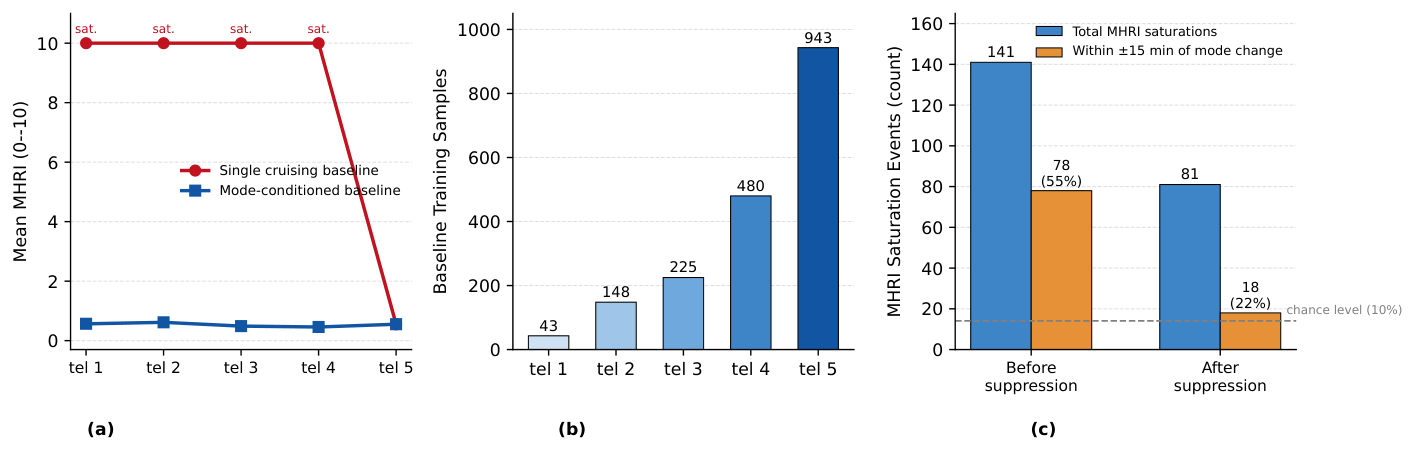
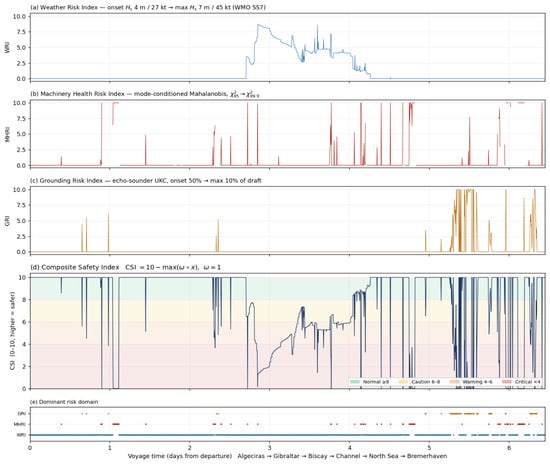
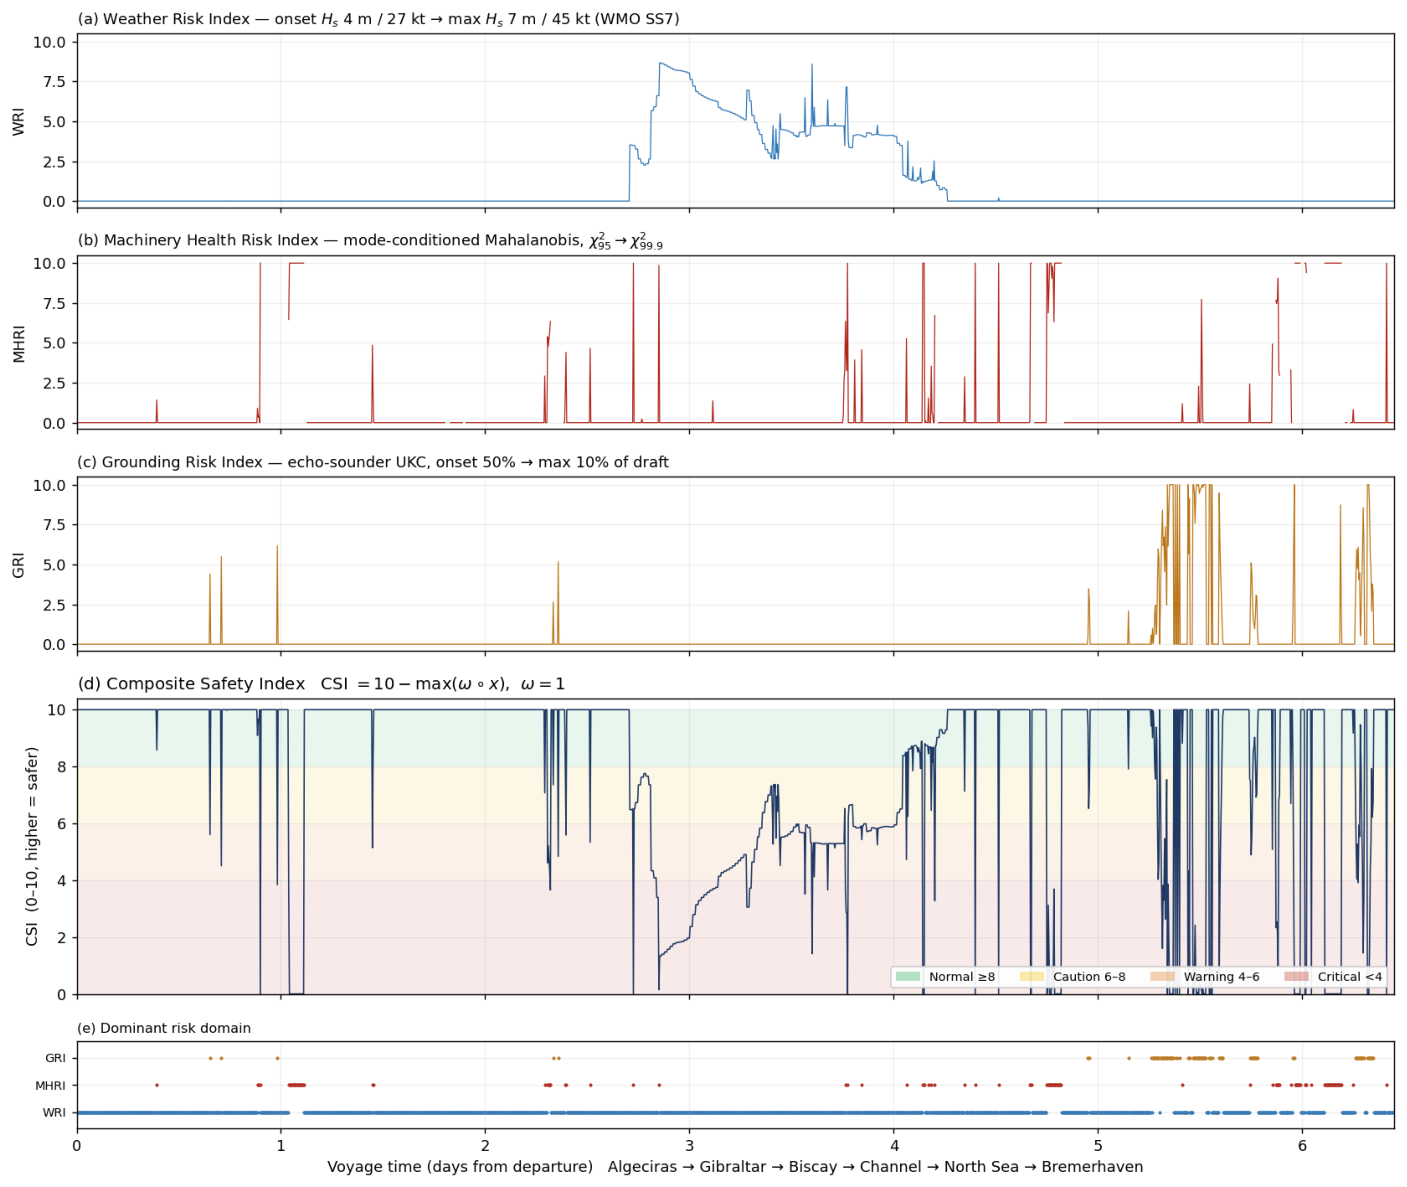
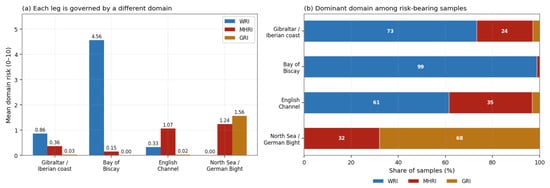
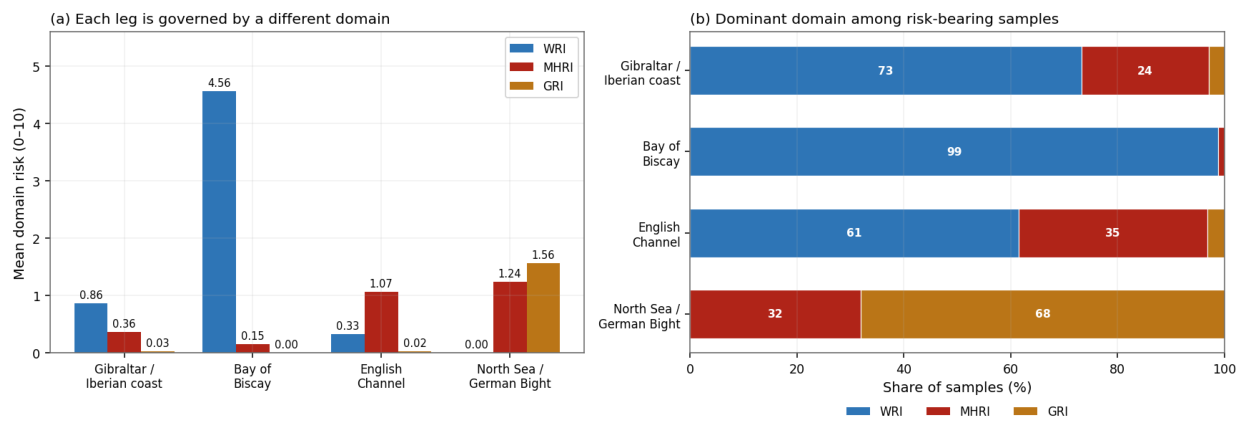
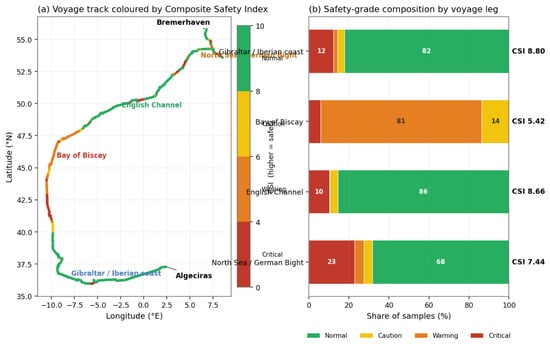
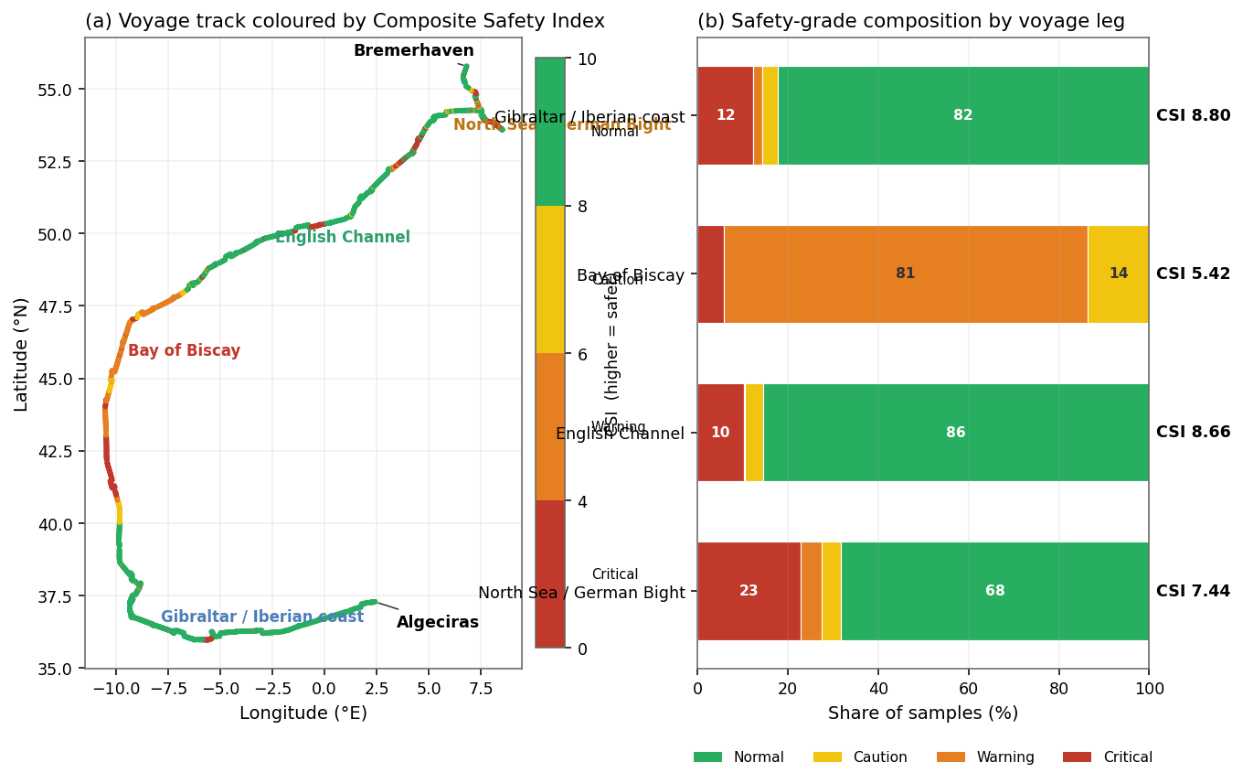
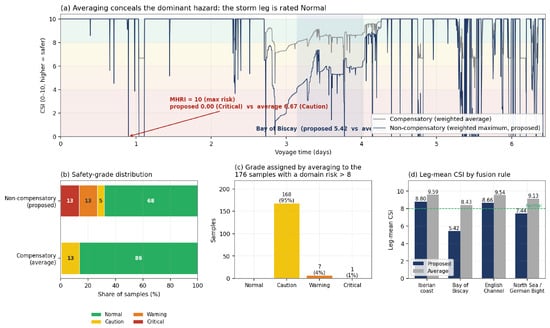
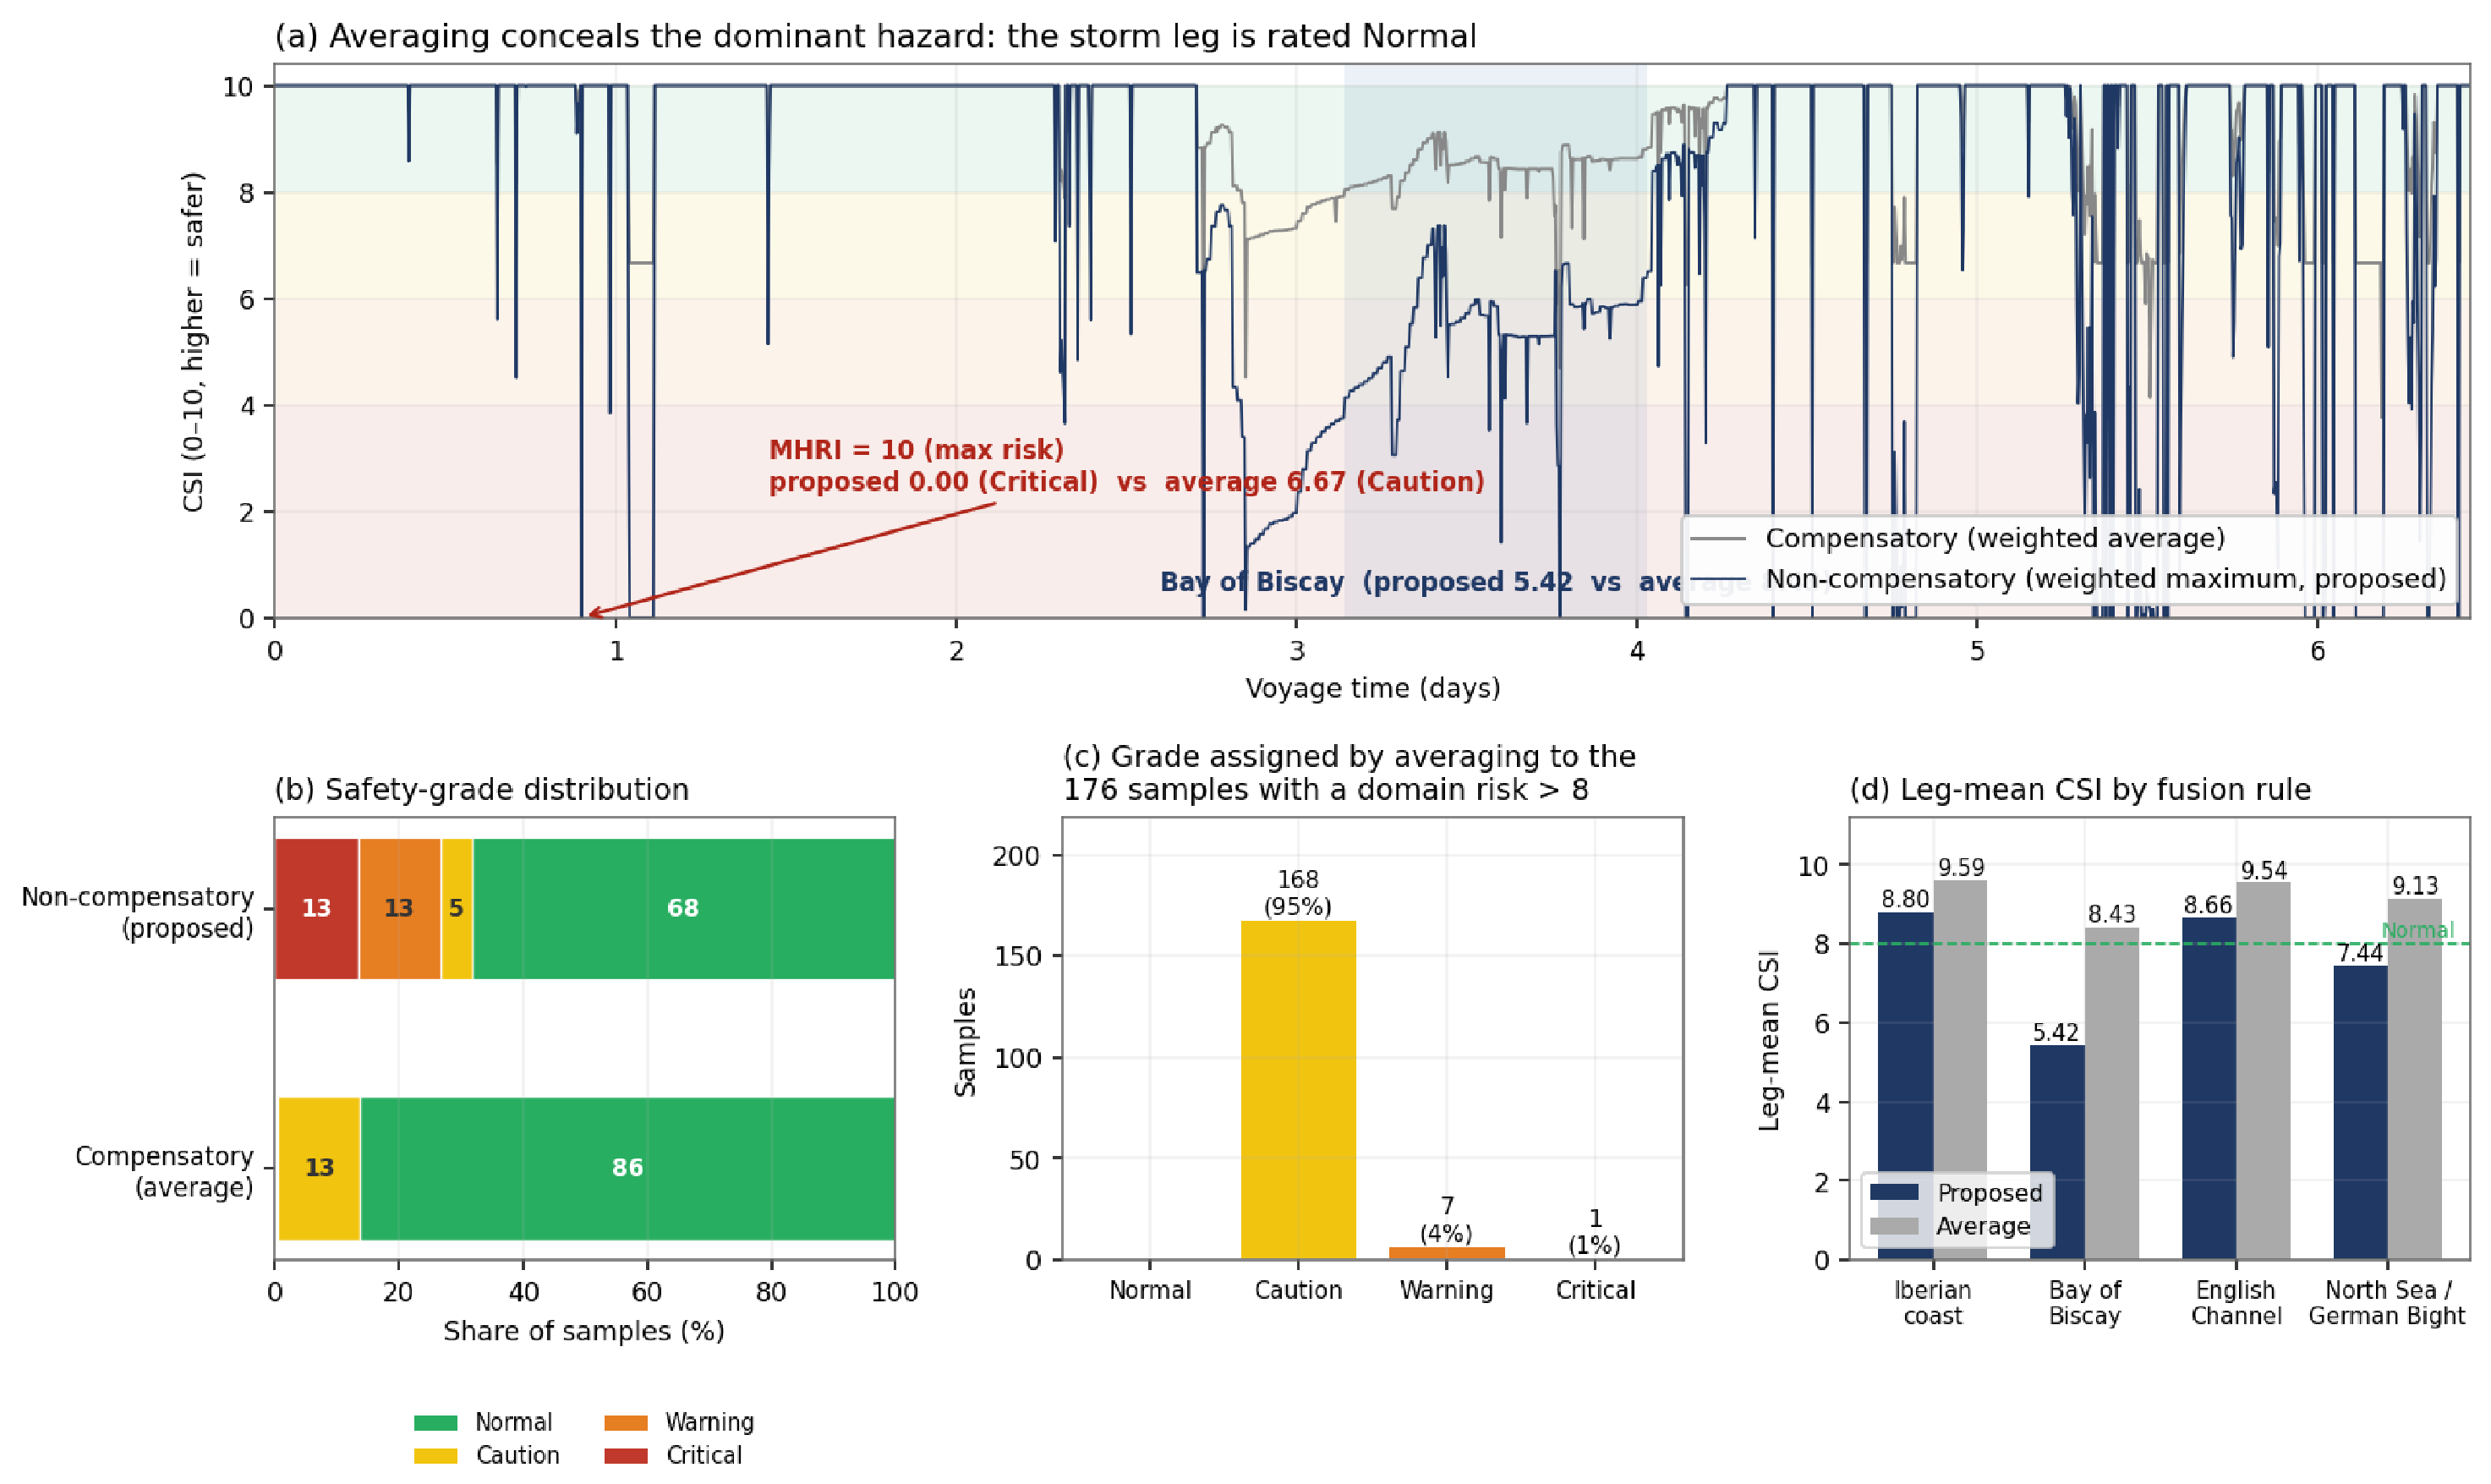
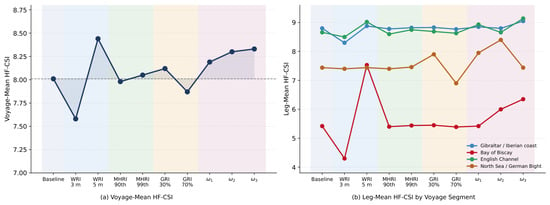
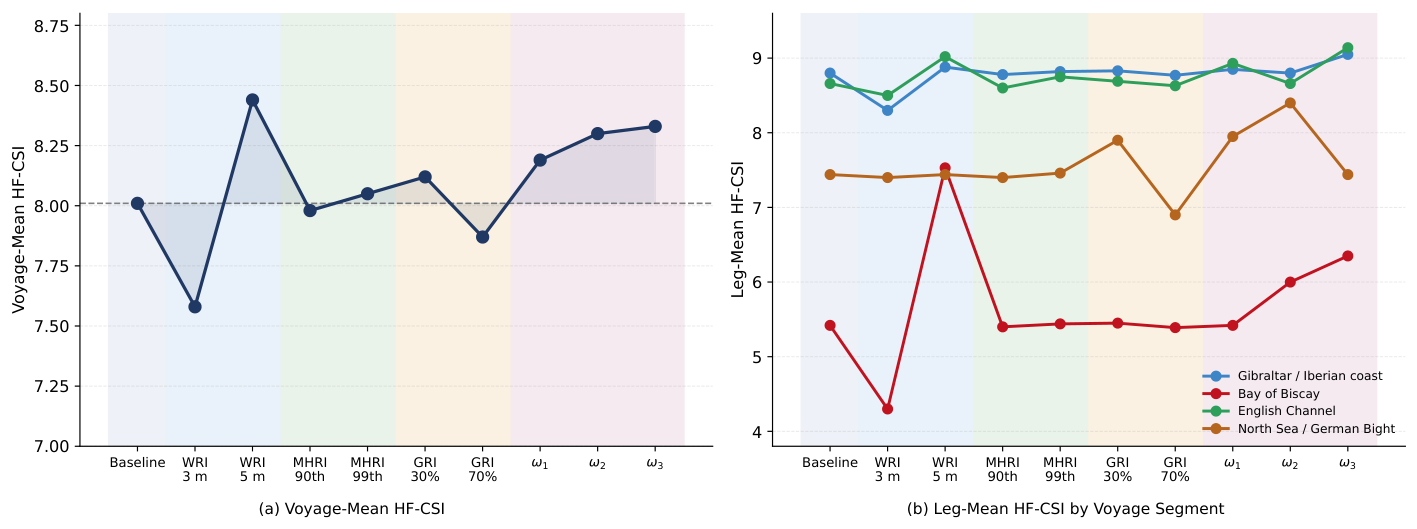
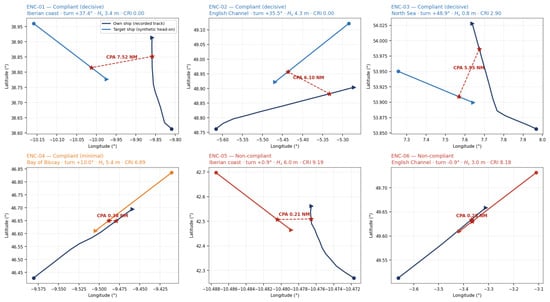
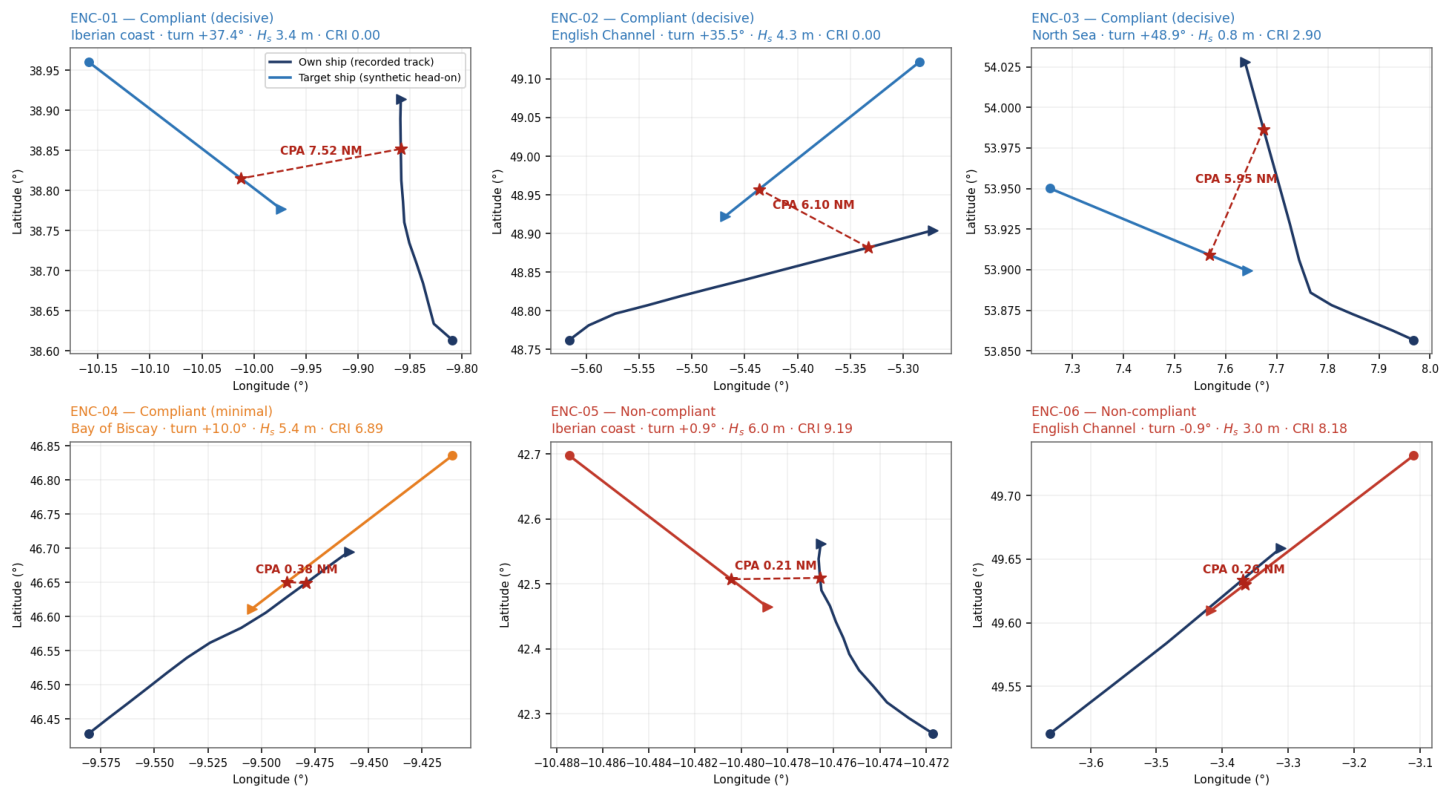
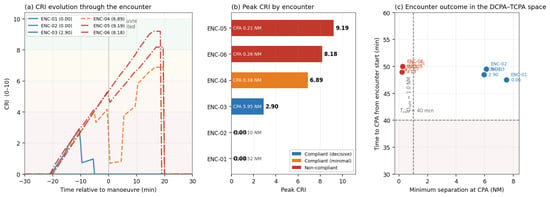
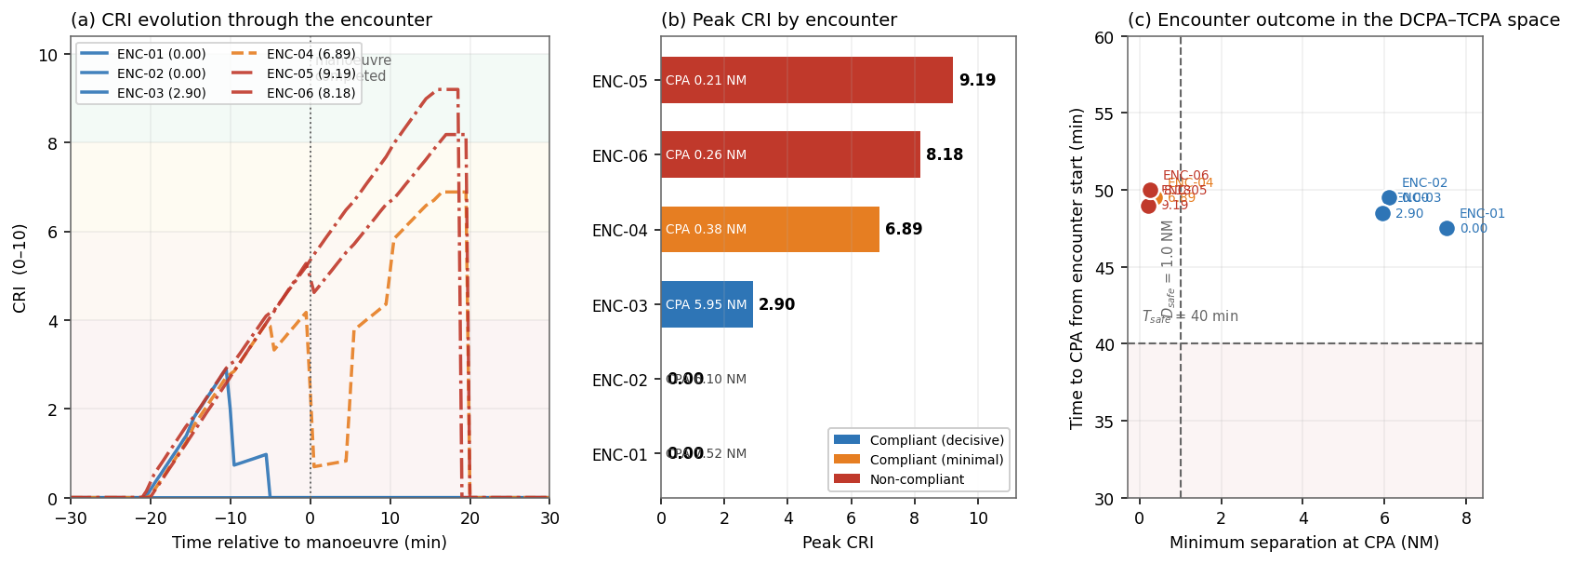
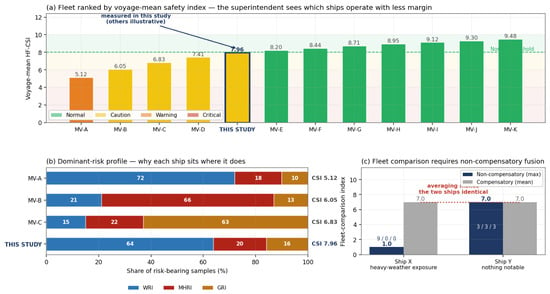
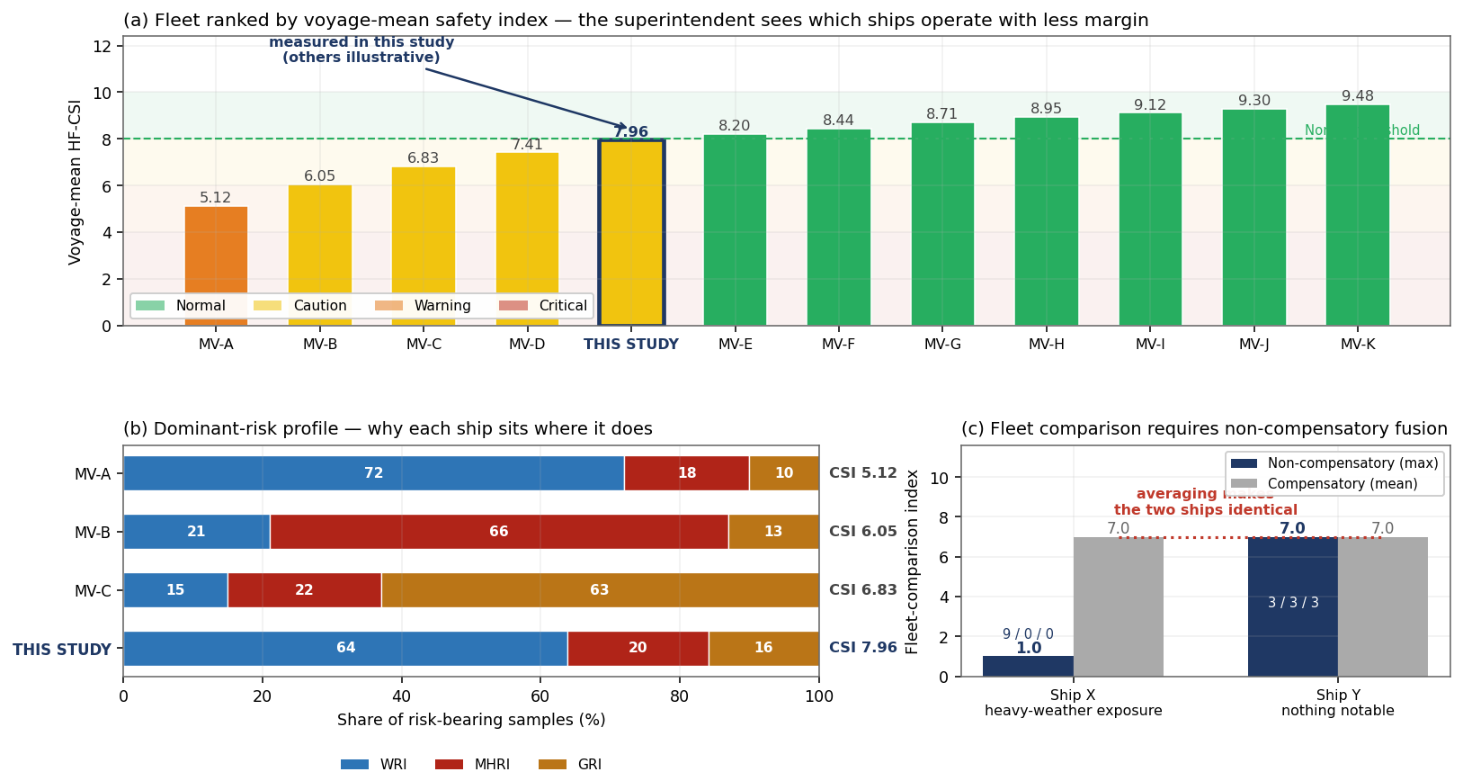

Disclaimer/Publisher’s Note: The statements, opinions and data contained in all publications are solely those of the individual author(s) and contributor(s) and not of MDPI and/or the editor(s). MDPI and/or the editor(s) disclaim responsibility for any injury to people or property resulting from any ideas, methods, instructions or products referred to in the content. |
© 2026 by the authors. Licensee MDPI, Basel, Switzerland. This article is an open access article distributed under the terms and conditions of the Creative Commons Attribution (CC BY) license.