


Abstract
A closed-loop CO2-aeration system, with integrated pH feedback, multiparameter sensing, water circulation, RS485 communication, stainless-steel gas-path valves, and fluorinated vessel interiors, was developed for controlled trace-metal size-fractionation studies in seawater. Representative archived seawater records showed mean pH values of 8.042 ± 0.026, 7.528 ± 0.030, and 7.005 ± 0.025 at programmed set points of 8.0, 7.5, and 7.0, respectively. Additionally, its preliminary application to trace-metal (Zn, Cu, Fe, and Mn) size fractionation with sequential pH stages of 8.0, 7.5, and 7.0 was investigated. Zn, Cu, Fe, and Mn were measured by inductively coupled plasma mass spectrometry (ICP–MS) in the <0.45 μm, <0.2 μm, and <100 kDa fractions. Lower pH was associated with higher mean <0.45 μm concentrations of all four metals, with the largest relative increase for Mn and the smallest for Fe. Cu and Zn showed increased contributions from the <100 kDa fraction, whereas the Fe contribution in this fraction decreased relative to pH 8.0. Mn shifted from an intermediate-size-dominated distribution to a larger-size-dominated distribution and then to a <100 kDa-dominated distribution. These preliminary observations illustrate the additional information provided by operational size fractionation. The platform supports proof-of-concept studies; independent incubation replication, whole-system metal blanks, and further controller validation are required for quantitative mechanistic applications.
1. Introduction
Anthropogenic greenhouse-gas emissions are warming the climate and changing the marine environment. Ocean acidification (OA) is a major CO2-related stressor that accompanies this warming. The ocean absorbs roughly one quarter to one third of anthropogenic CO2 emissions. This uptake slows the accumulation of atmospheric CO2 but alters seawater carbonate chemistry, lowers pH, and reduces calcium carbonate saturation [1]. An updated OceanSODA-ETHZ global gridded carbonate-system product indicates a global mean surface-ocean pH decline of 0.0166 ± 0.0010 units per decade during 1982–2021 [2]. A mapped dataset of surface-ocean acidification indicators provides a regional perspective across large marine ecosystems of the United States [3]. In the North Yellow Sea, reconstruction of subsurface pH and aragonite saturation state during 1976–2017 links intensified summertime bottom-water acidification to respiration beneath seasonal stratification [4]. A revised planetary-boundary assessment concluded that, by 2020, mean global-ocean conditions had entered the boundary’s uncertainty range. The revised threshold corresponds to a 10% decline from the pre-industrial global mean aragonite saturation state. More than 40% of surface waters and up to 60% of waters to 200 m had crossed the revised threshold [5]. Geological records indicate that both the rate and magnitude of ongoing acidification are unusual relative to past Earth-system change [6]. Ocean acidification impairs calcification and disrupts carbonate cycling; experiments show that elevated partial pressure of CO2 (pCO2) reduces calcification rates in planktonic calcifiers and increases the occurrence of malformed structures [7]. Coastal and estuarine waters are especially vulnerable. Upwelling, terrestrial inputs, eutrophication, respiration, and hypoxia add substantial seasonal and short-term variability to the long-term anthropogenic trend, resulting in recurrent low-pH and corrosive events [8,9,10].
In marine ecosystems, trace metals such as Zn, Cu, Fe, and Mn are essential micronutrients for photosynthetic electron transport, respiration, nitrogen fixation, and antioxidant defense in phytoplankton. By regulating nutrient limitation and community composition, these metals influence primary production and biogeochemical cycling. At locally elevated concentrations, however, reactive species may also be toxic [11,12,13]. Their bioavailability and environmental behavior depend not only on total concentration but also on chemical speciation among free ions, inorganic complexes, organic-ligand complexes, and colloidal or particle-bound forms. Recent syntheses indicate that organic complexation dominates the speciation of many biologically active trace metals, particularly Fe, Cu, and Zn. Multiple ligand classes, sometimes with slow exchange kinetics, regulate metal solubility, reactivity, scavenging, transport, and bioavailability [14,15]. This interpretation is consistent with the free-ion activity model and the biotic ligand model. In both models, biological responses are governed more directly by reactive species that can interact with biological receptors than by total dissolved concentration [16,17]. Ocean acidification can alter chemical speciation by changing the relative importance of inorganic ligands such as CO32− and OH−. This changes the proportions of inorganic complexes, hydrolyzed species, and free ions. Lower pH also changes the protonation of functional groups on organic ligands and their competition for binding sites. The resulting shift in the balance between inorganic and organic complexation may redistribute metals between strongly complexed, relatively inert pools and more reactive pools. Acidification may also alter the surface charge and aggregation stability of colloids and nanoparticles, promoting exchange between colloidal and low-molecular-weight dissolved forms [11,13,18]. Resolving the responses of Zn, Cu, Fe, and Mn at the levels of chemical complexation and operational size partitioning is therefore important for understanding changes in trace-metal mobility, potential bioavailability, and biogeochemical behavior in complex coastal waters.
Previous work shows that acidification can change trace-metal speciation, although the direction and magnitude depend on the metal, ligand pool, and seawater matrix. Coastal mesocosm work demonstrated pH-dependent changes in Fe speciation [19], whereas estuarine and shelf-sea studies showed that organic ligands can buffer or redirect the responses of Fe and Cu [20,21]. Scenario-based calculations likewise predict element-specific shifts between inorganic and organic forms [22]. These findings motivate controlled incubations that connect pH manipulation to operational size partitioning rather than inferring mobility from total concentrations alone. Existing automated platforms provide high-precision pH measurement [23,24,25], programmable pH and temperature regulation [26], direct pCO2 control [27], low-cost parallel pH-stat operation [28], and multichannel CO2 regulation for coral experiments [29]. However, those platforms were not designed around the analytical constraints of trace-metal size fractionation. In particular, potential metal inputs from gas-path materials, the need for contamination-conscious incubation vessels, and the coupling of stable pH manipulation to sequential filtration and ultrafiltration have received limited attention. A platform that integrates these functions is needed to test whether acidification redistributes metals among low-molecular-weight and colloid-associated pools in complex coastal seawater.
Accordingly, this study had three objectives: (1) to describe a closed-loop, multichannel acidification platform configured for trace-metal experiments; (2) to identify its functional differences from the system reported by Zheng et al. [29]; and (3) to apply the platform to compare the operational size distributions of Zn, Cu, Fe, and Mn across pH 8.0, 7.5, and 7.0. The present system combines pH-feedback CO2 delivery, multiparameter monitoring, water circulation, and contamination-conscious gas-path and vessel materials. Its application-specific contribution lies in integrating these control and material-design features with a complete workflow comprising filtration, ultrafiltration, and inductively coupled plasma mass spectrometry (ICP–MS). The application is intended as a functional demonstration of the platform and as an initial assessment of element-specific redistribution; it is not presented as a formal metrological validation or a complete reconstruction of carbonate-system and metal-speciation chemistry.
2. Materials and Methods
2.1. Design Principles and Prototype Testing of the Acidification Simulation System
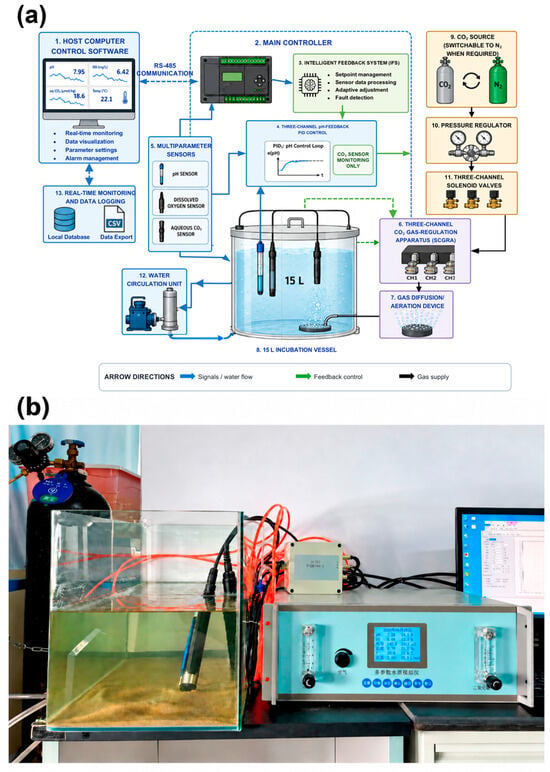
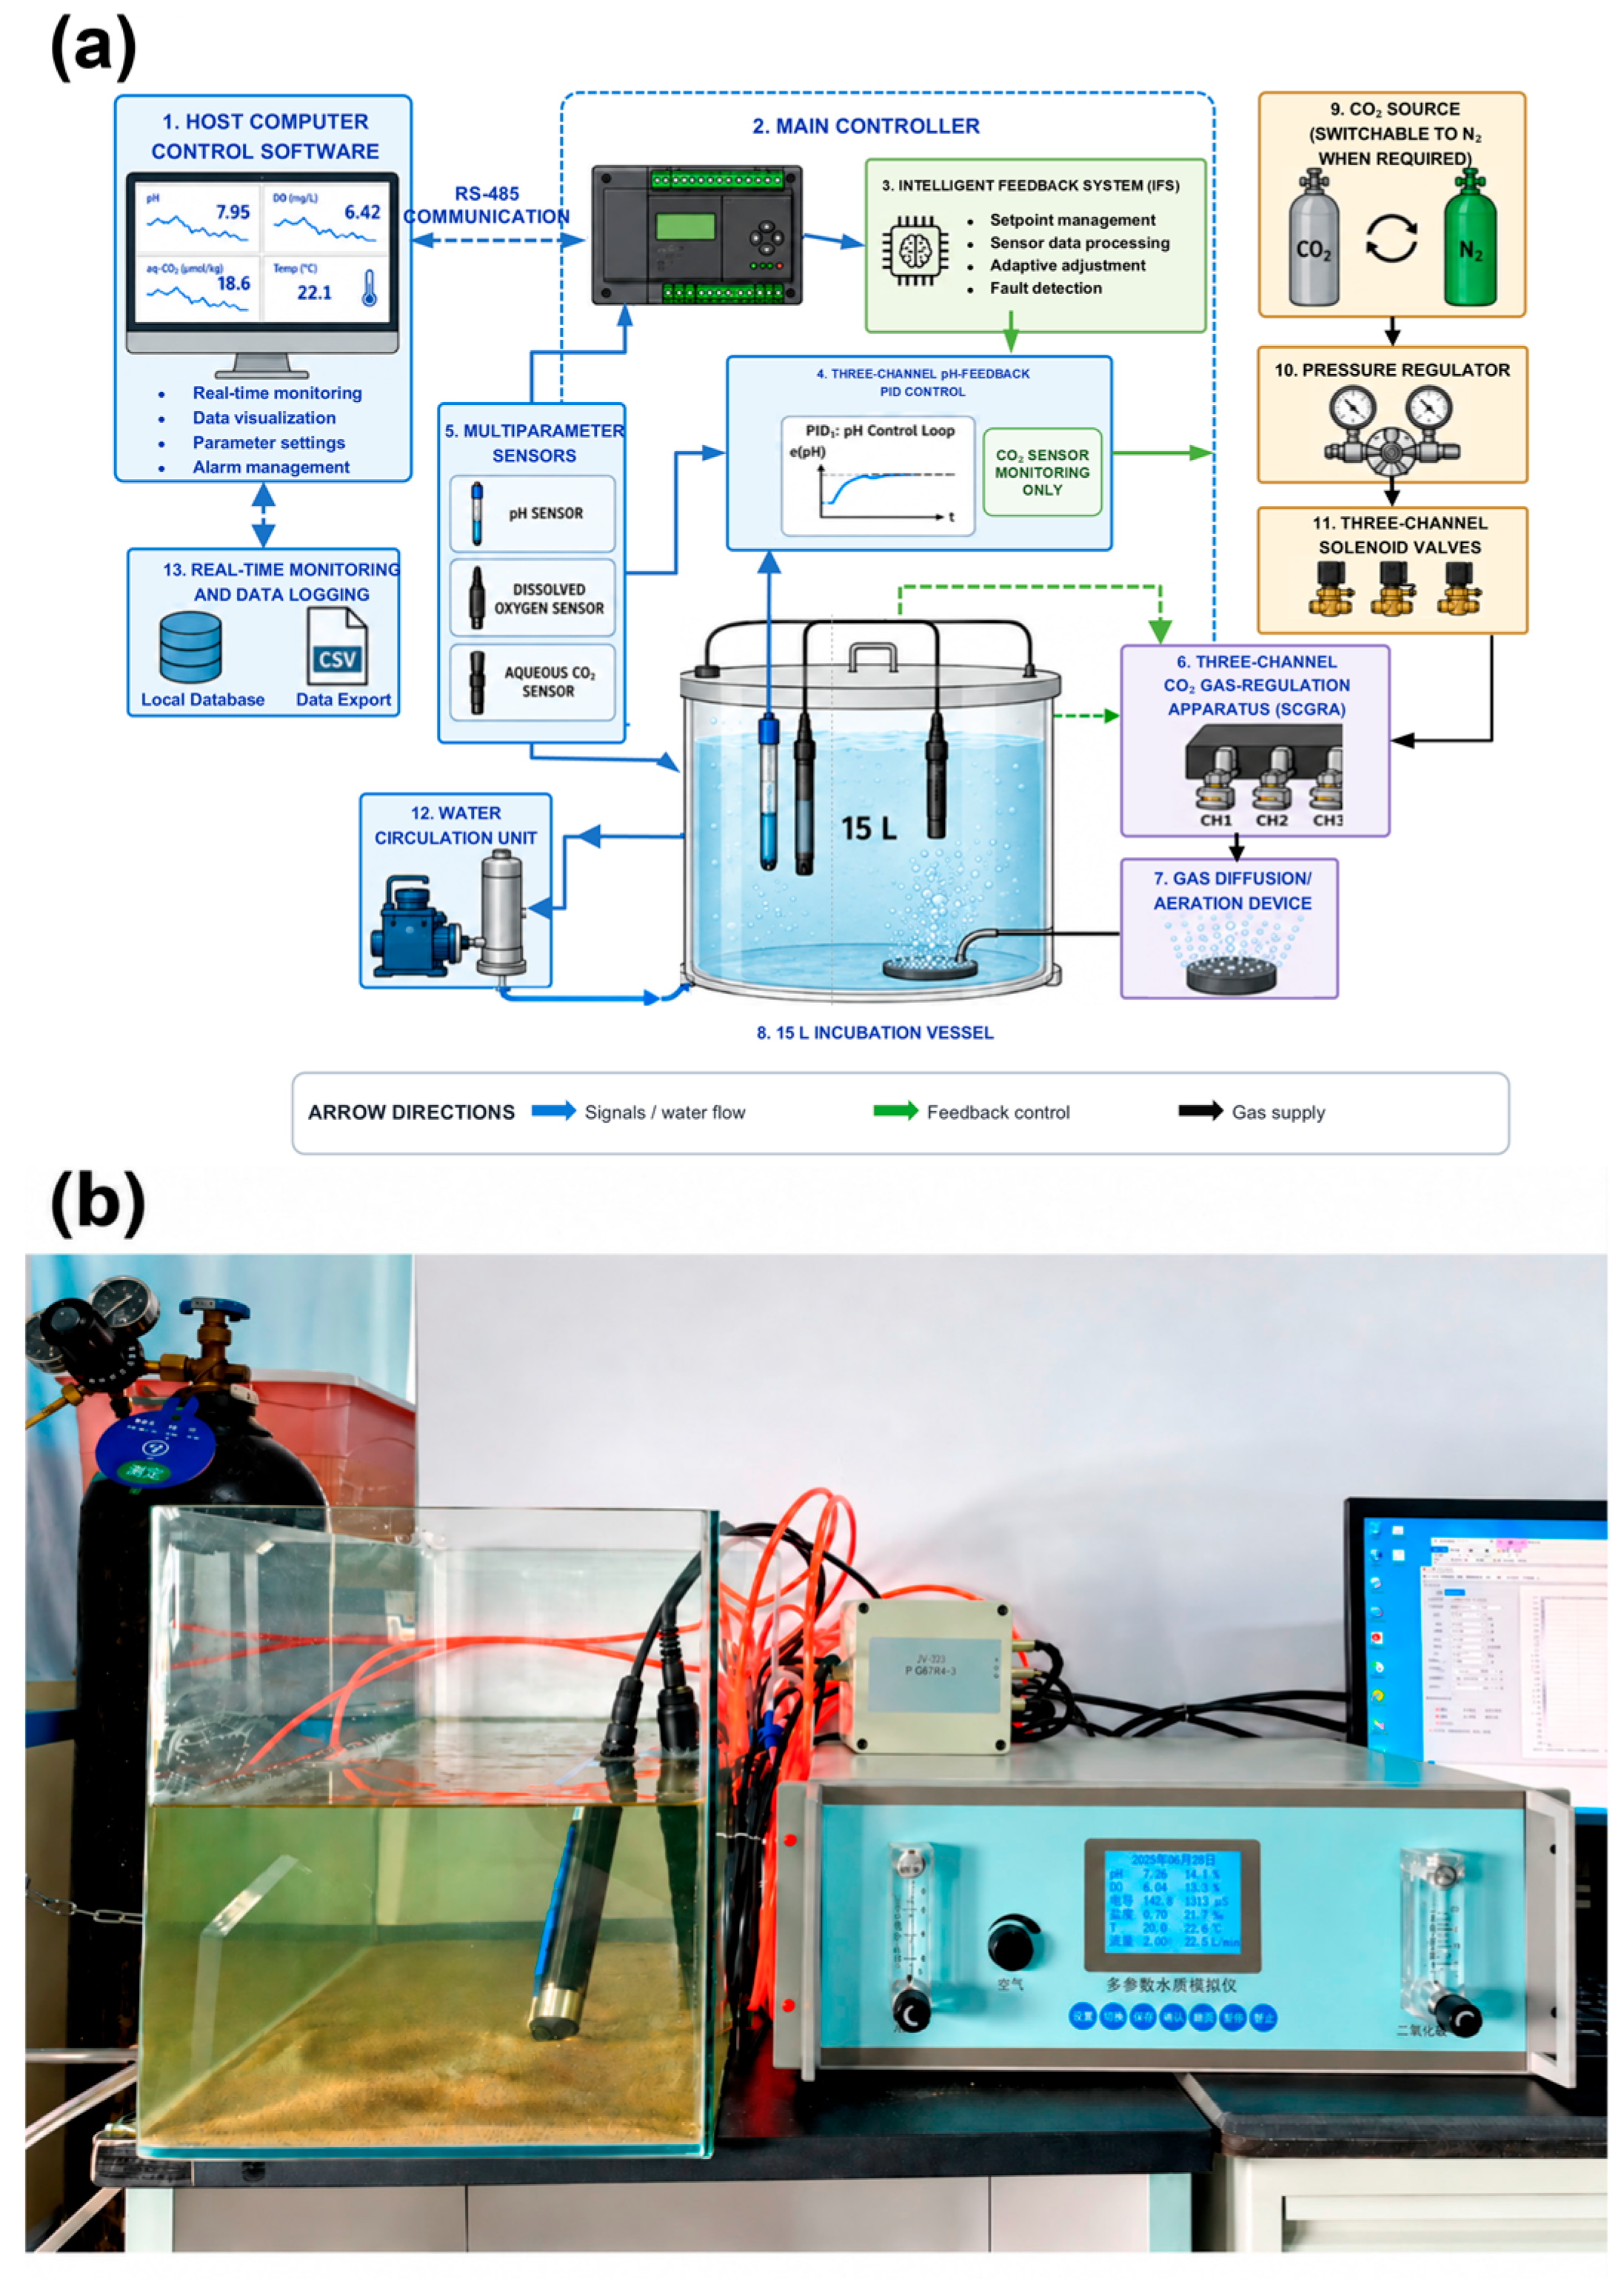
The acidification simulation system comprised host-computer control software(custom-developed software), a main controller (Shenhong Electronic Technology Co., Ltd., Yantai, China), multiparameter sensors (including pH, dissolved oxygen, and aqueous CO2; all from Chemins Sensing Technology Co., Ltd., Hangzhou, China), and a water-circulation unit (YuFeng Electronic Technology Co., Ltd., Shenzhen, China). RS485 communication linked the devices and supported status transmission and data acquisition (Figure 1a). An intelligent feedback system (IFS) for pH controlled a solenoid-based CO2 gas-regulation apparatus (SCGRA). The IFS consisted of a pH controller (YuFeng Electronic Technology Co., Ltd., Shenzhen, China) and a pH probe immersed in the incubation water. The controller received real-time pH measurements and generated the corresponding control output. The SCGRA comprised a CO2 source (switchable to N2 when required), a pressure regulator, gas lines, solenoid valves, and a gas-diffusion/aeration device. Aeration from the bottom of the vessel promoted gas–liquid exchange and adjusted the pH. The system used independent power supplies: direct current for the solenoid valves and alternating current for the controller and host computer.
Figure 1.
Ocean acidification simulation system: (a) schematic of the components and control workflow. Colored frames distinguish functional modules. Arrows indicate signal transmission, feedback control, gas supply, and water-circulation directions. Three independent pH-feedback channels control CO2 delivery; the aqueous-CO2 sensor is used for monitoring only. (b) Photograph of the prototype platform. The Chinese panel labels identify Air (left inlet), Carbon dioxide (right inlet), the Multiparameter water-quality simulator (center), and the controls Settings, Switch, Save, Confirm, Zero, Pause, and Stop. The display fields indicate conductivity, salinity, temperature, and flow. The cylinder tag denotes measurement, and the monitor shows the host-computer control software interface.
The controller used a pH-feedback routine to regulate CO2 delivery through a solenoid valve. The pH controller settings were Kp = 2.000, Ki = 1.000, and Kd = 1.000, with a 60 s control cycle. These parameters were adjusted during preliminary tests of the control speed. At each cycle, measured pH was compared with the programmed set point and the valve command was updated. CO2 bubbling lowered pH; strong acid was not used for incubation pH adjustment. Valve opening had no fixed time limit and could continue across successive control cycles when required by the feedback command. The host computer displayed set points, sensor values, and valve commands.
In addition to pH, the system recorded dissolved oxygen and an online aqueous-CO2 sensor signal to characterize environmental changes during incubation and support operational quality control. The pH time series was evaluated together with trends associated with differences in CO2 input, anomalous drift, and abrupt changes to assess system stability. Because the control objective was to establish and maintain prescribed pH levels, total alkalinity (TA) and dissolved inorganic carbon (DIC) were not independently determined by titration or verification measurements. The other carbonate-system parameters were therefore used only for process monitoring and quality control, not to reconstruct the complete carbonate system quantitatively.
An electrode continuously monitored pH, which served as the closed-loop control variable. Values are reported on the National Bureau of Standards (NBS) scale (pH_NBS) after calibration with standard buffers. The seawater matrix, temperature, and salinity can produce systematic differences among pH scales; therefore, the primary objective was to maintain stable relative pH gradients among treatments. pH_NBS was not converted to the total scale (pH_T), so the reported values represent relative acidification intensity. Without independently measured TA and DIC, the complete carbonate system and treatment pCO2 could not be reconstructed quantitatively; the aqueous-CO2 sensor signal was used for operational monitoring.
Following these design principles, we constructed an ocean acidification simulation system (OASys) prototype with three independently controlled CO2-aeration channels (Figure 1b). The host-computer software coordinated the controllers and managed channel-specific acquisition and storage. Each channel comprised its own pH-feedback loop and valve output, while three RS485 controllers were connected in parallel to one desktop computer for synchronous monitoring. Bottom aeration and water circulation promoted mixing between the sensing point and the bulk water. Because conventional solenoid valves can contain Cu-bearing components, custom stainless-steel valves were used in the gas path to reduce this potential contamination source; the incubation vessels had fluorinated inner surfaces for the same analytical purpose. These design choices were contamination-control measures rather than a quantitative blank-performance claim, because component-specific metal leaching was not measured in the present study.
We established three pH treatments (pH 8.0, 7.5, and 7.0). Incubations were maintained at 25 °C under a 12 h light/12 h dark photoperiod. The pH treatments were selected to span ambient to strongly acidified conditions and to resolve trace-metal size-fractionation responses across a broad experimental gradient. In particular, the pH 7.0 treatment was included as a process-oriented perturbation to examine the response of trace-metal partitioning under strong acidification and should not be interpreted as a direct projection of near-future coastal seawater pH. The low-pH stages were selected to challenge the operating range of the platform and explore operational metal fractionation under strong perturbation. They are not supported here as observed pH conditions in the sampled Yantai surface waters. This broad gradient may be useful for subsequent studies of other biogeochemical constituents, subject to application-specific validation.
The operating sequence was as follows. Before incubation, the pH probe was calibrated with standard buffers, channel set points and controller parameters were entered on the host computer, and gas pressure and circulation were checked. During incubation, each controller acquired pH once per control cycle, updated the valve command, actuated its channel-specific valve, and transferred pH, dissolved-oxygen, aqueous-CO2-sensor, and command data to the host computer. Continuous water circulation and bottom aeration reduced local gradients. If sensor drift or an abrupt excursion was observed, the logged multiparameter record could be used to distinguish a control event from a broader change in water quality. This workflow links pH manipulation directly to the subsequent clean fractionation procedure.
Zheng et al. [29] developed a three-channel, pH-feedback CO2 delivery system for coral physiological experiments and reported pH control within approximately ±0.02 units during a 15-day test. Although both systems use a multichannel pH-feedback architecture, the present platform was configured specifically for trace-metal size-fractionation studies. It couples pH manipulation with sequential filtration, ultrafiltration, and ICP–MS analysis and uses feedback-controlled CO2 aeration. The platform also incorporates dissolved-oxygen and aqueous-CO2 monitoring, water circulation combined with bottom aeration, custom stainless-steel gas-path valves, and fluorinated vessel interiors to reduce potential contamination during trace-metal experiments. Operation at programmed pH values of 8.0, 7.5, and 7.0 demonstrated the functional applicability of the complete experimental workflow. However, although archived records permit descriptive estimates of pH dispersion, response time, overshoot, drift, and between-channel reproducibility were not formally validated; therefore, the comparison identifies differences in experimental purpose and system configuration without implying superior metrological performance.
Zheng et al. [29] is the closest direct comparator because its three-channel pH-feedback CO2-delivery architecture resembles this prototype. References [23,24,25,26,27,28] provide the wider context of measurement and regulation strategies. The present evidence supports integration for a particular analytical application and does not demonstrate better performance than these earlier systems.
2.2. Sample Collection and Processing
Surface seawater was collected at a depth of 0.5 m from coastal waters near Yantai in June 2025. The sampling site was near an aquaculture area within a marine ranching zone. Immediately after collection, the sample bottles were enclosed in two polyethylene bags and transported in an insulated container at approximately 4 °C. Within 2 h of arrival at the laboratory, the samples were transferred to 15 L incubation vessels with fluorinated inner surfaces. The OASys platform was used to maintain the target pH of each treatment (8.0, 7.5, or 7.0) through closed-loop control, while pH and other water-quality parameters were continuously recorded. Initial seawater temperature was 20.1 °C, measured by the integrated temperature sensor, and salinity was 33.45 PSU, measured using a YSI sensor (YSI Incorporated, Yellow Springs, OH, USA). Nutrient concentrations and dissolved organic carbon were not measured. The experiment comprised one run in which seawater in one vessel was sequentially adjusted to pH 8.0, 7.5, and 7.0. After stabilization, each target condition was maintained overnight for approximately 16 h before sampling. At each stage, three parallel subsamples were independently filtered and ultrafiltered. These are within-run sampling and processing replicates, not independent incubation replicates; pH and exposure sequence are consequently confounded.
Samples were fractionated according to particle size and molecular weight using syringe filters and Macrosep® centrifugal ultrafiltration devices with a 100 kDa molecular-weight cutoff (MWCO; Pall Laboratory, Port Washington, NY, USA), following established procedures for dissolved and colloidal trace-metal fractionation with minor modifications [30,31]. Centrifugation was performed using a Velocity 14R centrifuge (Dynamica, Clayton, Victoria, Australia, Australia). To minimize background contamination, each ultrafiltration unit was sequentially rinsed with 10 mL of 0.05 mol L−1 NaOH, 10 mL of 0.02 mol L−1 HCl, and 10 mL of ultrapure water, and this cleaning procedure was repeated 5–10 times before use. A 15 mL aliquot of the <0.45 μm prefiltered sample was then loaded into the ultrafiltration unit and centrifuged at 3600 rpm for 10 min at 4 °C, until the retentate volume was ≤0.5 mL.
The ultrafiltrate was operationally defined as the <100 kDa fraction. The <0.45 μm fraction, defined as the total dissolved (TD) pool, and the <0.2 μm fraction were collected separately. A 0.5 mL aliquot of each fraction was diluted to 10 mL with 0.5 mol L−1 HNO3. All processed samples were allowed to equilibrate at room temperature (approximately 25 °C) for at least 48 h before instrumental analysis.
This study focused on the dissolved pool (<0.45 μm) and its redistribution among operationally defined size and molecular-weight fractions. Metal concentrations were directly measured in the <0.45 μm, <0.2 μm, and <100 kDa fractions. The 0.2–0.45 μm and 100 kDa–0.2 μm fractions were calculated by concentration difference as follows: 0.2–0.45 μm = (<0.45 μm) − (<0.2 μm), and 100 kDa–0.2 μm = (<0.2 μm) − (<100 kDa). Thus, the term “dissolved” throughout this study refers operationally to material passing through a 0.45 μm filter. The >0.45 μm particulate fraction was not directly measured. Intermediate fractions were calculated separately for each matched parallel subsample before calculating the mean and sample standard deviation (SD, n = 3). This preserves the covariance between the paired concentrations used in subtraction. Difference-derived values may be negative when measurement variability exceeds a small fraction contribution; these values were retained and are not interpreted as physical negative concentrations or complete disappearance.
2.3. Metal Determination and Data Analysis
Metal concentrations in the filtered samples and ultrafiltrates were determined following established ICP–MS procedures for dissolved and colloidal trace metals in coastal and estuarine waters [30,31]. Before instrumental analysis, samples were acid-extracted with 0.5 mol L−1 HNO3 and analyzed using an ELAN DRC II inductively coupled plasma mass spectrometer (ICP–MS; PerkinElmer, Shelton, CT, USA PerkinElmer, USA). The instrument was equipped with nickel sampler and skimmer cones, and 0.19 μmol L−1 rhodium (Rh) was added to each sample as an internal standard. High-purity argon (99.999%) was used as the plasma gas. The optimized plasma gas, nebulizer gas, and auxiliary gas flow rates were 15.0, 0.88, and 1.2 L min−1, respectively. These operating conditions followed the trace-metal analytical procedure reported by Luan et al. [30].
Calibration curves were established before analysis and checked after every 30 samples. Each prepared ICP–MS solution was measured in triplicate for technical precision; these instrument readings were not counted as independent experimental replicates. Method blanks, parallel samples, and matrix-spiked samples were included for quality control. The instrument detection limits (IDLs) for Fe, Mn, Cu, and Zn were 0.027, 0.049, 0.008, and 0.019 μg L−1, respectively. The corresponding method detection limits (MDLs) were 0.094, 0.106, 0.032, and 0.072 μg L−1, respectively. The relative standard deviation (RSD) values below describe variability among three separately processed parallel subsamples and do not quantify instrument-only precision.
Across the three pH stages, RSD ranges for <100 kDa, <0.2 μm, and <0.45 μm, respectively, were Cu: 4.40–19.91%, 4.07–20.03%, 2.69–10.68%; difference-derived fractions, 45.13–181.29% and 6.87–751.42%; Fe: 0.82–0.95%, 0.51–3.00%, 0.56–5.55%; difference-derived fractions, 2.45–105.16% and 2.08–99.28%; Mn: 0.69–19.41%, 0.31–5.81%, 0.36–8.61%; difference-derived fractions, 1.17–21.27% and 0.78–459.40%; Zn: 0.74–5.62%, 0.60–1.91%, 0.35–4.13%; difference-derived fractions, 2.62–62.26% and 1.61–8.50%. The two difference-derived ranges refer to 100 kDa–0.2 μm and 0.2–0.45 μm, respectively. Large relative variability in near-zero fractions reflects the small denominator and subtraction sensitivity. No inferential comparison among pH stages was performed because there was only one sequential experimental run.
For data analysis, the <0.45 μm fraction was operationally defined as the total dissolved pool. The proportional contributions of the <100 kDa, 100 kDa–0.2 μm, and 0.2–0.45 μm fractions to the total dissolved pool were calculated to characterize acidification-induced redistribution among operational size and molecular-weight fractions. This operational size-fractionation approach is consistent with recent studies of trace-metal partitioning in estuarine and coastal waters [30,31]. Concentrations are reported primarily in nmol L−1. The original mass concentrations (μg L−1) were converted to nmol L−1 using the atomic molar masses. Results are summarized as mean ± sample SD of the three parallel subsamples. Fraction shares were calculated from the mean fraction concentration divided by the mean <0.45 μm concentration.
3. Results and Discussion
3.1. Functional Demonstration of the Acidification Simulation System
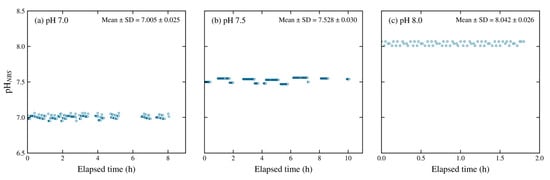
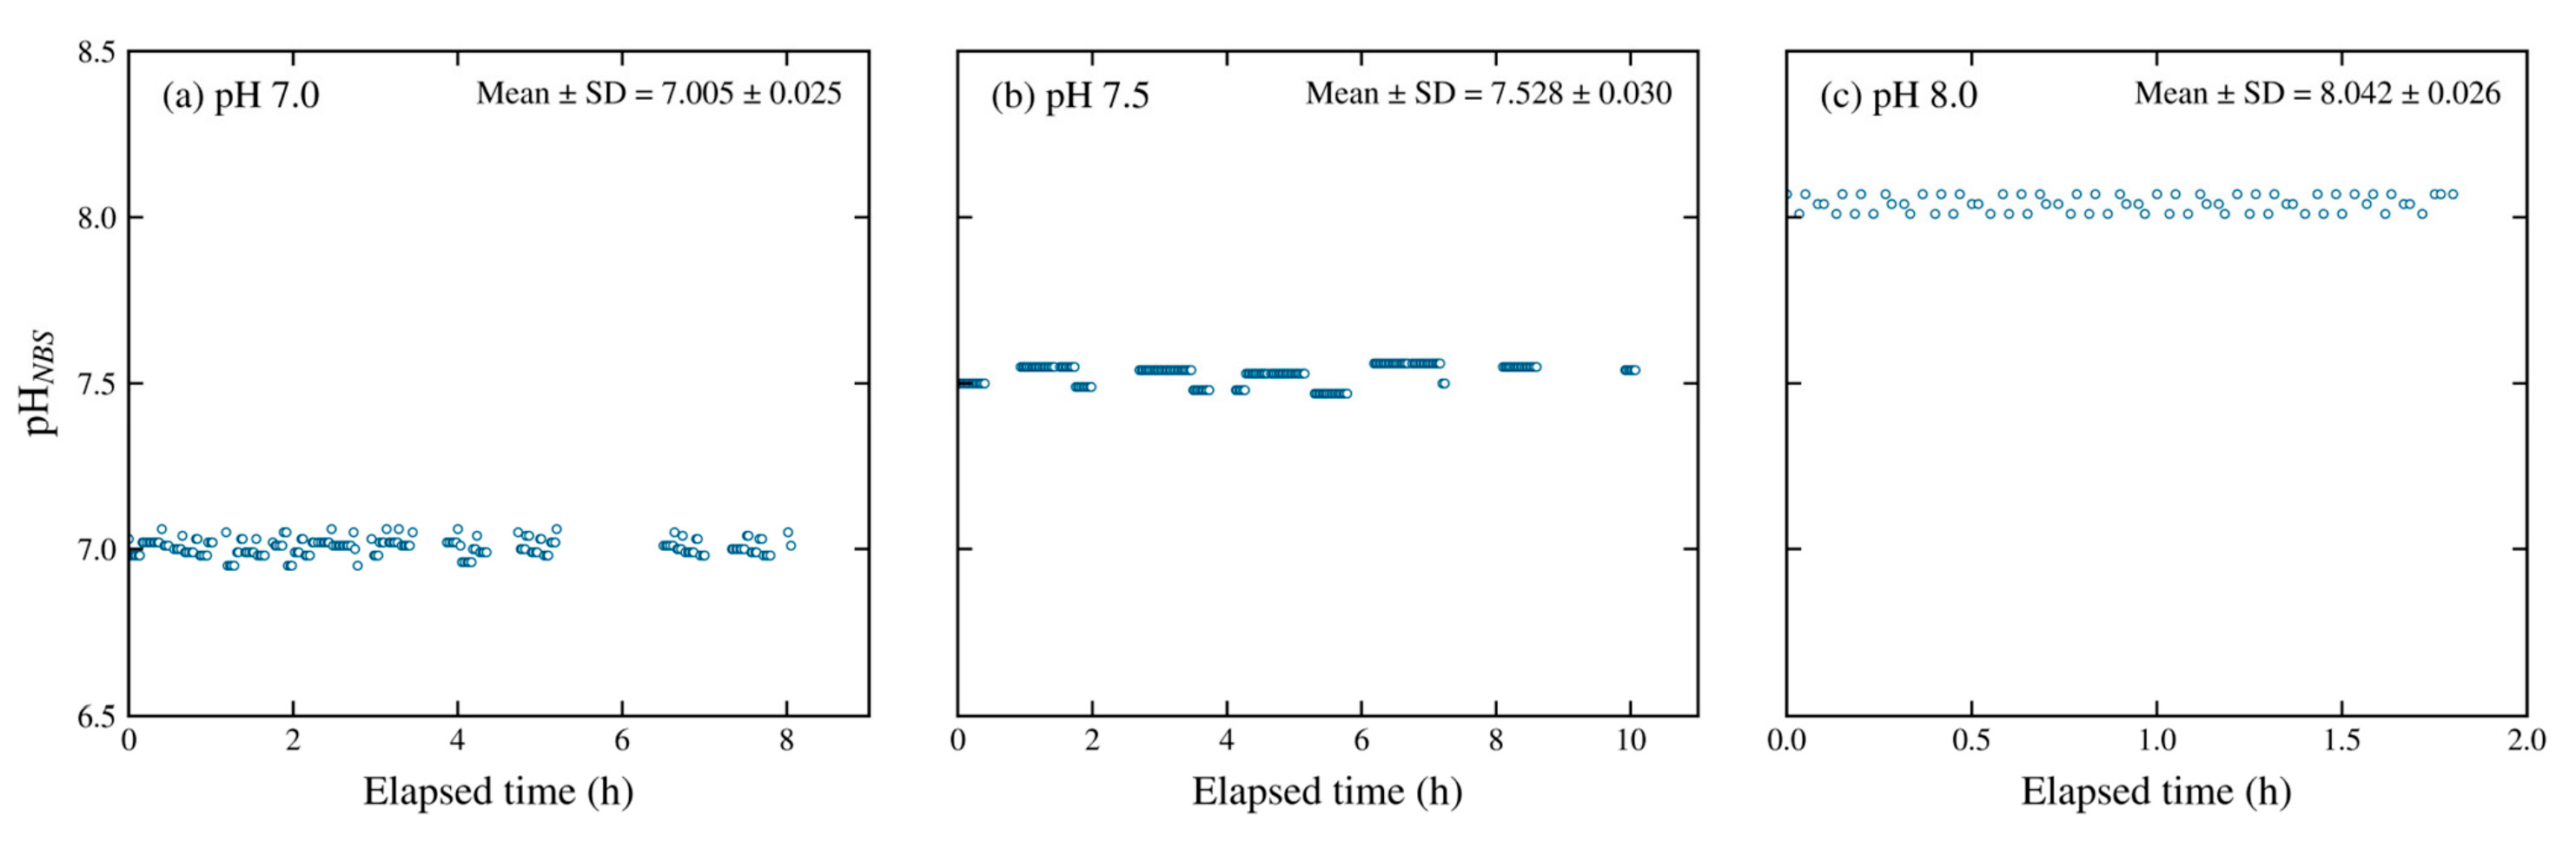
The prototype provides three pH-feedback channels, but the present trace-metal application used one vessel with sequential pH stages. The representative points shown in Figure 2 provide descriptive evidence of stable operation at all three set points: pH 7.005 ± 0.025 at 7.0, 7.528 ± 0.030 at 7.5, and 8.042 ± 0.026 at 8.0 (mean ± SD). The panels show separate archived observation windows and are not records of the complete overnight exposures. The displayed pH resolution was 0.01 unit. Control commands were updated every 1 min, whereas stored observations averaged approximately 2–3 min apart within these stable windows and included irregular gaps. These records describe representative operation and do not establish between-channel reproducibility or a complete controller performance specification.
Figure 2.
Representative archived pH_NBS records at programmed set points of (a) 7.0, (b) 7.5, and (c) 8.0. Panel annotations report the mean ± standard deviation (SD) for the displayed observation windows. These windows illustrate operational stability and do not establish response time, overshoot, long-term drift, or between-channel reproducibility.
The present experiment demonstrates the functional feasibility of the platform under three programmed pH treatments. A comprehensive evaluation of its metrological performance would require continuous high-frequency pH records and quantitative indicators of control precision, response time, overshoot, long-term drift, and between-channel reproducibility. System blanks would also be required to evaluate potential metal contamination or adsorption during operation. These measurements should therefore be included in the next stage of platform validation. A complete whole-system incubation blank and component-specific valve/vessel leaching tests were not performed. Therefore, the contamination-conscious materials do not demonstrate negligible metal leaching.
3.2. Zinc (Zn)
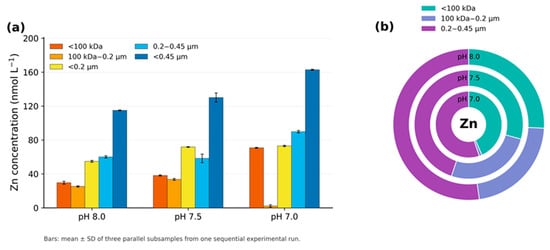
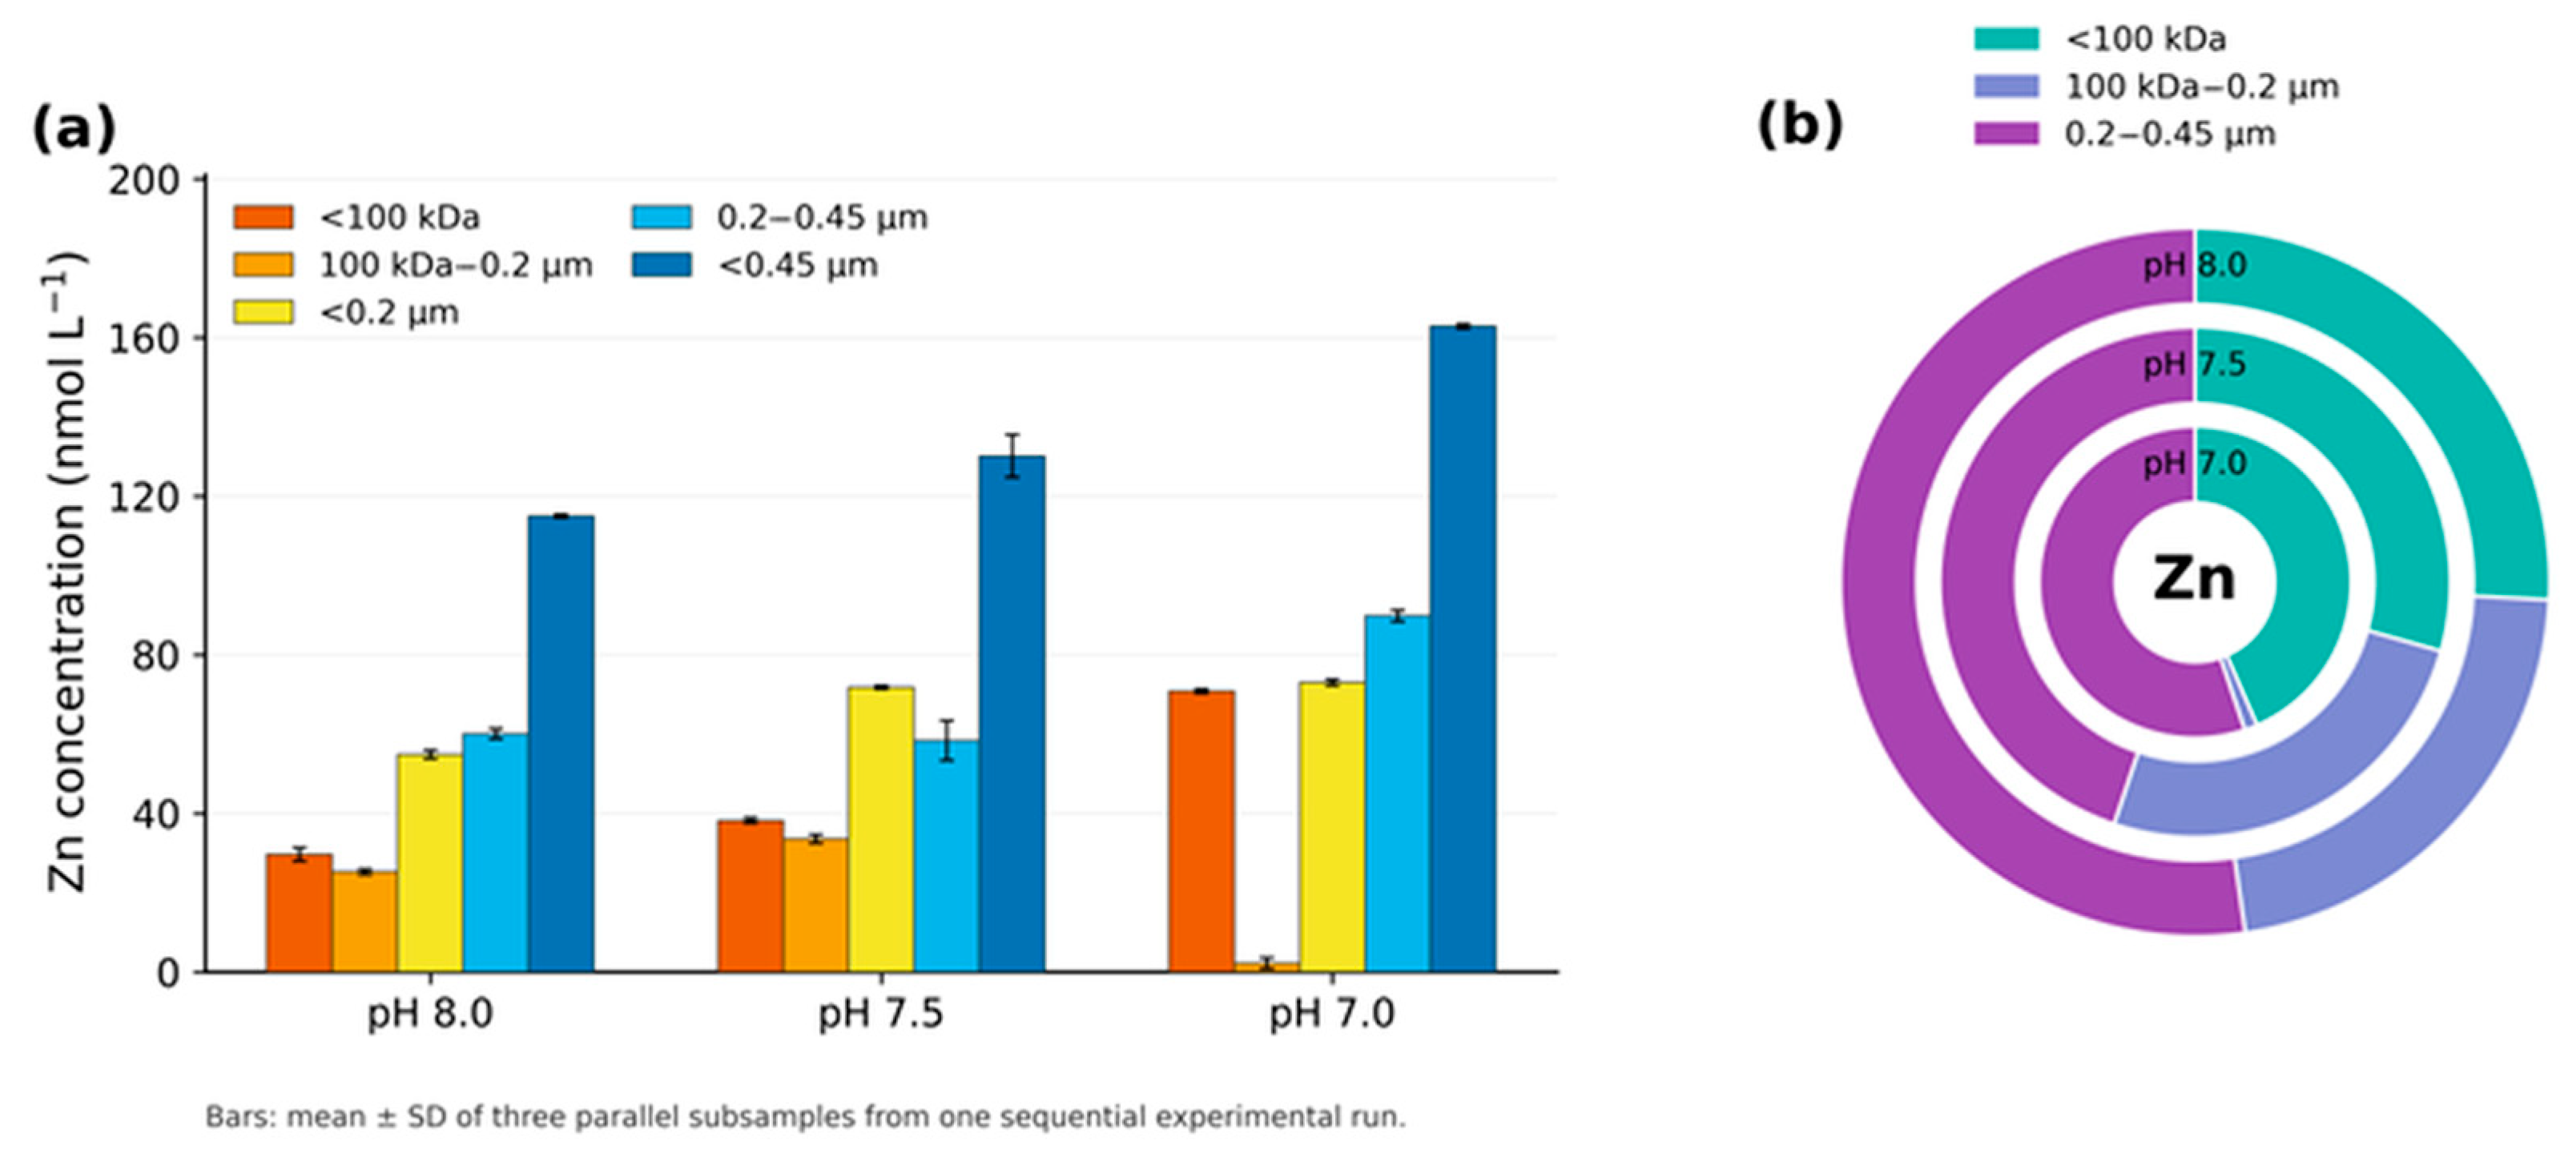
Ocean acidification increased the operationally dissolved Zn concentration and altered its internal size distribution, particularly under the pH 7.0 treatment (Figure 3). The principal change was an increase in the <100 kDa fraction accompanied by a marked decrease in the 100 kDa–0.2 μm fraction. This response is consistent with previous studies showing that decreasing pH can modify Zn complexation by changing carbonate chemistry, ligand protonation, and interactions between Zn and colloidal material [11,22].
Figure 3.
Distribution of Zn among operational size fractions under simulated seawater acidification. (a) Mean concentrations with standard deviation (SD) error bars for three independently processed parallel subsamples from one sequential experimental run. (b) Shares of the three non-overlapping size fractions calculated from their mean concentrations; outer, middle, and inner rings correspond to pH 8.0, 7.5, and 7.0, respectively.
The mean <0.45 μm Zn concentrations were 114.95 ± 0.41, 130.08 ± 5.37, 162.81 ± 0.61 nmol L−1 at pH 8.0, 7.5, and 7.0, respectively (mean ± SD, three parallel subsamples). At pH 8, the <100 kDa, 100 kDa–0.2 μm, and 0.2–0.45 μm fractions were 29.64 ± 1.67, 25.24 ± 0.66, 60.08 ± 1.24 nmol L−1, respectively. At pH 7.5, the <100 kDa, 100 kDa–0.2 μm, and 0.2–0.45 μm fractions were 38.17 ± 0.68, 33.56 ± 1.06, 58.35 ± 4.96 nmol L−1, respectively. At pH 7, the <100 kDa, 100 kDa–0.2 μm, and 0.2–0.45 μm fractions were 70.80 ± 0.52, 2.19 ± 1.37, 89.82 ± 1.45 nmol L−1, respectively. At pH 7.0, the corresponding mean fraction shares were 43.5%, 1.3%, 55.2%. These are descriptive within-run observations; their SD does not quantify variability among independently replicated incubations.
Several processes may account for the observed redistribution of Zn. Millero et al. [11] explained that declining seawater pH reduces the concentrations of carbonate and hydroxide ions, thereby modifying metal complexation, solubility, adsorption, and surface interactions. Thermodynamic calculations by Stockdale et al. [22] similarly showed that acidification can alter both the inorganic and organic speciation of trace metals. More directly, Kim et al. [32] demonstrated that the chemical lability and biological availability of Zn may either increase or decrease under acidification, depending on the composition and protonation properties of the ambient ligand pool. In their coastal surface-water experiment, acidification increased both electrochemically labile and bioavailable Zn. In contrast, Xu et al. [33] observed reduced Zn uptake by natural phytoplankton assemblages at lower pH and attributed this response to changes in bioavailable weak Zn complexes. Together, these studies indicate that the response of Zn to acidification cannot be predicted solely from changes in inorganic carbonate complexation because strong and weak organic ligands may modify both the magnitude and direction of the response.
We therefore interpret the low calculated contribution of the 100 kDa–0.2 μm fraction at pH 7.0 as a preliminary indication that this intermediate-size Zn pool was particularly sensitive to strong acidification. Protonation of organic or particle-surface binding sites may have weakened Zn association with intermediate-size colloids, while colloidal disaggregation, desorption, or changes in ligand binding could have transferred Zn into the <100 kDa pool and, potentially, into the larger 0.2–0.45 μm fraction [11,22,30]. This interpretation accounts for the simultaneous increase in the <100 kDa and 0.2–0.45 μm fractions and the sharp decrease in the intermediate fraction. However, because free Zn2+, ligand composition, and colloidal properties were not measured directly, the underlying mechanisms cannot be distinguished conclusively from the present data. The results nevertheless demonstrate that the increase in <0.45 μm Zn under acidification was accompanied by a substantial reorganization of its operational size distribution. The intermediate fraction at pH 7.0 was 2.19 ± 1.37 nmol L−1; subtraction uncertainty limits interpretation of its reduction.
3.3. Copper (Cu)
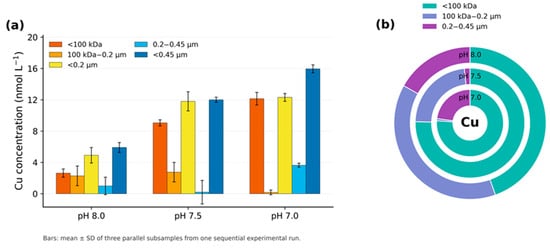
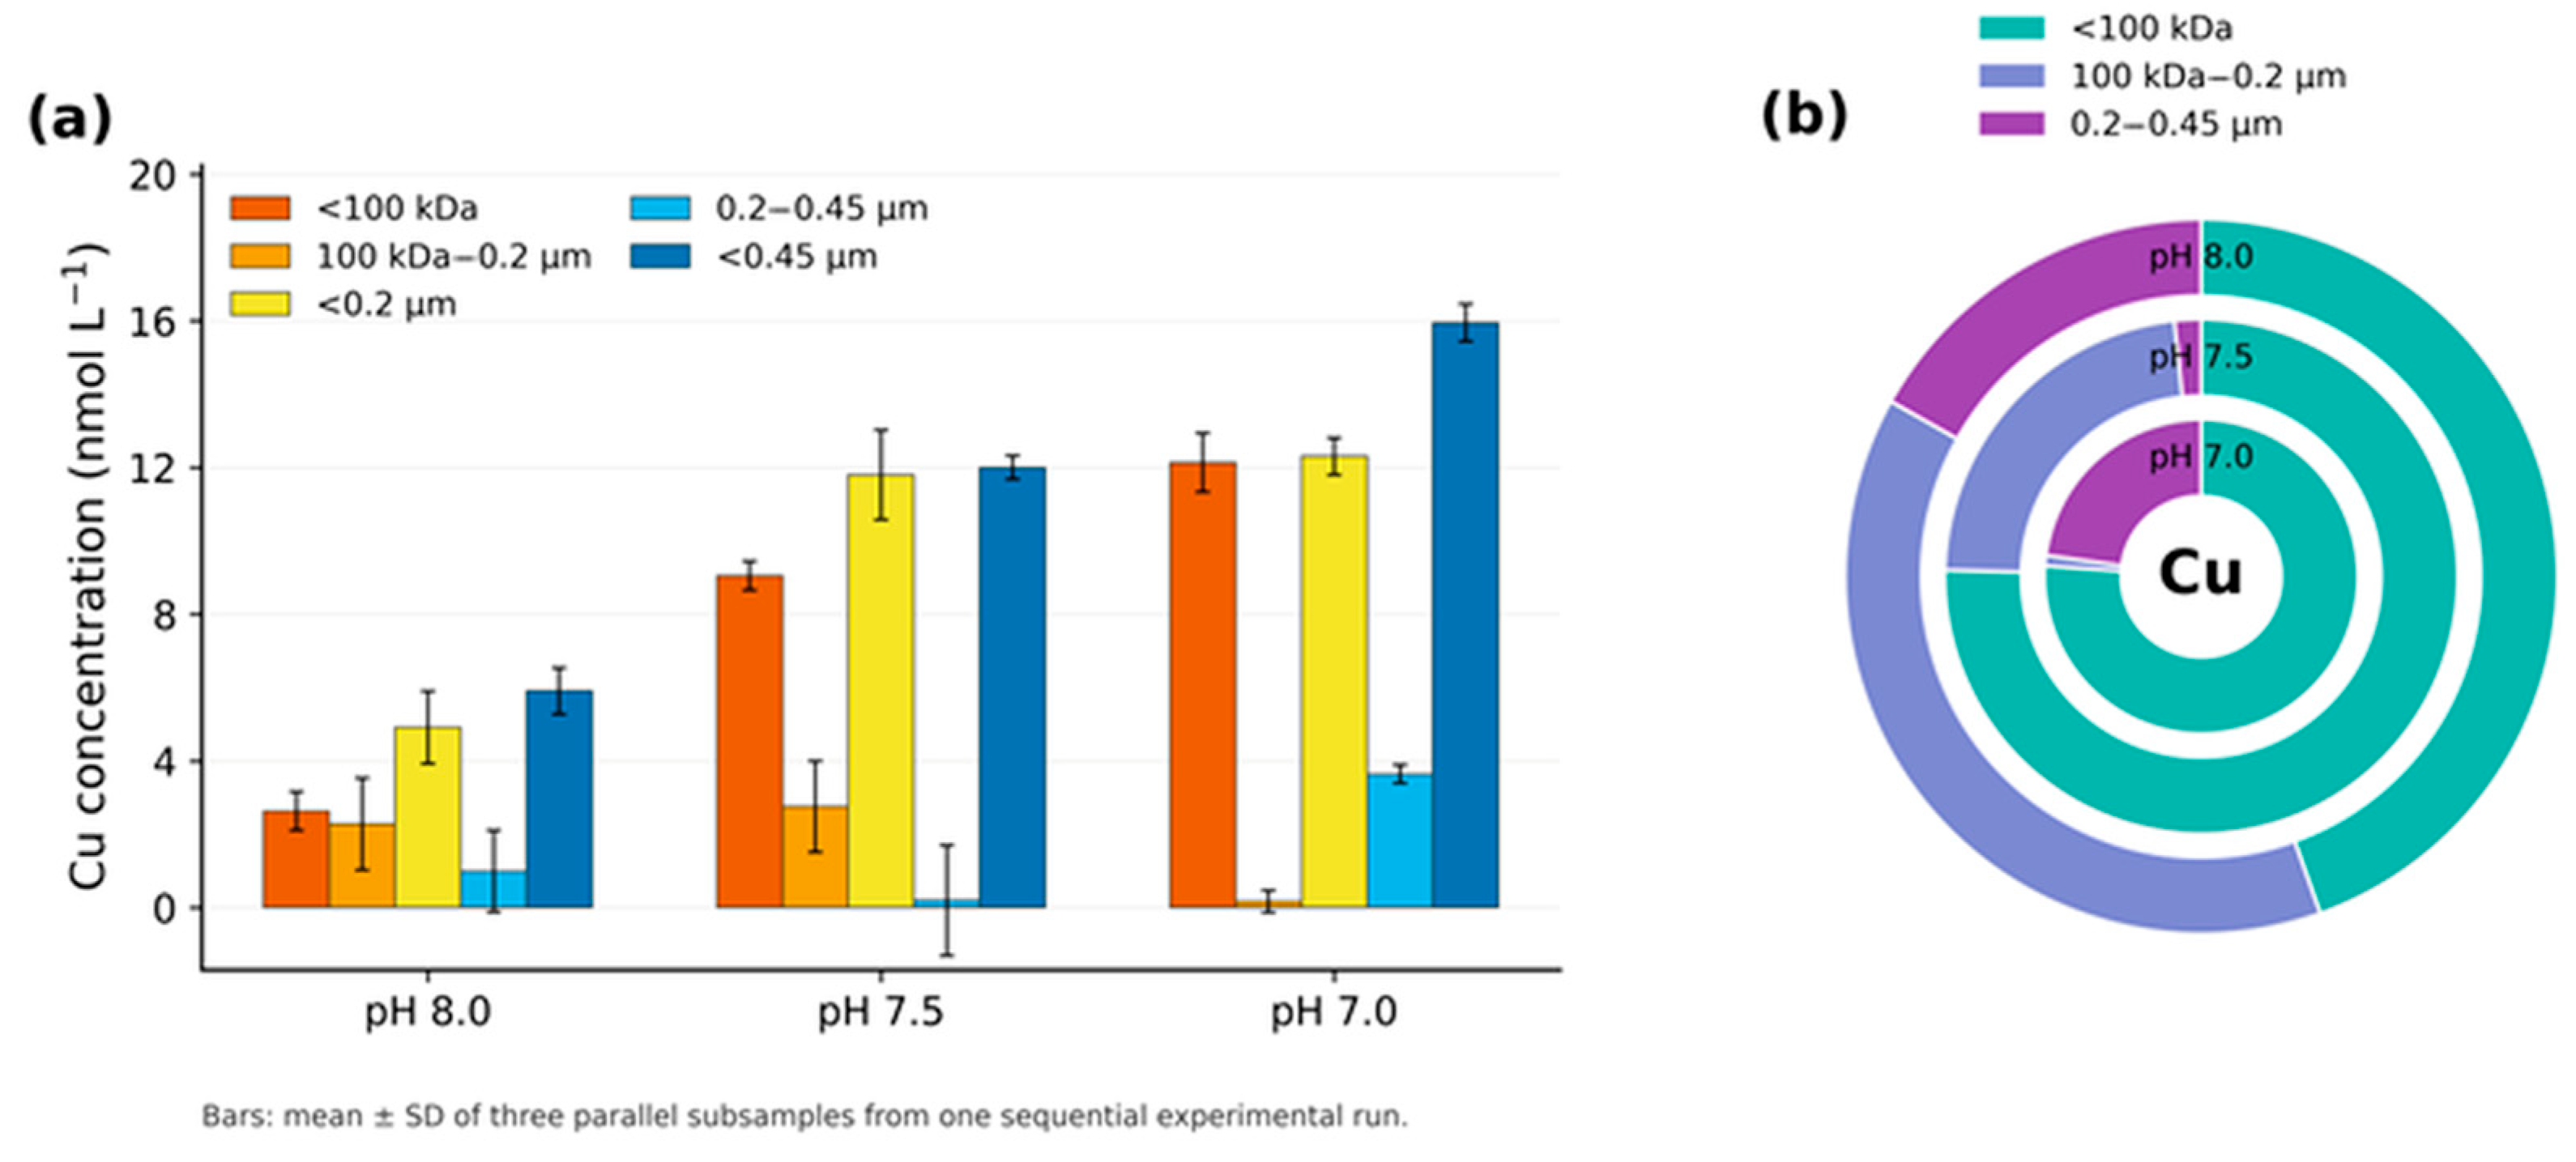
Acidification produced a pronounced increase in operationally dissolved Cu and substantially altered its size distribution (Figure 4). The increase was concentrated mainly in the <100 kDa fraction, whereas the 100 kDa–0.2 μm fraction had a low mean calculated contribution at pH 7.0. Meanwhile, the contribution of the 0.2–0.45 μm fraction increased under the strongest acidification treatment. These changes are consistent with the established sensitivity of Cu speciation to carbonate chemistry, organic complexation, and interactions with dissolved and colloidal organic matter [11,14,20,21,22]. The results further indicate that an increase in <0.45 μm Cu can be accompanied by simultaneous redistribution among different operational size fractions.
Figure 4.
Distribution of Cu among operational size fractions under simulated seawater acidification. (a) Mean concentrations with standard deviation (SD) error bars for three independently processed parallel subsamples from one sequential experimental run. (b) Shares of the three non-overlapping size fractions calculated from their mean concentrations; outer, middle, and inner rings correspond to pH 8.0, 7.5, and 7.0, respectively.
The mean <0.45 μm Cu concentrations were 5.91 ± 0.63, 12.00 ± 0.32, 15.95 ± 0.50 nmol L−1 at pH 8.0, 7.5, and 7.0, respectively (mean ± SD, three parallel subsamples). At pH 8, the <100 kDa, 100 kDa–0.2 μm, and 0.2–0.45 μm fractions were 2.63 ± 0.52, 2.28 ± 1.25, 1.00 ± 1.11 nmol L−1, respectively. At pH 7.5, the <100 kDa, 100 kDa–0.2 μm, and 0.2–0.45 μm fractions were 9.05 ± 0.40, 2.75 ± 1.24, 0.20 ± 1.51 nmol L−1, respectively. At pH 7, the <100 kDa, 100 kDa–0.2 μm, and 0.2–0.45 μm fractions were 12.14 ± 0.80, 0.17 ± 0.31, 3.65 ± 0.25 nmol L−1, respectively. At pH 7.0, the corresponding mean fraction shares were 76.1%, 1.1%, 22.9%. These are descriptive within-run observations; their SD does not quantify variability among independently replicated incubations.
Several processes may explain the observed response. Decreasing pH reduces carbonate availability and changes competition among Cu2+, inorganic ligands, organic binding sites, and protons [11,22]. Gledhill et al. [20] experimentally observed decreasing Cu complexation with organic matter as pH declined in estuarine waters, and their model predicted an approximately sixfold increase in inorganic Cu at pH 7.41 relative to pH 8.18. In contrast, Avendaño et al. [21] found no systematic pH-dependent change in the conditional stability constants or concentrations of Cu-binding ligands in Northwest European shelf waters. Their results indicate that the response of Cu complexation depends strongly on the composition and acid–base properties of the ambient ligand pool. Field investigations in the Yellow River Estuary and coastal waters of the Shandong Peninsula have further shown that low-molecular-weight and high-molecular-weight Cu pools coexist and that adsorption–desorption processes can strongly influence colloidal Cu distributions [34,35]. Collectively, these studies suggest that changes in inorganic complexation, ligand protonation, desorption, and colloidal transformations may occur concurrently during acidification.
We therefore interpret the continuous increase in <100 kDa Cu as a possible consequence of Cu release from proton-sensitive organic or particle-surface binding sites, followed by its transfer into smaller inorganic or organic complexes [20,22]. The low calculated contribution of the 100 kDa–0.2 μm fraction at pH 7.0 suggests that this intermediate-size Cu pool was particularly sensitive to strong acidification. Part of this Cu may have been transferred into the <100 kDa fraction through dissociation or disaggregation, while another part may have entered the 0.2–0.45 μm fraction through reaggregation or association with larger colloidal material [34,35]. Desorption of Cu from particles larger than 0.45 μm may also have contributed to the overall increase in operationally dissolved Cu. However, because free Cu2+ activity, Cu oxidation state, ligand concentrations, dissolved organic matter composition, and colloidal properties were not measured, these mechanisms cannot be distinguished conclusively. The present results nevertheless demonstrate that acidification changed both the concentration and operational size partitioning of dissolved Cu. The intermediate fraction at pH 7.0 was 0.17 ± 0.31 nmol L−1, including one negative difference-derived value. Cu(I)/Cu(II) redox cycling could also affect ligand binding and colloidal association, but neither oxidation state was measured. Thus, redox effects remain a possible explanation rather than an observed mechanism.
3.4. Iron (Fe)
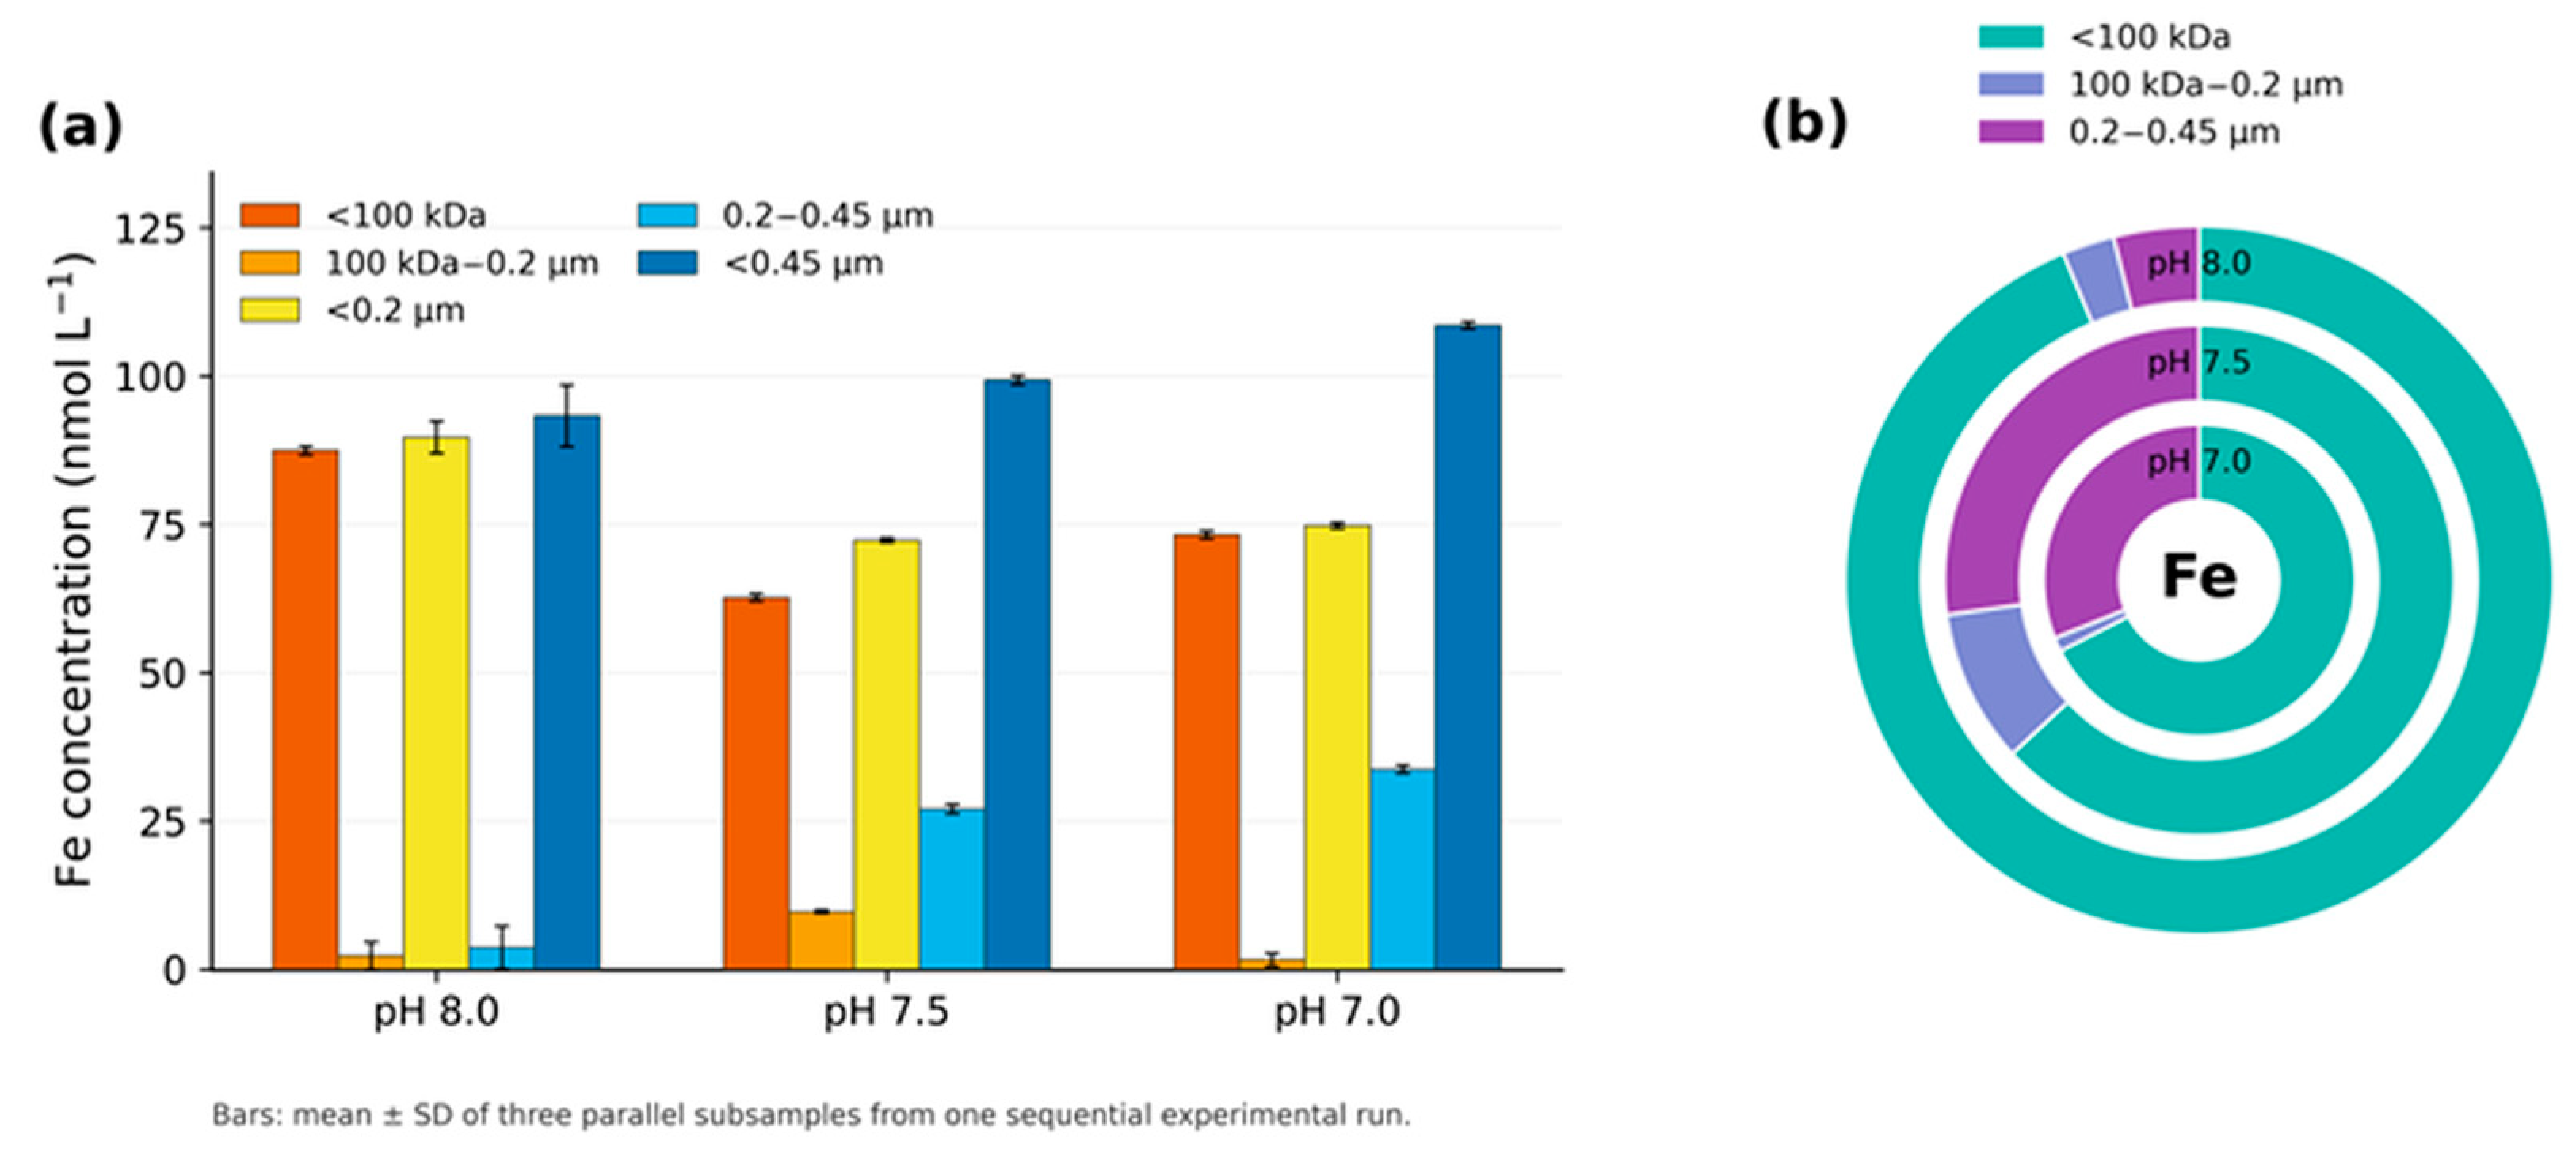
Lower pH was associated with a moderate increase in <0.45 μm Fe and changes in size partitioning (Figure 5). The <100 kDa fraction remained the largest mean fraction at all pH stages, but its proportional contribution decreased relative to pH 8.0, while the 0.2–0.45 μm contribution increased. The <100 kDa fraction includes a range of chemical forms and cannot be equated directly with free or biologically available Fe [14,15,36].
Figure 5.
Distribution of Fe among operational size fractions under simulated seawater acidification. (a) Mean concentrations with standard deviation (SD) error bars for three independently processed parallel subsamples from one sequential experimental run. (b) Shares of the three non-overlapping size fractions calculated from their mean concentrations; outer, middle, and inner rings correspond to pH 8.0, 7.5, and 7.0, respectively.
The mean <0.45 μm Fe concentrations were 93.29 ± 5.18, 99.31 ± 0.77, 108.54 ± 0.61 nmol L−1 at pH 8.0, 7.5, and 7.0, respectively (mean ± SD, three parallel subsamples). At pH 8, the <100 kDa, 100 kDa–0.2 μm, and 0.2–0.45 μm fractions were 87.43 ± 0.71, 2.23 ± 2.34, 3.64 ± 3.61 nmol L−1, respectively. At pH 7.5, the <100 kDa, 100 kDa–0.2 μm, and 0.2–0.45 μm fractions were 62.66 ± 0.60, 9.67 ± 0.24, 26.98 ± 0.79 nmol L−1, respectively. At pH 7, the <100 kDa, 100 kDa–0.2 μm, and 0.2–0.45 μm fractions were 73.25 ± 0.65, 1.58 ± 1.12, 33.71 ± 0.70 nmol L−1, respectively. The <100 kDa contribution was 93.7% at pH 8.0, 63.1% at pH 7.5, and 67.5% at pH 7.0. These are descriptive within-run observations; their SD does not quantify variability among independently replicated incubations.
Several interacting processes may explain the observed Fe response. Millero et al. [11] and Stockdale et al. [22] showed that decreasing pH changes Fe hydrolysis, inorganic speciation, solubility, and competition between protons and Fe for organic binding sites. In an estuarine-water experiment, Gledhill et al. [20] observed reduced organic complexation at lower pH, while their model predicted an approximately threefold increase in inorganic Fe at pH 7.41 compared with pH 8.18. Avendaño et al. [21], however, found that the conditional stability of Fe complexes relative to inorganic Fe complexation increased as pH declined, while the measured concentration of Fe-binding ligands showed no systematic pH trend. Biological and redox processes may further modify these chemical responses. Breitbarth et al. [19] observed increases in dissolved Fe, Fe(II) concentrations, and Fe(II) half-life under elevated CO2 in a coastal mesocosm experiment, suggesting enhanced persistence of reduced Fe under acidified conditions. In contrast, Shi et al. [36] found that decreasing pH reduced Fe uptake by diatoms and coccolithophores through changes in inorganic Fe chemistry. These contrasting findings show that an acidification-induced increase in operationally dissolved Fe does not necessarily correspond to an increase in Fe bioavailability.
The present Fe data show a larger contribution of the 0.2–0.45 μm fraction at lower pH, rather than uniform transfer toward <100 kDa material. Possible processes include dissolution, desorption, ligand redistribution, and colloidal aggregation or restructuring [20,21,22,37]. Fe increased less in relative total dissolved concentration than Mn, which may reflect stronger buffering by Fe-binding ligands and colloidal retention, whereas Mn is sensitive to oxide dissolution, desorption, and redox-dependent removal [14,15,38,39,40]. Oxidation states, ligands, redox potential, and mineralogy were not measured, so these mechanisms cannot be distinguished. The small intermediate fraction and its relatively large SD limit precise interpretation of its contribution.
3.5. Manganese (Mn)
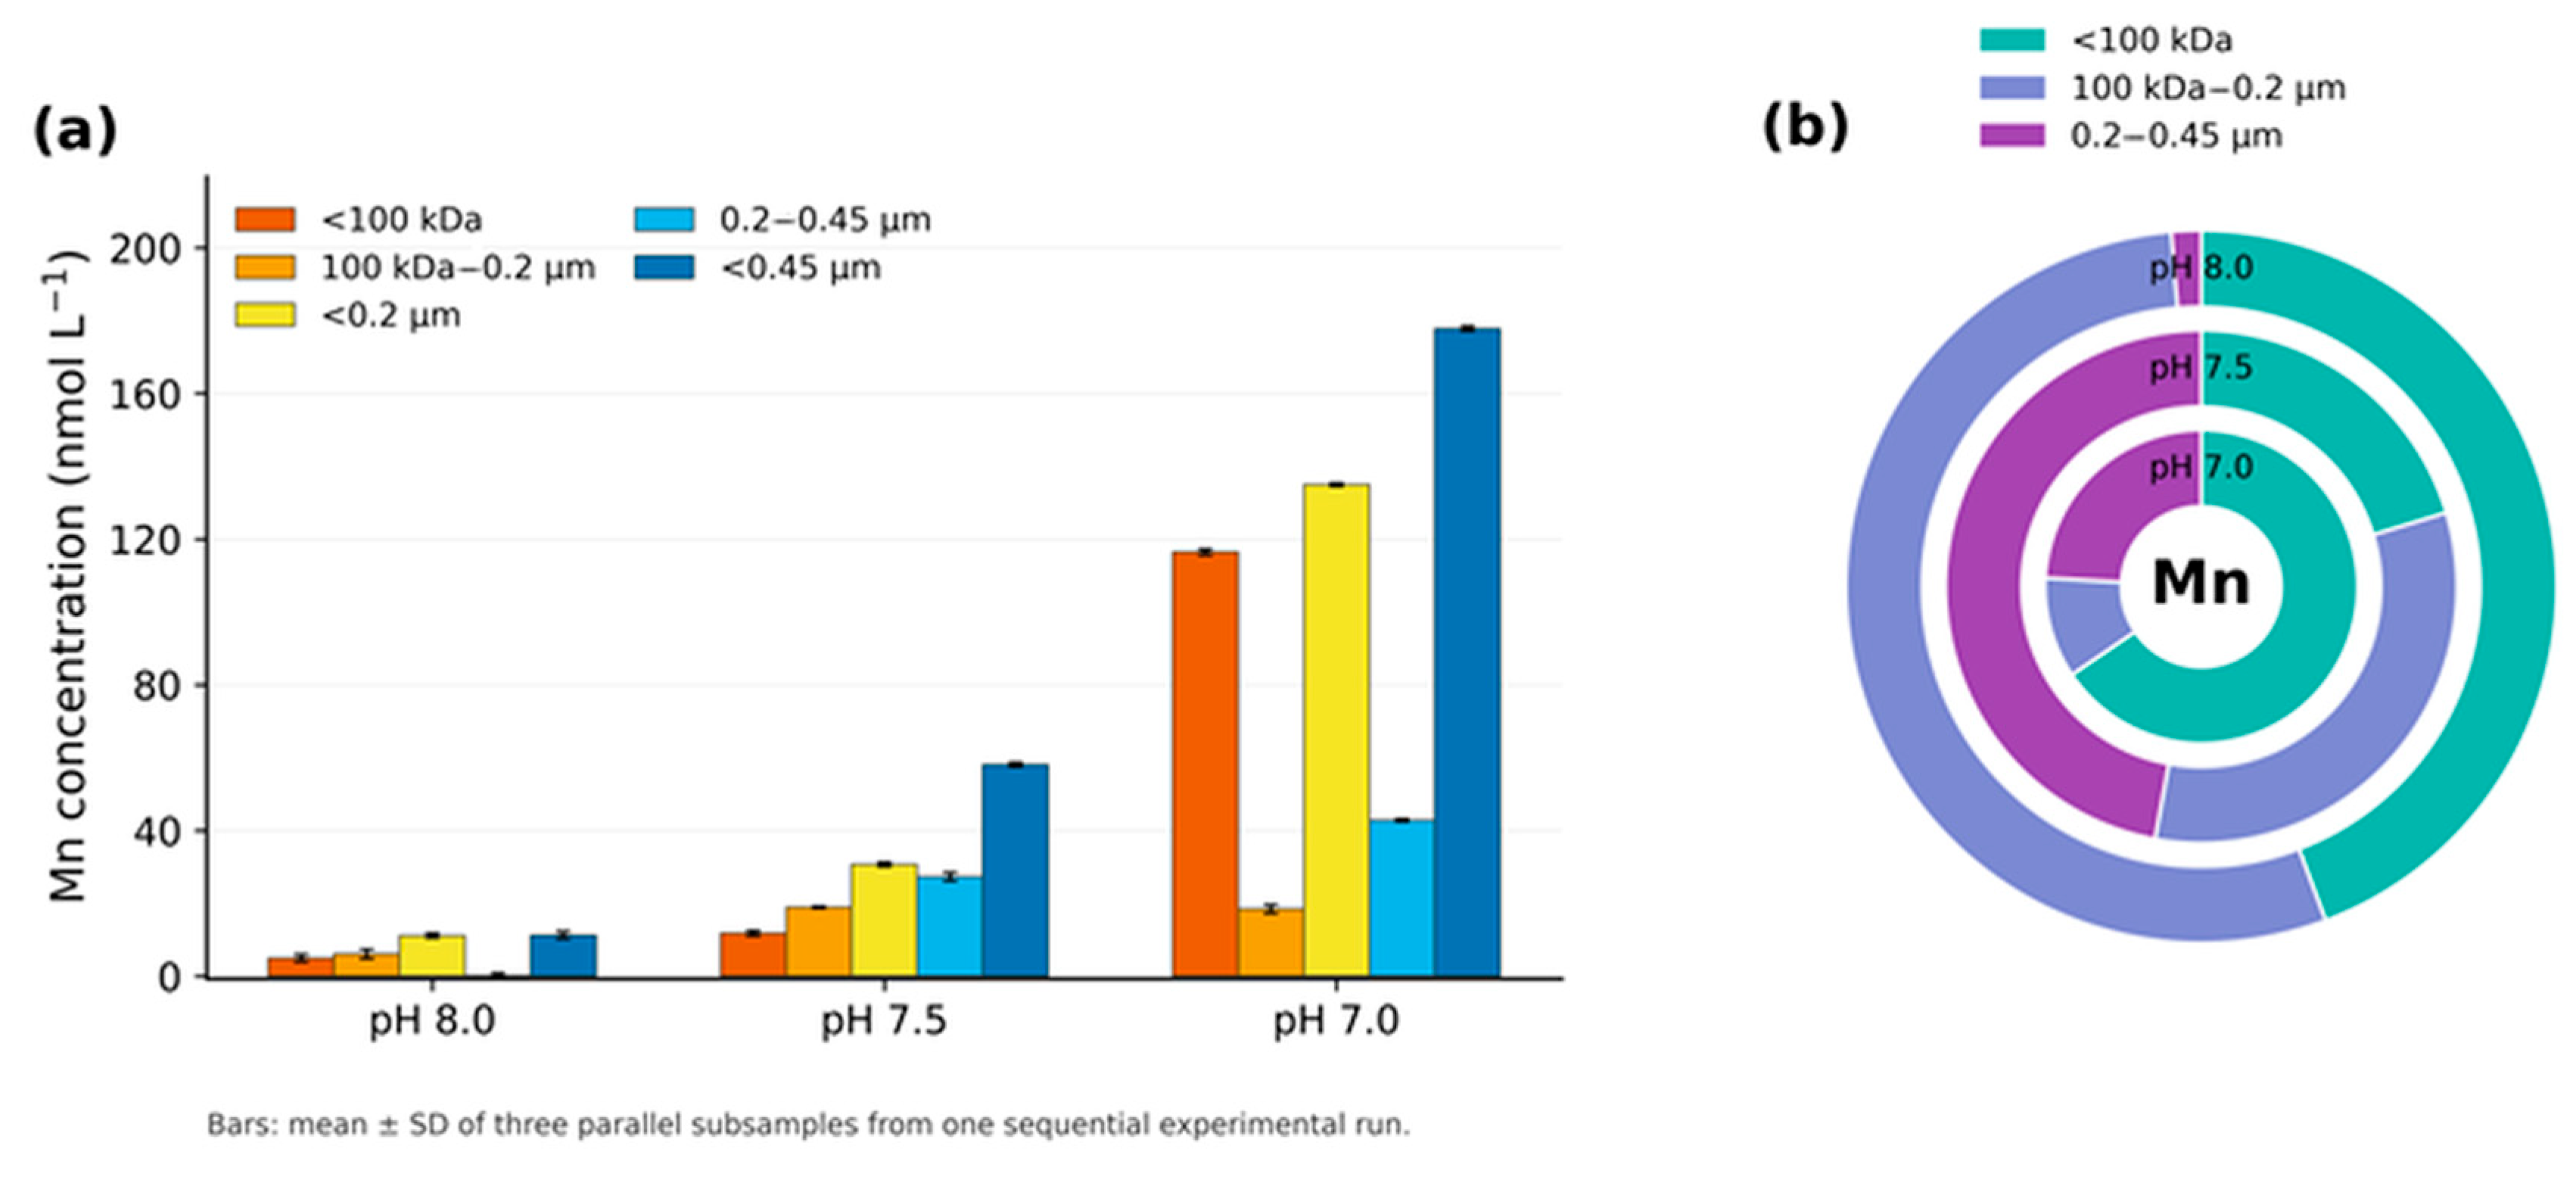
Among the four metals examined, Mn exhibited the strongest response to decreasing pH (Figure 6). Acidification increased the operationally dissolved (<0.45 μm) Mn concentration and changed the dominant size fraction, indicating substantial redistribution among the larger, intermediate-size, and lower-molecular-weight operational fractions measured in this study. This pronounced response is consistent with the sensitivity of marine Mn cycling to redox conditions, surface interactions, and changes in inorganic speciation [11,22,40]. Field investigations in estuarine and coastal waters have likewise shown that dissolved and colloidal Mn distributions vary considerably with pH, dissolved oxygen, salinity, particle abundance, and freshwater input [30,31,41].
The mean <0.45 μm Mn concentrations were 11.29 ± 0.97, 58.06 ± 0.61, 177.76 ± 0.64 nmol L−1 at pH 8.0, 7.5, and 7.0, respectively (mean ± SD, three parallel subsamples). At pH 8, the <100 kDa, 100 kDa–0.2 μm, and 0.2–0.45 μm fractions were 5.00 ± 0.97, 6.14 ± 1.31, 0.15 ± 0.70 nmol L−1, respectively. At pH 7.5, the <100 kDa, 100 kDa–0.2 μm, and 0.2–0.45 μm fractions were 11.81 ± 0.67, 18.91 ± 0.22, 27.35 ± 1.15 nmol L−1, respectively. At pH 7, the <100 kDa, 100 kDa–0.2 μm, and 0.2–0.45 μm fractions were 116.46 ± 0.81, 18.48 ± 1.19, 42.83 ± 0.34 nmol L−1, respectively. At pH 7.0, the corresponding mean fraction shares were 65.5%, 10.4%, 24.1%. These are descriptive within-run observations; their SD does not quantify variability among independently replicated incubations.
Comparable variability in Mn size partitioning has been reported for natural estuarine systems. Luan et al. found that Mn in the Yellow River Estuary occurred in both <1 kDa and high-molecular-weight colloidal fractions, with their relative contributions changing markedly between seasons and sampling locations [30]. Lu et al. also reported that Mn and other trace metals in the coastal waters of the Shandong Peninsula were distributed between truly dissolved and high-molecular-weight colloidal pools, reflecting the combined effects of riverine inputs, particles, and changing physicochemical conditions [31]. Although these field studies did not experimentally manipulate pH and used size cutoffs different from those adopted here, they demonstrate that Mn partitioning in coastal waters is highly dynamic. In addition, dissolved Mn concentrations of 1.1–81.5 nmol L−1 have been reported across the East China Sea, where freshwater supply and redox-related removal and regeneration were identified as important controls [41]. The concentrations measured at pH 8.0 and 7.5 in the present study fall within this broad coastal range, whereas the concentration measured under the pH 7.0 treatment was substantially higher. This comparison highlights the unusually high Mn concentration observed under the strongest experimental acidification treatment, although direct quantitative comparison is limited by differences in seawater matrix, environmental setting, and analytical procedure.
Several processes may have contributed to this response. First, the oxidation of soluble Mn(II) is strongly pH dependent. Experiments conducted at nanomolar concentrations in seawater showed that the Mn(II) oxidation rate varies with pH and is influenced by the formation of hydrolyzed and carbonate-associated Mn species [38]. Morgan further demonstrated that MnOH+, Mn(OH)2, and Mn–carbonate species make different contributions to Mn(II) oxidation as pH changes, with hydrolyzed species becoming increasingly important at higher pH [39]. A decrease in pH may therefore suppress oxidative removal of dissolved Mn(II), allowing a larger proportion of Mn to remain in operationally dissolved form. Acidification may also promote proton-assisted desorption from particle surfaces and the dissolution or restructuring of Mn-bearing oxide and colloidal phases. Ocean-scale observations and modelling indicate that the marine distribution of dissolved Mn is governed by the coupled effects of oxidation, photoreduction, aggregation, settling, and external inputs [40]. A perturbation of the balance among these processes could consequently produce a large change in both the concentration and apparent size distribution of Mn.
We therefore interpret the enrichment of the 0.2–0.45 μm fraction at pH 7.5 as a possible transient accumulation or restructuring of relatively large Mn-bearing colloidal material within the operationally dissolved pool. Under the stronger pH perturbation at pH 7.0, further dissolution, desorption, or disaggregation may have contributed to the pronounced enrichment of Mn in the <100 kDa fraction. This interpretation is consistent with the pH dependence of Mn(II) oxidation and with the established roles of Mn oxides, colloids, and redox transformations in marine Mn cycling [38,39,40]. However, the present fractionation data do not demonstrate direct transfer of Mn from one fraction to another. Mn oxidation states, free Mn2+ activity, ligand concentrations, particle mineralogy, and time-resolved changes in individual fractions were not measured. The proposed mechanisms should therefore be regarded as plausible explanations for the observed operational redistribution rather than as directly resolved reaction pathways. Without whole-system blanks, a contamination contribution to the high Mn concentration at pH 7.0 cannot be excluded. Confirmation requires dedicated blanks and independent incubation replicates.
Figure 6.
Distribution of Mn among operational size fractions under simulated seawater acidification. (a) Mean concentrations with standard deviation (SD) error bars for three independently processed parallel subsamples from one sequential experimental run. (b) Shares of the three non-overlapping size fractions calculated from their mean concentrations; outer, middle, and inner rings correspond to pH 8.0, 7.5, and 7.0, respectively.
3.6. Cross-Element Patterns and Implications
Mean concentrations of all four metals under <0.45 μm increased as pH declined in this single sequential run. The relative increase from pH 8.0 to 7.0 was largest for Mn (approximately 15.7-fold) and smallest for Fe (approximately 1.16-fold). Cu and Zn showed increased contributions of the <100 kDa fraction. Fe remained predominantly in the <100 kDa fraction but had a larger 0.2–0.45 μm contribution at lower pH. Mn shifted from a 100 kDa–0.2 μm-dominated distribution at pH 8.0 to a 0.2–0.45 μm-dominated distribution at pH 7.5 and a <100 kDa-dominated distribution at pH 7.0. These descriptive contrasts illustrated the information gained by measuring operational size fractions alongside total dissolved concentration.
The differences among the four metals are consistent with their distinct seawater chemistries. Previous studies have shown that acidification can alter metal hydrolysis, carbonate complexation, and interactions with organic ligands, but the direction and magnitude of these effects vary among elements [11,19,20,21,22]. The responses of Fe and Cu are likely to be closely associated with changes in organic complexation and colloidal stability [19,20,21,34,35,36,37], whereas the Zn pattern may reflect the combined influence of inorganic speciation, ligand binding, and exchange between lower-molecular-weight and colloidal forms [11,22,30,31,32,33]. For Mn, the much larger concentration increase and the successive changes in the dominant fraction suggest additional contributions from pH-sensitive oxidation, desorption, dissolution of Mn-bearing phases, and colloidal restructuring [30,31,38,39,40,41]. These mechanisms may operate simultaneously, and their relative importance cannot be determined from size-fractionation measurements alone.
The main scientific value of the present experiment lies in the simultaneous comparison of four metals in the same seawater matrix and under the same acidification and fractionation procedures. This design reduces methodological differences among individual metal measurements and provides preliminary evidence of element-specific operational redistribution. Measurements limited to the bulk <0.45 μm fraction would have detected the overall increase in dissolved metal concentrations but would not have captured the distinct redistribution of Fe and Cu across the measured fractions, the mixed response of Zn, or the changing dominant fraction of Mn. Operational size fractionation therefore provides complementary information for evaluating how acidification may alter the forms in which trace metals occur in coastal seawater.
These comparisons nevertheless remain qualitative because most previous studies examined thermodynamic species, organic-ligand complexes, or size fractions different from those used here. In addition, pH was measured on the NBS scale, while total alkalinity and dissolved inorganic carbon were not independently determined. The carbonate system was therefore not fully constrained for direct comparison with studies reporting pH on the total scale. Metal oxidation states, free-ion activities, ligand concentrations, and colloidal composition were also not measured independently. Consequently, the present results demonstrate element-specific changes in operational size partitioning, while the chemical pathways responsible for those changes require further investigation. The single sequential run does not separate pH effects from exposure duration or treatment order. Without a whole-system metal blank, common contamination cannot be excluded quantitatively; divergent size patterns alone do not rule out contamination. The <1 kDa fractions reported in several comparison studies are not quantitatively equivalent to the present <100 kDa fraction, so fraction percentages and effect sizes are not directly comparable.
4. Conclusions
A closed-loop ocean acidification simulation system was developed for trace-metal size-fractionation studies in seawater. The platform integrates host-computer control, multiparameter sensing, RS485 communication, water circulation, and pH-feedback CO2 valve control. Contamination-conscious gas-path components and fluorinated vessel interiors were incorporated to support trace-metal experiments. Its functional operation was demonstrated through seawater incubations at programmed pH values of 8.0, 7.5, and 7.0, followed by sequential filtration, ultrafiltration, and ICP–MS analysis.
In this single sequential run, lower pH was associated with higher total dissolved (<0.45 μm) concentrations of all four metals, with the largest relative increase for Mn and the smallest for Fe. The metals showed distinct changes in operational size partitioning, providing information beyond total dissolved concentrations alone. The simultaneous comparison of four metals in the same seawater matrix and under a common experimental workflow provides a practical basis for investigating element-specific size redistribution during acidification.
However, the present study represents a functional demonstration of the platform, and independent incubation replication and further quantitative validation are required. Future work should evaluate pH precision, response time, overshoot, long-term drift, between-channel reproducibility, and component-specific metal blanks. Measurements of total alkalinity, dissolved inorganic carbon, metal oxidation states, free-ion activities, organic ligands, and colloidal composition would also help identify the processes responsible for the observed redistribution. Integrating these measurements with the present platform will improve its application to mechanistic studies of trace-metal behavior under changing coastal carbonate conditions.
Author Contributions
Conceptualization, D.P. and X.M.; methodology, X.M. and Y.L.; investigation, X.M. and Y.L.; data curation, X.M. and Y.L.; writing—original draft preparation, X.M.; writing—review and editing, D.P., X.M. and Y.L.; supervision, D.P.; project administration, D.P.; funding acquisition, D.P. All authors have read and agreed to the published version of the manuscript.
Funding
This research was funded by the Jing-Jin-Ji Regional Integrated Environmental Improvement–National Science and Technology Major Project of the Ministry of Ecology and Environment of China (2025ZD1201000), and the Special Fund for the Scholar Program of Yantai City.
Data Availability Statement
The data supporting the findings of this study are available from the corresponding author upon reasonable request.
Conflicts of Interest
The authors declare no conflicts of interest.
References
- Doney, S.C.; Fabry, V.J.; Feely, R.A.; Kleypas, J.A. Ocean acidification: The other CO2 problem. Annu. Rev. Mar. Sci. 2009, 1, 169–192. [Google Scholar] [CrossRef] [Scilit]
- Ma, D.; Gregor, L.; Gruber, N. Four decades of trends and drivers of global surface ocean acidification. Glob. Biogeochem. Cycles 2023, 37, e2023GB007765. [Google Scholar] [CrossRef] [Scilit]
- Sharp, J.D.; Jiang, L.-Q.; Carter, B.R.; Lavin, P.D.; Yoo, H.; Cross, S.L. A mapped dataset of surface ocean acidification indicators in large marine ecosystems of the United States. Sci. Data 2024, 11, 715. [Google Scholar] [CrossRef] [Scilit]
- Li, C.-L.; Yang, D.-Z.; Zhai, W.-D. Effects of warming, eutrophication and climate variability on acidification of the seasonally stratified North Yellow Sea over the past 40 years. Sci. Total Environ. 2022, 815, 152935. [Google Scholar] [CrossRef] [Scilit]
- Findlay, H.S.; Feely, R.A.; Jiang, L.-Q.; Pelletier, G.; Bednaršek, N. Ocean acidification: Another planetary boundary crossed. Glob. Chang. Biol. 2025, 31, e70238. [Google Scholar] [CrossRef] [Scilit]
- Hönisch, B.; Ridgwell, A.; Schmidt, D.N.; Thomas, E.; Gibbs, S.J.; Sluijs, A.; Zeebe, R.; Kump, L.; Martindale, R.C.; Greene, S.E.; et al. The geological record of ocean acidification. Science 2012, 335, 1058–1063. [Google Scholar] [CrossRef] [Scilit]
- Riebesell, U.; Zondervan, I.; Rost, B.; Tortell, P.D.; Zeebe, R.E.; Morel, F.M.M. Reduced calcification of marine plankton in response to increased atmospheric CO2. Nature 2000, 407, 364–367. [Google Scholar] [CrossRef] [Scilit]
- Damien, P.; Bianchi, D.; Kessouri, F.; McWilliams, J.C. Extremes and short-term fluctuations in coastal ocean acidification and hypoxia. J. Geophys. Res. Ocean. 2024, 129, e2024JC021197. [Google Scholar] [CrossRef] [Scilit]
- Feely, R.A.; Carter, B.R.; Alin, S.R.; Greeley, D.; Bednaršek, N. The combined effects of ocean acidification and respiration on habitat suitability for marine calcifiers along the west coast of North America. J. Geophys. Res. Ocean. 2024, 129, e2023JC019892. [Google Scholar] [CrossRef] [Scilit]
- Jiang, L.-Q.; Boyer, T.P.; Paver, C.R.; Yoo, H.; Reagan, J.R.; Alin, S.R.; Barbero, L.; Carter, B.R.; Feely, R.A.; Wanninkhof, R. Climatological distribution of ocean acidification variables along the North American ocean margins. Earth Syst. Sci. Data 2024, 16, 3383–3390. [Google Scholar] [CrossRef] [Scilit]
- Millero, F.J.; Woosley, R.; DiTrolio, B.; Waters, J. Effect of ocean acidification on the speciation of metals in seawater. Oceanography 2009, 22, 72–85. [Google Scholar] [CrossRef] [Scilit]
- Bruland, K.W.; Middag, R.; Lohan, M.C. Controls of trace metals in seawater. In Treatise on Geochemistry, 2nd ed.; Holland, H.D., Turekian, K.K., Eds.; Elsevier: Amsterdam, The Netherlands, 2014; pp. 19–51. [Google Scholar] [CrossRef] [Scilit]
- Cheriyan, E.; Kumar, B.S.K.; Gupta, G.V.M.; Rao, D.B. Implications of ocean acidification on micronutrient elements-iron, copper and zinc, and their primary biological impacts: A review. Mar. Pollut. Bull. 2024, 199, 115991. [Google Scholar] [CrossRef] [Scilit]
- Moffett, J.W.; Boiteau, R.M. Metal organic complexation in seawater: Historical background and future directions. Annu. Rev. Mar. Sci. 2024, 16, 577–599. [Google Scholar] [CrossRef] [Scilit]
- Whitby, H.; Park, J.; Shaked, Y.; Boiteau, R.M.; Buck, K.N.; Bundy, R.M. New insights into the organic complexation of bioactive trace metals in the global ocean from the GEOTRACES era. Oceanography 2024, 37, 142–155. [Google Scholar] [CrossRef] [Scilit]
- Campbell, P.G.C. Interactions between trace metals and aquatic organisms: A critique of the free-ion activity model. In Metal Speciation and Bioavailability in Aquatic Systems; Tessier, A., Turner, D.R., Eds.; John Wiley & Sons: London, UK, 1995; pp. 45–102. [Google Scholar]
- Slaveykova, V.I.; Wilkinson, K.J. Predicting the bioavailability of metals and metal complexes: Critical review of the biotic ligand model. Environ. Chem. 2005, 2, 9–24. [Google Scholar] [CrossRef] [Scilit]
- Gao, W.J.; Qu, B.X.; Yuan, H.M.; Song, J.M. Effects of coastal ocean acidification on the biogeochemical characteristics of trace elements at the sediment–water interface. Mar. Sci. 2023, 47, 119–130. (In Chinese) [Google Scholar] [CrossRef]
- Breitbarth, E.; Bellerby, R.J.; Neill, C.C.; Ardelan, M.V.; Meyerhöfer, M.; Zöllner, E.; Croot, P.L.; Riebesell, U. Ocean acidification affects iron speciation during a coastal seawater mesocosm experiment. Biogeosciences 2010, 7, 1065–1073. [Google Scholar] [CrossRef] [Scilit]
- Gledhill, M.; Achterberg, E.P.; Li, K.; Mohamed, K.N.; Rijkenberg, M.J.A. Influence of ocean acidification on the complexation of iron and copper by organic ligands in estuarine waters. Mar. Chem. 2015, 177, 421–433. [Google Scholar] [CrossRef] [Scilit]
- Avendaño, L.; Gledhill, M.; Achterberg, E.P.; Rérolle, V.M.C.; Schlosser, C. Influence of ocean acidification on the organic complexation of iron and copper in Northwest European shelf seas: A combined observational and model study. Front. Mar. Sci. 2016, 3, 58. [Google Scholar] [CrossRef] [Scilit]
- Stockdale, A.; Tipping, E.; Lofts, S.; Mortimer, R.J.G. Effect of ocean acidification on organic and inorganic speciation of trace metals. Environ. Sci. Technol. 2016, 50, 1906–1913. [Google Scholar] [CrossRef] [Scilit]
- Cao, L.; Qi, D.; Li, Q.; Yang, B.; Zhang, Y.; Zhang, S.; Qi, S.; Zhang, Y.; Liu, Y. Spectrophotometric loop flow analyzer for high-precision measurement of seawater pH. Talanta 2021, 224, 121775. [Google Scholar] [CrossRef] [Scilit]
- Yin, T.; Papadimitriou, S.; Rérolle, V.M.C.; Arundell, M.; Cardwell, C.L.; Walk, J.; Palmer, M.R.; Fowell, S.E.; Schaap, A.; Mowlem, M.C.; et al. A novel lab-on-chip spectrophotometric pH sensor for autonomous in situ seawater measurements to 6000 m depth on stationary and moving observing platforms. Environ. Sci. Technol. 2021, 55, 14968–14978. [Google Scholar] [CrossRef] [Scilit]
- Li, H.; Wang, S.; Zheng, S.; Fang, T.; Shu, H.; Xu, Y.; Guo, X.; Achterberg, E.P.; Zhan, L.; Ma, J. Underway mapping of coastal seawater pH using an automated shipboard analyzer with spectrophotometric detection. Talanta 2024, 278, 126532. [Google Scholar] [CrossRef] [Scilit]
- Onthank, K.L.; Foster, J.; Carman, E.P., Jr.; Foster, J.E.; Culler-Juarez, M.; Calvo, E.; Duerksen, W.; Natiuk, T.; Saca, L. The Open Acidification Tank Controller: An open-source device for the control of pH and temperature in ocean acidification experiments. HardwareX 2023, 14, e00435. [Google Scholar] [CrossRef] [Scilit]
- Sordo, L.; Santos, R.; Reis, J.; Shulika, A.; Silva, J. A direct CO2 control system for ocean acidification experiments: Testing effects on the coralline red algae Phymatolithon lusitanicum. PeerJ 2016, 4, e2503. [Google Scholar] [CrossRef] [Scilit]
- Pérez-Rojas, C.A.; Martínez-Martínez, C.A.; Palacios-Mechetnov, E.; Lora-Vilchis, M.C. Design of a low-cost pH-Stat to study effects of ocean acidification on growth and nutrient consumption of diatoms. Aquac. Eng. 2022, 99, 102300. [Google Scholar] [CrossRef] [Scilit]
- Zheng, X.; Wang, C.; Hadi, T.A.; Ye, Y.; Pan, K. An ocean acidification-simulated system and its application in coral physiological studies. Acta Oceanol. Sin. 2018, 37, 55–62. [Google Scholar] [CrossRef] [Scilit]
- Luan, F.; Yang, T.; Lu, Y.; Wang, N. Molecular size-fraction and seasonal characteristics of dissolved trace metals in river and estuarine waters of the Yellow River, China. Front. Mar. Sci. 2022, 9, 1074829. [Google Scholar] [CrossRef] [Scilit]
- Lu, Y.; Luan, Y.; Zhang, Z.; Ding, J.; Pan, D. Size fraction, behavior, and fate of trace metals along the river-estuary-coastal ocean continuum of Shandong Peninsula, northern China. Mar. Environ. Res. 2025, 210, 107324. [Google Scholar] [CrossRef] [Scilit]
- Kim, J.-M.; Baars, O.; Morel, F.M.M. The effect of acidification on the bioavailability and electrochemical lability of zinc in seawater. Philos. Trans. R. Soc. A 2016, 374, 20150296. [Google Scholar] [CrossRef] [Scilit]
- Xu, Y.; Shi, D.; Aristilde, L.; Morel, F.M.M. The effect of pH on the uptake of zinc and cadmium in marine phytoplankton: Possible role of weak complexes. Limnol. Oceanogr. 2012, 57, 293–304. [Google Scholar] [CrossRef] [Scilit]
- Lu, Y.; Pan, D.; Yang, T.; Wang, C. Spatial and environmental characteristics of colloidal trace Cu in the surface water of the Yellow River Estuary, China. Mar. Pollut. Bull. 2021, 168, 112401. [Google Scholar] [CrossRef] [Scilit]
- Lu, Y.; Pan, D. Spatial distribution, compositional pattern, and source apportionment of colloidal trace metals in the coastal water of Shandong Peninsula, northeastern China. Mar. Pollut. Bull. 2024, 203, 116445. [Google Scholar] [CrossRef] [Scilit]
- Shi, D.; Xu, Y.; Hopkinson, B.M.; Morel, F.M.M. Effect of ocean acidification on iron availability to marine phytoplankton. Science 2010, 327, 676–679. [Google Scholar] [CrossRef] [Scilit]
- Lu, Y.; Wang, X.; Pan, D. The influences of Yellow River input and nutrient dynamics on colloidal Fe migration in the Bohai Sea, China. Mar. Environ. Res. 2024, 198, 106553. [Google Scholar] [CrossRef] [Scilit]
- von Langen, P.J.; Johnson, K.S.; Coale, K.H.; Elrod, V.A. Oxidation kinetics of manganese(II) in seawater at nanomolar concentrations. Geochim. Cosmochim. Acta 1997, 61, 4945–4954. [Google Scholar] [CrossRef] [Scilit]
- Morgan, J.J. Kinetics of reaction between O2 and Mn(II) species in aqueous solutions. Geochim. Cosmochim. Acta 2005, 69, 35–48. [Google Scholar] [CrossRef] [Scilit]
- van Hulten, M.M.P.; Middag, R.; Dutay, J.-C.; de Baar, H.J.W.; Roy-Barman, M.; Gehlen, M.; Tagliabue, A.; Sterl, A. Manganese in the west Atlantic Ocean in the context of the first global ocean circulation model of manganese. Biogeosciences 2017, 14, 1123–1152. [Google Scholar] [CrossRef] [Scilit]
- Wang, Z.; Ren, J.; Xuan, J.; Liu, S.; Zhang, J. Distribution and off-shelf transport of dissolved manganese in the East China Sea. Front. Mar. Sci. 2023, 9, 1110913. [Google Scholar] [CrossRef] [Scilit]
Disclaimer/Publisher’s Note: The statements, opinions and data contained in all publications are solely those of the individual author(s) and contributor(s) and not of MDPI and/or the editor(s). MDPI and/or the editor(s) disclaim responsibility for any injury to people or property resulting from any ideas, methods, instructions or products referred to in the content. |
© 2026 by the authors. Licensee MDPI, Basel, Switzerland. This article is an open access article distributed under the terms and conditions of the Creative Commons Attribution (CC BY) license.