


Abstract
Benthic chambers measure the sediment–seawater solute exchange. In cohesive sediments, this exchange may scale with the sediments’ diffusive boundary layer (DBL) thickness and thus the intensity of chamber water agitation. To investigate this, we deployed a customised Unisense A/S MiniChamber lander with an opaque, stirred benthic chamber on the subtidal seafloor of Queen Charlotte Sound, New Zealand. We deployed the chamber at 18 sites over six days, during the morning, midday, and the afternoon, using four stirrer speeds (10, 17, 26, 35 rpm). All but the highest stirrer speed allowed particles resuspended during chamber deployment to settle. Sediment total O2 uptake (TOU) ranged from 614 to 1125 µmol m−2 h−1. Ammonium, phosphorus, and nitrate fluxes indicated consistent sediment release, except for two deployments that showed nitrate uptake. Statistical analyses revealed a negative effect of the initial chamber turbidity on TOU, but failed to detect effects of stirrer speed or time of day on any measured flux. Variation in TOU was minimal across stirrer speeds at midday but higher during the morning and afternoon. We discuss these observations in the context of sediment disturbance during deployment and diel variations in infaunal activity. Overall, our results align with those of previous studies using different chambers, indicating that chamber-derived sediment–seawater solute flux estimates may be unaffected by chamber water agitation intensity.
1. Introduction
Benthic chamber landers, which can operate in all ocean depths [1,2,3,4], measure in situ sediment–seawater solute fluxes, allowing researchers to quantify sedimentary carbon cycling processes and assess the impact of human activities on benthic–pelagic coupling [5,6,7]. The placement of a chamber on the seafloor alters environmental conditions for the transport and reaction processes that mediate these fluxes, disrupting boundary layer flow, the intensity of photosynthetically active radiation (PAR, if present), the deposition of pelagic particles, and potentially the natural behaviour of bioturbating infauna and epifauna.
To prevent stagnation of the enclosed seawater, and mimic natural hydrodynamics, benthic chambers have a mechanism for internal mixing (paddle wheels, stirring bars, pumps). The design and speed settings of this mechanism can affect solute flux measurements because of its influence on the hydrodynamic conditions inside the chamber and, hence, the dimensions of the diffusive boundary layer (DBL) [4,8,9]. The DBL is a thin layer of water above the sediment surface in which frictional forces cause molecular diffusion to become the dominant mode of solute transport [10]. Its thickness scales with the bottom-current speed and the roughness of the sediment surface [11,12,13,14]. Solute diffusion across this layer is driven by the concentration gradient between the well-mixed water column above and the sediment porewater below.
As the DBL thickness increases, the distance for molecular diffusion increases, potentially increasing the impedance to solute exchange [5,7,15,16,17,18]. This effect depends, however, on the sediment’s biochemical activity [19,20]. A larger or smaller DBL does not necessarily imply a smaller or larger flux, respectively, because the solute concentration at the lower boundary of the DBL (sediment porewater) can simply decrease or increase in response, so that the gradient in the DBL and thus solute flux remain unchanged. A tight coupling between DBL thickness and solute flux is typically observed in organically enriched sediment or under conditions of low bottom-seawater solute concentration, where diffusion across the DBL acts as the rate-limiting step for solute exchange [5,21]. In such diffusion-limited scenarios, reducing DBL thickness by stirring steepens the concentration gradient and increases solute exchange. However, if solute diffusion across the DBL is faster than consumption, production, or transport inside the sediment, reaction kinetics or internal transport become the primary bottleneck. In these cases, reducing the DBL thickness only changes porewater concentrations without altering the gradient, making the stirrer speed less important [5].
Predicting how the sediment–seawater solute flux responds to changing DBL thickness is complicated by the kinetics and spatial mobility of sedimentary solute reaction zones [22]. For example, in organically enriched sediments, a proportion of the total O2 consumption is due to reoxidation of reduced carbon mineralisation products (e.g., NH4+, Fe2+, H2S) at the base of the oxygenated layer. This reaction zone, which includes reaction processes of different kinetics, can migrate vertically, and complex models are then required to predict the response [18]. In the example of a coastal sediment, such modelling showed that theoretical elimination of a DBL increased the O2 uptake of the sediment promptly, but this uptake soon declined and at steady state, it was only marginally higher [22]. In other words, sudden changes in the DBL thickness may affect the sediment solute flux in the short term, but less so in the long term, and this needs to be considered when deriving this flux from short-term chamber deployments.
Other effects are important too: Unnatural pressure gradients inside the chamber may affect the behaviour and thus bioturbation of benthic infauna, altering, for example, the flushing of animal burrows and associated solute exchange across the burrow walls [23]. Furthermore, touchdown of the lander can cause sediment resuspension, the severity of which depends on the system’s approach speed and landing angle. The biogeochemical impact of this resuspension will depend on sediment type, organic matter load, and temperature [24,25]. For example, resuspension can enhance O2 uptake by exposing reduced compounds and organic matter to oxygenated water, and by increasing the available particulate surface area for bacterial attachment [26,27,28,29].
The effects of both chamber stirring and deployment-induced particle resuspension on solute exchange measurements depend on the equipment’s engineering and the sediment’s biogeochemical functioning. Therefore, conclusions drawn from deployments of one lander design at one location may not apply to deployments of other designs at other locations. Here, in the absence of both in-depth knowledge of the chamber hydrodynamic performance and the local sediment biogeochemistry, we used an empirical approach with a customised Unisense A/S MiniChamber lander asking two questions: how do stirrer speed settings affect the sediment–seawater solute flux inside the chamber, and how do particles resuspended during deployment affect the flux measurements?
2. Materials and Methods
2.1. Study Site
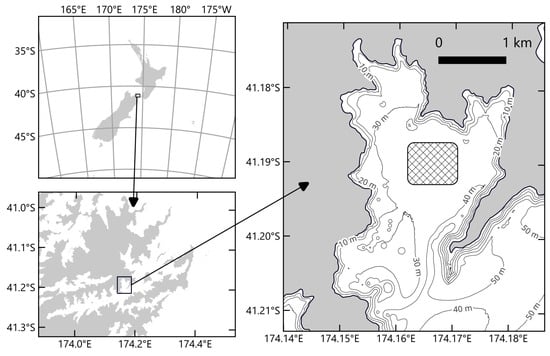
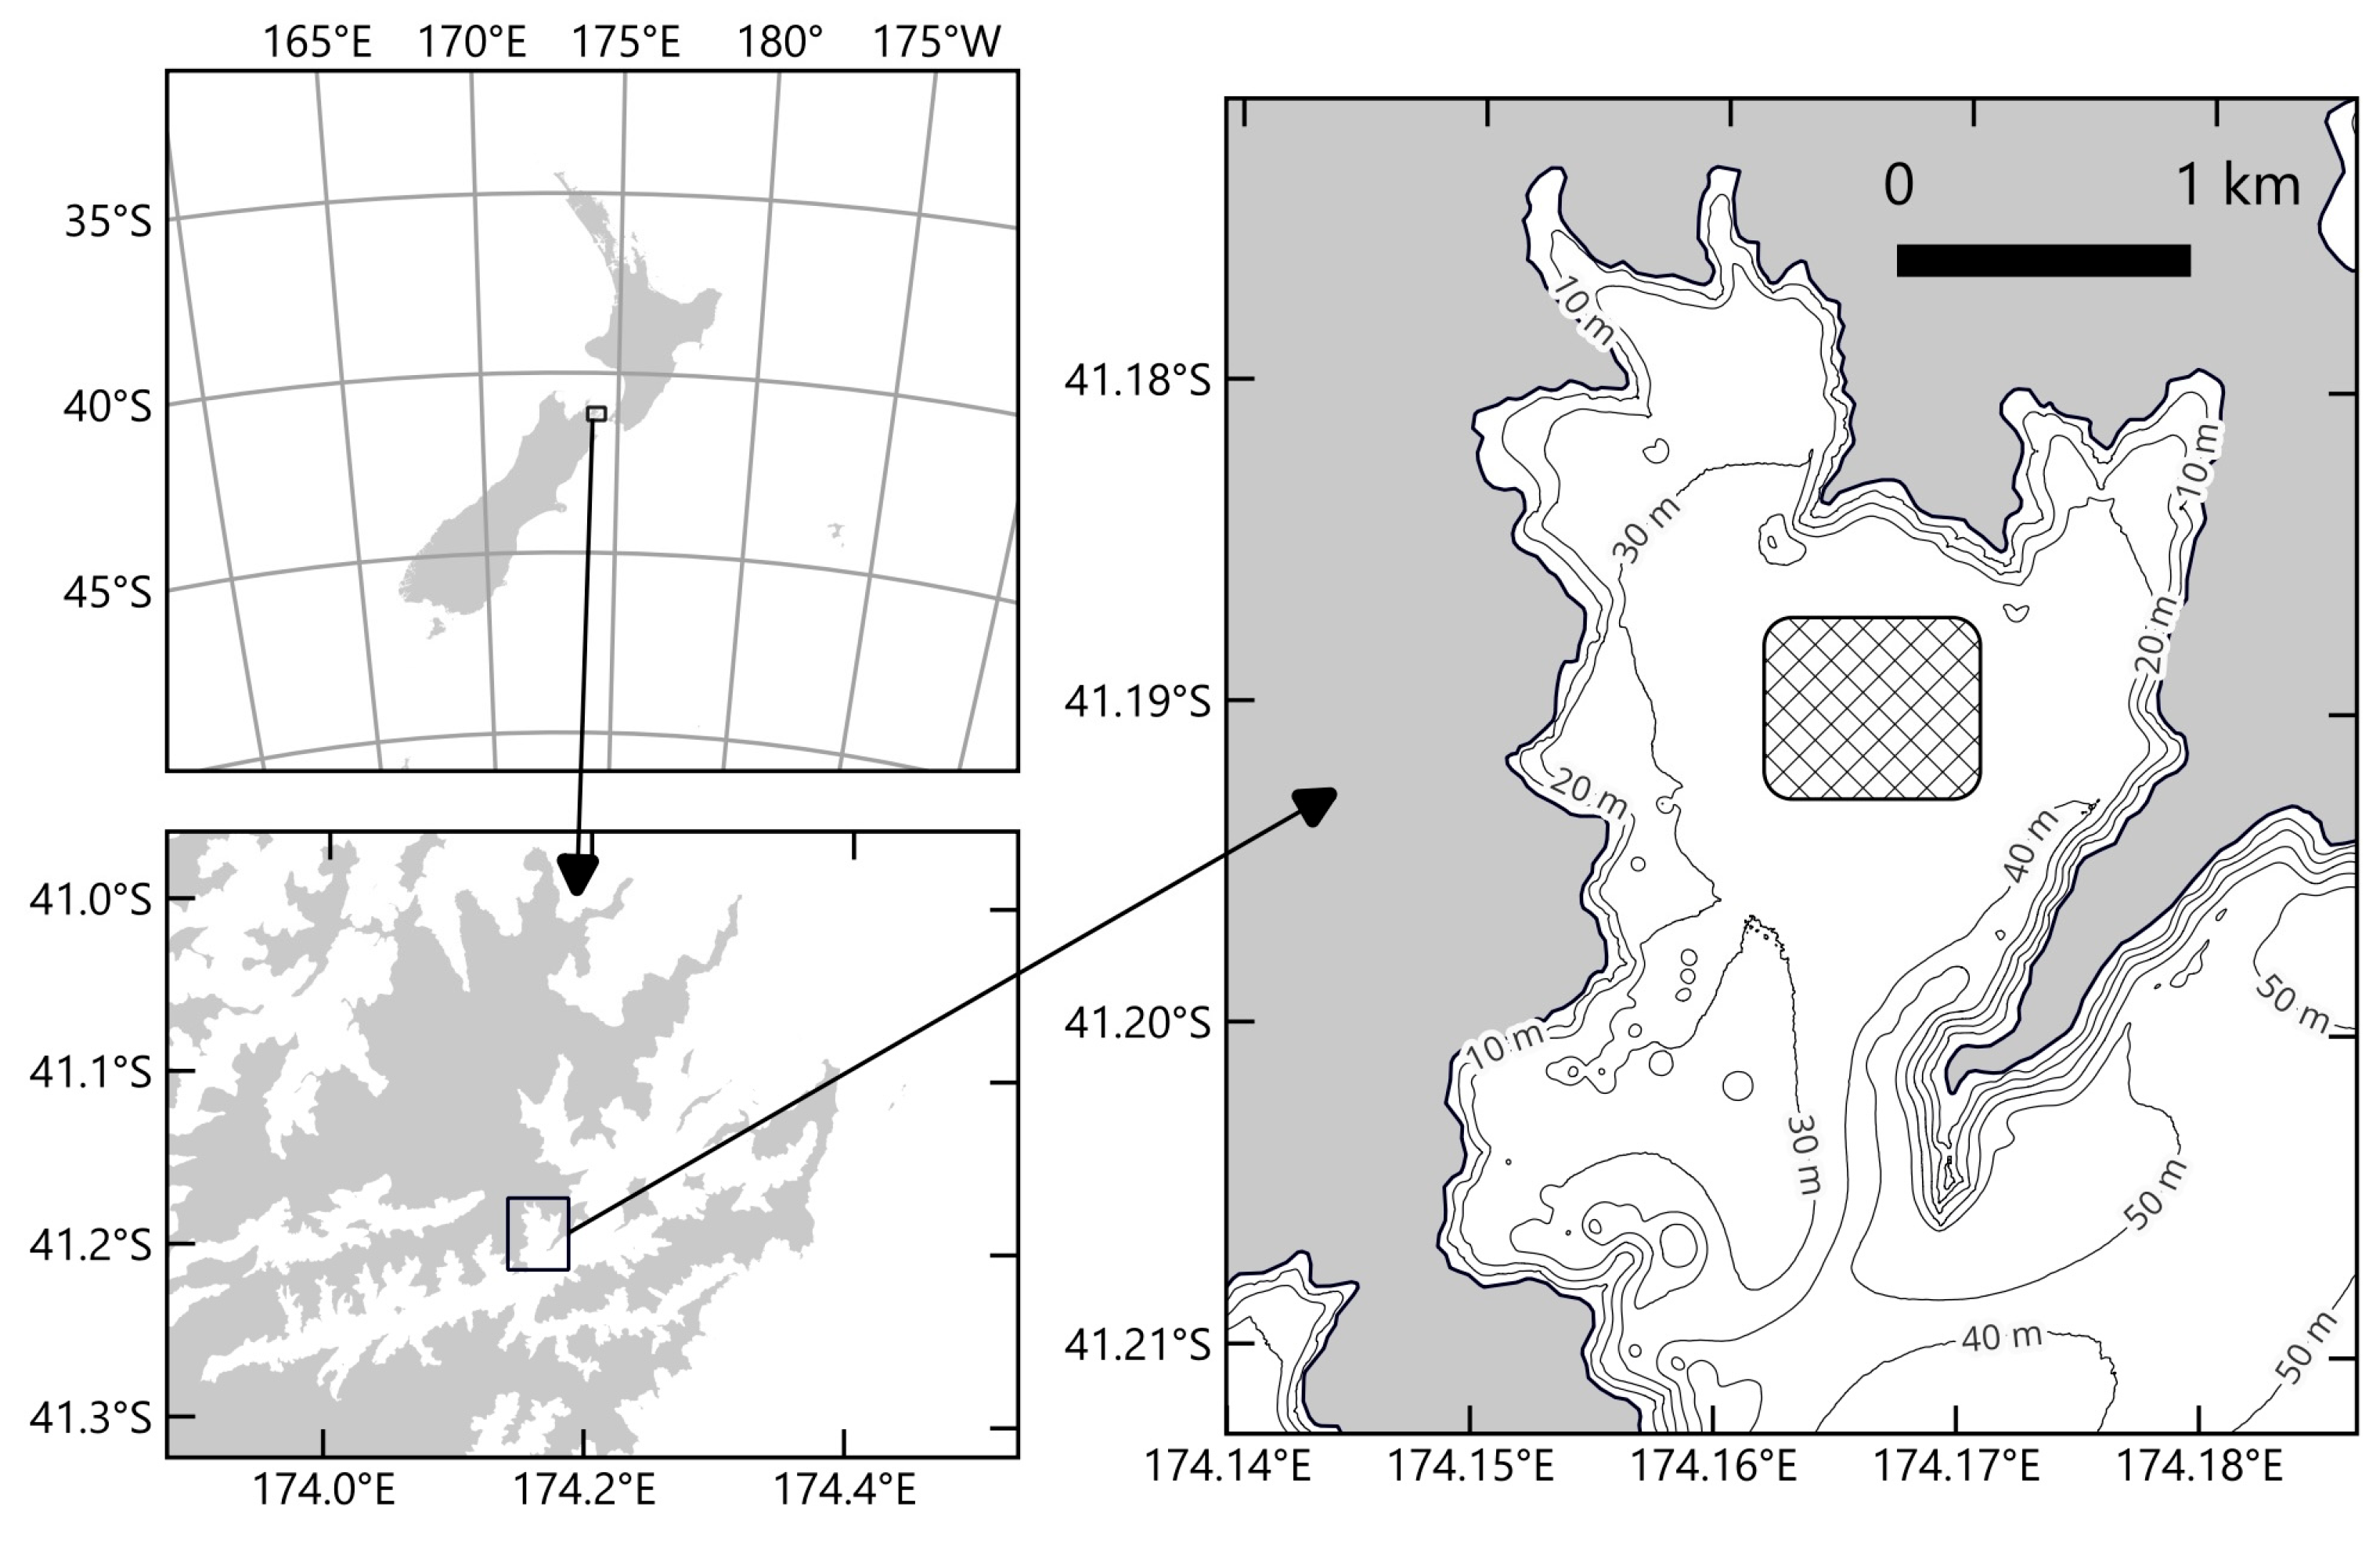
The Bay of Many Coves (also known as Miritū Bay, Figure 1) is one of the larger inlets of the inner Queen Charlotte Sound, located north of the Tory Channel, New Zealand. The mean spring tidal range is approximately 1.5 m, decreasing to about 0.5 m during neap tides. The bay is exposed to southerly winds that funnel through the Tory Channel and can generate large seas during gale conditions. The surrounding land comprises 52 ha of native and regenerating bush. Although the bay has no major rivers, small ephemeral streams and freshwater seeps are present and become more active after heavy rainfall. The seafloor in this part of the sound consists mainly of flat plains (63%) and broad slopes. We chose the deep, central, and sheltered plateau of the bay for our study to exclude confounding depth-related variations in sediment characteristics and bottom seawater hydrodynamic conditions (Figure 1). Between 15th and 20th of February 2023, the temperature and salinity of the bottom seawater of this plateau ranged 15.9–16.4 °C and 34.75–34.84, respectively.
Figure 1.
Charts showing the Bay of Many Coves in Queen Charlotte Sound of New Zealand. The hashed rectangle outlines the lander deployment site.
2.2. Study Design
We deployed the opaque chamber of a customised Unisense A/S MiniChamber lander once at each of 18 locations haphazardly placed within the central plateau of Bay of Many Coves, New Zealand (Figure 1). The deployments were completed over six consecutive days during morning, midday, and afternoon periods (Table 1). Our goal was to measure in situ sediment–seawater solute fluxes (dissolved O2, nitrate, ammonium, and phosphorus) in darkness and under hydrodynamic regimes generated by four chamber stirrer speeds (10, 17, 26, 35 rpm; Table 1). Limited by vessel charter time and resources, the two lowest stirrer speeds were tested only four times, while the two highest speeds were tested five times. We also monitored seawater turbidity inside the chamber to determine whether differences in the intensity of particle resuspension during deployments affected solute flux measurements, and to assess how stirrer speed influenced particle settlement over the deployment period. In addition, we recorded 28 CTD profiles over three days to evaluate the turbidity of the benthic boundary layer and describe the hydrographic structure of the water column (Table 2).
Table 1.
Bay of Many Coves. Benthic chamber lander deployment date, time, and location, and chamber stirrer settings (% maximum power, %pwrm; revolutions per min, rpm), and maximum intensity of downwelling PAR incident during the deployment period, 80 cm above the seafloor.
Table 2.
Date, time, and location of CTD profiles.
2.3. Benthic Chamber Lander
The Unisense A/S MiniChamber Lander consisted of a stainless-steel frame supporting a square acrylic chamber with rounded corners and a magnetic lid (30 × 30 × 35 cm). The chamber walls were covered with opaque adhesive tape to exclude light. The lid was fitted with a motor-driven stirrer (4 rods, length = 11 cm, diameter = 1.4 cm), a pneumatic silencer, and ports for two sensors: an Aanderaa O2 optode (model 4835) and a Seapoint turbidity sensor. The Aanderaa optode was powered and logged by a Unisense A/S field datalogger, while the turbidity sensor was connected to an RBRconcerto3 CTD multi-channel logger, which also recorded data from an LI-COR LI-192 quantum PAR sensor mounted on the lander frame above the chamber.
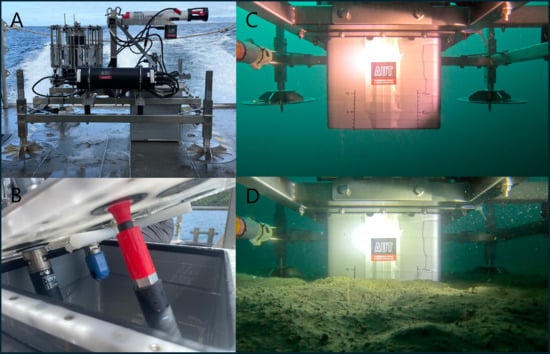
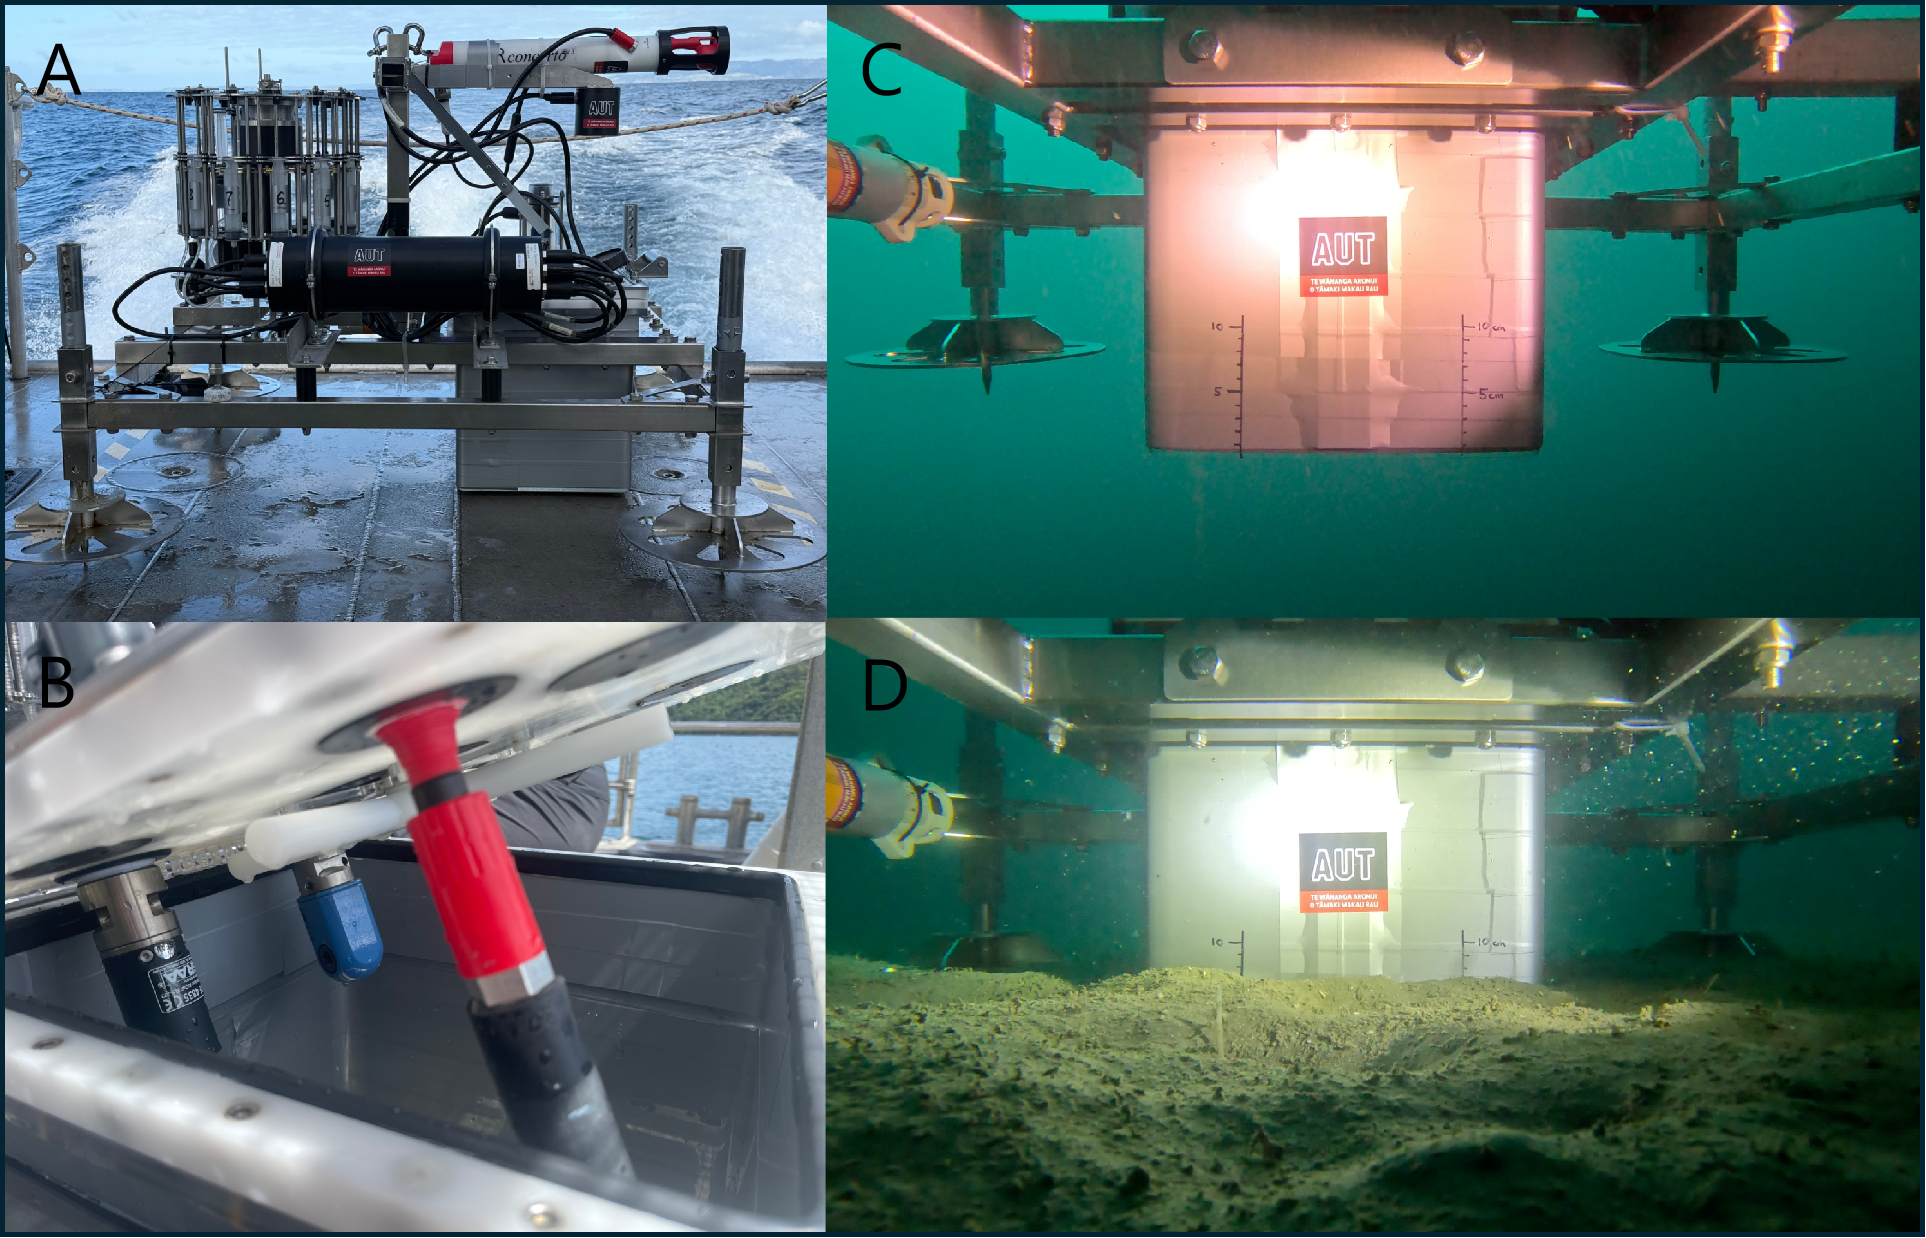
Furthermore, the lander frame housed a motor-driven syringe water sampler, a GoPro camera with lights, and a large magnet used to release the lid on command from the datalogger. The water-sampling rosette (Figure 2A) held spring-loaded polypropylene syringes connected via tubing to the sampling ports in the chamber lid. Their spring mechanism was triggered by a rotating, motor-driven actuator arm. All lander components, except the RBRconcerto3 CTD logger, the LICOR quantum sensor, the Seapoint turbidity sensor, and the GoPro camera, were part of the default Unisense A/S MiniChamber lander setup.
Figure 2.
Photographs of (A) the Unisense A/S MiniChamber Lander system, (B) the inside of the magnetic chamber lid with a stirrer in the centre, a turbidity sensor (Seapoint), an Aanderaa O2 optode and conductivity sensor, (C) a close-up view of the chamber, and (D) the deployed chamber.
2.4. Lander Deployment and Data Acquisition
After initiating a programmed ~3 h measurement sequence, we lowered the lander to the seafloor, reducing the winch speed during the final descent to minimise sediment disturbance, aiming for straight, vertical insertion. The lander feet were adjusted so that, upon reaching the seafloor, the chamber penetrated the sediment approximately 5 cm, enclosing ~27 L of bottom seawater. The actual penetration depth was determined from a photograph of the exterior chamber wall, on which a centimetre scale had been marked (Figure 2).
The measurement sequence began with a 10 min trigger delay to accommodate deployment. The stirrer was then set to 80% power (35 rpm), the logging frequency to 5 s, and the optode salinity setting to 35. With the chamber lid still open, the optode serial port was activated. The stirrer was then stopped and restarted at one of four power settings (20, 40, 60, or 80%, resulting in 10, 17, 26, or 35 rpm) after which the lid was closed. After 5 min of recording, four syringes were triggered to collect seawater from inside the chamber. The datalogger then continued recording for 180 min before releasing an additional four syringes for final seawater sampling. Throughout each deployment, the CTD logger continuously recorded data from the Seapoint turbidity sensor inside the chamber.
2.5. CTD Profiling and Sediment Collection
We used an RBRmaestro3 CTD multi-channel logger, equipped with an LI-COR LI-192 quantum PAR and a Seapoint turbidity sensor, to measure sets of four vertical water-column profiles at seven haphazardly chosen locations within the area marked in Figure 1, over three days (Table 2).
Five sediment cores were collected using a small NIOZ mono corer (Royal Netherlands Institute for Sea Research, Texel, The Netherlands) with a 54 mm diameter, 300 mm long acrylic tube. Cores were carefully extruded from the tube by inserting a plunger from the bottom of the tube and the top 2 cm was retained for granulometric and organic content analyses.
2.6. Sample Treatment and Analysis
Syringe seawater samples were filtered (0.45 µm Minisart) and frozen until analysis on an air-segmented continuous flow auto-analyzer (Astoria 2, Astoria Pacific, Oregon, OR, USA) configured for the simultaneous fluorometric determination of ammoniacal N (Am-N), and photometric determinations of nitrate (NO3-N), and soluble reactive phosphorus (SRP) using standard methods for seawater [30] and manufacture specifications.
The sediment core samples were homogenised and subsampled for analyses of organic matter contents as loss of weight after combustion [31]. The particle size distribution of the remaining sediment was determined with a laser particle size analyzer (EyeTech Ambivalue, Dussen, The Netherlands).
2.7. Data Analysis
We estimated the total O2 uptake (TOU; µmol O2 m−2 h−1) from the slope of the linear decline in chamber O2 concentration, the volume of the enclosed seawater, and the size of the enclosed sediment surface area (900 cm2). The volume of the enclosed seawater was determined using estimates of the chamber penetration depth, gathered from photos of a centimetre scale marked on the chamber as shown in Figure 2D. TOU served as a proxy for total sediment O2 demand under conditions of darkness, assuming that O2 consumption by the enclosed bottom seawater, if isolated from the sediment, offsets the measurement of the sediment consumption by <10 µmol O2 m−2 h−1 (K.V., unpublished results). In other words, the TOU is the sum of the sediment uptake of O2 from the bottom seawater and the O2 consumption caused by oxidation of reduced solutes released by the sediment into the bottom seawater.
The sediment–seawater fluxes of nitrate, ammonium and phosphorus were derived from the difference in concentration in seawater samples taken at the beginning and end of each deployment, the volume of the enclosed seawater (see above), and the size of the enclosed sediment surface area (900 cm2). Note that negative values indicate sediment solute release, while positive values indicate solute uptake.
Although turbidity inside the chamber was recorded continuously, only values measured seconds before contact of the chamber with the sediment, and at the start and end of the incubation period (closed lid) were used to derive the bottom seawater turbidity and particle-clearance rates, respectively. The latter were expressed as the change in turbidity (NTU) per hour.
The section of the PAR profile covering the water column from just below the sea surface and below 25 m depth were used to derive the diffuse light attenuation coefficient, Kd (m−1), following the Lambert–Beer equation, which models the exponential decay of light:
PAR(z) is the PAR intensity at depth z (m) and PAR(0) is the PAR intensity just below that seawater surface. To derive an average Kd, the negative slopes of the LN(PAR) versus depth plot were considered when R2 > 0.99.
2.8. Statistical Analysis
Statistical data analyses were performed in R Studio version 2026.01.01 [32]. The effects of stirrer speed (Stirrer), initial chamber turbidity (Turb), and time of day (TOD) on sediment–seawater solute fluxes were evaluated using analysis of covariance (ANCOVA). Note that the initial chamber turbidity is the turbidity measured after closure of the chamber lid, at the start of the incubation period (Table 3). Total oxygen uptake (TOU) and the fluxes of ammoniacal nitrogen (Am-N), nitrate nitrogen (NO3-N), and soluble reactive phosphorus (SRP) were analysed separately as response variables. Stirrer and Turb were included as continuous predictors, whereas TOD (morning, midday, and afternoon) was treated as a fixed categorical factor. For each response variable, the following general model was fitted: Response ~ Stirrer + Turb + TOD. Observations containing missing values for a response variable were excluded from the corresponding analysis. Type II sums of squares were used to evaluate the significance of individual predictors because the design was unbalanced owing to occasional missing observations. Model performance was evaluated using coefficients of determination (R2), and F-statistics and associated p-values were used to determine the significance of individual predictors at α = 0.05.
Table 3.
Total chamber O2 consumption (TOU), fluxes of ammoniacal nitrogen (Am-N), nitrate nitrogen (NO3-N), and soluble reactive phosphorus (SRP), and bottom seawater turbidity measured immediately before chamber contact with the sediment (BW), after closure of the chamber lid (Start), and at the end of the incubation period (End). Negative flux values (µmol m−2 h−1) indicate solute release by the sediment.
3. Results
3.1. Water Column and Sediment Properties
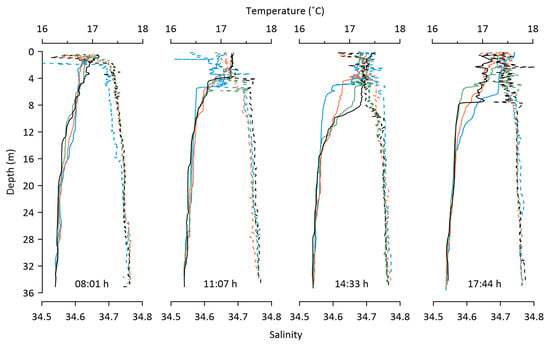
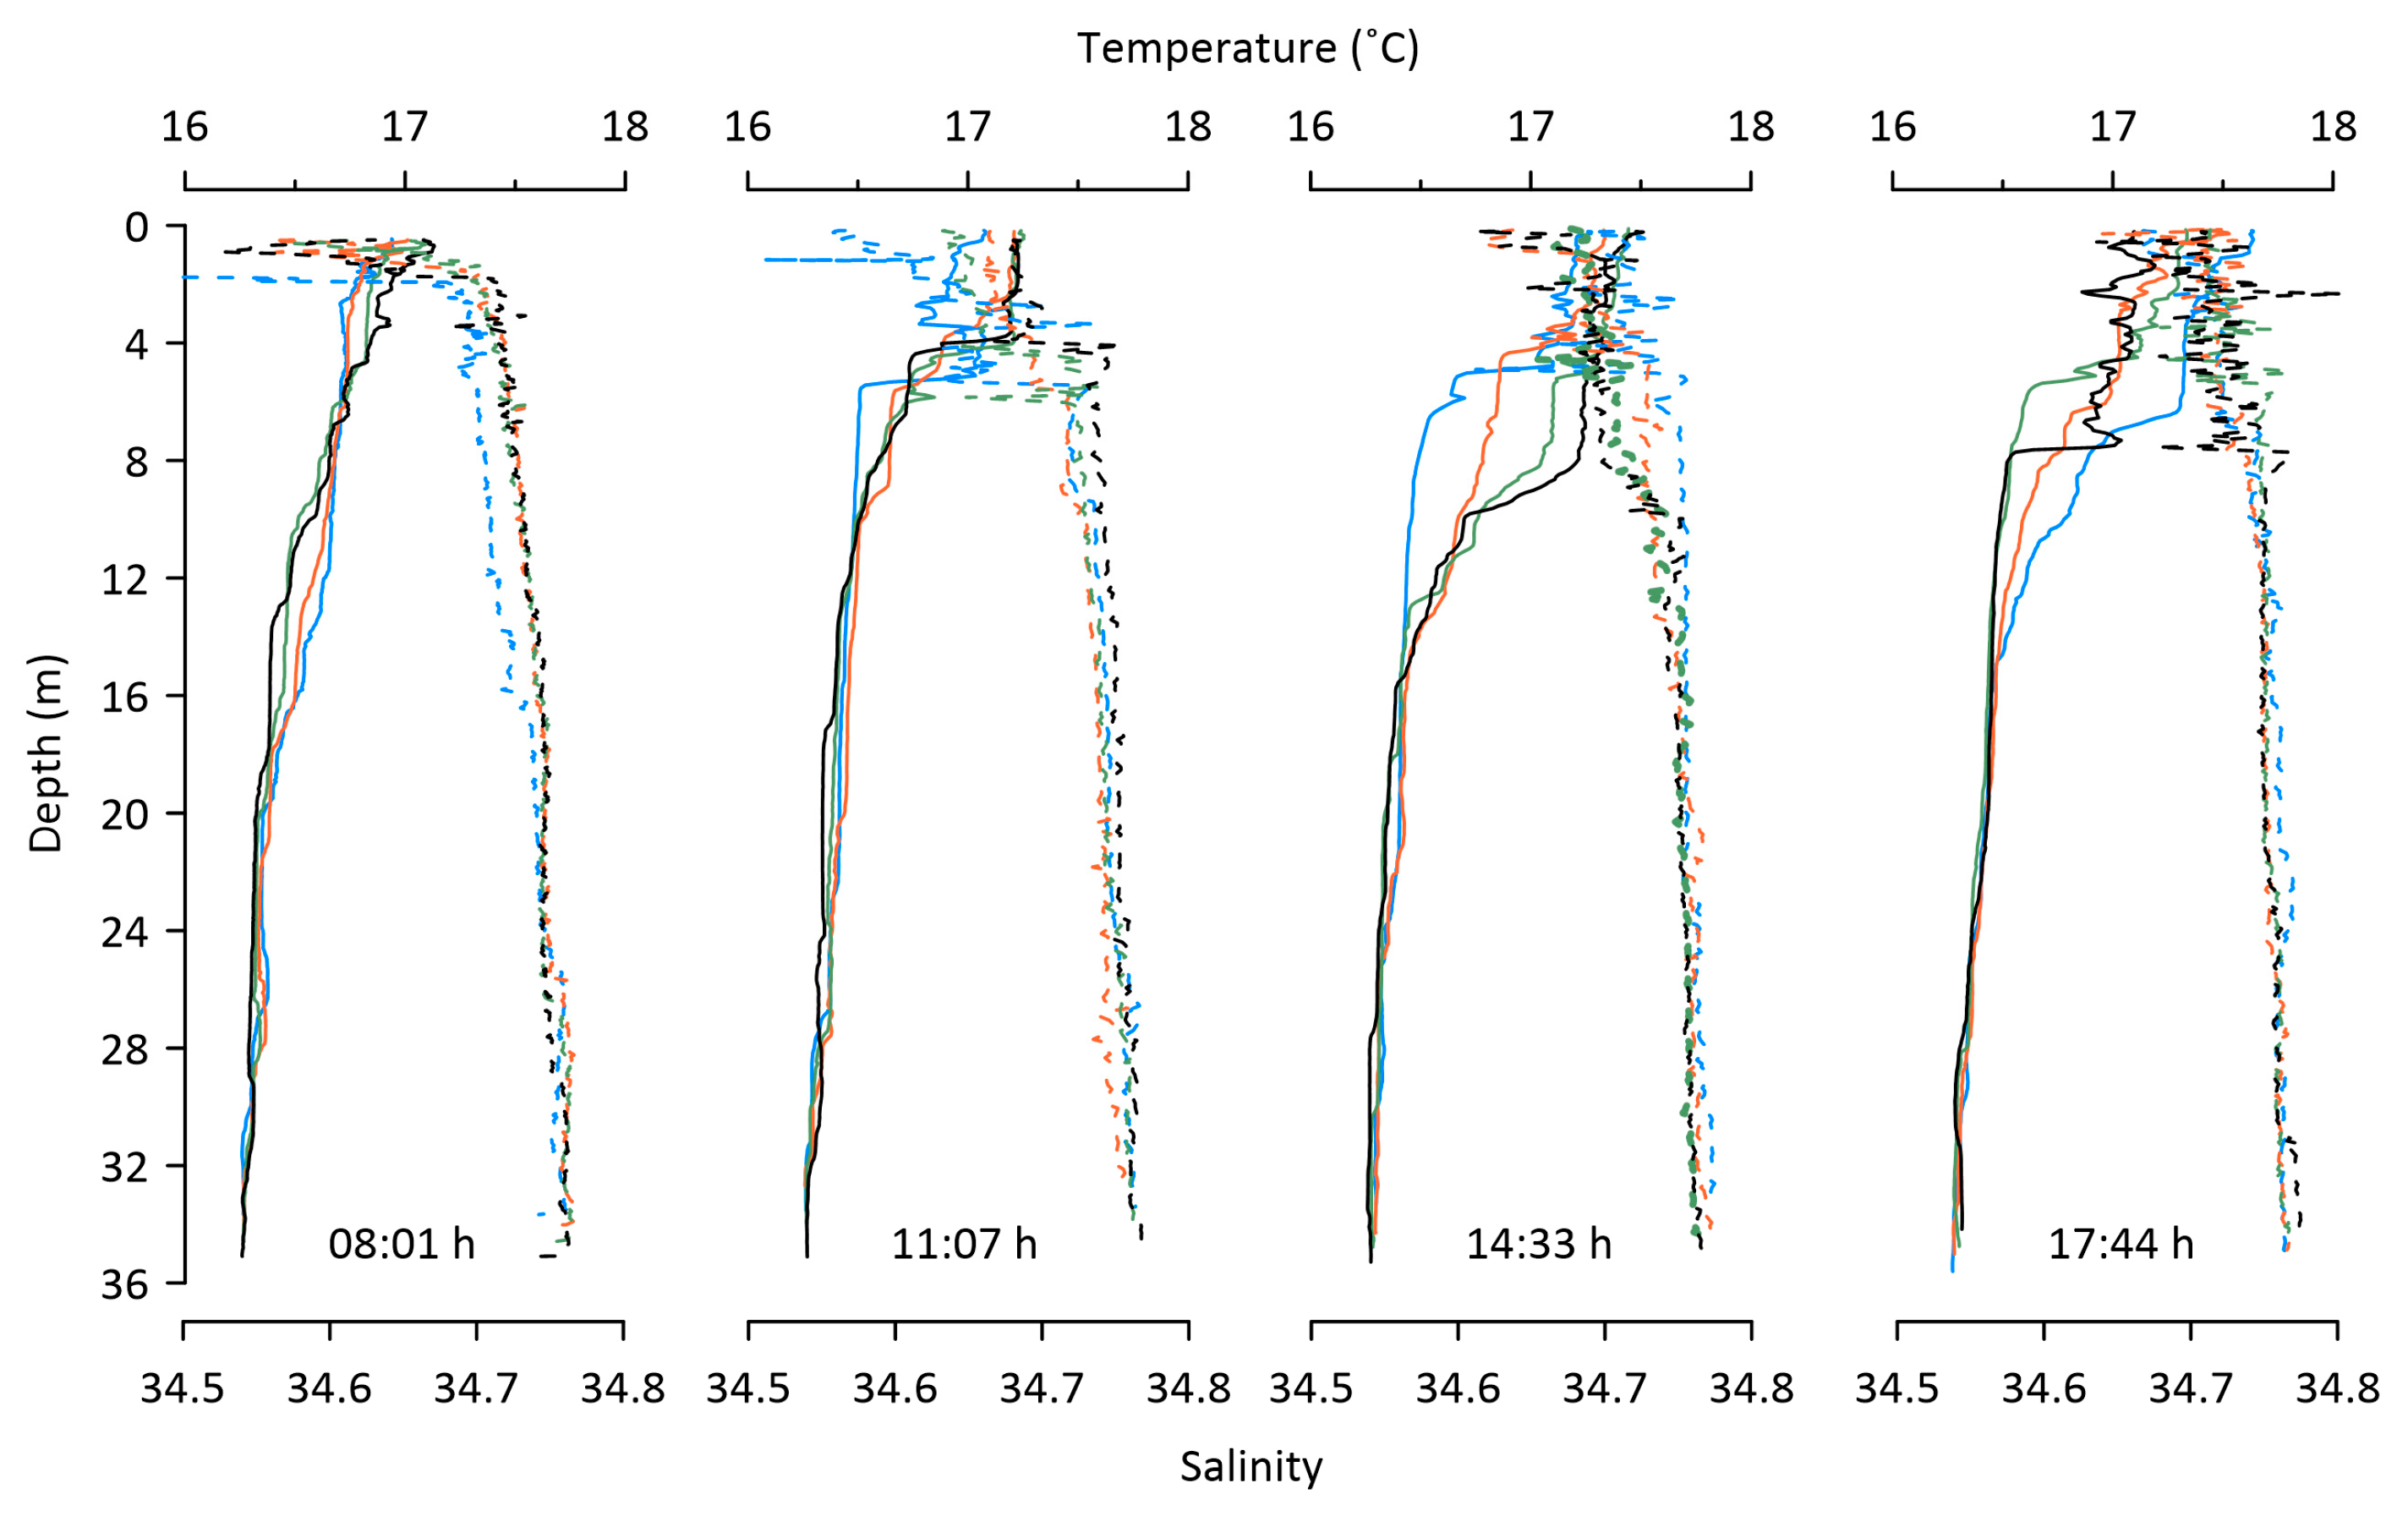
The surface mixed layer depth increased from 4 m in the morning to 6–8 m by late afternoon on 19 February 2023 (Figure 3). The diffuse light attenuation coefficient, Kd, averaged 0.139 ± 0.007 m−1 (Mean ± SE, n = 12). Near the seafloor, downwelling PAR reached midday values of ~13 µmol quanta m−2 s−1. Measurements conducted by the PAR sensor mounted on the chamber lander, approximately 0.6 m above the seabed, confirmed similar midday intensities of ~10 µmol quanta m−2 s−1 (Table 1).
Figure 3.
Bay of Many Coves, Queen Charlotte Sound, New Zealand. Time series of vertical temperature (solid lines) and salinity (dashed lines) profiles recorded on the 19 of February 2023. Coloured lines indicate replicate profiles.
The sediment comprising extremely poorly sorted (phi = 2.23) medium silt with 15% sand, 70% silt, and 15% clay (SD < 3%). The high proportion of clay and fine silt reflects the low-energy conditions, but the presence of fine sand indicates episodic high-energy events. Organic matter amounted 6.5 ± 0.7% (Mean ± SD, n = 5) of the sediment dry weight.
3.2. Bottom Seawater and Chamber Turbidity
The turbidity of the bottom seawater, measured ~40 cm above the seafloor before chamber contact, was 2.8 ± 0.3 NTU (n = 17). CTD profiles showed similar conditions, with a bottom seawater turbidity of 3.8 ± 0.2 NTU (n = 28). The turbidity inside the sealed chamber—measured ~10 cm above the sediment after lid closure—was more variable, ranging from 4.7 to 43.2 NTU (Table 3).
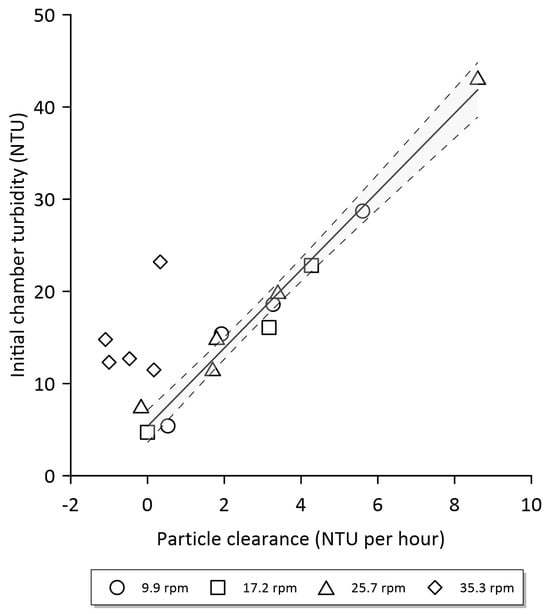
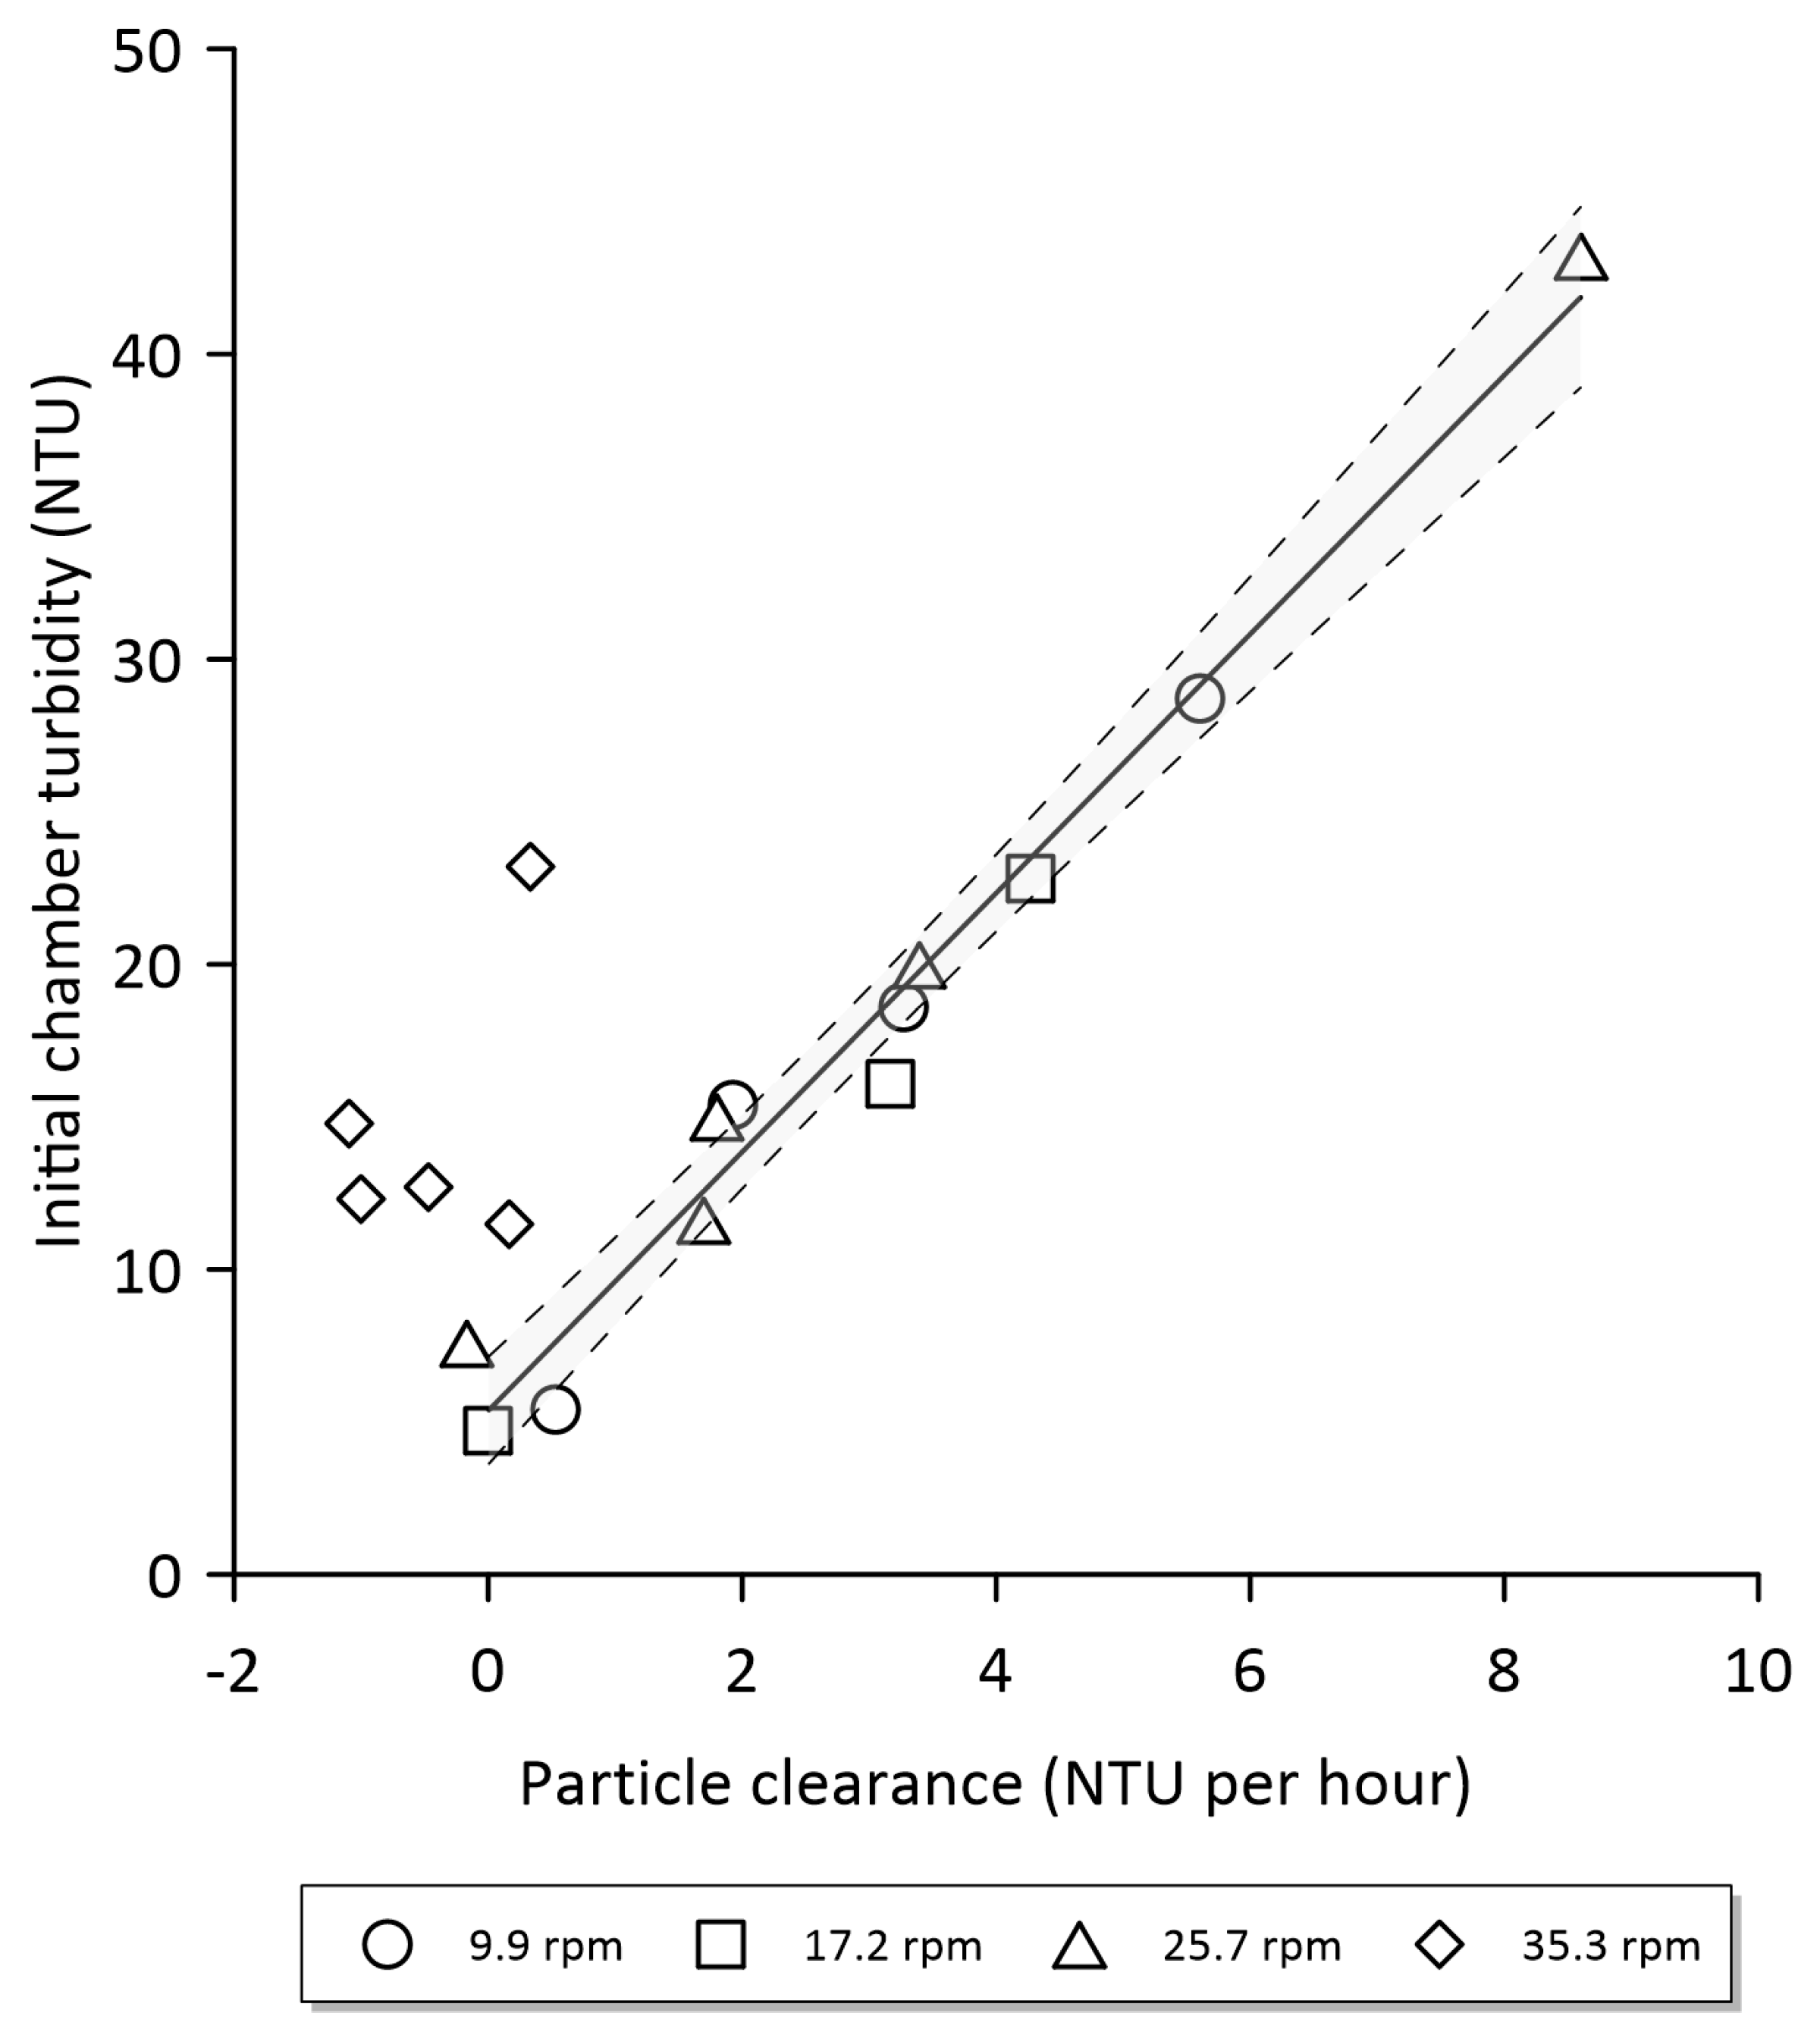
During the incubation period, the chamber turbidity declined at all stirrer speeds except the highest, reflecting particle settlement. Particle-clearance rates (NTU h−1) were linearly and positively related to the initial turbidity for stirrer speeds of 10, 17, and 26 rpm (Figure 4, Table 4). The fitted intercepts for these speeds (4.6, 4.4, and 6.7 NTU) indicate that turbidity would eventually approach levels slightly above the measured background turbidity of 3–4 NTU. High initial chamber turbidities and negative particle clearances observed at 35 rpm indicate that this stirrer speed resuspended sediment particles (Figure 4).
Figure 4.
Bay of Many Coves, Queen Charlotte Sound, New Zealand, February 2023. Benthic chamber suspended particle clearance (NTU per hour) as a function of initial chamber turbidity during three-hour deployments of a Unisense A/S MiniChamber lander at ~34 m water depth. The chamber stirrer was set to 9.9, 17.2, 25.7 or 35.3 rpm. The solid and dashed lines indicate the linear fit and 95% confidence limits, respectively, of combined particle clearances at 9.9, 17.2, and 25.7 rpm stirrer speeds.
Table 4.
Summary statistics of the linear fits of particle clearance (NTU per hour) versus initial chamber turbidity (NTU) shown in Figure 4. R2, coefficient of determination; R, correlation coefficient; p, p-value. Slope and intercept are given with standard error (SE).
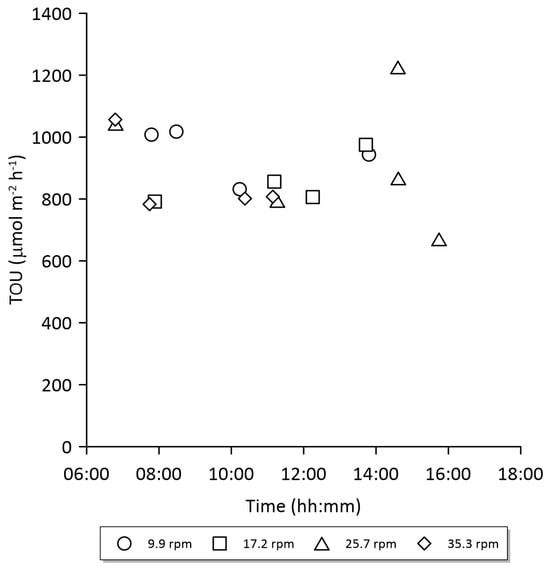
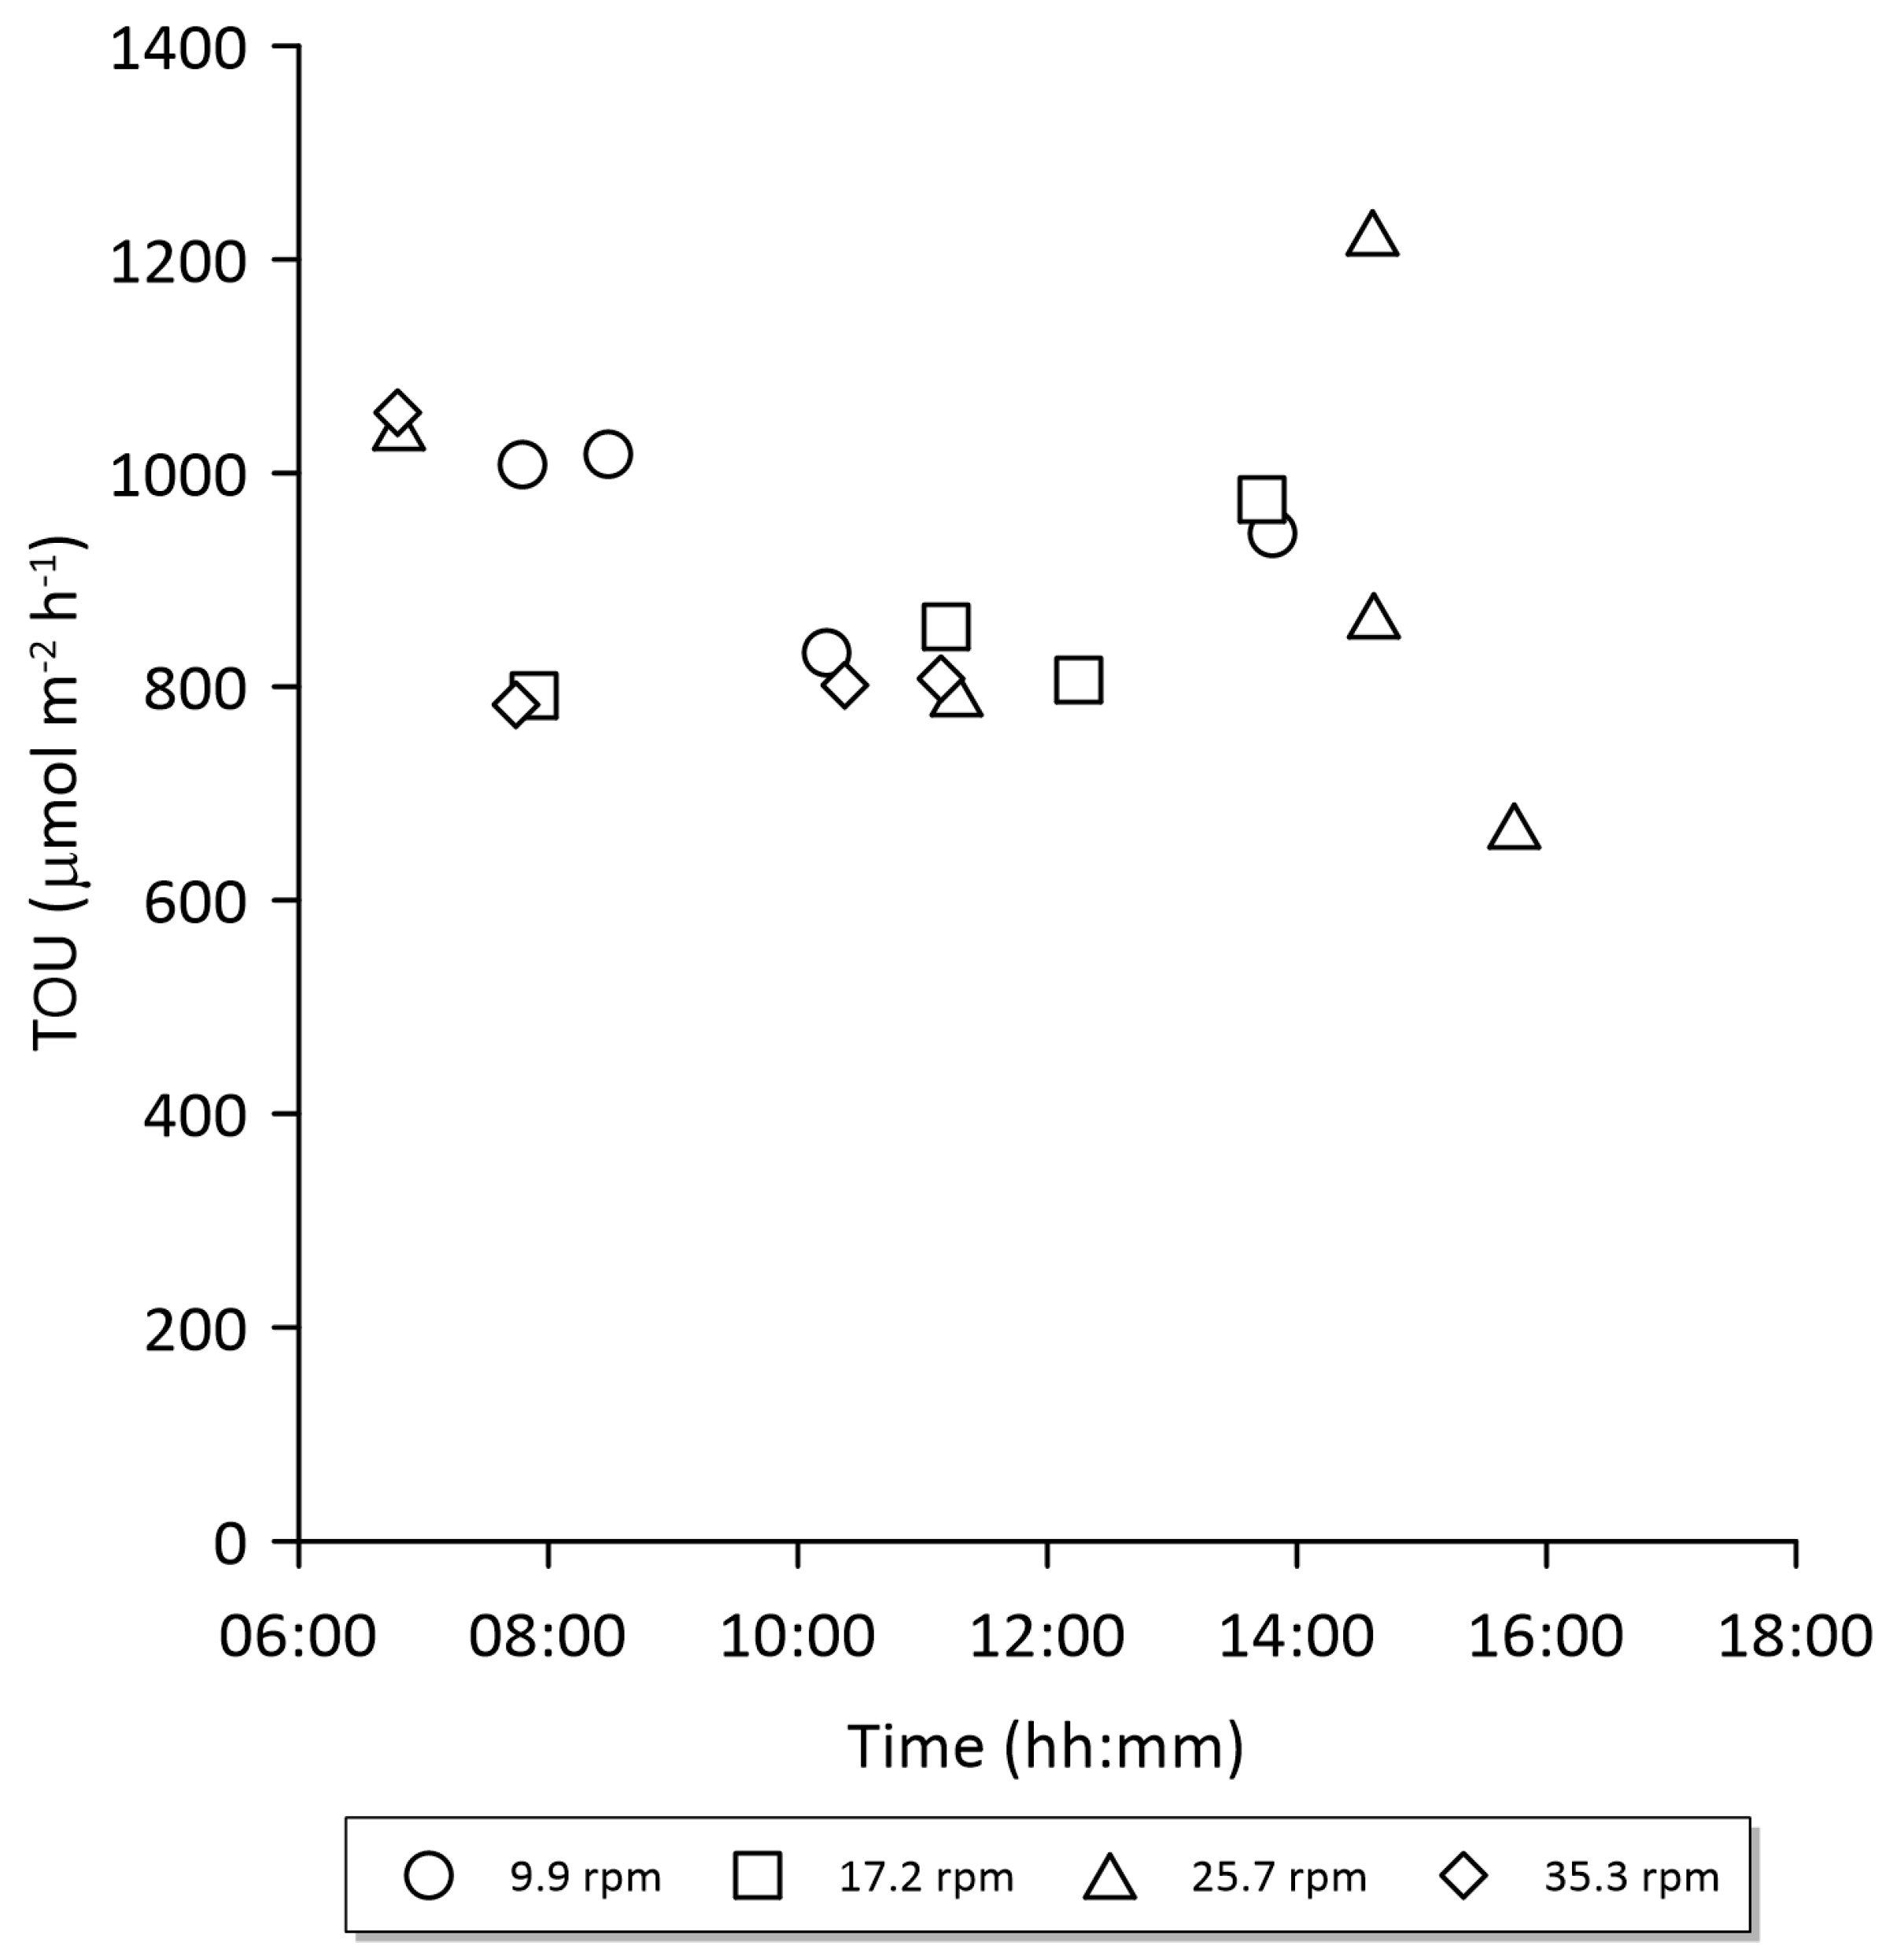
Univariate ANCOVA revealed a significant negative effect of the initial chamber turbidity (Turb) on TOU (Table 5, F1,10 = 7.72, p = 0.02, R2 = 0.54). There was insufficient evidence for effects of Turb on the fluxes of ammonium, nitrate, and soluble reactive phosphorus. Similarly, ANCOVA failed to detect a significant effect of stirrer speed (Stirrer) or time of day (TOD) on any of the response variables (Table 5). Notably, midday TOU exhibited little variation across stirrer speeds (mean 748 ± 9 µmol m−2 h−1; n = 6; Figure 5), whereas morning and afternoon TOU were more variable (872 ± 48 µmol m−2 h−1, n = 6; and 859 ± 82 µmol m−2 h−1, n = 5, respectively).
Table 5.
Results of separate analyses of covariance ANCOVA testing the effects of stirrer speed (Stirrer), initial chamber turbidity (Turb), and time of day (TOD) on sediment–seawater solute fluxes. Analyses were conducted separately for total oxygen uptake (TOU), and the sediment–seawater fluxes of ammoniacal nitrogen (Am-N), nitrate nitrogen (NO3-N), and soluble reactive phosphorus (SRP), with TOD treated as a categorical factor and Stirrer and Turb as continuous predictors. Sum Sq, sum of squares; Df, degrees of freedom; F, F-statistics; p, p-value. Significant effects (p < 0.05) are indicated in bold.
Figure 5.
Bay of Many Coves, Queen Charlotte Sound, New Zealand. Total chamber O2 consumption, TOU, as a function of time of day. TOU was measured under conditions of darkness and four different stirrer speeds.
Given the modest sample size and residual degrees of freedom (df = 10) across all models, the study has limited power except for large effects: Sensitivity analysis indicated low power to detect small (f2 = 0.02; power = 7.3%) or medium (f2 = 0.15; power = 22.9%) effects, and moderate power to detect large effects (f2 = 0.35; power = 45.7%). Non-significant results should therefore be interpreted with caution, as the analyses were underpowered to detect all but the largest effects.
4. Discussion
Boundary layer theory suggests that stirrer speed in a benthic chamber affects the thickness of the diffusive boundary layer (DBL) of the enclosed sediment, but in practice this only matters when molecular diffusion across this layer is the rate-limiting step. Our analyses of solute flux data acquired with a customised Unisense A/S MiniChamber lander configuration indicated that molecular diffusion across the DBL of the Bay of Many Coves seafloor may not have been the rate-limiting step. The TOU of the bay’s cohesive sediment and sediment–seawater exchanges of nitrate, ammonium, and phosphorus were insensitive to variations in chamber stirring within the 10–35 rpm range. Perhaps the lowest stirrer speed was sufficient to overcome any DBL impedance, so that integrated solute reaction rates (kinetics of sedimentary reaction processes), not molecular diffusion, determined sediment–seawater solute exchanges. Earlier studies using other chamber designs and types of stirring mechanisms support this interpretation [3,4,33,34]. In consensus, these studies indicate that chamber hydrodynamics is of minor importance when working in areas where the DBL impedance can be ignored. Tengberg et al. [3], for example, compared different benthic flux chambers with different stirring mechanisms under conditions ranging from slow mixing to just noticeable sediment resuspension. Their variations in chamber mixing did not generate statistically significant differences between chamber types for O2 and nutrient fluxes.
Our PAR measurements confirmed what was considered in the planning of this field study: that the 34 m deep seafloor of the Bay of Many Coves receives sufficient light during the day to fuel benthic photosynthetic O2 production. To exclude the diurnal variations in such production as a confounding factor (sun’s azimuth and altitude, clouds, water column properties including surface waves), we deployed an opaque chamber and then assumed that our chamber solute flux measurements would be independent of the intensity of PAR incident at the seafloor. A similar approach was used by Vopel et al. [35] producing estimates of the TOU of a 50 m deep seafloor in Tasmania. There, deployments were performed not just at different times of the day but at different sites along a transect heading towards a fish farm to study the farm’s depositional footprint in the seafloor ecosystem.
We note, however, that other potentially confounding factors remain, such as diel variations in faunal activity, and a behavioural response of fauna to chamber-induced changes in the boundary layer flow. As shown in Figure 5, TOU measured in the morning and afternoon varied largely (SE = 48 and 82 µmol m−2 h−1), while estimates of the midday TOU varied an order of magnitude less (SE = 9 µmol m−2 h−1). The overall average of these estimates, 824 µmol m−2 h−1, followed Glud’s power function TOU = 284 z−0.74 (Figure 16 in [5]): Given a water depth of 34 m, this function predicts a consumption of ~20.9 mmol O2 m−2 d−1 or 871 µmol O2 m−2 h−1. This value is remarkably close to our estimate—an unexpected match given the semi-enclosed nature of the Bay of Many Coves.
The variations in TOU observed in the morning and afternoon could have come from the chamber’s inability to integrate the activities of patchily distributed benthic microphyte and macrofaunal species. These organisms influence sediment–seawater O2 flux through respiration, photosynthesis, and bioturbation. As observed in many shallow-water systems, macrofauna grazing will have sustained a patchy distribution of benthic microphytes. Locations at which microphytes had accumulated would have exhibited pronounced diel oscillations in TOU with a higher O2 uptake at night and in the morning due to algae respiration, and increasingly lower uptake as benthic photosynthetic O2 production increased during the day. If the chamber measurements of TOU exhibited hysteresis, then the range of TOU observed in the morning would have exceeded that observed at midday as shown in Figure 5, caused by higher O2 uptake of sediment densely populated by microphytes. However, such an effect would not explain the range of TOU observed in the afternoon; during this time of the day, the hysteresis effect should have extended the range towards lower uptake.
Another cause of variations in TOU is spatial differences in the intensity of macrofauna bioturbation. The occasional inclusion of a large or more active species would extend the range of observed TOU, but this should be the case for all three measurement periods. If, however, such species displayed circadian rhythms in their activity governed by an endogenous (internal) clock, then intense burrowing, feeding, or sediment reworking during morning and afternoon hours would cause local hotspots in TOU, while midday cessation of this activity would explain the similarity of TOU estimates.
Our chamber turbidity measurements showed that (a) the chamber lander deployment with a rope and winch caused the sediment surface to resuspend during touchdown, likely due to boat drift adding a horizontal component to the lander’s path, and (b) a wide range of stirrer power settings (20–60%) are suitable because they allow suspended particles to settle as they would under natural boundary layer flow conditions (Figure 4). In other more exposed environments, sea surface waves and strong bottom currents can further complicate the situation if the lander remains tied to a rope during touchdown. If particles of the sediment surface layer resuspended during touchdown escape the chamber and drift away, this would lead to an underestimation of the natural sediment O2 demand because these particles constitute freshly sedimented reactive organic material that accounts for much of the sediments’ O2 demand. This reasoning may explain our evidence for a negative effect of chamber turbidity on TOU (Table 5). High initial turbidity marked incidents of rough chamber landing with potential loss of freshly deposited particles causing a lower sediment O2 uptake.
While our findings add confidence to the utility of a large range of the Unisense A/S MiniChamber lander’s stirrer speed settings, this range may not apply to organically enriched sites where the sediment O2 demand exceeds the supply by diffusion across the DBL. For example, in applications where chamber deployments cover a gradient in sediment organic matter content [35], the most enriched sites should be trialled to determine if the seafloor TOU is in fact insensitive to the degree of chamber stirring. As the sediment’s O2 demand increases, diffusive molecular transport across the DBL may become the bottleneck, and mimicking realistic boundary layer conditions may then be important.
Author Contributions
Conceptualisation, K.V. and D.R.P.; data acquisition, K.V., D.R.P. and E.Z.; formal analysis, E.Z. and K.V.; resources, K.V.; writing—original draft preparation, E.Z. and K.V.; writing—review and editing, E.Z., K.V. and D.R.P.; supervision, K.V.; project administration, K.V. and D.R.P.; funding acquisition, K.V. and D.R.P. All authors have read and agreed to the published version of the manuscript.
Funding
The authors acknowledge the financial support of the Blue Economy Cooperative Research Centre, established and supported under the Australian Government’s CRC Programme, grant number CRCXX000001 (previously 20180101), and the New Zealand Seafood Innovations Ltd.
Informed Consent Statement
Not applicable.
Data Availability Statement
Data will be made available on request.
Acknowledgments
We thank Anika Kuczynski, Michelle Simone, and the crews of the NIWA research vessel Ikatere for assistance and logistical support.
Conflicts of Interest
The authors declare no conflicts of interest.
Abbreviations
The following abbreviations are used in this manuscript:
| Am-N | Ammoniacal nitrogen |
| CTD | Conductivity, temperature, depth |
| DBL | Diffusive boundary layer |
| Kd | Diffuse light attenuation coefficient |
| NIOZ | Royal Netherlands Institute for Sea Research |
| NO3-N | Nitrate nitrogen |
| NTU | Nephelometric turbidity unit |
| PAR | Photosynthetic active radiation |
| SE | Standard error |
| SRP | Soluble reactive phosphorus |
| Stirrer | Stirrer speed |
| TOD | Time of day |
| TOU | Total sediment O2 uptake |
| Turb | Turbidity |
References
- Berelson, W.M.; Hammond, D.E.; Smith, K.L., Jr.; Jahnke, R.A.; Devol, A.H.; Hinga, K.R.; Rowe, G.T.; Sayles, F. In-situ benthic flux measurement devices: Bottom lander technology. Mar. Technol. Soc. J. 1987, 21, 26–32. [Google Scholar]
- Tengberg, A.; de Bovée, F.; Hall, P.; Berelson, W.; Chadwick, D.; Ciceri, G.; Crassous, P.; Devol, A.; Emerson, S.; Gage, J.; et al. Benthic chamber and profiling landers in oceanography—A review of design, technical solutions and functioning. Prog. Oceanogr. 1995, 35, 253–292. [Google Scholar] [CrossRef] [Scilit]
- Tengberg, A.; Stahl, H.; Gust, G.; Muller, V.; Arning, U.; Andersson, H.; Hall, P.O.J. Intercalibration of benthic flux chambers: I. Accuracy of flux measurements and influence of chamber hydrodynamics. Prog. Oceanogr. 2004, 60, 1–28. [Google Scholar] [CrossRef] [Scilit]
- Tengberg, A.; Hall, P.O.J.; Andersson, U.; Lindén, B.; Styrenius, O.; Boland, G.; de Bovee, F.; Carlsson, B.; Ceradini, S.; Devol, A.; et al. Intercalibration of benthic flux chambers II. Hydrodynamic characterization and flux comparisons of 14 different designs. Mar. Chem. 2005, 94, 147–173. [Google Scholar]
- Glud, R.N. Oxygen dynamics in marine sediments. Mar. Biol. Res. 2008, 4, 243–289. [Google Scholar] [CrossRef] [Scilit]
- Griffiths, J.R.; Kadin, M.; Nascimento, F.J.A.; Tamelander, T.; Törnroos, A.; Bonaglia, S.; Bonsdorff, E.; Brüchert, V.; Gårdmark, A.; Järnström, M.; et al. The importance of benthic–pelagic coupling for marine ecosystem functioning in a changing world. Glob. Change Biol. 2017, 23, 2179–2196. [Google Scholar] [CrossRef] [Scilit]
- Jørgensen, B.B.; Wenzhöfer, F.; Egger, M.; Glud, R.N. Sediment oxygen consumption: Role in the global marine carbon cycle. Earth Sci. Rev. 2022, 228, 103987. [Google Scholar] [CrossRef] [Scilit]
- Berelson, W.M.; Hammond, D.E. The calibration of a new free-vehicle benthic flux chamber for use in the deep sea. Deep Sea Res. 1986, 33, 1439–1454. [Google Scholar] [CrossRef] [Scilit]
- Broström, G.; Nilsson, J. A theoretical investigation of the diffusive boundary layer in benthic flux chamber experiments. J. Sea Res. 1999, 42, 179–189. [Google Scholar] [CrossRef] [Scilit]
- Santschi, P.; Bower, P.; Nyffeler, U.P.; Azevedo, A.; Broecker, S. Estimates of the resistance to chemical transport posed by the deep-sea boundary layer. Limnol. Oceanogr. 1983, 28, 899–912. [Google Scholar] [CrossRef] [Scilit]
- Archer, D.; Emerson, S.; Smith, C.R. Direct measurement of the diffusive sublayer at the deep sea floor using oxygen microelectrodes. Nature 1989, 340, 623–626. [Google Scholar] [CrossRef] [Scilit]
- Gundersen, J.K.; Jørgensen, B.B. Microstructure of diffusive boundary layers and the oxygen uptake of the sea floor. Nature 1990, 345, 604–607. [Google Scholar] [CrossRef] [Scilit]
- Boudreau, B.P. Solute transport across the sediment-water interface: Diffusive boundary layers and beyond. In The Benthic Boundary Layer: Transport Processes and Biogeochemistry; Oxford University Press: Oxford, UK, 2001; pp. 121–146. [Google Scholar]
- Røy, H.; Hüttel, M.; Jørgensen, B.B. The role of small-scale sediment topography for oxygen flux across the diffusive boundary layer. Limnol. Oceanogr. 2002, 47, 837–847. [Google Scholar] [CrossRef] [Scilit]
- Jørgensen, B.B.; Revsbech, N.P. Diffusive boundary layers and the oxygen uptake of sediments and detritus. Limnol. Oceanogr. 1985, 30, 111–122. [Google Scholar] [CrossRef] [Scilit]
- Hall, P.O.J.; Anderson, L.G.; Rutgers van der Loeff, M.M.; Sundby, B.; Westerlund, S.F.G. Oxygen uptake kinetics in the benthic boundary layer. Limnol. Oceanogr. 1989, 34, 734–746. [Google Scholar] [CrossRef] [Scilit]
- Arega, F.; Lee, J.H.W. Diffusional mass transfer at sediment-water interface of cylindrical sediment oxygen demand chamber. J. Environ. Eng. 2005, 131, 755–766. [Google Scholar] [CrossRef] [Scilit]
- Boudreau, B.P.; Jørgensen, B.B. The Benthic Boundary Layer: Transport Processes and Biogeochemistry; Oxford University Press: Oxford, UK, 2001. [Google Scholar]
- Kelly-Gerreyn, B.A.; Hydes, D.J.; Waniek, J.J. Control of the diffusive boundary layer on benthic fluxes: A model study. Mar. Ecol. Prog. Ser. 2005, 292, 61–74. [Google Scholar] [CrossRef] [Scilit]
- Rasmussen, H.; Jørgensen, B.B. Microelectrode studies of seasonal oxygen uptake in a coastal sediment: Role of molecular diffusion. Mar. Ecol. Prog. Ser. 1992, 81, 289–303. [Google Scholar] [CrossRef] [Scilit]
- Jørgensen, B.B.; Des Marais, D.J. The diffusive boundary layer of sediments: Oxygen microgradients over a microbial mat. Limnol. Oceanogr. 1990, 35, 1343–1355. [Google Scholar] [CrossRef] [Scilit]
- Glud, R.N.; Berg, P.; Fossing, H.; Jørgensen, B.B. Effect of the diffusive boundary layer on benthic mineralization and O2 distribution: A theoretical model analysis. Limnol. Oceanogr. 2007, 52, 547–557. [Google Scholar] [CrossRef] [Scilit]
- Webb, A.P.; Eyre, B.D. The effects of two benthic chamber stirring systems on the diffusive boundary layer, oxygen flux, and passive flow through model macrofauna burrows. Estuaries 2004, 27, 352–361. [Google Scholar] [CrossRef] [Scilit]
- Almroth, E.; Tengberg, A.; Andersson, J.H.; Pakhomova, S.; Hall, P.O.J. Effects of resuspension on benthic fluxes of oxygen, nutrients, dissolved inorganic carbon, iron and manganese in the Gulf of Finland, Baltic Sea. Cont. Shelf Res. 2009, 29, 807–818. [Google Scholar] [CrossRef] [Scilit]
- Almroth-Rosell, E.; Tengberg, A.; Andersson, S.; Apler, A.; Hall, P.O.J. Effects of simulated natural and massive resuspension on benthic oxygen, nutrient and dissolved inorganic carbon fluxes in Loch Creran, Scotland. J. Sea Res. 2012, 72, 38–48. [Google Scholar] [CrossRef] [Scilit]
- Wainright, S.C. Stimulation of heterotrophic microplankton production by resuspended marine sediments. Science 1987, 238, 1710–1712. [Google Scholar] [CrossRef] [Scilit]
- Wainright, S.C. Sediment-to-water fluxes of particulate material and microbes by resuspension and their contribution to the planktonic food web. Mar. Ecol. Prog. Ser. 1990, 62, 271–281. [Google Scholar] [CrossRef] [Scilit]
- Wainright, S.C.; Hopkinson, C.S., Jr. Effects of sediment resuspension on organic matter processing in coastal environments: A simulation model. J. Mar. Syst. 1997, 11, 353–368. [Google Scholar] [CrossRef] [Scilit]
- Sloth, N.P.; Riemann, B.; Nielsen, L.P.; Blackburn, T.H. Resilience of pelagic and benthic microbial communities to sediment resuspension in a coastal ecosystem, Knebel Vig, Denmark. Estuar. Coast. Shelf Sci. 1996, 42, 405–415. [Google Scholar] [CrossRef] [Scilit]
- Clesceri, L.S.; Greenberg, A.E.; Eaton, A.D. Standard Methods for the Examination of Water and Wastewater, 20th ed.; American Public Health Association: Washington DC, USA, 1998. [Google Scholar]
- Luczak, C.; Janquin, M.-A.; Kupka, A. Simple standard procedure for the routine determination of organic matter in marine sediment. Hydrobiologia 1997, 345, 87–94. [Google Scholar] [CrossRef] [Scilit]
- R Core Team. R: A Language and Environment for Statistical Computing; R Foundation for Statistical Computing: Vienna, Austria, 2023; Available online: www.r-project.org (accessed on 27 August 2026).
- Buchholtz-ten Brink, M.R.; Gust, G.; Chavis, D. Calibration and performance of a stirred benthic chamber. Deep Sea Res. Part A 1989, 36, 1089–1101. [Google Scholar] [CrossRef] [Scilit]
- Huettel, M.; Gust, G. Impact of bioroughness on interfacial solute exchange in permeable sediments. Mar. Ecol. Prog. Ser. 1992, 89, 253–267. [Google Scholar] [CrossRef] [Scilit]
- Vopel, K.; Plew, D.R.; Simone, M.N.; Davey, A.; Ross, D.J. Environmental impact of exposed salmon farms: Transect reveals matching gradients in seafloor ecosystem structural and functional proxies. Aquac. Environ. Interact. 2026, 18, aei00509. [Google Scholar] [CrossRef] [Scilit]

Disclaimer/Publisher’s Note: The statements, opinions and data contained in all publications are solely those of the individual author(s) and contributor(s) and not of MDPI and/or the editor(s). MDPI and/or the editor(s) disclaim responsibility for any injury to people or property resulting from any ideas, methods, instructions or products referred to in the content. |
© 2026 by the authors. Licensee MDPI, Basel, Switzerland. This article is an open access article distributed under the terms and conditions of the Creative Commons Attribution (CC BY) license.