


Abstract
This paper analyzes the fatigue loads of wind turbines in a floating offshore wind farm (FOWF) whose layout can be reconfigured. Such wind farm reconfiguration will be useful for wake effect mitigation in varying wind conditions. As an example FOWF, a farm with three 5 MW floating offshore wind turbine (FOWT) models on semi-submersible platforms, developed by the National Laboratory of the Rockies (NLR) (formerly the National Renewable Energy Laboratory (NREL)), is considered. Simulations for the example FOWF are conducted with various realistic turbulent wind and irregular wave conditions in the medium-fidelity wind farm simulator FAST.Farm. Using the simulation data, fatigue analysis is conducted by calculating the damage equivalent loads (DELs) using the computational tool MLife at critical components of the three FOWTs. The analysis results demonstrate the potential of reconfigurable FOWFs in not only increasing power outputs but also reducing fatigue loads for many critical components of turbines.
1. Introduction
The global push for a sustainable future has led to the increased use of renewable energy sources. Among these, offshore wind has emerged as a promising and tangible source of clean energy, particularly due to the advantage of harnessing stronger and more consistent wind resources found over the ocean compared to onshore locations. Traditional fixed-bottom offshore wind turbines are limited to shallow waters, typically up to depths of 60 m, restricting their deployment to nearshore areas [1]. This limitation has led to the research and development of floating offshore wind turbines (FOWTs) to be installed in deeper waters, far from the coast where wind conditions are often more favorable.
The long distance of floating FOWTs from the coast makes accessibility and, accordingly, maintenance difficult. This, in turn, makes the study of the fatigue behavior of FOWTs imperative. Wind turbine structures endure significant cyclic loading from wind and regular operation [2]. In offshore environments, these structures also face forces from waves and sea currents. Gravitational and inertia forces arising from the masses of blades, towers, and nacelles exacerbate fatigue-associated problems. Moreover, rotor blades experience edgewise bending moments due to gravitational loads.
Research has been conducted using fatigue load analyses of FOWTs. Frandsen et al. [3] compared the loads of the 5 MW Vindeby offshore wind farm in Denmark consisting of 11 wind turbines to an onshore wind farm under similar conditions. They showed that the fatigue loads for the offshore case are reduced by as much as 15% compared with onshore wind turbines due to reduced turbulence. Nonetheless, extreme loads could be higher in offshore wind turbines. They also concluded that the nearest upstream wind turbines contribute considerably to fatigue loading for a given turbine. This finding suggests that the layout and spacing of turbines in a wind farm are crucial for managing fatigue loads. For the same wind farm, Thomsen et al. [4] investigated the fatigue loads experienced by offshore wind turbines operating within the wake of upstream turbines. The key finding was that turbines operating within the wake region show significantly higher fatigue loads, ranging from a 5% to 15% increase.
Fleming et al. [5] explored various control strategies for mitigating the wake effects between two 5 MW turbines placed 7 rotor diameters (884.8 m) apart in a turbulent inflow. The key control methods evaluated in their study include yaw misalignment, tilt misalignment, and the repositioning of the downstream turbine. These methods were analyzed through high-fidelity simulations to assess their impact on power output and turbine loading. All evaluated methods showed potential for improving power capture and reducing loading. Tilt and repositioning demonstrated greater potential for power capture, suggesting their consideration in future turbine designs. Individual blade pitch control for the downstream turbine can also mitigate loading from wake overlaps. They emphasized the need for continued research to expand these studies to larger turbine arrays and various atmospheric conditions and to compare wake redirection-based methods. Some recent works [6,7] studied the fatigue analysis and control of FOWTs with yaw misalignment but without repositioning capability.
This paper analyzes the fatigue loads of wind turbines in a floating offshore wind farm (FOWF) whose layout can be reconfigured via turbine repositioning. For this purpose, a wind farm with three 5 MW FOWT models on semi-submersible platforms is utilized. Simulations for the FOWF are conducted for various realistic wind and wave conditions to acquire fatigue load information. For the analysis, the damage equivalent loads at critical components of the three turbines are calculated and compared in two cases, that is, the non-reconfigured layout case with zero nacelle yaw angle and the reconfigured layout case with simple non-zero constant nacelle yaw angles. By this comparison, we aim to answer the question regarding whether the layout modification of FOWFs can potentially lead to benefits in terms of not only increasing power outputs but also reducing fatigue loads.
This paper is organized as follows. In Section 2, the fatigue load analysis problem to be considered in this paper is formulated. The analysis procedure using computational tools is given in Section 3. Section 4 presents the fatigue load analysis results. Based on the results, conclusions and potential future work are elaborated on in Section 5.
2. Fatigue Load Analysis Problem
In this section, we will state the fatigue load analysis problem to be considered in this paper. The fatigue loads of interest are for the components of specific turbines in a floating offshore wind farm (FOWF), under simple control laws. Below, we will clarify the wind farm with specific turbines (Section 2.1), the turbine components of interest (Section 2.2), and the simple control laws (Section 2.3). After these clarifications, the fatigue load analysis problem will be formally stated (Section 2.4).
2.1. An FOWF for Fatigue Load Analysis
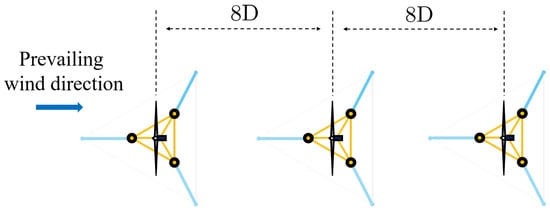
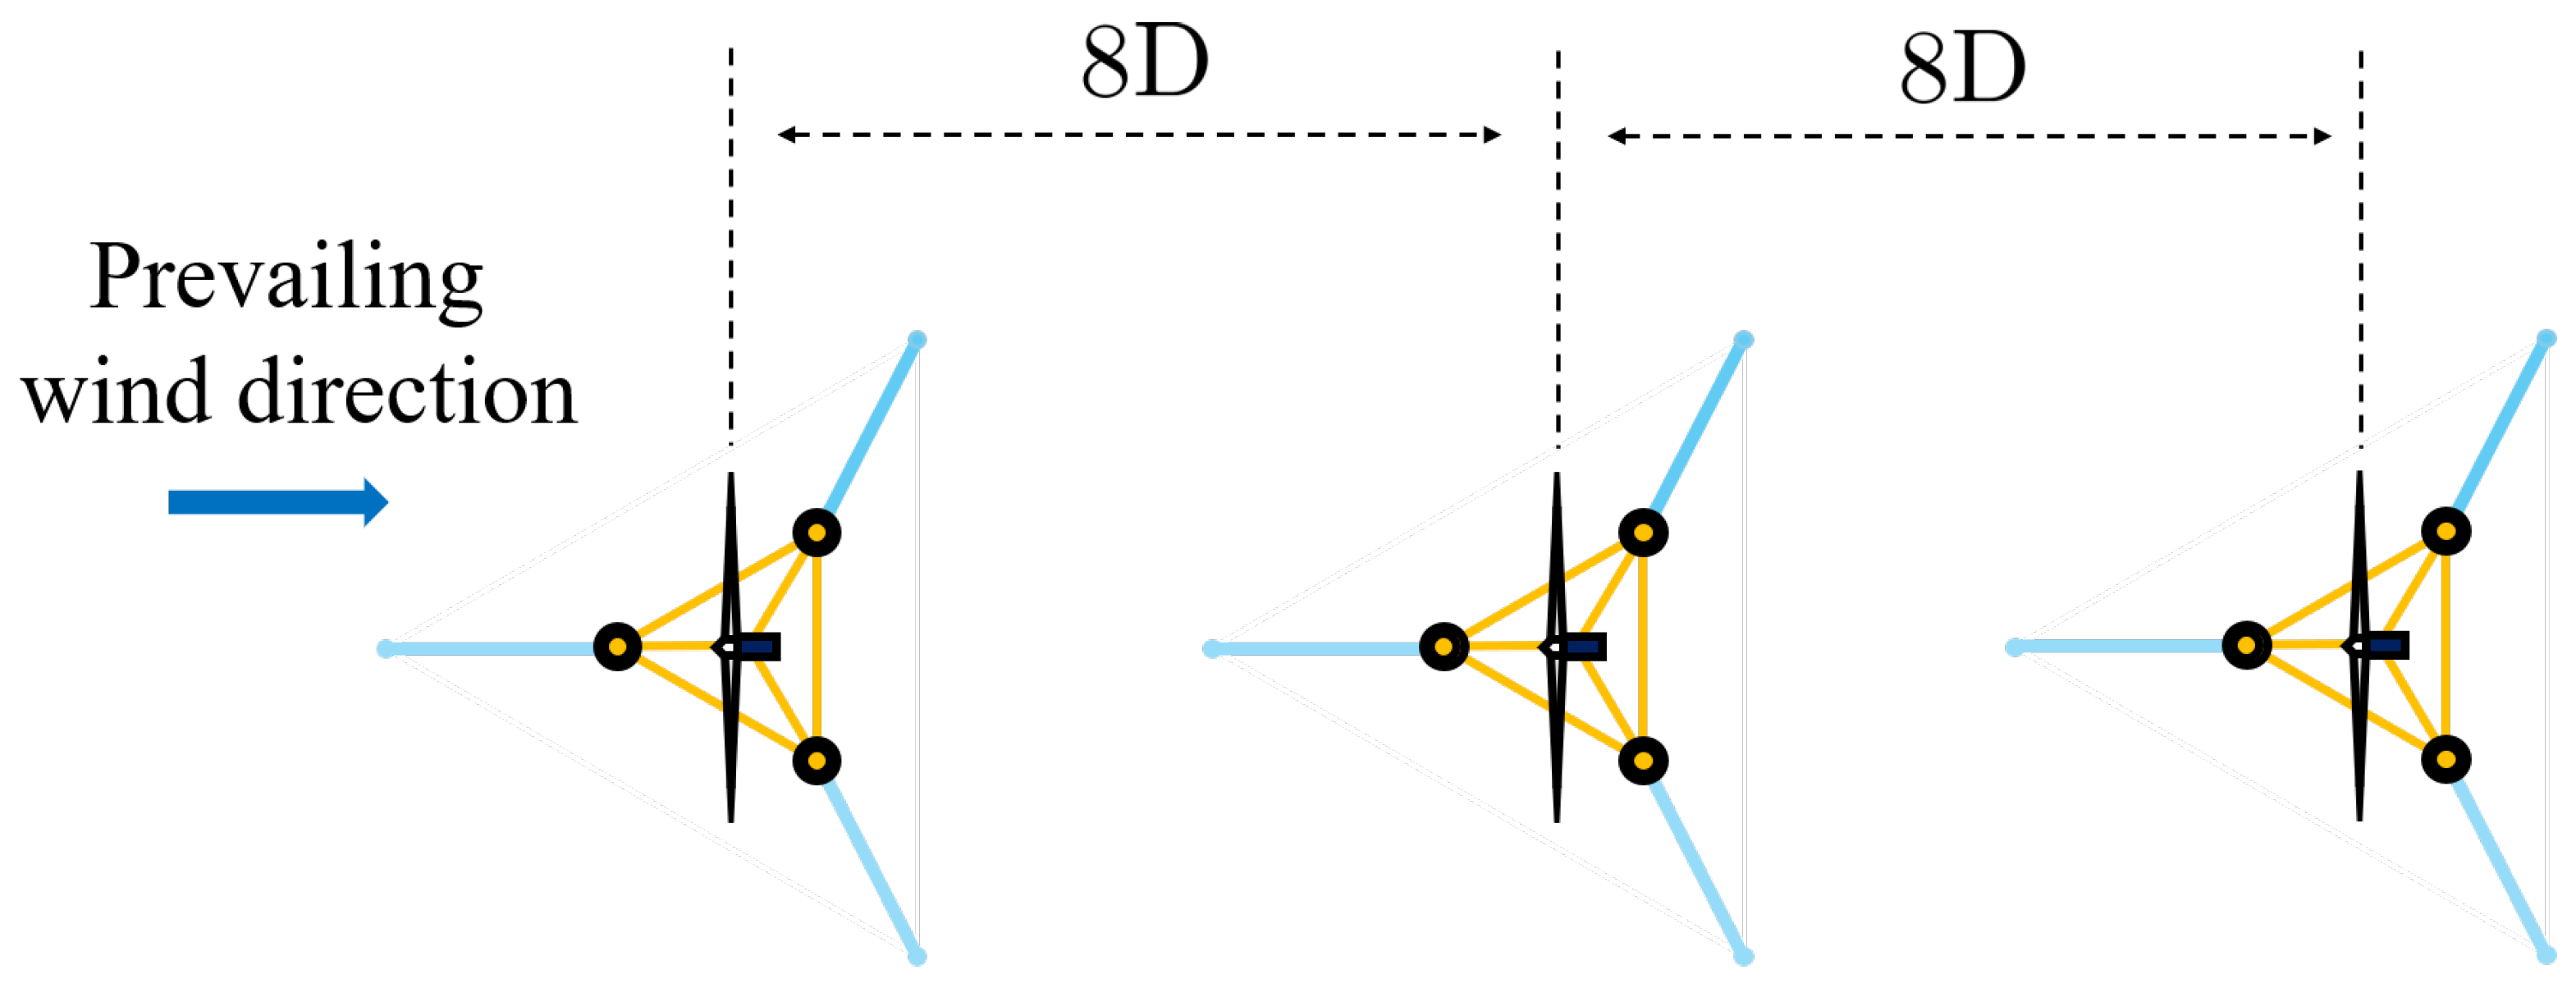
The specific FOWF to be analyzed is illustrated in Figure 1. The farm consists of three NLR1 5 MW wind turbines [8] with semi-submersible platforms [9]. They are installed with 8D (i.e., 8 times the rotor diameter m, which is equal to 1008 m) inter-turbine spacing in the prevailing wind direction, i.e., from left to right in Figure 1.
Figure 1.
The top view of the FOWF for fatigue load analysis. The wind turbines in this figure are at the installation locations, i.e., the locations for the no-wind case.
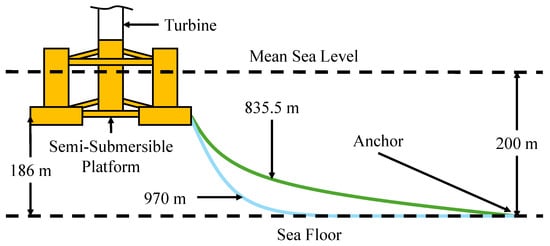
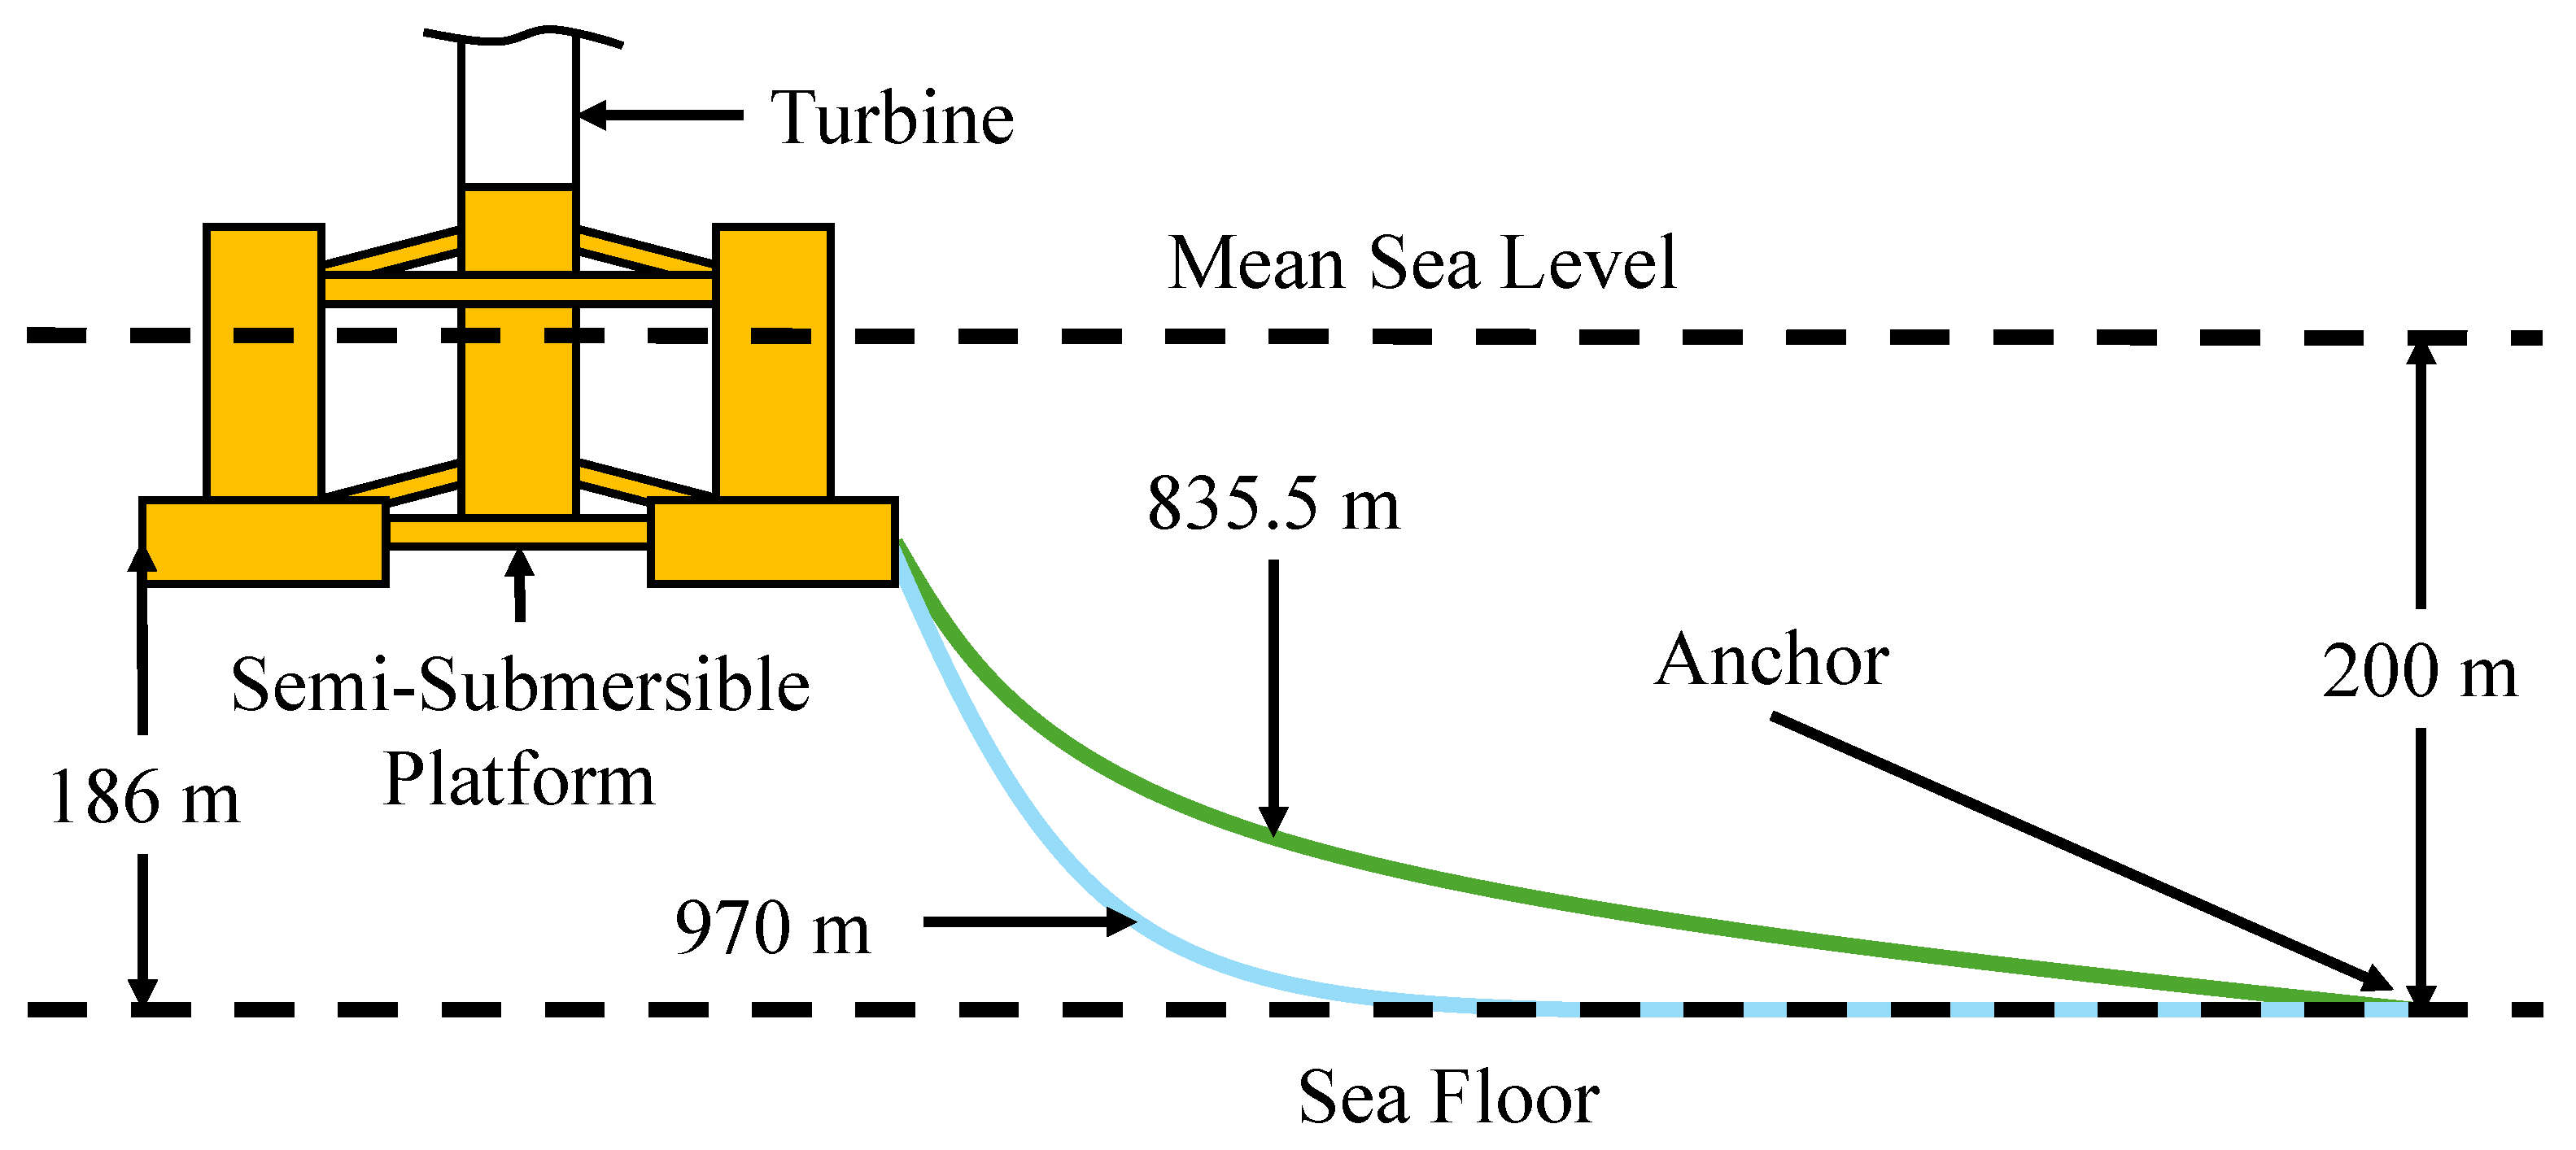
All parameter values for the turbines, platforms, and mooring line systems are taken from [8,9], except the mooring line length, which is modified from m to 970 m, as shown in Figure 2. The lengthened mooring lines enhance the mobility of each wind turbine in lateral directions using the aerodynamic force applied on the rotor plane and thus the reconfigurability of the FOWF in Figure 1 for wake effect mitigation.
Figure 2.
Mooring line lengths: original length 835.5 m and modified length 970 m.
The reconfigurable 1-by-3 FOWF with the same wind turbines and platforms as described above was analyzed in our previous work [10]. There, we showed that reconfiguration is beneficial for an increase in wind farm power. The novelty of this paper in comparison to our previous work [10] is that it demonstrates an additional benefit of layout reconfiguration from the fatigue mitigation viewpoint using this specific FOWF.
2.2. Turbine Components for Fatigue Load Analysis
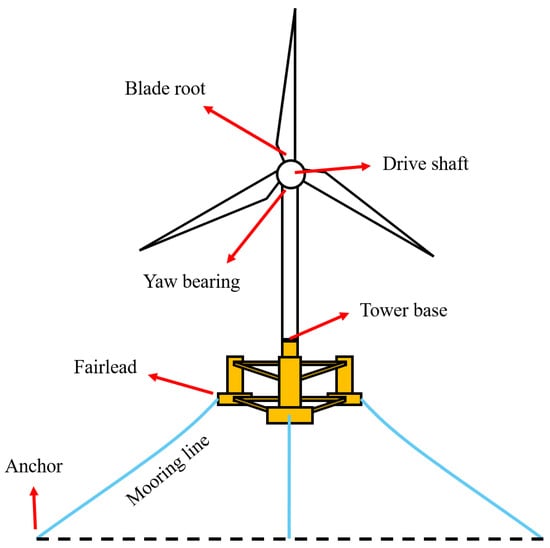
For each turbine in the FOWF in Figure 1, we will analyze the fatigue loads of the following critical components and locations, indicated in Figure 3: blade roots, tower base, drive shaft, yaw bearing, and connection points (anchors and fairleads) for mooring lines. These components and locations are the ones typically examined in the fatigue load analysis of wind turbines in the literature as they are prone to failures [11].
Figure 3.
Turbine components and locations for fatigue analysis.
2.3. Control Laws for Fatigue Load Analysis
The NLR 5 MW wind turbine considers the following control variables: collective blade pitch angle, generator torque, and nacelle yaw angle. For the fatigue load analysis of the FOWTs operating in the FOWF in Figure 1, control laws for the collective blade pitch angle and generator torque for each turbine are assumed to be given by the NLR baseline controller [8,9].
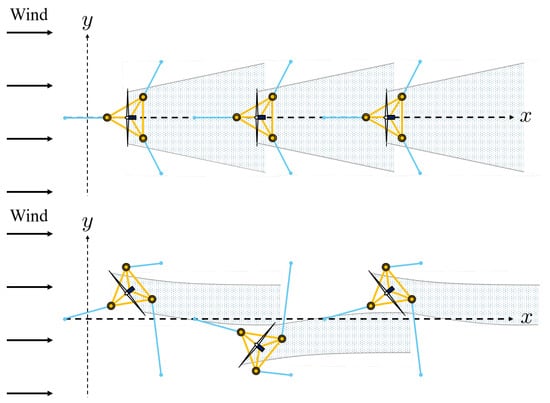
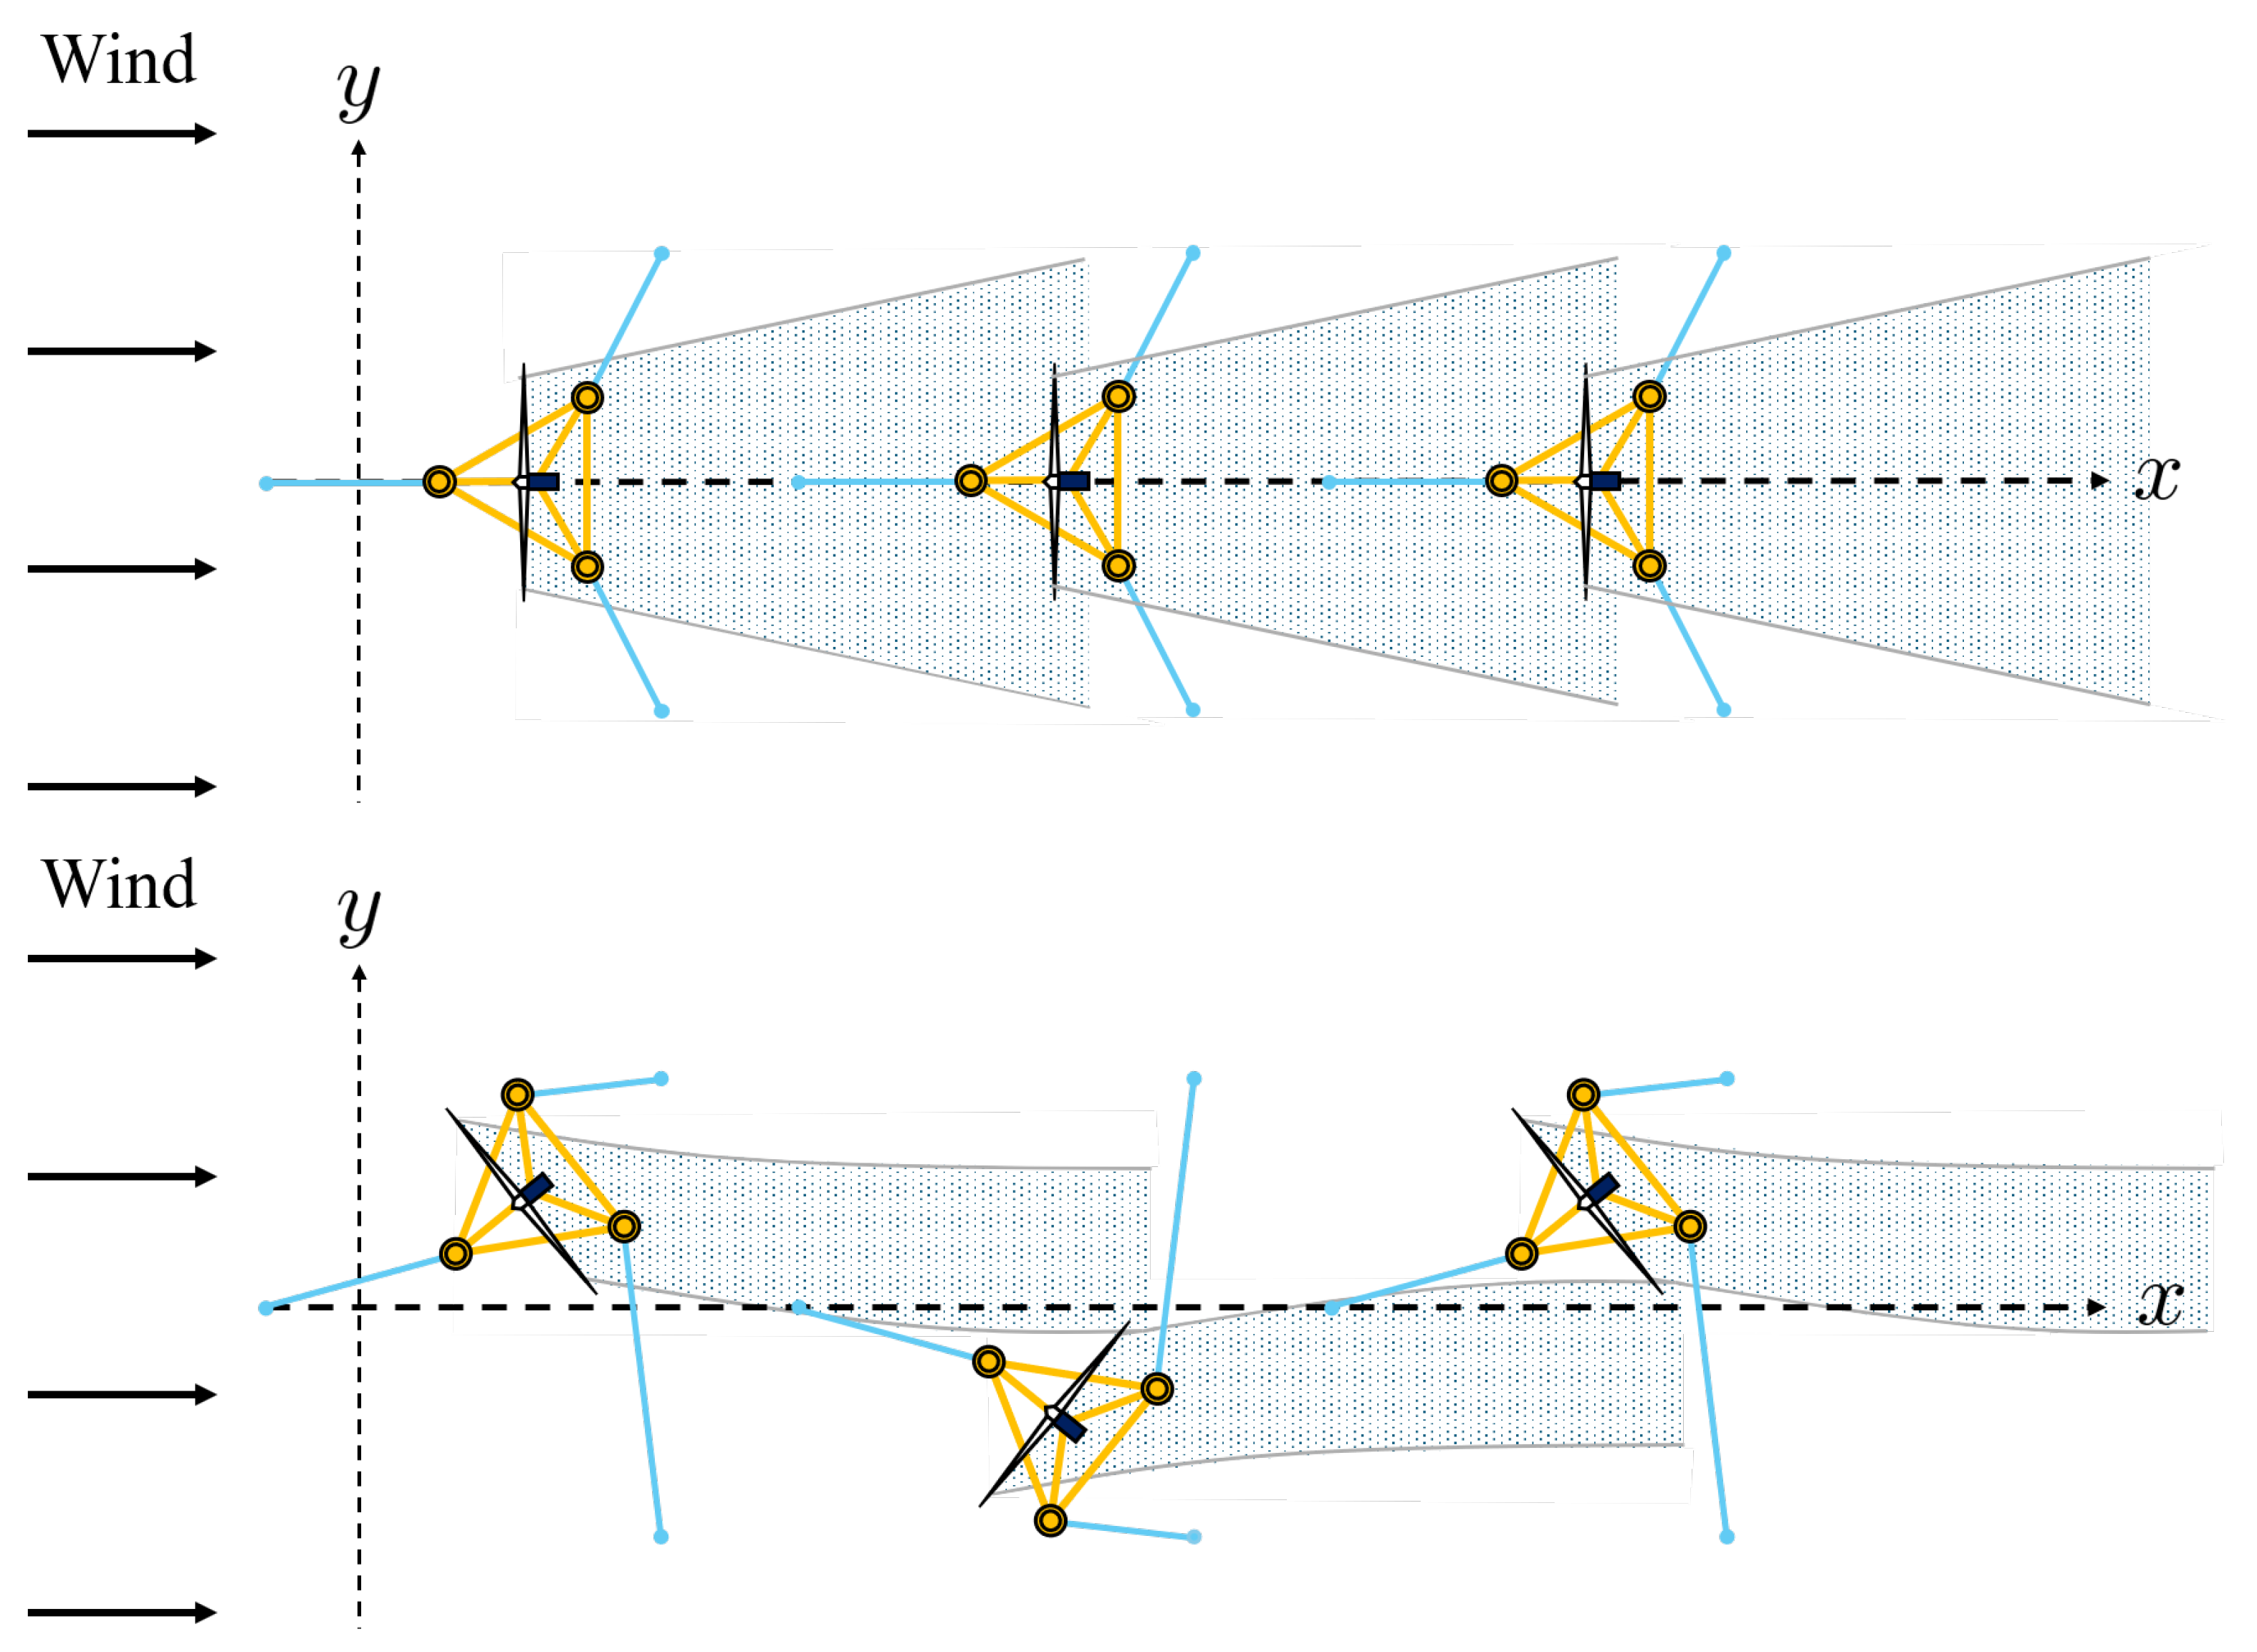
As control laws for nacelle yaw angles for the three turbines, denoted by the degree, 2, we consider two cases, as depicted in Figure 4. For the non-reconfigured layout case, , and for the reconfigured layout case, .
Figure 4.
The top view of the FOWF layout and wake. The top figure shows the non-reconfigured FOWF layout with , while the bottom figure shows the reconfigured FOWF layout with .
Here, positive nacelle yaw angles correspond to counter-clockwise rotations in the FOWF’s top view shown in Figure 4. Note that, as illustrated in Figure 4, for the case when , due to the lateral component of the aerodynamic force applied on the rotor plane, the first and third turbines will move in the positive y-direction, while the second turbine shifts to the negative y-direction. Consequently, the wake overlap for downstream turbines is reduced due to the reconfigured FOWF layout caused by alternating nacelle yaw angles.
2.4. Fatigue Load Analysis Problem for Reconfigurable FOWF
The fatigue load analysis problem to be considered in this paper is as follows. For the given FOWF in Section 2.1 with the control laws in Section 2.3, the fatigue loads at the three turbines’ components in Section 2.2 are compared between two cases, i.e., the non-reconfigured and reconfigured layout cases.
From the fatigue load analysis results, we aim at answering the question “Does the layout reconfiguration of the FOWF have the potential to reduce the fatigue loads of each turbine, in addition to increasing total power capture?” with a simple nacelle yaw control law. Finding the optimal nacelle yaw control law is beyond the scope of this paper. If the answer to the question above is affirmative, then the FOWF’s reconfiguration will be more promising for reducing the cost of floating offshore wind energy significantly.
3. Fatigue Load Analysis Procedure
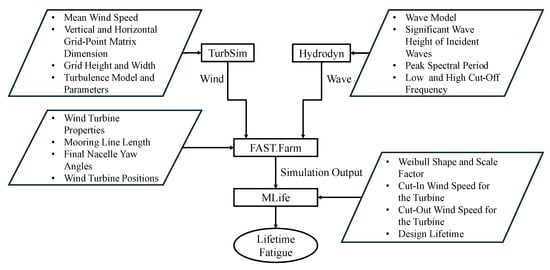
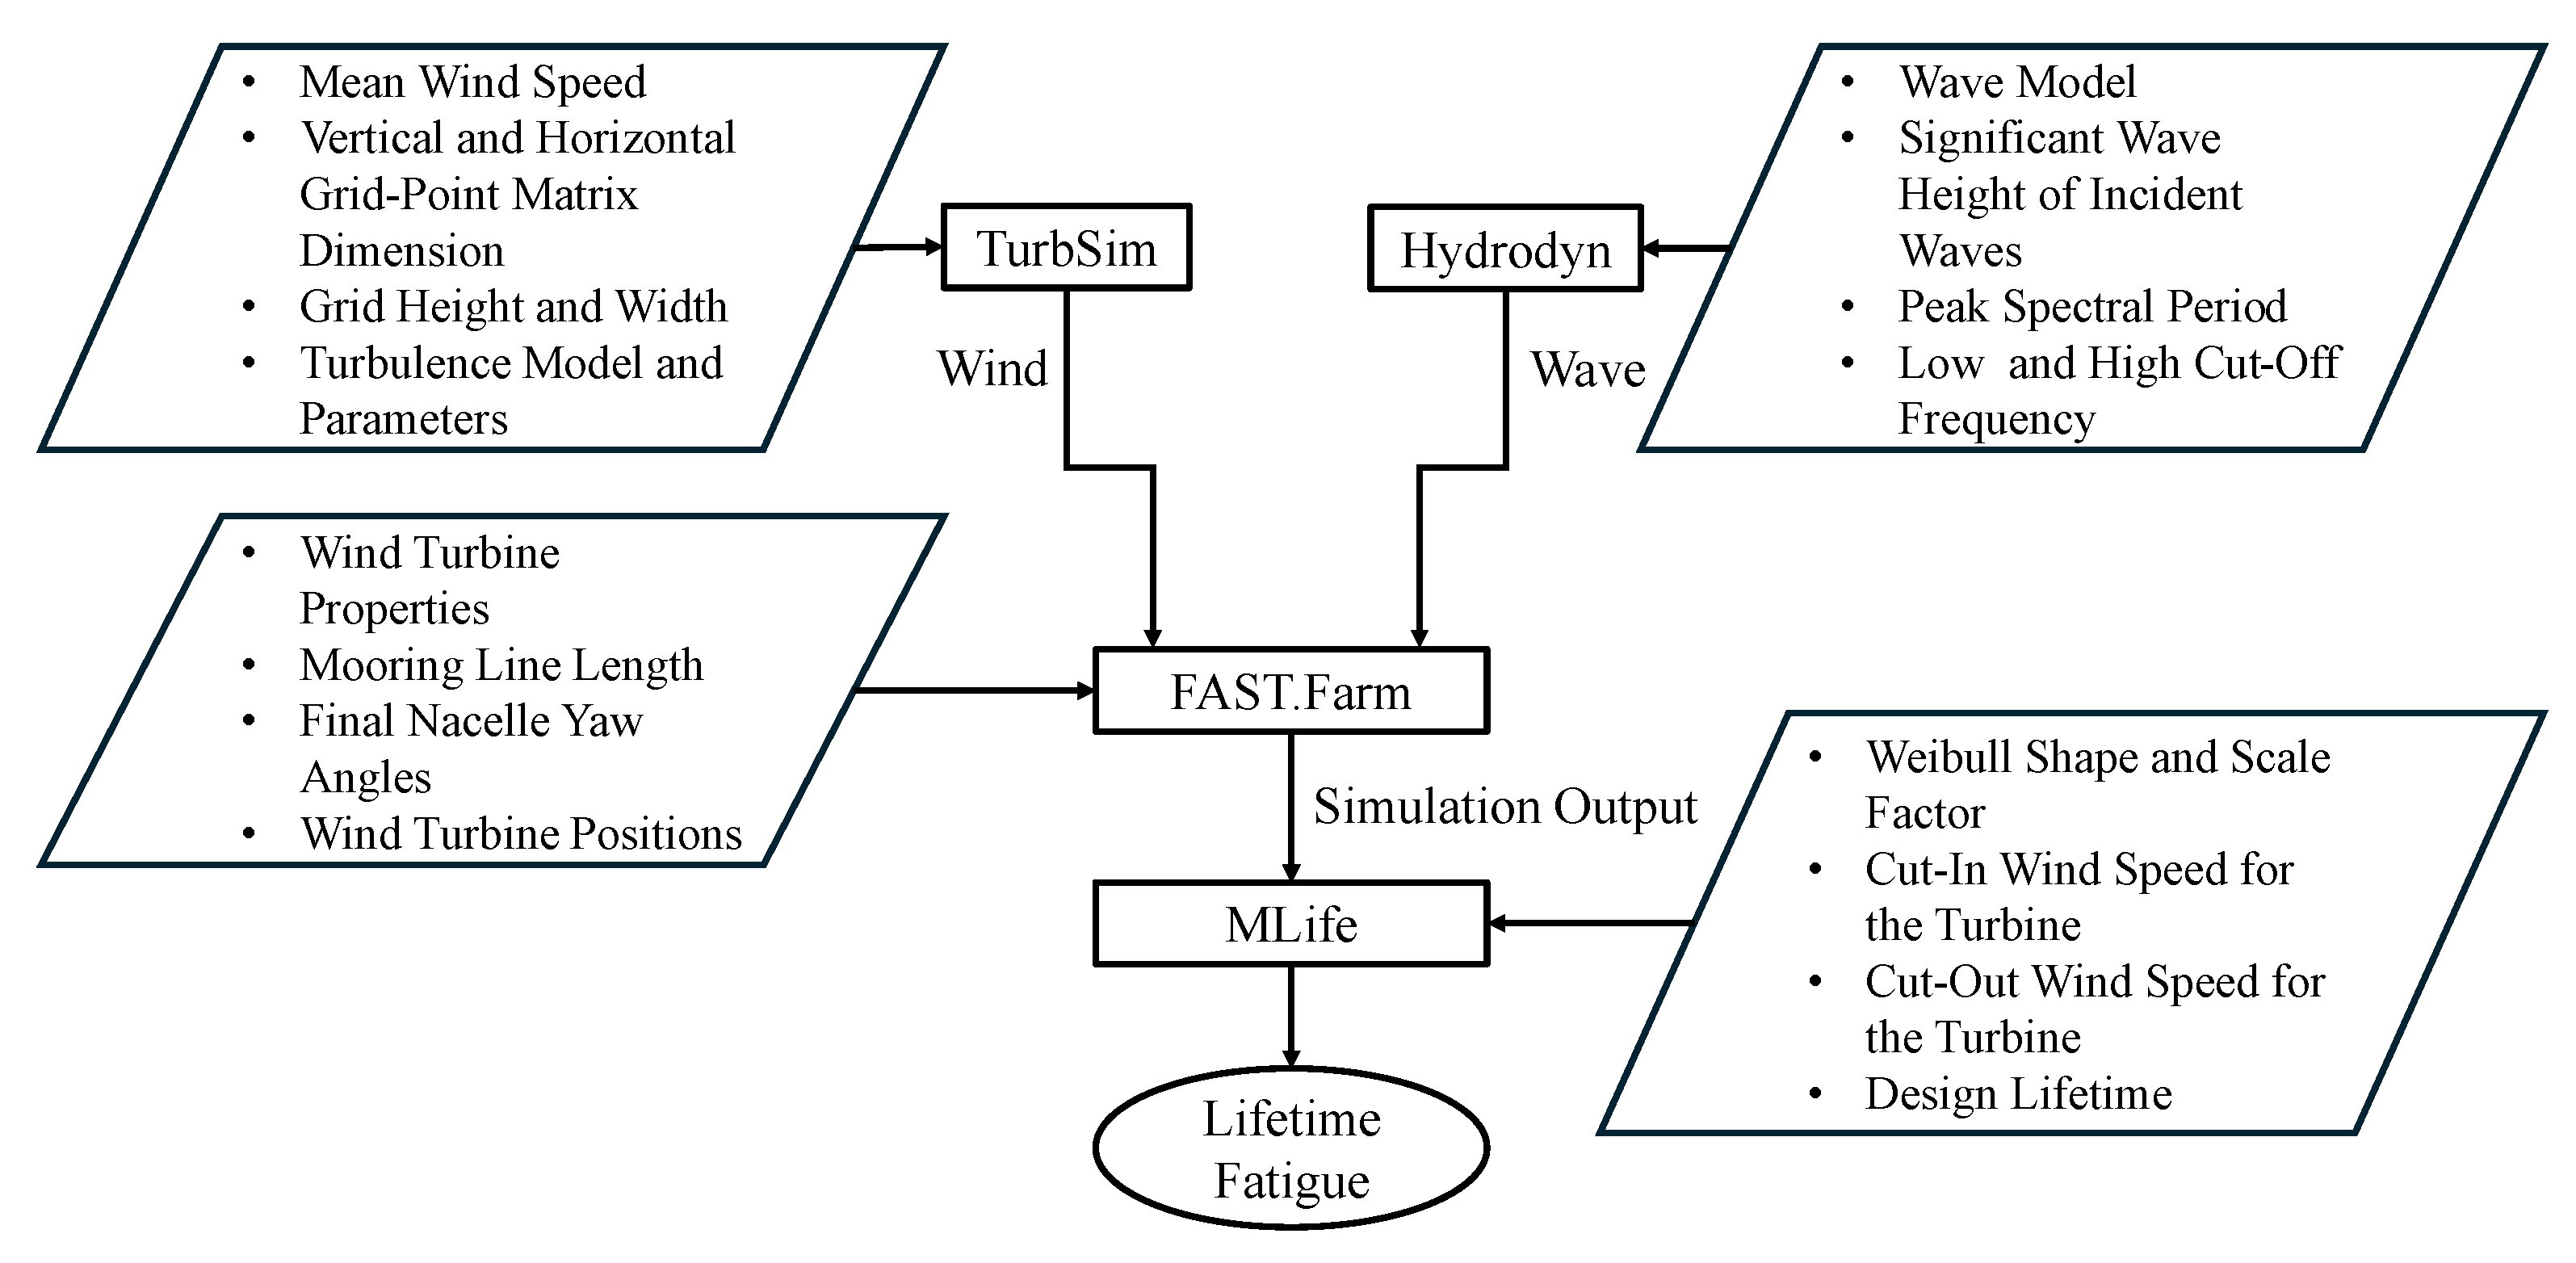
The procedure for the fatigue load analysis problem formulated in Section 2.4 is summarized in Figure 5. Below, we explain the details of each block of this figure. In this figure, the rectangular blocks indicate the names of the computational tools to be utilized, and the arrows pointing toward and away from the rectangular blocks are the inputs and outputs of computational tools. All simulations, including the generation of wave and wind conditions, were conducted on a standard desktop computer. The creation of a single TurbSim file took approximately 4 h and generated a file of about 1.6 GB. A FAST.Farmm simulation required approximately 5 h of computation time and produced output data of approximately 5 GB.
Figure 5.
Fatigue load analysis procedure.
3.1. Generation of Wind and Wave Profiles
To obtain FOWF simulation results under realistic environmental conditions, we generated 111 combinations of wind and wave profiles, as in Table 1. Each wind profile was generated by the software TurbSim [12], by specifying an average wind speed ranging from 4 m/s to 24 m/s and the lowest turbulence intensity IEC standard class ‘C’ of [13]. The selection of a low turbulence intensity is suitable for mimicking wind on the open ocean. In this study, the turbulence model “IECKAI” was used.
Table 1.
Selected combinations of environmental conditions.
We associated one irregular wave profile with each of the 111 wind profiles. The wave profiles were created by the Hydrodyn module [14] with the JONSWAP spectrum [15,16] in the wind farm simulator FAST.Farm [17], and they were characterized by the significant wave height, typically denoted as , and the peak spectral period, as given in Table 1.
3.2. Simulation of FOWF
Each combination of wind and wave profiles was input to the medium-fidelity wind farm simulator FAST.Farm [17], in order to obtain time-series data. FAST.Farm can simulate the dynamical motions of each turbine as well as the wake dynamics in the wind farm. Each wind turbine’s dynamical model used in this study was taken from [8,9] and is summarized in Section 2.1. The simulation time was set to 4400 s. The first 800 s of the simulations was cut off to eliminate startup transients, and the remaining 3600 s time-series data were used for fatigue load analysis. The simulation length of 3600 s is considered to be sufficient for estimating the fatigue damage life of an FOWT [18].
3.3. Calculation of Fatigue Loads
For both the non-reconfigured and reconfigured layout cases, the time-series data of the results of the 111 simulations were sent to the software MLife [19] to calculate the lifetime fatigue loads of wind turbine components for the three turbines. For each 3600 s simulation, MLife calculates the damage for that specific environmental state using the Palmgren–Miner linear damage accumulation rule. The total lifetime damage is then computed by taking the probability-weighted sum of these short-term damages [19].
One limitation of the adopted short-term approach is that the one-hour simulation results have to represent, with their occurrence probability, the whole lifetime of a wind turbine. Therefore, extrapolating the short-term results to a 20-year lifetime assumes that the specific environmental conditions captured in our short seed are fully representative of the long-term joint probability distribution of environmental conditions.
For readers interested in reproducing the results, all parameters used in the computational tools, i.e., FAST.Farm, TurbSim, HydroDyn, and MLife, are given in Table A1, Table A2, Table A3 and Table A4 in Appendix A.
4. Fatigue Load Analysis Results
This section presents the power output and fatigue load performance in the non-reconfigured and reconfigured layout cases in order to highlight the potential benefits of reconfigurable FOWFs.
4.1. Power Output Performance
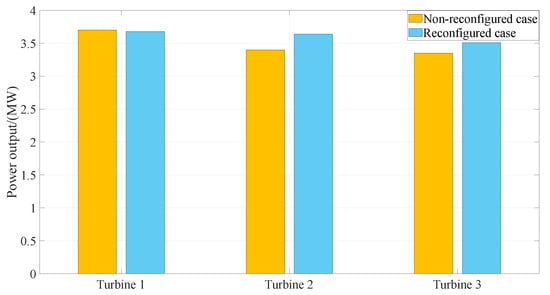
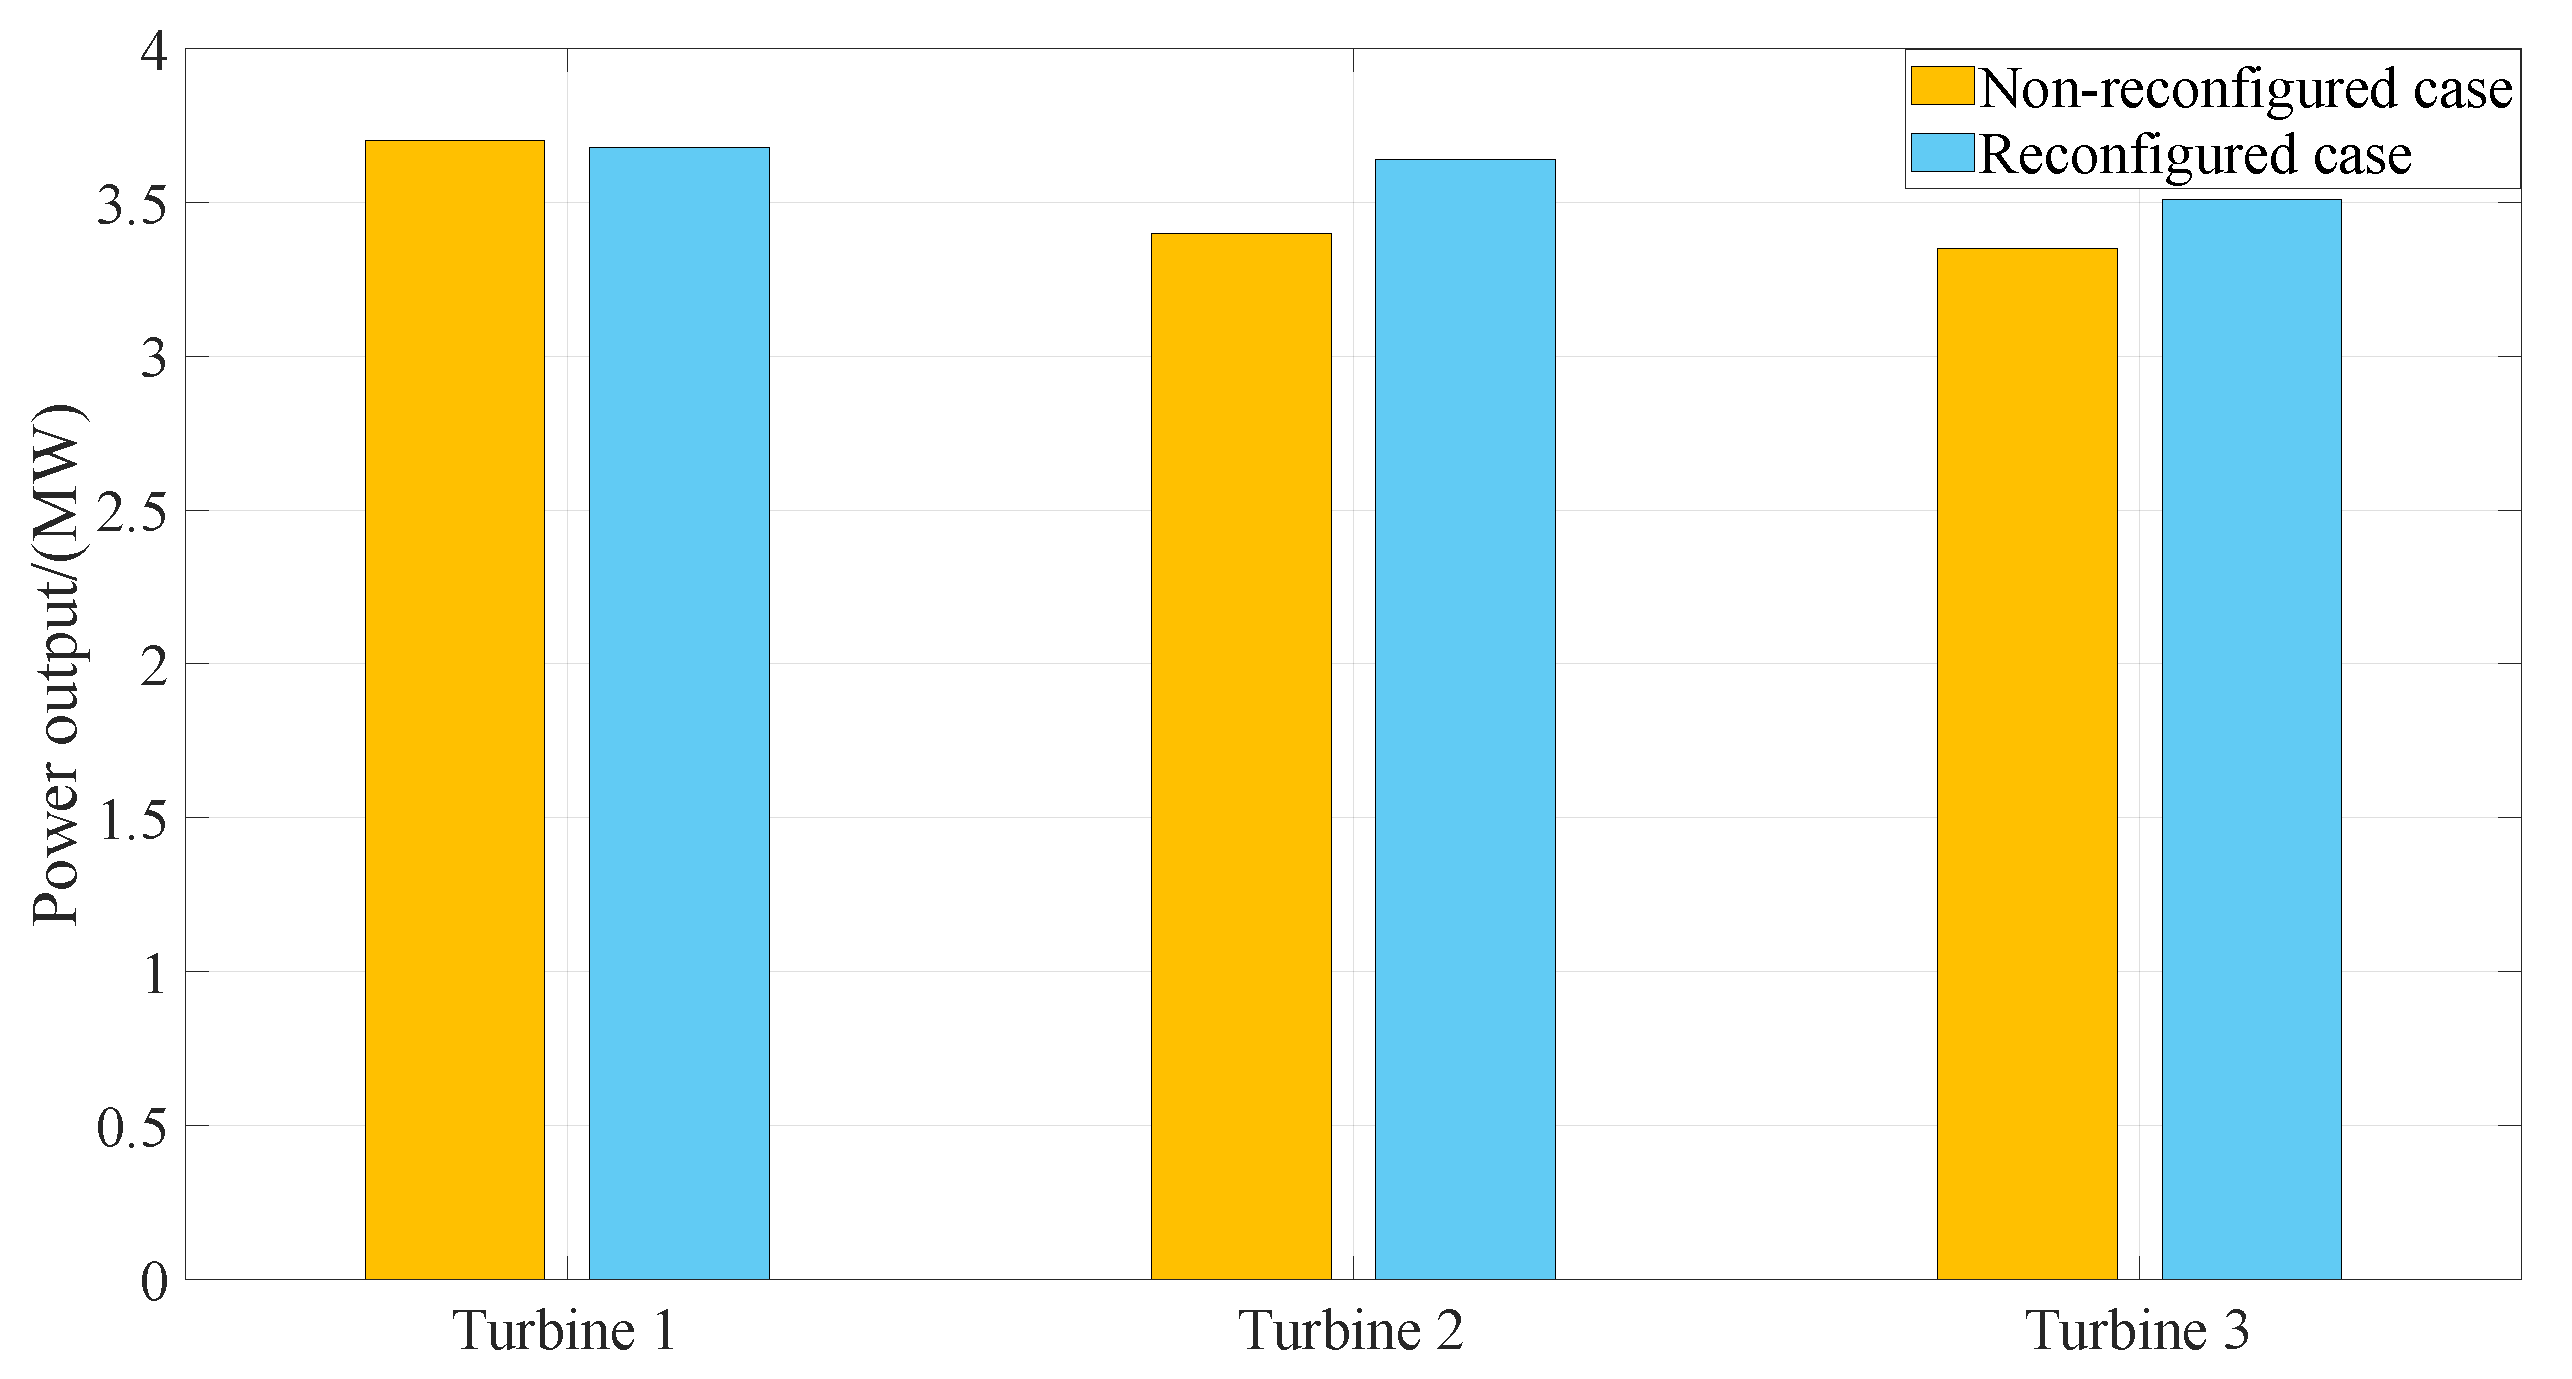
Figure 6 shows the power output, averaged over all 111 simulations, for each turbine in the non-reconfigured (yellow-colored) and reconfigured (blue-colored) cases. Based on this figure, with the layout reconfiguration, the following can be observed:
Figure 6.
Averaged power output of each turbine.
- Turbine 1 reduces the power output slightly, by %. This is due to the reduced effective wind speed caused by nacelle yawing .
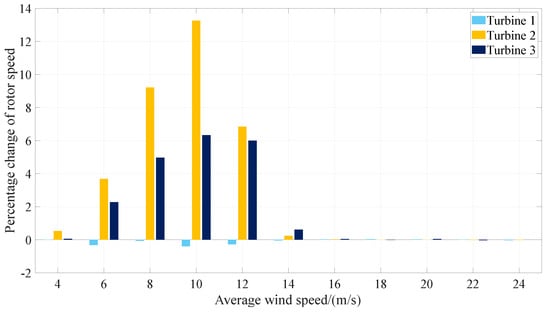
- Turbine 2 and Turbine 3 increase the power outputs by % and %, respectively. This is due to the reduced wake overlap. The higher percentage increase for Turbine 2 in comparison with Turbine 3 is because Turbine 2 is outside of the wake region of the upstream turbine after reconfiguration, while Turbine 3 is still in the wake region of Turbine 1. To quantitatively assess the wake recovery resulting from layout reconfiguration, the rotor speeds of the turbines were compared between the non-reconfigured and reconfigured configurations. Rotor speed serves as an indicator of the local inflow conditions, with higher values corresponding to reduced wake-induced velocity deficits. As shown in Figure 7, the rotor speed variations in the turbines exhibit trends similar to those observed for the power output. Turbine 1 shows a decrease in rotor speed, which is consistent with the corresponding reduction in power output. In contrast, Turbines 2 and 3 exhibit an increase in rotor speed, reflecting the increase in power production. These results indicate that the reconfigured layout reduces the wake influence on Turbines 2 and 3 and improves their inflow conditions, thereby supporting the observed wake exit behavior.
- The farm’s total average power increases by , from 10.45 MW to 10.83 MW.
Figure 7.
Percentage increase in rotor speed with layout reconfiguration for various average wind speeds.
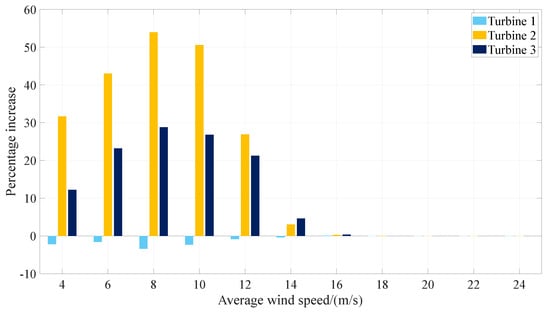
Figure 8 shows the percentage increase in each turbine’s power output with layout reconfiguration for each average wind speed. This figure illustrates the advantage of FOWF layout reconfiguration from the power output viewpoint, especially for below-rated wind speed cases. For above-rated wind speeds, the powers of all turbines are saturated to the rated power in both the non-reconfigured and reconfigured scenarios. Although we could not see any advantage in terms of the power maximization of layout reconfiguration for above-rated wind speed cases for the 1-by-3 FOWF, it turns out that the layout configuration is still advantageous from a fatigue mitigation viewpoint, which will be presented next.
Figure 8.
Percentage increase in power output with layout reconfiguration for various average wind speeds.
4.2. Fatigue Load Performance
Damage equivalent load (DEL) is the constant-amplitude load that generates the same fatigue damage as the original variable-amplitude load history. DEL is a widely used fatigue metric in wind turbine analysis. It enables complex load spectra to be condensed into a single representative value. In this study, DELs were calculated using MLife. MLife obtains the cycles to failure for each specific cycle from a Wöhler relationship. In this study, a Wöhler exponent of 10 was specified. MLife uses the Palmgren–Miner linear hypothesis, which is a simple approach to calculating fatigue damage. Miner’s rule is widely used, but it does not capture all effects. For instance, it does not consider the order in which loads occur; applying large loads first compared to small loads first does not change the damage sum, even though in reality, it does.
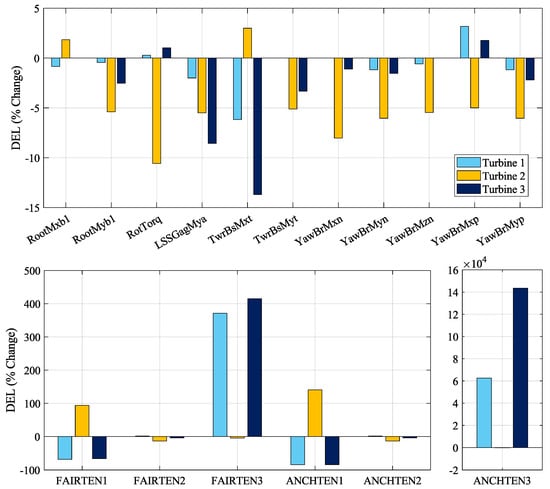
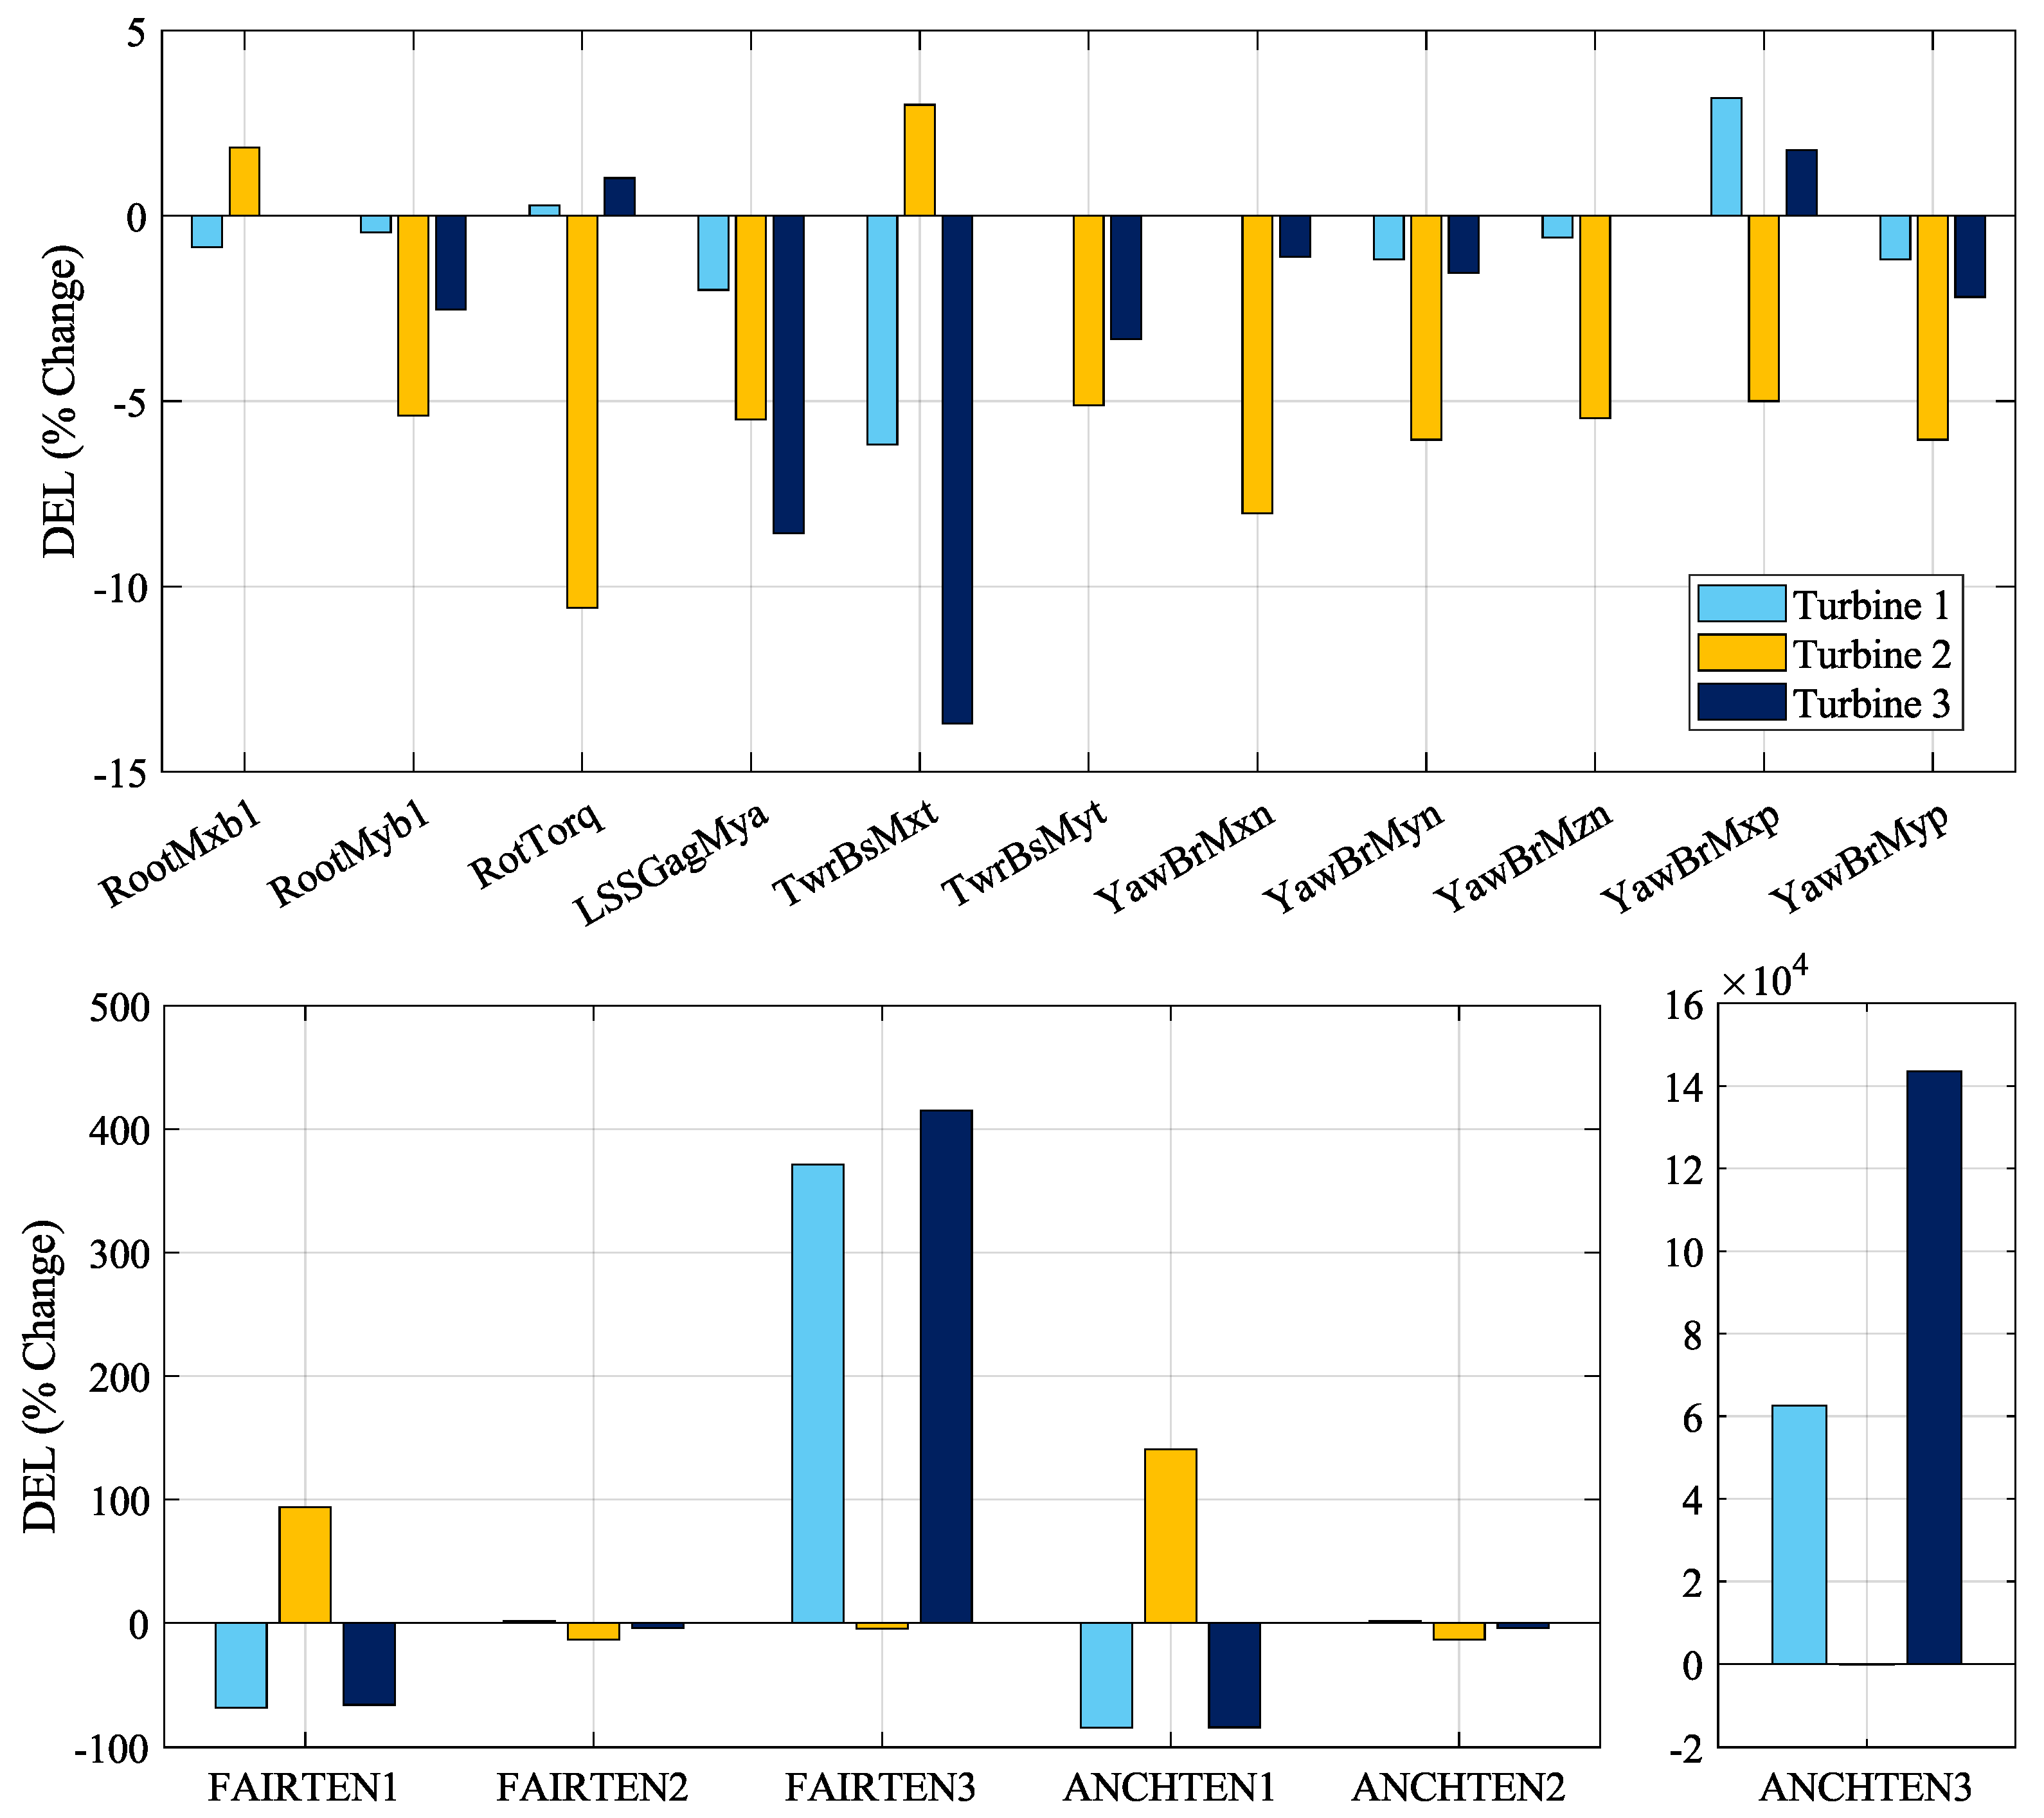
Figure 9 shows the percentage changes in DELs for the reconfigured case in comparison to the non-reconfigured case, for the three turbines. The percentage change was computed by
The acronyms in the figure are the variable names used in FAST.Farm, and they are explained in Table 2. In terms of Figure 9, the following observations can be made.
Figure 9.
The change in DELs. The top bar chart is for the blade root, drive shaft, tower base and yaw bearing, while the bottom bar charts are for the mooring system.
Table 2.
FAST.Farm output variables.
4.2.1. Blade Roots (RootMxb1, RootMyb1)
As it is representative of the three blades, blade number 1 was chosen for the fatigue analysis in Figure 9. Only Turbine 2 experienced the increased edgewise bending moment as a result of layout reconfiguration. This negative impact comes from the higher wind harness caused by the reconfiguration, which the higher energy output of 7.06% confirms.
4.2.2. Drive Shaft (RotTorq, LSSGagMya)
The DEL for the low-speed shaft torque of Turbine 2 decreased noticeably. This is because Turbine 2 is out of the wake region for the reconfigured case, and therefore, the less turbulent wind hitting the turbine causes less damage. In addition, reduced DELs were observed for the rotating low-speed shaft bending moment for all turbines.
4.2.3. Tower Base (TwrBsMxt, TwrBsMyt)
The DEL of the tower base pitching decreased for all three turbines as a result of repositioning the turbines. This is because Turbines 2 and 3 went out of the wake region, and thus cyclic loading decreased. The tower base roll showed a similar positive trend for lifetime fatigue, apart from Turbine 2.
4.2.4. Yaw Bearing (YawBrMxn, YawBrMyn, YawBrMzn, YawBrMxp, YawBrMyp)
All moments for the yaw bearing showed a decrease in DELs, except the non-rotating tower top roll moment of Turbines 1 and 3.
4.2.5. Fairleads and Anchors (ANCHTEN (1,2,3), FAIRTEN (1,2,3))
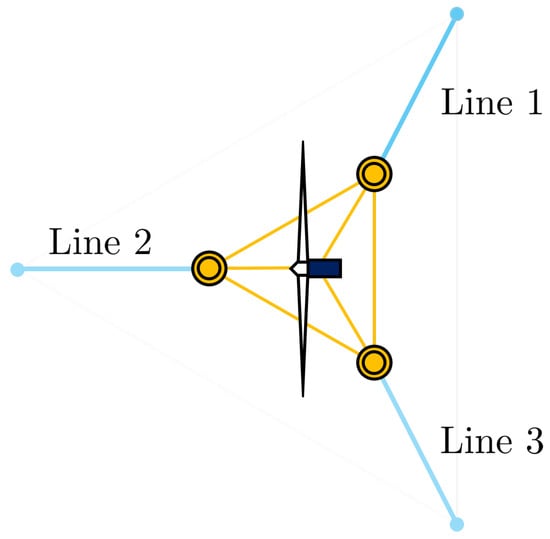
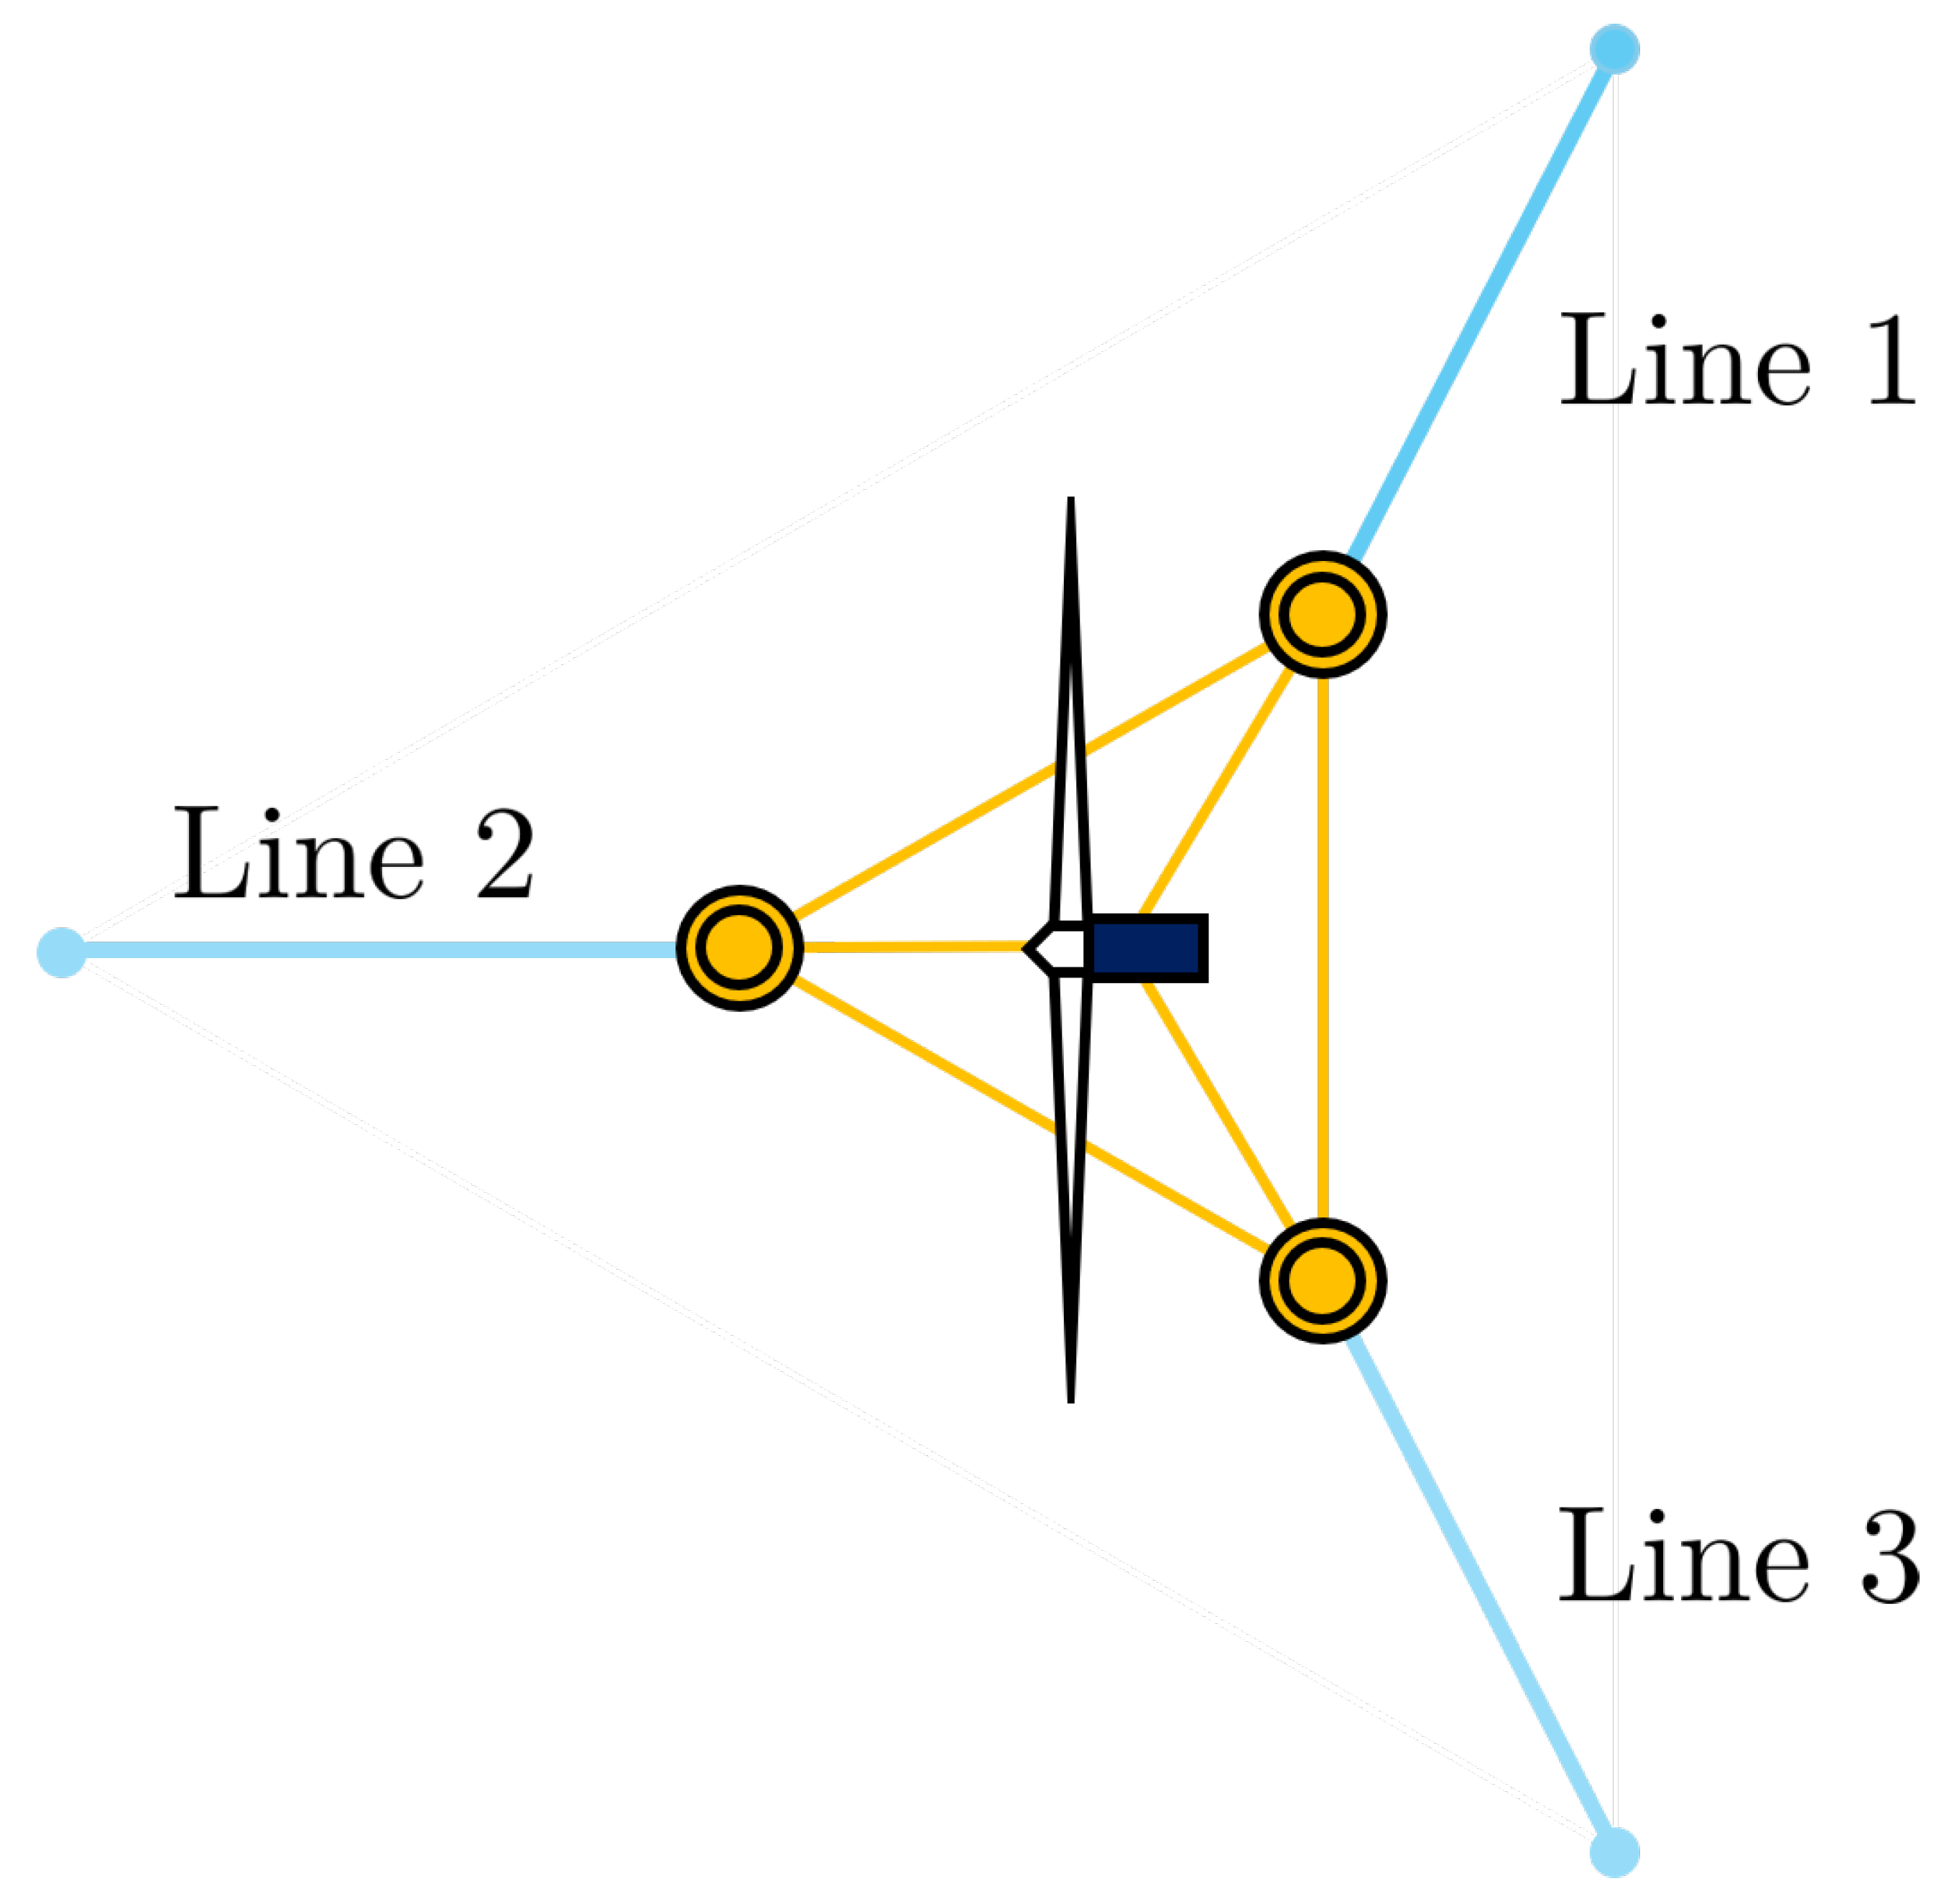
Fairlead/anchor Line 3 for Turbines 1 and 3 and Line 1 for Turbine 2 showed the greatest change in the DEL, since the corresponding mooring lines were stretched the most by the relocated turbine. See the numbering of mooring lines in Figure 10. In this study, no component-specific mooring line material properties or design data were defined. Consequently, the reported fatigue metrics should not be interpreted as predictions of actual mooring line failure or as indicators of proximity to design limits. Although the large increases in ANCHTEN3 and FAIRTEN3 indicate substantially higher relative fatigue loading compared to the baseline configuration, they cannot be used to determine whether mooring line design limits are approached or exceeded without a component-specific fatigue assessment.
Figure 10.
Numbering of mooring lines connecting anchors and fairleads.
In the non-reconfigured layout, the DELs for ANCHTEN2 and ANCHTEN3 are relatively low, as evidenced by the comparatively low applied forces observed in the results. This also explains the relatively large DEL changes, since Equation (1) shows that small denominator values lead to disproportionately high percentage changes in DEL.
4.3. Linking Power Increase and Fatigue Reduction
Due to the layout reconfiguration, Turbines 2 and 3 move partially or fully out of the wake region. As a result, they experience higher effective mean wind speeds, which leads to the increased power production presented in Section 4.1. At the same time, the reduced wake exposure decreases the turbulence intensity and cyclic loading experienced by the turbines. Consequently, the damage equivalent loads (DELs) of many structural components are reduced while achieving higher energy output simultaneously, as observed in Section 4.2.
4.4. Turbine-Wise Fatigue Change
By the inspection of the top plot in Figure 9, we can observe the general tendency that most of the DELs of Turbine 2, indicated by the yellow-colored bars, went down with the layout reconfiguration. In addition, the DELs of Turbine 3, the blue-colored bars, for the low-speed shaft bending moment and the tower base moments were reduced significantly. These observations imply that moving the wind turbines outside the wake region will lead to a fatigue reduction in turbine components.
5. Conclusions
This study compared the fatigue behavior of floating offshore wind turbines (FOWTs) within a specific 1-by-3 wind farm considering the non-reconfiguration and reconfiguration of the farm layout. The primary finding is that the layout reconfiguration of a floating wind farm can considerably improve longevity by reducing damage equivalent loads (DELs), particularly at critical structural points such as the blade root and tower base. The results demonstrated that wind farm reconfiguration potentially can not only improve overall power output but also mitigate the fatigue loading of turbines’ critical components, thereby reducing the cost of floating offshore wind energy. At the same time, the results showed the limitation of a simple layout reconfiguration strategy with increased fatigue loads for some components, such as the connection points of mooring lines. This suggests a future research topic on the development of advanced layout reconfiguration strategies for floating offshore wind farms in terms of optimizing and balancing fatigue loads between turbines and between components.
Author Contributions
Conceptualization, M.M.M., Y.N. and R.N.; methodology, M.M.M.; software, M.M.M.; validation, M.M.M.; formal analysis, M.M.M.; investigation, M.M.M.; resources, M.M.M.; data curation, M.M.M.; writing—original draft preparation, M.M.M.; writing—review and editing, M.M.M., Y.N. and R.N.; visualization, M.M.M.; supervision, R.N.; project administration, R.N.; funding acquisition, R.N. All authors have read and agreed to the published version of the manuscript.
Funding
This research was funded by the Natural Sciences and Engineering Research Council of Canada (NSERC) (Grant No. RGPIN-2023-03339) and MITACS Globalink.
Data Availability Statement
Readers interested in this work can email the corresponding author to request that data be shared.
Acknowledgments
The authors would like to thank Jason Jonkman and the team at the National Renewable Energy Laboratory for their assistance in the use of OpenFAST and MLife.
Conflicts of Interest
The authors declare no conflicts of interest.
Abbreviations
The following abbreviations are used in this manuscript:
| DEL | Damage equivalent load |
| FAST | Fatigue, aerodynamics, structures, and turbulence |
| FOWF | Floating offshore wind farm |
| FOWT | Floating offshore wind turbine |
| NLR | National Laboratory of the Rockies |
| NREL | National Renewable Energy Laboratory |
Appendix A. Parameters in Computational Tools
For interested readers, we provide the parameters used in simulating wind farms and evaluating damage equivalent loads in Table A1, Table A2, Table A3 and Table A4.
Table A1.
Parameters used in FAST.Farm.
Table A2.
Parameters used in TurbSim.
Table A3.
Parameters used in HydroDyn.
Table A4.
Parameters used in MLife.
Notes
| 1 | Due to the institutional name change from the National Renewable Energy Laboratory (NREL) to the National Laboratory of the Rockies (NLR), we use NLR throughout this paper. |
| 2 | The subscript corresponds to the upstream turbine. |
References
- Arapogianni, A.; Genachte, A.B.; Ochagavia, R.M.; Vergara, J.P.; Castell, D.; Tsouroukdissian, A.R.; Korbijn, J.; Bolleman, N.; Huera-Huarte, F.J.; Schuon, F.; et al. Deep Water—The Next Step for Offshore Wind Energy; European Wind Energy Association (EWEA): Brussels, Belgium, 2013; pp. 1–51. [Google Scholar]
- Igwemezie, V.; Mehmanparast, A.; Kolios, A. Current trend in offshore wind energy sector and material requirements for fatigue resistance improvement in large wind turbine support structures—A review. Renew. Sustain. Energy Rev. 2019, 101, 181–196. [Google Scholar]
- Frandsen, S.; Thomsen, K. Change in fatigue and extreme loading when moving wind farms offshore. Wind Eng. 1997, 21, 197–214. [Google Scholar]
- Thomsen, K.; Sørensen, P. Fatigue loads for wind turbines operating in wakes. J. Wind Eng. Ind. Aerodyn. 1999, 80, 121–136. [Google Scholar] [CrossRef] [Scilit]
- Fleming, P.; Gebraad, P.M.; Lee, S.; van Wingerden, J.W.; Johnson, K.; Churchfield, M.; Michalakes, J.; Spalart, P.; Moriarty, P. Simulation comparison of wake mitigation control strategies for a two-turbine case. Wind Energy 2015, 18, 2135–2143. [Google Scholar]
- Wang, Y.; Liu, Z. Fatigue analysis of wind turbine and load reduction through wind-farm-level yaw control. Energy 2025, 326, 136266. [Google Scholar]
- Wang, Y.; Liu, Z. Structural control of floating offshore wind turbines via active yaw control. J. Fluids Struct. 2026, 140, 104462. [Google Scholar]
- Jonkman, J.; Butterfield, S.; Musial, W.; Scott, G. Definition of a 5-MW Reference Wind Turbine for Offshore System Development; Technical Report; National Renewable Energy Laboratory (NREL): Golden, CO, USA, 2009.
- Robertson, A.; Jonkman, J.; Masciola, M.; Song, H.; Goupee, A.; Coulling, A.; Luan, C. Definition of the Semisubmersible Floating System for Phase II of OC4; Technical Report; National Renewable Energy Laboratory (NREL): Golden, CO, USA, 2014.
- Niu, Y.; Lathi, P.P.; Nagamune, R. Floating offshore wind farm control via turbine repositioning with aerodynamic force. In Proceedings of the 2023 American Control Conference (ACC); IEEE: San Diego, CA, USA, 2023; pp. 2542–2547. [Google Scholar]
- Dinmohammadi, F.; Shafiee, M. A fuzzy-FMEA risk assessment approach for offshore wind turbines. Int. J. Progn. Health Manag. 2013, 4, 59–68. [Google Scholar] [CrossRef] [Scilit]
- Jonkman, B.J. TurbSim User’s Guide: Version 1.50; Technical Report; National Renewable Energy Laboratory (NREL): Golden, CO, USA, 2009.
- IEC 61400-1: 2019; Wind Energy Generation Systems-Part 1: Design Requirements. International Electrotechnical Commission: Geneva, Switzerland, 2019.
- Jonkman, J.M.; Robertson, A.; Hayman, G.J. HydroDyn User’s Guide and Theory Manual; National Renewable Energy Laboratory: Golden, CO, USA, 2014.
- Hasselmann, K.; Barnett, T.P.; Bouws, E.; Carlson, H.; Cartwright, D.E.; Enke, K.; Ewing, J.; Gienapp, A.; Hasselmann, D.; Kruseman, P.; et al. Measurements of wind-wave growth and swell decay during the Joint North Sea Wave Project (JONSWAP). Ergaenzungsheft Zur Dtsch. Hydrogr. Z. Reihe A 1973. Available online: https://scispace.com/pdf/measurements-of-wind-wave-growth-and-swell-decay-during-the-2esyfu2epg.pdf (accessed on 9 June 2026).
- Young, I.R. Wind Generated Ocean Waves; Elsevier: Oxford, UK, 1999. [Google Scholar]
- Jonkman, J.M.; Shaler, K. Fast.Farm User’s Guide and Theory Manual; National Renewable Energy Laboratory: Golden, CO, USA, 2021.
- Li, H.; Hu, Z.; Wang, J.; Meng, X. Short-term fatigue analysis for tower base of a spar-type wind turbine under stochastic wind-wave loads. Int. J. Nav. Archit. Ocean. Eng. 2018, 10, 9–20. [Google Scholar]
- Hayman, G. MLife Theory Manual for Version 1.00; National Renewable Energy Laboratory: Golden, CO, USA, 2012.

Disclaimer/Publisher’s Note: The statements, opinions and data contained in all publications are solely those of the individual author(s) and contributor(s) and not of MDPI and/or the editor(s). MDPI and/or the editor(s) disclaim responsibility for any injury to people or property resulting from any ideas, methods, instructions or products referred to in the content. |
© 2026 by the authors. Licensee MDPI, Basel, Switzerland. This article is an open access article distributed under the terms and conditions of the Creative Commons Attribution (CC BY) license.