Abstract
Nourishment grain size is a key parameter in beach nourishment projects, directly determining beach stability under extreme hydrodynamic environments. Taking Xiaoshizui Beach on Wailingding Island as the study area, this paper establishes a coupled typhoon storm surge–wave–sediment model based on the MIKE 21 HD-SW-ST coupled model. This model has been systematically verified through the measured data of tide levels, waves, and beach profiles, and the verification results are satisfactory. Four scenarios with nourishment grain sizes of 0.4, 0.6, 0.8, and 1.0 mm were established to quantify the morphological evolution patterns of the beach under strong typhoons. The results indicate that during the typhoon, the beach exhibits a cross-shore sediment transport pattern characterized by erosion of the backshore dune, accretion of the upper-middle foreshore, and erosion of the lower foreshore. The influence of nourishment grain size shows significant spatial variability: increasing grain size enhances the erosion resistance of the backshore and berm, reducing the erosion extent; however, within the breaker zone, coarse sand tends to form a steep profile, intensifying wave breaking, which increases the scour depth in this region. This study elucidates the regulatory mechanism of grain size under extreme conditions, providing scientific reference for grain size selection in beach restoration projects.
1. Introduction
Sandy beaches represent one of the most typical depositional landforms in the coastal zone and constitute a vital component of both coastal ecosystems and human society. As natural barriers against waves, beaches maintain rich biodiversity and provide critical natural resources for coastal tourism, fisheries, and leisure industries [1,2,3]. However, the interaction between anthropogenic activities and global climate change has significantly exacerbated coastal erosion. According to Luijendijk et al. [4], approximately 7% of global sandy shorelines are undergoing severe erosion, while 24% of the shorelines exhibit a retreat rate exceeding 0.5 m/a.
Typhoon-induced storms are the primary driving forces causing drastic erosion and geomorphological changes in sandy beaches over short periods. Extensive studies have confirmed that typhoon events are often accompanied by strong winds, large waves, and significant water level setup. The resulting extreme hydrodynamic environments can lead to dramatic changes in beach profiles, rapid shoreline retreat, and the reshaping of nearshore sedimentary patterns within hours to days [5]. Escalating global climate change correlates with a marked increase in both the frequency and severity of typhoons, further elevating the risk of typhoon-induced beach erosion; thus, research on the underlying erosion mechanisms has garnered global attention.
The beach’s response to storms is mainly influenced by tidal conditions, local morphological features, and the characteristics of the storm event. The propagation and breaking processes of nearshore waves are modulated by water depth, and tidal level variations during typhoons constitute a significant component of the total water depth. Total water depth not only controls the extent and degree of beach erosion, but may also alter the spatial location of wave–current interactions [6]. The superimposition of storm surges on astronomical high tides significantly exacerbates their erosive impact. Liu et al. (2022) [7] conducted a coupled simulation using Delft3D and XBeach and found that compared to low tides, high tides and moderate tides have higher water levels and greater tidal ranges. The waves generated by high tides act on the higher-altitude areas of the beach, driving greater offshore sediment transport. The waves caused by high tides have stronger velocities, thereby increasing the sediment transport rate of the entire beach. Furthermore, the extent of coastal erosion is heavily governed by local morphological factors—such as beach length, slope, and orientation. Existing research indicates that the influence of storm distance on beach erosion/accretion intensity exceeds that of storm intensity [8]. Xing et al. (2023) [9] employed the XBeach model to simulate the morphodynamic evolution of Chudao’s southern coast under the influence of Typhoon Lekima, and the results showed that the nearshore water level significantly rose under the storm surge caused by the typhoon. During the entire typhoon process, the beach profile experienced continuous and extensive erosion, and the response process of the sand beach was regulated by topographic conditions. Qi et al. (2010) [10] analyzed the observational data from 6 storms in the South China Sea and 8 different coastal types, and also confirmed that there are significant differences in the response characteristics of different types of beaches to storms. Apart from single storm events, recent studies have further pointed out that the response of beaches to storms is also related to the number and intensity of storms. Compared to a single storm, storm clusters tend to cause more severe beach erosion mainly due to the cumulative effect [11,12]. Additionally, the temporal sequencing characteristics within storm clusters may play a key regulatory role in the overall erosion effect [11,13,14].
Traditional coastal protection projects predominantly employ hard structures, such as seawalls, detached breakwaters, and groins. While these measures can rapidly resist wave impact and protect shoreline stability to a certain extent [15,16,17], numerical simulation studies indicate that the narrow gap regions around hard structures are highly susceptible to inducing fluid resonance under wave action, leading to significant wave height amplification and a dramatic increase in wave loads [18,19]. Therefore, hard engineering often disrupts the natural equilibrium of nearshore sediment transport, exacerbating erosion in neighboring coastal areas and degrading local ecosystems [16,20]. In contrast, beach nourishment, which rapidly restores beach width and berm height through the exogenous supply of sand sources, is regarded as a superior alternative to hard engineering. It mitigates shoreline retreat trends over certain time scales while balancing landscape, tourism, and ecological functions, making it a widely implemented measure [21,22].
In the research on beach nourishment projects, the stability and long-term benefits of the nourishment projects are jointly controlled by multiple factors, including nourishment volume, placement location, grain size, and regional hydrodynamic conditions. Among these, nourishment grain size serves as a core parameter directly determining the sediment incipient motion, settling, and transport characteristics, playing a key regulatory role in the morphological evolution and erosion resistance of the nourished beach under different hydrodynamic environments. Increasing grain size typically leads to a steeper beach slope [23]; larger particles require more energy to be transported and are typically found in high-energy environments. Conversely, finer particles are transported by weaker currents or winds, thereby accumulating in low-energy environments [24]. Differences in beach response to storms are not only dominated by hydrodynamic conditions but are also correlated with beach type [25], beach morphology [26], and sediment grain size [27]. In recent years, process-based numerical models have been increasingly adopted to simulate the morphological response of beach topography to storms and evaluate the performance of beach nourishment under diverse design scenarios. Silva et al. [28] applied the XBeach model to the coast of the Ebro Delta and compared the effectiveness of four beach nourishment strategies (including uniform beach filling and dune deployment at three distinct locations) under low- and high-energy Mediterranean storm conditions. The results demonstrated that the optimal sand placement location varies with storm intensity. Pinto et al. [29] further validated XBeach based shoreface nourishment simulations under the impact of extratropical storms along the Atlantic coast of Portugal and recorded the redistribution of nourished sediments on the active shoreface profile.
The above studies have deepened the understanding of how beach nourishment design interacts with storm-induced morphodynamic processes. However, existing research mainly focuses on the morphological evolution characteristics of beaches under different nourishment schemes or the geomorphic responses of natural beaches to storm erosion. In comparison, quantitative comparisons of different nourishment sediment grain size scenarios under the typhoon-driven morphodynamic background of embayed beach environments remain relatively limited. Xiaoshizui Beach on Wailingding Island is a typical embayed beach. Taking this beach as the study area, the present study employs the MIKE 21 HD-SW-ST coupled model [30], which is calibrated and validated using historical field observation data. By setting multiple scenarios with different nourishment sediment grain sizes, numerical simulation and analysis were conducted on the evolutionary characteristics of beach morphology during typhoon events. This study aims to reveal the influence patterns and underlying mechanisms of different nourishment grain sizes on beach morphological changes under typhoon impacts to provide references for the selection of sediment grain sizes in beach restoration projects.
2. Study Area
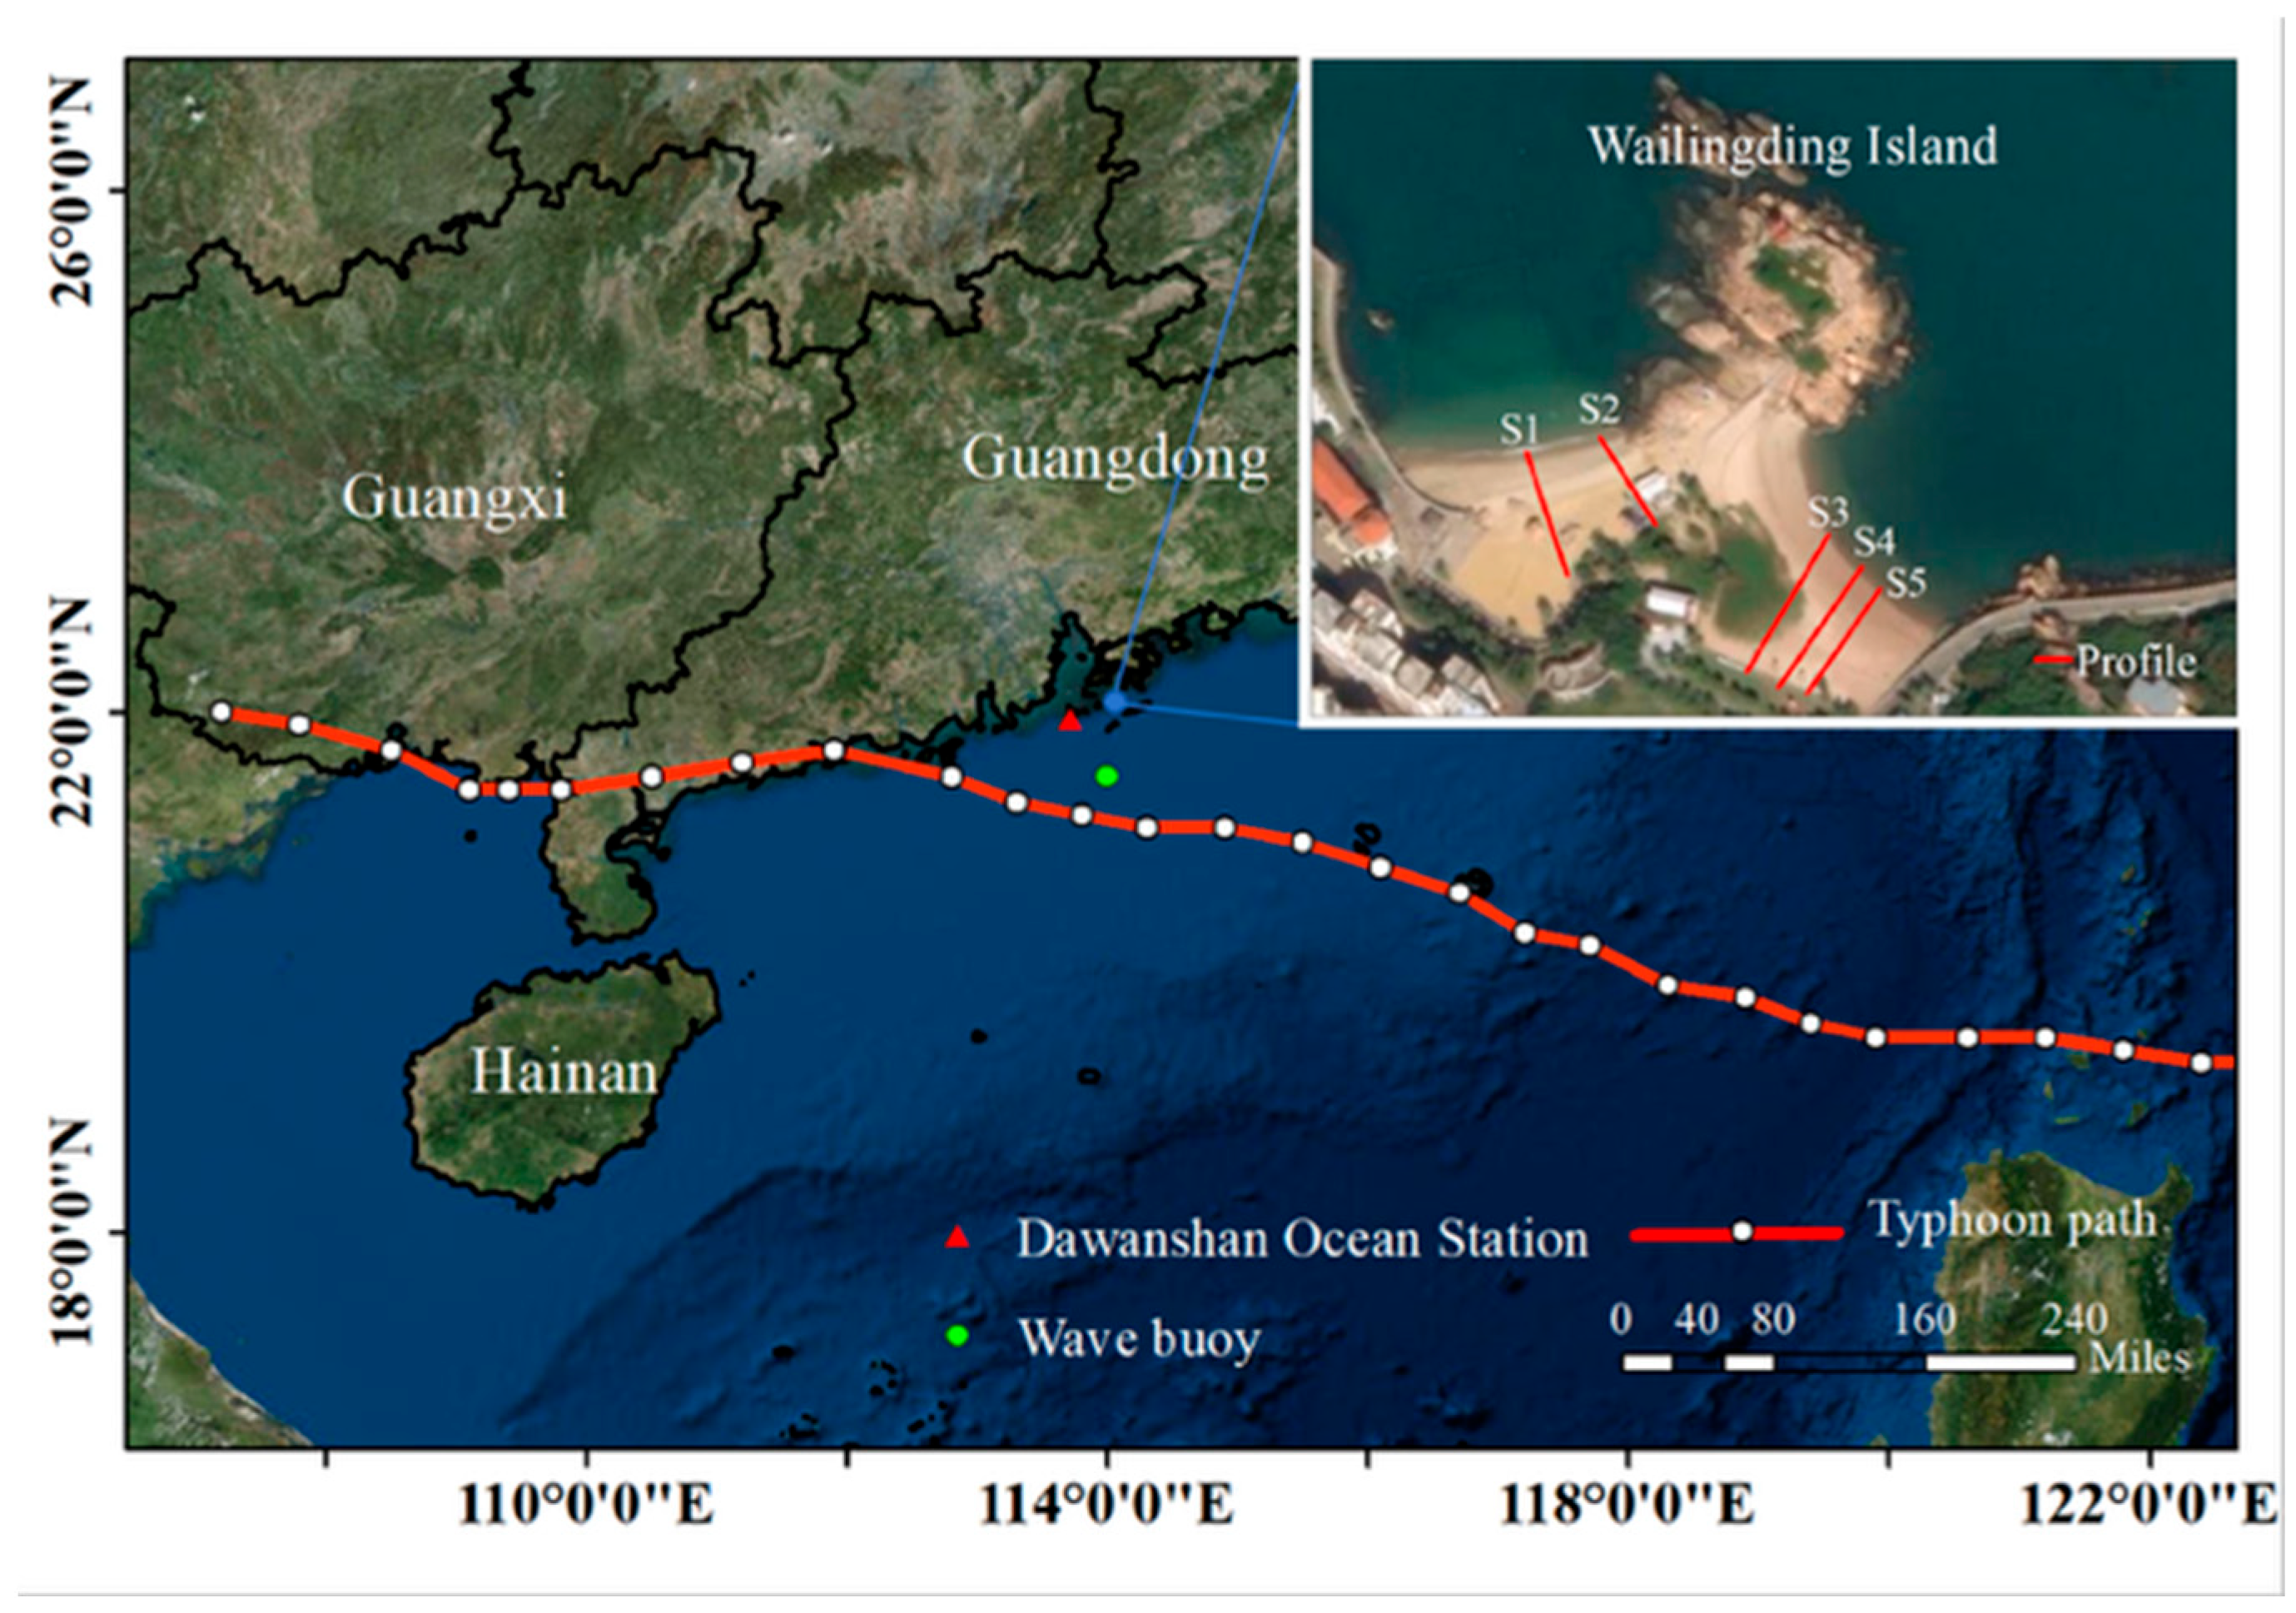
Geographically positioned in the eastern waters of the Wanshan Archipelago at the Pearl River Estuary, Wailingding Island has a land area of 4.399 km2 and a coastline of 12.22 km. Morphologically, the island spans 3.2 km along its east–west axis and 2.4 km along its north–south axis, tapering to 1.07 km at its narrowest section. The specific site of this study is Xiaoshizui Beach, located on the northwest coast of Wailingding Island (inside Shiyong Bay), as shown in Figure 1. The beach exhibits a straight morphology, with a shoreline length of approximately 180 m and an average berm width of about 10 m.
Figure 1.
Study area.
The waters adjacent to this region are dually influenced by the East Asian monsoon climate and Pearl River runoff, resulting in active hydrodynamic conditions. The tide is characterized as an irregular semidiurnal tide, with an average tidal range between 1.0 m and 1.7 m. During spring tides, the maximum surface ebb current velocity can exceed 1.0 m/s [31]. Wave action is dominated by wind waves, followed by swell. The prevailing wave direction ranges from SE to S, and the annual mean significant wave height is generally less than 1.2 m. Controlled by seasonal monsoon variations, prevailing northeasterly winds in winter result in relatively rough sea states. Although southwesterly winds prevail in summer with relatively calm sea states, the area is susceptible to tropical cyclones, during which giant waves with significant wave heights exceeding 2.8 m can occur [32].
The typhoon investigated in this study was Typhoon No. 2518, Ragasa, with its track shown in Figure 1. Characterized by an extensive impact range and extremely high intensity, Ragasa exhibited rapid intensification, super-typhoon intensity, and a complex trajectory, classifying it as a typical severe typhoon. On 17 September 2025, the typhoon originated in the Northwest Pacific as a tropical depression; by the afternoon of September 18, the depression developed into a tropical storm. In the early morning of September 21, Ragasa rapidly intensified into a super typhoon. With the sharp increase in the central wind speed, the lowest central pressure dropped to approximately 905 hectopascals, making this event one of the most powerful tropical cyclones in the Northwest Pacific in 2025. Subsequently, it moved northwestward. When making landfall near the Babuyan Islands in Cagayan Province, north of Luzon Island, Philippines, on September 22, it maintained extremely strong winds, bringing intense wind and destructive precipitation to the local area. On September 24, Typhoon Ragasa made landfall on Hailing Island (Yangjiang City, Guangdong Province) as a severe typhoon, subsequently weakening as it moved inland.
3. Materials and Methods
3.1. Methodology
3.1.1. MIKE Model
This study employs the MIKE 21/3 HD-SW-ST coupled model (version 2023) (DHI, Hørsholm, Denmark; ) to simulate the processes of tidal currents, waves, and sediment transport. MIKE 21 is a depth-averaged two-dimensional numerical model; its HD module relies on the depth-integrated incompressible Reynolds-averaged Navier–Stokes equations. These equations are time-averaged based on the Reynolds-averaged theory and follow the Boussinesq approximation and the assumption of static water pressure. The hydrodynamic module is governed by the continuity and momentum conservation equations.
The MIKE 21 SW model is a spectral wave model based on unstructured meshes. Constructed based on the wave action conservation equation, the wave field is described by the wave action density N (σ, θ), making it widely applicable for engineering applications and wave prediction modeling in coastal and estuarine regions. The model is capable of simulating the generation and growth of wind-generated waves in offshore and coastal areas, as well as the propagation, dissipation, and transformation processes of swells. In this study, a bidirectional coupling model was constructed using the MIKE 21 HD module and the SW module: the water level and flow field calculated by the HD module were used as the dynamic background field to input the SW module, supporting the iterative solution of the wave field; conversely, the wave radiation stress calculated by the SW module was fed back as the core driving force to the hydrodynamic module, simultaneously correcting the bottom friction dissipation under the coexistence of waves and currents, and participating in the subsequent calculation of the water level and flow field to simulate the interaction between waves and currents [30].
The MIKE 21 ST model supports the calculation of sediment transport under pure current or combined wave–current action. It solves the advection–diffusion equation for sediment concentration and updates the bed level based on sediment flux divergence [33]. It can calculate both suspended load and the total load (comprising suspended load and bed load). The simulation process of this module is generally divided into four main parts: (1) the wave module provides elements such as wave radiation stress, wave height, and wave period; (2) the hydrodynamic module calculates the current velocity, current direction, and water level variations via the 2D tidal current model; (3) the sediment transport module processes sediment settling, suspension, and diffusion; and (4) the evolution of underwater topography is simulated based on the bed level change equation.
3.1.2. Typhoon Model
The fundamental meteorological data used in this study, including atmospheric pressure and maximum wind speed, were acquired from the Tropical Cyclone Data Center of the China Meteorological Administration (https://tcdata.typhoon.org.cn/zjljsjj.html, accessed on 25 November 2025) [34].
To generate accurate typhoon wind and pressure fields as driving conditions for the hydrodynamic model, this study adopted the calculation formulae for typhoon pressure and wind fields proposed by Wang et al. [35], which are applicable to the China region:
(1) Pressure field calculation:
(2) Wind field calculation:
where is the latitude of the typhoon center; is the moving speed of the typhoon center; is the ambient pressure (normal pressure) of the typhoon; is the central pressure of the typhoon; is the radius of maximum wind speed (the distance between the center of the cyclone and its most intense wind zone); is the pressure at a distance from the typhoon center; and and represent the components of the typhoon translation speed in the and directions, respectively.
3.2. Model Construction and Validation
3.2.1. Model Setup
Based on MIKE 21, this study established a coupled tide–wave–sediment numerical model for the waters of the Xiaoshizui Beach restoration project on Wailingding Island. Bathymetric data for the waters near the study area were obtained by integrating nautical charts with in situ survey data. Offshore bathymetry data were derived from the ETOPO global bathymetry dataset [36], while the coastline was defined using Google Earth imagery and field surveys. The study area covers an extent from east longitude 105.46° E to 125.82° E, and from latitude 13.84° N to 27.71° N, covering the entire South China Sea, the Taiwan Strait, and the eastern part of the East China Sea. An unstructured triangular mesh was employed to adapt to the complex coastline, and wetting and drying processes were handled using dynamic boundaries. To balance accuracy and computational efficiency, three nearshore grid resolutions of 10 m, 5 m, and 3 m were tested respectively. The results showed that the computational results of the 10 m grid and the 5 m grid differed significantly, with the 10 m grid producing a maximum morphological change of only 0.15 m, substantially lower than the 0.60 m from the 5 m grid. In contrast, the difference between the 5 m grid and the 3 m grid was comparatively small; the 3 m grid yielded a maximum morphological change of 0.63 m, representing a 5% difference relative to the 5 m grid, which confirms grid convergence. However, the 3 m grid would significantly reduce the computational efficiency. Therefore, the nearshore and project area grid resolution was ultimately selected as 5 m, and the entire computational domain contained approximately 60,191 triangular elements and 31,813 nodes. Bathymetry was assigned to the grid nodes via inverse distance weighted interpolation. The boundary conditions were set based on the TPXO9 global tidal database (https://www.tpxo.net/, accessed on 25 November 2025). The input parameters included eight main tidal components: M2, S2, N2, K2, K1, O1, P1, Q1. The Manning coefficient was set at 60 m1/3/s, and the Smagorinsky coefficient was 0.28.
The control equation of the wave mathematical model adopts the full-spectrum formula, and the time processing adopts the unsteady formula. The frequency spectrum utilized a logarithmic discretization, and the directional spectrum covered 360 degrees to accommodate variations in wind, wind waves, or swell. Considering the importance of the wind field, spatiotemporally varying wind velocity component fields were input into the model; wind field data were processed into 2D structured grid files and mapped to the computational mesh via bilinear interpolation. The smoothing factor α for diffraction was set to 1. Bed roughness was set to 0.004 m. Wave breaking was simulated using the Battjes and Janssen formulation with a default parameter value of 0.8. The JONSWAP spectrum was selected for the initial boundary condition spectrum.
Given that local sediment dynamics are jointly controlled by waves and currents, a coupled modeling approach was adopted. Specifically, the quasi-three-dimensional STPQ3D module was utilized to generate transport rate tables, from which sediment transport rates were determined via linear interpolation. Consistent with field characteristics, the critical Shields parameter was set to 0.040, and the background water temperature was set to 30 °C based on the measured average value of the sea area.
This study adopted a coupled HD–SW–ST model, with the coupling time step set to 600 s. Sediment transport was calculated using the quasi-steady state method, in which the transport rate under current conditions is determined via linear interpolation from a pre-generated transport rate table within each hydrodynamic time step. The morphological acceleration factor method was applied for terrain updating. Given that this study simulated real typhoon processes, the morphological acceleration factor was set to 1 (no acceleration) to accurately reflect topographic evolution on the actual time scale. The terrain update interval was consistent with the coupling time step. This configuration can reasonably capture the morphological profile dynamic response during typhoon events while ensuring numerical stability.
3.2.2. Model Validation
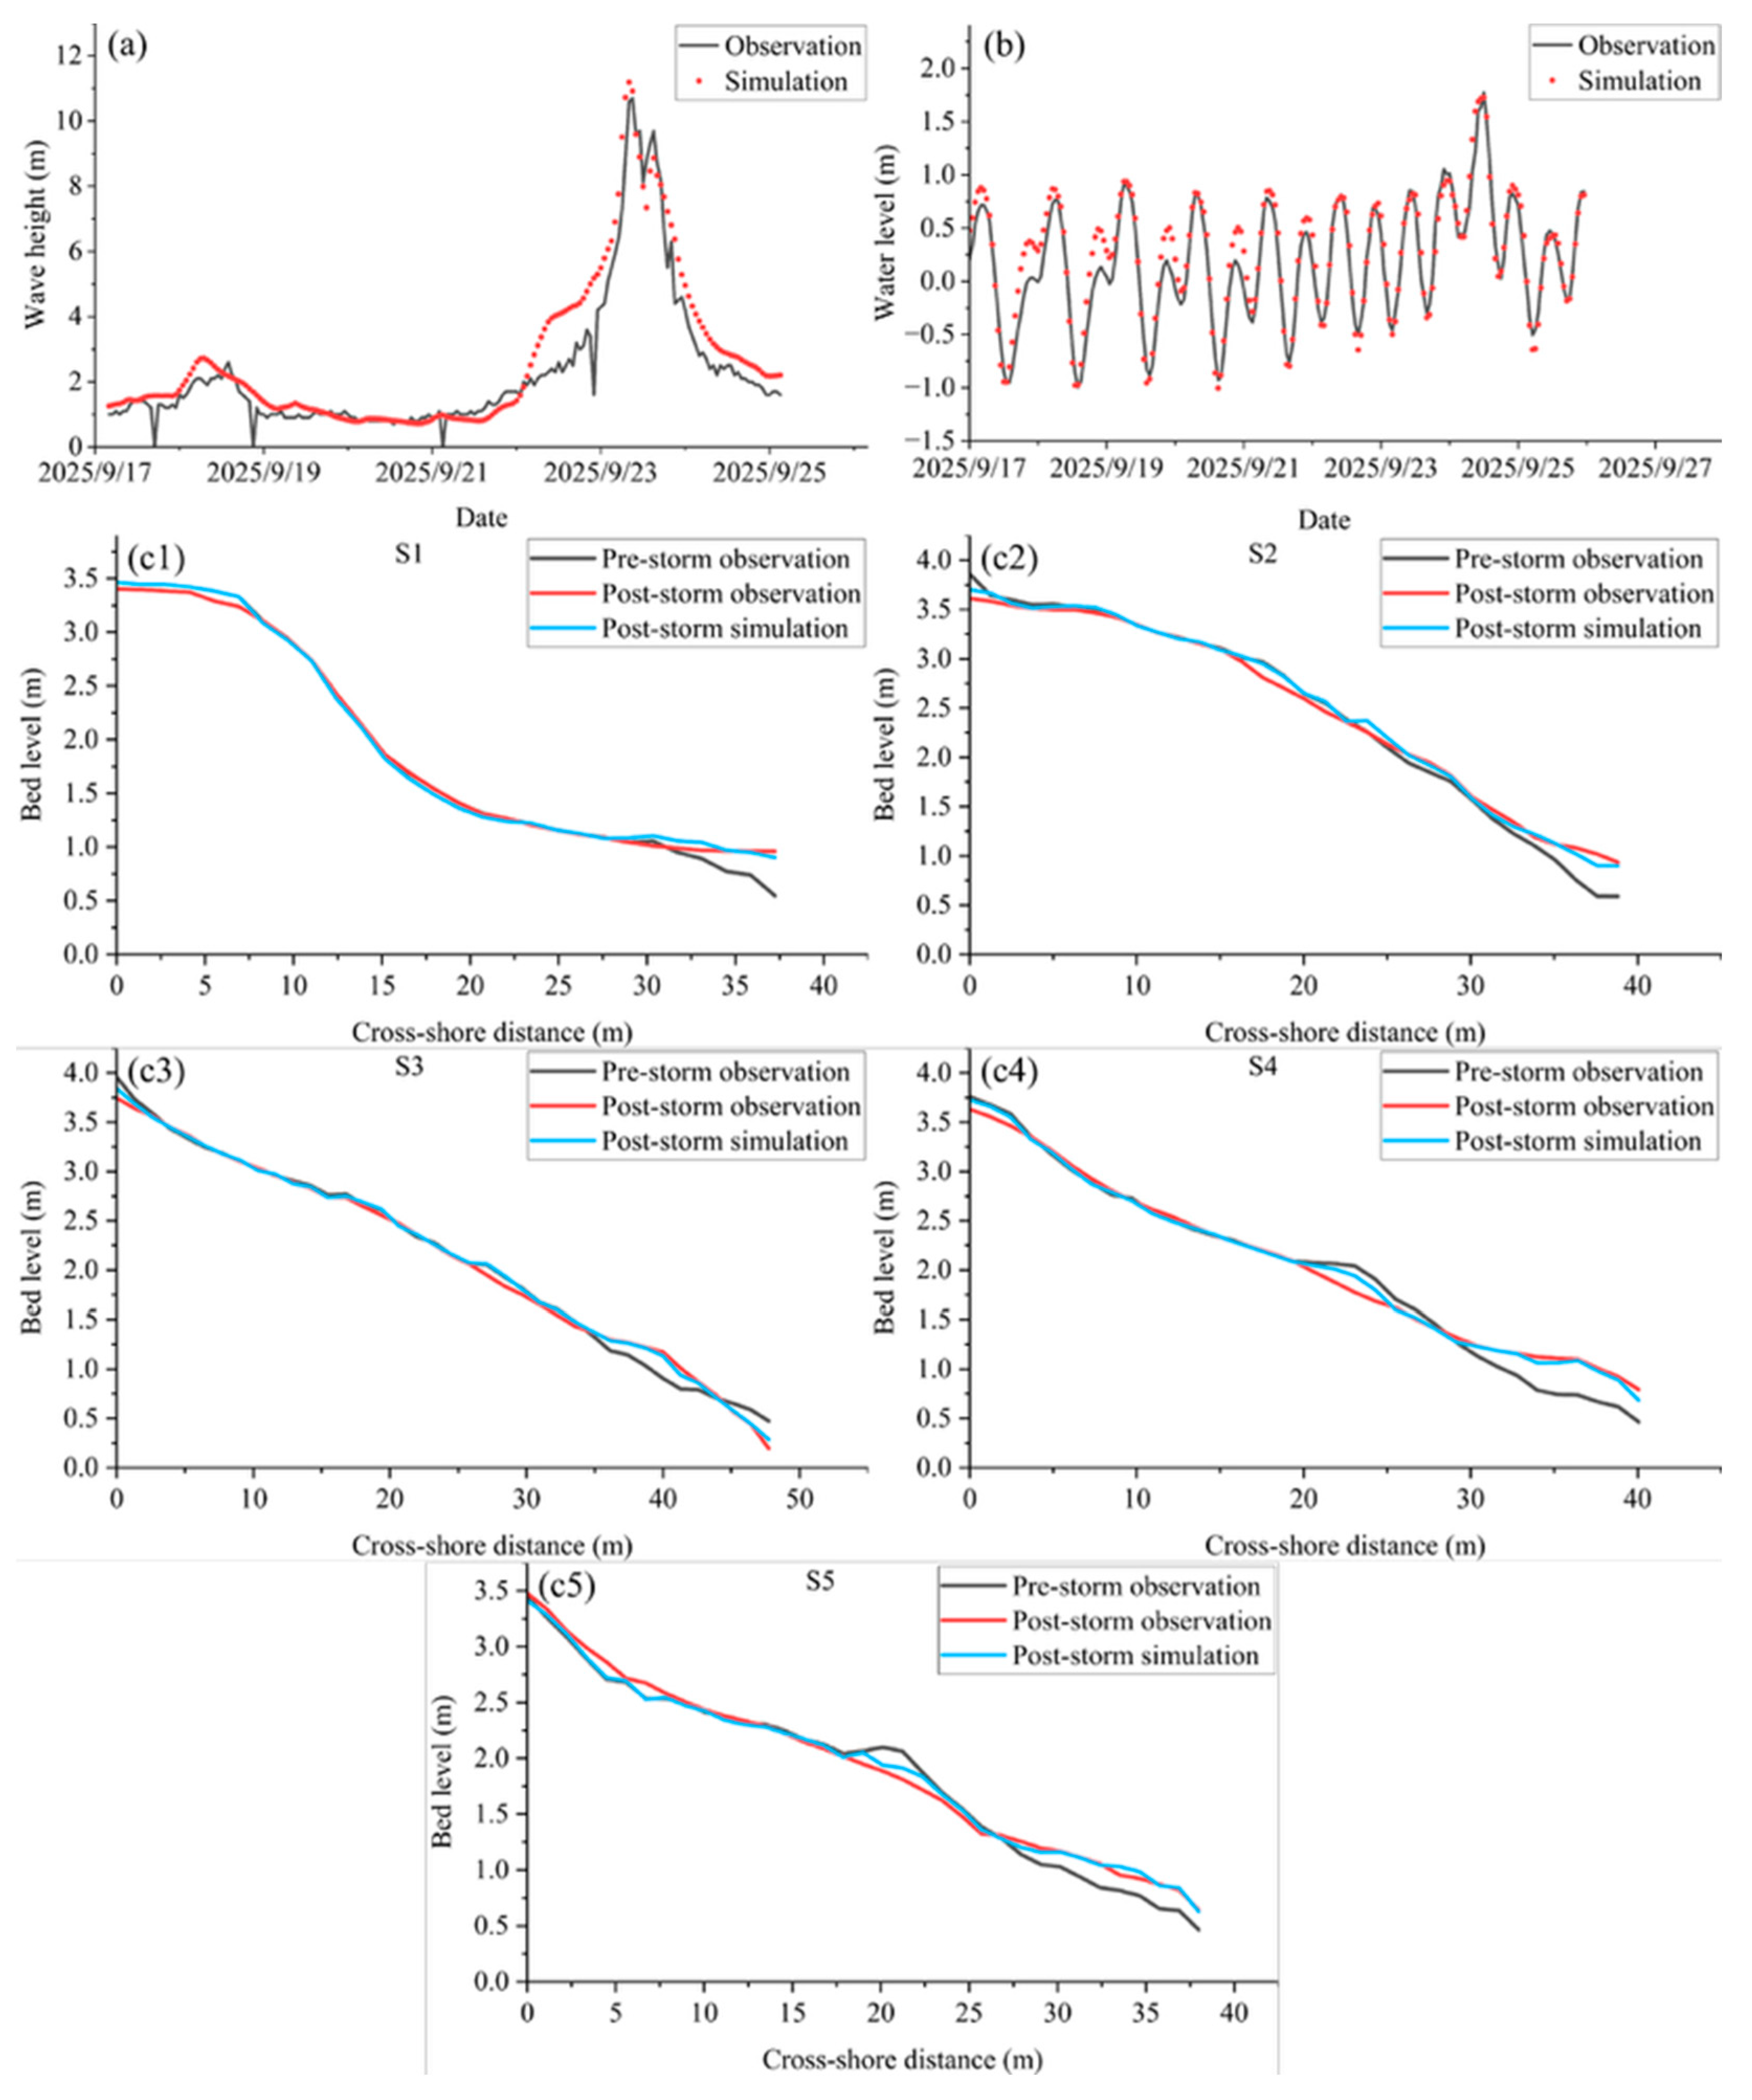
To ensure the reliability of the numerical simulation, the coupled wave–tide model was systematically validated using in situ observed data collected from September 17 to 25, 2025. Since there were no in situ wind field data within the model area, the wind field was indirectly validated using measured significant wave heights, rather than through comprehensive meteorological validation. Water level validation data were selected from the Dawanshan Ocean Station (113°43′ E, 21°56′ N), while wave validation data were derived from a wave buoy located at (114° E, 21.5° N). The locations are presented in Figure 1. The hydrodynamic validation results are presented in Figure 2a,b. The validation results demonstrate that the simulated water levels and significant wave heights were in good agreement with the measured values regarding both variation trends and magnitudes; in particular, the model accurately reproduced the peak wave characteristics during the passage of the typhoon on September 23 with Pearson correlation coefficients reaching as high as 0.96 and 0.95, respectively. The verification results of the beach profile are shown in Figure 2c1–c5, with the elevation referenced to the 1985 National Vertical Datum of China (NVD85). The bed surface height variations of the simulated profiles S1 to S5 were in close agreement with the topographic heights measured after the typhoon, effectively capturing the beach erosion and accumulation processes caused by the storm surge. However, local discrepancies still existed on some profiles. These are primarily attributable to the model’s use of a spatially uniform median grain size, whereas field observations revealed that sediment composition varied substantially along the beach profiles. Such variations significantly influence the local morphological responses. This limitation is clearly reflected in the observational differences for profiles S1 and S5, where the model underestimated the development of bar features. This suggests that the uniform grain-size assumption can introduce biases when simulating local morphological characteristics, particularly in areas with pronounced sediment grain-size gradients. Through sensitivity analysis, we demonstrated that changes in grain size mainly affect the magnitude of local features, while the overall patterns of erosion and deposition remain consistent. These findings indicate that although the model may not fully resolve fine-scale morphological changes, it is capable of capturing the dominant dynamic processes of major morphological evolution at the beach scale.
Figure 2.
Model validation diagrams. (a) Comparison of the simulated and observed tidal levels at the Dawanshan Ocean Station. (b) Comparison of the simulated and observed significant wave heights at the wave buoy. (c1–c5) Comparison of the simulated bed elevations and measured topography along typical beach profiles (S1–S5) before and after the passage of Typhoon Ragasa (referenced to NVD85, 1985 National Vertical Datum of China).
To evaluate the model performance, the Brier Skill Score (BSS) was used [37]. A BSS value of 1 indicates a perfect match, while a negative skill score will occur if the deviation between the model prediction and the final measurement conditions is greater than that between the baseline prediction and the final measurement conditions. The evaluation criteria are shown in Table 1. The BSS values for the five profiles S1 to S5 were 0.77 (Good), 0.81 (Excellent), 0.78 (Good), 0.89 (Excellent), and 0.76 (Good), respectively. The comprehensive validation results indicate that despite local discrepancies at S1 and S5, the overall BSS results confirm that the model’s predictive capability is satisfactory and meets the requirements for subsequent studies on beach morphological evolution [7].
Table 1.
BSS evaluation value range and the prediction effects represented.
3.3. Scenario Settings
To investigate the influence of different nourishment grain sizes on beach erosion under extreme typhoon conditions, this study simulated the beach erosion and accretion processes associated with varying nourishment grain sizes during Typhoon Ragasa. The simulation duration spanned 72 h, encompassing the period before and after the typhoon’s landfall. The beach nourishment extended 40 m seaward, with a berm elevation set at 1.60 m and an initial beach slope of 1:10.
Based on field measurement results, the substrate of Xiaoshizui Beach and its adjacent waters is dominated by sandy sediments, exhibiting distinct spatial zonation. Sediments in the nearshore shallow water zone are relatively coarse, with median grain sizes ranging from 0.15 to 1.48 mm (averaging 0.81 mm) and a sand content as high as 94.78%. In conjunction with the observed data, four median grain sizes—0.4, 0.6, 0.8, and 1.0 mm—were selected as the scenario parameters for the numerical simulation.
4. Results
4.1. Characteristics of Typhoon Waves
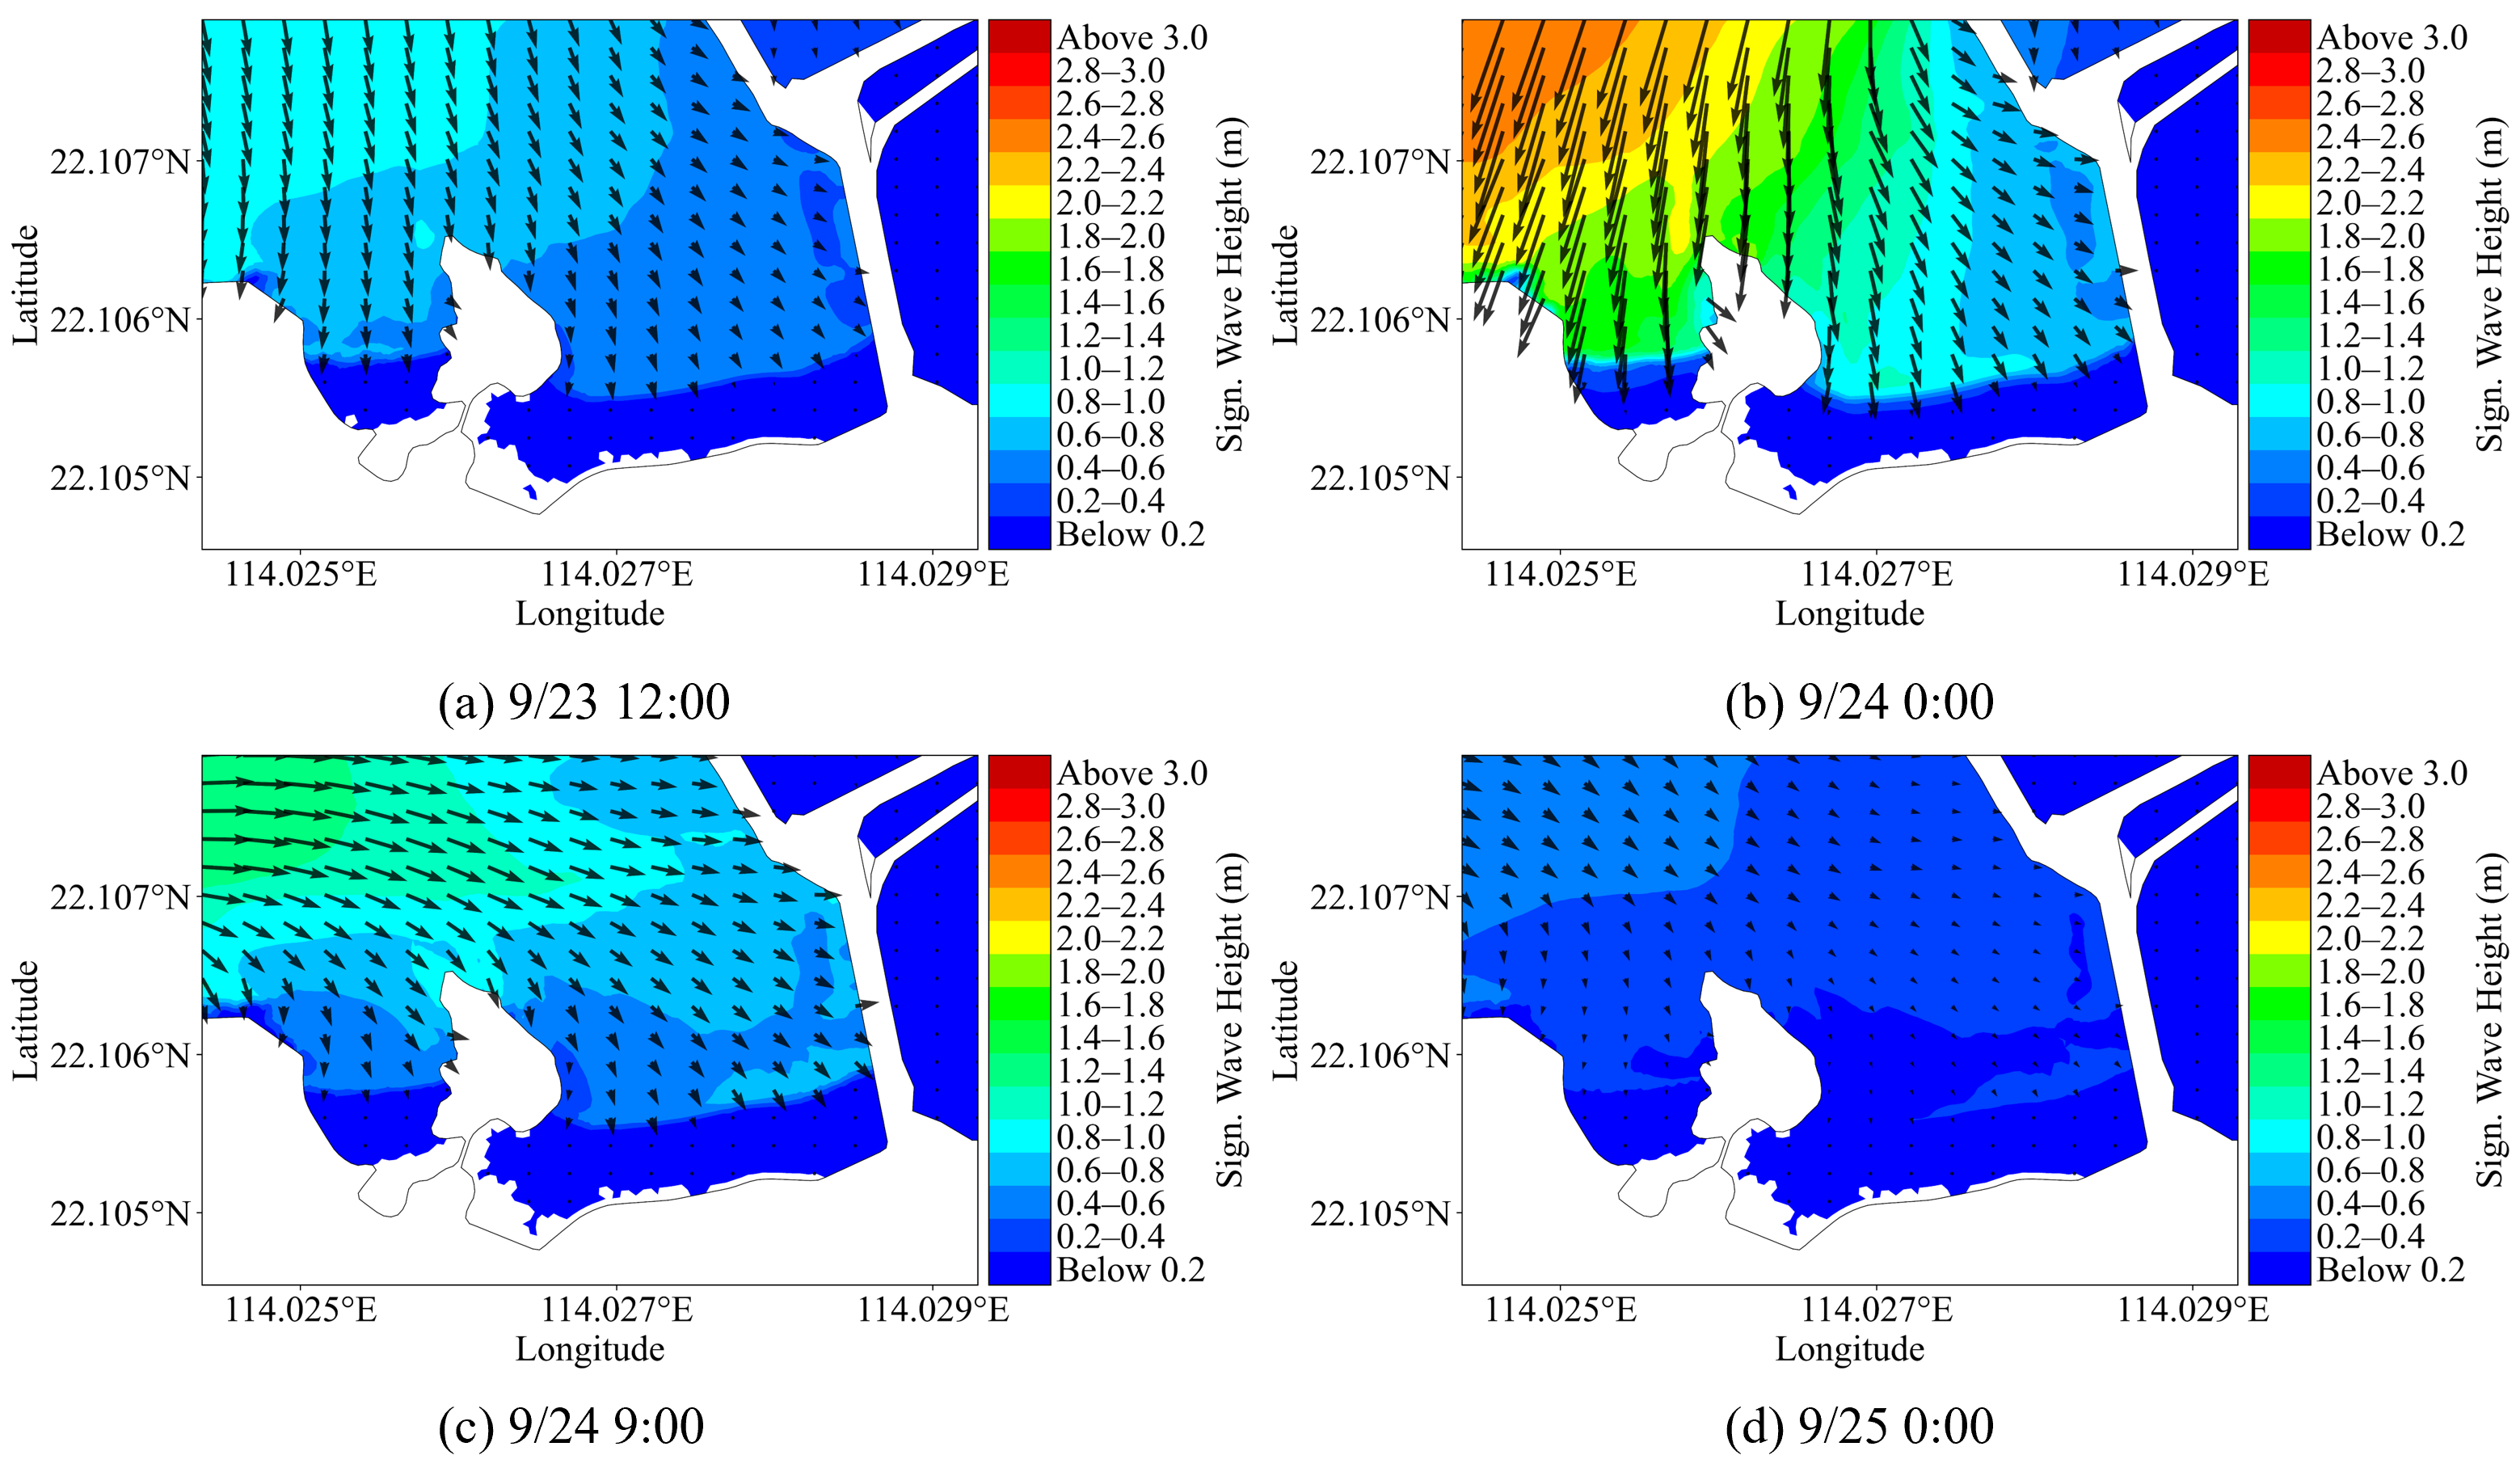
Based on the numerical simulation results, this study selected four key moments during the typhoon impact period—the growth phase (12:00, 23 September 2025), the peak phase (00:00, 24 September 2025), the decay phase (09:00, 24 September 2025), and the stable phase (00:00, 25 September 2025)—to conduct an in-depth analysis of the spatial distribution of significant wave heights across the domain. As illustrated in Figure 3, during the typhoon period, the wave field rapidly evolved, exhibiting pronounced regional variability in response to the typhoon. During the growth stage (Figure 3a), the offshore area was first affected by the typhoon. As the typhoon center approached, the significant wave height rapidly increased, reaching 1 to 1.2 m. At the peak stage (Figure 3b), the significant wave height reached its maximum value, exceeding 2.6 m. As the typhoon entered the attenuation stage (Figure 3c), the wave height throughout the area gradually decreased, with the offshore wave height dropping below 1.6 m. By the stable stage (Figure 3d), the significant wave height in the region had significantly weakened, and the offshore wave height further decreased to below 0.4 m. In contrast, the nearshore area was affected by the island’s shielding, and the overall wave height was significantly lower than that of the offshore area. Moreover, in the semi-open bay formed by the eastern breakwater and the western promontory, due to the decrease in water depth and terrain shielding, wave attenuation was significant. The maximum significant wave height decreased from 3.0 m at the bay entrance to 0.2 m, and the wave height within the bay was generally less than 2.0 m. Near the western beach, the waves propagate predominantly southward, while near the eastern beach, they propagate southeastward. It is worth noting that the variations in wave height in both space and time play a crucial role in the evolution of beach morphology and directly determine the extent of the breaking wave zone and the areas where intense sediment transport occurs.
Figure 3.
Spatial distribution of significant wave heights at representative moments during the passage of Typhoon Ragasa. The arrows indicate the direction and magnitude of the wave.
In order to further investigate the influence of sediment particle size on wave propagation and attenuation, based on the reference case of 0.4 mm, simulations were conducted with median particle sizes of 0.6 mm, 0.8 mm, and 1.0 mm. Figure 4 shows the spatial distribution of wave height differences between each particle size scenario and the reference scenario (D50 = 0.4 mm) at the peak moment of the typhoon. The results indicate that in all three cases, the wave height variations within the study area were relatively large, with the maximum variation being approximately 0.33 m. The overall trend was a decrease in wave height. As the particle size increased from 0.4 mm to 1.0 mm, the area and intensity of wave height reduction also increased slightly. In the near-shore area, the reduction in wave height was the most significant, with the local maximum reduction reaching 0.33 m. This spatial distribution of wave height changes is fundamentally controlled by sediment dynamics: differences in sediment particle size lead to distinct patterns of seabed erosion and deposition, which alter the local topography, thereby modifying wave shoaling and the subsequent distribution of wave energy.
Figure 4.
Spatial distribution of changes in average wave height during typhoon for different median grain sizes (relative to D50 = 0.4 mm). (a) D50 = 0.6 mm; (b) D50 = 0.8 mm; (c) D50 = 1.0 mm.
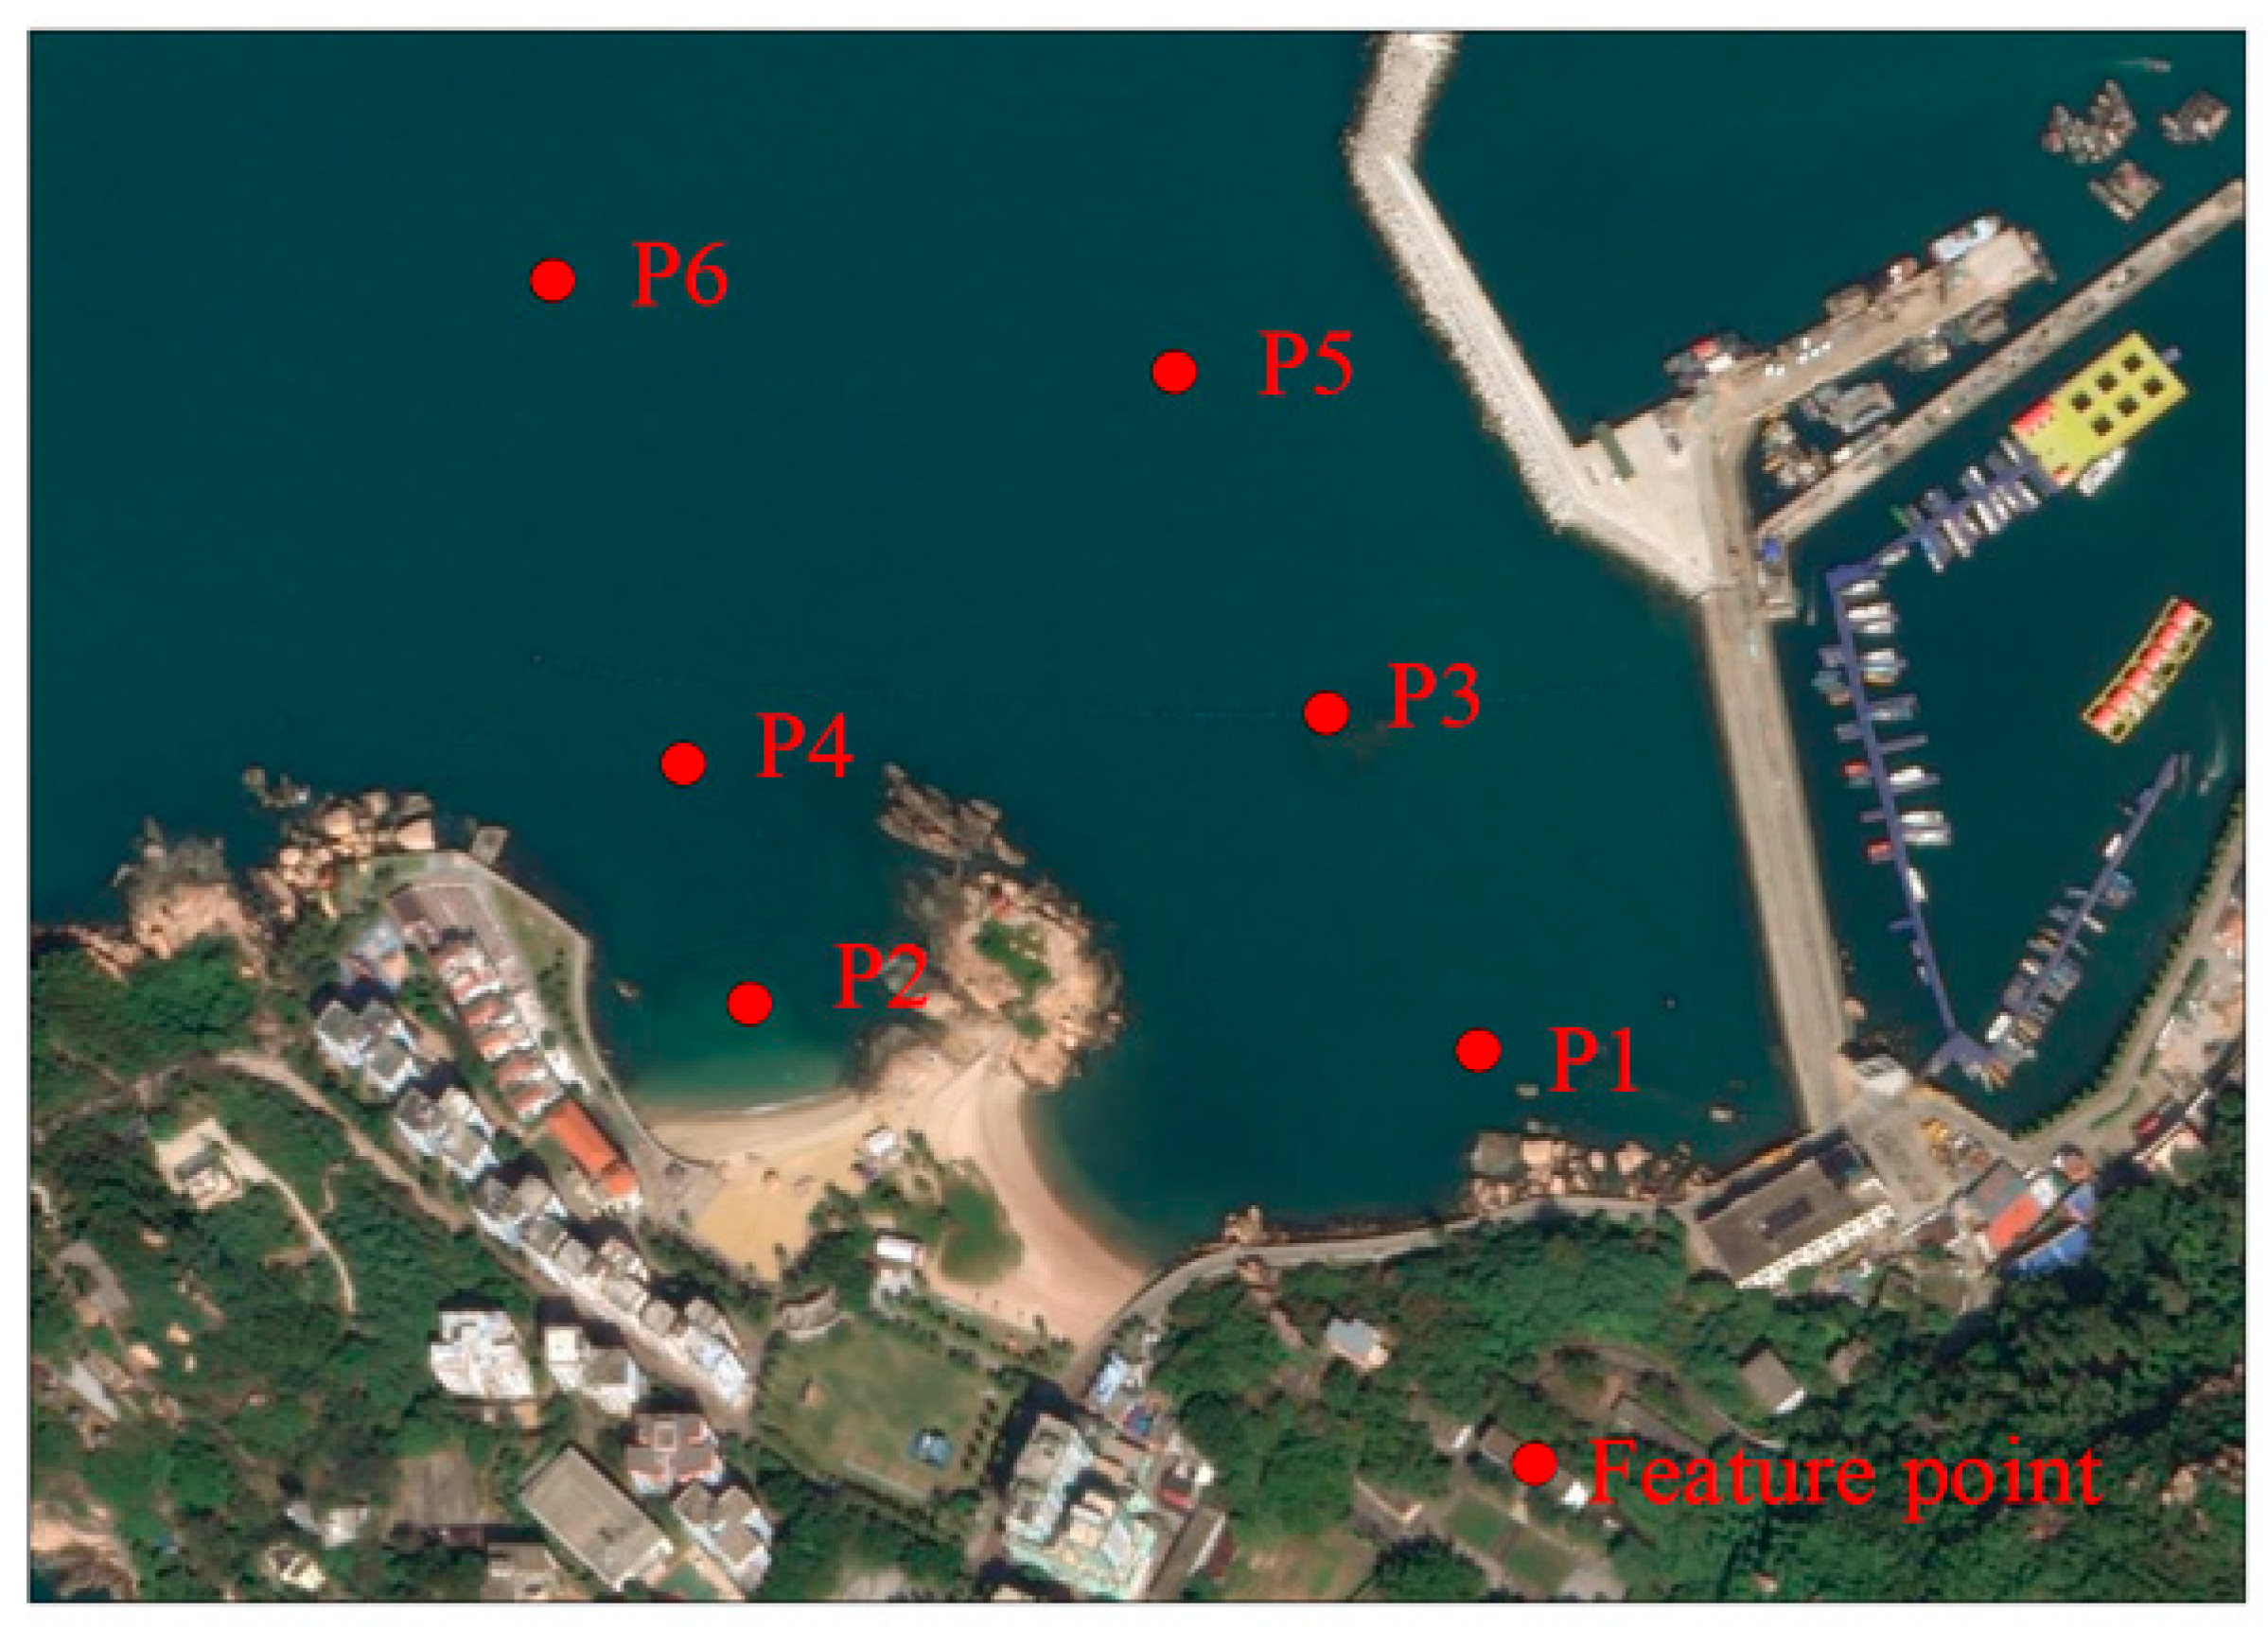
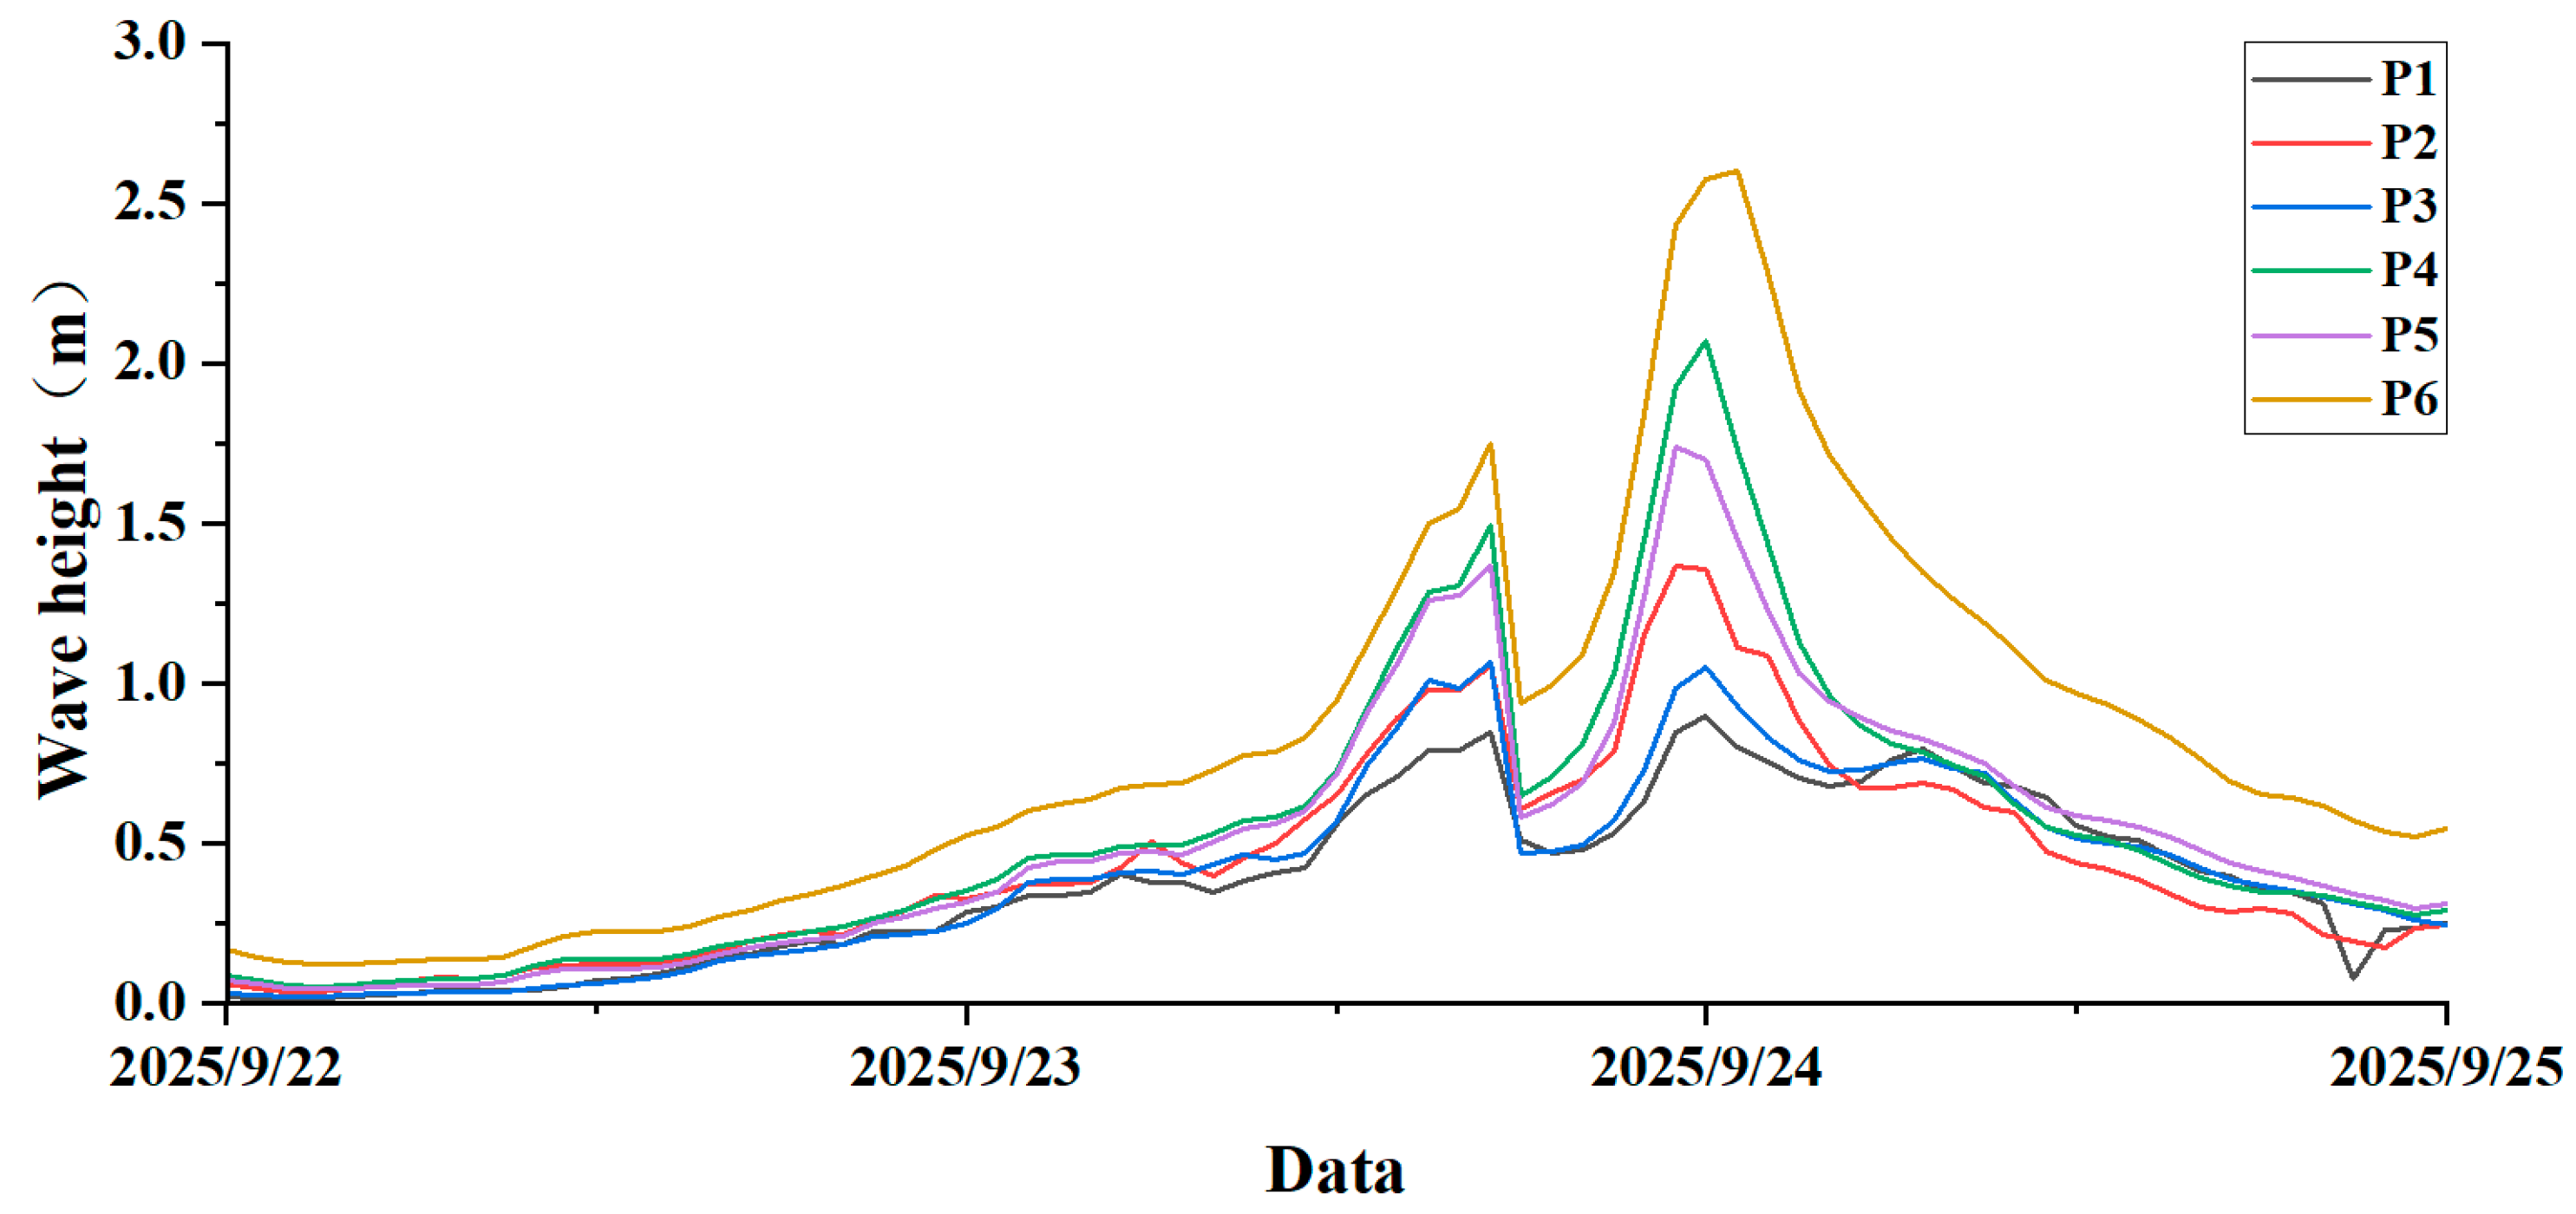
To further investigate the evolutionary patterns of typhoon waves in the local study area, six representative characteristic points were selected at the front, nearshore, and offshore locations of the east beach (P1, P3, P5) and west beach (P2, P4, P6), respectively (see Figure 5). Their wave height variation processes were compared and analyzed, and the results are shown in Figure 6. The significant wave heights at all characteristic points exhibited a bimodal feature: the first peak occurred at 17:00 on September 23rd, when the peripheral wind field of the typhoon began to have a significant impact on the study area, and the maximum significant wave height reached 1.6 m; then the wave height decreased rapidly. At 00:00 on September 24th, the second peak appeared, at this time, the center of the typhoon was closest to the study area, and the maximum significant wave height jumped to 2.7 m. The intensity of the second peak was significantly higher than that of the first peak. Regarding spatial distribution, the same types of characteristic points on the east and west beaches exhibited highly consistent temporal trends. However, the significant wave heights at the west beach points (P2, P4, P6) were generally higher than those at the corresponding east beach points (P1, P3, P5). Meanwhile, within the same beach area, the significant wave heights showed a significant decreasing trend extending from offshore to the shore, reflecting the wave attenuation effect of the nearshore topography.
Figure 5.
Location map of characteristic points.
Figure 6.
Variation curves of significant wave heights at characteristic points.
4.2. Eulerian Residual Current Field
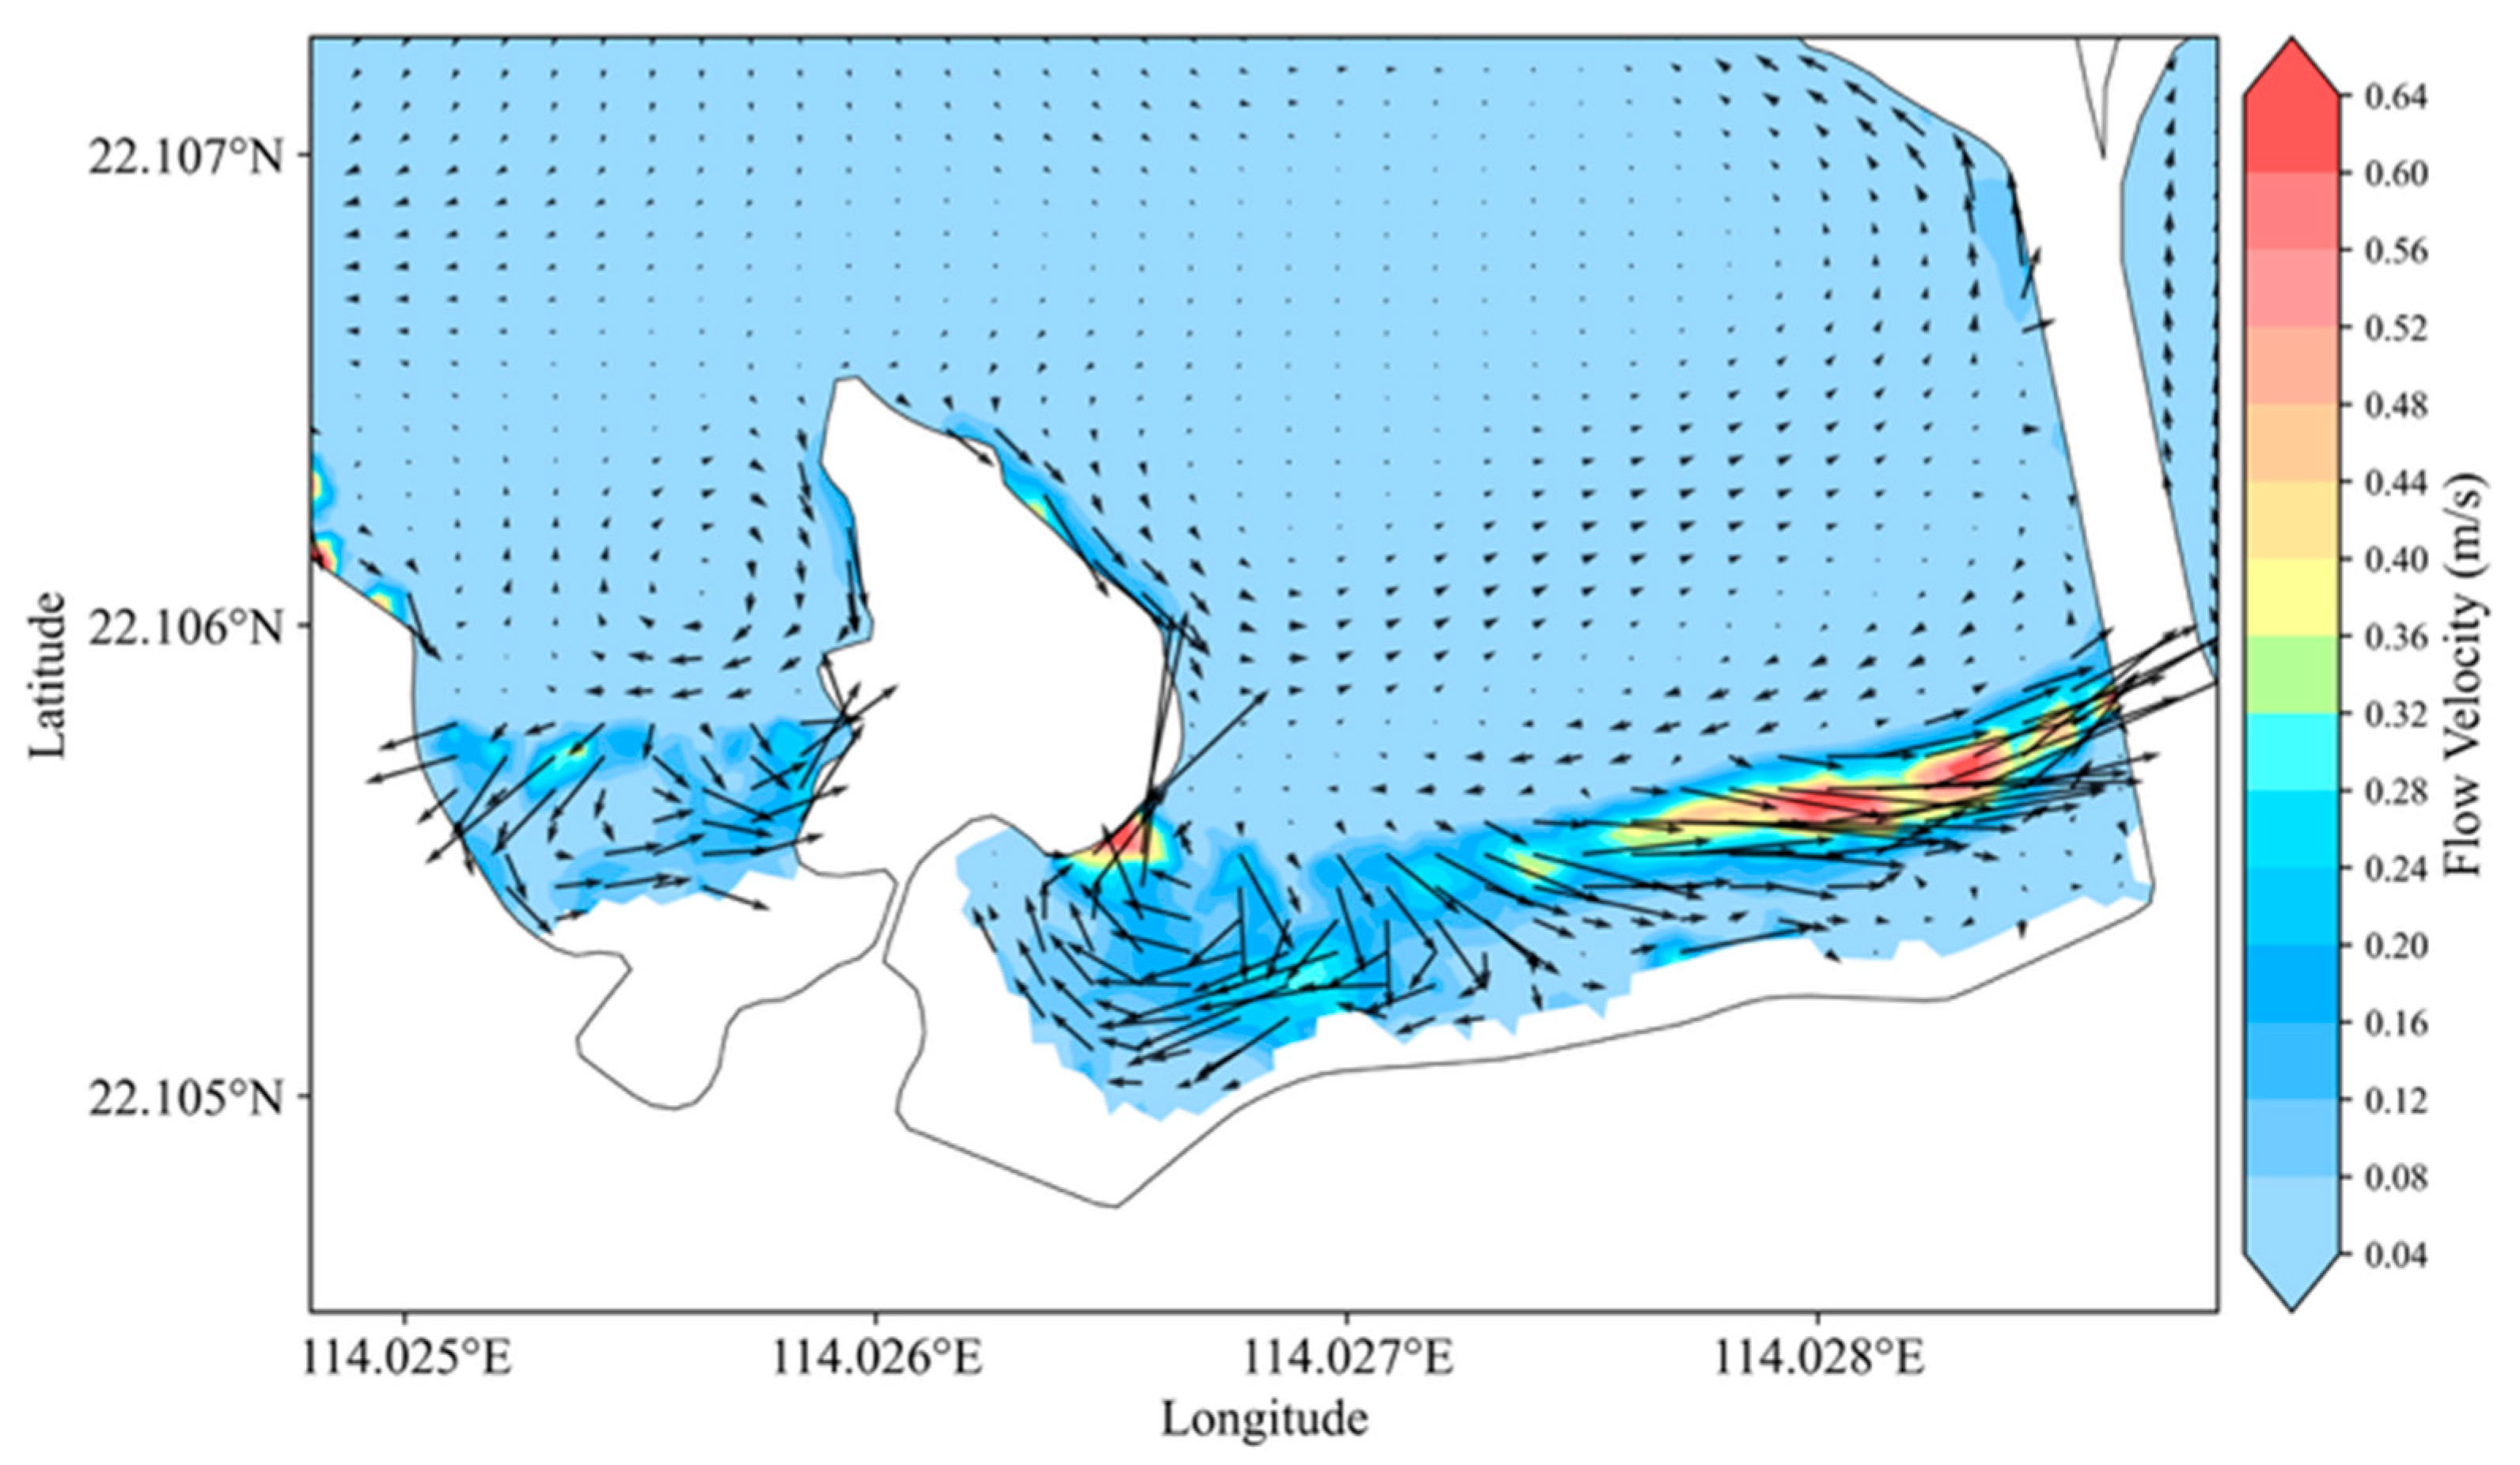
The Eulerian residual flow is defined as the time-averaged flow velocity obtained by integrating the instantaneous flow field over one or more complete tidal cycles. The residual current characteristics at Xiaoshizui Beach on Wailingding Island during a typhoon were analyzed, as shown in Figure 7. From the nearshore to the offshore direction, the residual current velocity generally exhibited a decreasing trend. In the offshore deep-water area, the velocity typically remained below 0.15 m/s, while the maximum residual current velocity occurred in the nearshore shallow-water area, reaching up to 0.64 m/s. A headland is present in the middle of the beach. Influenced by this headland, locally elevated residual current velocities were observed in its vicinity, with peak values reaching 0.30–0.36 m/s, significantly higher than those in adjacent offshore areas. The residual current magnitude on the eastern side of the beach was greater than that on the western side.
Figure 7.
Residual current field.
Along the nearshore beach berm, the alongshore residual current direction exhibited a generally coherent flow aligned with the shoreline. In the vicinity of the headland and along irregular coastlines, the residual current direction undergoes sharp spatial variations, with alternating onshore, offshore, and alongshore flow components. Consequently, the residual current field exhibits complex closed or semi-closed local circulations, forming multiple well-developed vortices. In the offshore area outside the surf zone, the residual current is dominated by an onshore component, resulting in a shoreward residual flow.
4.3. Characteristics of Beach Erosion and Accretion
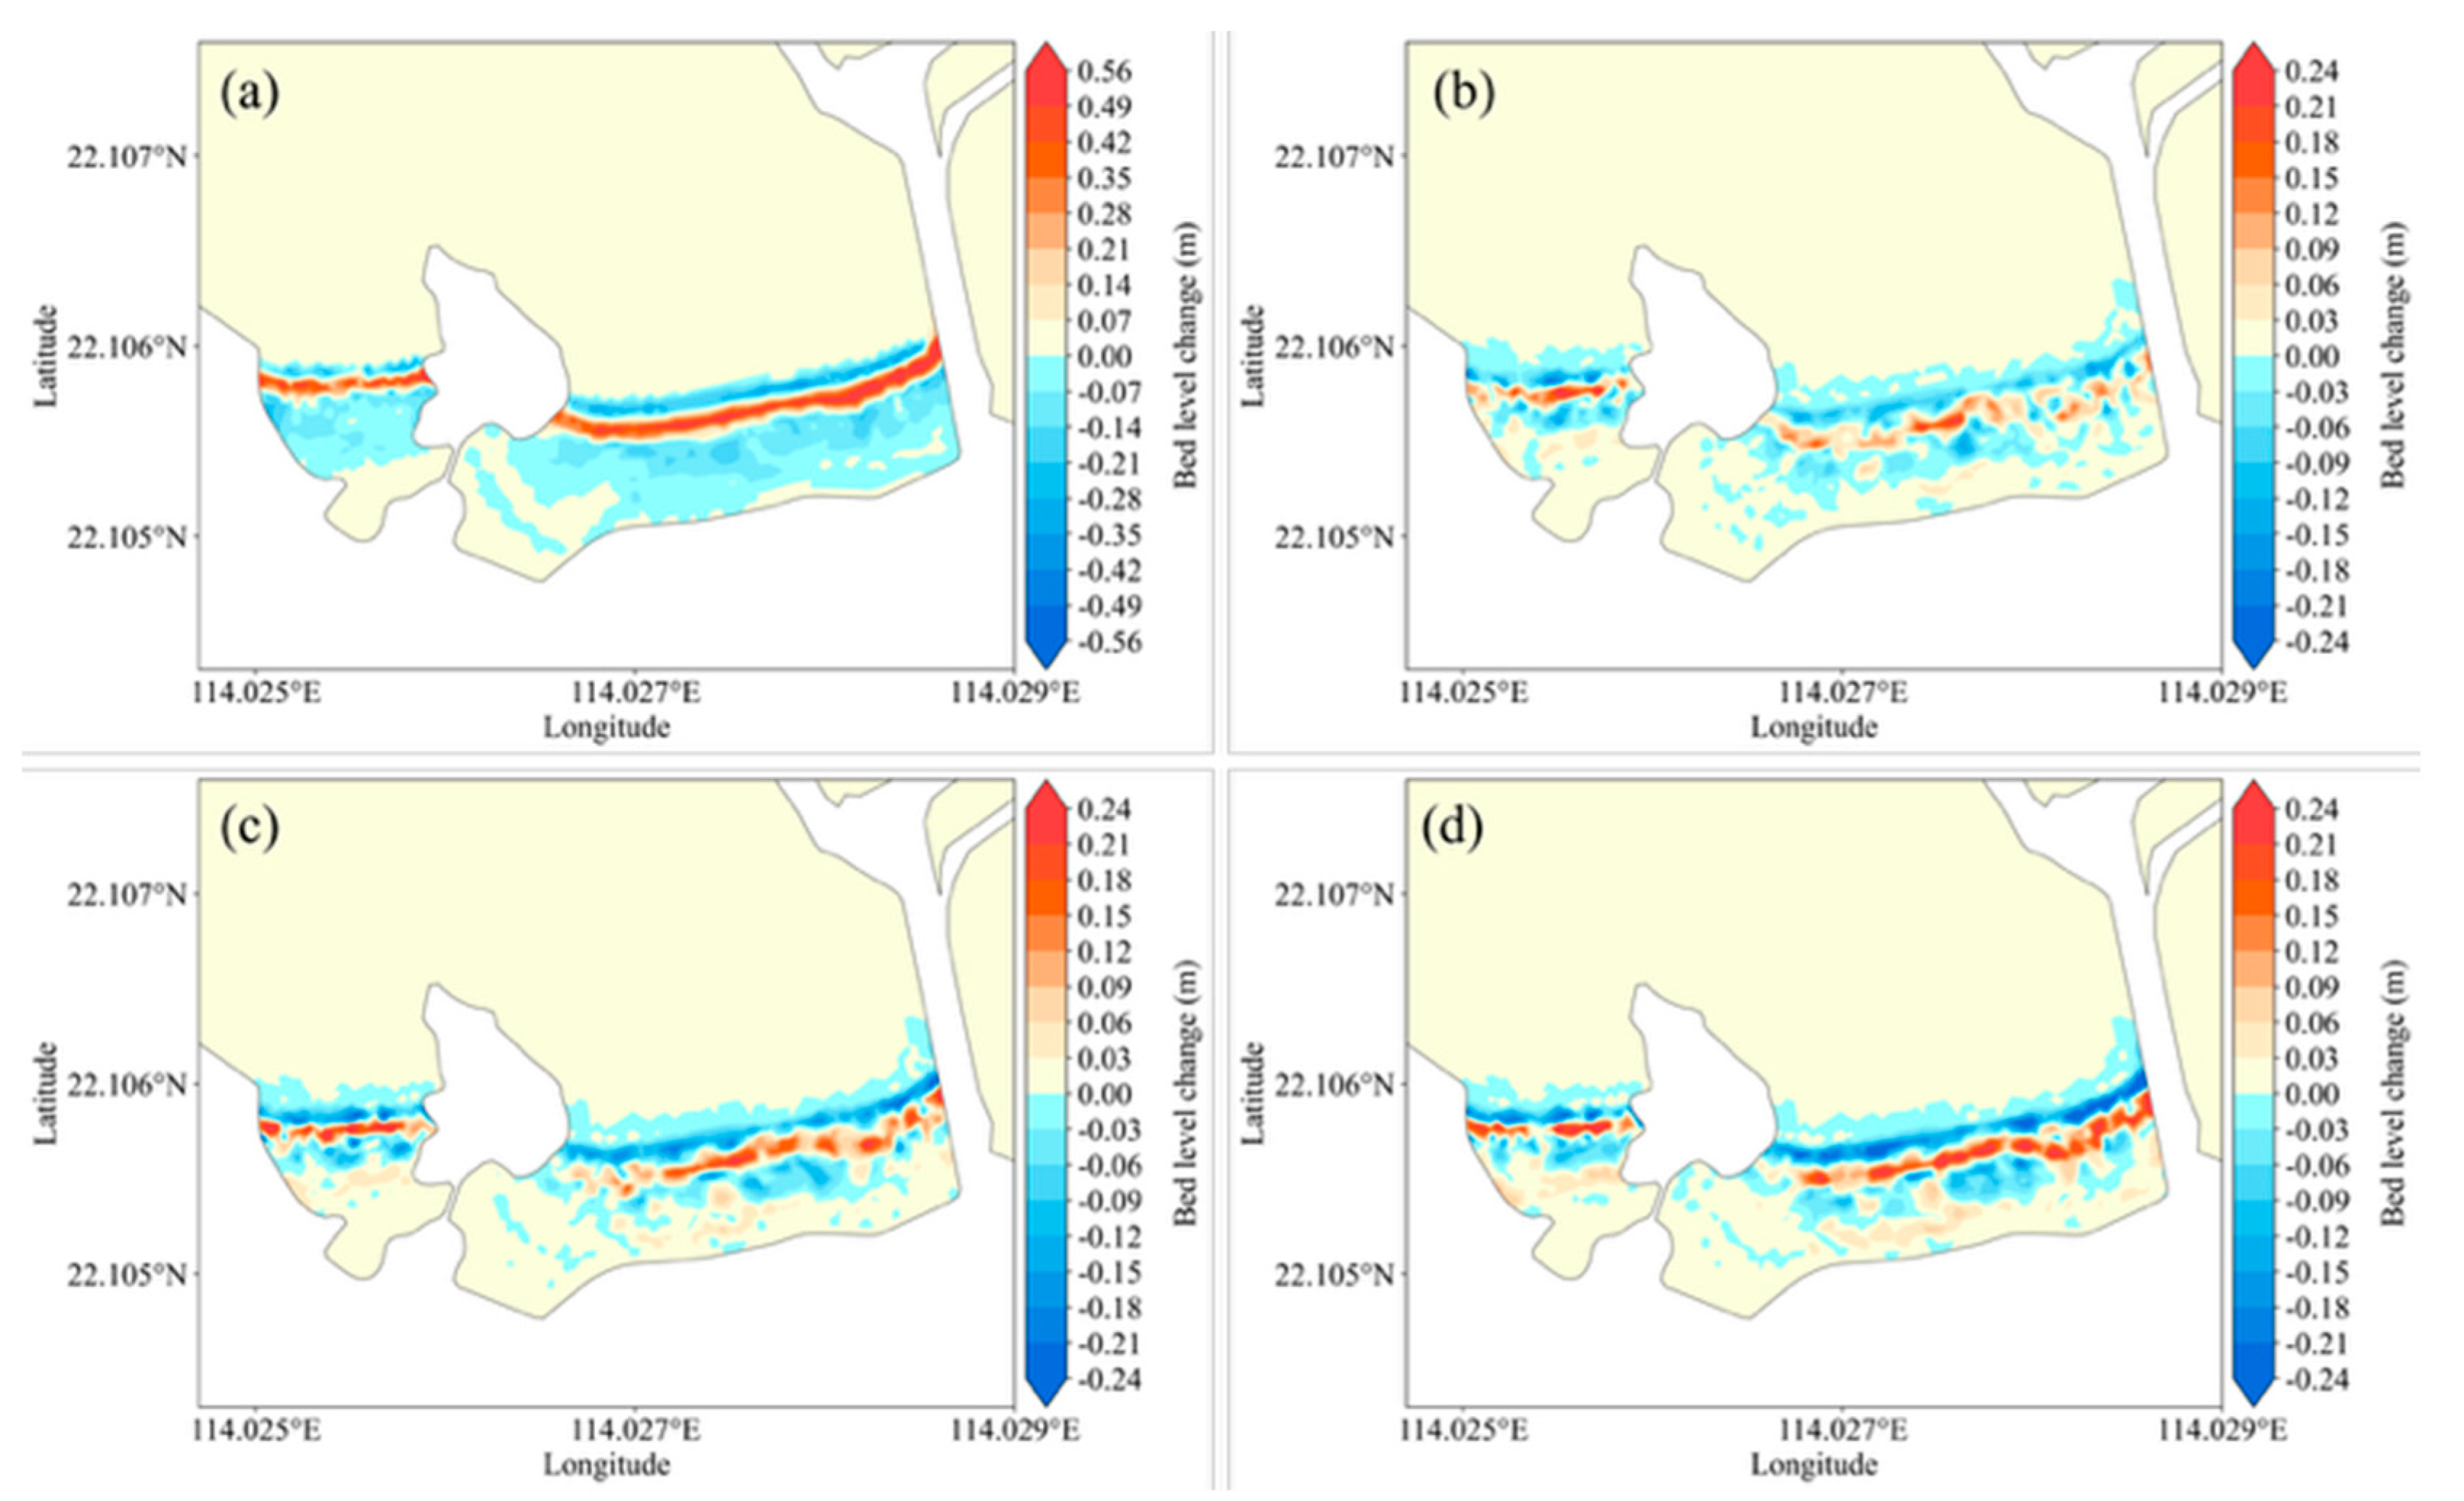
Figure 8 presents the numerical simulation results of bed erosion and accretion distribution in the study area after 72 h of typhoon forcing for median nourishment grain sizes of 0.4, 0.6, 0.8, and 1.0 mm. The results indicate that under different grain size conditions, the spatial distribution patterns of bed erosion and accretion exhibit high consistency, generally characterized by erosion of the backshore dune, accretion in the upper-middle foreshore, and erosion in the lower foreshore.
Figure 8.
Modeled erosion and deposition patterns for different median grain sizes after 72 h under Typhoon Ragasa. (a) D50 = 0.4 mm. (b) Change in patterns for D50 = 0.6 mm (relative to the 0.4 mm). (c) Change in patterns for D50 = 0.8 mm (relative to the 0.4 mm). (d) Change in patterns for D50 = 1.0 mm (relative to the 0.4 mm).
During the typhoon impact period, the elevated water level induced by the storm surge, superimposed with typhoon waves, directly impacted the berm region. This resulted in significant scour of the backshore dune and berm, forming distinct scarps with a maximum scour depth of approximately 0.2 m. Concurrently, strong bottom currents generated by wave breaking in the foreshore region suspended and transported sediment, forming an erosion zone with a maximum depth of about 0.3 m. It is noteworthy that the eroded sediments are transported to the nearshore shallow water area under the combined action of waves and currents; subsequently, sedimentation occurs in this area due to the reduction of flow kinetic energy. Consequently, a continuous accretion zone formed immediately adjacent to the shoreline and the berm front, with a maximum accretion thickness exceeding 0.56 m. This lateral distribution characteristic reveals that significant cross-shore sediment transport occurs in the study area under the dynamic action of typhoons. Although severe local scour occurs, a large amount of submerged sediment is also transported and deposited on the upper part of the beach, which to a certain extent raises the beach surface and steepens the profile slope.
A comparison of the simulation results for different grain sizes reveals that sediment grain size modulates local erosion and accretion intensity. The extent of erosion in the backshore dune and berm regions decreased with increasing grain size, indicating that coarser sediment possesses stronger erosion resistance stability in high-energy environments due to higher critical shear stress for incipient motion. However, in the lower foreshore region, the erosion intensity increased with increasing grain size. When D50 = 1.0 mm, the scour in this region was the most intense, with the scour depth approaching 0.40 m. Nevertheless, variations in grain size did not alter the overall spatial pattern of erosion and accretion in the study area.
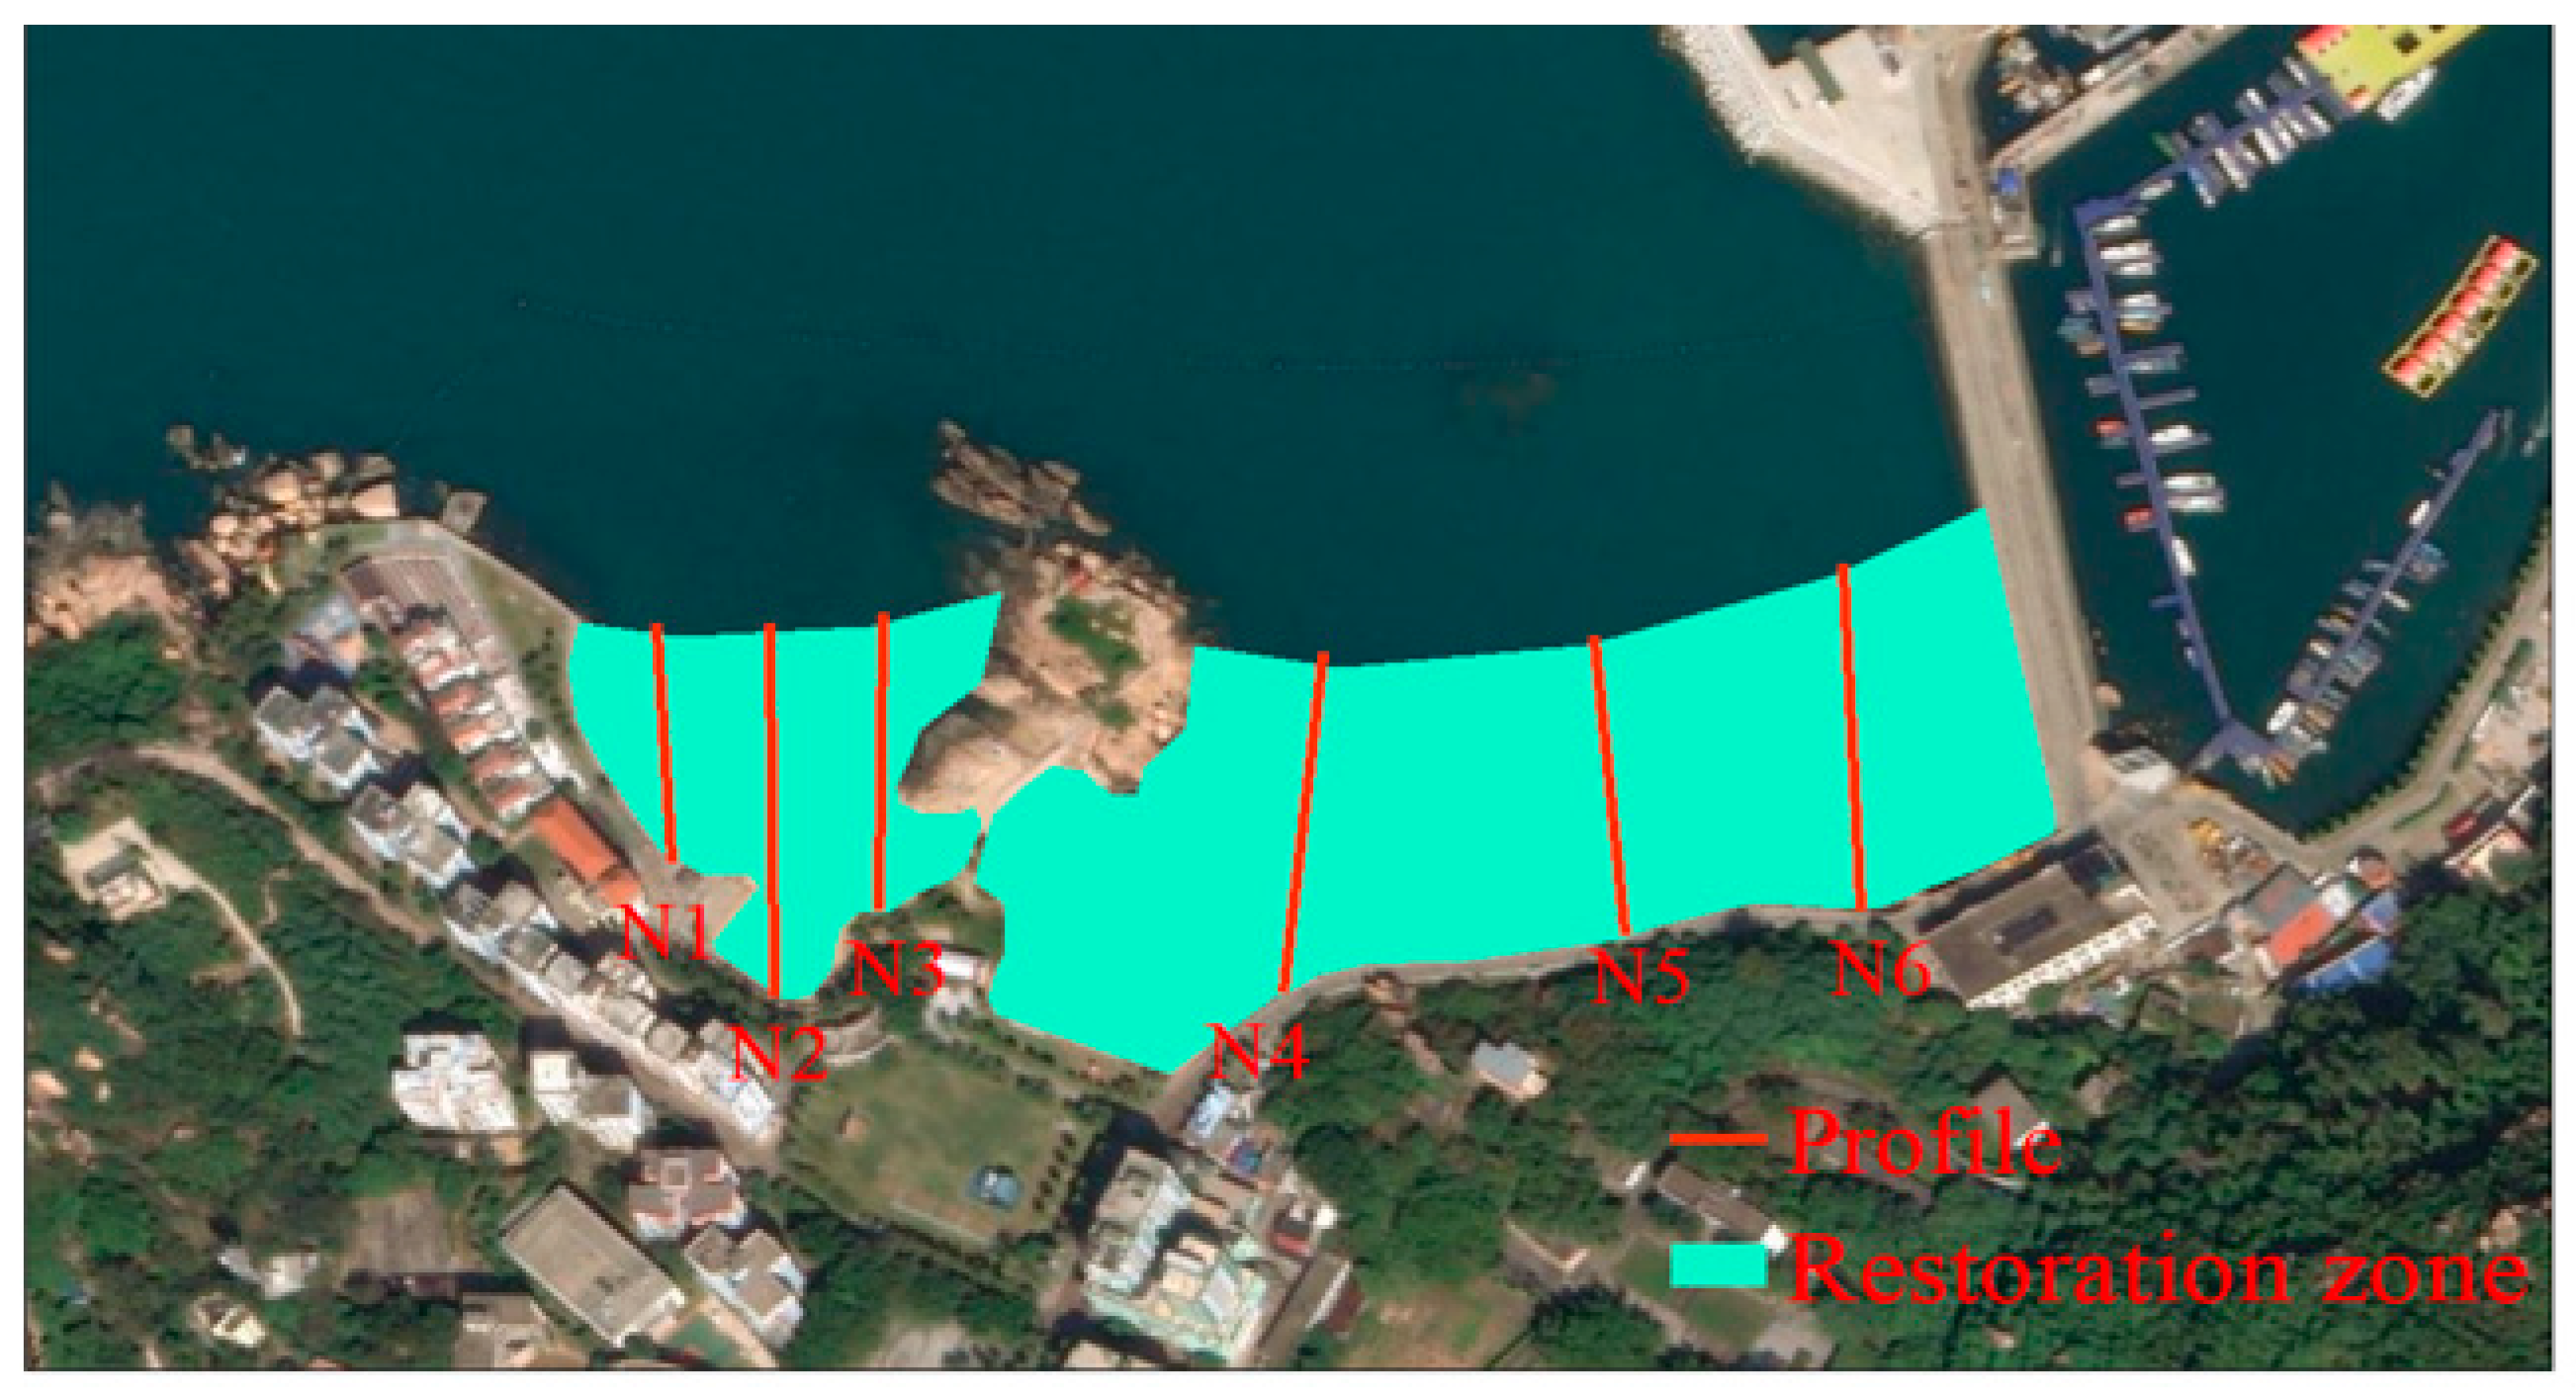
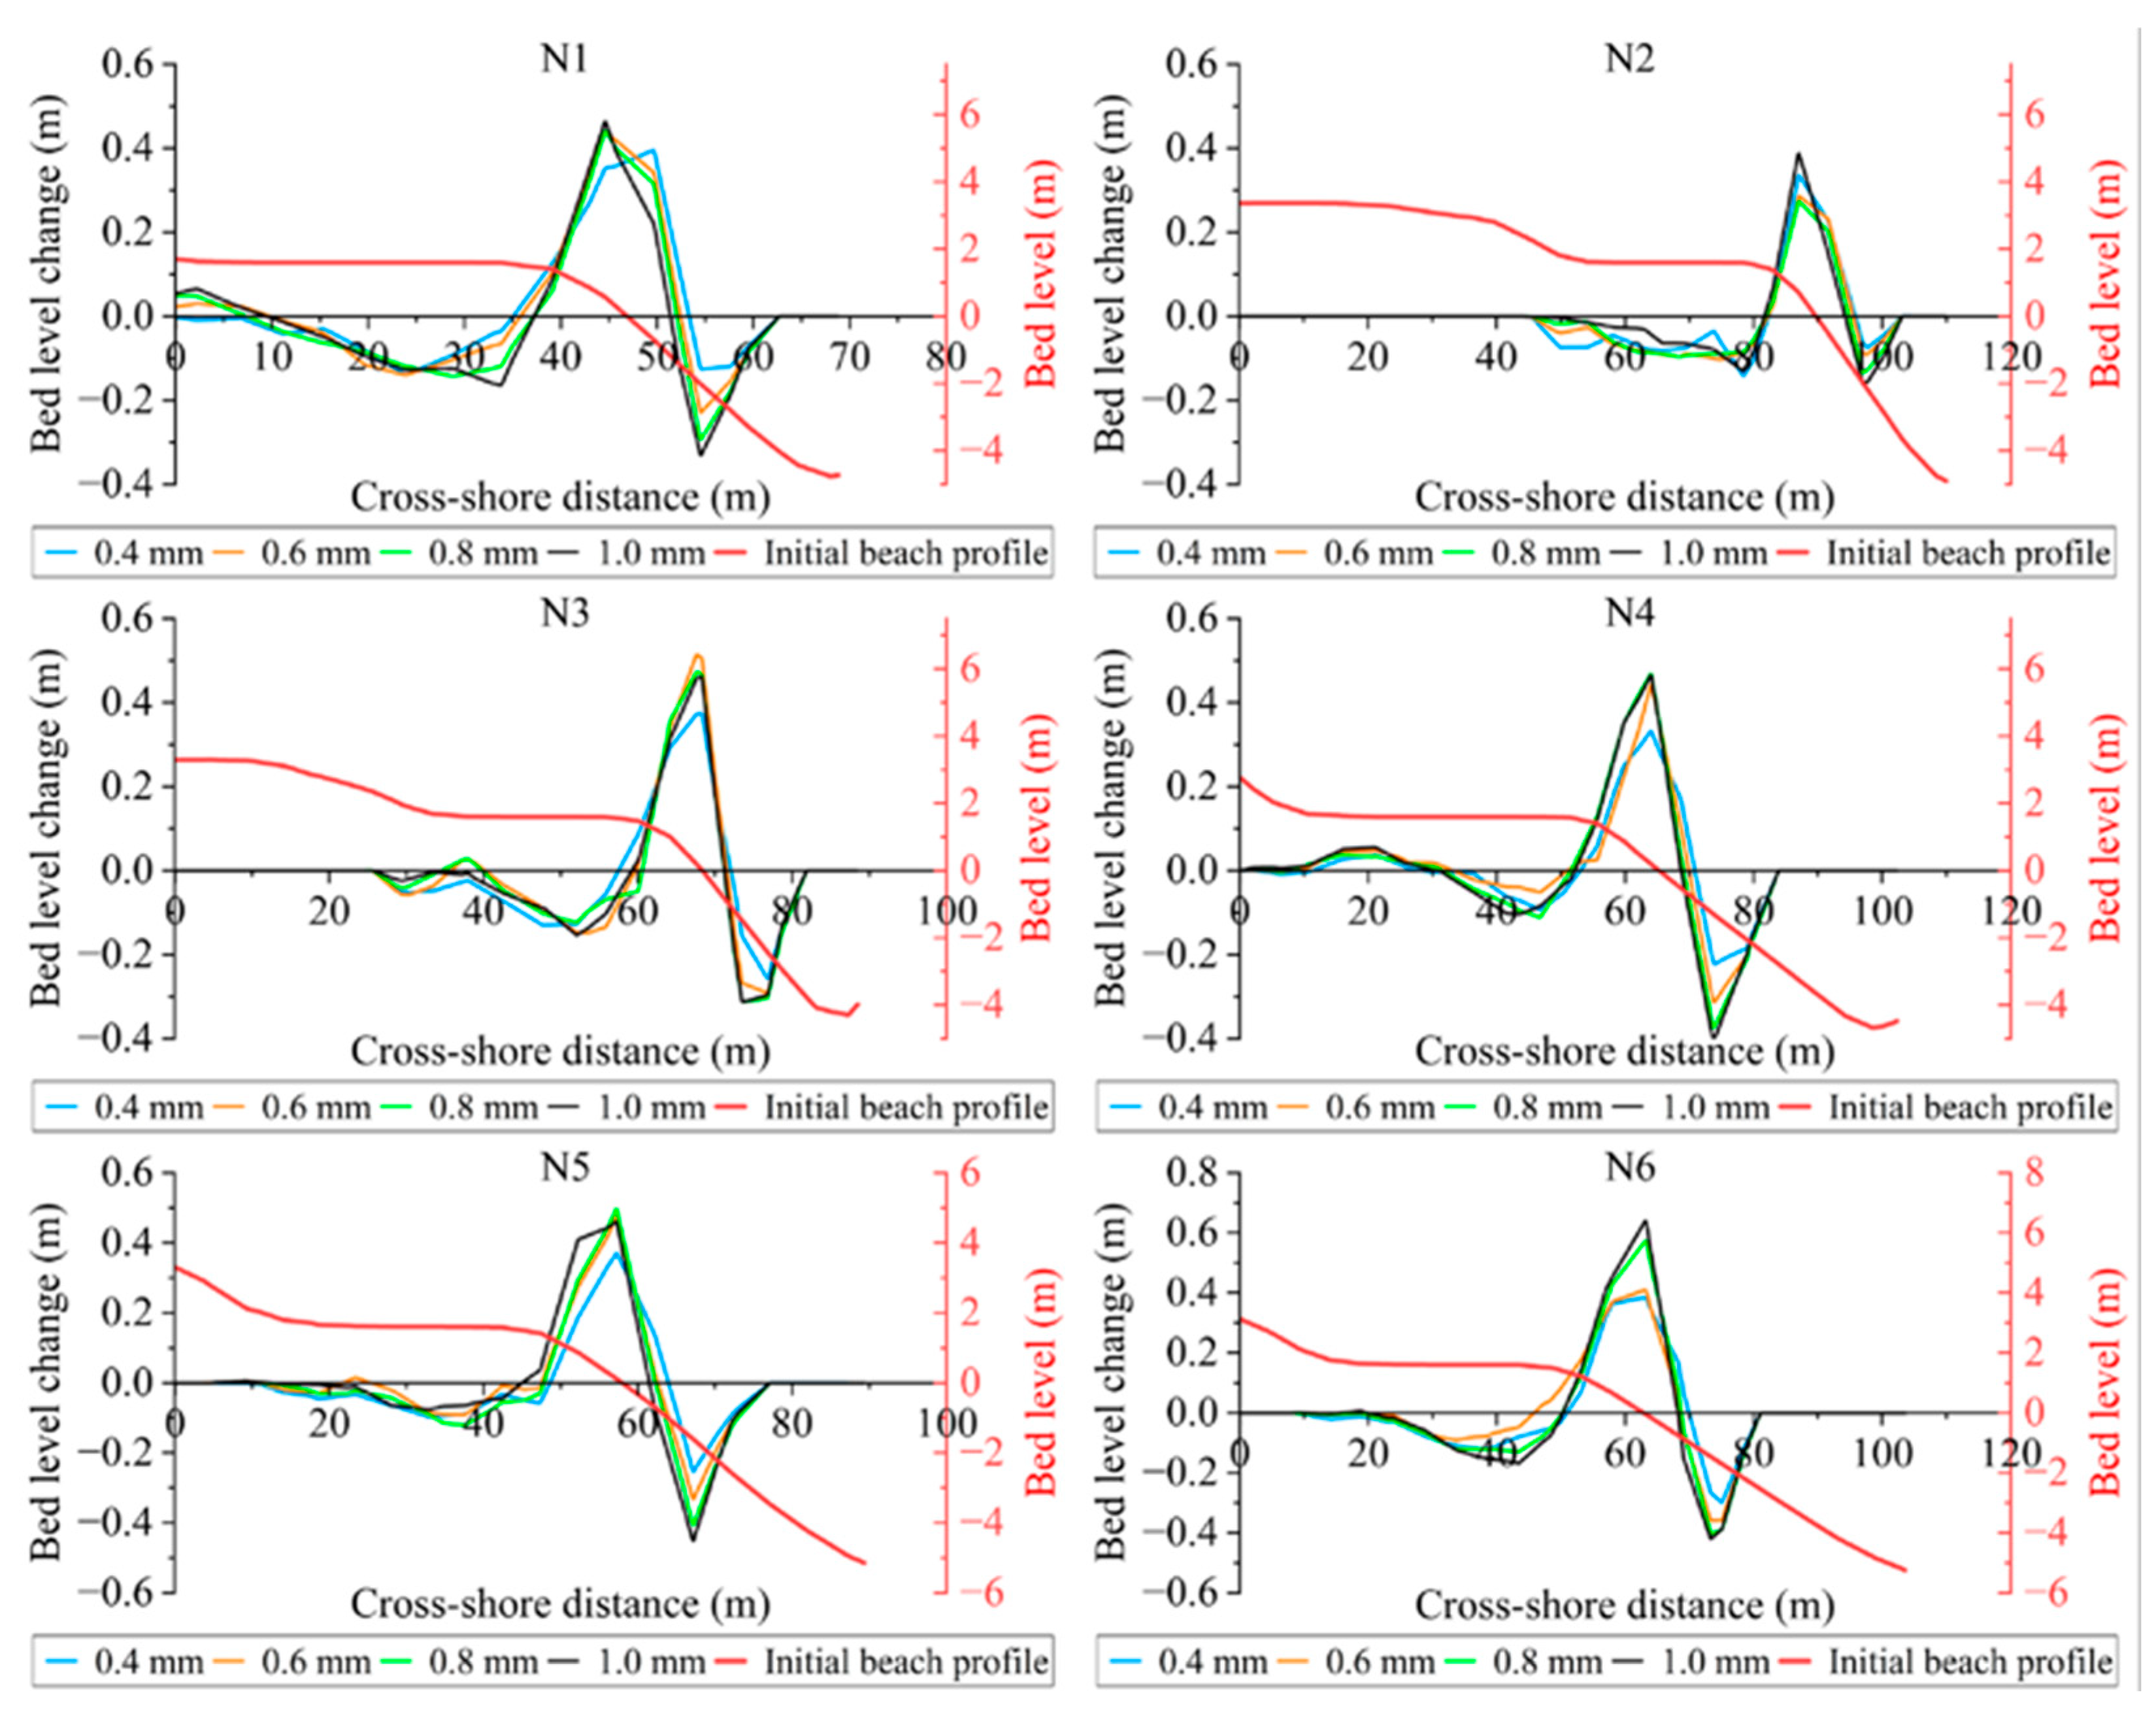
To deeply investigate the influence of nourishment grain size on beach morphological evolution in beach restoration projects, six typical profiles (N1~N6) within the restoration area were selected for quantitative analysis (profile locations shown in Figure 9). Figure 10 shows the changes in the erosion and deposition of different terrain profiles after 72 h of simulation under the influence of the typhoon. Due to differences in wave action intensity at different profile locations, the magnitudes of erosion and accretion varied among profiles; however, the overall morphological evolution patterns were fundamentally consistent. At the nearshore berm, influenced by storm surge setup and direct wave impact, all profiles experienced varying degrees of bed erosion. Among them, the berm scour at profile N2 on the west side was the most severe, with a maximum scour depth of 0.25 m. The lost sediment was deposited in the offshore zone, forming a distinct sandbar with a maximum accretion height of approximately 0.60 m. The formation of the sandbar induced wave breaking further offshore. This resulted in significant erosion features appearing again at the surf zone of the profiles, particularly at profile N6 on the east side, where scour in the deep-water zone was most severe, reaching a depth of 0.40 m.
Figure 9.
Location map of typical profiles.
Figure 10.
Profile variations after 72 h of typhoon under different grain sizes.
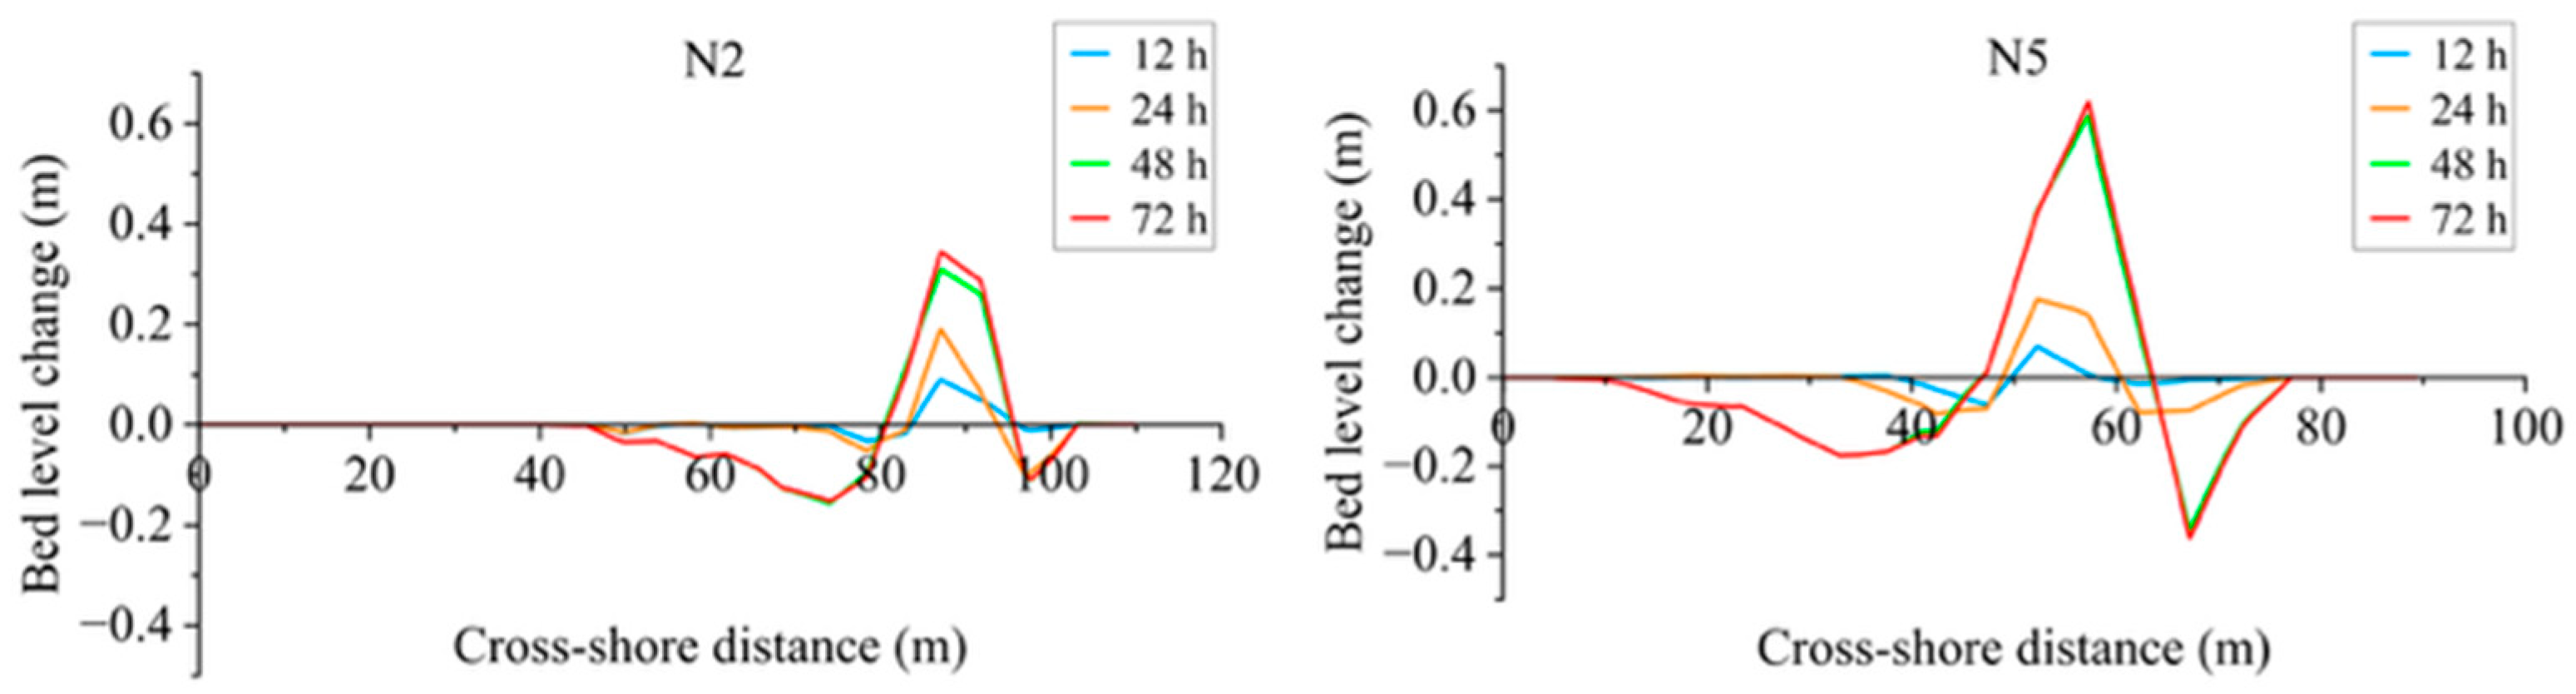
Figure 11 further shows the bed elevation changes along the nearshore profile at different times during the typhoon process (for the case with D50 = 0.6 mm). For the west side N2 profile, at 12 h of simulation, the overall profile topography changed little, with bed elevation fluctuations controlled within ±0.1 m; after 24 h, erosion began to appear on the nearshore berm, with weak accumulation in the offshore area and the bar prototype initially appeared; at 48 h, berm erosion further intensified, and the range and thickness of offshore accumulation continued to increase; by 72 h, the maximum erosion depth reached 0.25 m, and eroded sediments accumulate din the offshore area forming an obvious bar. In comparison, the east side N5 profile responded more rapidly with larger variation amplitude. Approximately 48 h later, the typhoon had completely departed from the study area. Subsequently, storm waves gradually weakened and returned to normal background wave conditions. During the 48–72 h period, hydrodynamic forcing diminished significantly, and the hydrodynamic conditions were insufficient to drive noticeable erosion or deposition. Consequently, the beach profile remained relatively stable during this stage, with virtually no significant morphological changes. Bar accumulation tends to stabilize, with a maximum accumulation height of approximately 0.60 m, and the offshore erosion morphology was also basically stable.
Figure 11.
Changes in bed elevation along the nearshore profile at different times during a typhoon (D50 = 0.6 mm).
Further analysis revealed significant spatial differences in the erosion and accretion magnitudes of the profiles in the restoration area. Overall, the magnitude of topographic changes on the east beach (N4, N5, N6) was greater than that on the west beach (N1, N2, N3). Taking D50 = 0.6 mm as an example, the maximum scour depth at the offshore location of Profile N5 on the eastern side was 0.33 m; in contrast, the maximum scour depth at the offshore location of Profile N2 on the western side was only 0.15 m, indicating that the eastern region is more sensitive to typhoon response. In addition, the nourished sediment grain size plays a key regulatory role in the erosion and accretion stability of the beach. The results (see Figure 8) indicate that in the offshore surf zone, the erosion depth is positively correlated with the grain size of nourishment sediment; that is, the larger the grain size, the more severe the bed erosion. Taking the eastern profile N4 as an example, when using D50 = 0.4 mm, the maximum scour depth in the surf zone was 0.18 m; however, when the grain size increased to 1.0 mm, this value increased drastically to 0.40 m.
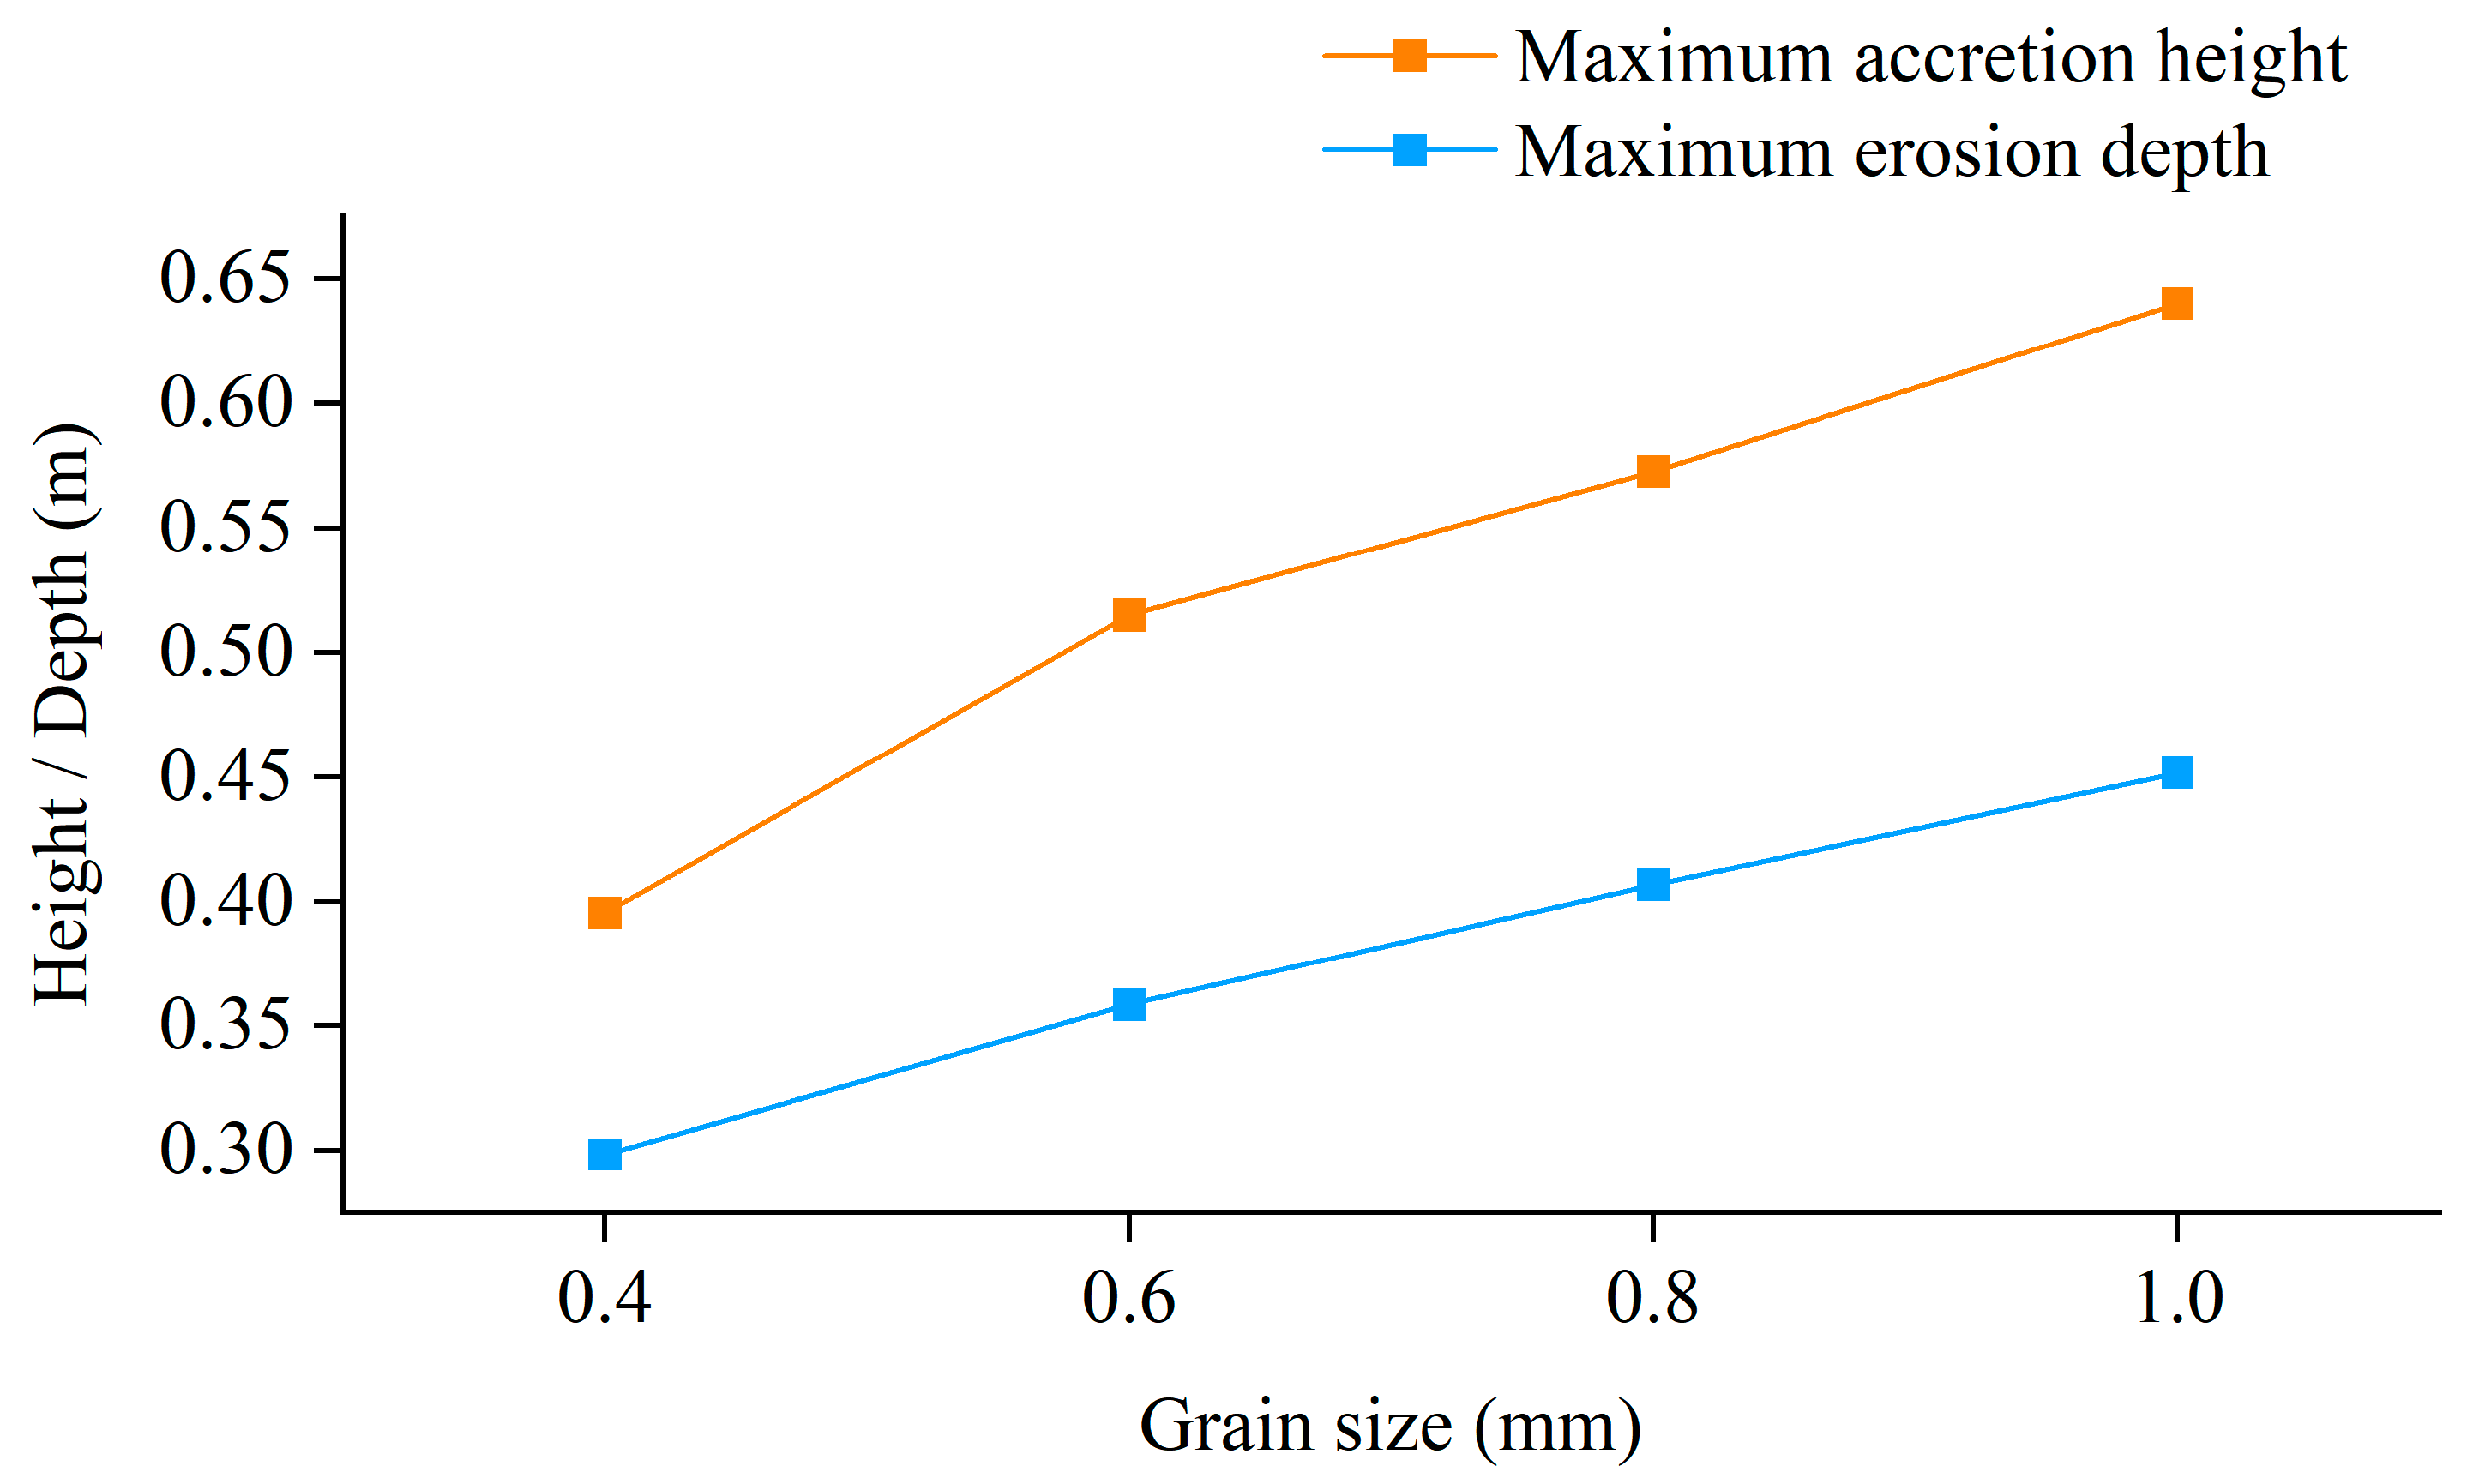
Furthermore, the particle size of the beach nourishment sediment plays a crucial role in regulating the erosion and accretion stability of the beach. To quantitatively determine the dependence of the morphological deformation amplitude on the nourishment grain size, Figure 12 plots the relationship between the maximum erosion depth and the maximum accumulation height and the median particle size (D50 = 0.4, 0.6, 0.8, and 1.0 mm). The results show that these two variables have a significant positive correlation with the nourishment grain size. As the D50 increased from 0.4 mm to 1.0 mm, the maximum erosion depth increased from approximately 0.30 m to 0.45 m, and the maximum accumulation height increased from approximately 0.40 m to 0.64 m. This indicates that larger nourishment grain sizes amplify the seabed erosion and sandbar accumulation in the nearshore wave zone, leading to more intense cross-shore morphological deformation under typhoon conditions.
Figure 12.
The maximum sedimentation and erosion scale under different particle sizes.
4.4. Sediment Transport and Sediment Budget
4.4.1. Sediment Transport
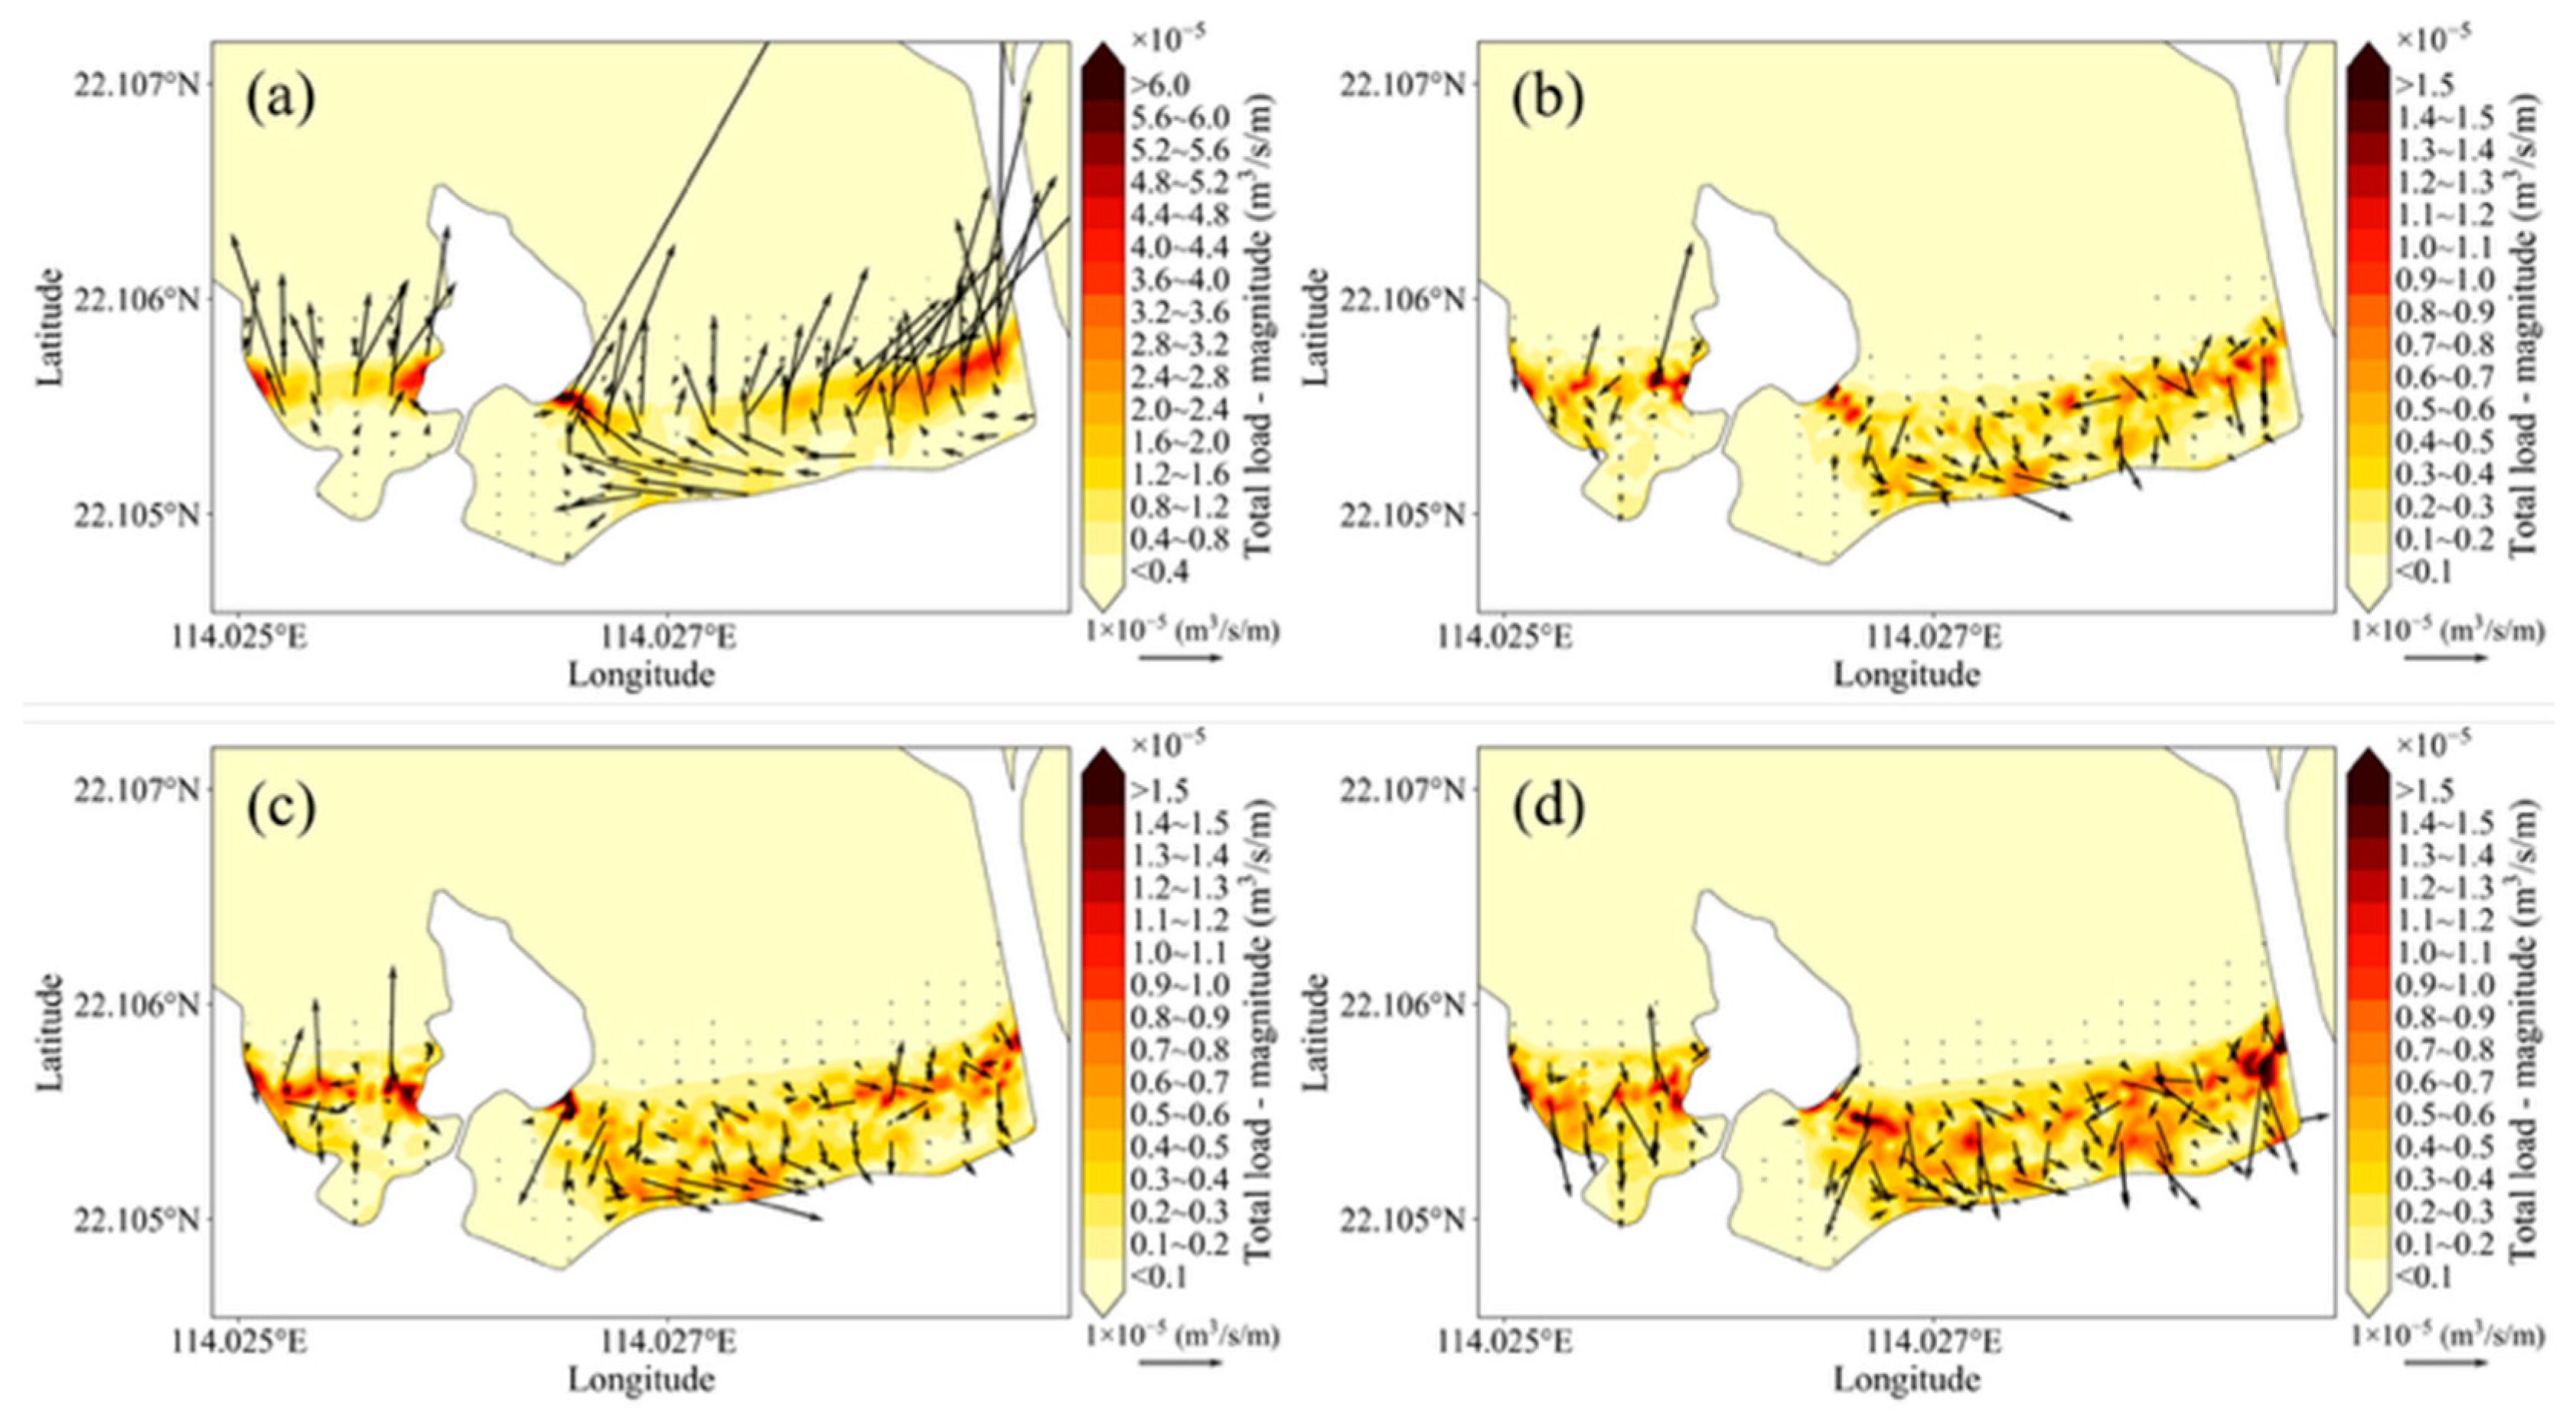
Under the influence of the typhoon, the average total load within the study area exhibited distinct spatial heterogeneity. Figure 13 illustrates the magnitude and direction of the time-averaged total load magnitude for each grain size scenario (D50 = 0.4, 0.6, 0.8, and 1.0 mm) over the 72-h simulation period. The results indicate that cross-shore sediment transport dominates across the entire study area. Regions with high sediment transport are mainly concentrated near the coastline and shoal areas. The local peak total load magnitude exceeded 6 m3/s/m, while sediment transport on the offshore side was remarkably lower, below 0.4 m3/s/m. In terms of transport direction, sediment movement in the backshore was predominantly offshore-directed, whereas the lower foreshore is characterized by onshore-directed transport. As the median grain size increases, the overall onshore total load magnitude rises gradually.
Figure 13.
Modeled average total load magnitude for different median grain sizes under Typhoon Ragasa. (a) D50 = 0.4 mm. (b) Change in transport patterns for D50 = 0.6 mm (relative to the 0.4 mm). (c) Change in transport patterns for D50 = 0.8 mm (relative to the 0.4 mm). (d) Change in transport patterns for D50 = 1.0 mm (relative to the 0.4 mm).The arrows indicate the direction and magnitude of the total load magnitude.
4.4.2. Sediment Budget
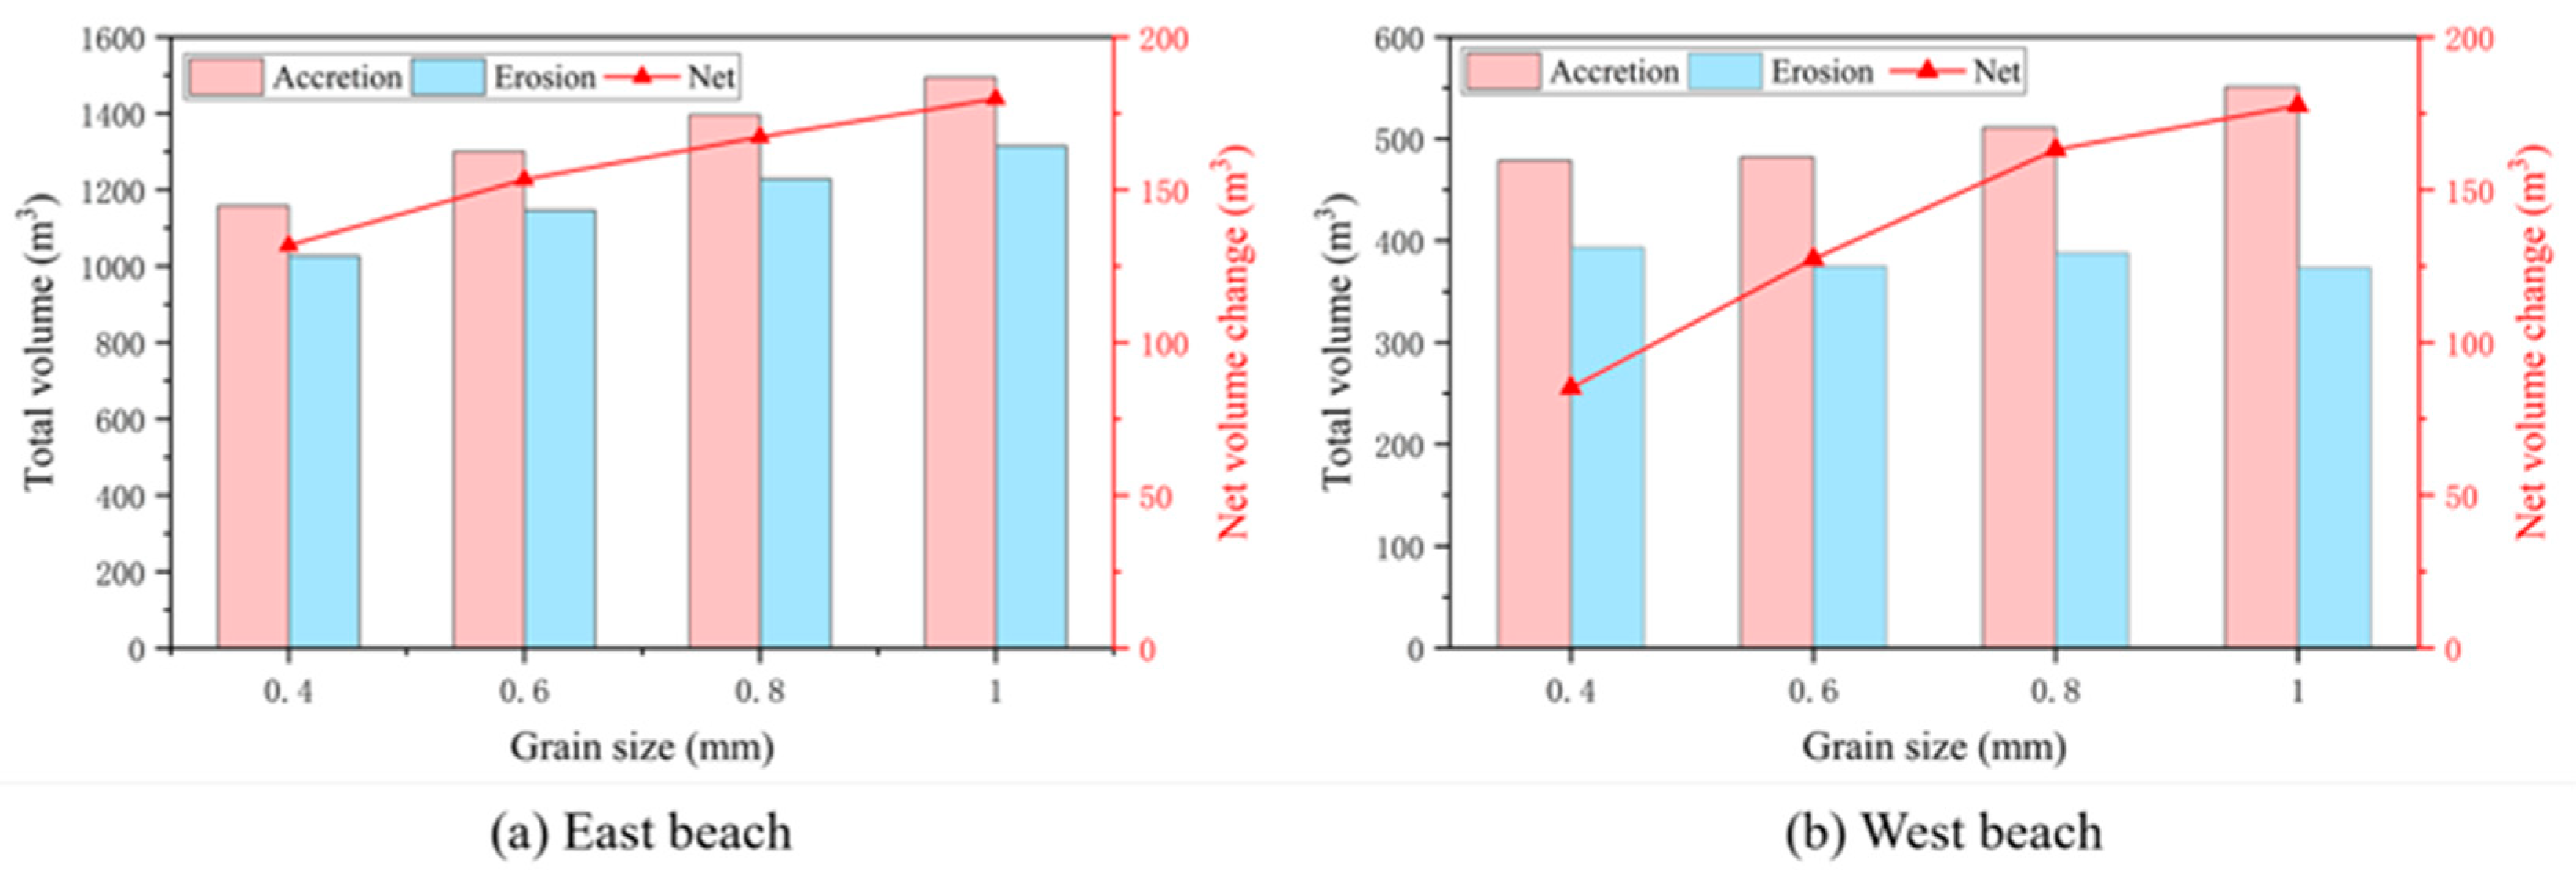
The sediment balance is a core indicator for quantitatively assessing the stability of beaches and the intensity of sediment transport under the influence of typhoons, and it can reflect the overall impact of the size of the replenished sediment particles on the balance between beach erosion and accretion. Based on the 72-h numerical simulation results of typhoons, this study calculated the total erosion and accretion volumes of the east and west beaches (spatial extent defined by the beach restoration boundaries shown in Figure 9) under different median particle sizes of replenished sediment, and analyzed the sediment balance characteristics of the study area during the influence of Typhoon Ragasa (Figure 14). Overall, the erosion and accretion volumes of the east and west beaches both showed an upward trend with the increase in the median particle size of the replenished sediment, but there were significant spatial differences in the scale of sediment transport between the east and west beaches. The erosion and accretion intensity of the east beach was much higher than that of the west beach, with the accretion volume being approximately 2.4 to 2.5 times that of the west beach, and the erosion volume being approximately 2.7 to 2.9 times that of the west beach.
Figure 14.
The volume of beach erosion and accretion under different sand grain sizes.
For the east beach, when the median particle size of the replenished sediment increased from 0.4 mm to 1.0 mm, the accretion volume increased from 1156 m3 to 1438 m3, an increase of 24.4%; the erosion volume increased from 1023 m3 to 1312 m3, an increase of 28.3%. The east beach always showed a net accretion state under all particle size conditions, with the net accretion volume gradually increasing with median grain size. The sediment transport intensity of the west beach was overall lower than that of the east beach, and the influence of particle size was smaller. When D50 increased from 0.4 mm to 1.0 mm, the accretion volume of the west beach increased from 478 m3 to 572 m3, an increase of 19.7%; the erosion volume fluctuated mildly between 373 m3 and 393 m3 with no substantial variation. The west beach also showed a net accretion feature, with the net accretion volume changing in a similar trend to that of the east beach. Under extreme hydrodynamic conditions, the naturally occurring seabed sand outside the restoration area is transported shoreward under the action of strong waves and tidal currents, eventually depositing within the restoration area. As a result, the restoration area as a whole remains in a net accretion state.
5. Discussion
This study focused on the morphodynamic response of the Xiaoshizui Beach on Wailingding Island under the impact of the intense Typhoon Ragasa, with particular emphasis on the influence mechanism of different median sediment grain sizes on beach profile stability. The MIKE 21 HD–SW–ST coupled model was employed to successfully simulate the beach evolution process driven by storm surge and extreme waves during the typhoon. The model demonstrates significant advantages in simulating typhoon-driven beach dynamics, as it can accurately capture the real-time coupling processes among storm surge, wave propagation, sediment transport, and morphological evolution. Compared with the static equilibrium profile approach adopted by López et al. (2018) [38], the present process-based morphodynamic model explicitly simulates time-varying hydrodynamic forcing and sediment transport under transient typhoon conditions, enabling the capture of the full dynamic morphological evolution. Consequently, the present model better reflects the dynamic response of headland-bay beaches under extreme events. Compared with the combination of Delft3D and a one-dimensional shoreline model used by Tonnon et al. (2018) [39], the present model solves fully coupled two-dimensional hydrodynamic–morphodynamic equations at high spatiotemporal resolution, providing a more detailed description of wave–current–sediment interactions during storms. Furthermore, the unstructured mesh offers greater flexibility and accuracy in reproducing the complex and irregular coastline geometry typical of headland-bay beaches—characteristics that structured grids or hybrid one-dimensional approaches generally cannot resolve effectively. However, compared with XBeach, the present model is relatively weaker in simulating subharmonic waves as well as dune collapse and overtopping processes. These limitations may affect the absolute accuracy of the erosion volume estimates, but have minimal impact on the relative comparison results across different grain size scenarios, which was the core focus of this study.
During a typhoon, the spatial and temporal distribution of wave and flow fields serves as the dynamic basis for determining the pattern of beach erosion and accretion responses. This study found that wave heights are higher on the west beach than on the east beach, while the residual current is stronger on the east side. These phenomena are primarily controlled by the local topography of the study area. The west beach experiences less wave energy attenuation due to weaker sheltering by the headland, whereas the east beach lies in the sheltered zone of the headland, resulting in significant energy dissipation. In terms of the flow field, the disturbance of the current by the headland, along with differences in shoreline configuration and water depth between the east and west sides, collectively leads to a pattern of stronger residual currents on the east side and weaker ones on the west. This dynamic contrast is the fundamental cause of the differing geomorphic responses between the east and west beaches, which is consistent with the findings of Shi et al. (2023) [40] on the dynamic response differences at various locations within a headland-bay system. The simulation results show that under the action of typhoon, the beach presents a typical erosion–accretion pattern of backshore erosion, middle-upper foreshore deposition, and lower foreshore erosion, which indicates that the sediment transport is mainly cross-shore transport. The sediments are eroded from the rear beach and the lower front beach and then deposited in the middle-front beach area. The backshore erosion-foreshore deposition pattern observed in this study is highly consistent with the numerical simulation results of beach morphological response during Typhoon Lekima by Xing et al. (2023) [9]. This agreement confirms the dominant role of cross-shore sediment transport under strong storm surges.
In terms of open-sea forcing, the trajectory and intensity of the typhoon center determine the magnitude and temporal variation characteristics of the significant wave height in the open sea; in terms of nearshore transformation, headland sheltering, water depth reduction and seabed slope together determine the refraction, attenuation, and breaking position of waves in the bay. The erosion and deposition patterns in Figure 8 show pronounced backshore scour, which is attributed to wave overtopping and storm surge. This process is primarily controlled by nearshore wave transformation while surf zone scouring is directly related to the concentrated breaking of open-sea wave energy in shallow water areas. Under different particle size scenarios, the particle size has no impact on open-sea forcing and only affects the nearshore transformation process by changing the nearshore slope.
The erosion range of backshore dunes and berm areas decreased with the increase in particle size, indicating that coarse-grained sediment has stronger anti-scour stability and can effectively mitigate beach erosion, which also verifies the theory proposed by Van Rijn (1993) [24] that larger particles require higher energy to be entrained. Lei et al. [41] also found in the study on the evolution of beaches nourished with sediments of different particle sizes that the use of coarse-grained sediments for beach nourishment and restoration can reduce beach erosion. However, this study found that the larger the sediment particle size supplemented in the surf zone, the greater the erosion depth. This difference is mainly due to the steeper beach profile formed by coarse-grained sediment, which causes the breaking point of incident waves to move onshore and the breaking process to be more concentrated and intense, thus significantly enhancing the bed shear stress in the surf zone and intensifying bed scour. Figure 15 illustrates the spatial distribution of bed shear stress under typhoon conditions for the D50 = 0.6 mm, 0.8 mm, and 1.0 mm cases, relative to the reference condition with D50 = 0.4 mm. The results show that as the sediment grain size increased, bed shear stress in the foreshore and breaker zones exhibited a progressively increasing trend.
Figure 15.
Spatial distribution of changes in bed shear stress during typhoon for different median grain sizes (relative to D50 = 0.4 mm). (a) D50 = 0.6 mm; (b) D50 = 0.8 mm; (c) D50 = 1.0 mm.
Although this study deeply analyzed the evolution process of beaches with different particle sizes under typhoon action, there are still some limitations. This paper only considered a single strong typhoon, where the results may vary depending on the specific track, intensity, and timing of the storm event, and did not consider the cumulative erosion effect caused by storm clusters, which may be more significant in the actual natural environment [11]. In addition, beach evolution is the result of the combined action of multiple factors such as beach particle size, width, length, and slope. This study only focused on the single variable of particle size and did not fully consider the influence of other factors. Future research plans to further explore the evolution mechanism of beaches and hydrodynamics under the combined action of multiple factors.
6. Conclusions
In this study, a coupled wave–current–sediment mathematical model was established based on the MIKE 21 platform. The hydrodynamic and topographic evolution processes under the action of a typical intense typhoon were simulated, and the influence mechanisms of different nourished sediment grain sizes on the morphological response of beach profiles were thoroughly investigated. The main conclusions are as follows:
- Under typhoon conditions, the beach exhibited a consistent erosion–accumulation pattern across all particle size scenarios, characterized by erosion of the backshore dune and berm, accretion in the upper-middle foreshore, and erosion of the lower foreshore. Particle size did not alter this spatial pattern, but significantly influenced the magnitude of morphological changes. As the median particle size increased, the erosion of the backshore decreased, while the erosion of the lower foreshore and breaker zone increased. Correspondingly, both the maximum erosion depth and the accumulation thickness showed an increasing trend with the increase in particle size.
- During the typhoon period, sediment transport was predominantly cross-shore, with some longshore transport also occurring in the backshore region. Under different grain size scenarios, the study area as a whole presented a net deposition state. With the increase in grain size, the net deposition volume of the beach increased.
Sediment grain size plays a crucial role in determining the morphodynamic response of Xiaoshizui Beach on Wailingding Island under typhoon forcing. Differences in grain size result in varying threshold velocities, porosities, and settling velocities, which directly influence sediment transport and the overall morphological stability of the beach profile. As the replenishment grain size increased from 0.4 mm to 1.0 mm, the erosion depth of the backshore dune and berm decreased progressively, indicating that coarser sediment possesses greater resistance to erosion. However, at the same time, the maximum scour depth in the breaker zone increased from approximately 0.30 m to 0.45 m, and the maximum bar accretion thickness increased from approximately 0.40 m to 0.64 m, indicating that coarser replenishment grain sizes actually lead to more intense local topographic changes in the breaker zone. From the perspective of recreational experience, approximately 0.5 mm is the most comfortable grain size for the human body; the 0.6 mm grain size offers a moderate texture and significantly greater barefoot comfort than the coarser 0.8 mm and 1.0 mm options. Although the simulation results showed that the 1.0 mm grain size yields the largest net accretion volume, the excessive local topographic fluctuations it induces under extreme events and its noticeably coarser texture are unfavorable for beach recreational use. Taking both beach engineering stability and human comfort into consideration, a replenishment grain size of D50 = 0.6 mm is recommended. This grain size can effectively suppress erosion of the backshore and berm under typhoon conditions, maintain overall profile morphological stability, keep local scour and accretion amplitudes in the breaker zone within a reasonable range, and provide a good barefoot experience, thereby balancing engineering protection requirements under extreme events with the quality of daily recreational use.
Author Contributions
Conceptualization, Y.S. and H.S.; methodology, Y.S. and Z.Y.; software, L.P. and Y.S.; validation, L.P. and S.W.; formal analysis, L.P.; investigation, S.W. and X.W.; resources, H.S.; data curation, Y.S.; writing—original draft preparation, L.P. and Y.S.; writing—review and editing, L.P., Z.Y. and X.W.; visualization, S.W.; supervision, H.S. and Z.Y.; project administration, H.S. and X.W.; funding acquisition, H.S. All authors have read and agreed to the published version of the manuscript.
Funding
The author(s) declare that financial support was received for the research, authorship, and/or publication of this article. This research was supported by the Shandong Provincial Lab and Talent Program (Double Hundred Plan for Oversees Experts Talent Category, Grant No. WSR2024073), the Guangxi Natural Science Foundation under Grant No. 2026GXNSFBA00640130, the Taishan Industrial Experts Program (tscy20251040), and the State Key Program of the National Natural Science of China (42330406, 42476163).
Data Availability Statement
The original contributions presented in this study are included in the article/supplementary material. Further inquiries can be directed to the corresponding author(s).
Conflicts of Interest
We declare that there are no conflicts of interest.
References
- Harris, L.R.; Defeo, O. Sandy shore ecosystem services, ecological infrastructure, and bundles: New insights and perspectives. Ecosyst. Serv. 2022, 57, 101477. [Google Scholar] [CrossRef]
- Mehvar, S.; Filatova, T.; Dastgheib, A.; Steveninck, E.D.R.V.; Ranasinghe, R. Quantifying Economic Value of Coastal Ecosystem Services: A Review. J. Mar. Sci. Eng. 2018, 6, 5. [Google Scholar] [CrossRef]
- Rodil, I.F.; Lastra, M.; López, J.; Mucha, A.P.; Fernandes, J.P.; Fernandes, S.V.; Olabarria, C. Sandy Beaches as Biogeochemical Hotspots: The Metabolic Role of Macroalgal Wrack on Low-productive Shores. Ecosystems 2018, 22, 49–63. [Google Scholar] [CrossRef]
- Luijendijk, A.; Hagenaars, G.; Ranasinghe, R.; Baart, F.; Donchyts, G.; Aarninkhof, S. The State of the World’s Beaches. Sci. Rep. 2018, 8, 11381. [Google Scholar] [CrossRef] [PubMed]
- Zeng, C.; Zhu, S.; Li, Z.; Chen, D.; Zhang, H. High-frequency in situ measurements of beach responses to Tropical Storm Bebinca at Qing’an Bay, Guangdong Province, China. Reg. Stud. Mar. Sci. 2020, 36, 101285. [Google Scholar] [CrossRef]
- Li, Y.; Zhang, C.; Song, J.; Chi, S.; Zhao, S.; Qi, H.; Shi, J. Tide-modulated wave characteristics and breaking regimes in the intertidal zone of a dissipative beach. Ocean. Eng. 2022, 266, 113055. [Google Scholar] [CrossRef]
- Liu, X.; Kuang, C.; Huang, S.; Dong, W. Modelling morphodynamic responses of a natural embayed beach to Typhoon Lekima encountering different tide types. Anthr. Coasts 2022, 5, 4. [Google Scholar] [CrossRef]
- Yu, Y.; Wang, Y.; Qiao, L.; Wang, N.; Li, G.; Tian, Z.; Zhong, Y. Geomorphological response of sandy beach to tropical cyclones with different characteristics. Front. Mar. Sci. 2022, 9, 1010523. [Google Scholar] [CrossRef]
- Xing, H.; Li, P.; Zhang, L.; Xue, H.; Shi, H.; You, Z. Numerical Simulation of the Beach Response Mechanism under Typhoon Lekima: A Case Study of the Southern Beach of Chudao. J. Mar. Sci. Eng. 2023, 11, 1156. [Google Scholar] [CrossRef]
- Qi, H.; Cai, F.; Lei, G.; Cao, H.; Shi, F. The response of three main beach types to tropical storms in South China. Mar. Geol. 2010, 275, 244–254. [Google Scholar] [CrossRef]
- Oo, Y.H.; Vieira da Silva, G.; Zhang, H. Storm sequence chronology and initial profile morphology controls on beach erosion. Appl. Ocean. Res. 2023, 130, 103431. [Google Scholar] [CrossRef]
- Zhang, D.; Guo, J.; Shi, L.; Chen, W.; Kuang, C.; Xia, X. Non-uniform cumulative responses of beach sedimentary geomorphology to consecutive storms around a meso-macro tidal island. Front. Mar. Sci. 2024, 11, 1495918. [Google Scholar] [CrossRef]
- Eichentopf, S.; Karunarathna, H.; Alsina, J.M. Morphodynamics of sandy beaches under the influence of storm sequences: Current research status and future needs. Water Sci. Eng. 2019, 12, 221–234. [Google Scholar] [CrossRef]
- Guo, J.; Shi, L.; Pan, S.; Ye, Q.; Cheng, W.; Chang, Y.; Chen, S. Monitoring and evaluation of sand nourishments on an embayed beach exposed to frequent storms in eastern China. Ocean Coast. Manag. 2020, 195, 105284. [Google Scholar] [CrossRef]
- AEl-Masry, E. Hard engineering coastal structures; detrimental or beneficial: A case study of Agami–Sidi Kerair coast, Mediterranean Sea, Egypt. Egypt. J. Aquat. Biol. Fish. 2022, 26, 505–531. [Google Scholar] [CrossRef]
- Schoonees, T.; Gijón Mancheño, A.; Scheres, B.; Bouma, T.J.; Silva, R.; Schlurmann, T.; Schüttrumpf, H. Hard Structures for Coastal Protection, Towards Greener Designs. Estuaries Coasts 2019, 42, 1709–1729. [Google Scholar] [CrossRef]
- Sarhan, T.E. Submerged Offshore Breakwaters for Wave Energy Dissipation. Int. J. Ocean. Oceanogr. 2020, 14, 125–137. [Google Scholar]
- Gao, J.; He, Z.; Zang, J.; Chen, Q.; Ding, H.; Wang, G. Numerical investigations of wave loads on fixed box in front of vertical wall with a narrow gap under wave actions. Ocean Eng. 2020, 206, 107323. [Google Scholar] [CrossRef]
- Gao, J.; Gong, S.; He, Z.; Shi, H.; Zang, J.; Zou, T.; Bai, X. Study on Wave Loads during Steady-State Gap Resonance with Free Heave Motion of Floating Structure. J. Mar. Sci. Eng. 2023, 11, 448. [Google Scholar] [CrossRef]
- Guo, Y.C.; Mohapatra, S.C.; Guedes Soares, C. Submerged breakwater of a flexible porous membrane with a vertical flexible porous wall over variable bottom topography. Ocean Eng. 2022, 243, 109989. [Google Scholar] [CrossRef]
- de Schipper, M.A.; Ludka, B.C.; Raubenheimer, B.; Luijendijk, A.P.; Schlacher, T.A. Beach nourishment has complex implications for the future of sandy shores. Nat. Rev. Earth Environ. 2020, 2, 70–84. [Google Scholar] [CrossRef]
- Liu, G.; Cai, F.; Qi, H.; Zhu, J.; Liu, J. Morphodynamic Evolution and Adaptability of Nourished Beaches. J. Coast. Res. 2019, 35, 737–750. [Google Scholar] [CrossRef]
- McFall, B.C. The Relationship between Beach Grain Size and Intertidal Beach Face Slope. J. Coast. Res. 2019, 35, 1080–1086. [Google Scholar] [CrossRef]
- Van Rijn, L.C. Principles of Sediment Transport in Rivers, Estuaries and Coastal Seas; Aqua Publications: Amsterdam, The Netherlands, 1993. [Google Scholar]
- Burvingt, O.; Castelle, B. Storm response and multi-annual recovery of eight coastal dunes spread along the Atlantic coast of Europe. Geomorphology 2023, 435, 108735. [Google Scholar] [CrossRef]
- Marco-Peretó, C.; Durán, R.; Simarro, G.; Guillén, J. Morphological Response of a Sheltered Beach to Extreme Wave and Stream Sediment Delivery Events. Geosciences 2026, 16, 27. [Google Scholar] [CrossRef]
- Lamy, A.; Robin, N.; Smyth, T.A.G.; Hesp, P.A.; René, C.; Feyssat, P.; Raynal, O.; Hebert, B. Impact of temporal beach grain size variability on aeolian sediment transport and topographic evolution in a microtidal environment. Geomorphology 2024, 453, 109126. [Google Scholar] [CrossRef]
- Costa, G.P.; Marino, M.; Cáceres, I.; Musumeci, R.E. Effectiveness of dune reconstruction and beach nourishment to mitigate coastal erosion of the Ebro Delta (Spain). J. Mar. Sci. Eng. 2023, 11, 1908. [Google Scholar] [CrossRef]
- Oliveira, F.S.; Fortunato, A.B.; Freire, P. Beach nourishment protection against storms for contrasting backshore typologies. J. Mar. Sci. Eng. 2024, 12, 1465. [Google Scholar] [CrossRef]
- DHI MIKE 21/3 Coupled Model FM, User Guide; Danish Hydraulic Institute: Hørsholm, Denmark, 2016.
- Xie, Q.; Li, H.-X.; Lin, L.; Li, Z.-L.; Huang, J.-s.; Xu, X.-R. Characteristics of expanded polystyrene microplastics on island beaches in the Pearl River Estuary: Abundance, size, surface texture and their metals-carrying capacity. Ecotoxicology 2021, 30, 1632–1643. [Google Scholar] [CrossRef]
- Ye, Z.; Ma, X.; Yang, N.; Cui, L. Assessment of wave energy resources in the Pearl River estuary of China. Desalination Water Treat. 2023, 298, 222–232. [Google Scholar] [CrossRef]
- Fang, Z.; Shen, C.; Han, X.; Hu, C. Numerical Simulation of Hydrodynamics and Sediment Transport for Coastal Protection with Artificial Reefs. Oceans 2026, 7, 16. [Google Scholar] [CrossRef]
- Wang, H.; Xu, Z.; Li, W.; Sun, M. Study of tidal phase effect on storm surge in the Tieshan Bay, China. Environ. Res. Commun. 2026, 8, 015010. [Google Scholar] [CrossRef]
- Wang, X.; Yin, Q.; Zhang, B. Research and applications of a forecasting model of typhoon surges in China seas. Adv. Water Sci. 1991, 2, 1–10. (In Chinese) [Google Scholar]
- Shi, H.; Zhao, S.; Zhu, R.; Sun, L.; Wang, H.; Wang, Q.; Zhan, C. Risk Assessment of Storm Surge Disasters in a Semi-Enclosed Bay Under the Influence of Cold Waves: A Case Study of Laizhou Bay, China. J. Mar. Sci. Eng. 2025, 13, 1434. [Google Scholar] [CrossRef]
- Van Rijn, L.C.; Walstra, D.J.; Grasmeijer, B.; Sutherland, J.; Pan, S.; Sierra, J.P. The predictability of cross-shore bed evolution of sandy beaches at the time scale of storms and seasons using process-based profile models. Coast. Eng. 2003, 47, 295–327. [Google Scholar] [CrossRef]
- López, I.; Aragonés, L.; Villacampa, Y.; Navarro-González, F.J. Gravel beaches nourishment: Modelling the equilibrium beach profile. Sci. Total Environ. 2018, 619, 772–783. [Google Scholar] [CrossRef]
- Tonnon, P.K.; Huisman, B.J.A.; Stam, G.N.; Van Rijn, L.C. Numerical modelling of erosion rates, life span and maintenance volumes of mega nourishments. Coast. Eng. 2018, 131, 51–69. [Google Scholar] [CrossRef]
- Shi, L.; Guo, J.; Chen, S.; Chang, Y.; Zhang, D.; Gong, Z. Morphodynamic response of an embayed beach to different typhoon events with varying intensities. Acta Oceanol. Sin. 2023, 42, 51–63. [Google Scholar] [CrossRef]
- Lei, G.; He, T.C.; Li, C.D.; Zheng, J.X.; Cai, F.; Qi, H.S.; Liu, G.; Zhao, S.H. Differences of post-restoration evolution of beaches maintained with sediments of different particle sizes: A case study of Dong’ao and Tulongdi beach restoration projects in Dongtou district, Wenzhou City. J. Appl. Oceanogr. 2025, 44, 569–579. (In Chinese) [Google Scholar]
Disclaimer/Publisher’s Note: The statements, opinions and data contained in all publications are solely those of the individual author(s) and contributor(s) and not of MDPI and/or the editor(s). MDPI and/or the editor(s) disclaim responsibility for any injury to people or property resulting from any ideas, methods, instructions or products referred to in the content. |
© 2026 by the authors. Licensee MDPI, Basel, Switzerland. This article is an open access article distributed under the terms and conditions of the Creative Commons Attribution (CC BY) license.