


Abstract
The suspended configuration of inter-array power cables between floating offshore wind turbines necessitates using various ancillary equipment, such as buoy elements and bend stiffeners, to maintain the desired cable geometry. The failure analysis is an important step in the design of an inter-array dynamic power cable layout. This study investigates the impact of buoy element failures on the structural integrity and fatigue life of inter-array power cable configurations in offshore environments, focusing on four environmental conditions representative of the North Sea. Utilizing numerical simulations and fatigue analysis in OrcaFlex, static and dynamic analyses are conducted to assess maximum tension, minimum bend radius (MBR), and fatigue life under single and two failure scenarios of buoy elements. The results indicate that single buoy failures significantly increase maximum tension at hang-off points. At the same time, MBR is found to be the smallest at the failure position, aiding in failure point identification. In addition, for the two buoy element failure scenarios, the maximum tension increase poses risks to structural integrity, while MBR and fatigue life have high sensitivity to the applied environmental conditions.
1. Introduction
Given the escalating demand for environmentally sustainable energy sources on a global scale, ocean renewable energy has emerged as a rapidly developing sector. Among the various forms of ocean renewable energy, offshore wind energy stands out as particularly promising and is being rapidly adopted worldwide. Notably, the increase in floating offshore wind turbines (FOWTs) has become a focal point in this domain. The deployment of these FOWTs necessitates the installation of extensive networks of inter-array power cables, contributing significantly to the development cost of the whole wind farm. In regions characterized by deepwater conditions (>60 m), the utilization of suspended configurations for inter-array power cables presents an opportunity to mitigate costs and minimize energy loss within the inter-array system, thereby enhancing economic viability and operational efficiency [1]. In a suspended power cable system, ancillary equipment such as buoyancy modules or buoys is essential. These components play a crucial role in establishing the targeted geometry and ensuring that the cable remains suspended throughout the water column.
The suspended configuration of inter-array power cables for FOWTs is a relatively new technology. In comparison, numerous riser configurations, such as lazy wave, steep wave, Chinese lantern, and tethered wave, have already been established in the oil and gas industry [2]. Buoyancy modules are commonly utilized in these configurations. Each of these configurations serves different purposes and operational conditions. Attaching buoyancy modules to an inter-array power cable can create a buoyancy section, offering several advantages. Andreassen [3] has concluded that the buoyancy section on a power cable can significantly reduce the impact of surface motions on the touch-down point (TDP) or touch-down region (TDR). Additionally, it can prevent compression forces at the cable’s TDR and help increase reachable depth with the same cable type. For example, an uplift force is created by installing buoyancy modules to establish a steel lazy wave riser (SLWR) configuration. The uplift force isolates the critical touch-down area from the dynamic motions of the riser. Yue et al. [4] stated that the uplift force turns the sag bend area of the SLWR into a “pseudo-touch-down” area, reducing stress on the touch-down. Various suspended configurations, including lazy wave, are applied to dynamic inter-array power cables between FOWTs. Rentschler et al. [5] conducted numerical analyses to compare catenary and lazy wave configurations used in dynamic inter-array cable systems for FOWTs. Their findings suggest that, in most cases, a lazy wave shape is preferable to a catenary shape because the lazy wave shape can potentially reduce the cable failure rate and prevent costly repairs and array downtime.
In the preceding lazy wave configurations, certain sections of the power cable touch the seabed. Rapha and Domínguez [2] developed a suspended cable model for optimizing layouts in floating offshore wind farms. One suspended configuration is double hanging, which forms a fully suspended cable connecting two FOWTs. This configuration incorporates typical ancillary equipment like bend stiffeners and buoyancy modules, simulating multiple configurations, including lazy wave, steep wave, and tethered wave. Schnepf et al. [6] established a numerical model for suspended cables in FOWTs, employing a fully suspended arrangement where the entire cable floats in the water column, avoiding contact with the seabed or water surface. In a separate investigation by Schnepf et al. [7], they compared configurations utilizing buoyancy modules and those utilizing buoys, highlighting that the minimum bending radius for buoyancy modules is superior to that of buoys. Ahmad et al. [1] explored the impact of buoy size in suspended configurations, concluding that smaller buoy sizes are more conducive to fine-tuning the arrangement and ensuring even tension distribution along the cable. Beier et al. [8] investigated the effects of cable length, buoy quantity, and spacing on the maximum effective tension and minimum bending radius of the cable. The core main material of the cable is copper. The minimum bending radius of the cable directly influences the severity of the deformation of the copper. Over-deformation of copper leads to a decrease in all physical properties of copper and even causes fracture due to the plasticity of copper [9]. The study by Matine and Drissi-Habti [10] investigated the effect of damage mechanisms on the behaviors of submarine power phase conductors. They concluded that when the deformation exceeds the yield strength, significant changes are observed in the mechanical, electrical, and thermal behaviors of the conductor.
To the authors’ knowledge, prior research has not addressed the impact of buoyancy element failure on the suspended power cable connecting two FOWTs, nor has there been an examination of cable fatigue life with buoyancy element failure. This research aims to fill this gap by examining how buoyancy failure affects the suspended cable. It also provides insight into the robust design of suspended inter-array power cables.
2. Numerical Setup and Methodology
In this section, the environmental conditions used in the numerical simulation are detailed in Section 2.1. The properties of the three main elements of the suspended inter-array power cable are discussed in Section 2.2. The procedure of failure analysis is outlined in Section 2.3. All modeling and simulations in the present study are carried out in OrcaFlex version 11.3.
2.1. Environmental Conditions
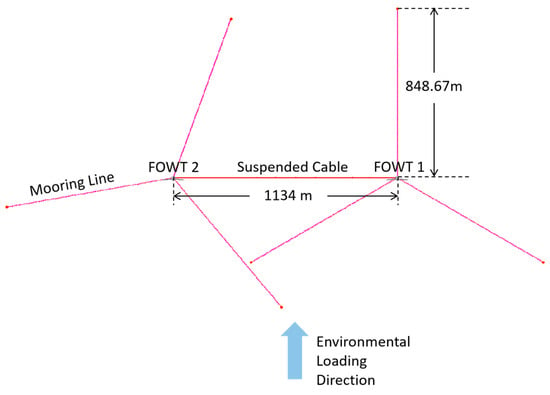
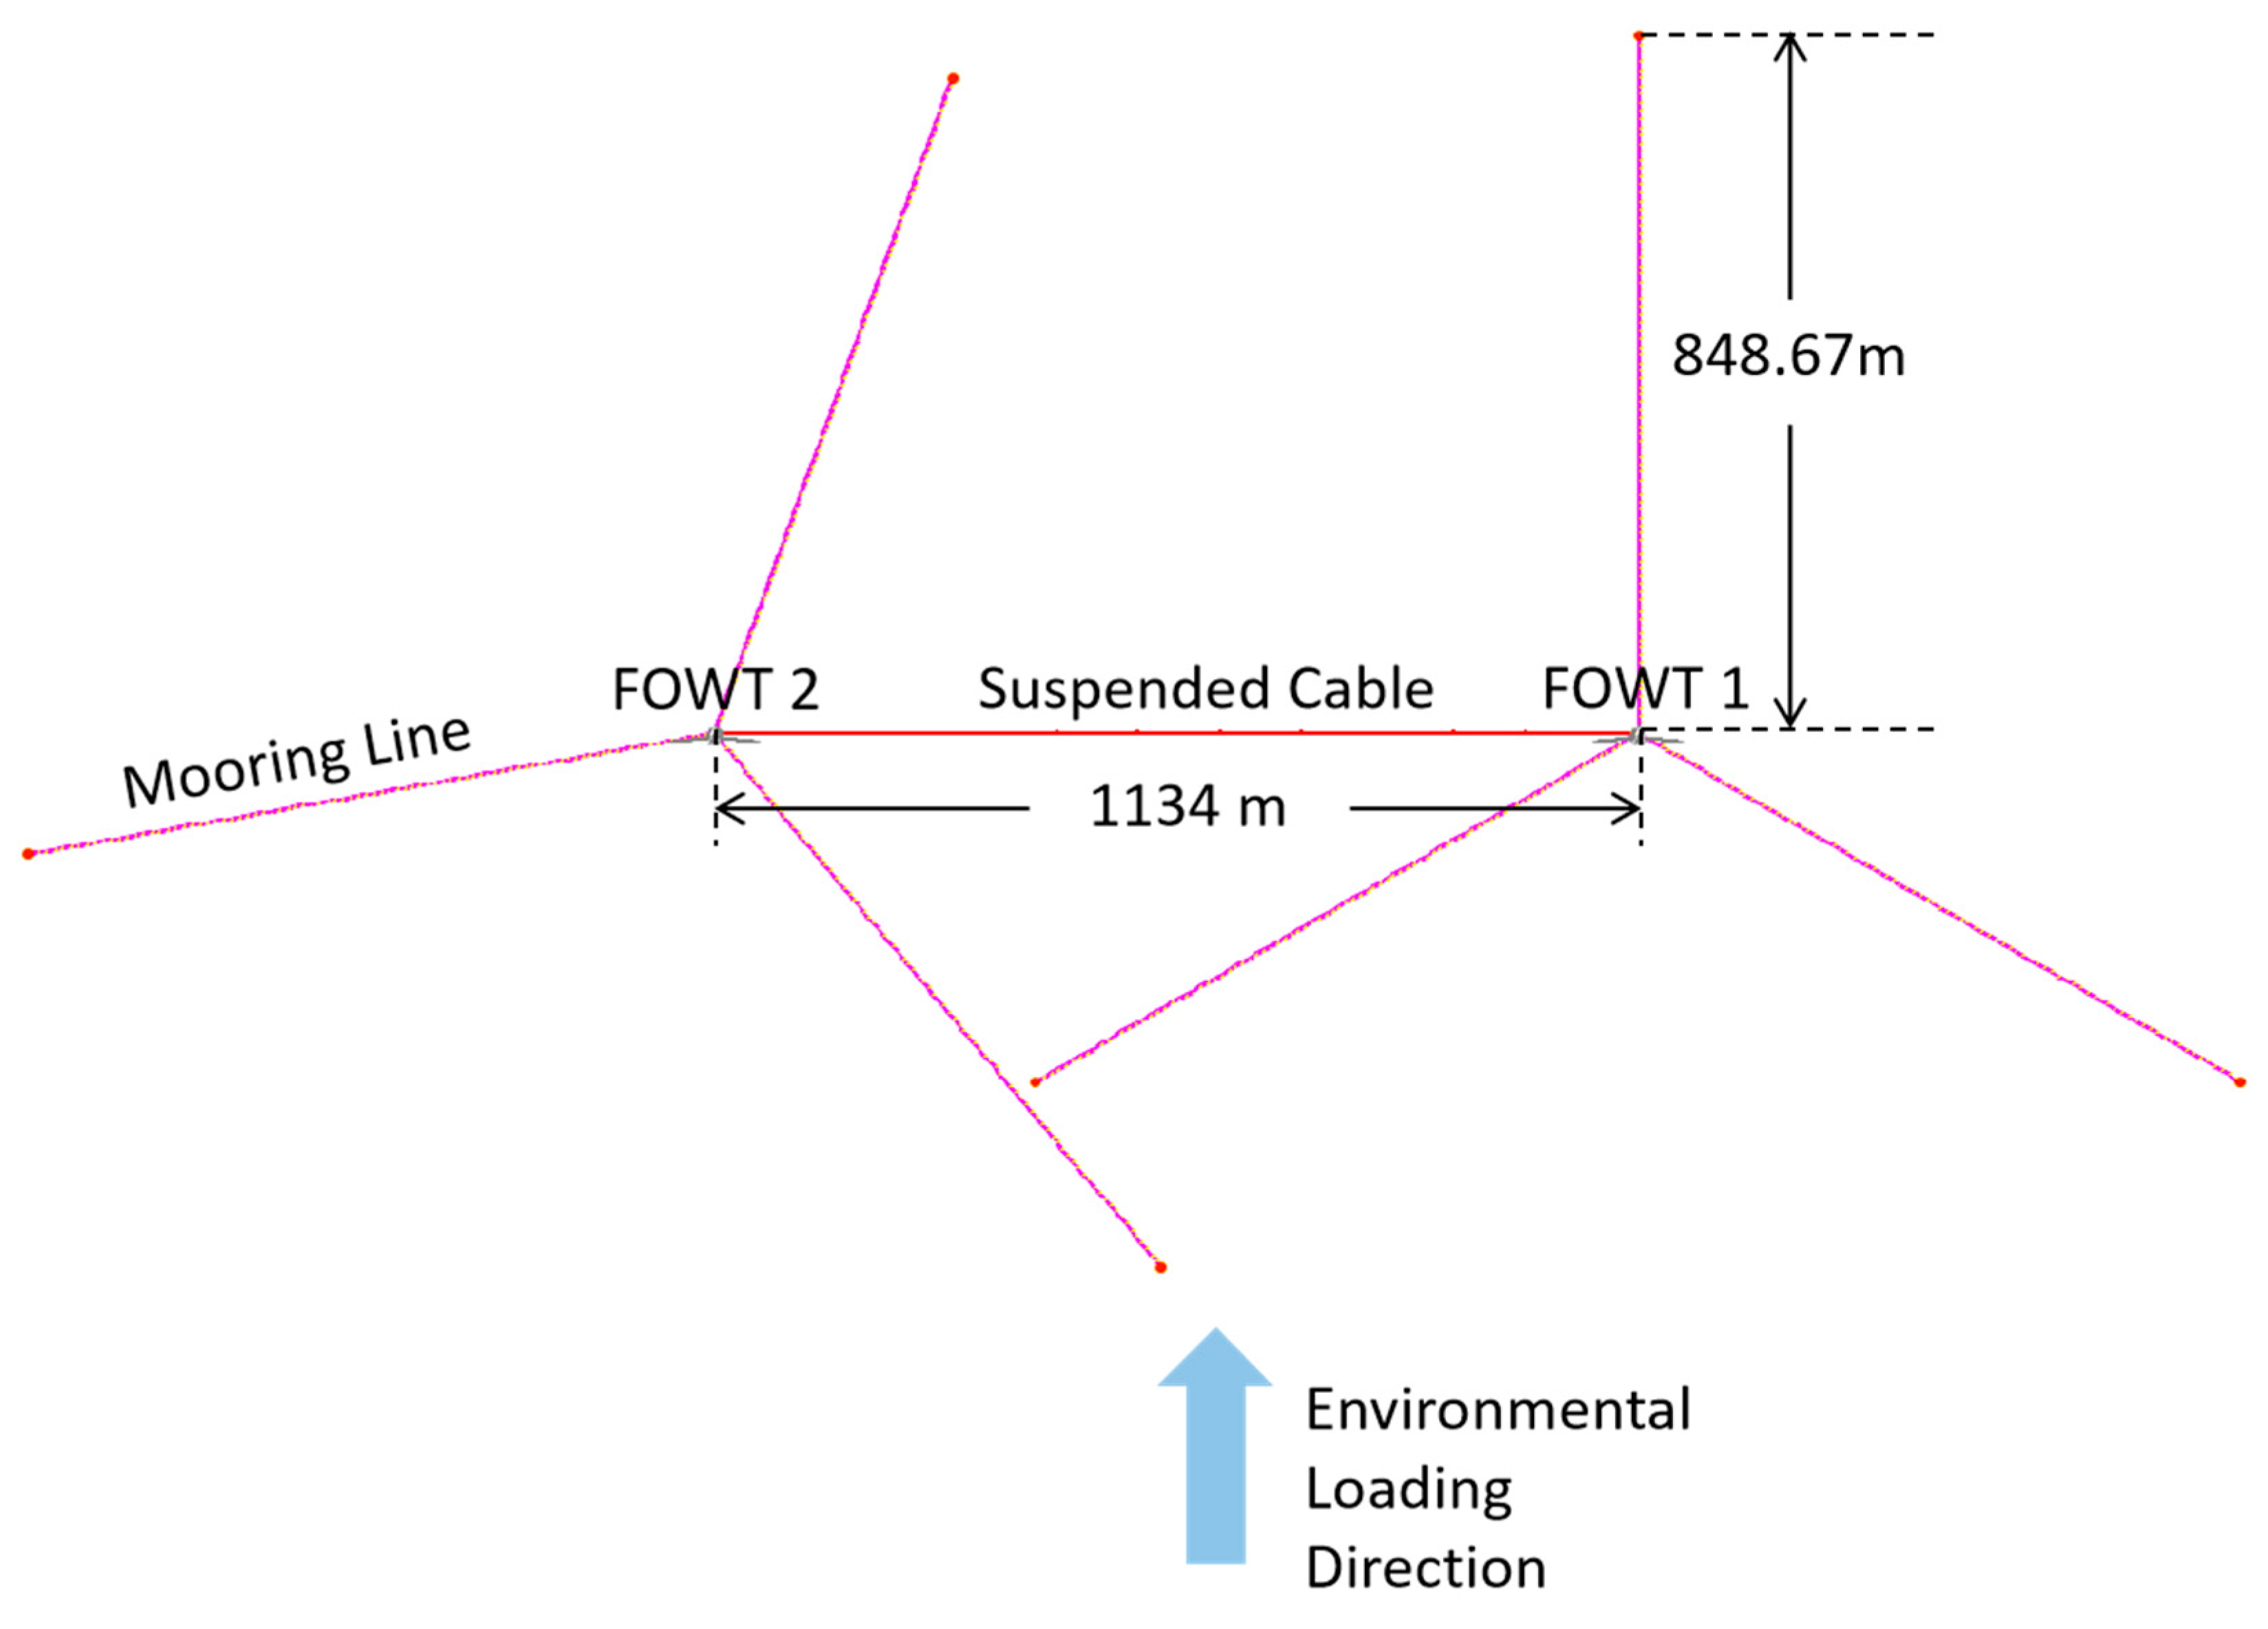
The present model of OC3-Hywind FOWT is based on the reference design by Jonkman [11]. Essential parameters are summarized in Table 1. Figure 1 depicts the layout of FOWTs and the definition of the environmental loading directions. Environmental conditions are based on metocean data for the Southern North Sea Phase II project [12], detailed in Table 2. The turbulent wind fields used in the present simulations are generated using the IECKAI (IEC Kaimal) turbulence model in TurbSim software version 1.40 [13] and imported into the OrcaFlex model.
Table 1.
OC3-Hywind FOWT specifications (Jonkman [11]).
Figure 1.
Plan view of the present two FOWTs’ setup.
Table 2.
Environmental conditions.
In the time domain dynamic simulations, the JONSWAP wave spectrum is used to generate irregular sea states, with the peak shape parameter γ calculated based on significant wave height and peak period , following DNVGL-RP-C205 [14].
Total current velocity comprises wind-generated current velocity and tidal current velocity. Tidal current velocity at the surface is set at 0.2 m/s according to the NORSOK standard [15], with a profile following a power law as specified in paragraph 4.1.4.2 of DNVGL-RP-C205 [14]. Wind-generated current velocities are computed according to DNVGL-RP-C205 [14].
2.2. Suspended Inter-Array Power Cable Setup
2.2.1. Power Cable Properties
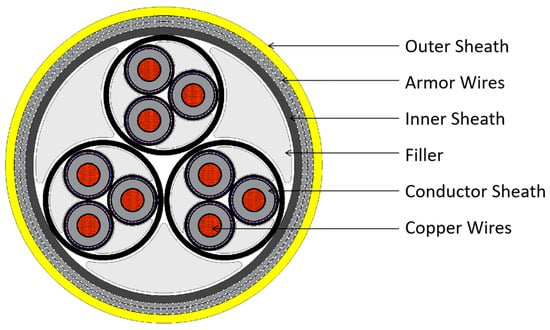
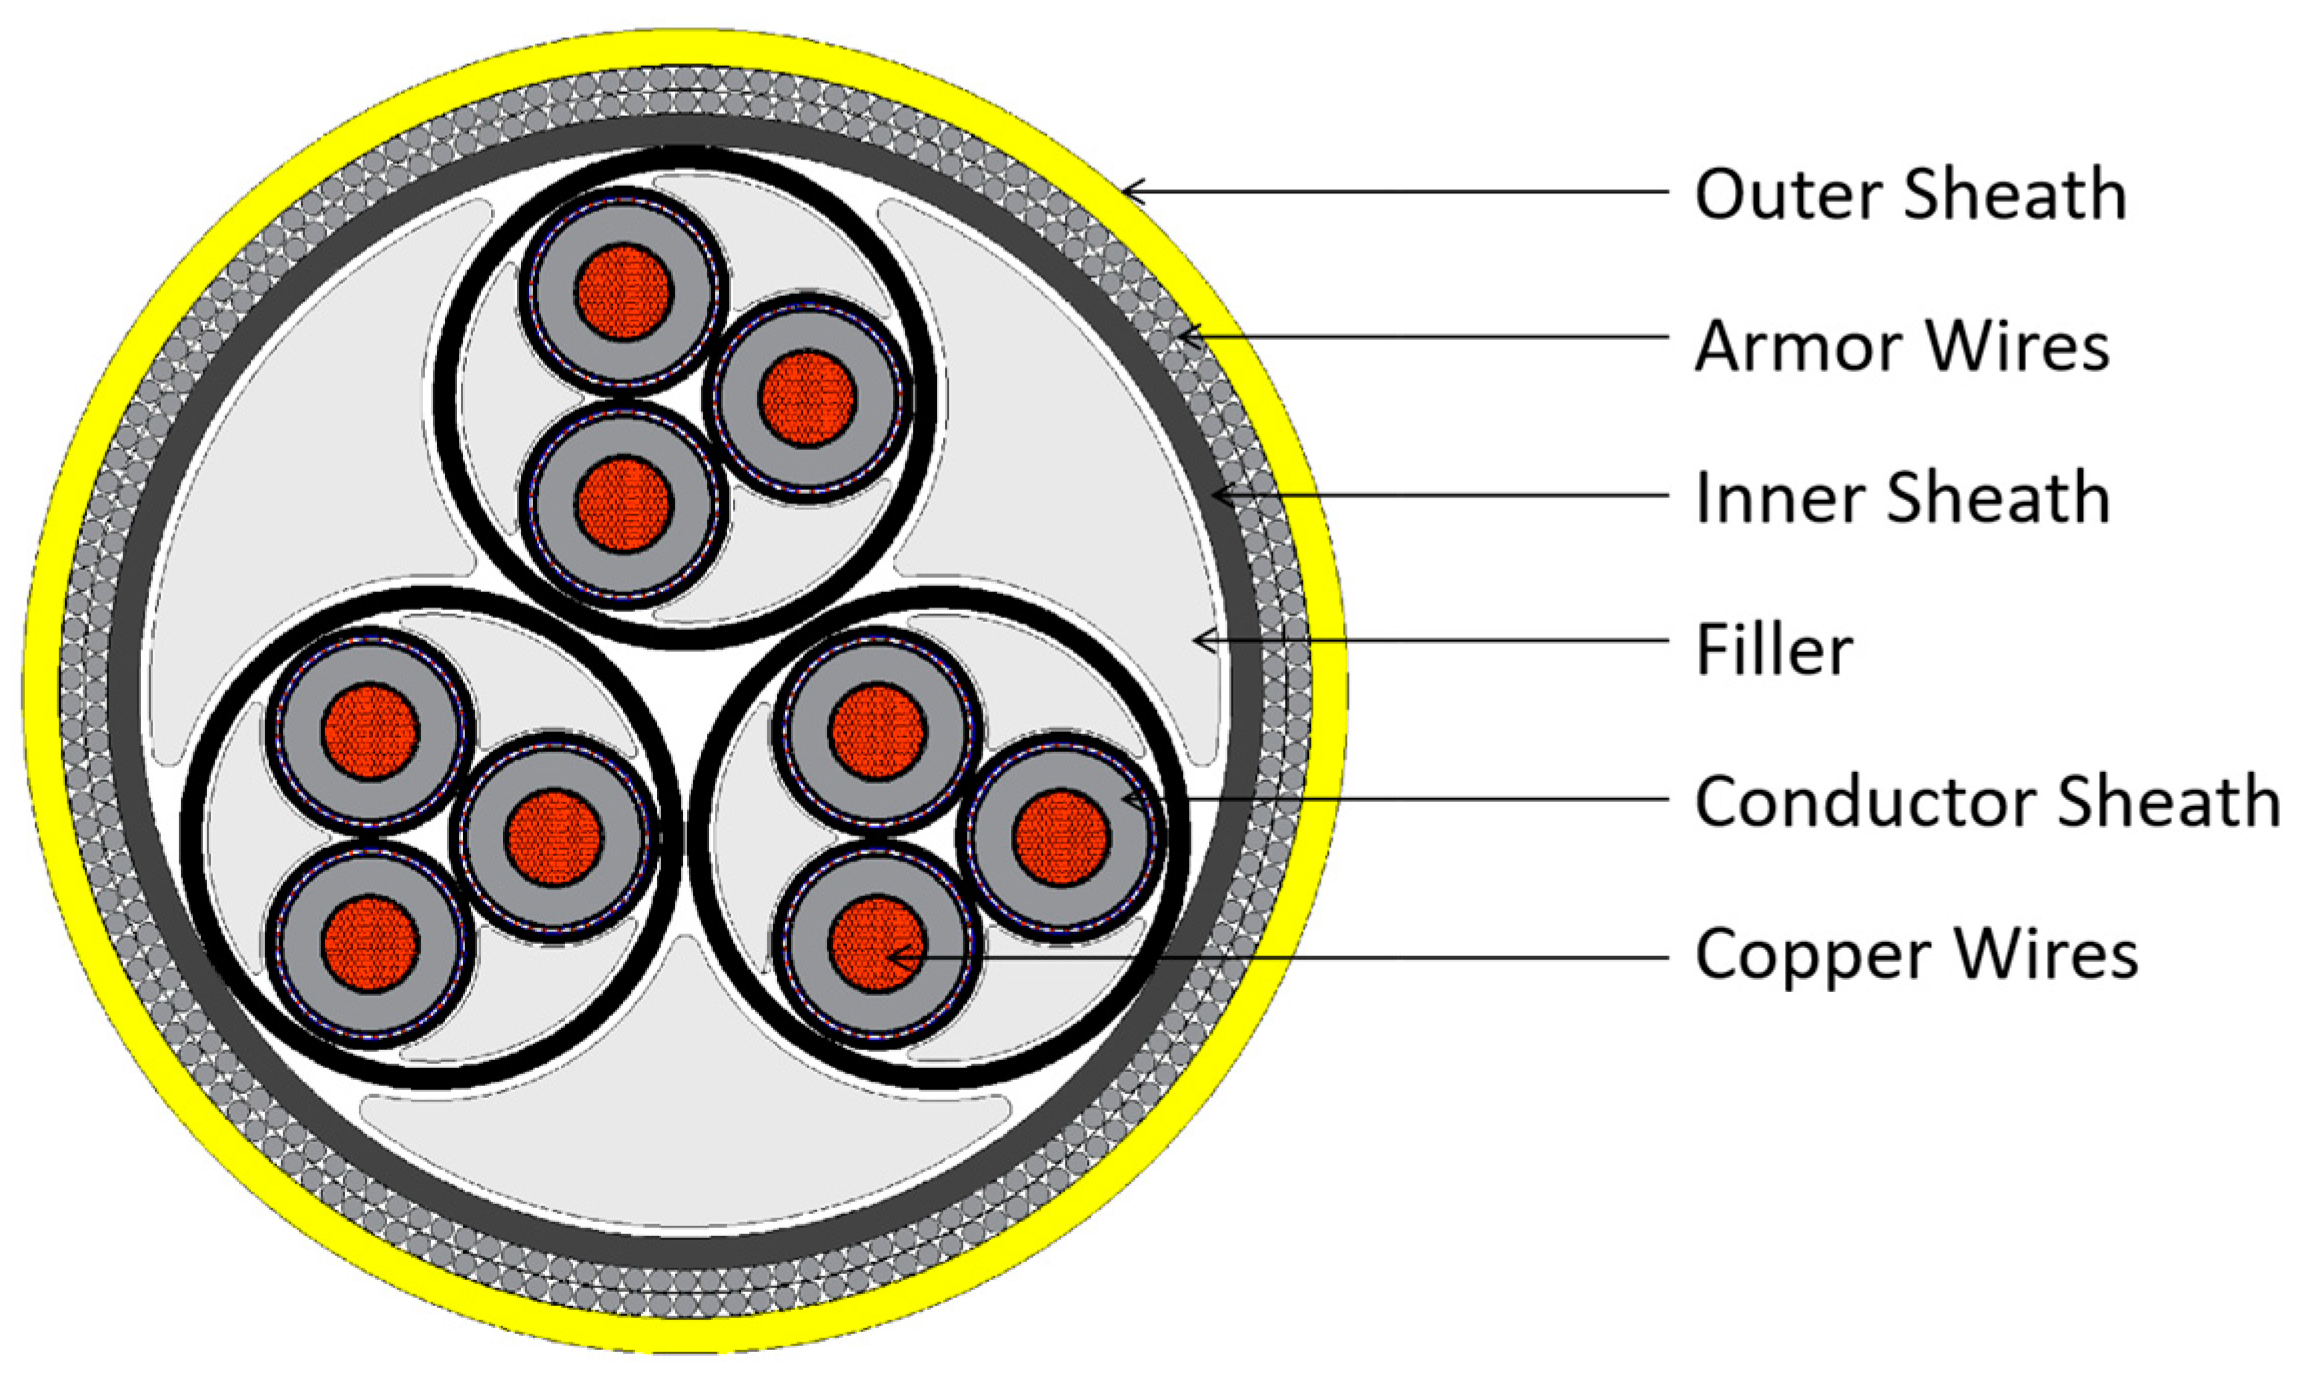
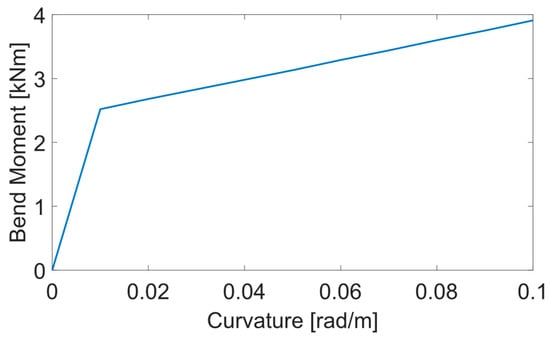
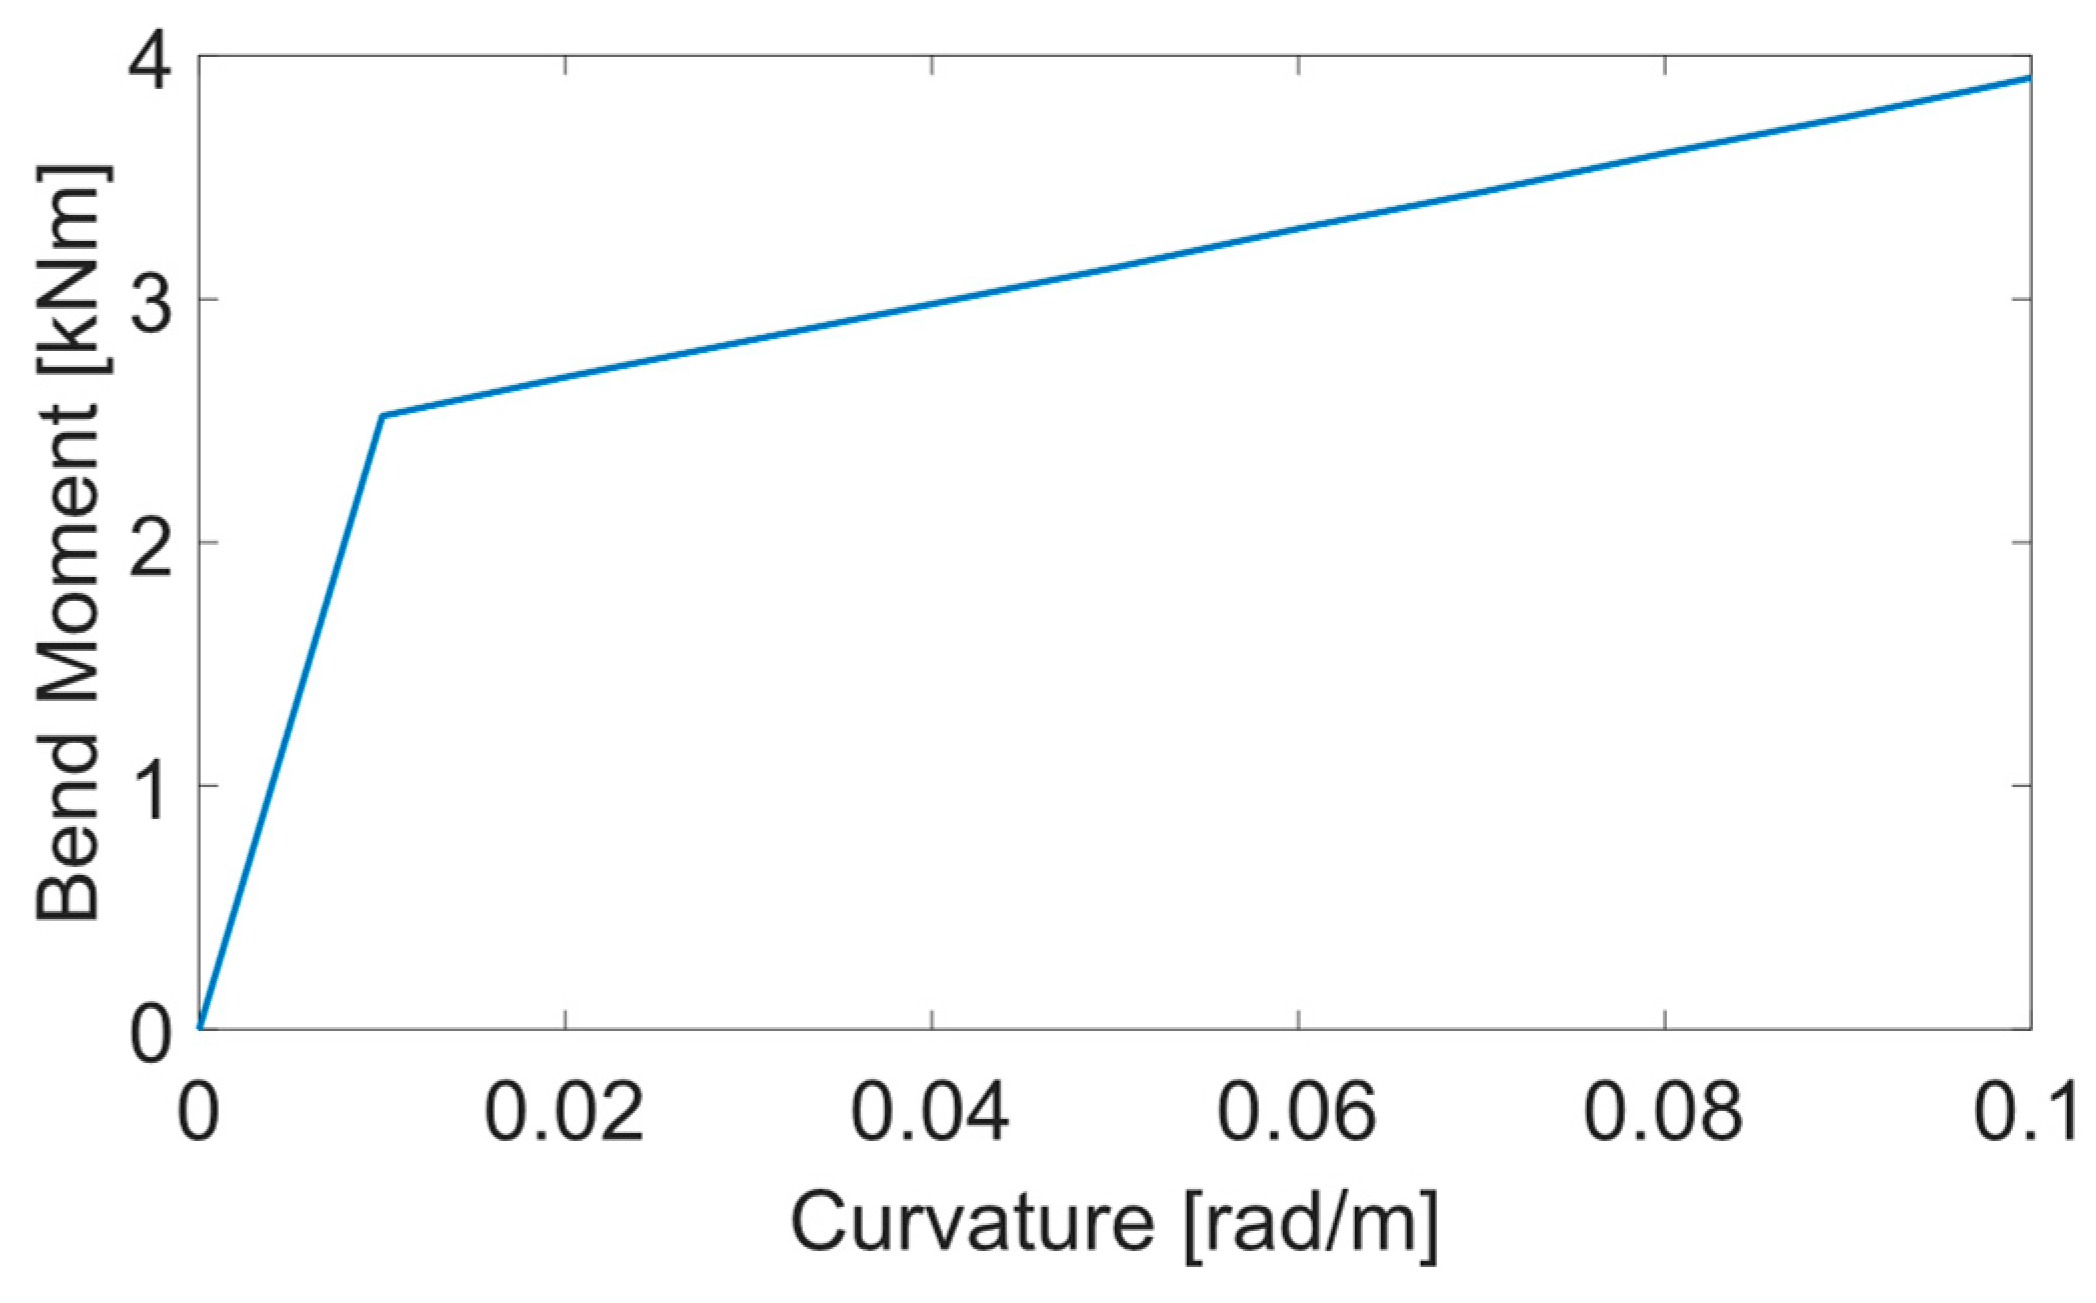
A three-conductor inter-array dynamic power cable from Beier et al. [8] is used in the present study. The properties of the cable are derived with reference to the IEC standard [16]. Table 3 presents the structural properties of the power cable. Figure 2 provides a detailed cross-sectional view of its primary components. In the conducted fatigue analysis, particular attention is given to the steel armor and copper conductors. The nonlinear correlation between the bending moment and curvature for the power cable is visually shown in Figure 3.
Table 3.
Power cable properties.
Figure 2.
Cross-section of the three-conductor inter-array dynamic power cable.
Figure 3.
Bending stiffness of the power cable.
The nonlinear moment–curvature properties of the cable are due to the local stick–slip behavior under tension and bending loads. The properties of the present cable are obtained from a finite element model of the cable cross-section created in UFLEX software version 2.8 [17]. UFLEX is a specialized program for nonlinear stress analysis of complex umbilical cross-sections [17]. UFLEX utilizes customized finite elements to accurately model components like copper conductors, steel armor, and filler inlets, specifically tailored for the armor and copper constituents of the cable. Beam elements are appropriately applied to these filled bodies (SINTEF [18]).
The cable model in the present study is built based on the setup from Ahmad et al. [1] and Beier et al. [8]. They provided a detailed sensitivity study of the whole model (including boundary conditions, problem geometry, and mesh independence tests). A constant time step of 0.1 s is used in the present study. The cable is modeled as FEM beam elements in OrcaFlex. Each end of the cable is attached to the FOWTs, respectively. The FOWTs are simulated as 6 DOF rigid bodies. The cable can be divided into four sections, including hang-off position (HOP), bend stiffener, and buoy and free-hanging sections. The discretization of the sections depends on the severity of motions. Because of severe motion by the FOWT, the element length is 0.2 m, and there are 50 elements for each HOP section. For free-hanging sections, the element length is 1 m. The element length for the bend stiffener section is 0.12 m. For the buoy section, the element length is 0.3 m. More detailed information of the model setup can be referred to Ahmad et al. [1] and Beier et al. [8].
2.2.2. Buoy Element Properties
Buoy elements are necessary to support the cable in a floating configuration in the water column. The properties of the buoys are summarized in Table 4. The suspended inter-array power cable configuration is established based on optimization studies conducted by Beier et al. [8]. These studies focused on a two-turbine setup, which is consistent with the configuration employed in the present study. According to Beier et al. [8], the spacing between buoys dictates the cable’s geometry and determines whether it makes contact with the seabed, maintains a suspended configuration, or floats up to the sea surface. A spacing of 100 m is found to yield optimal results for the considered setup in their study. In the present study, the total cable length is 1240 m, consisting of 10 buoys spaced 100 m apart.
Table 4.
Properties of the buoys (adapted from [1]).
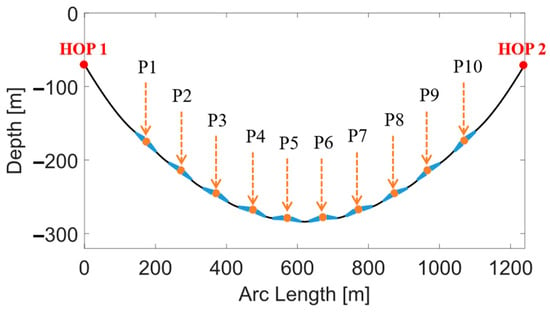
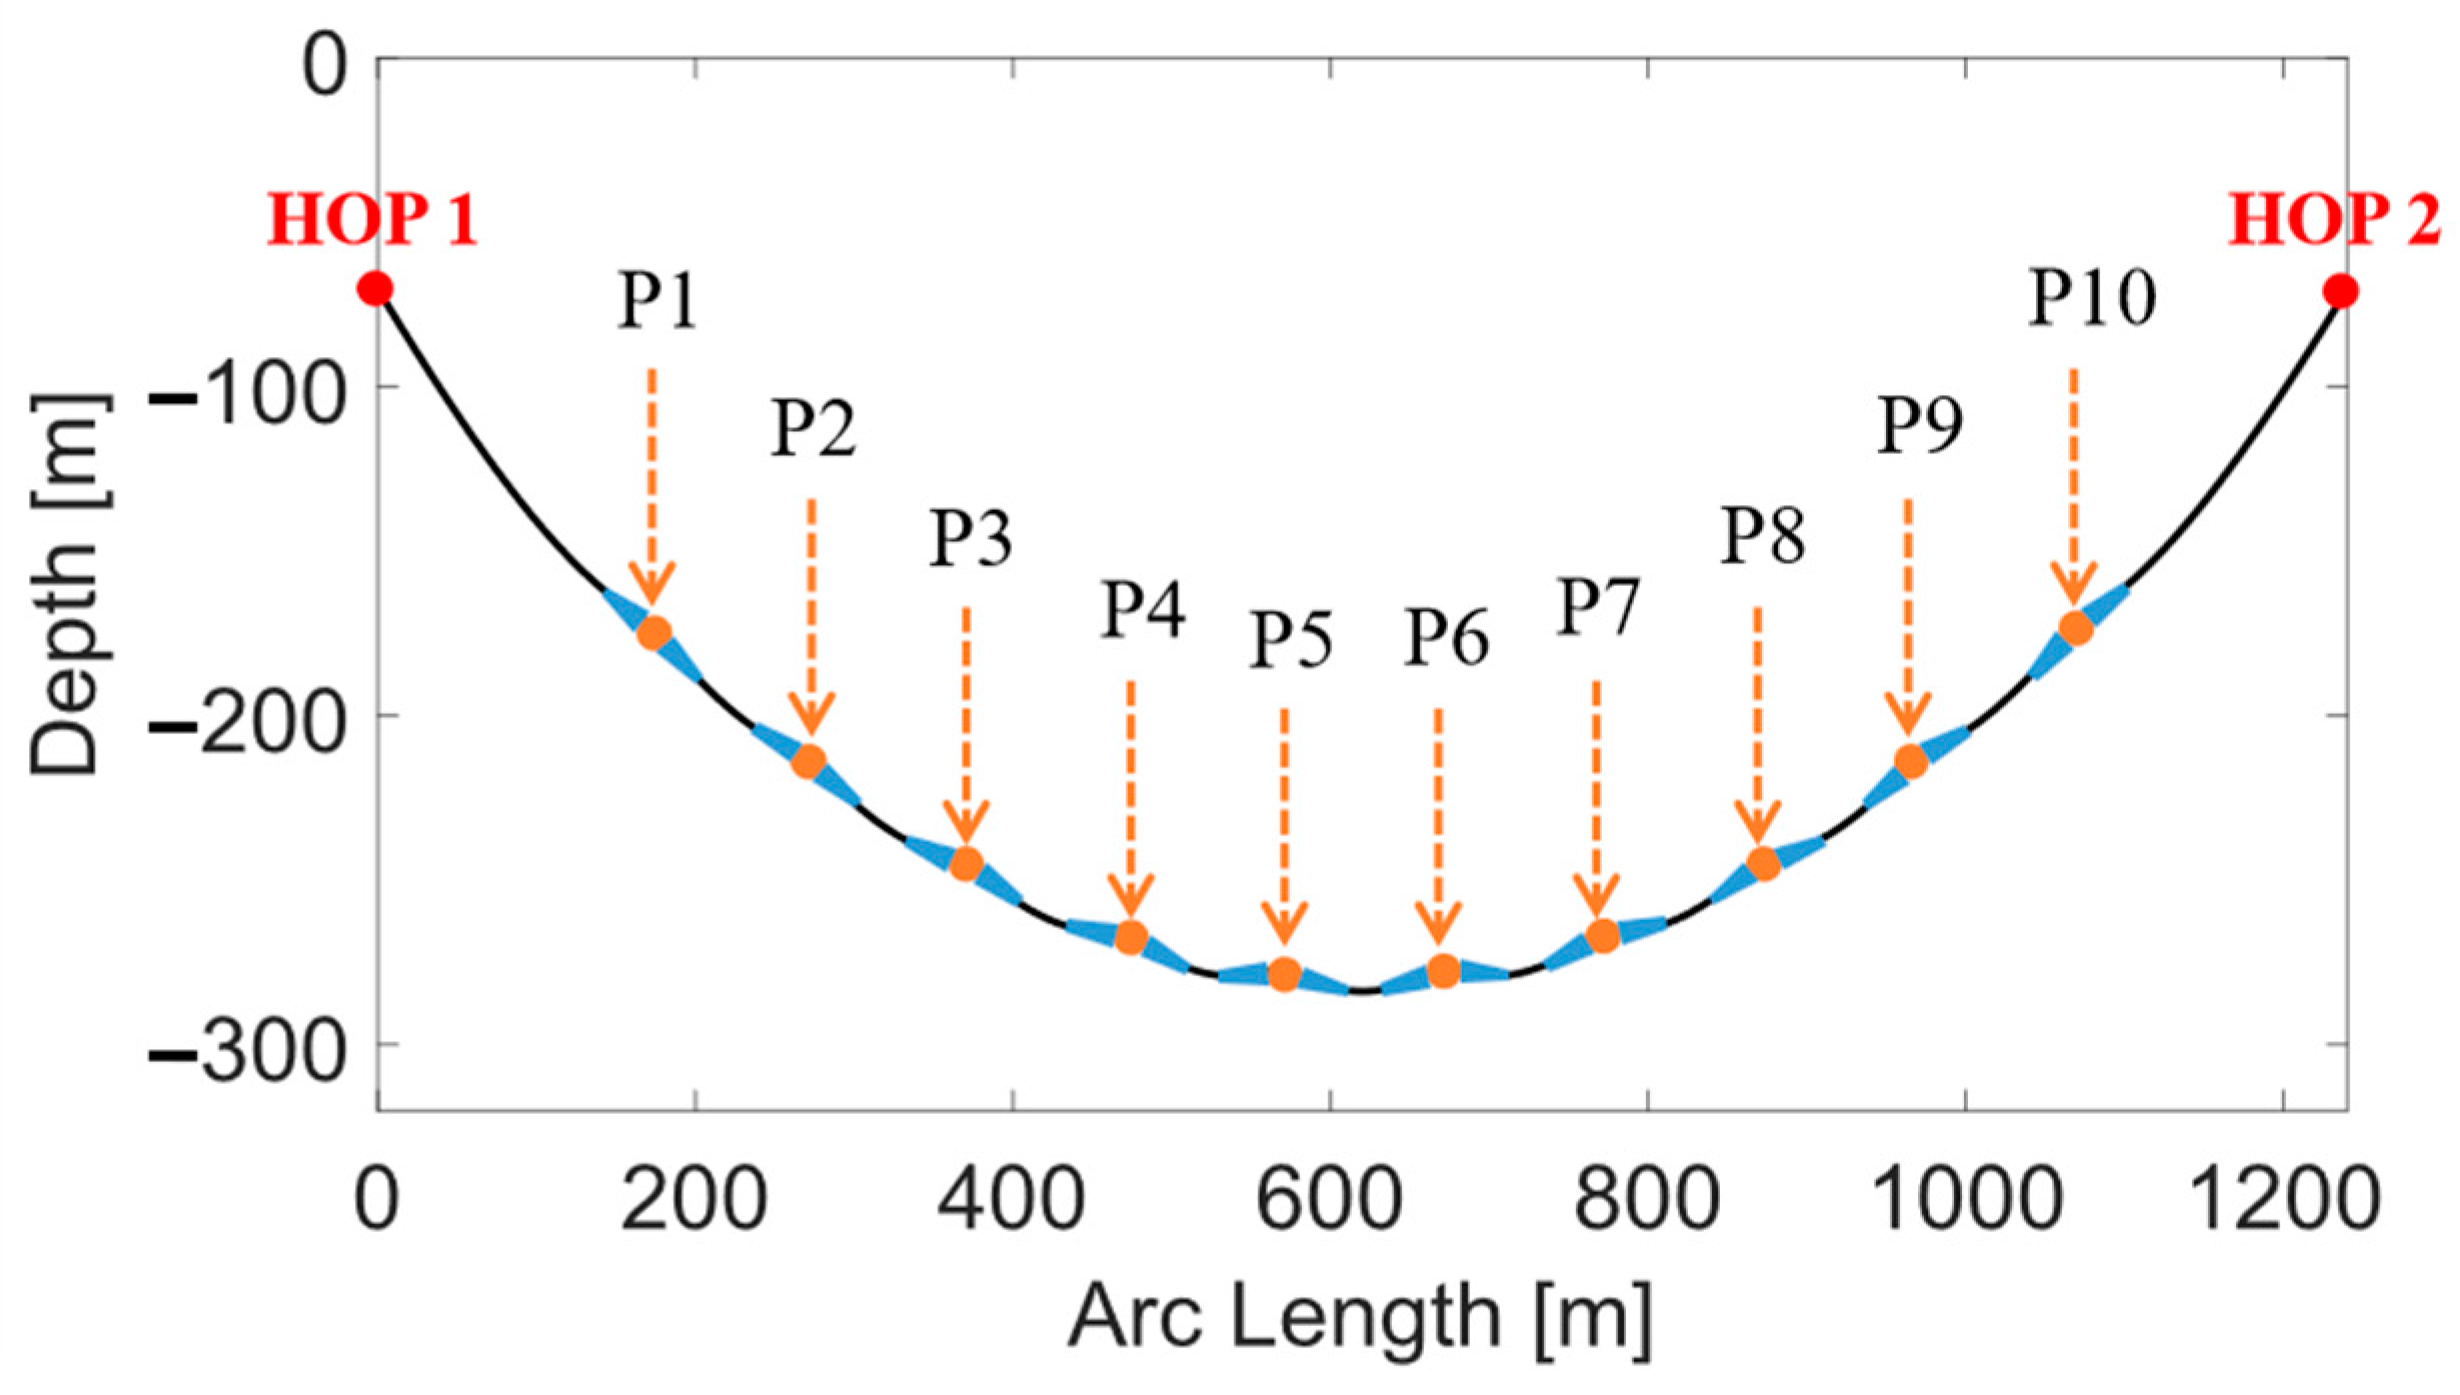
The positions of buoy elements and two hang-off points have been systematically numbered. The hang-off points (HOP) are crucial variables, serving as connection points between the FOWT and the cable. Figure 4 illustrates the locations of buoy elements, denoted from P1 to P10, between the two hang-off points, identified as HOP 1 and HOP 2.
Figure 4.
Number of buoy elements.
2.2.3. Bend Stiffener Properties
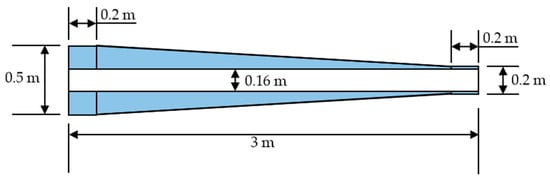
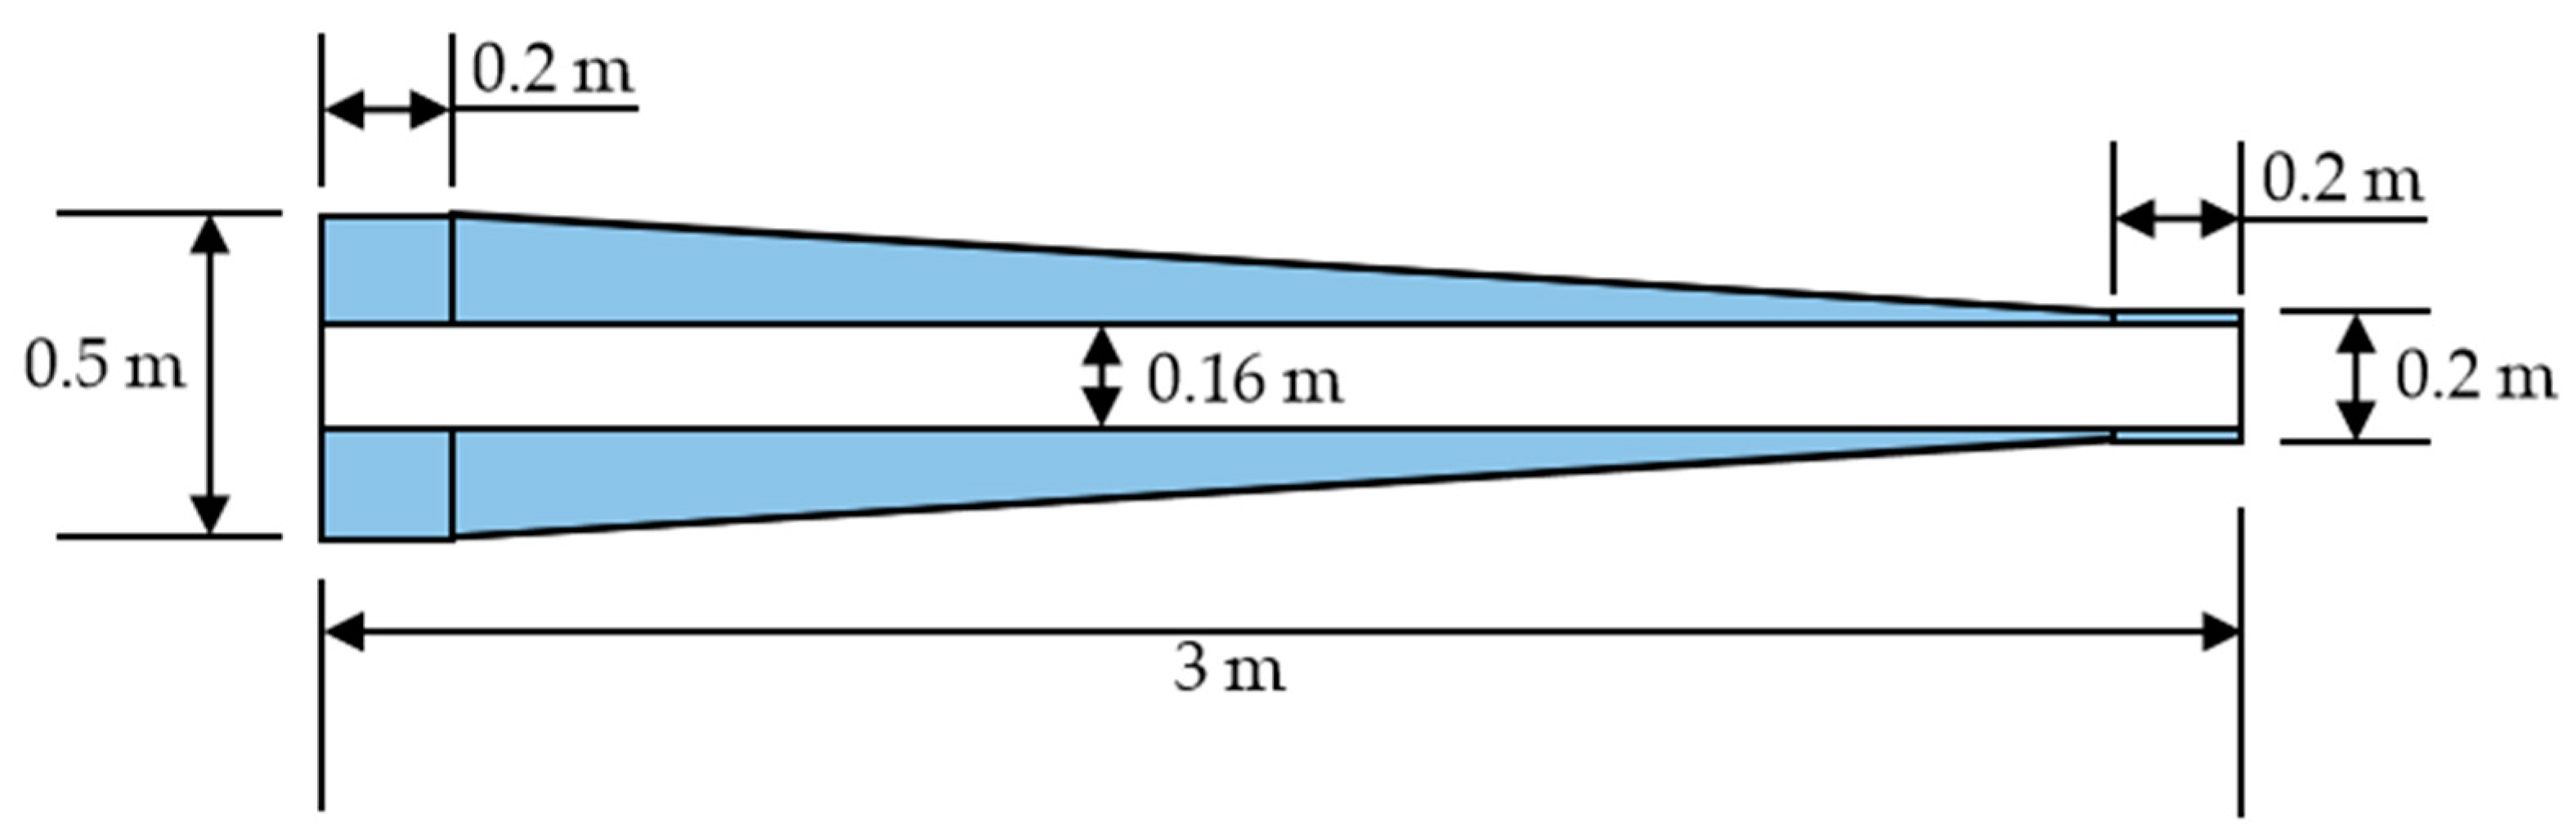
Differences in stiffness between buoyancy sections and the bare cable can result in excessive cable curvature and fatigue damage accumulation. Bend stiffeners can give a smooth transition in stiffness between the buoyancy sections and the bare cable. The bend stiffener configuration adopted in this study is based on the optimal design for maximizing the cable’s fatigue life, as suggested by Liu et al. [19]. The dimensions of the bend stiffener in their study were taken from a typical commercial bend stiffener setup as described by Schnepf et al. [20]. The material density is 7.85 t/m3, and the Poisson ratio is 0.5. The inner diameter of all bend stiffeners is set at 0.16 m, with a length of 3.0 m. (See Figure 5).
Figure 5.
The bend stiffener’s dimension (BSL: 3 m, OD: 0.20–0.50 m, ID: 0.16 m). Reproduced from Liu et al. [19].
2.3. Failure Analysis Procedure
In this section, the procedures of static, dynamic, and fatigue analyses are provided. The flowchart of the present study is outlined to show the selection of cases based on their results from static and dynamic analysis. Fatigue analysis is performed as a postprocessing calculation.
2.3.1. Static and Dynamic Analysis Procedure
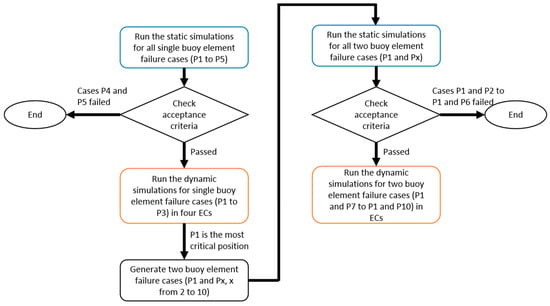
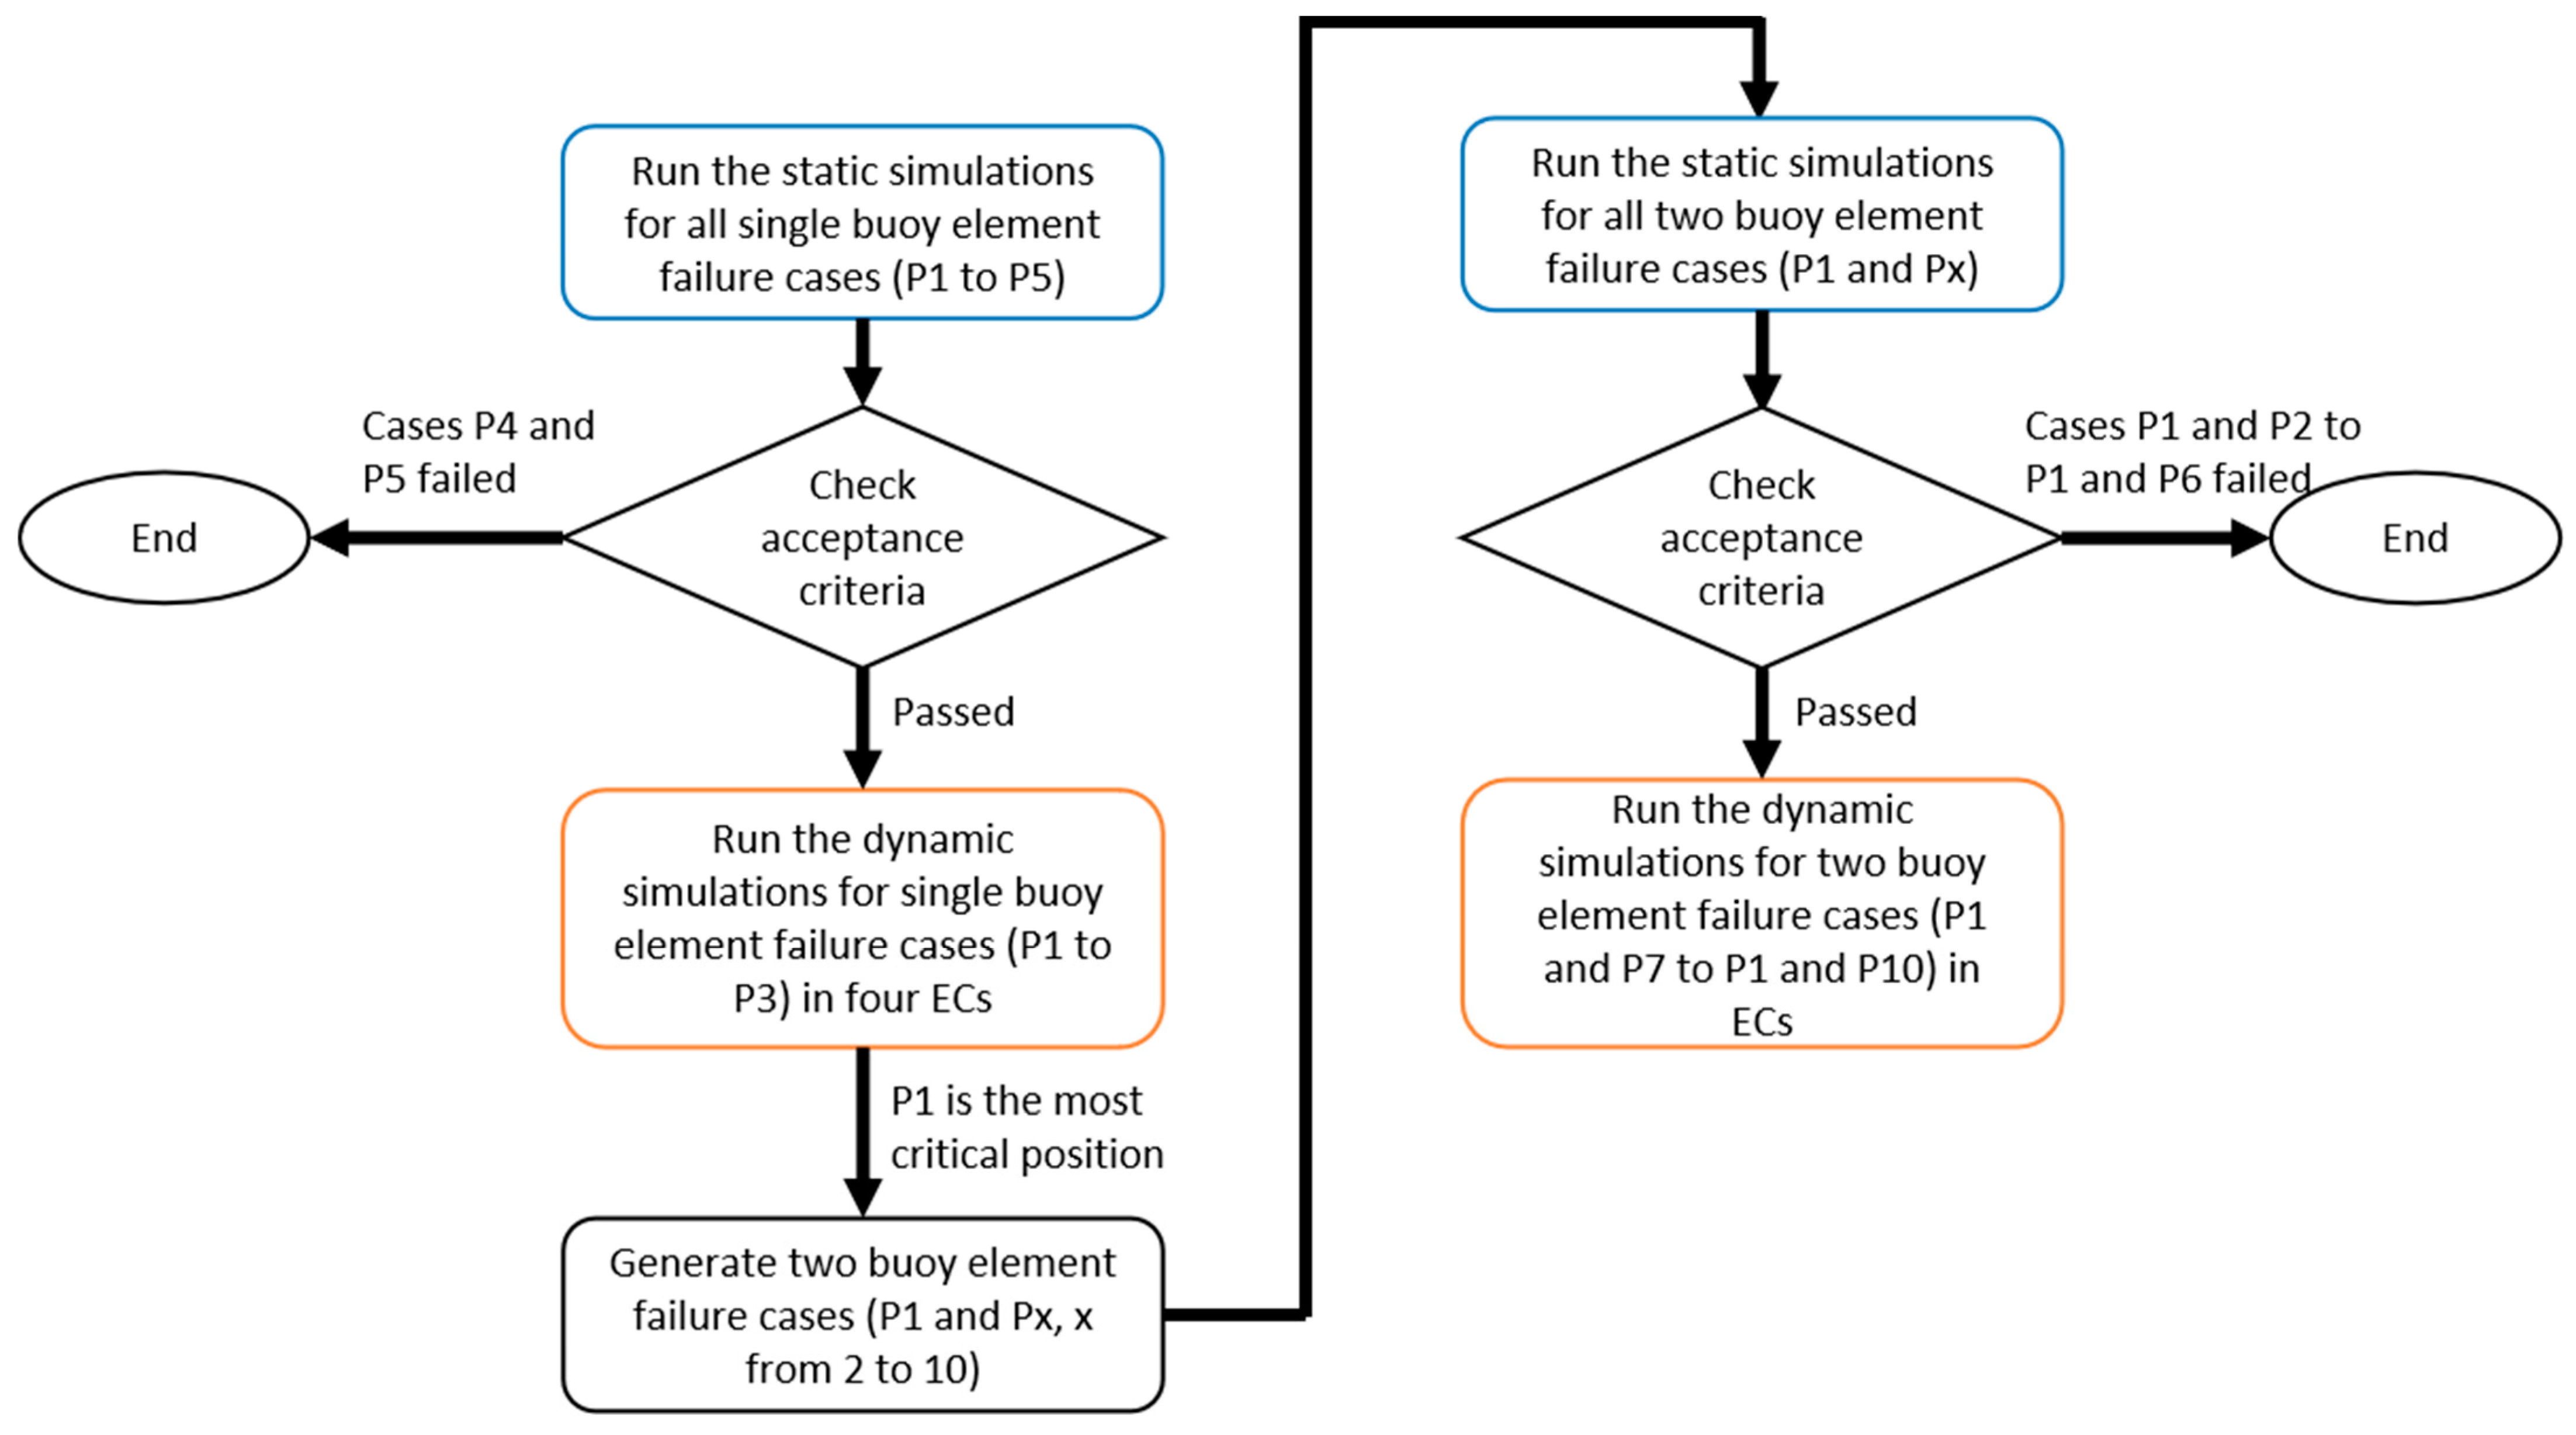
The failure analysis in this study starts from static analysis to eliminate all the cases that do not fulfill the acceptance criteria outlined in Table 5. The main procedure is shown in Figure 6. Single buoy element failure cases are generated first. The positions of buoy elements at P1–P5 and P6–P10 are symmetric with respect to the incoming direction of environmental loading as shown in Figure 1. Buoy failures at positions P1–P5 are selected to generate the cases in this study. The dynamic analysis is conducted for cases with a single buoy element failure at P1 to P3. According to computed fatigue life, the most critical position is selected to generate two buoy element failure cases. The static and dynamic analysis of two buoy element failure cases is performed analogically to the single buoy element failure case.
Table 5.
Acceptance criteria.
Figure 6.
Static and dynamic analysis procedure.
2.3.2. Fatigue Analysis
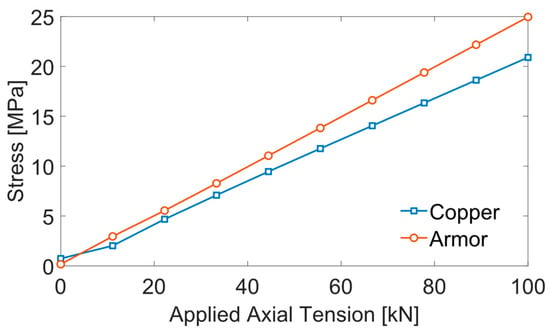
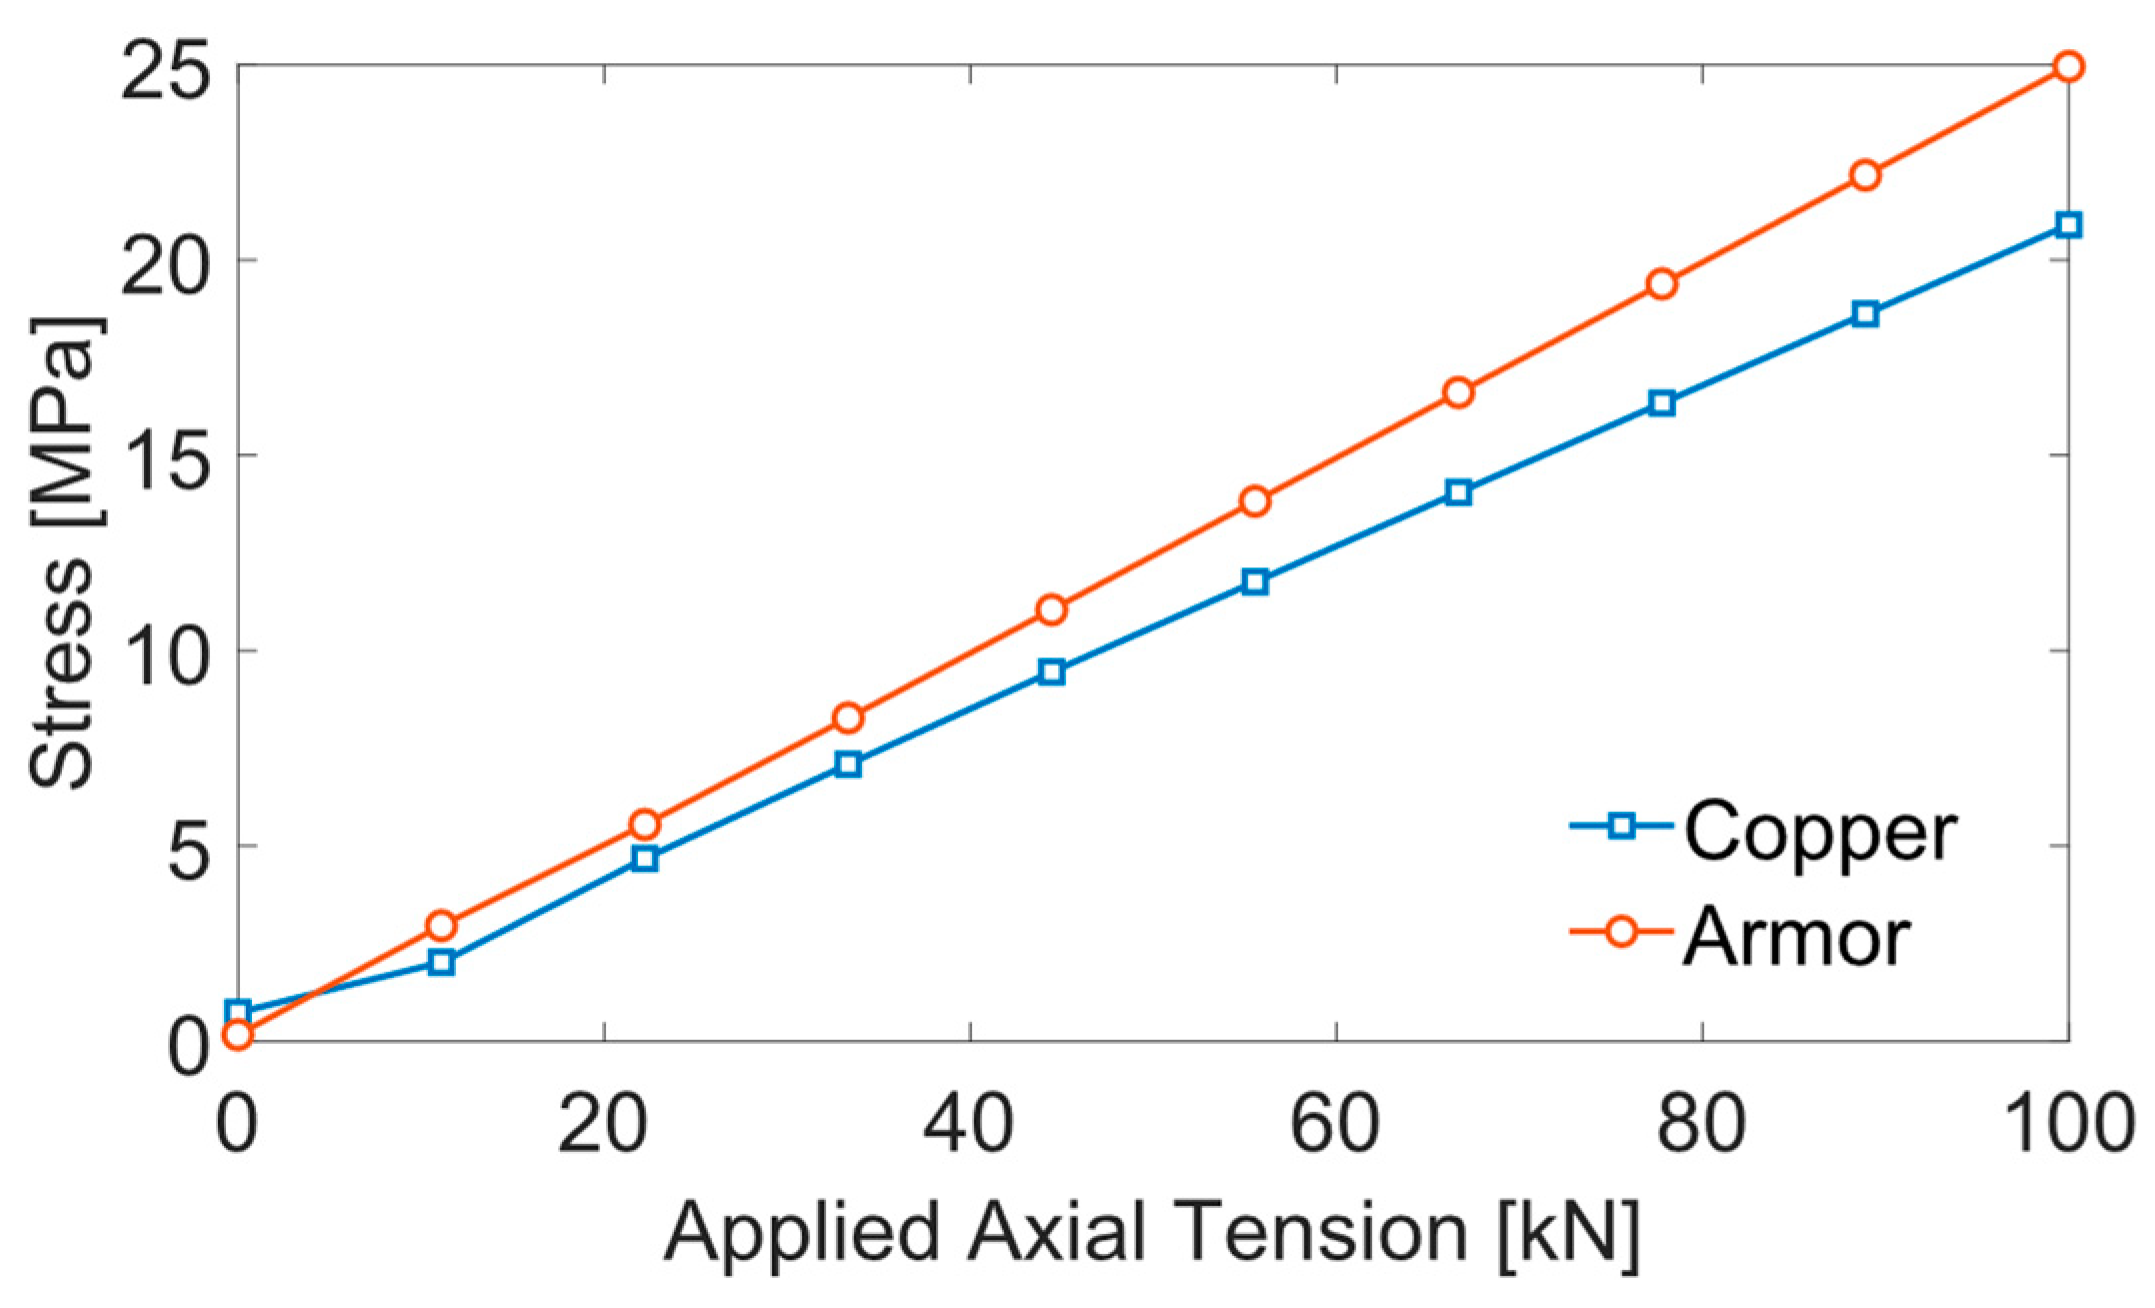
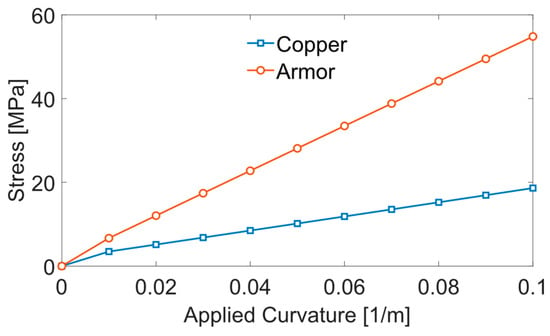
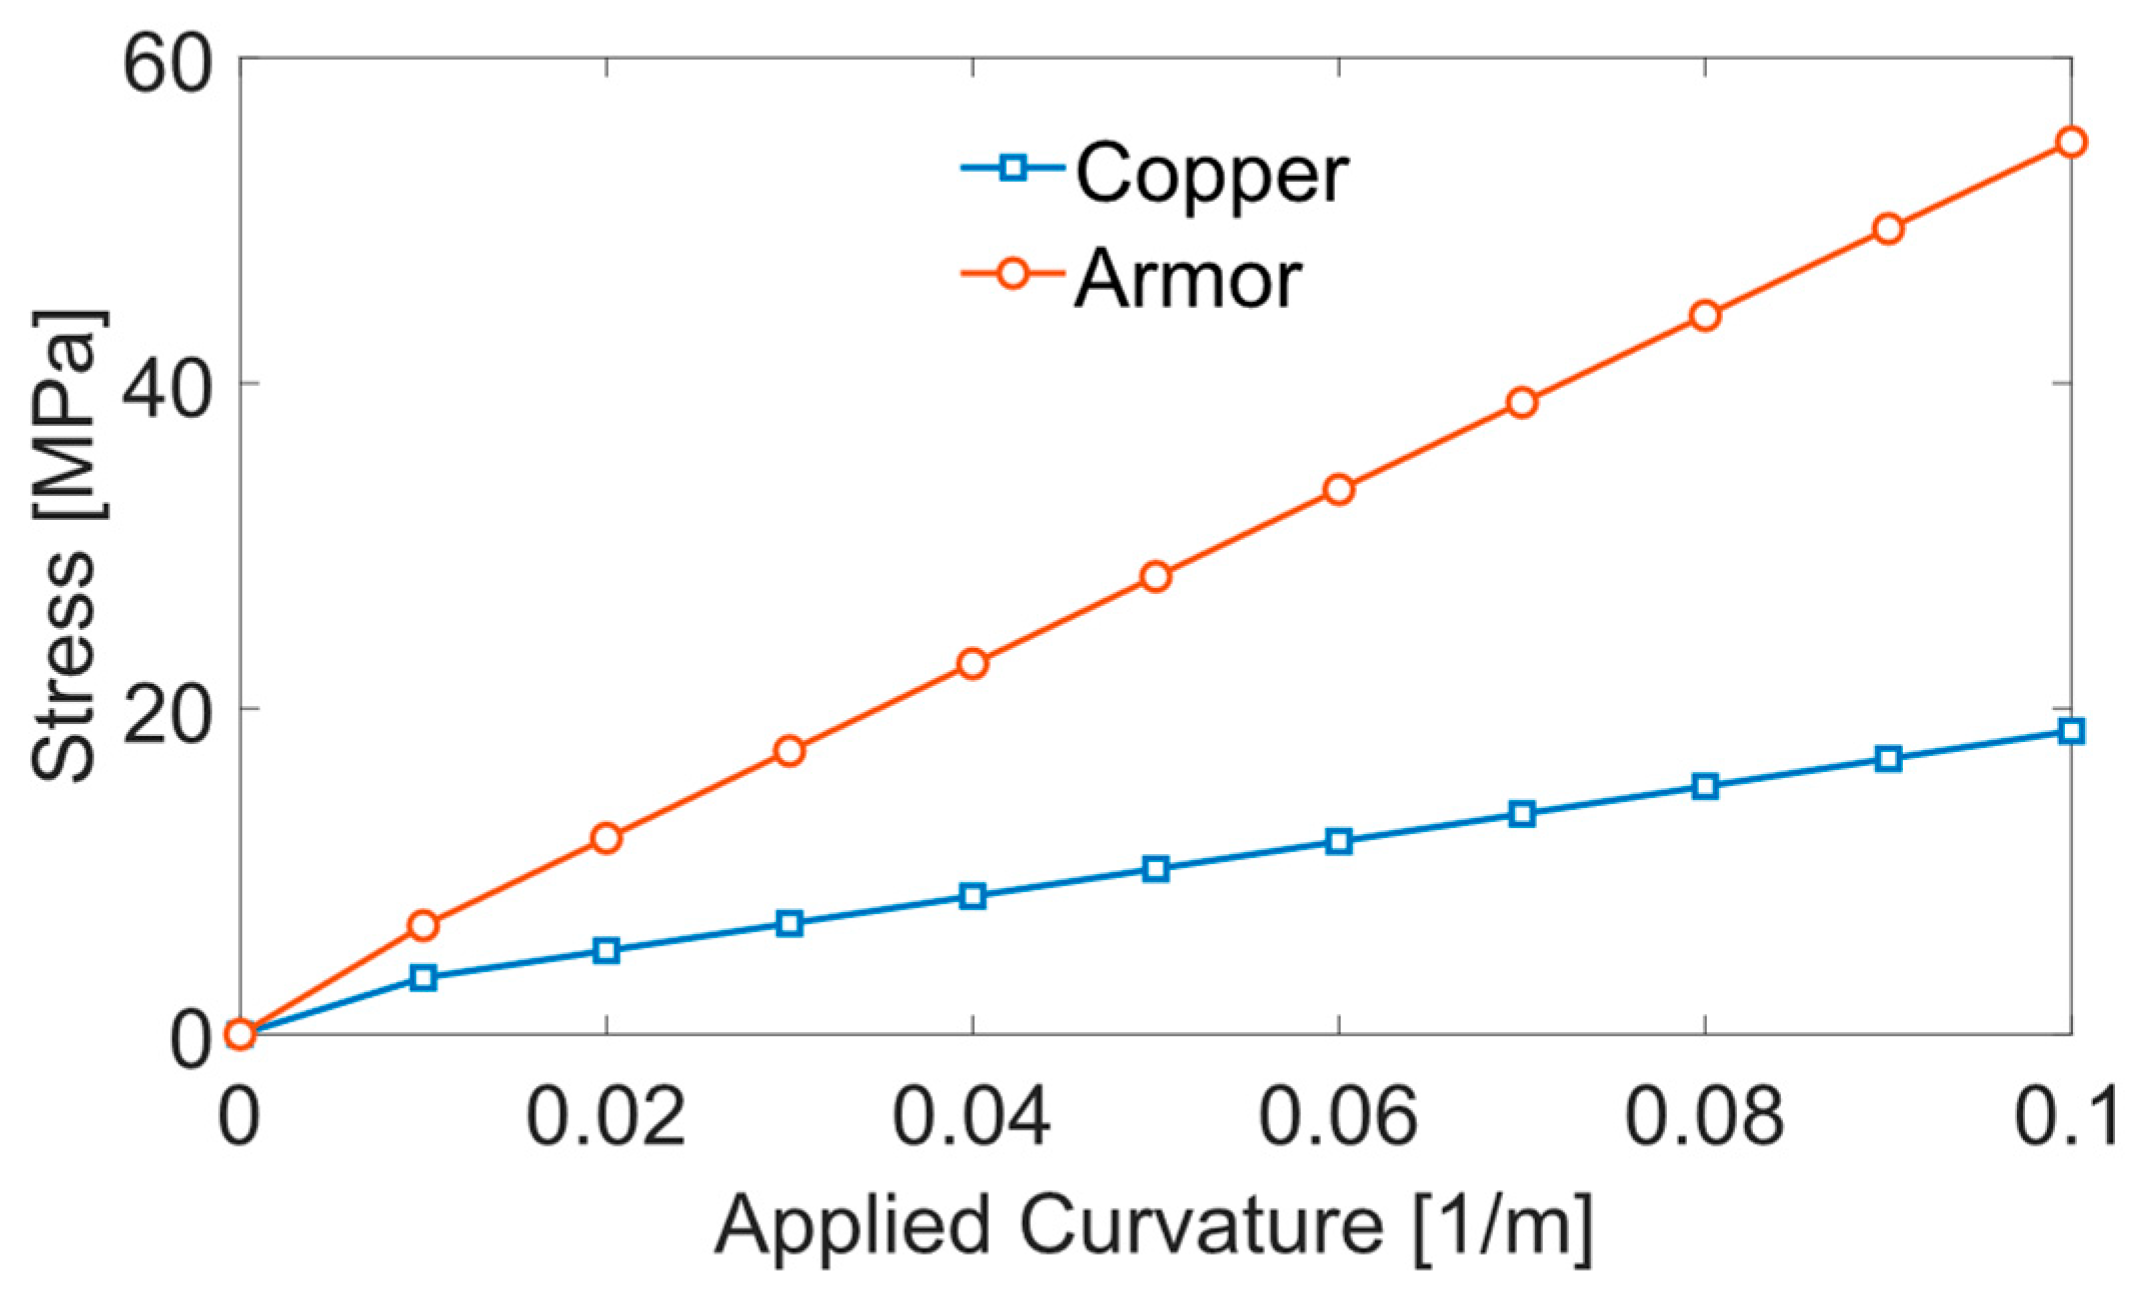
Fatigue analysis is carried out after dynamic simulation. Fatigue life from fatigue analysis indicates the severity of single buoy element failure at different positions. In the fatigue analysis conducted using OrcaFlex, stress factors are selected for damage calculation using the rain flow method for stress cycle counting. Each case undergoes fatigue analysis, focusing on the armor and copper components. The S-N curves for galvanized steel and copper provided in DNV-RP-C203 [21] are employed in the present study for armor wires and copper wires, respectively. Figure 7 and Figure 8 depict the tension–stress and curvature–stress relationships for both components derived using UFLEX. Table 6 outlines the stress factors, representing the gradients of these relationships. These stress factors are utilized to compute stresses using the formula [22]:
where is stress, and are the tension and curvature stress factors, is effective tension, and are the curvature components in the local and directions of the line, and is the circumferential location of the fatigue point.
Figure 7.
Tension–stress relationship for different cable components.
Figure 8.
Curvature–stress relationship for different cable components.
Table 6.
Stress factors.
3. Results and Discussion
There are two subsections in this section based on the number of buoy element failures in the cable. The first subsection presents the analysis for scenarios involving a single buoy failure, followed by the results from both static and dynamic analyses. The second subsection addresses the analysis for scenarios with two buoy failures, also including both static and dynamic analysis results.
3.1. Analysis of Single Buoy Failure Scenarios
3.1.1. Static Analysis
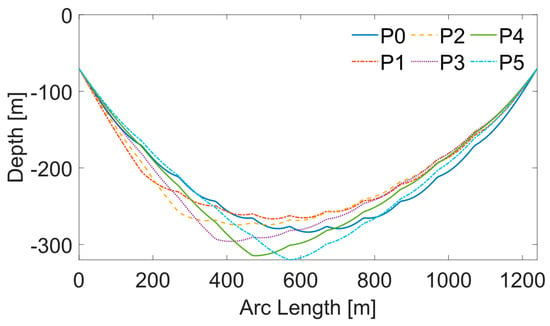
Static analysis is conducted for five suspended inter-array cable configurations with five different buoy failure locations (P1 to P5 in Figure 4). P0 represents the control group, meaning the cable has no buoy failure. Table 7 presents the cable’s highest maximum tension, lowest minimum bending radius (MBR), sea surface clearance, and seabed clearance under each buoy failure condition. It is observed that the seabed clearances of the cable are less than 10 m when a single buoy element fails at positions P4 and P5, failing to meet the acceptance criteria outlined in Table 5.
Table 7.
Static analysis results.
The elevations of the cable are shown in Figure 9. Compared to the original geometry P0, the failure of a single buoy along the cable results in a notable change in its overall geometry, causing asymmetry in the suspended shape. Specifically, when a buoy element fails at either P4 or P5, the cable loses its ability to maintain the desired suspended configuration, exceeding the seabed clearance requirement. Therefore, cases with buoy failure at positions P4 and P5 are omitted from the dynamic analysis. Positions P4 and P5 are essential for preserving the fully suspended configuration of the cable. Because of the symmetry of the buoy positions, positions P6 and P7 are also important for preserving the fully suspended configuration of the cable.
Figure 9.
Vertical excursions of the cable in single buoy element failure scenarios.
3.1.2. Dynamic Analysis
According to the static analysis findings in Section 3.1.1, the remaining buoy failed to sustain the required seabed clearance of the suspended configuration when the single buoy failure occured at positions P4 and P5. Consequently, the dynamic analysis focuses on scenarios where single buoy failures occur at positions P1, P2, and P3 across four ECs outlined in Table 2.
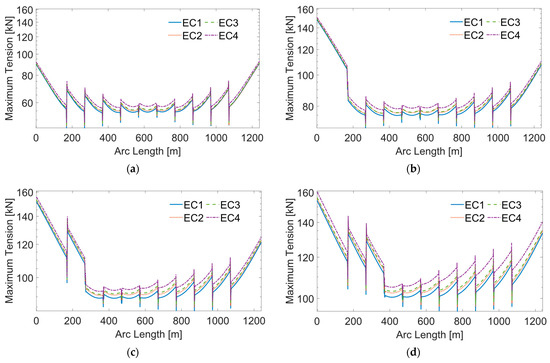
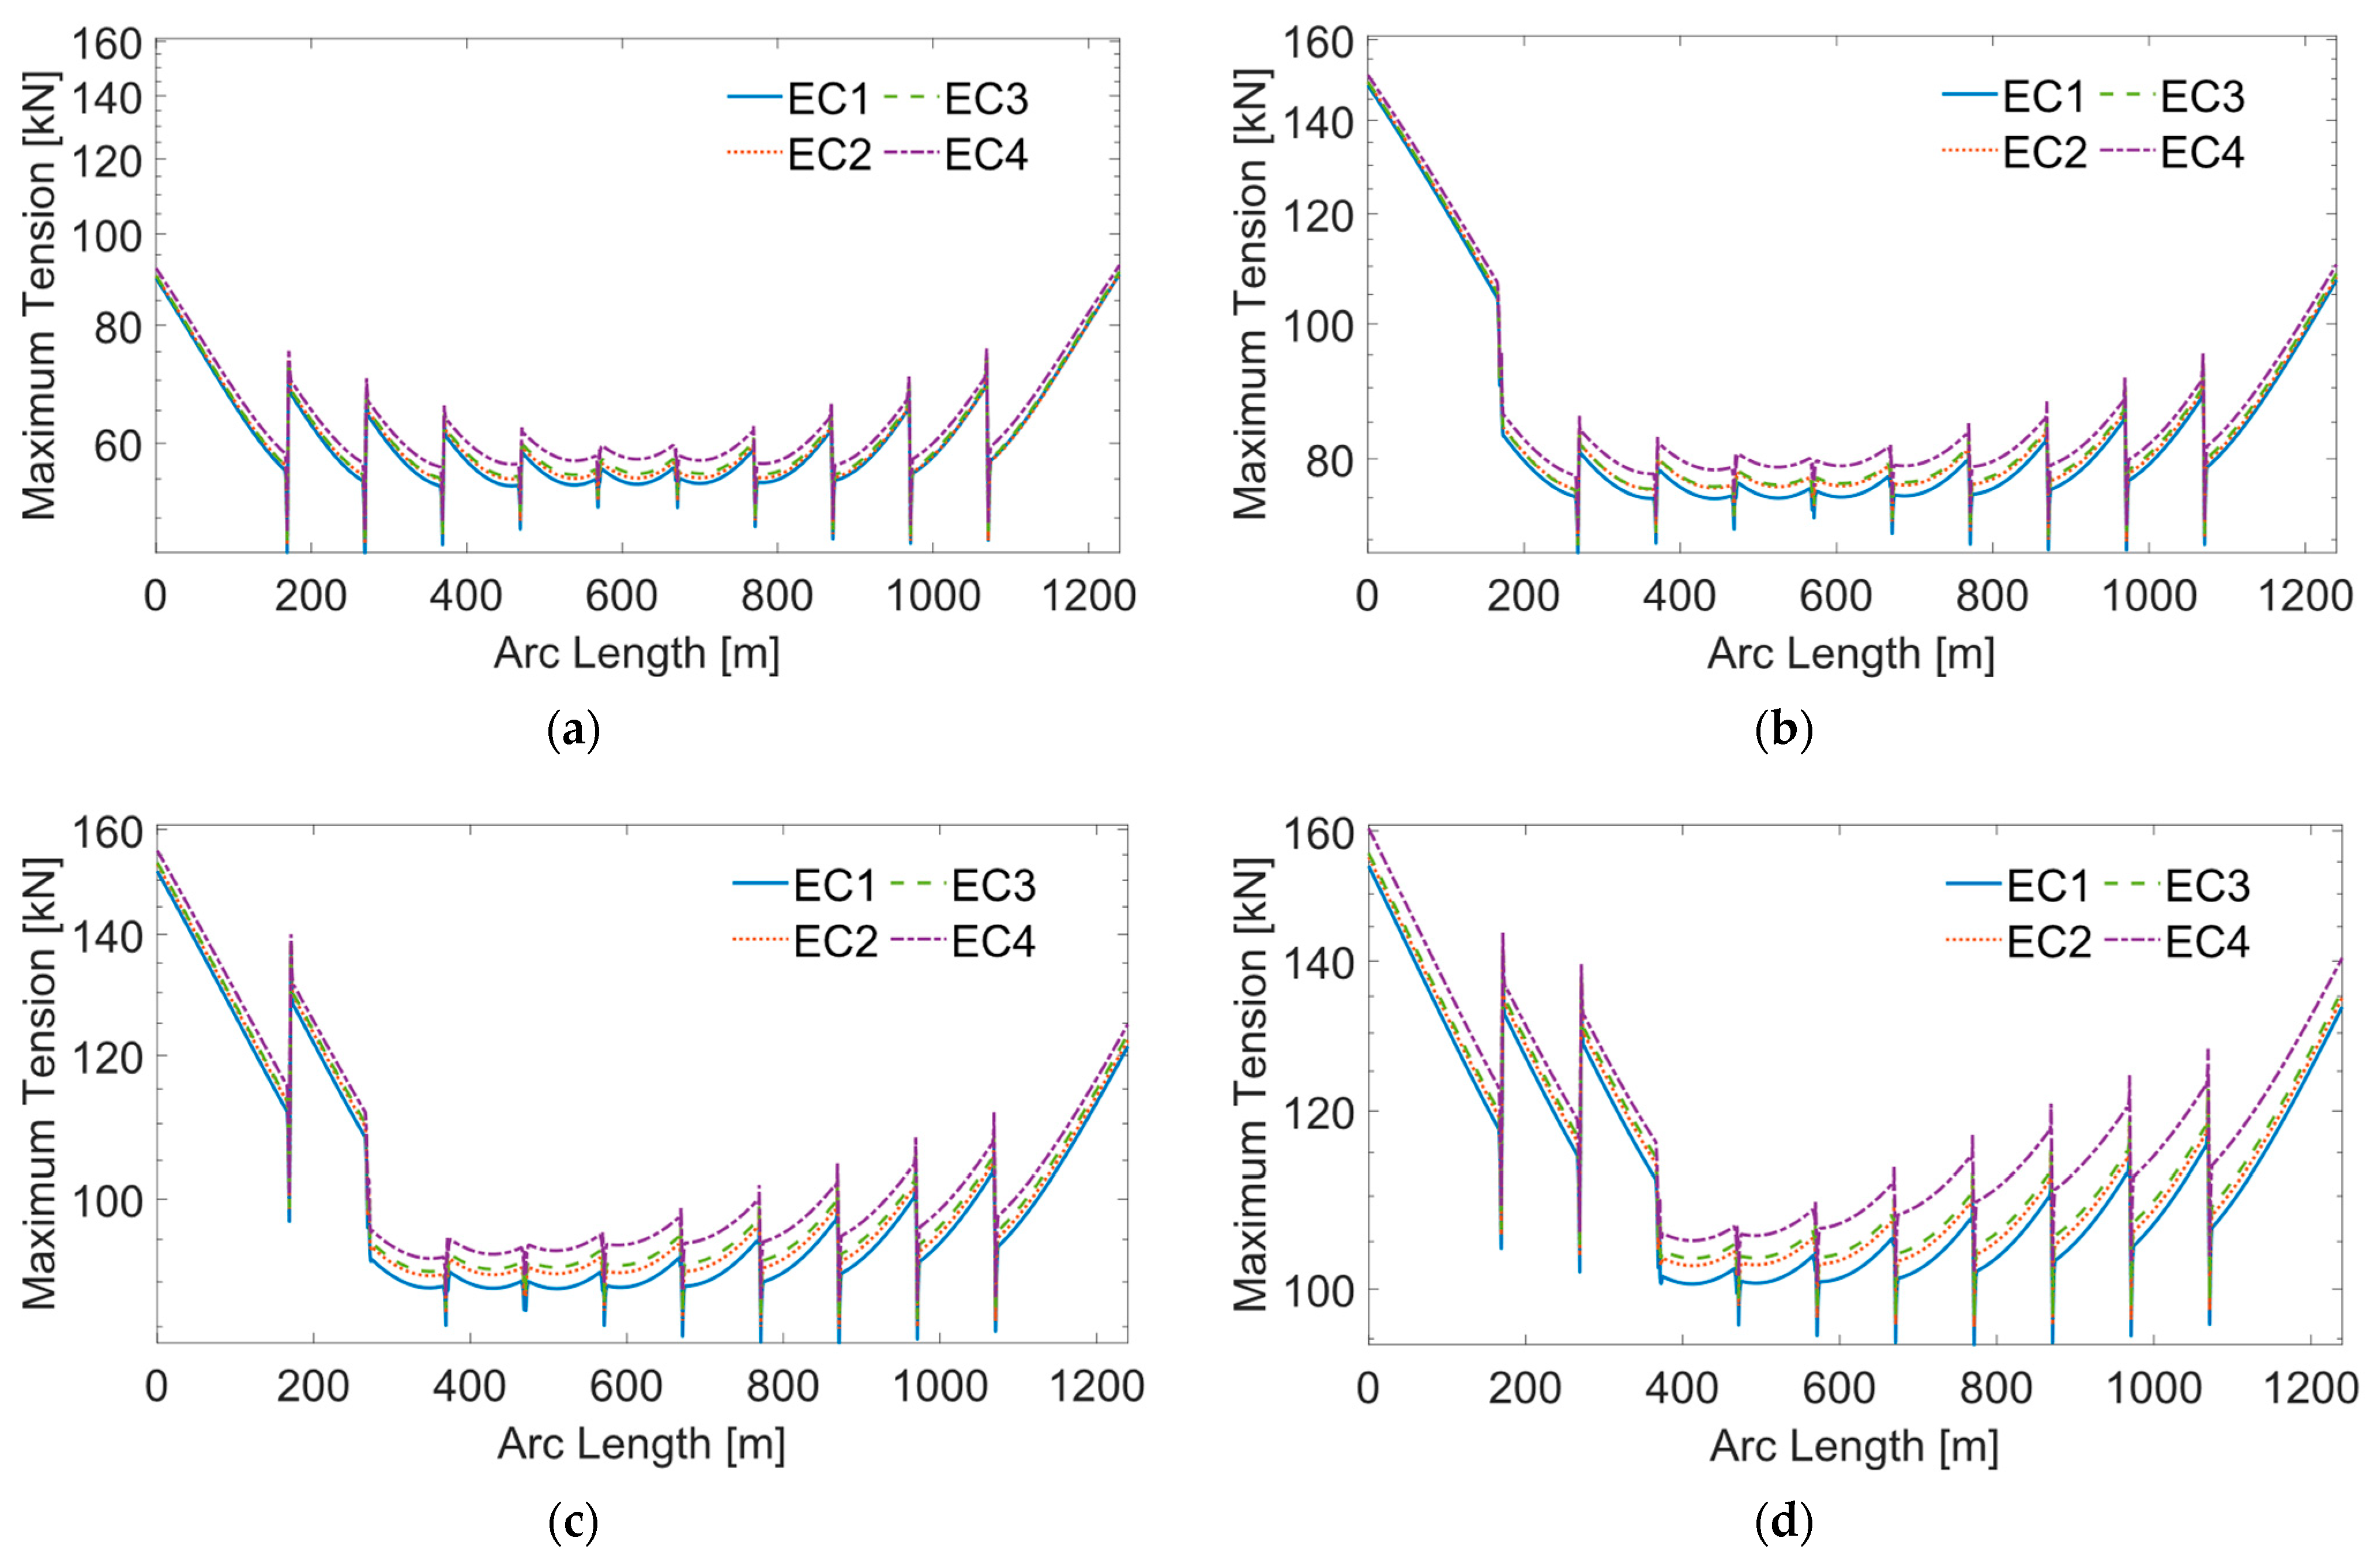
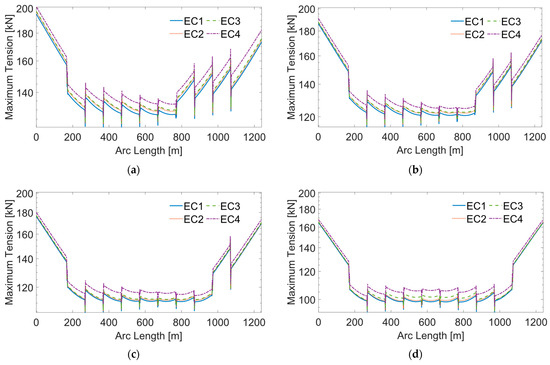
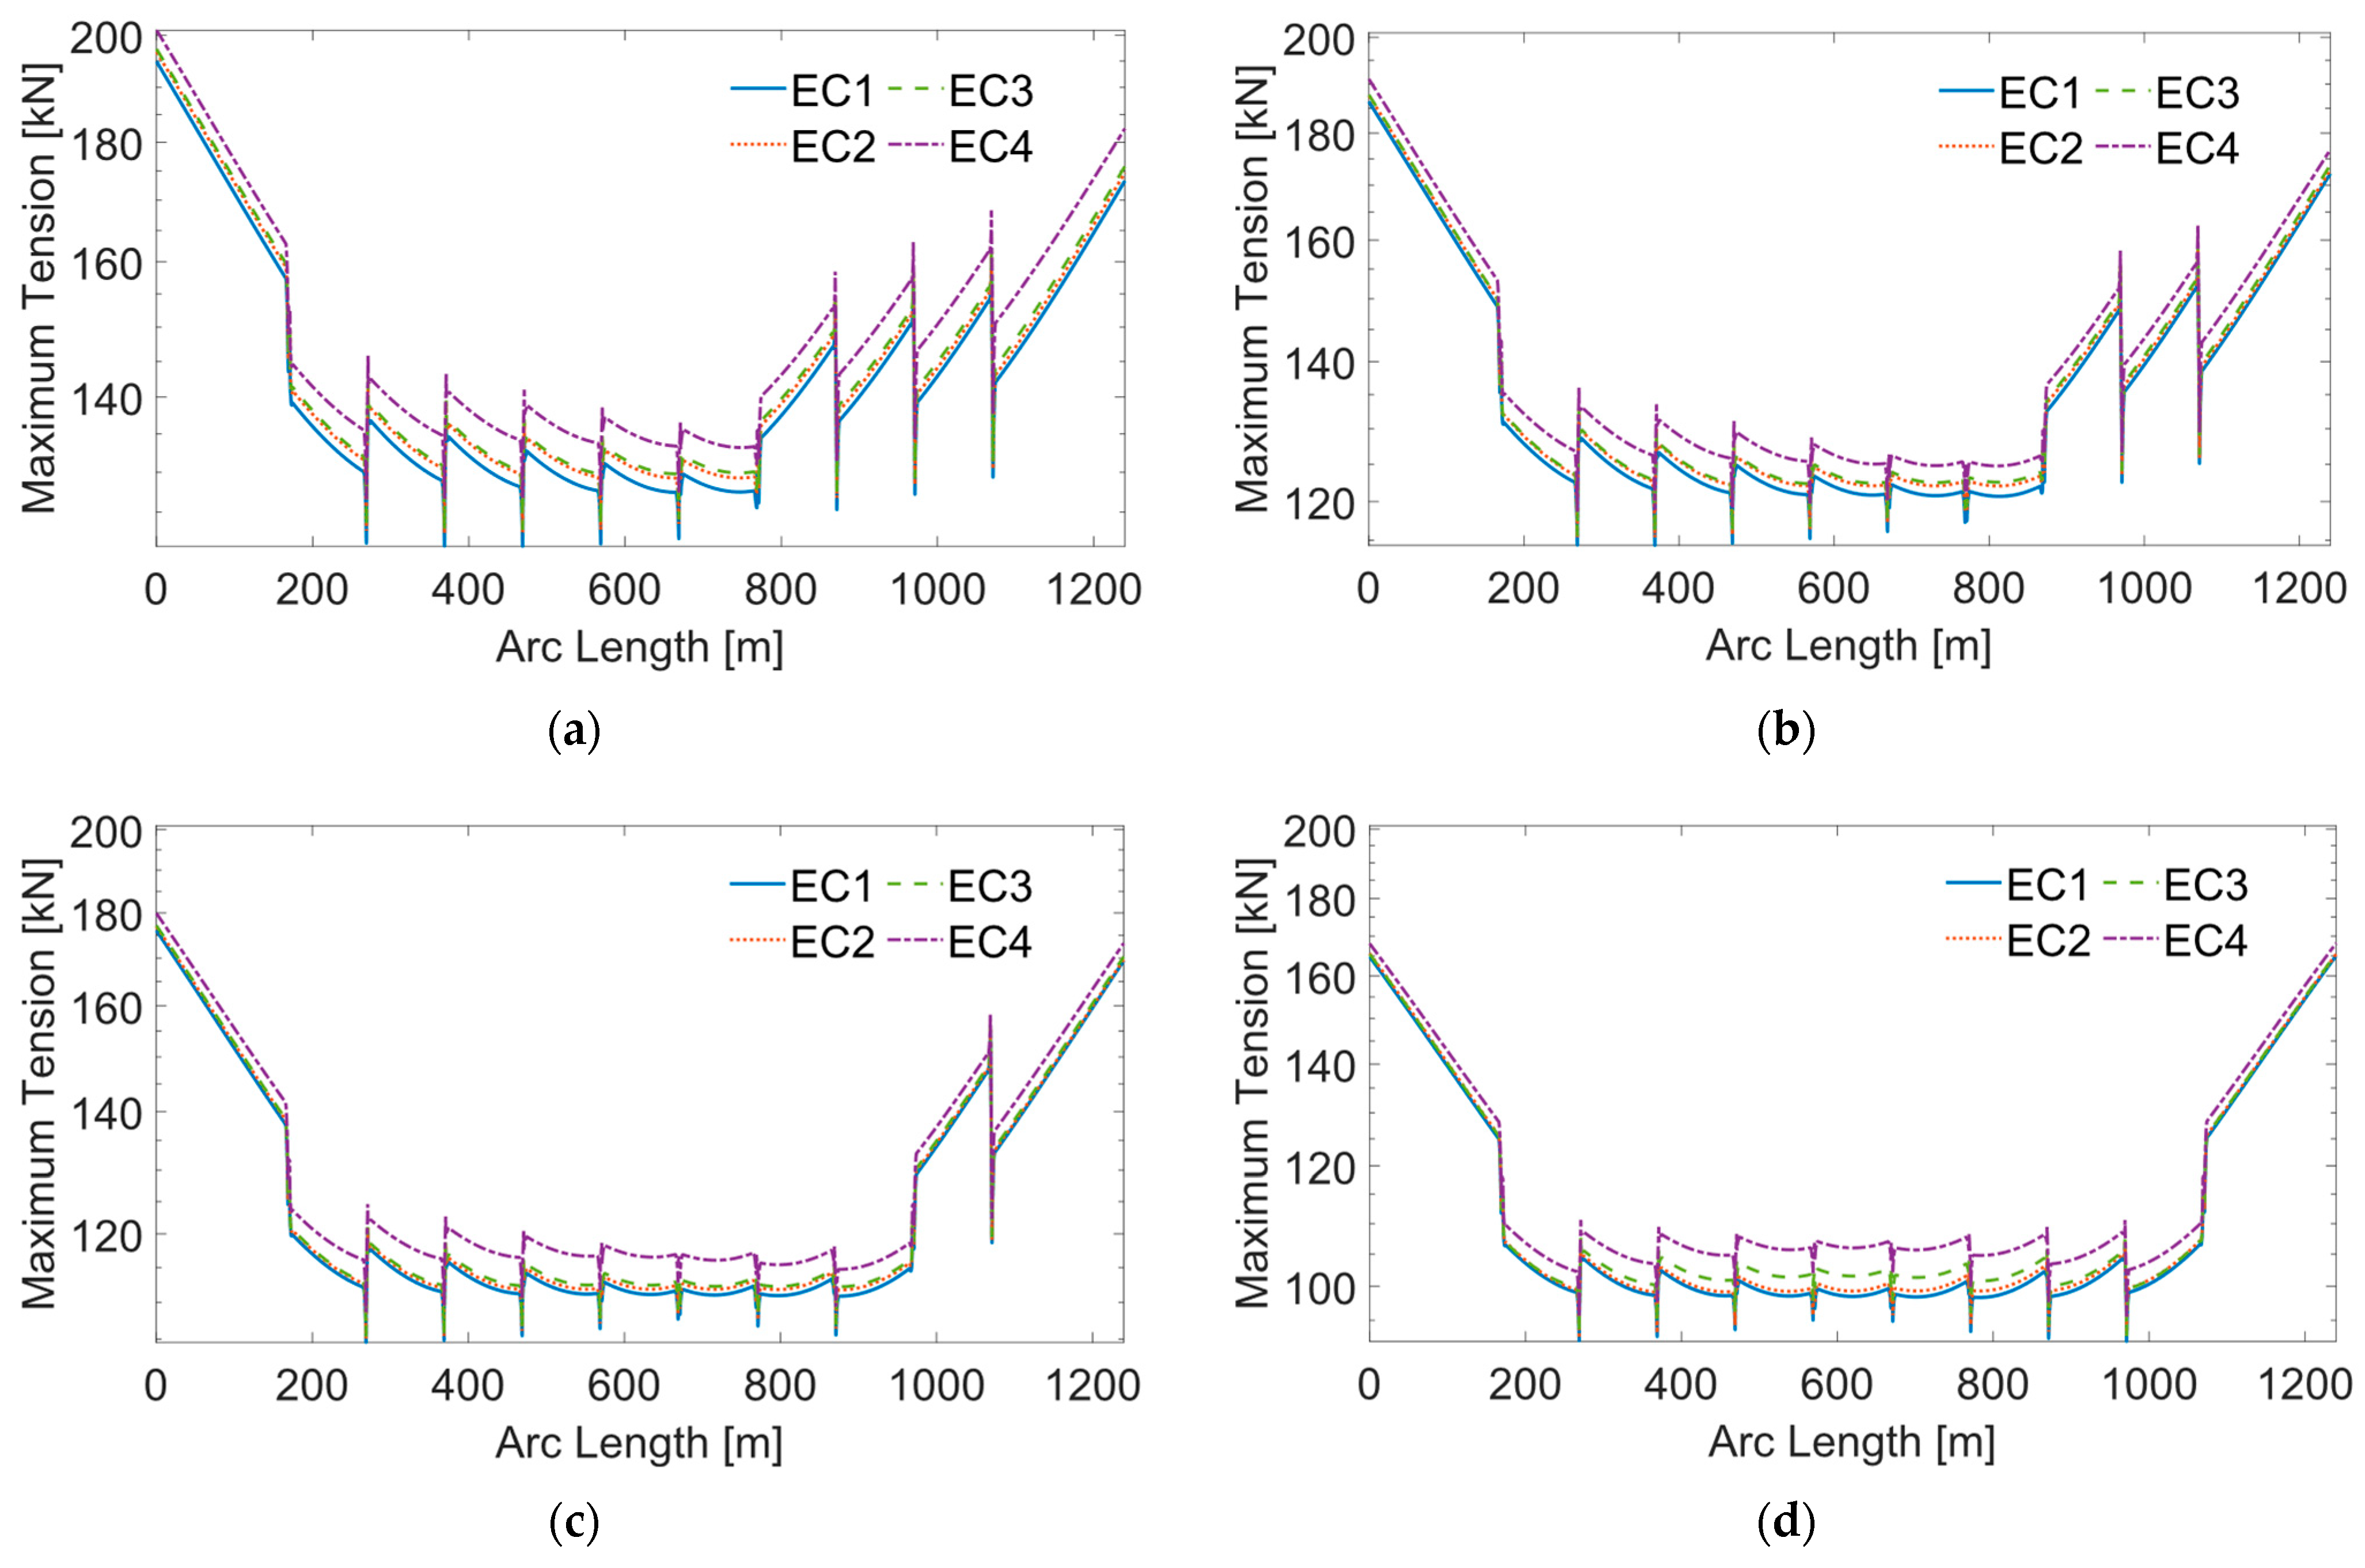
The dynamic analysis evaluates the maximum tension and MBR of the cable to understand the impact of a single buoy failure. Figure 10 illustrates the maximum tension along the cable for each case. When a single buoy fails, the maximum tension at the HOP closest to the failure position significantly increases compared to the intact cable. Specifically, the tension at HOP2 is higher when the failure occurs at P3 compared to P1. The magnitude of tension fluctuations increases when buoy failure occurs, as shown in Figure 10b–d. The shapes of the maximum tension curves are consistent across all ECs, with maximum tension rising as environmental loading becomes more severe.
Figure 10.
Maximum tension along the cable with single buoy element failure at different positions in ECs: (a) no buoy failure P0; (b) single buoy failure at P1; (c) single buoy failure at P2; (d) single buoy failure at P3.
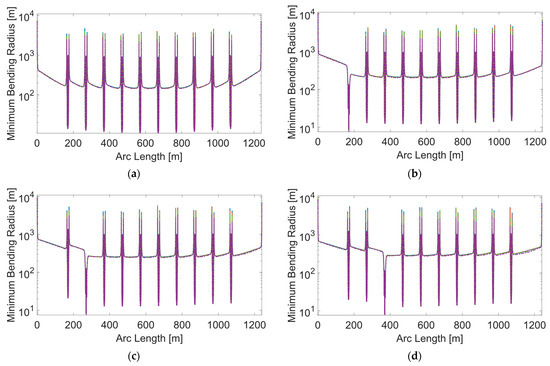
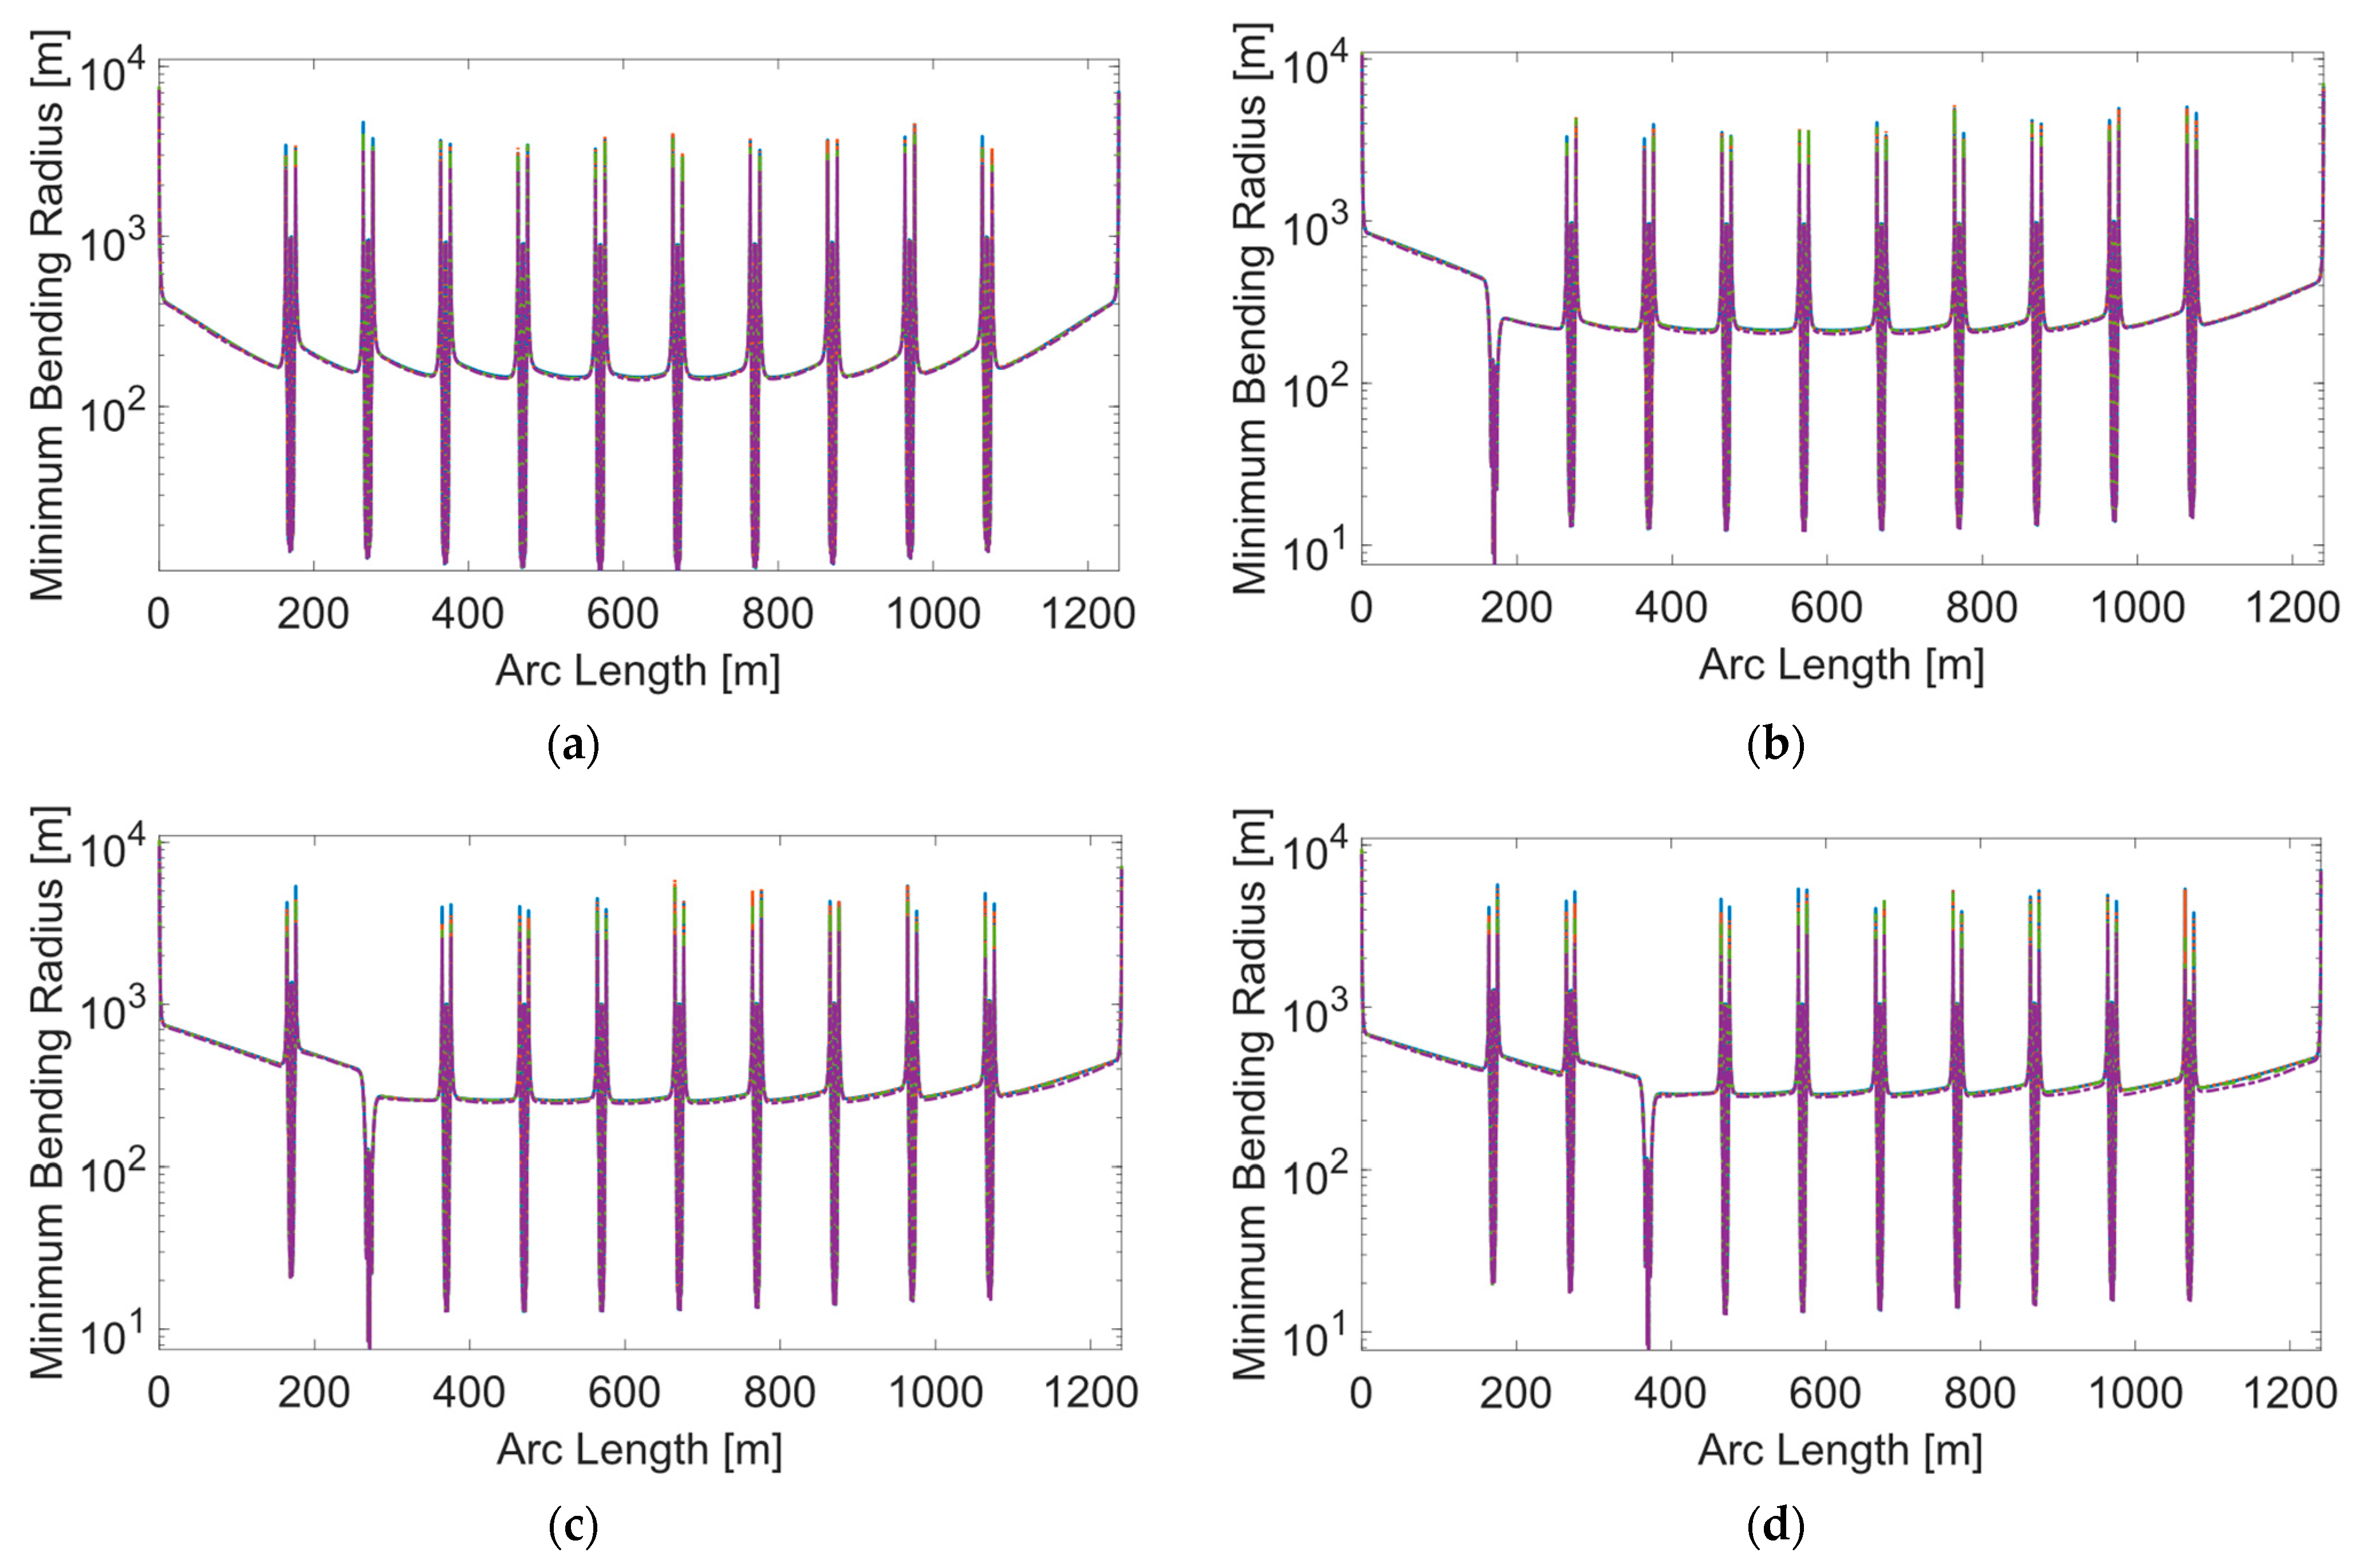
Figure 11 shows the MBR along the cable for scenarios where single buoy failure occurs at positions P1, P2, and P3. The MBR is observed to be the smallest at the position of the buoy failure.
Figure 11.
MBR along the cable with single buoy element failure at different positions in ECs: (a) no buoy failure P0; (b) single buoy failure at P1; (c) single buoy failure at P2; (d) single buoy failure at P3.
Table 8 provides a summary of the dynamic analysis results, listing the highest maximum tension, the lowest MBR, and minimum fatigue life. A color scale is employed to illustrate the performance of different cases, with greener hues indicating better performance. The analysis reveals that when the single buoy element failure occurs at P1, the cable experiences the shortest fatigue life across EC1 to EC3. Consequently, P1 is identified as the most critical position for single buoy element failure. Consequently, the combination of P1 and one of the other positions is selected for further investigation in the study of the cable with two buoy element failures.
Table 8.
Dynamic analysis results.
3.2. Failure Analysis of the Cable with Two Buoy Element Failures
3.2.1. Static Analysis
The static analysis results for scenarios with two buoy element failures are presented in Table 9. When two buoy elements fail at positions ranging from P1 and P2 to P1 and P6, the highest maximum tension of the cable exceeds 200 kN, surpassing the acceptance criteria outlined in Table 5. Moreover, the seabed clearances for failure scenarios at P1 and P5 and P1 and P6 are less than 10 m, failing to meet the specified requirement. Consequently, the four cases with buoy failure at P1 and P7 to P1 and P10, which satisfy the acceptance criteria, are selected for further investigation in the dynamic analysis.
Table 9.
Static analysis results of a cable with two buoy element failures.
3.2.2. Dynamic Analysis
The maximum tension along the cable with two buoy element failures of each case is shown in Figure 12. The fluctuations in maximum tension between the buoy failure positions and the nearest HOP are shown on the y-axis, as exemplified by the three fluctuations from HOP 2 in Figure 12a. This pattern mirrors the variation observed in maximum tension when a single buoy element fails. As the distance between the positions of two buoy element failures increases, the maximum tension at HOP 1 decreases. The tension is more evenly distributed to both HOPs when two buoy elements fail at positions P1 and P10.
Figure 12.
Maximum tension along the cable with two buoy element failures at different positions in ECs: (a) two buoy element failures at P1 and P7; (b) two buoy element failures at P1 and P8; (c) two buoy element failures at P1and P9; (d) two buoy element failures at P1 and P10.
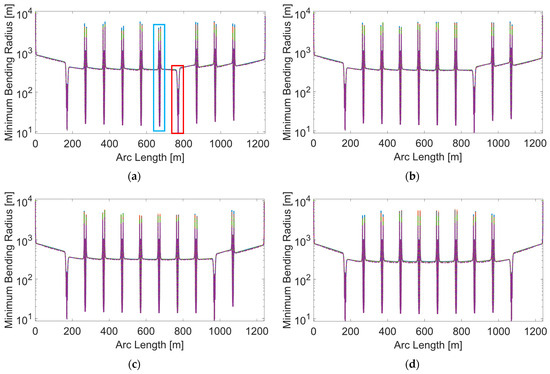
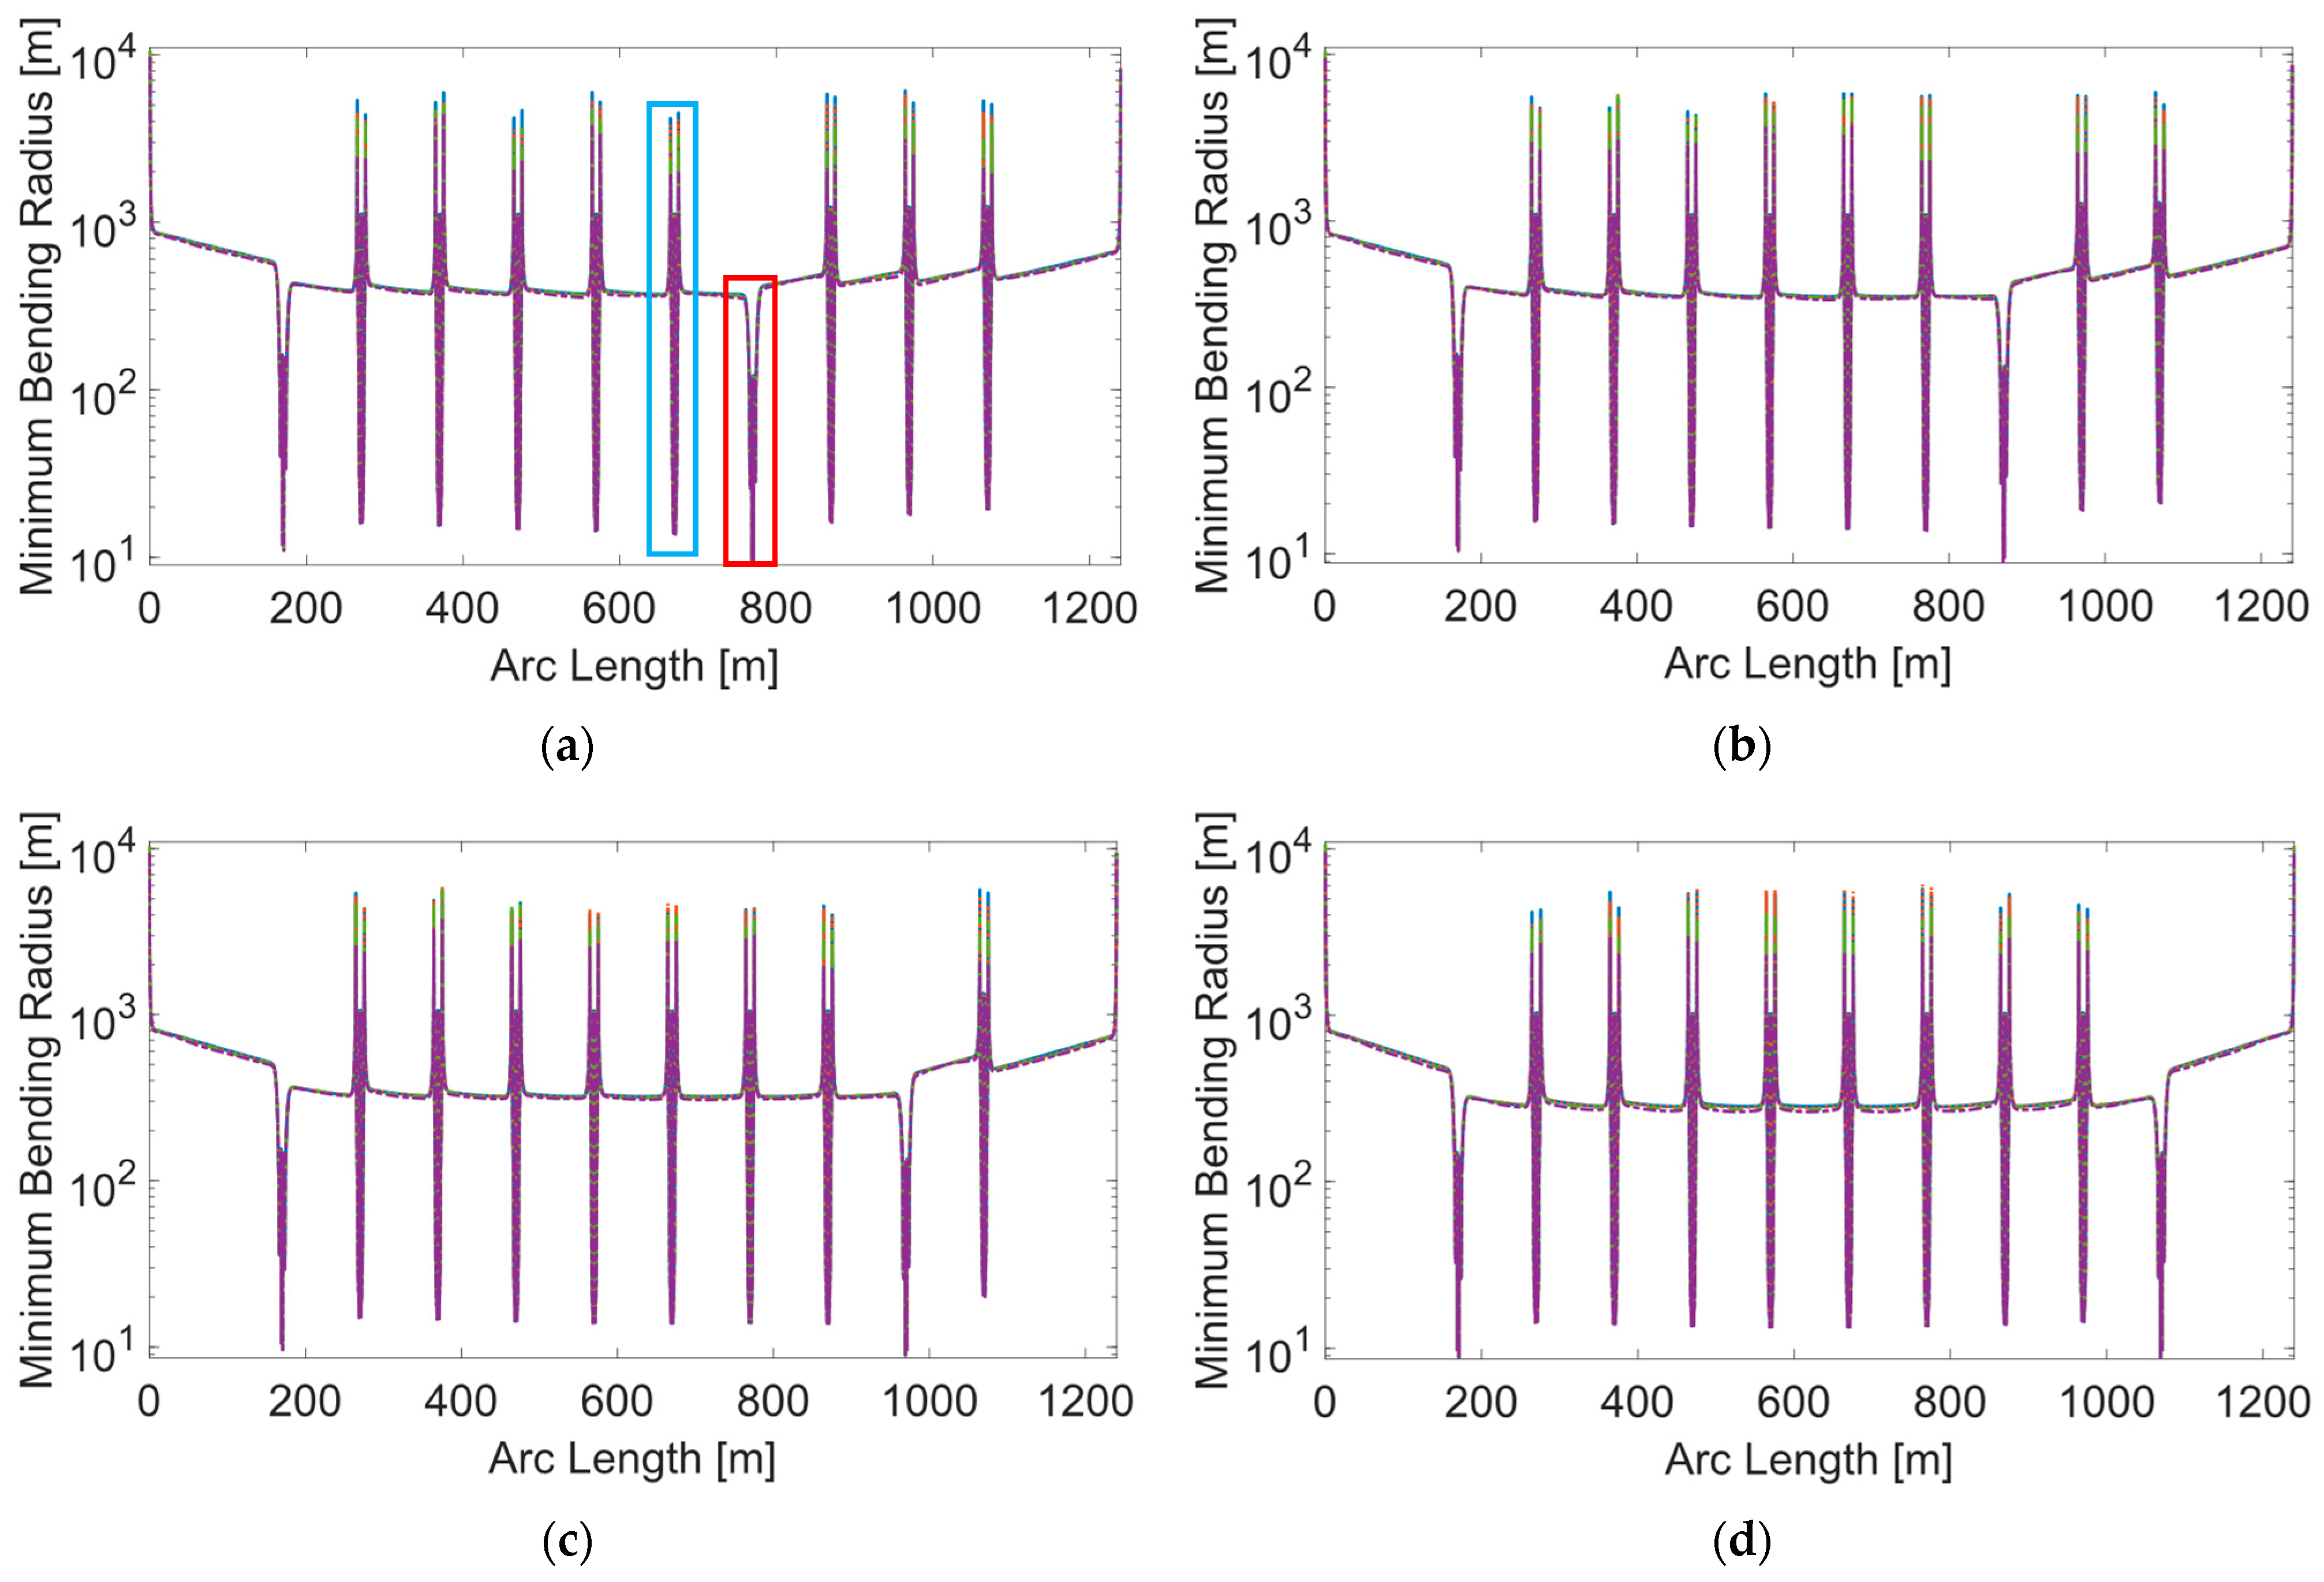
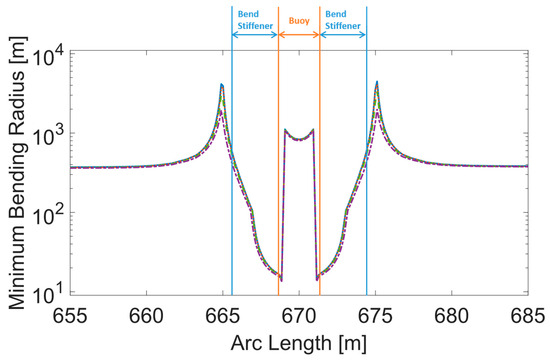
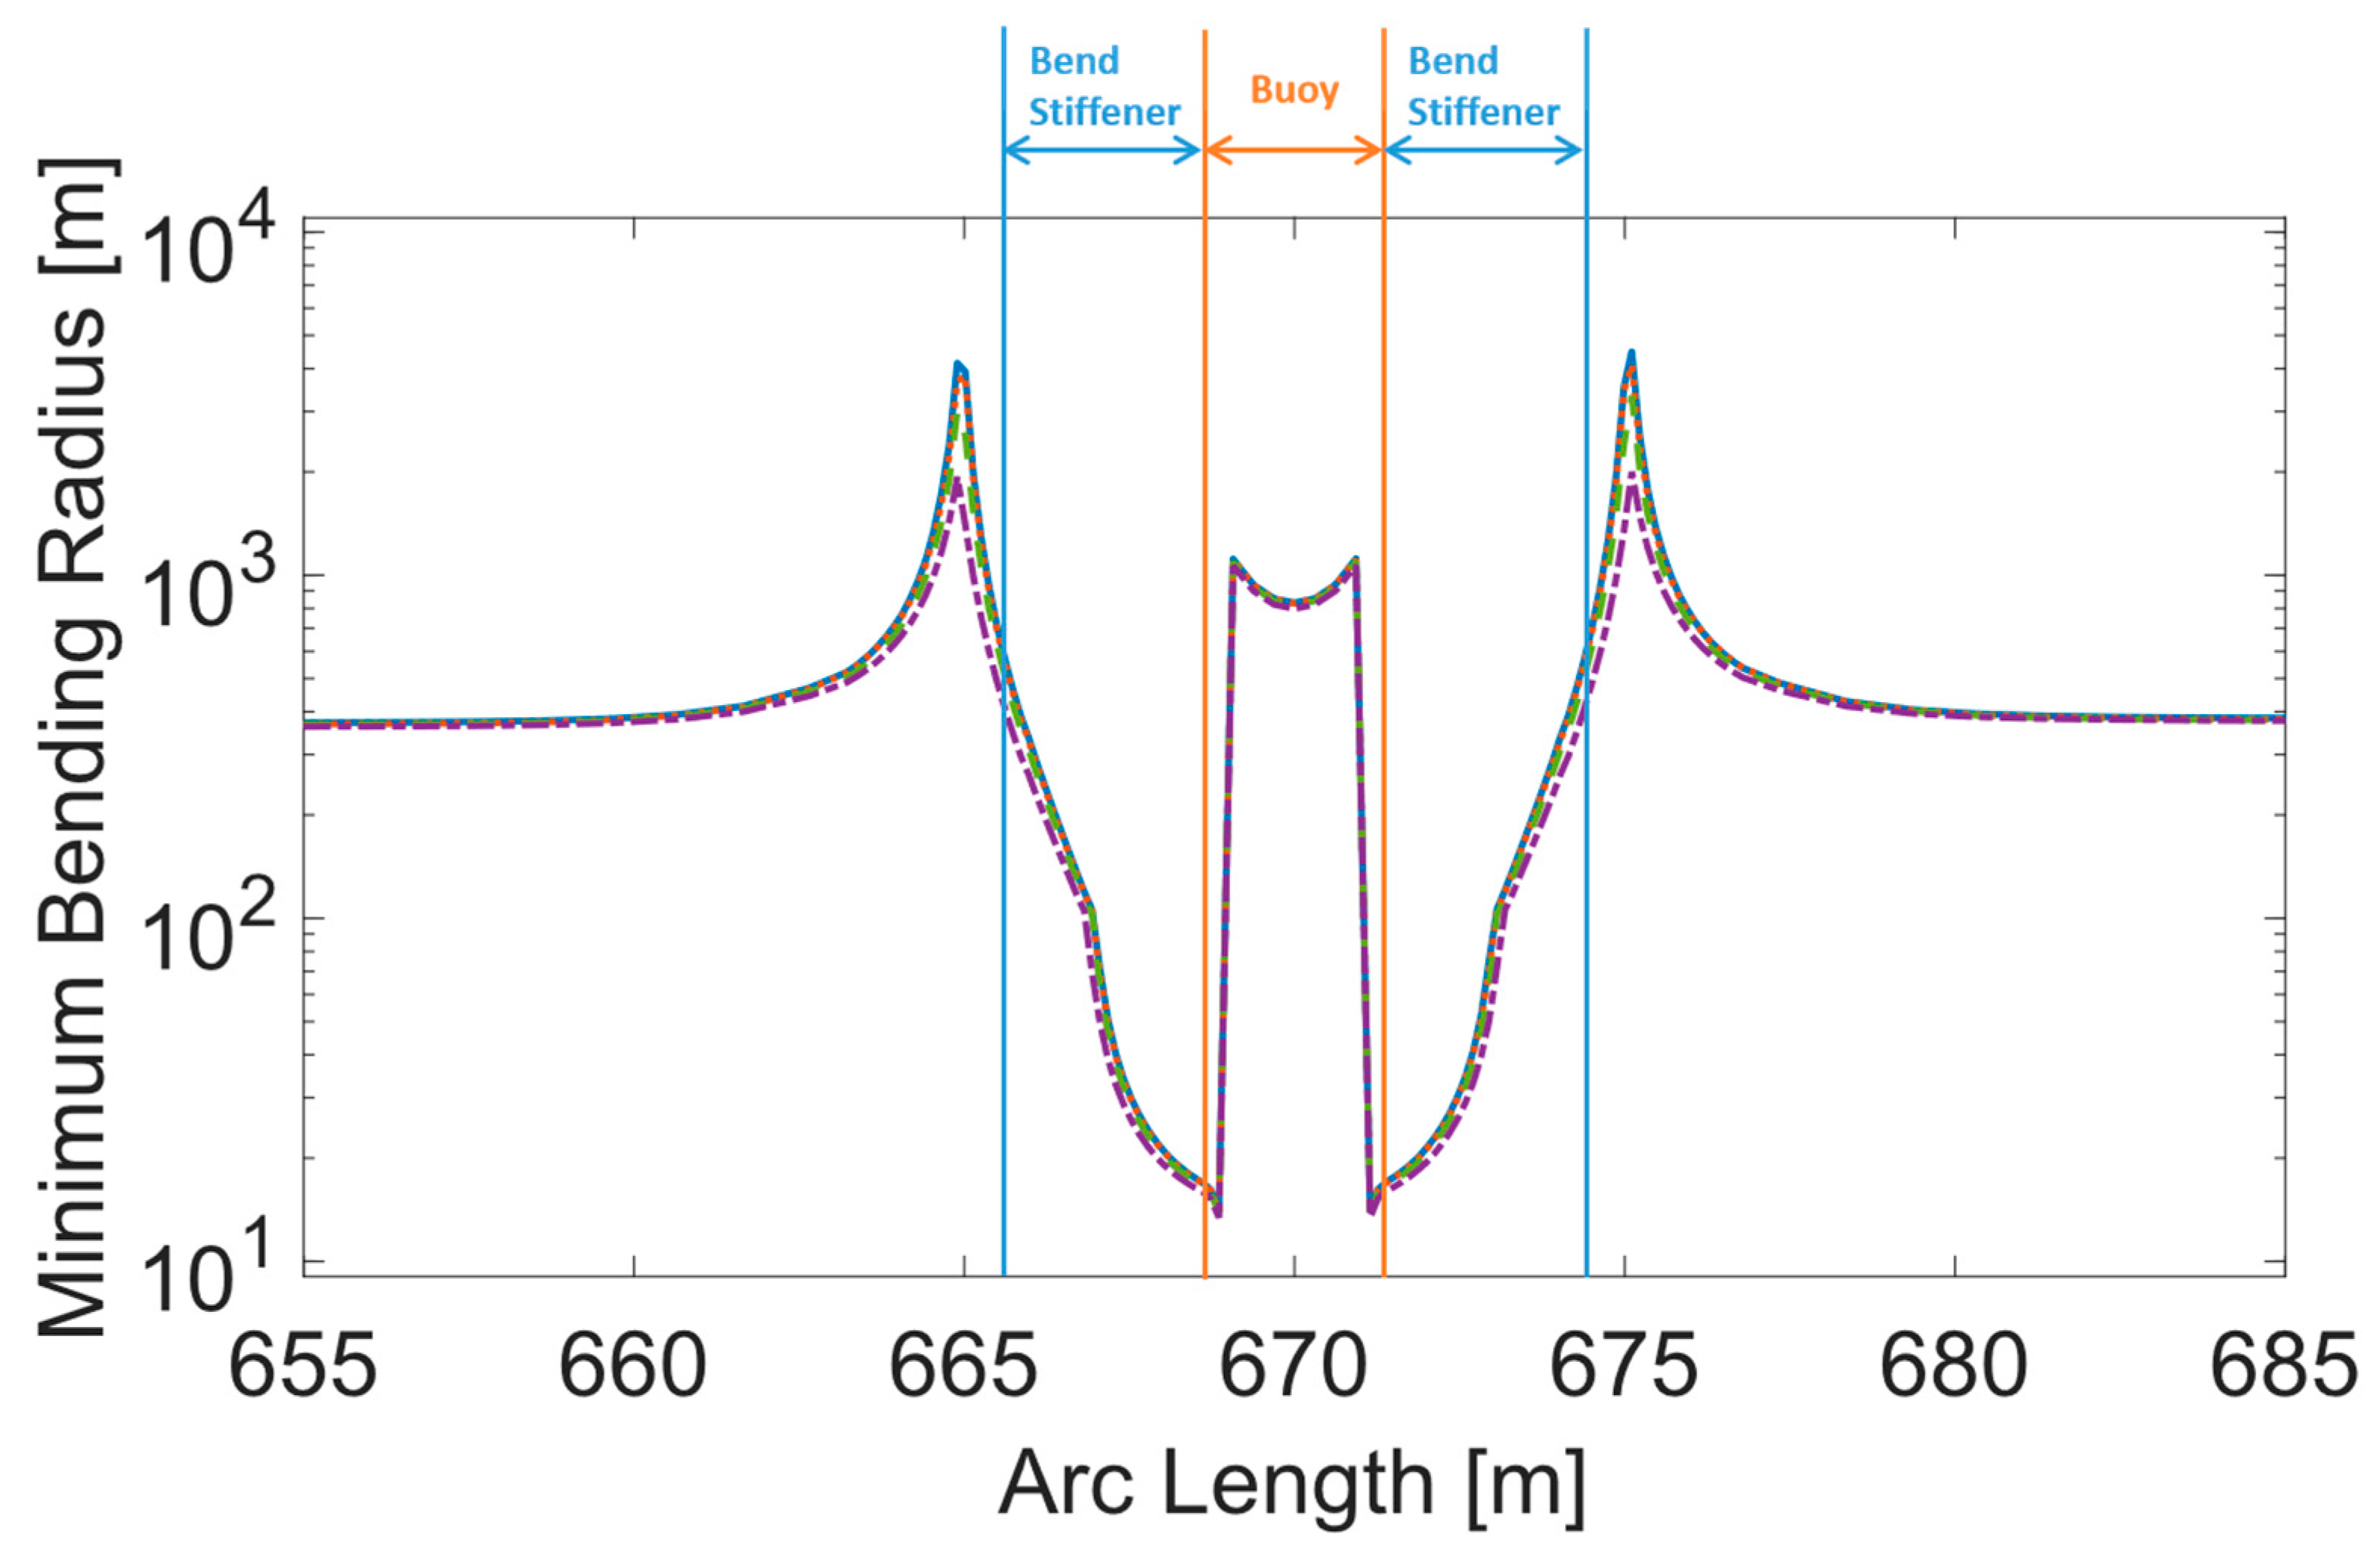
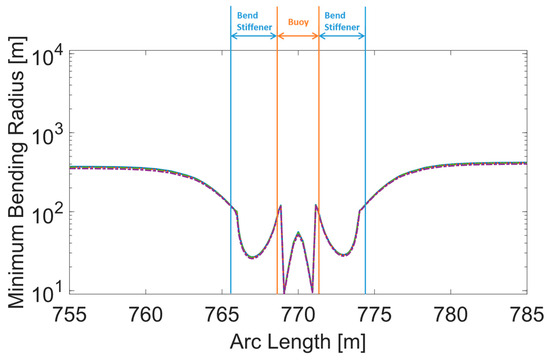
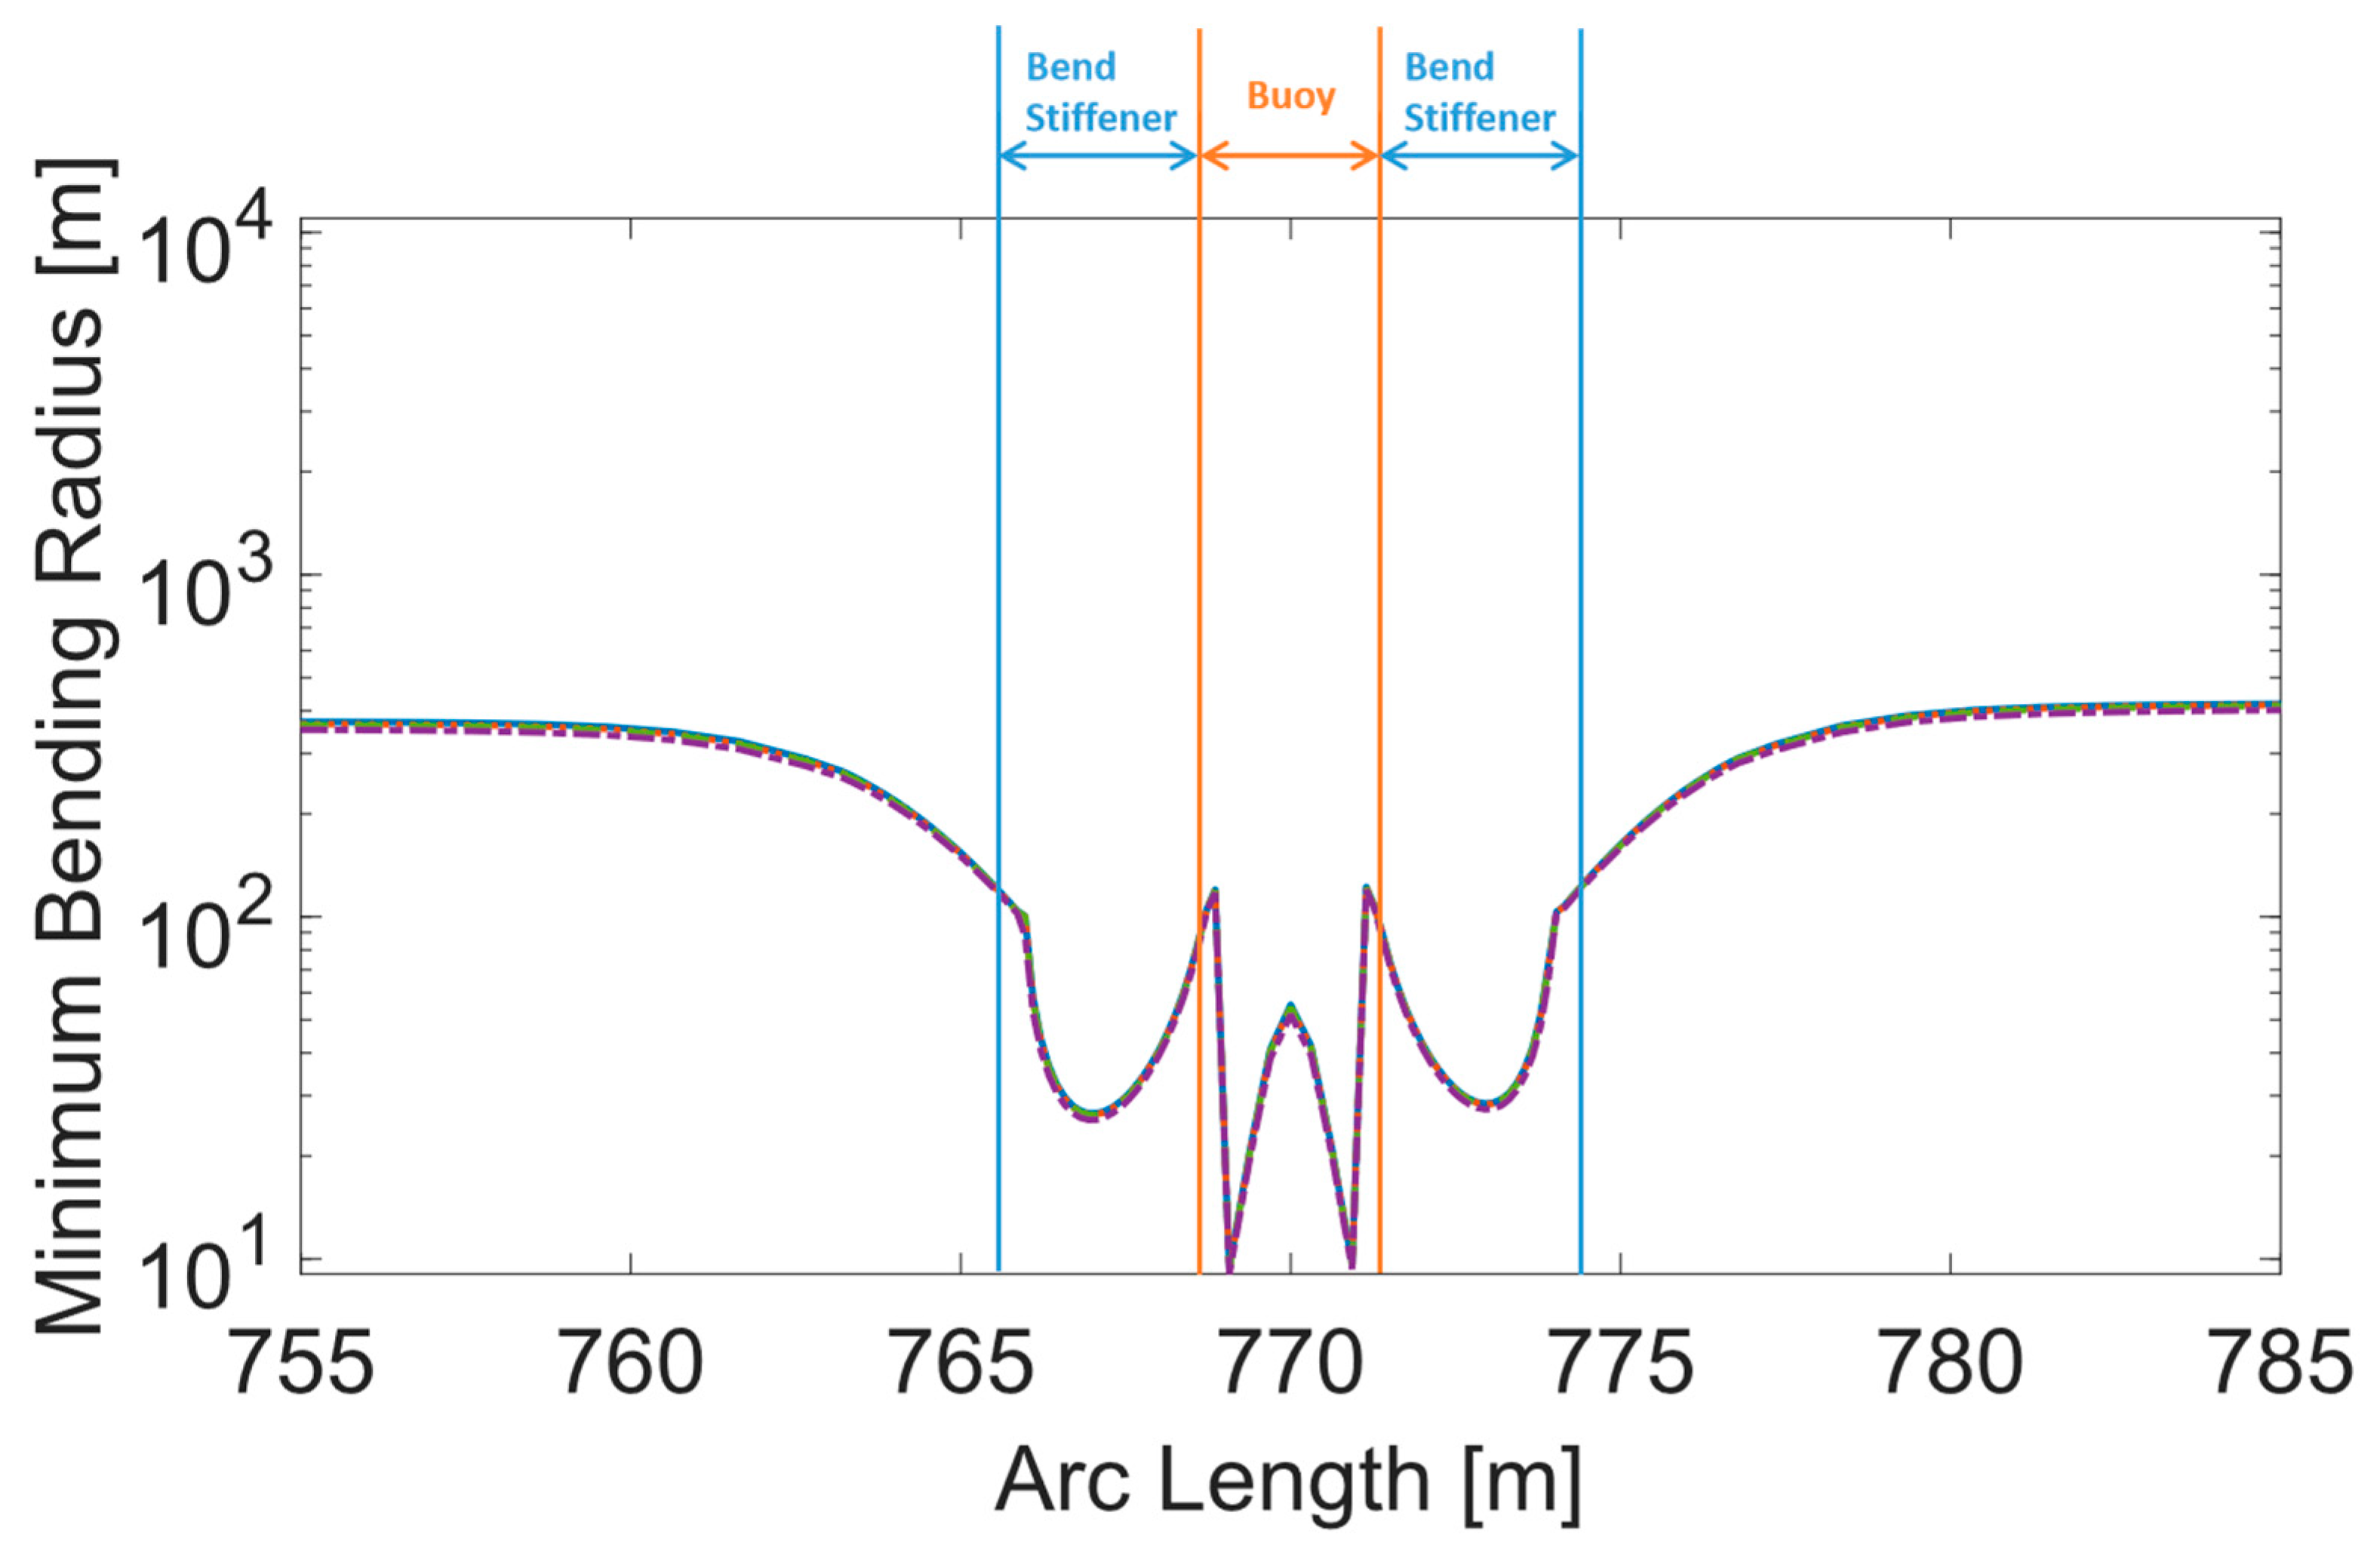
Figure 13 shows the MBR along the cable for cases with two buoy element failures. Notably, the smallest MBR of the cable is observed at the buoy failure locations. Figure 14 and Figure 15 provide close-up views of MBR variations in sections with and without buoy element failures. The magnified area is denoted with the blue box and the red box in Figure 13a. The MBR is lowest at the joint between the buoy element and the bend stiffeners, with a significant decrease observed in sections affected by buoy failure due to the absence of geometric constraints imposed by the buoy element.
Figure 13.
MBR along the cable with two buoy element failures at different positions in ECs: (a) two buoy element failures at P1 and P7; (b) two buoy element failures at P1 and P8; (c) two buoy element failures at P1 and P9; (d) two buoy element failures at P1 and P10.
Figure 14.
MBR of a section without buoy element failure.
Figure 15.
MBR of a section with buoy element failure.
Detailed comparison of MBR in areas affected by buoy failure versus unaffected sections are presented in Figure 14 and Figure 15.
Table 10 summarizes the dynamic analysis results for scenarios with two buoy element failures, showing the highest maximum tension, the lowest MBR, and fatigue life. The maximum tension of the cable increases by up to 54.37% compared to single buoy failure at P1. The MBR decreases by 13.85% to 19.73% in EC1, while other ECs show an increase. Regarding fatigue life, the minimum fatigue lives in most cases are longer than the corresponding fatigue lives from single buoy failure analysis.
Table 10.
Dynamic analysis results of a cable with two buoy element failures.
4. Conclusions
The present study analyzed the maximum tension, minimum bend radius (MBR), and fatigue life of a fully suspended power cable under various buoy element failure scenarios to investigate the impact on the cable performance. The conclusions are summarized as follows:
- Single Buoy Element Failure:
- Single buoy failures result in significant increases in maximum tension at HOPs and along the cable’s length. The increase in maximum tension ranges from 66.79% to 77.07%.
- The MBR value is the smallest at the position of the single buoy element failure.
- Position P1 is the most critical for single buoy failure scenarios, resulting in the largest decrease in overall fatigue life of the cable. The decrease in fatigue life ranges from 83.87% to 24.28%.
These findings highlight the importance of a robust buoy element design for a durable suspended inter-array power cable configuration.
- 2.
- Two Buoy Element Failures:
- Significant changes occur in maximum tension, MBR, and fatigue life when two buoy elements fail compared to single buoy element failure scenarios.
- Maximum tension of the cable increases significantly, posing potential risks to the structural integrity of the cable.
- MBR decreases in certain environmental conditions while showing an increase in others, indicating complex interactions between buoy element failures and environmental factors.
These findings underscore the importance of considering multiple failure scenarios in the design and maintenance of suspended inter-array power cable systems for floating offshore wind applications.
Author Contributions
Conceptualization, D.L., M.J.J., I.B.A. and M.C.O.; methodology, D.L., M.J.J., I.B.A. and M.C.O.; software, D.L., M.J.J. and I.B.A.; validation, D.L., M.J.J., I.B.A. and M.C.O.; formal analysis, D.L., M.J.J., I.B.A. and M.C.O.; investigation, D.L., M.J.J., I.B.A. and M.C.O.; resources, M.C.O.; writing—original draft preparation, D.L.; writing—review and editing, D.L., M.J.J., I.B.A. and M.C.O.; visualization, D.L. and M.J.J.; supervision, M.J.J., I.B.A. and M.C.O.; project administration, M.C.O.; funding acquisition, M.C.O. All authors have read and agreed to the published version of the manuscript.
Funding
The authors also acknowledge the support from ImpactWind SouthWest—RCN project number 332034—financed by the Research Council of Norway and the industry partners.
Institutional Review Board Statement
Not applicable.
Informed Consent Statement
Not applicable.
Data Availability Statement
Data are contained within the article.
Conflicts of Interest
Author Izwan Ahmad was employed by the company IKM Ocean Design AS. The remaining authors declare that the research was conducted in the absence of any commercial or financial relationships that could be construed as a potential conflict of interest.
References
- Ahmad, I.B.; Schnepf, A.; Ong, M.C. An optimisation methodology for suspended inter-array power cable configurations between two floating offshore wind turbines. Ocean. Eng. 2023, 278, 114406. [Google Scholar] [CrossRef] [Scilit]
- Rapha, J.I.; Domínguez, J.L. Suspended cable model for layout optimisation purposes in floating offshore wind farms. J. Phys. Conf. Ser. 2021, 2018, 012033. [Google Scholar] [CrossRef] [Scilit]
- Andreassen, J.S. Designing fiber optic dynamic riser cables for offshore applications. In Proceedings of the SubOptic Conference & Convention, Yokohama, Japan, 11–14 May 2010. [Google Scholar]
- Yue, B.; Walters, D.; Yu, W.; Raghavan, K.; Thompson, H. Lazy wave SCR on turret moored FPSO. In Proceedings of the 21st International Offshore and Polar Engineering Conference (ISOPE), Maui, HI, USA, 19–24 June 2011. Paper No. I-11-561. [Google Scholar]
- Rentschler, M.U.T.; Adam, F.; Chainho, P.; Michels, J.; Sauder, T.; Sayer, F. Parametric study of dynamic inter-array cable systems for floating offshore wind turbines. Mar. Syst. Ocean. Technol. 2020, 15, 16–25. [Google Scholar] [CrossRef] [Scilit]
- Schnepf, A.; Devulder, A.; Johnsen, Ø.; Ong, M.C.; Lopez-Pavon, C. Numerical investigations on suspended power cable configurations for floating offshore wind turbines in deep water powering an FPSO. J. Offshore Mech. Arct. Eng. 2023, 145, 030904. [Google Scholar] [CrossRef] [Scilit]
- Schnepf, A.; Lopez-Pavon, C.; Ong, M.C.; Yin, G.; Johnsen, Ø. Feasibility study on suspended inter-array power cables between two spar-type offshore wind turbines. Ocean. Eng. 2023, 277, 114215. [Google Scholar] [CrossRef] [Scilit]
- Beier, D.; Ong, M.C.; Janocha, M.J.; Ye, N. Application of suspended inter-array power cables in floating offshore wind farms. Appl. Ocean. Res. 2024, 147, 103991. [Google Scholar] [CrossRef] [Scilit]
- Ech-Cheikh, F.; Drissi-Habti, M. Numerical Modeling of the Micromechanics Damage of an Offshore Electrical High-Voltage Phase. Energies 2023, 16, 5422. [Google Scholar] [CrossRef] [Scilit]
- Matine, A.; Drissi-Habti, M. On-Coupling Mechanical, Electrical and Thermal Behavior of Submarine Power Phases. Energies 2019, 12, 1009. [Google Scholar] [CrossRef] [Scilit]
- Jonkman, J. Definition of the Floating System for Phase IV of OC3 (NREL/TP-500-47535); National Renewable Energy Laboratory: Golden, CO, USA, 2010. [CrossRef] [Scilit]
- Cheynet, E.; Li, L.; Jiang, Z. Metocean conditions at two Norwegian sites for development of offshore wind farms. Renew. Energy 2024, 224, 120184. [Google Scholar] [CrossRef] [Scilit]
- Kelley, N.; Jonkman, B. Overview of the TurbSim Stochastic Inflow Turbulence Simulator (NREL/TP-500-41137); National Renewable Energy Laboratory: Golden, CO, USA, 2007. [CrossRef] [Scilit]
- DNV-RP-C205; Environmental Conditions and Environmental Loads. DNV: Baerum, Norway, 2019.
- NORSOK N-003; Actions and Action Effects. NORSOK: Lysaker, Norway, 2017.
- IEC 63026; Submarine Power Cables with Extruded Insulation and Their Accessories for Rated Voltages from 6kV (Um = 7.2 kV) up to 60 kV (Um = 72.5 kV)—Test Methods and Requirements. iTeh Standards: Newark, DE, USA, 2019.
- SINTEF. UFLEX Software: Umbilicals—Power Cables. 2017. Available online: https://www.sintef.no/globalassets/sintef-ocean/pdf/uflexfactsheet_2017_des.pdf (accessed on 10 March 2024).
- SINTEF. UFLEX Theory Manual; SINTEF: Trondheim, Norway, 2018. [Google Scholar]
- Liu, D.; Janocha, M.J.; Ahmad, I.; Ong, M.C. Fatigue analysis of suspended inter-array power cables between spar-type floating wind turbines: Evaluating the influence of bend stiffeners on fatigue life. Ocean Eng. 2024; under review.
- Schnepf, A.; Lopez-Pavon, C.; Devulder, A.; Johnsen, Ø.; Ong, M.C. Suspended power cable configurations for floating offshore wind turbines in deep water powering an FPSO. In Proceedings of the ASME 2022 41st International Conference on Ocean, Offshore and Arctic Engineering, V008T09A049, Hamburg, Germany, 5–10 June 2022. [Google Scholar] [CrossRef] [Scilit]
- DNV-RP-C203; Fatigue Design of Offshore Steel Structures. DNV: Baerum, Norway, 2019.
- Orcina Ltd. OrcaFlex. 2022. Available online: https://www.orcina.com/webhelp/OrcaFlex/ (accessed on 16 April 2024).

Disclaimer/Publisher’s Note: The statements, opinions and data contained in all publications are solely those of the individual author(s) and contributor(s) and not of MDPI and/or the editor(s). MDPI and/or the editor(s) disclaim responsibility for any injury to people or property resulting from any ideas, methods, instructions or products referred to in the content. |
© 2024 by the authors. Licensee MDPI, Basel, Switzerland. This article is an open access article distributed under the terms and conditions of the Creative Commons Attribution (CC BY) license (https://creativecommons.org/licenses/by/4.0/).