


Abstract
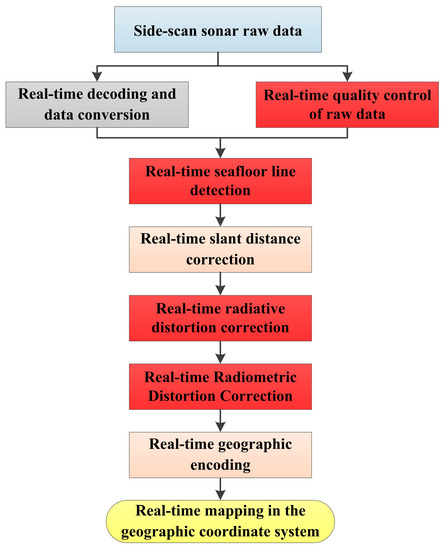
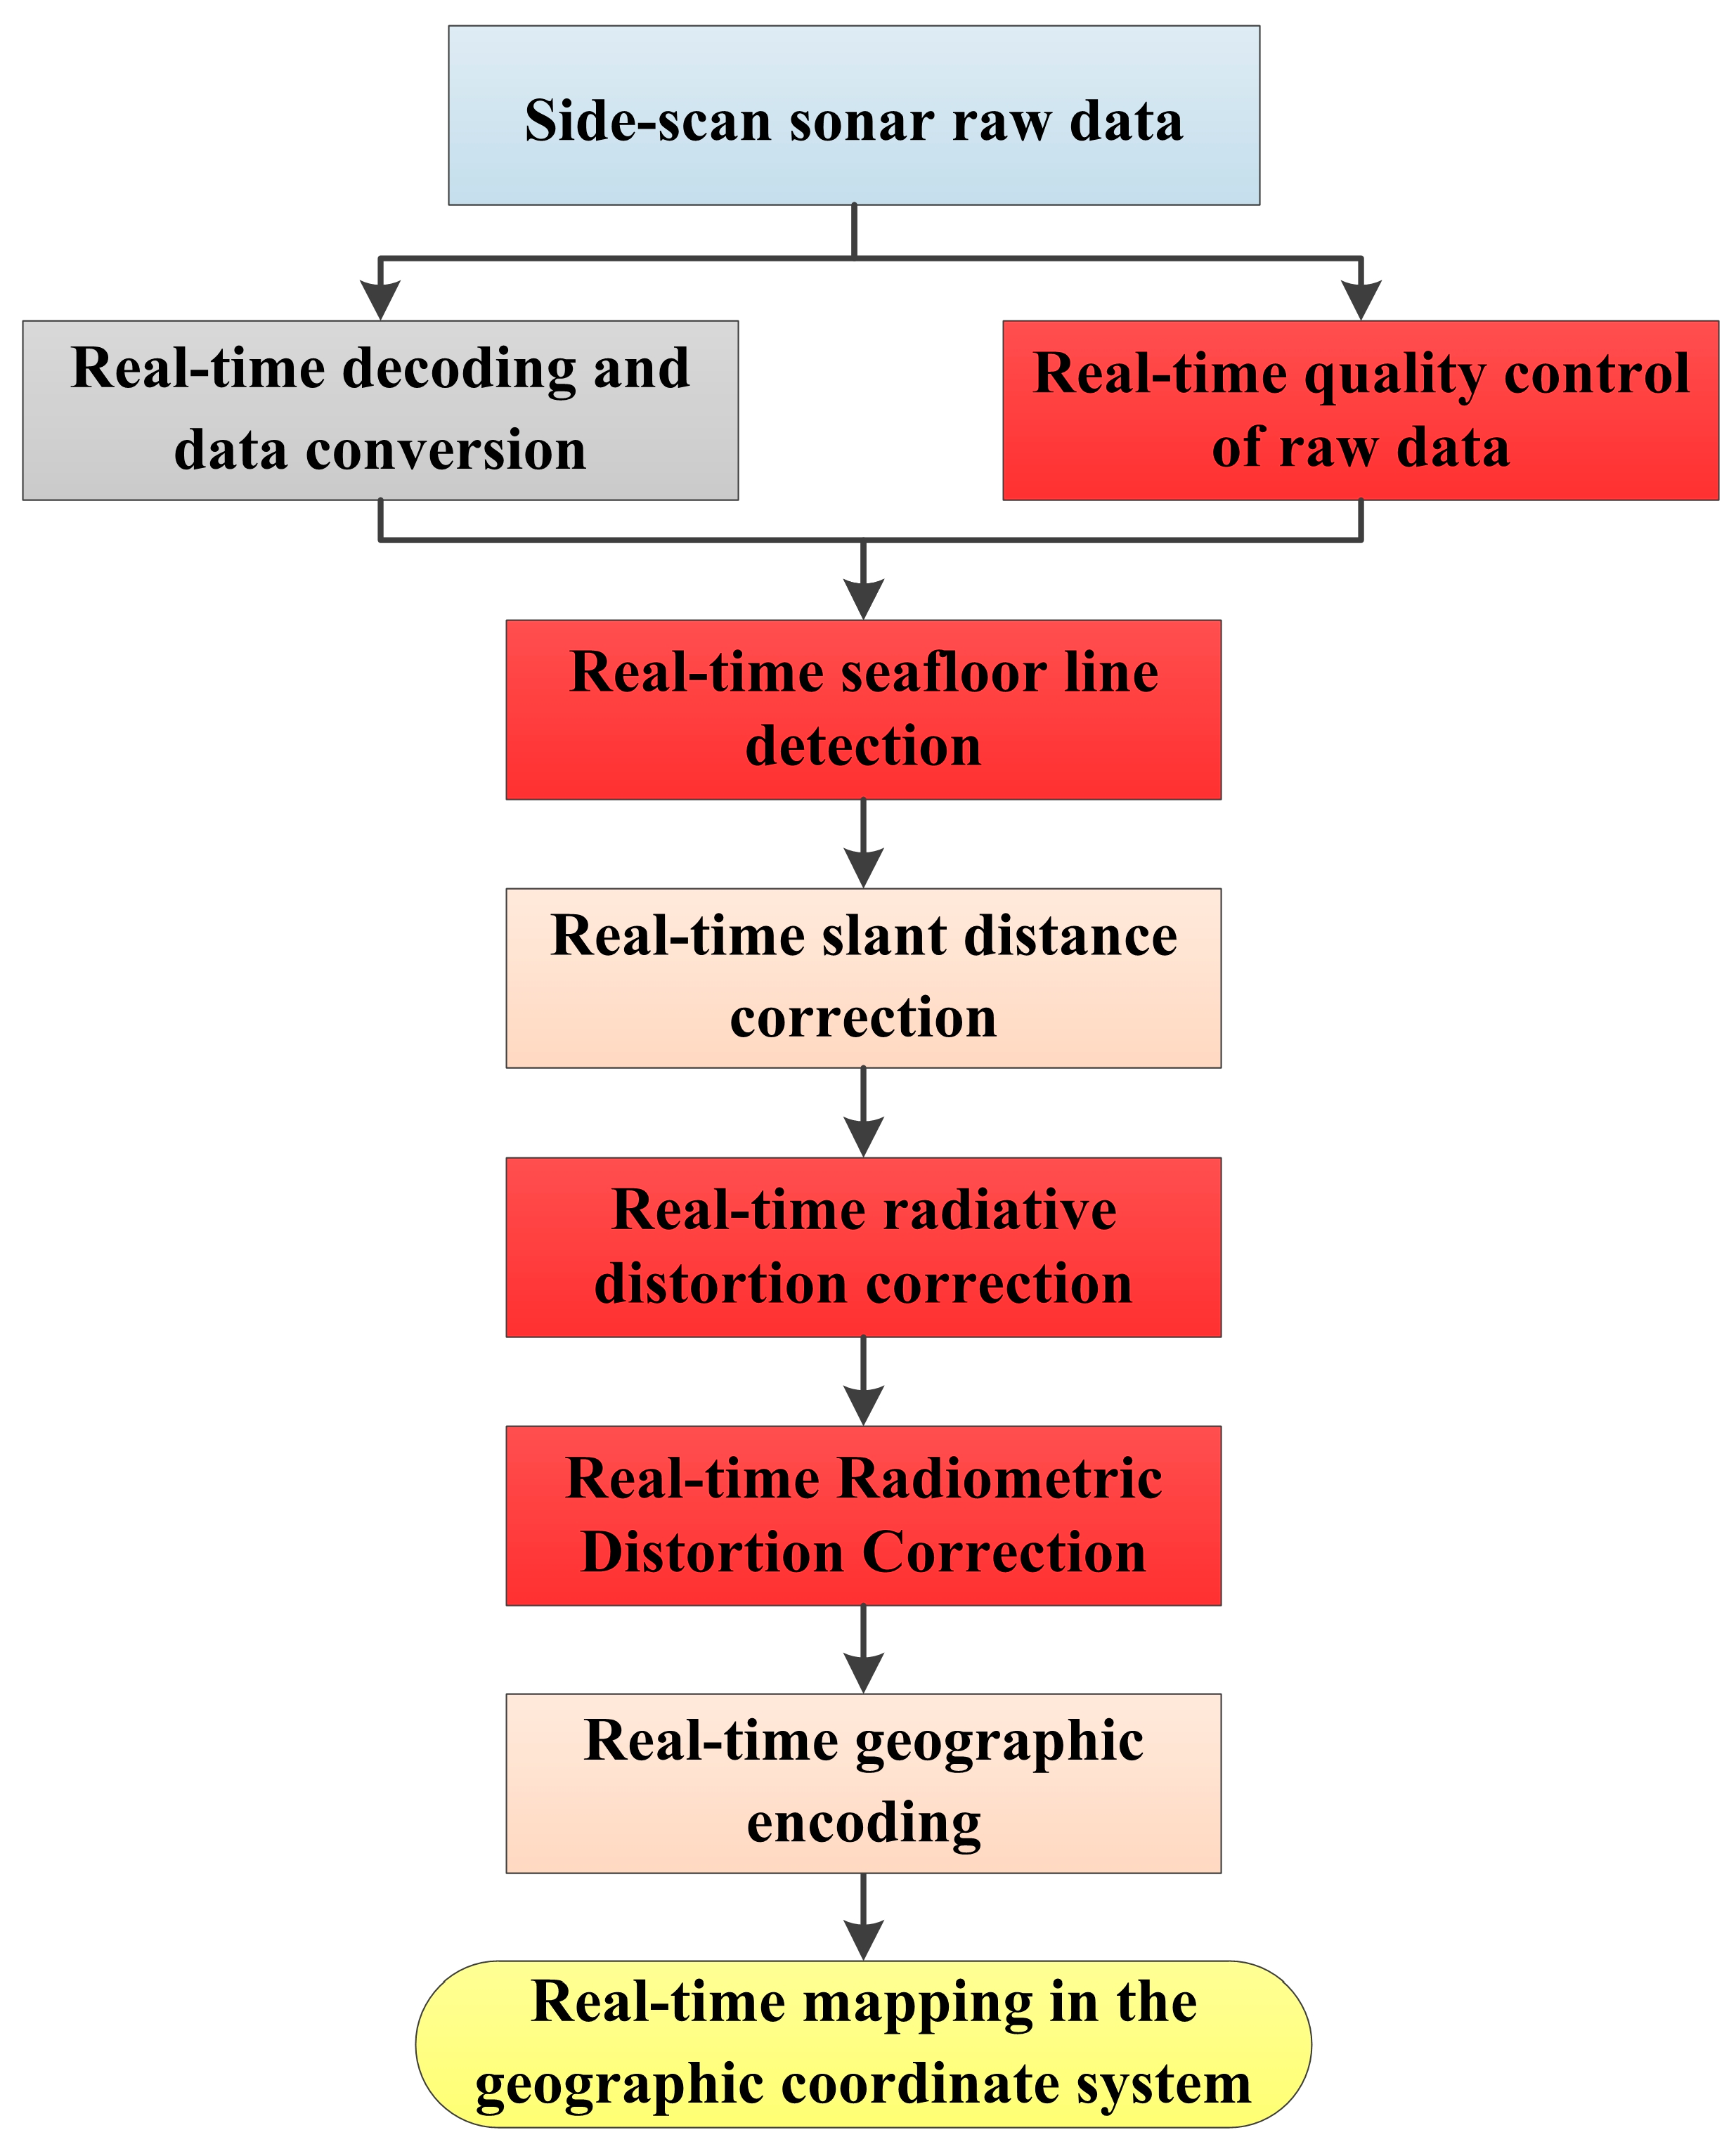
In light of the prevailing approach in which data from side-scan sonar (SSS) from Autonomous Underwater Vehicles (AUVs) are primarily processed and visualized post mission, failing to meet the requirements in terms of timeliness for on-the-fly image acquisition, this paper introduces a novel method for real-time processing and superior imaging of navigation strip data from SSS aboard AUVs. Initially, a comprehensive description of the real-time processing sequence is provided, encompassing the integration of multi-source navigation data using Kalman filtering, and high-pass filtering of attitude and heading data to exclude anomalies, as well as the use of bidirectional filtering techniques within and between pings, ensuring real-time quality control of raw data. In addition, this study adopts the semantic segmentation Unet network for automatic real-time tracking of seafloor lines, devises a real-time correction strategy for radial distortion based on historical echo data, and utilizes the alternating direction multiplier method for real-time noise reduction in strip images. With the combined application of these four pivotal techniques, we adeptly address the primary challenges in real-time navigation data processing. In conclusion, marine tests conducted in Bohai Bay substantiate the efficacy of the methodologies delineated in this research, offering a fresh paradigm for real-time processing and superior visualization of SSS navigation strip data on AUVs.
1. Introduction
SSS obtains high-resolution sonar images via line scanning, primarily for underwater target detection and seabed topography surveys [1,2,3]. Traditionally, SSS operation has primarily been carried out by mother ships equipped with SSS equipment [4,5], employing a towed approach. However, this method cannot deeply penetrate sensitive and remote areas for task execution, thus greatly restricting its operational scope.
In recent years, AUVs, with their long range and high autonomy, have been assigned tasks in sensitive, remote waters [6]. Furthermore, due to their deep submergence capacity and strong attitude control characteristics, AUVs can provide a stable platform for SSS, reducing the distance between the transducer and the seabed, thus enhancing the resolution of the data [7,8]. Therefore, AUV-mounted SSS shows broad application prospects in areas such as underwater target detection, seabed topographic mapping, underwater cruise warning, underwater matched navigation, and more. However, due to the limitations of underwater acoustic communication, large amounts of SSS data can only be processed after the AUV has been recovered, thus failing to meet the need for real-time image acquisition and processing for navigation strip data [9]. In certain critical missions, such as real-time detection and identification of specific underwater obstacles or potential targets, there may be a need for an AUV to perform real-time strip data processing and imaging based on the data collected by its side-scan sonar. Such real-time processing can provide timely information feedback for the AUV navigation and decision making. Therefore, there is an urgent need for research on real-time processing and high-quality imaging based on SSS navigation strip data obtained from AUVs.
For clarity, the term “strip” typically refers to the sonar data of each ping from the side-scan sonar. In addition, “navigation strip data using SSS” refers to the data collected by the side-scan sonar system on an AUV during its voyage on a ping-by-ping basis.
Traditional post-processing of SSS strip data includes decoding of the original binary observation files and extraction of raw data, quality control of raw observation data, generation of strip waterfall images, tracking of seabed lines, correction of radiation distortion, slant range correction, image denoising, and geographic coding [10,11]. Due to the complexity of the marine water and seabed environments, raw SSS data can be severely affected by noise and other factors, exhibiting issues like radiation distortion and geometric distortion, severely affecting the effects of SSS data processing and the quality of imaging, reducing the reliability of tasks such as underwater target detection, underwater matched navigation, and so on [12,13]. To enhance the quality of SSS images, many scholars have conducted a considerable amount of research [14,15,16,17].
For example, Zhao et al. [18] considered the continuous change and symmetric distribution of the seabed line and proposed a comprehensive seabed line tracking method that was still able to achieve robust tracking results in complex measurement environments. Wang Xiao [19] analyzed the characteristics of the SSS waterfall image and proposed a seabed line threshold tracking method. Wang et al. [20] proposed a seabed line extraction method in consideration of the spatial distribution characteristics of the seabed line. This method consists of two steps: point density clustering and chain search, and has strong anti-interference ability in complex measurement environments. Wang Aixue [21], based on the distribution characteristics of echo intensity in time and space, proposed a strip image equalization method based on statistical parameters. Buscombe [22] achieved the correction of radiation distortion of lightweight SSS echo images based on a simplified model of shallow-sea sonar-target geometry, acoustic backscatter, and sound wave attenuation, promoting the popularization and application of lightweight SSS systems in seabed habitat surveys. Shih et al. [23] proposed a seabed line tracking method combining image filtering, image segmentation, and edge detection techniques, achieving high accuracy. Although the aforementioned methods have improved the quality of SSS strip images to a certain extent, they are all post-processing methods and are not applicable to real-time processing, and cannot meet the needs of real-time processing and high-quality imaging of navigation strip data mounted on AUVs.
In summary, the main approach for handling data obtained from AUV-mounted SSS is post-processing and imaging, which does not satisfy the requirements of the real-time detection of targets or the in-transit acquisition of seabed topography images [24,25]. Hence, this paper studies the real-time processing and high-quality imaging of SSS navigation strip data based on AUVs. The structure of this paper is as follows:
Firstly, we introduce the research background and related work, clarifying the uniqueness and necessity of this study. Subsequently, the research methodologies and strategies are detailed. Based on this foundation, the major contributions of our study can be summarized as follows:
- We construct and analyze a real-time processing flow, addressing the limitations of existing post-processing strategies when applied in real-time contexts.
- A comprehensive real-time data quality management strategy is introduced, providing methods for optimizing key data and performing efficient filtering.
- Utilizing a strategy based on the Unet network, we achieve heightened efficiency and accuracy in automatic seafloor line tracking.
- Innovatively, we propose the use of statistical characteristics from historical echo data for real-time correction of radial distortion.
- We introduce a technique based on the Alternating Direction Multiplier Method, offering a novel approach to real-time noise reduction for strip images.
- Through on-site experiments in Bohai Bay, the robustness and practicality of our proposed methods are thoroughly validated.
The conclusion of the article analyzes the experimental results, providing a summary and recommendations.
3. Experiments and Analysis
3.1. Data Preparation
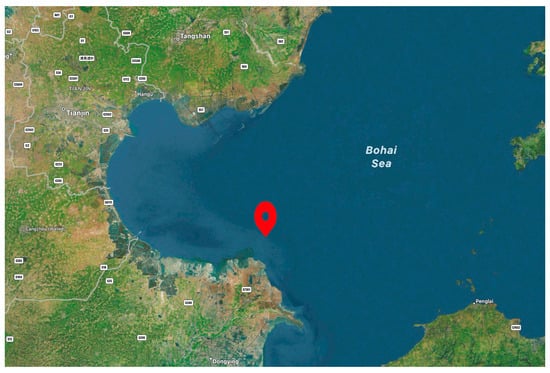
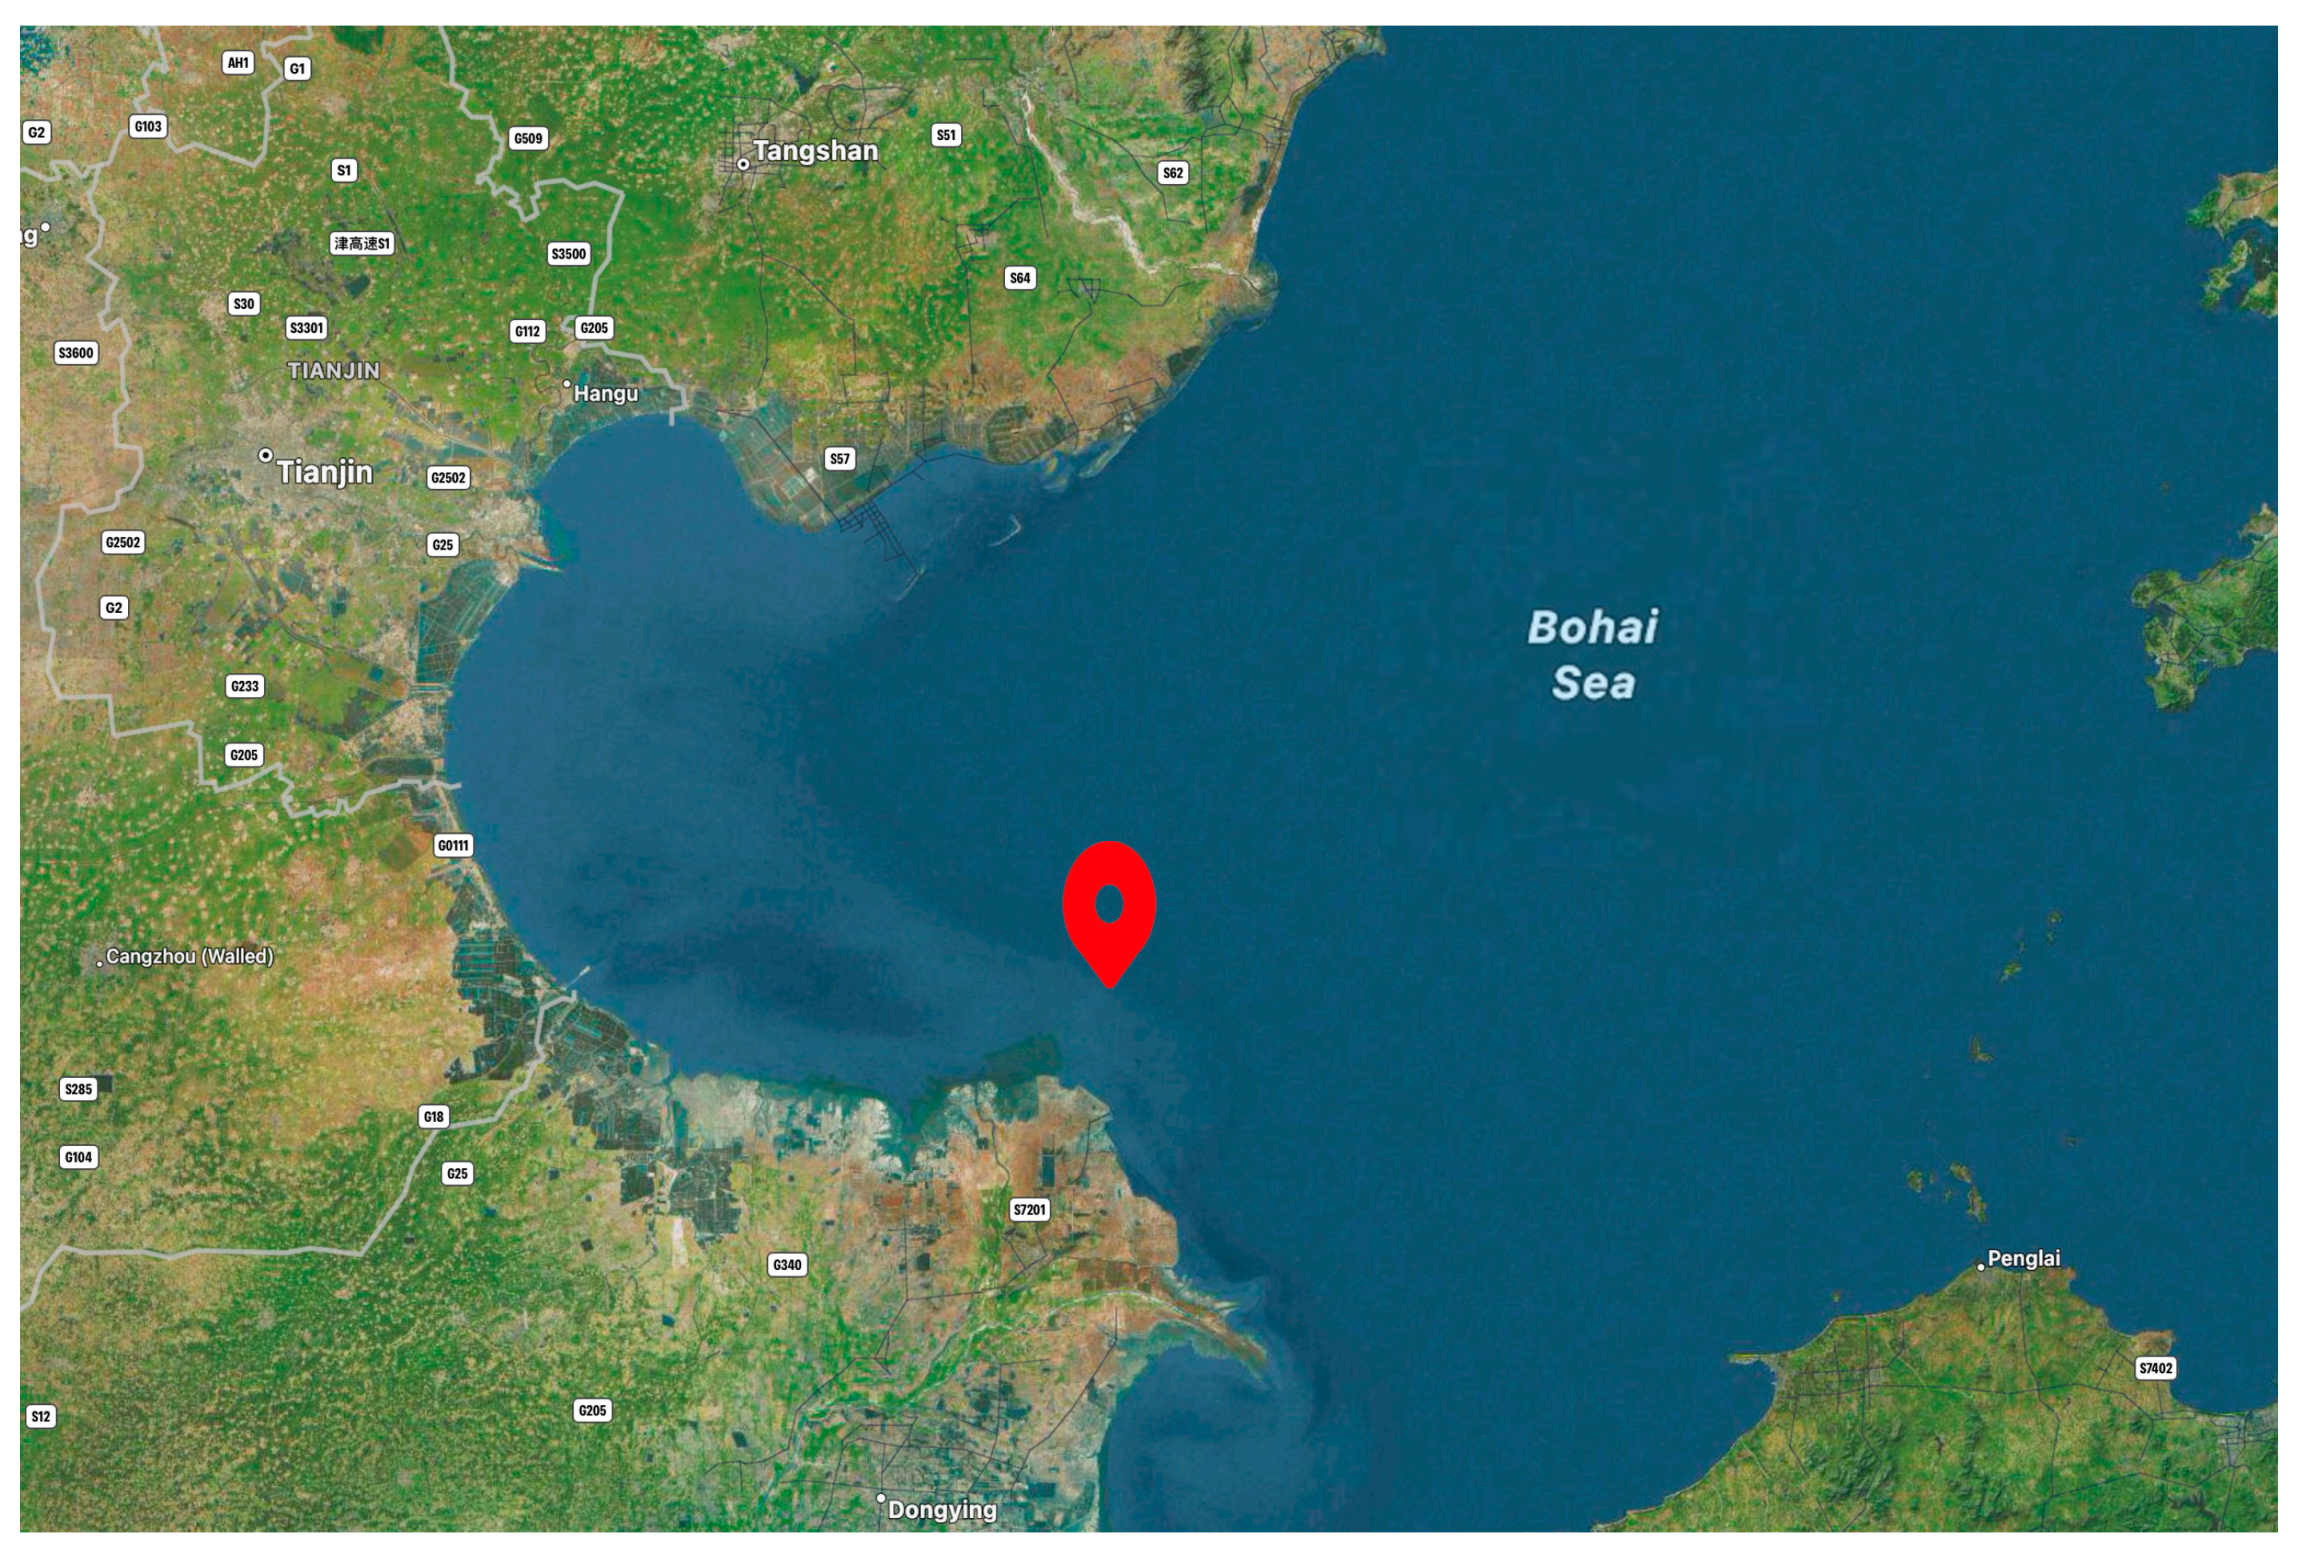
To verify the correctness of the real-time processing method for AUV-equipped SSS for swath data proposed above, an AUV equipped with an SSS measurement device was used in a water area of 3000 m × 660 m in Bohai Bay, with a water depth change of 845 m and a lot of suspended matter. The SSS system adopts Analog and Digital (DSSS), which contains two frequencies: 100 kHz and 410 kHz. The single side-scan amplitude of the SSS was set to 150 m, the common coverage rate between swaths was 60%, and five measurement lines were laid out in the measurement area, allowing full measurement coverage of the entire water area. During the measurement process, the AUV speed was controlled to vary between 0.5 and 3.5 knots, the water depth varied between approximately 5 m and 9 m with the speed change, and the measurement positions were distributed as shown in Figure 8. The data processing module used was an NVIDIA Jetson Orin NX, the hardware environment was the Windows operating system, and the CPU was a 1024-core NVIDIA Ampere architecture GPU with 32 Tensor Cores. The CPU was a six-core Arm Cortex-A78AE v8.2 64-bit CPU.
Figure 8.
Position of the measurement area.
3.2. Analysis and Evaluation of Key Technologies in Strip Data Processing
3.2.1. Automatic Seabed Line Tracking
To verify the correctness of the seabed line tracking algorithm, we decoded and performed quality control on each strip’s original observation file in the eXtended Triton Format (XTF) of the SSS. XTF is a prevalent format used for underwater sonar data storage, and provides a standardized method for storing and exchanging various types of sonar data. After obtaining the original waterfall images of each strip, automatic seabed line tracking was carried out in consideration of the distribution characteristics of the waterfall images.
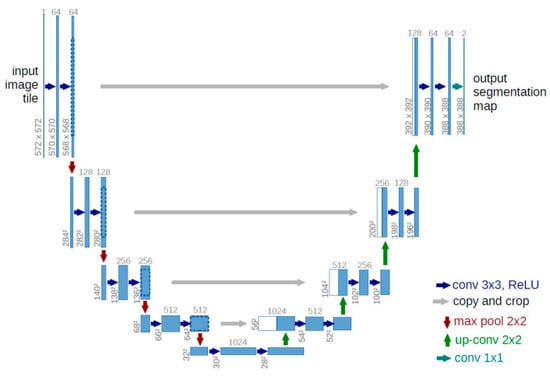
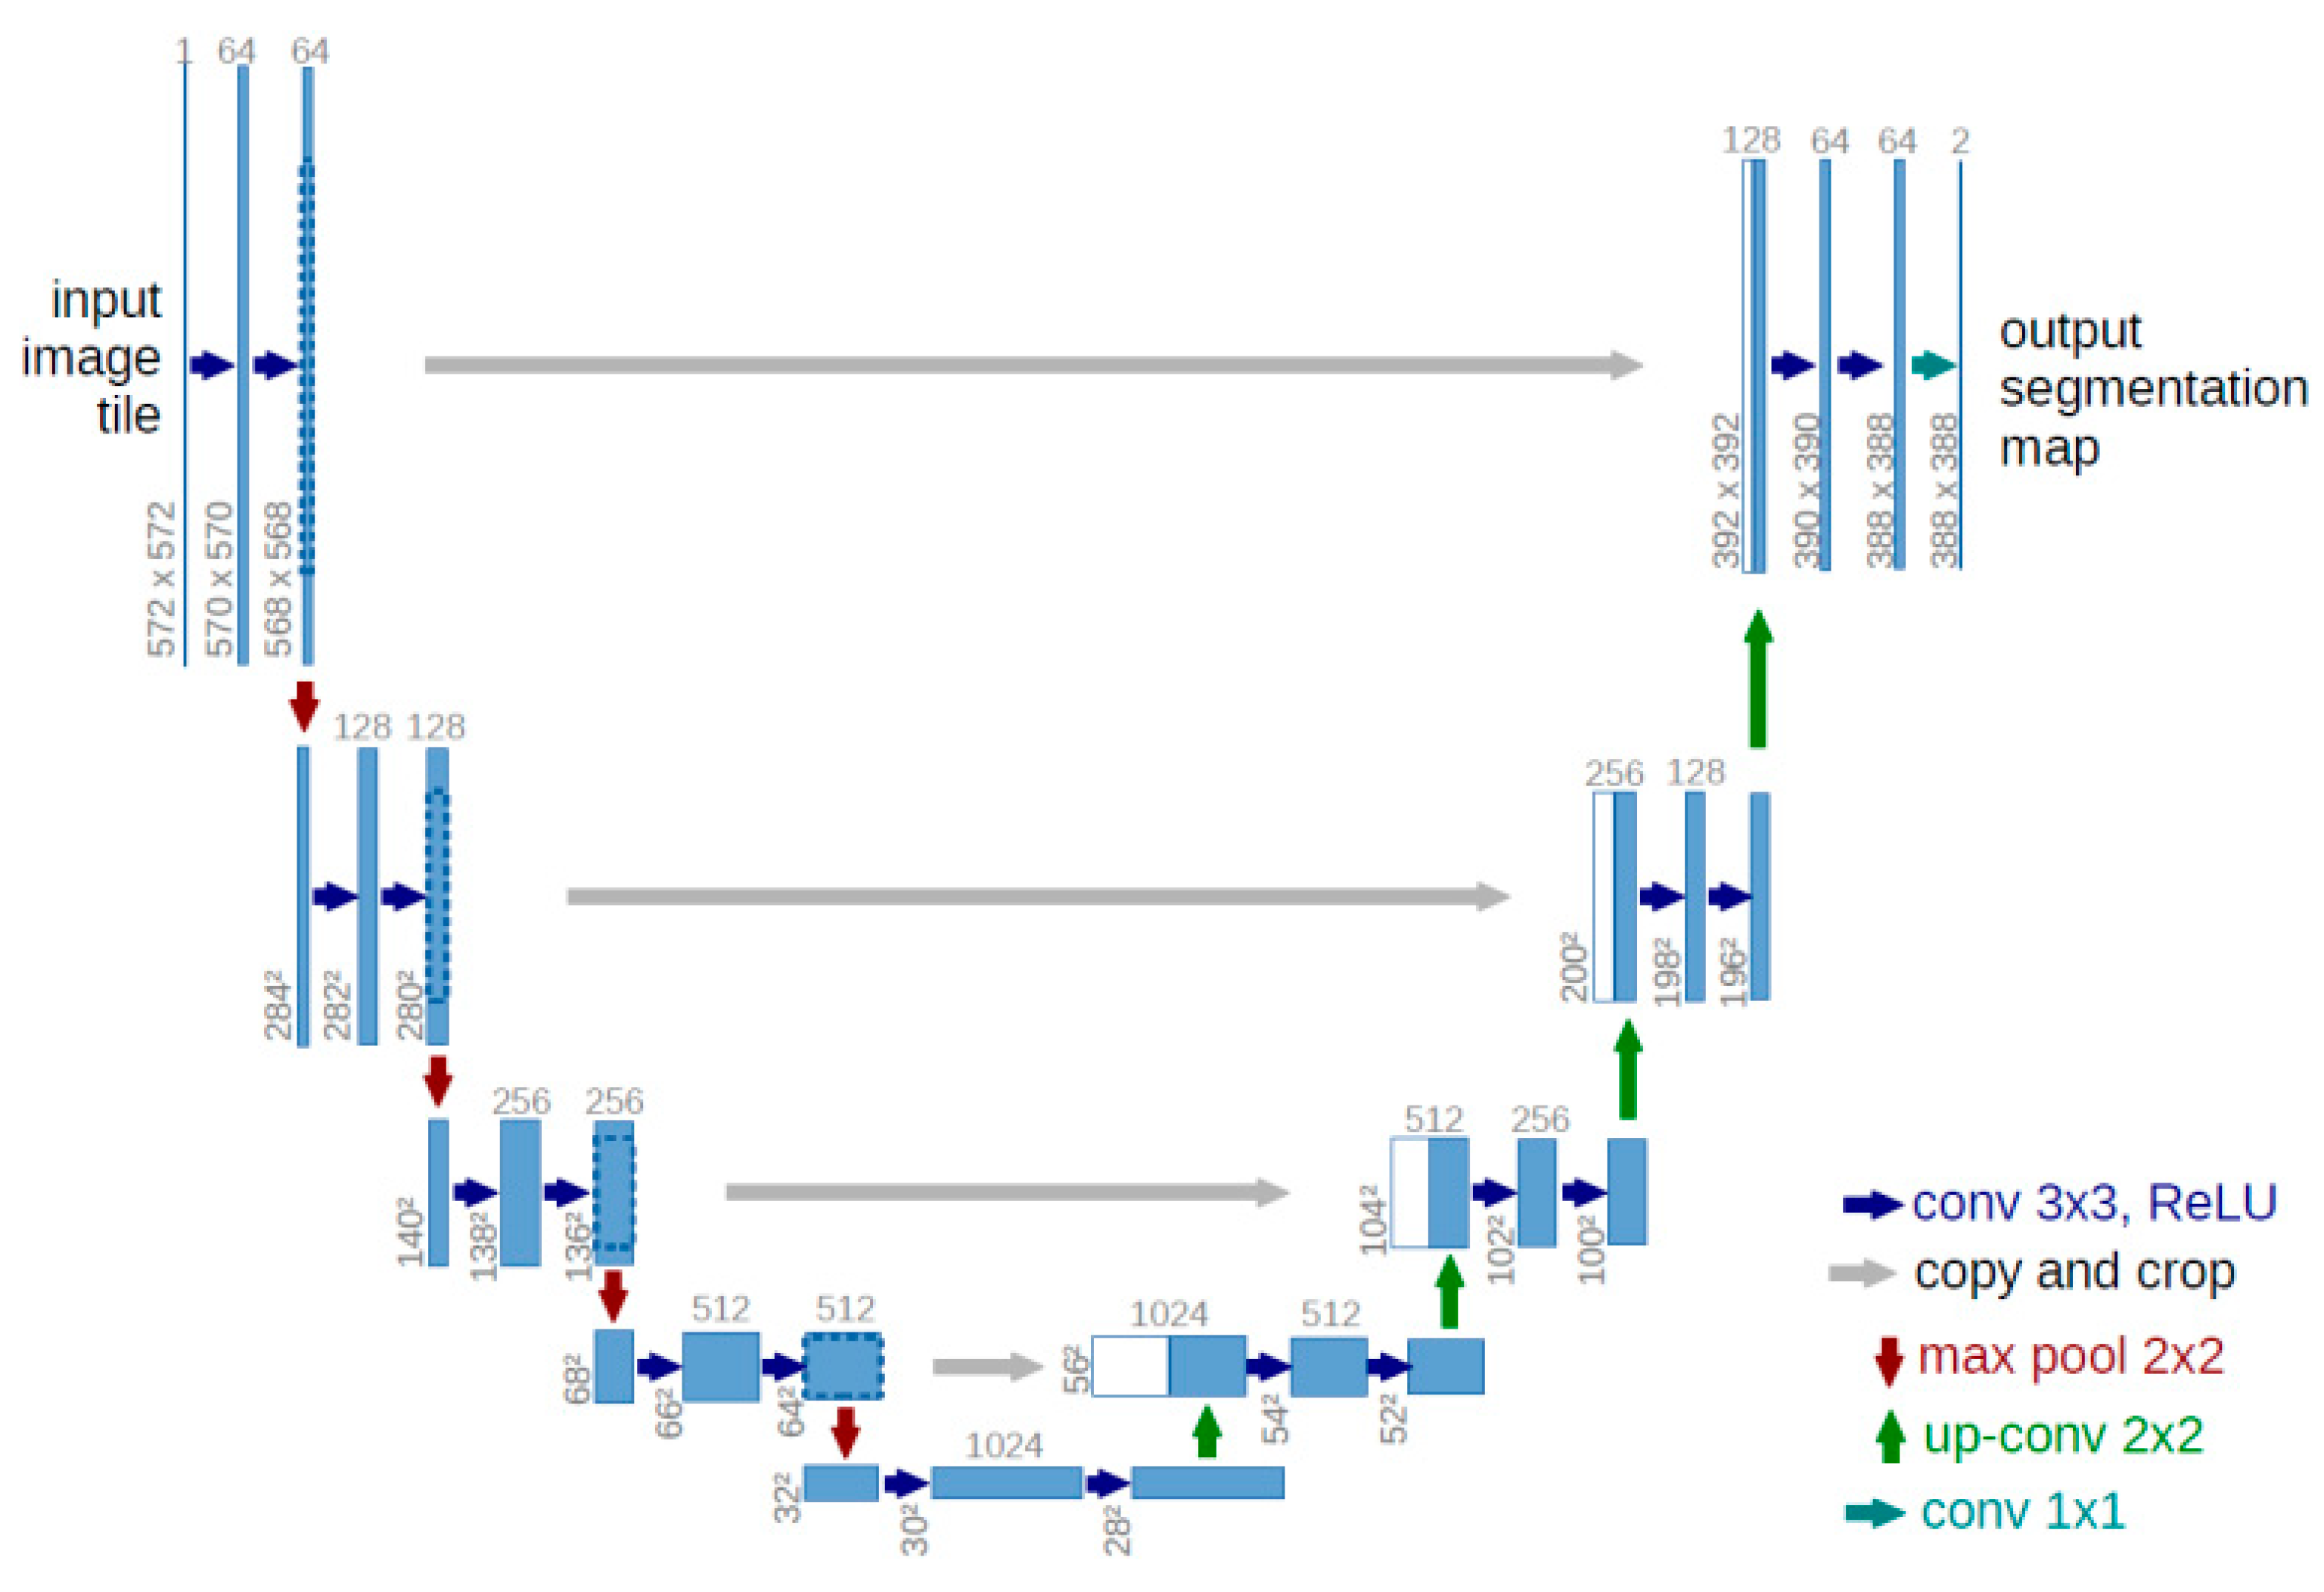
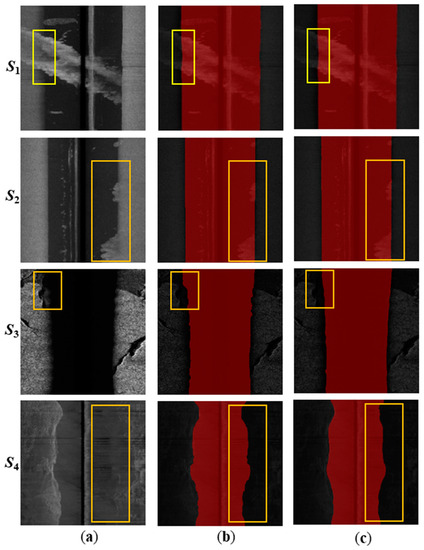
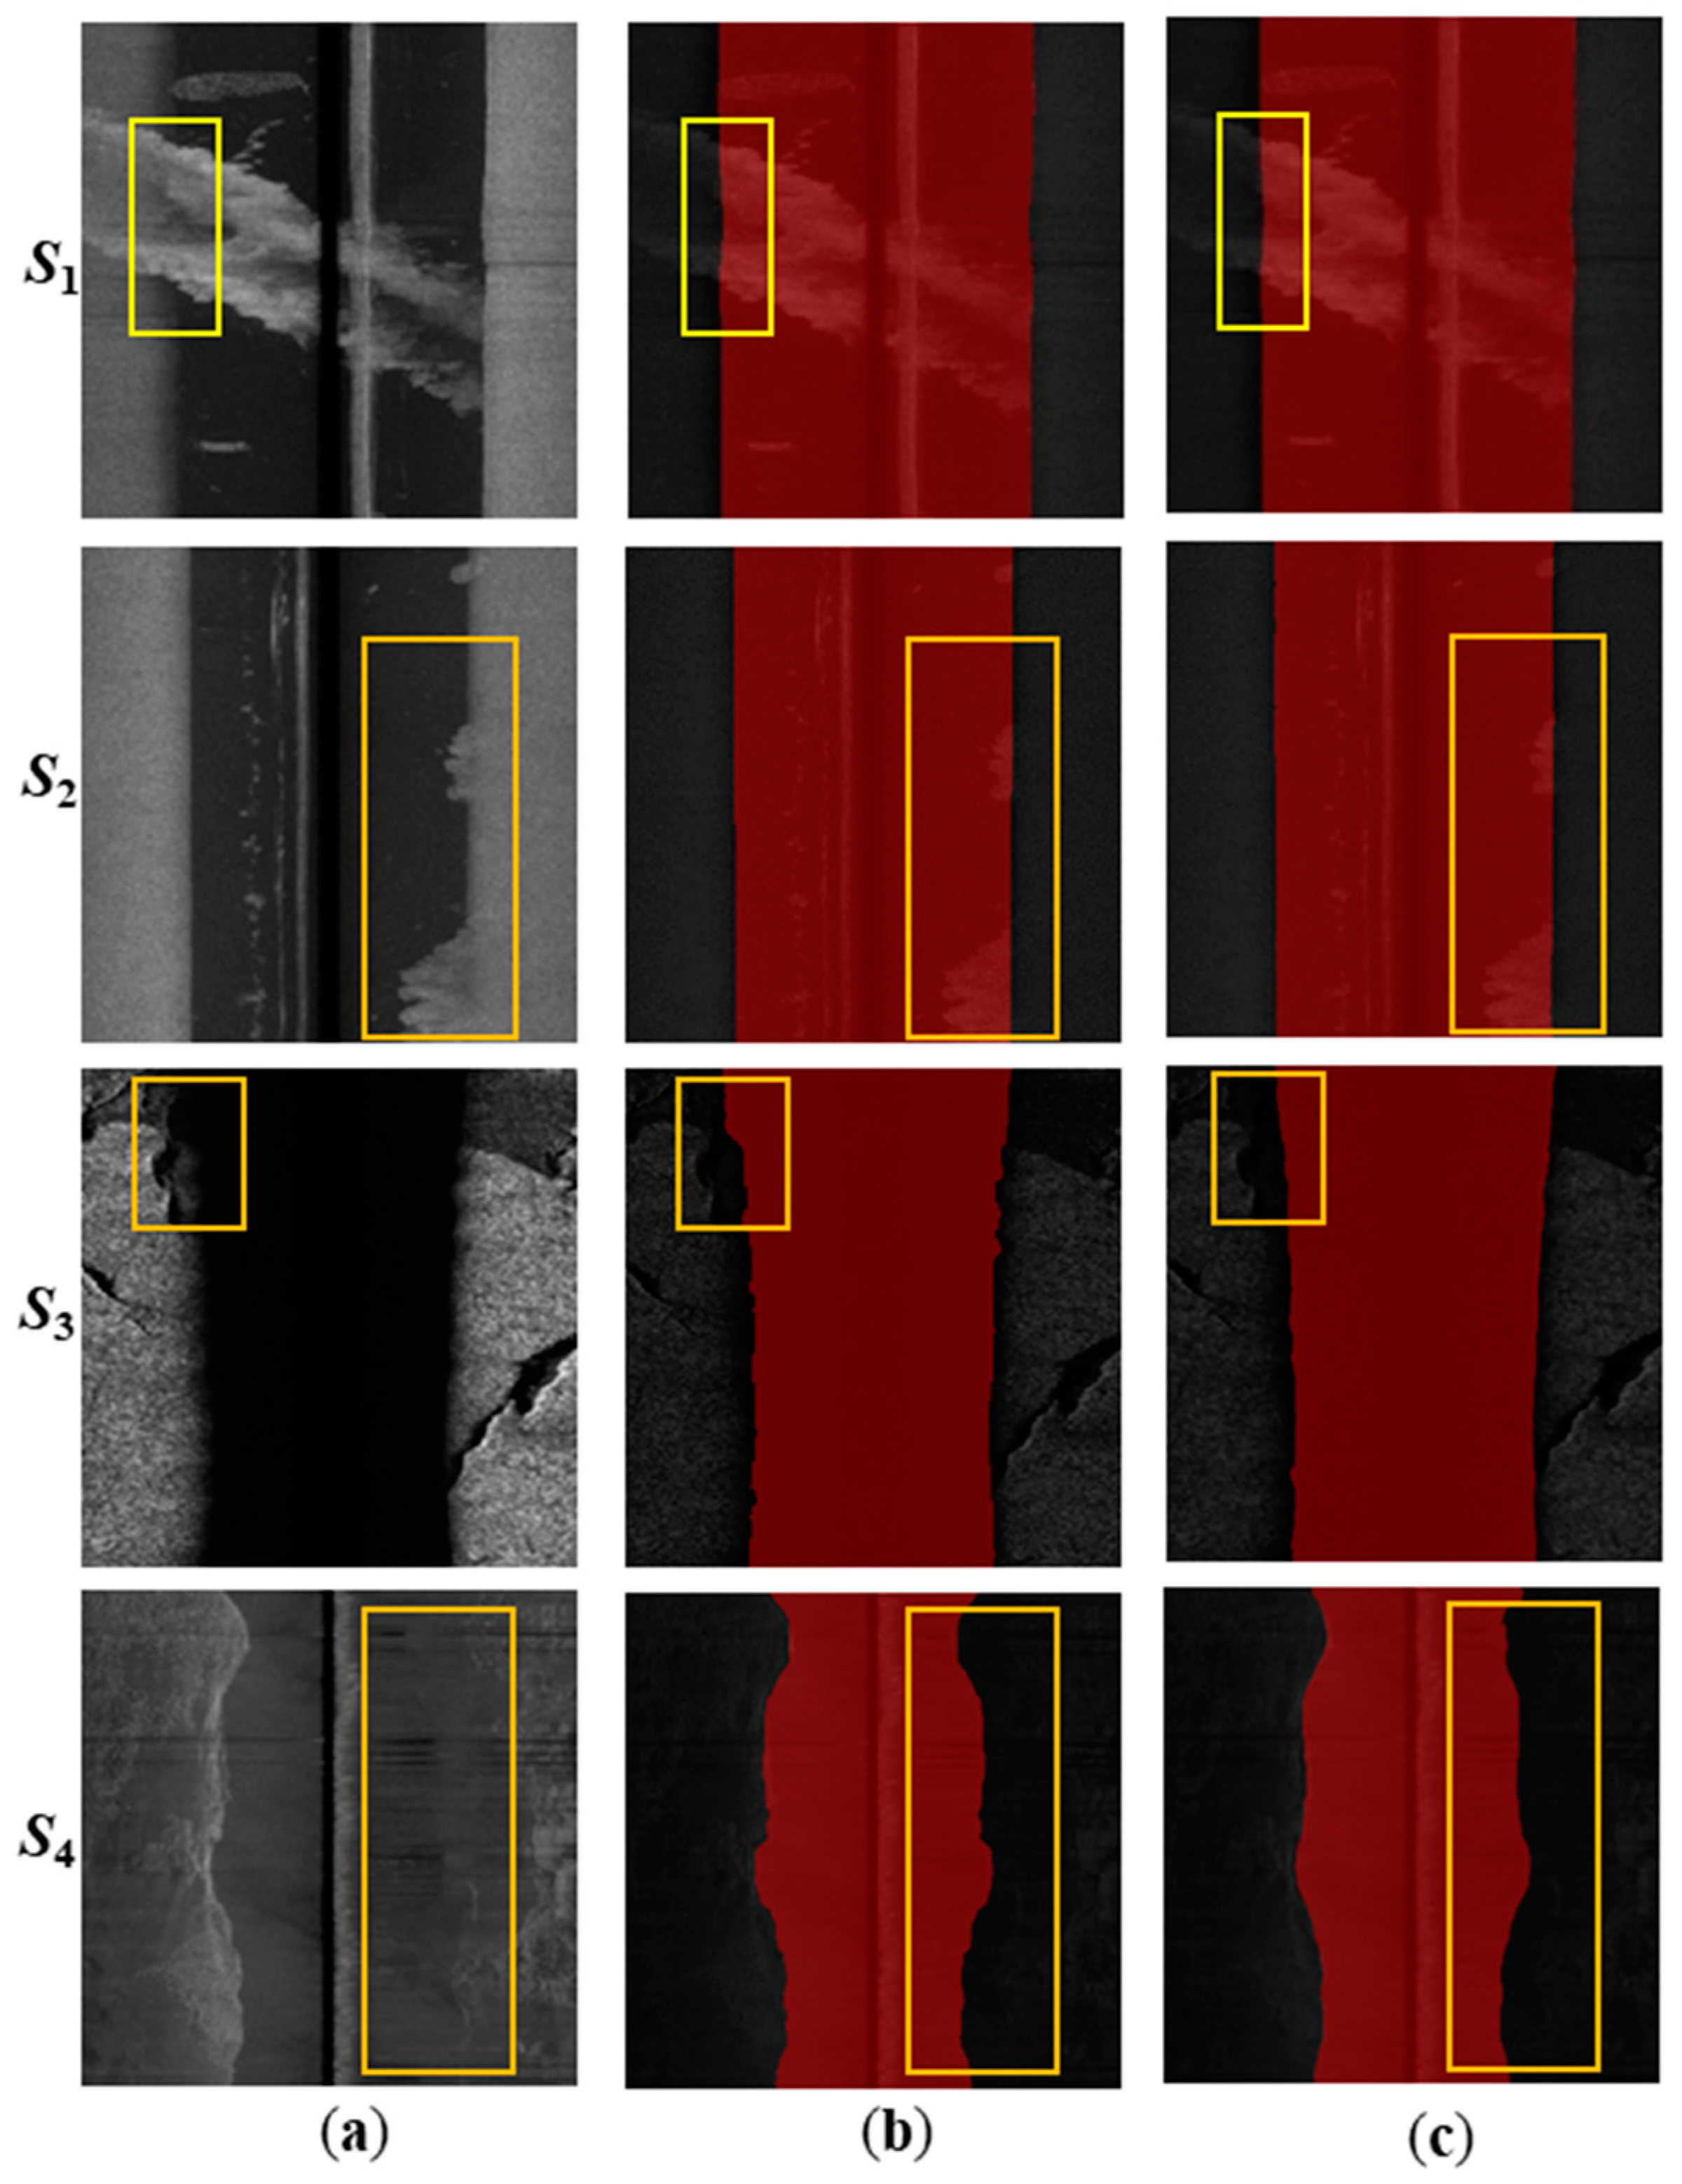
First, we built a semantic segmentation model training dataset. The original SSS waterfall image is quite large, making it difficult to use directly as model input. It can be truncated in the direction of the vertical track line, and there can be some overlap between adjacent truncations. A total of 818 images were obtained, of which 759 were used as the training set and 159 as the test set. The model was trained over 200 batches. The tracking results of the model on the waterfall images with different interferences are shown in Figure 9.
Figure 9.
Model segmentation results. (a) Sample image; (b) manual annotation; (c) model segmentation results. The effects of different factors affecting seafloor line tracking are marked by yellow boxes.
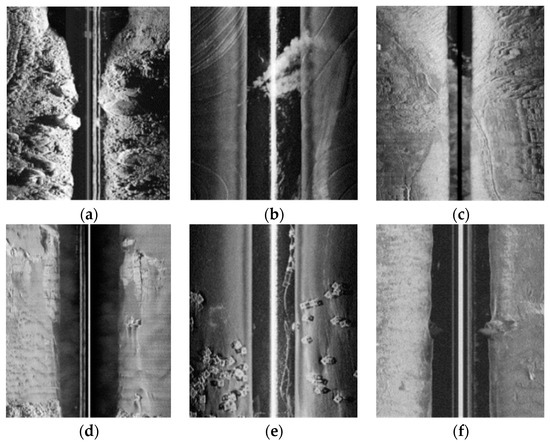
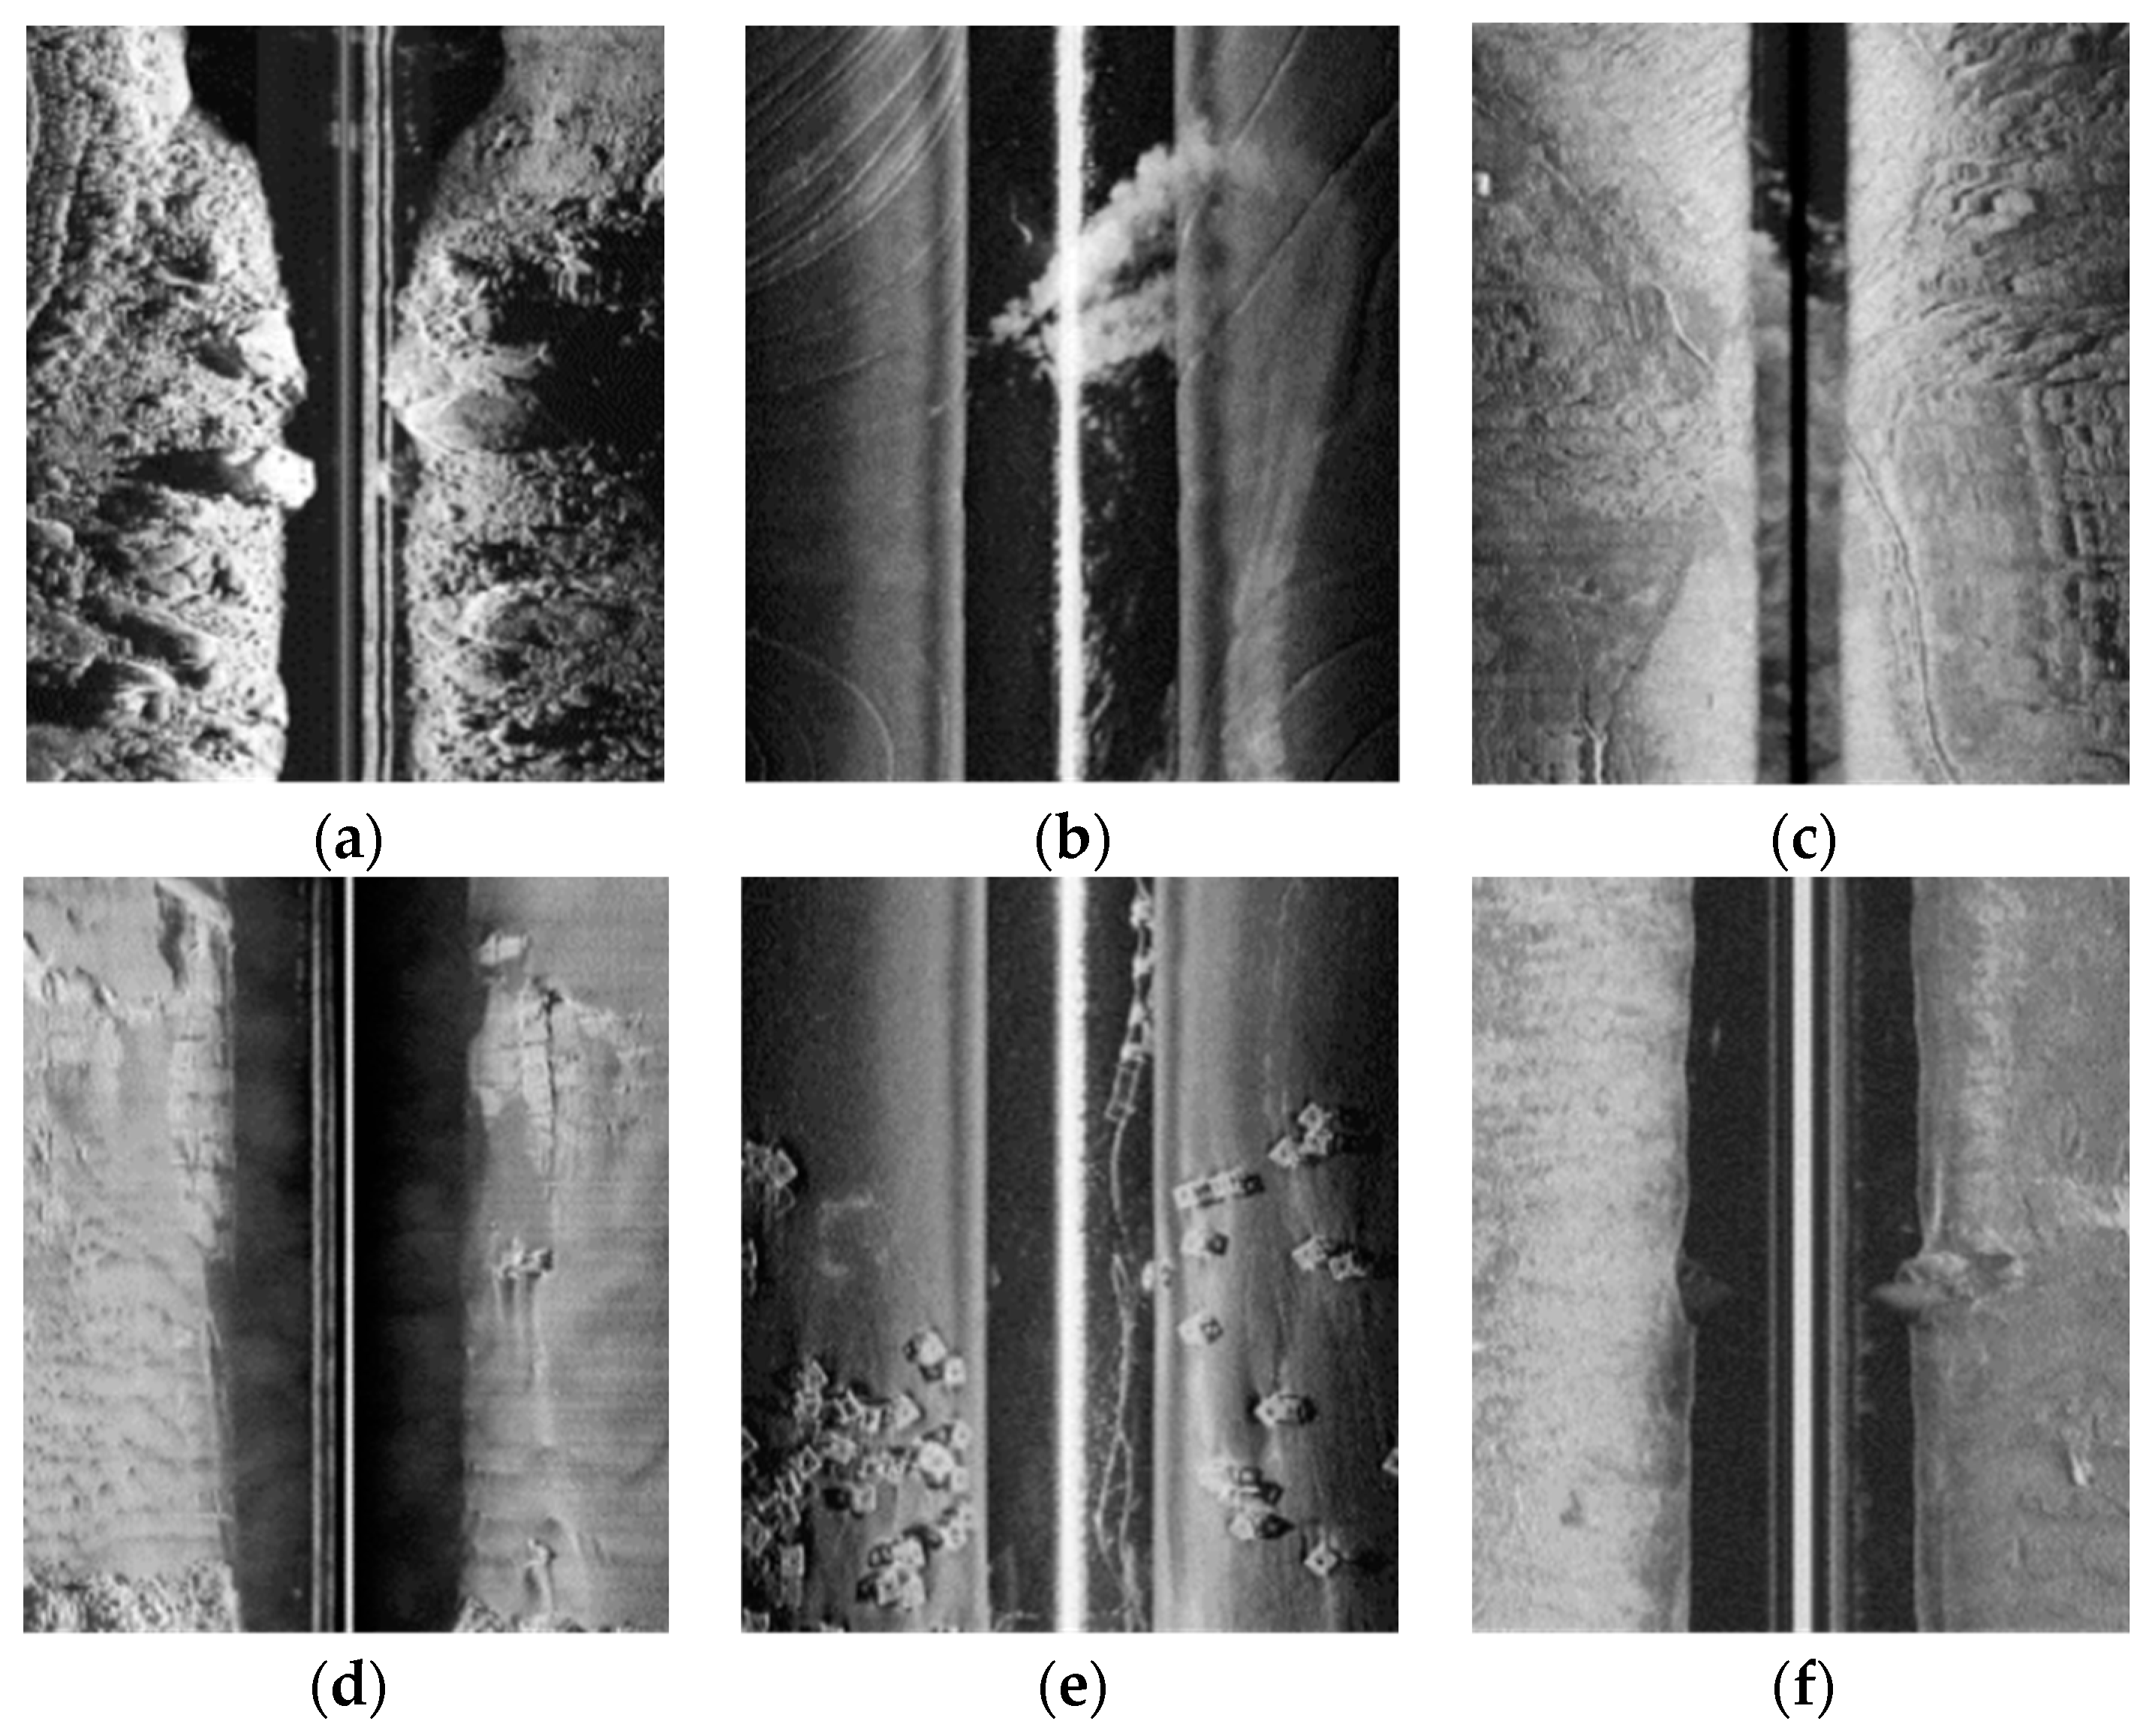
In the S1 sample, there are a large amount of suspended particles in the water column area. Despite the bottom echo in some pings in the port side image being drowned out by the strong echo produced by the suspended particles, the model can still achieve good results due to the neural network’s strong context acquisition ability. In the S2 sample, the seabed line in the port side image is very clear, and both models are able to correctly segment the port side image. Some of the seabed lines in the starboard image are covered by strong echoes in the continuous ping, but the model can still correctly segment the starboard side, because it can simultaneously integrate the echo information from the port and starboard sides. The bottom material is strongly absorbing in the S3 sample, making it difficult to distinguish the boundary between the seabed area and the water column area in some pings in the port-side image. The model still achieves good segmentation results. In the S4 sample, there is serious noise interference, which results in a low contrast between the water column area and the seabed area in the image. The model is able to estimate the range of the water column area in the starboard image based on the distribution of the water column area in the port side image, thereby obtaining a more accurate segmentation result.
The accuracy of seabed tracking directly affects the correction effect of image radiometric distortion and the measurement accuracy of the seabed target shape. Therefore, it is necessary to evaluate the accuracy of the obtained seabed lines. Accuracy evaluation can be checked on the basis of the completeness of the target contour.
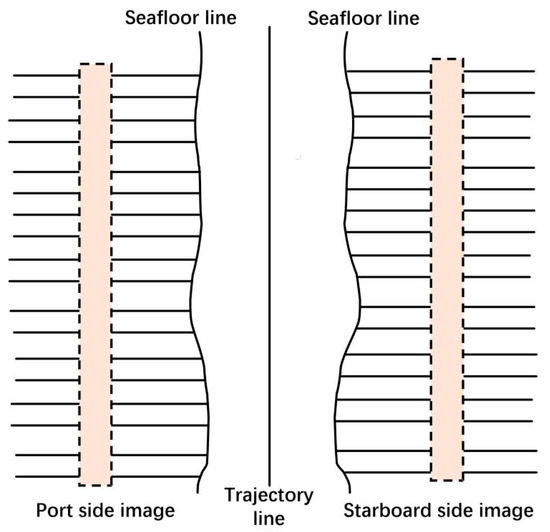
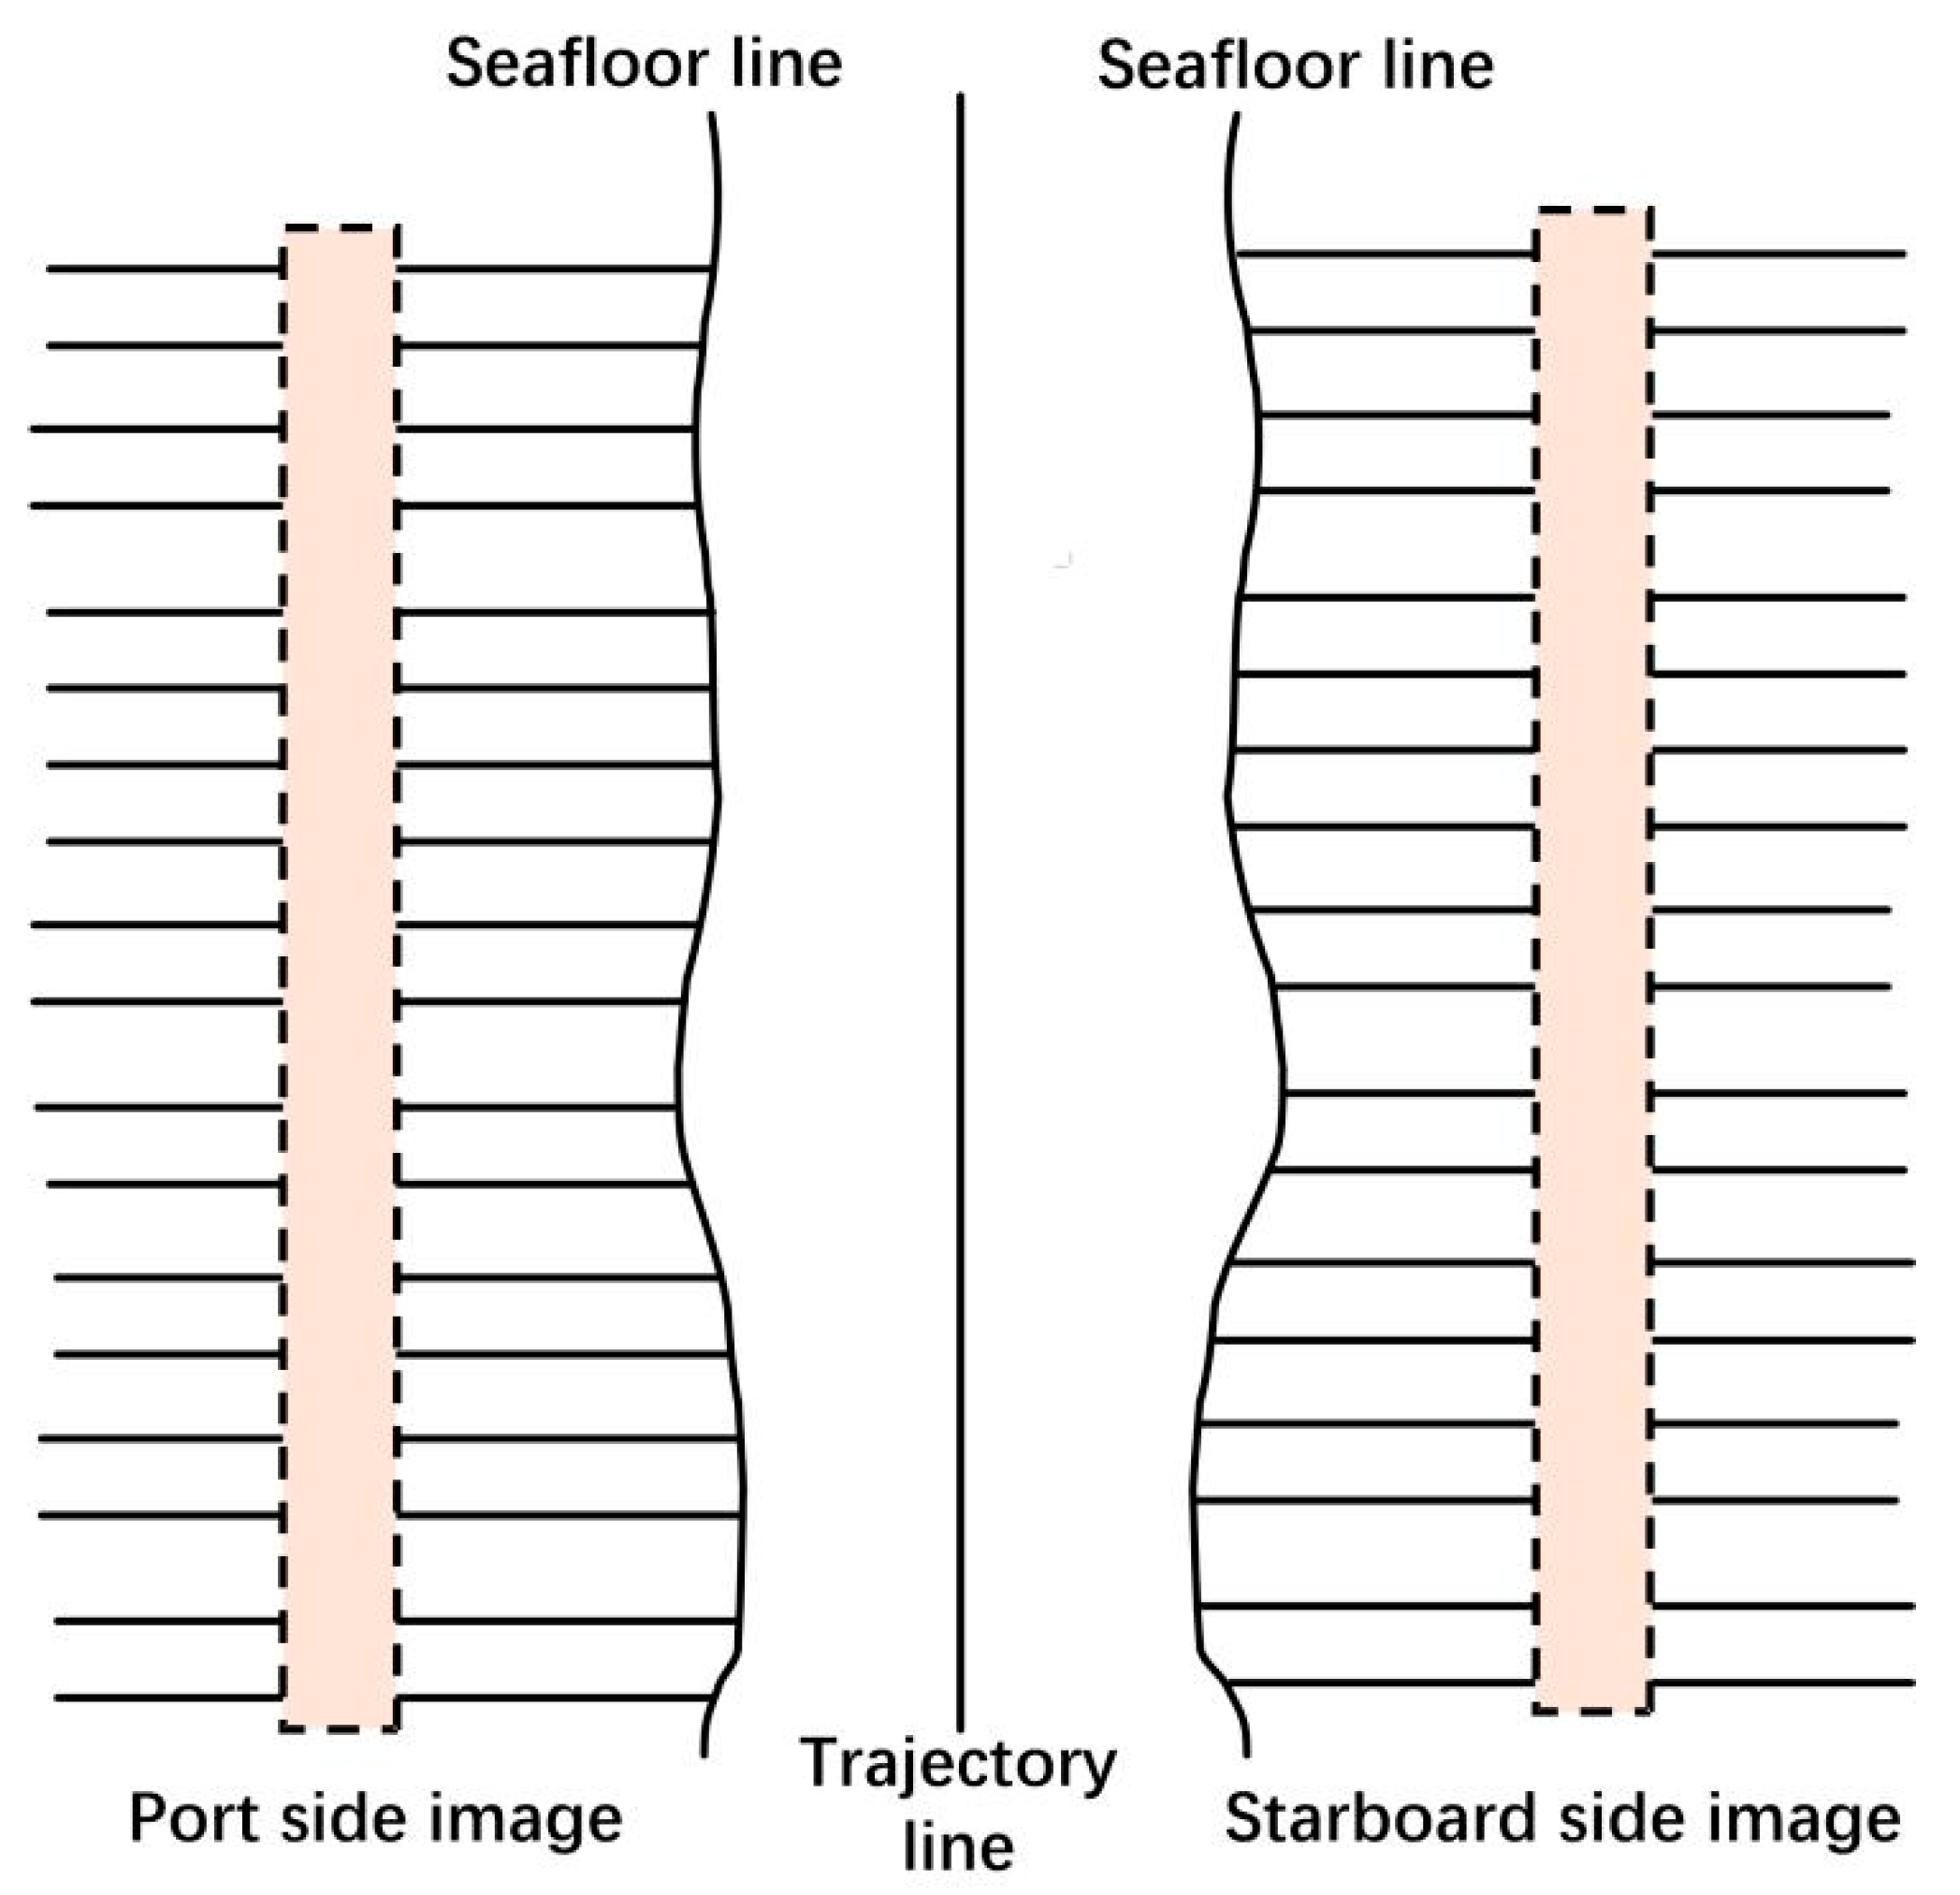
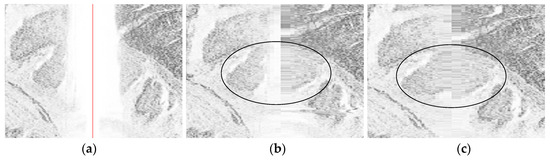
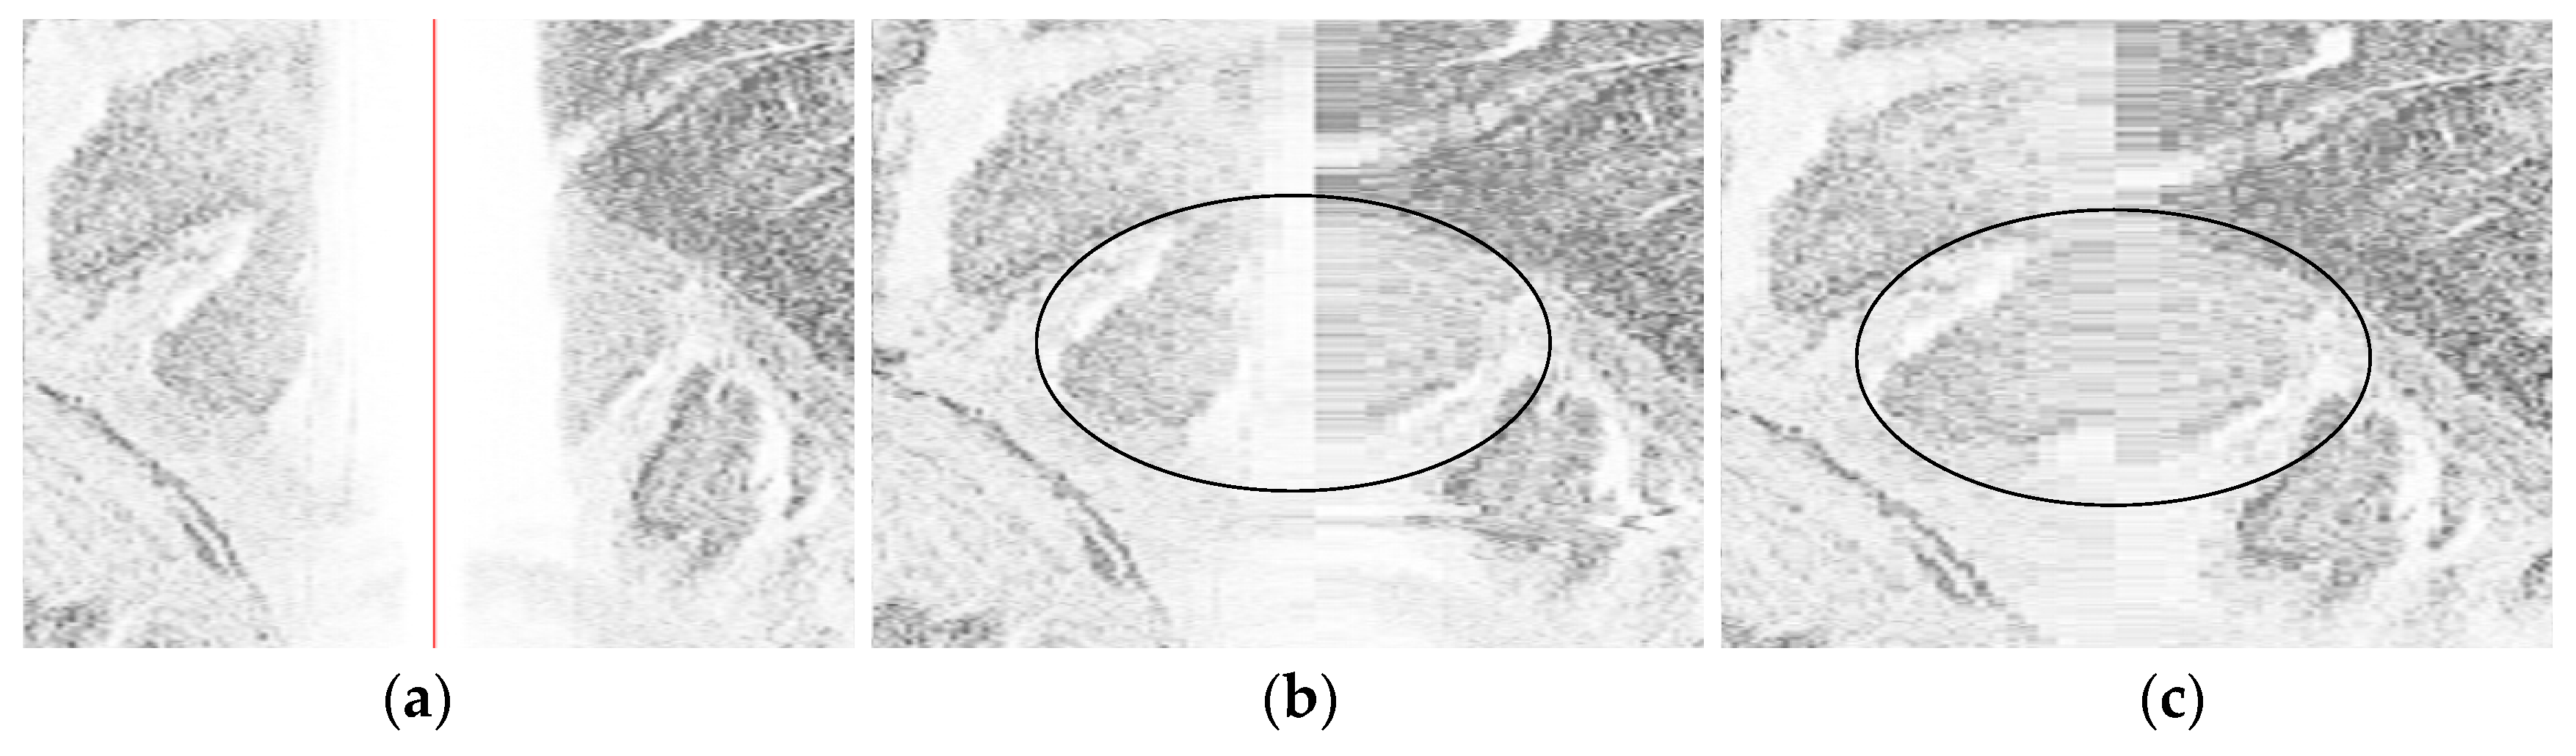
When the SSS images possess a fixed scan amplitude, the width of the original strip waterfall image will be equal, and the width of the water column area image will vary with the distance between the towfish and the seabed. When the towfish depth is constant, the width of the water column area will be high in deep water areas and low in shallow water areas. The water column area is caused by the propagation time of sound waves in the water body and must be eliminated by using the towfish height or water column area width obtained from seabed tracking, with the assistance of slant range correction. If there is a target on the seabed directly below the towfish, and the seabed tracking is correct, theoretically, the target images on the left and right sides will be compressed to the same extent after slant range correction, and the target image contour formed will be continuous, as shown in Figure 10c; otherwise, it will be discontinuous, as shown in Figure 10b. Therefore, the continuity of the target contour after slant range correction can be used to evaluate the correctness of seabed tracking.
Figure 10.
Example of the influence of seabed tracking on the edge contour of the image after slant distance correction. (a) Original image; (b) incorrect seabed tracking; (c) correct seabed tracking.
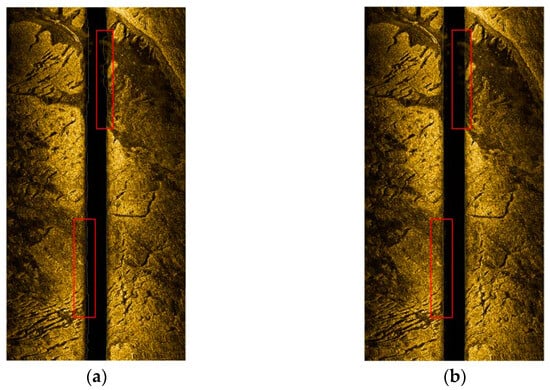
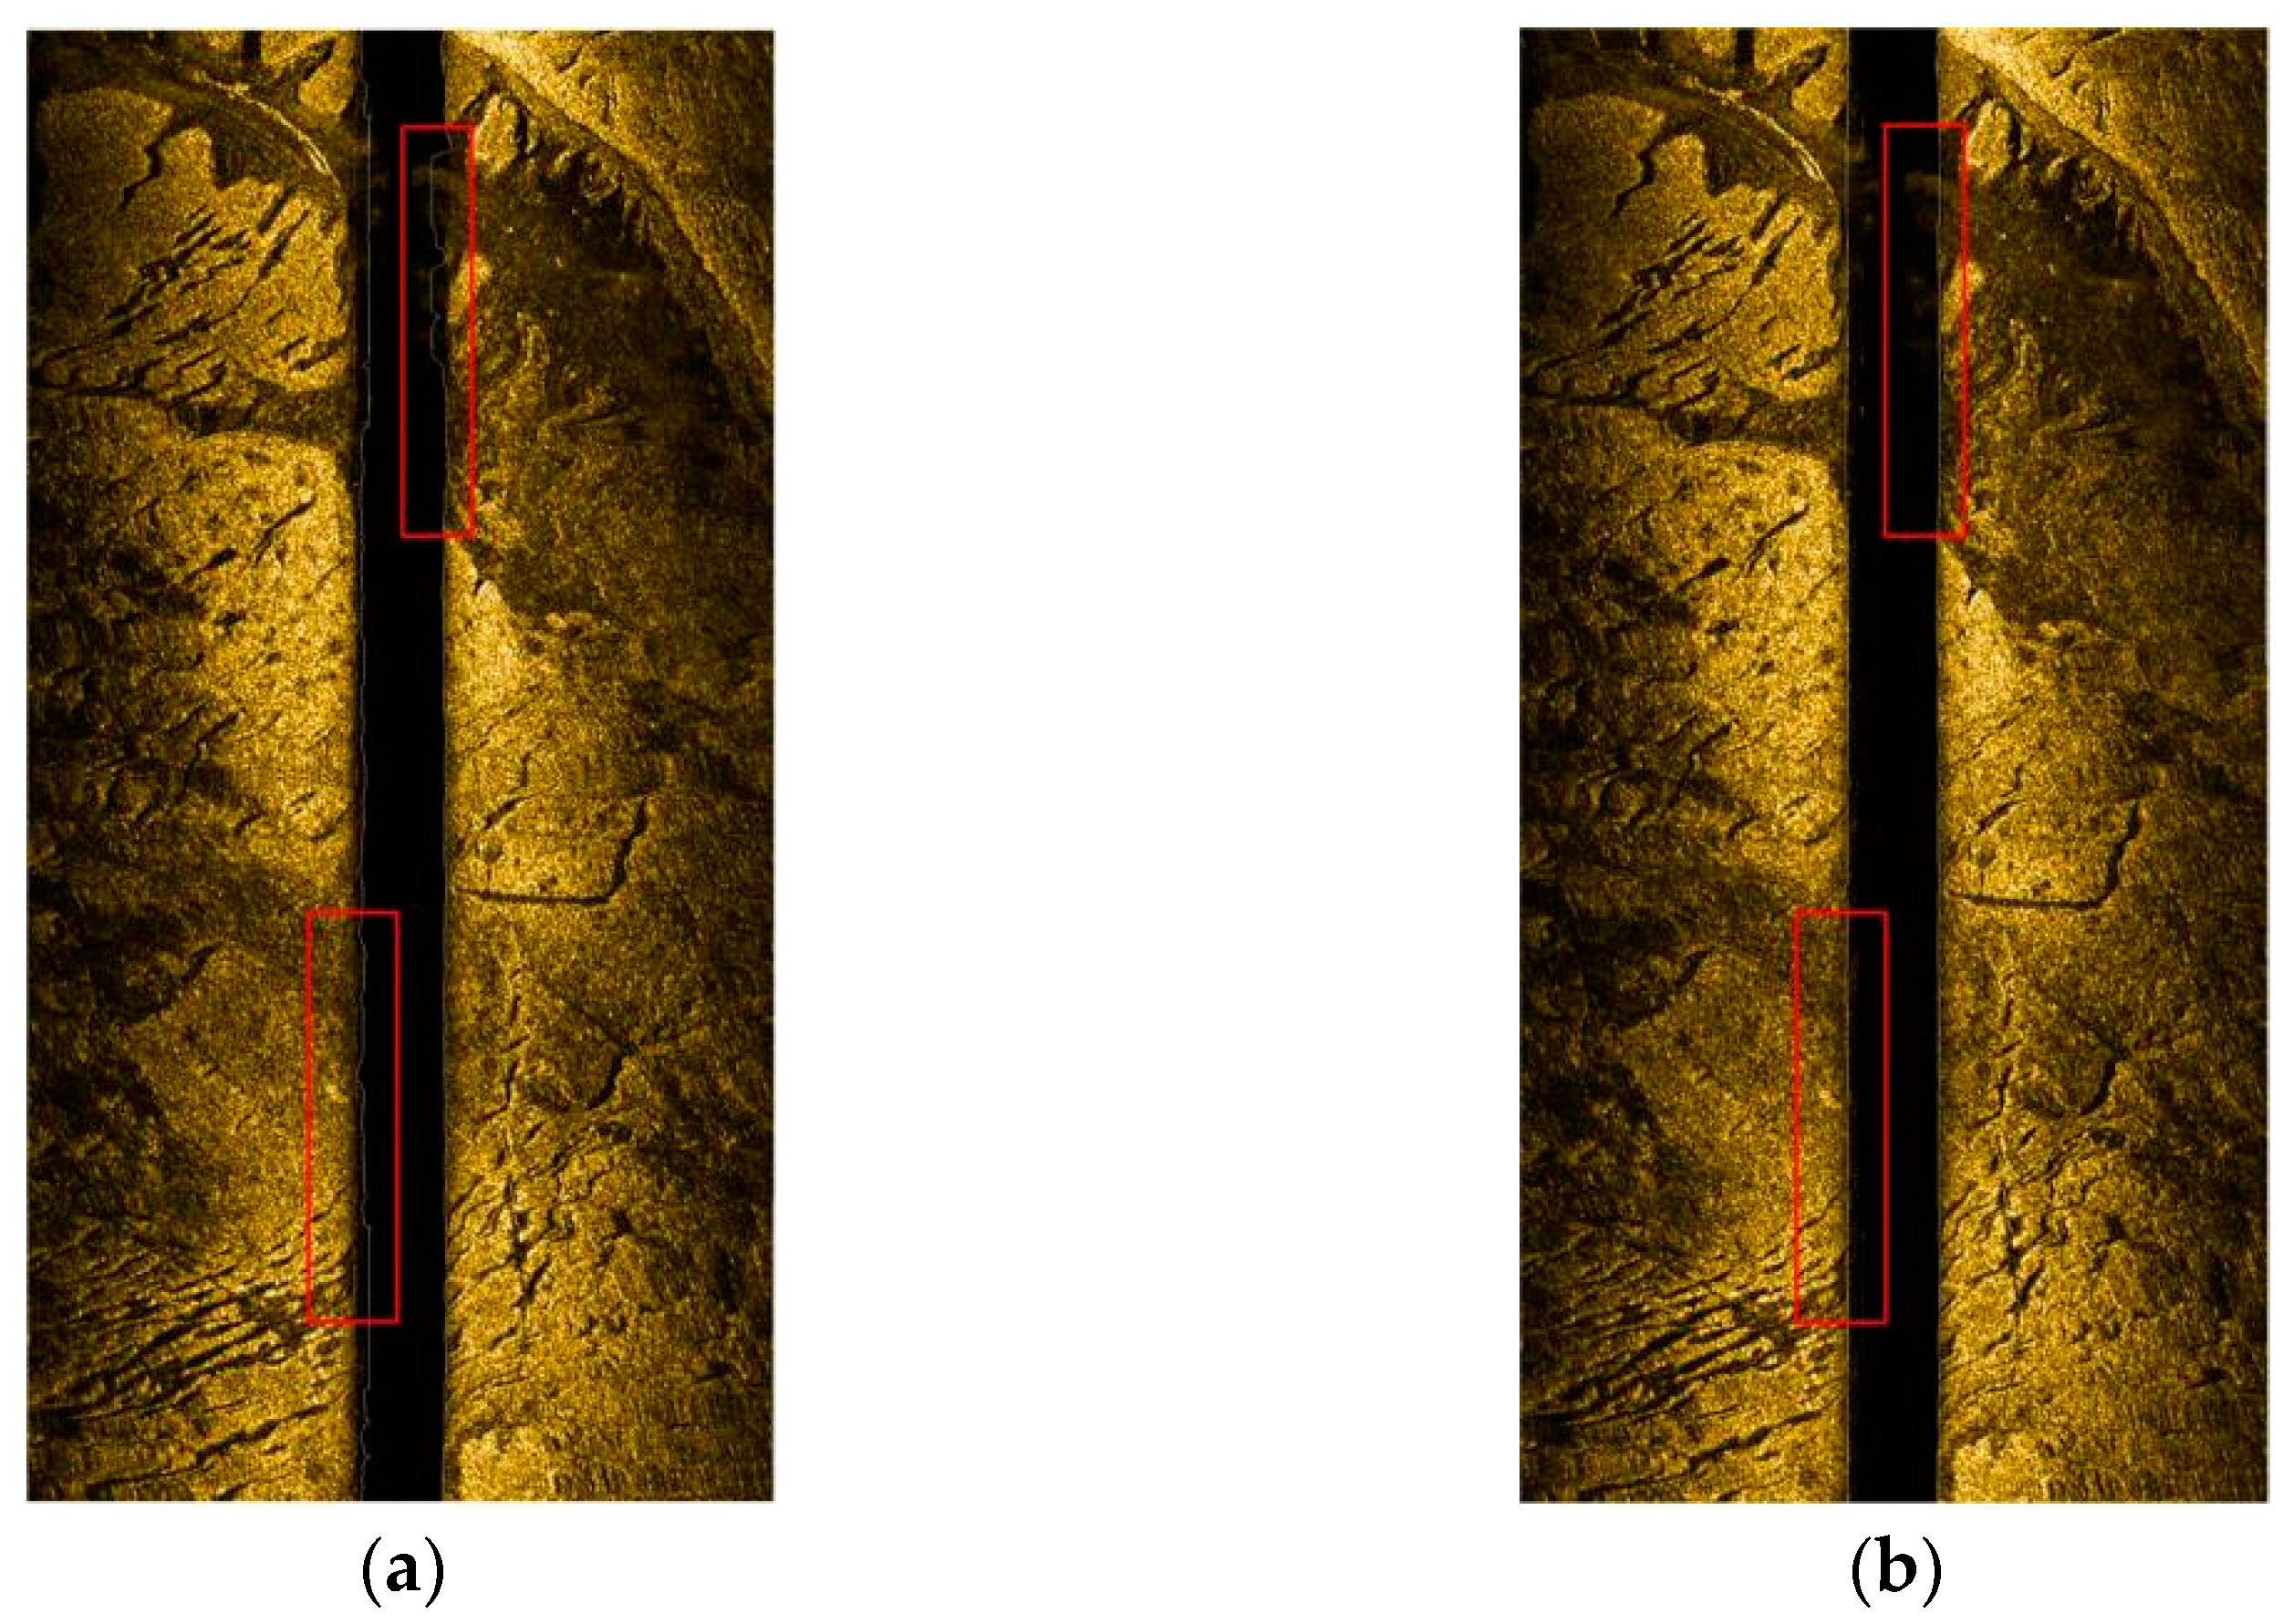
One of the stripe images in the Bohai Bay area was tracked for the seabed line, using both the traditional threshold method and the seabed line automatic tracking method proposed in this paper, while considering the distribution characteristics of waterfall images. The tracked seabed lines are shown in Figure 11. As can be seen from the two boxed areas in Figure 11a, the traditional threshold method results in abnormal seabed line tracking when there are suspended objects underwater and the seabed possesses weak absorption, which is mainly due to the fact that the threshold method detects the seabed based on echo intensity or grayscale changes. The method in this paper integrates the semantic information of the seabed in the previous and subsequent pings, considers symmetry, and is effectively able to track the correct seabed on the basis of previous and subsequent pings, combining connectivity and symmetry, solving the problem of abnormal tracking at the location of suspended objects and weakly absorbing bottom material. Therefore, the correct seabed line tracking is presented in the boxed area in Figure 11a, and requires only 0.4 s, which means that not only is the automatic tracking of the seabed line better realized compared with the traditional method, but good real-time performance, robustness and correctness is also achieved.
Figure 11.
Seabed line extraction results. (a) Results of the traditional threshold method; (b) results of the method proposed in this paper.
3.2.2. Radiometric Distortion Correction
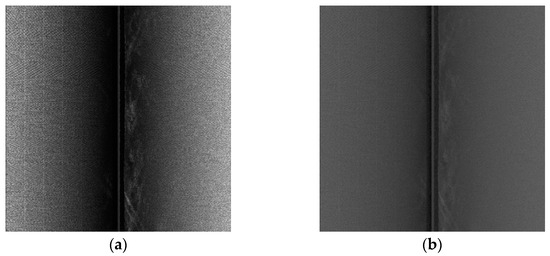
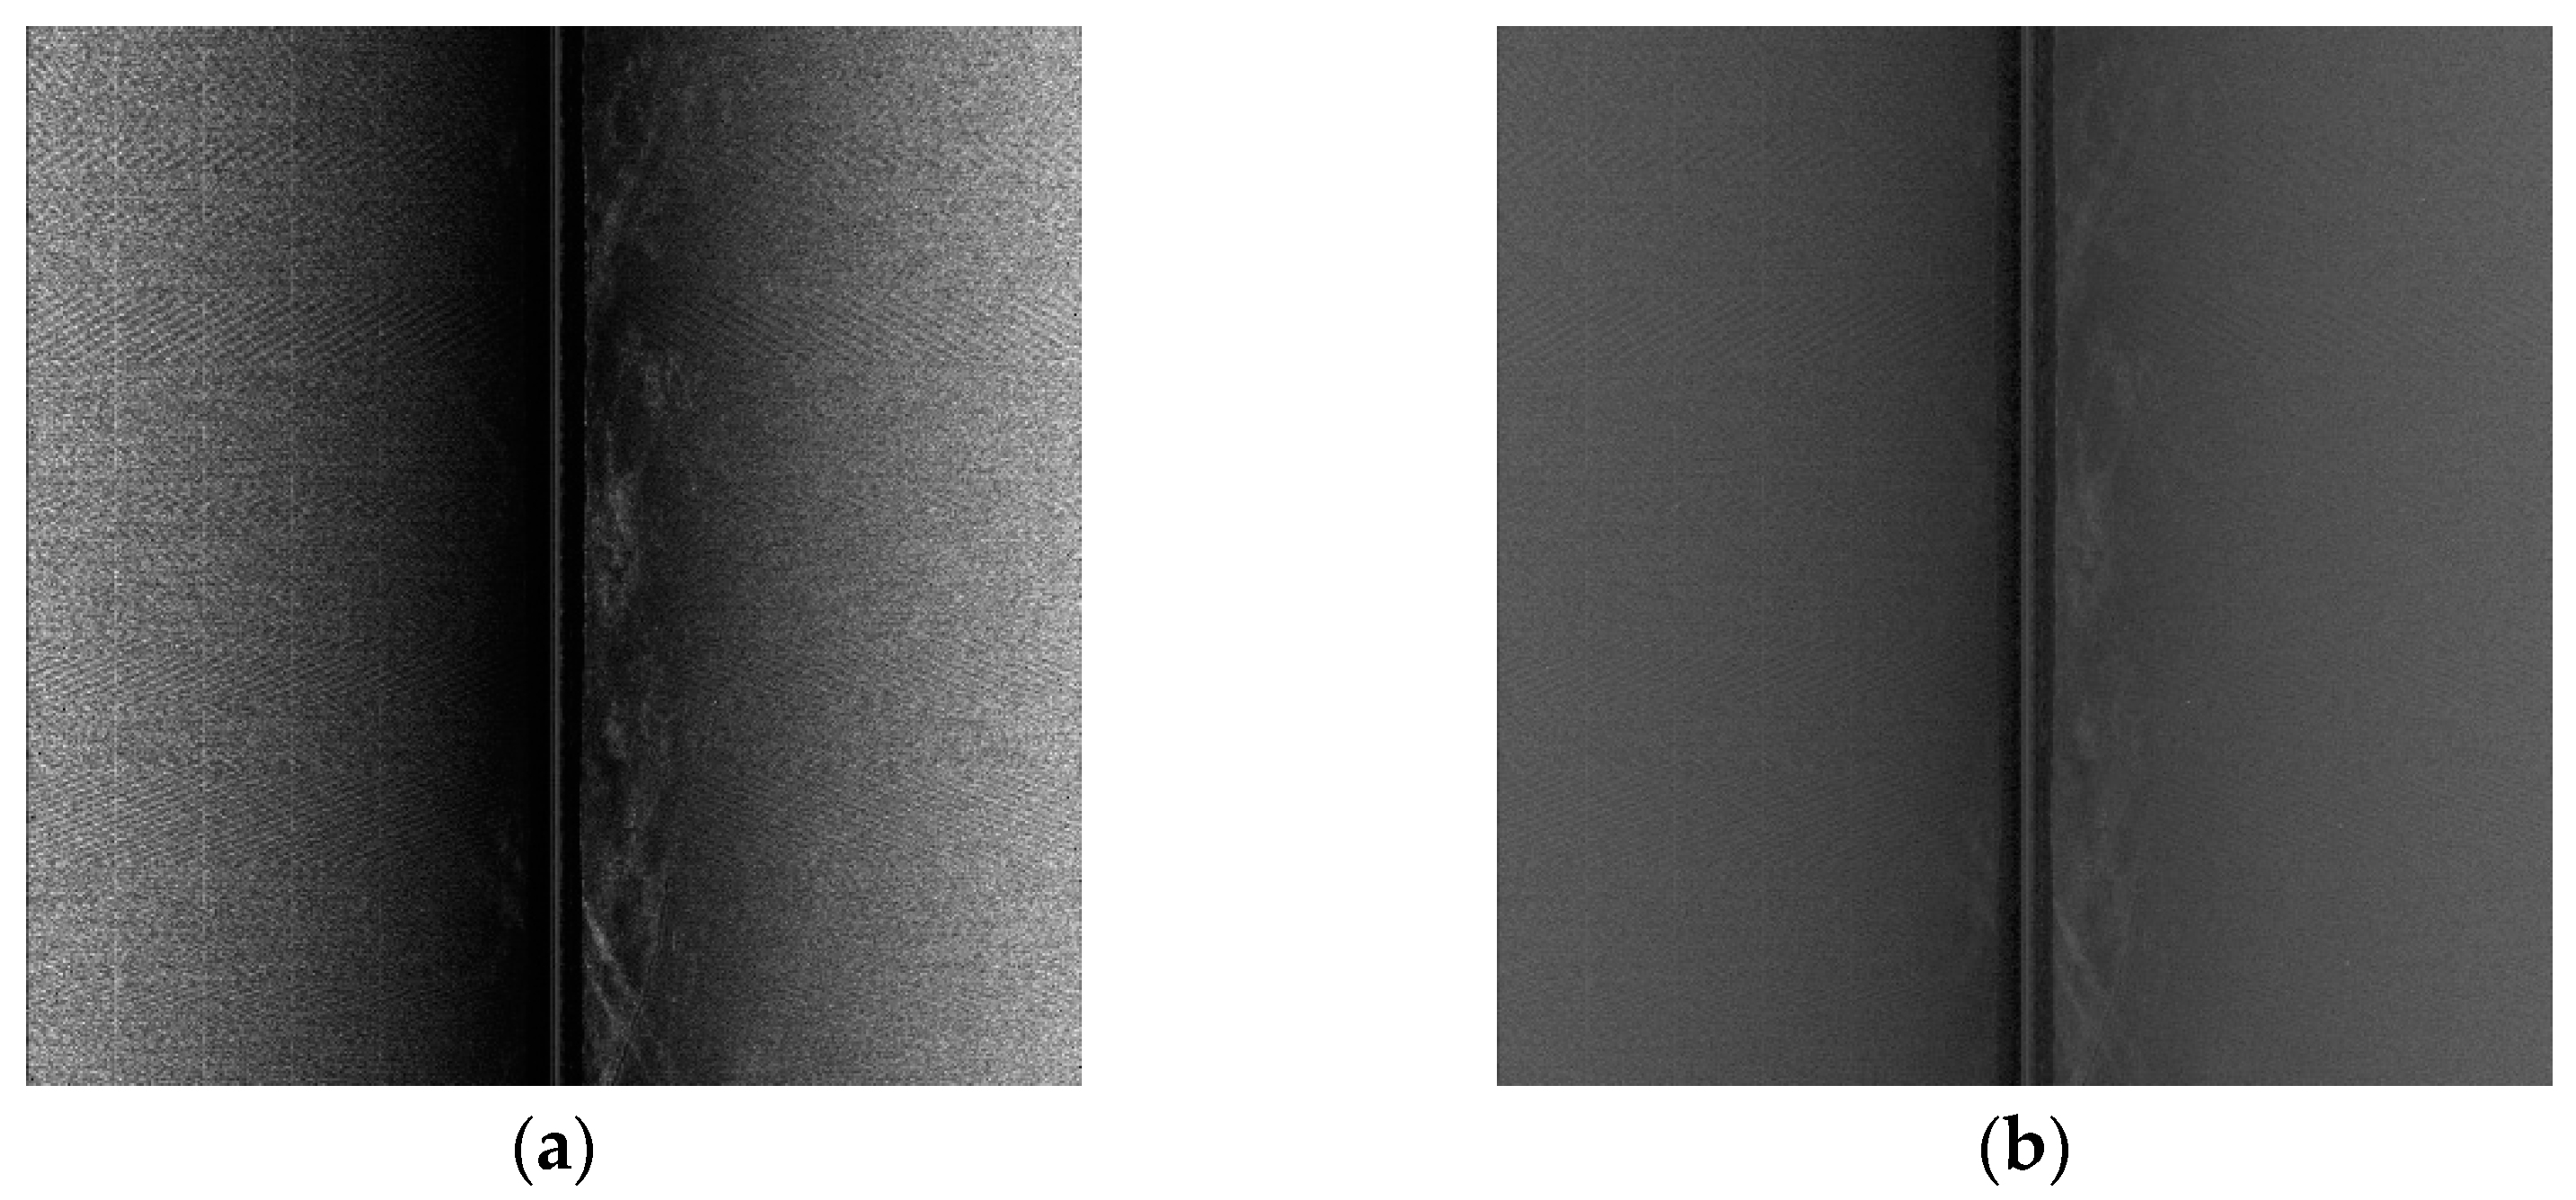
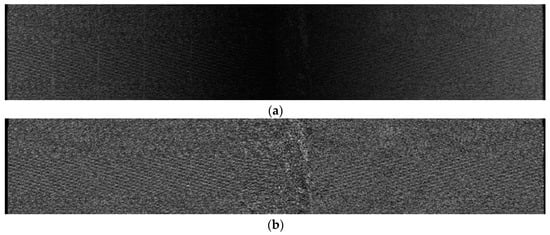
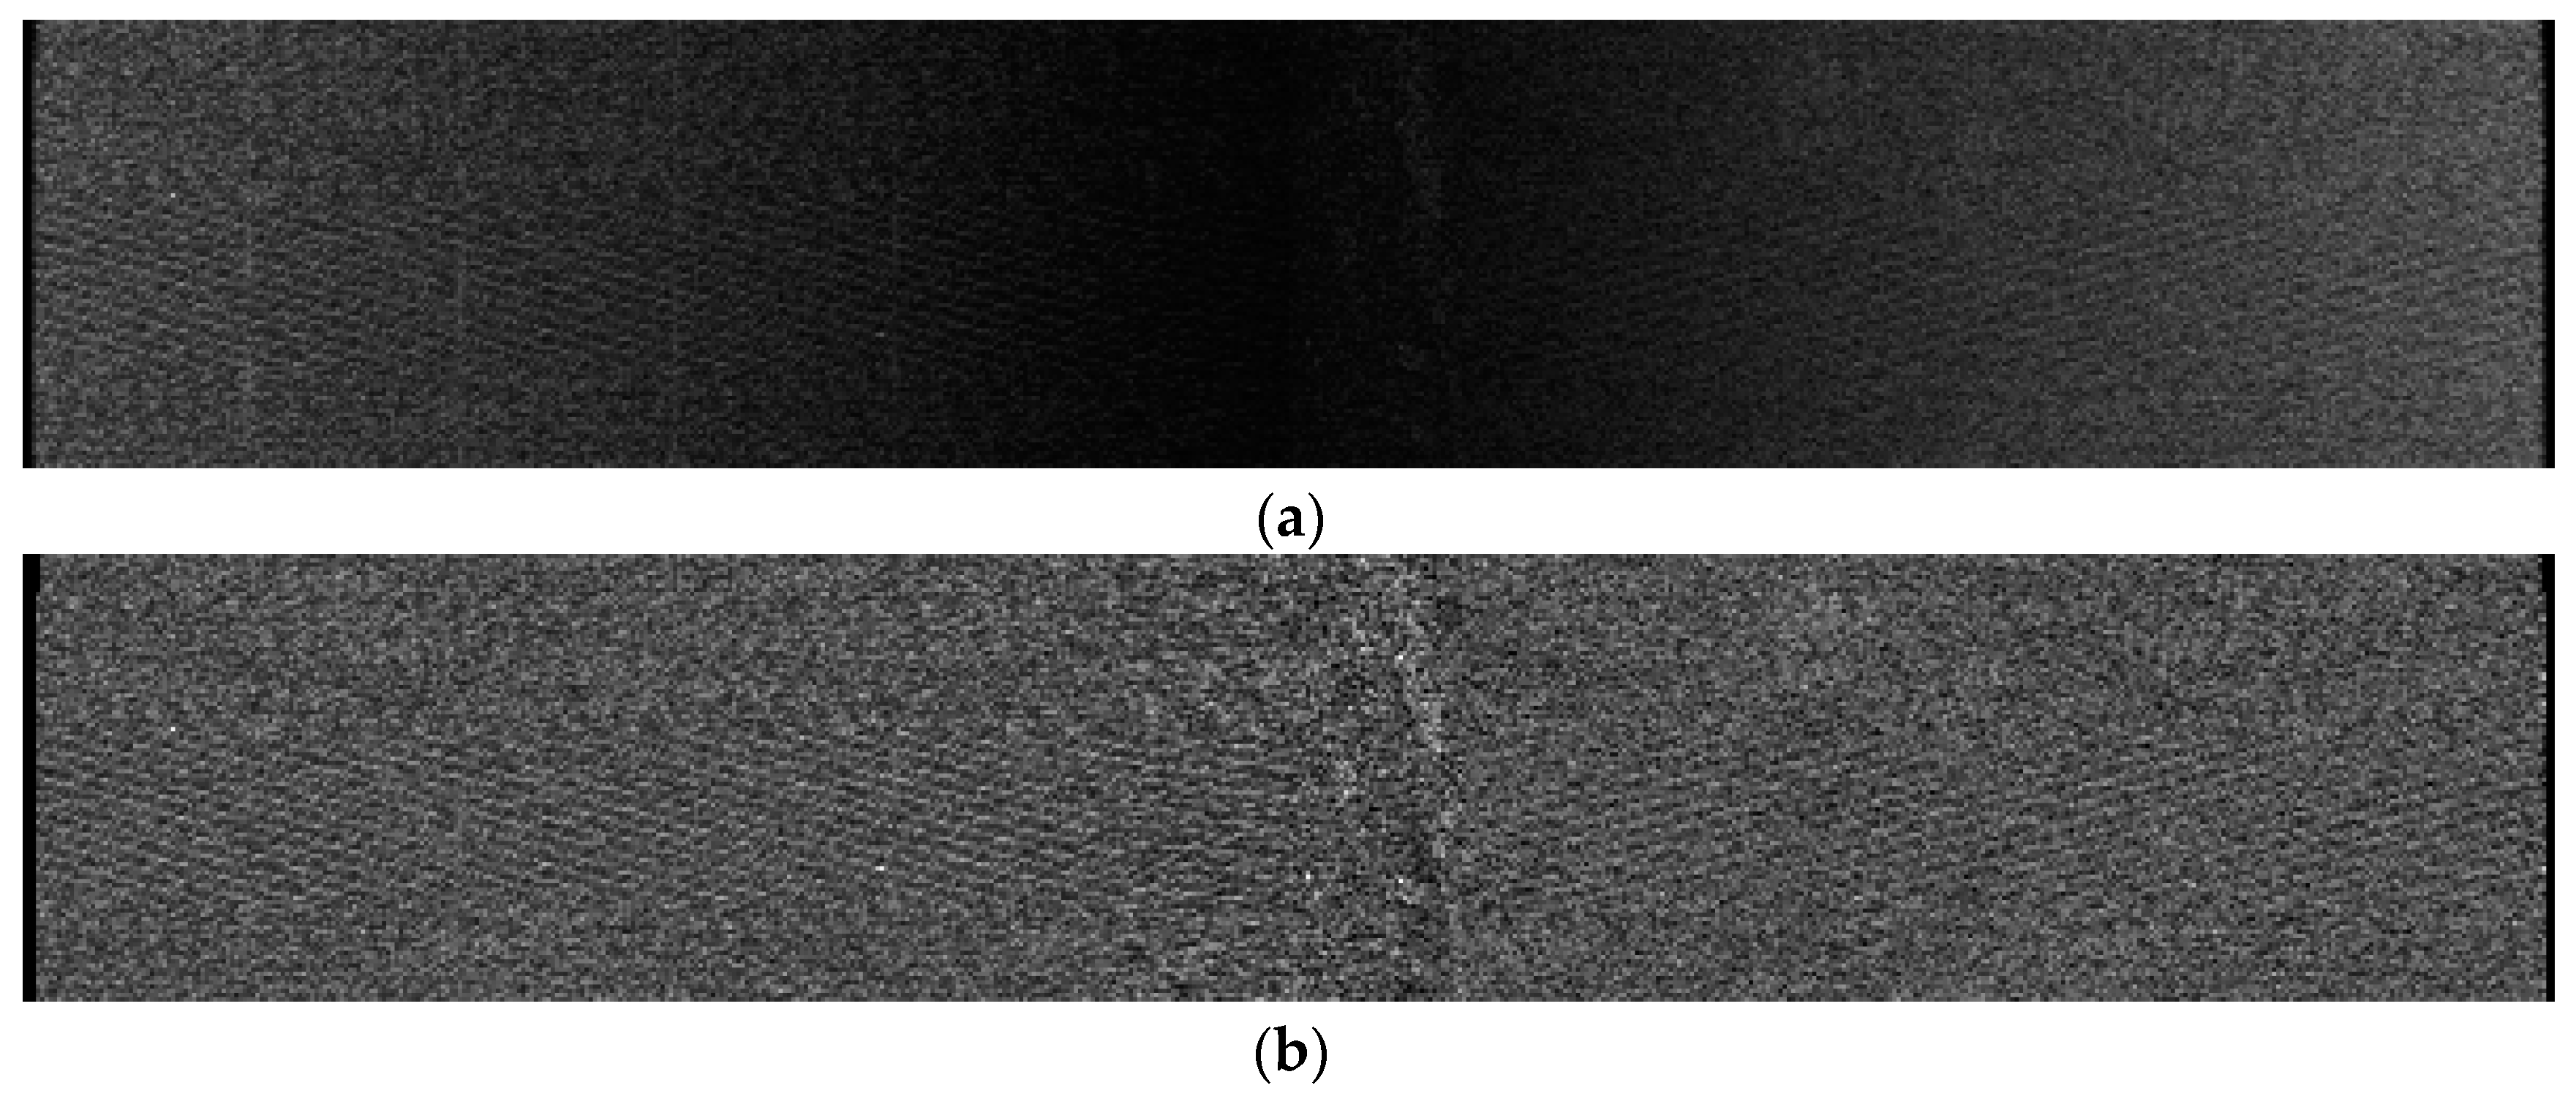
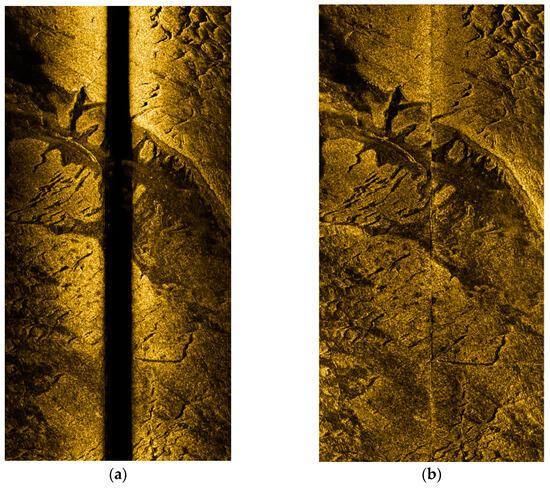
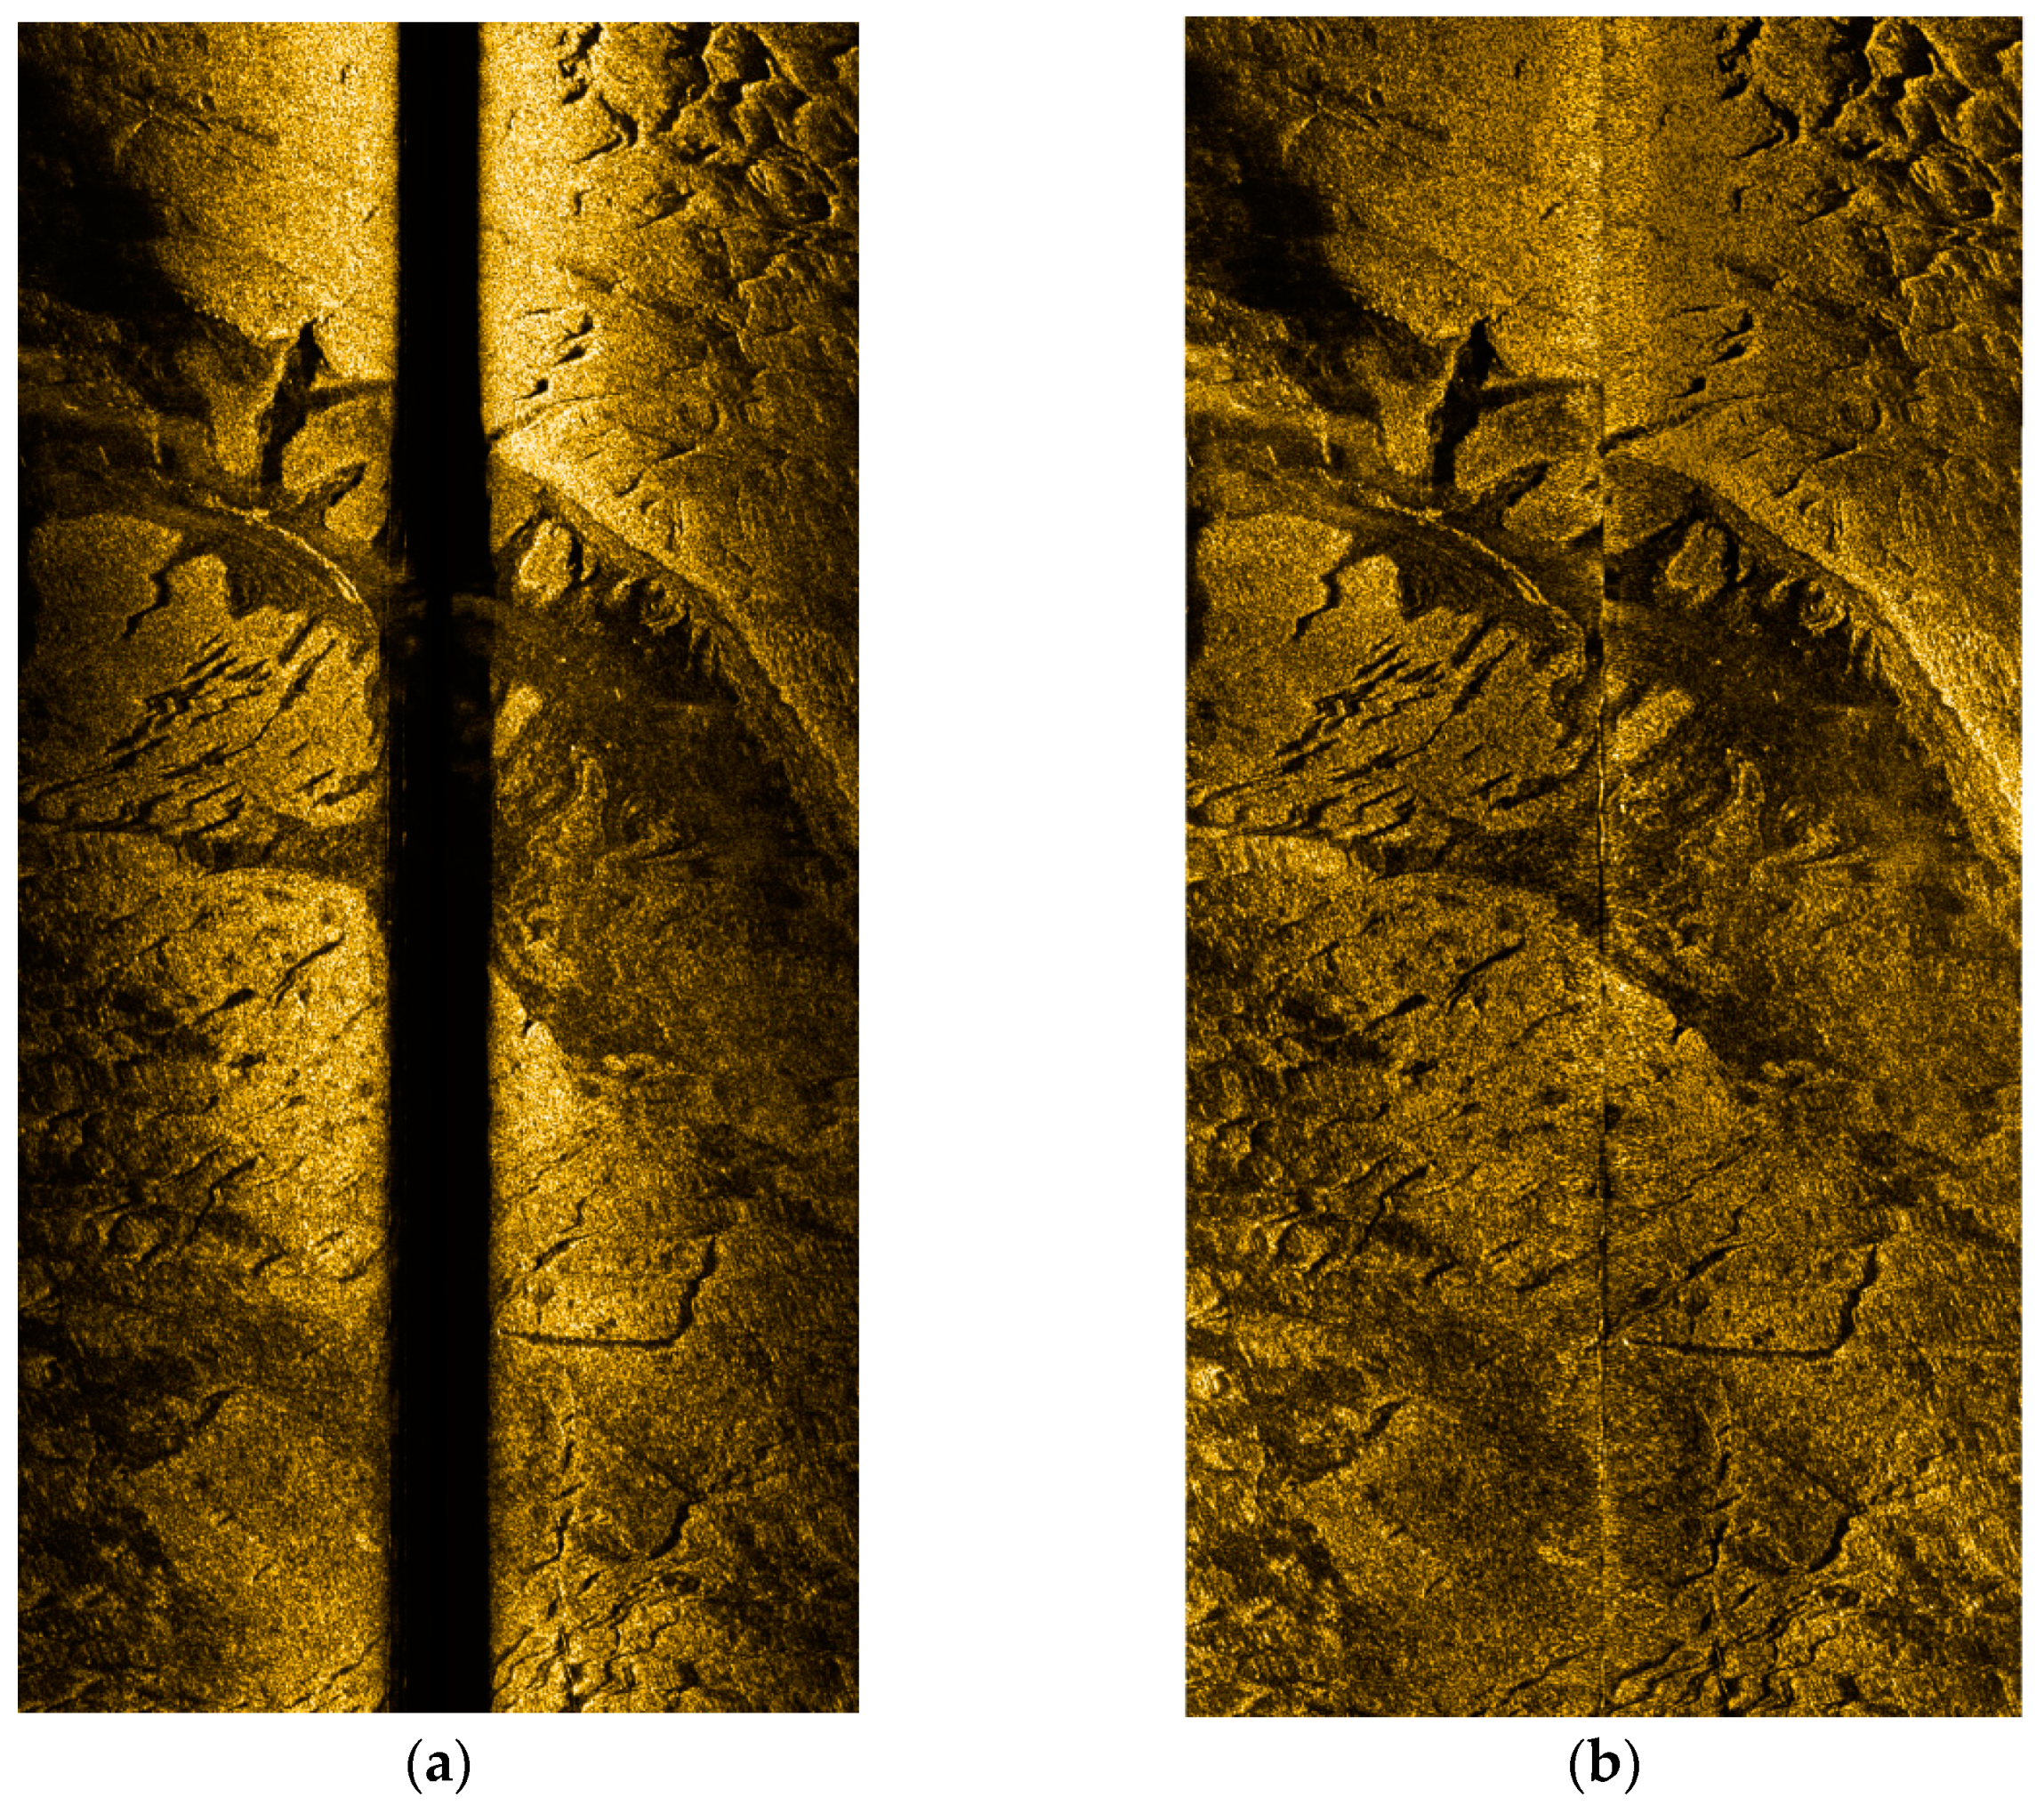
In order to verify the effectiveness of the radiometric distortion correction proposed in this paper, the waterfall image after seabed line tracking in the Bohai Bay area was selected for radiometric distortion correction. Figure 12a is the original waterfall image, showing that:
Figure 12.
Comparison of stripe images before and after radiometric distortion correction. (a) Before radiometric distortion correction; (b) after slant distance correction and radiometric distortion correction.
(1) There is an area in the central of the strip with a high amount of light, mainly due to the shorter sound wave propagation distance in the central area and the lower amount of energy loss, resulting in stronger echo intensity. This is manifested on the image as an area with a high amount of light, which does not correctly reflect the distribution of seabed material.
(2) In the transverse direction (orthogonal to the navigation track) of the strip image, with increasing sound wave propagation distance, the echo energy loss at the edge becomes greater, and the echo intensity becomes weaker, which is manifested in the image as darker color.
The random carry empirical compensation model can correct the above problems, but this correction is often not thorough due to the difference between the parameters of the empirical model and the actual water area, and the problem of uneven grayscale in the transverse direction still exists. The radiometric distortion correction method proposed in this paper is able to effectively eliminate the incomplete compensation problem caused by propagation loss of transverse echo intensity (grayscale). Figure 13b shows the results after correction using the method proposed in this paper. It can be seen that after slant distance correction and radiometric distortion correction, the grayscale of the image becomes more uniform in the transverse direction, correctly reflecting the distribution of the seabed material and the changes in geomorphological features. In addition, the time required to correct the radiation distortion is only 1 s, which meets the requirements of real-time processing.
Figure 13.
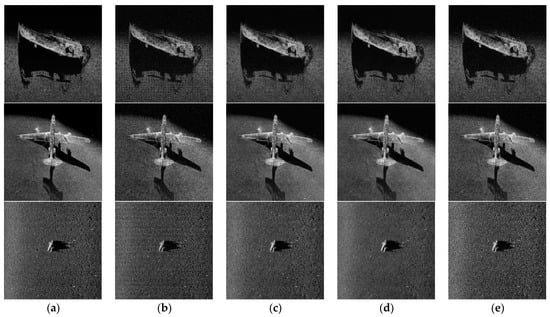
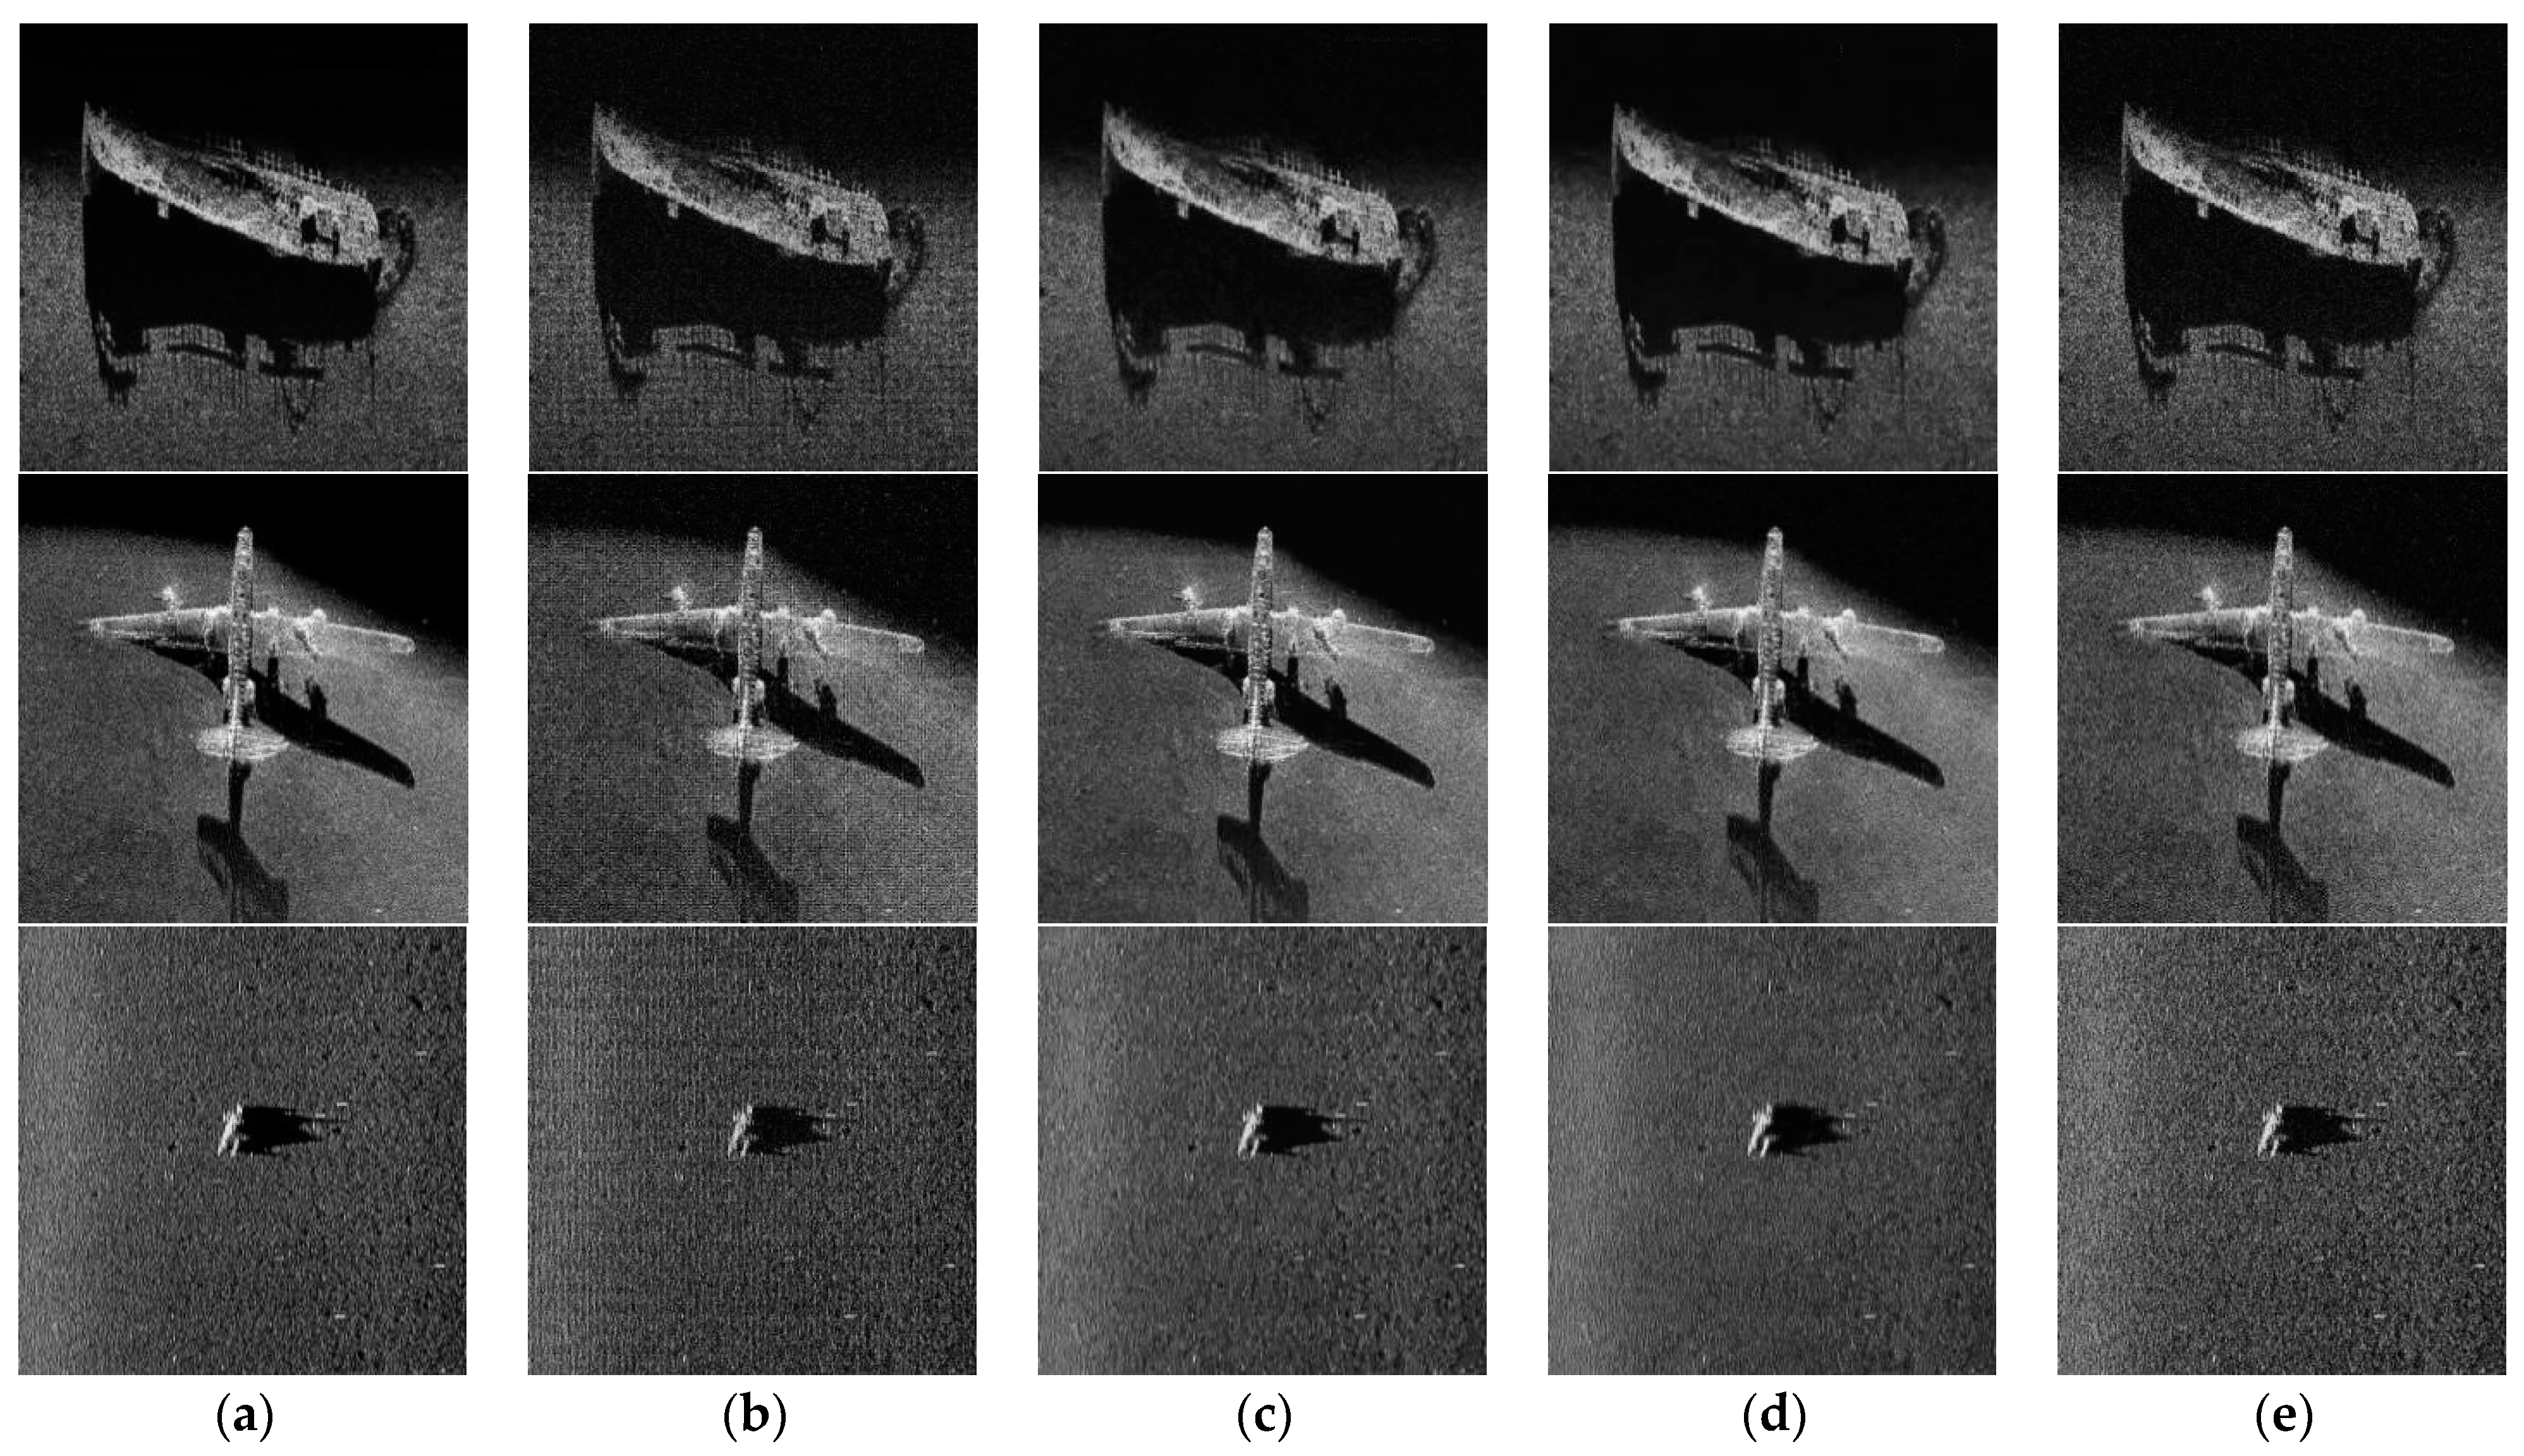
Effects of different image denoising methods on different images. (a) True value; (b) noise; (c) ADMM; (d) FlexISP; (e) DeepJoint.
3.2.3. Real-Time Noise Reduction
The results of the SSS image noise reduction experiment are evaluated from two main perspectives: qualitative and quantitative.
Qualitative evaluations are mainly performed based on subjective vision, and quantitative evaluations mainly use the peak signal-to-noise ratio (PSNR) of the image to evaluate the distortion performance of image noise reduction. The PSNR represents the logarithmic value of the mean square error between the original image and the processed image relative to ; the formula is as follows:
In the formula, MSE represents the mean square error between the denoised image X and the original image Y. H and W are the heights and widths of the two images, respectively; n is the number of bits per pixel, the unit of PSNR is dB, and the higher the value, the smaller the image distortion.
This experiment used three different images for testing, namely, a shipwreck image, an airplane wreckage image, and a frogman image. Of these, the shipwreck image is a local image obtained via SSS imaging, containing less noise, but with rich texture detail. This is used to test the effect of the algorithm on image texture detail during the noise reduction process. the airplane wreckage image is a local image obtained via SSS imaging; the texture is unclear, but the contour is obvious. It is used to test the impact on weak targets during the noise reduction process. In the frogman image, due to the water quality and the smaller size of the frogman, the resolution of the image is lower. It is used to test the effect of the noise reduction algorithm on low-resolution images. In addition, in order to better analyze the effect of image denoising from a qualitative perspective, grayscale images are used for display to avoid the influence of pseudocolor on image judgment, as well as to better compare the differences in denoising performance between algorithms.
Based on an analysis of the above experimental results in Table 1, of these four methods, DeepJoint exhibits the poorest denoising capability, while the ADMM method excels, having the best denoising performance. When considering the signal-to-noise ratio of the image, the ADMM method exhibits the highest similarity after post-processing, with the results being more aligned with human perception from a visual standpoint. The shipwreck image predominantly contains Gaussian random noise. While DeepJoint suppresses this noise to a certain extent, it also compromises the detailed texture of the shipwreck, leading to a blurred image. The signal-to-noise ratio of the processed image is noticeably lower than that of the other methods, indicating that it possesses the most significant image distortion. The ADMM method demonstrates superior noise removal with minimal distortion, showing improvements of 4.69 and 6.79 compared to flexISP and DeepJoint, respectively. The airplane wreckage image, conversely, has comparatively limited texture information and is of lower resolution. Following denoising with DeepJoint and flexISP, the image appears blurrier. However, the ADMM method manages to remove noise while preserving the delineation between ground objects and the seafloor, with improvements of 1.97 and 4.05, respectively, being observed over flexISP and DeepJoint. The frogman image is inherently blurred, and under low resolution, the blurring of the image edges by DeepJoint and flexISP becomes more pronounced. The denoising by ADMM is more distinct, but to a certain degree, the visual distortion is also more apparent, showing improvements of 0.027 and 1.99, respectively, compared to flexISP and DeepJoint. In summary, ADMM can eliminate or mitigate the impact of noise while ensuring minimal distortion of side-scan sonar images with varying resolutions, degrees of clarity, and sizes. Most notably, its noise reduction aligns most closely with human visual perception.
Table 1.
Comparison of peak signal-to-noise ratios (PSNRs) after image denoising.
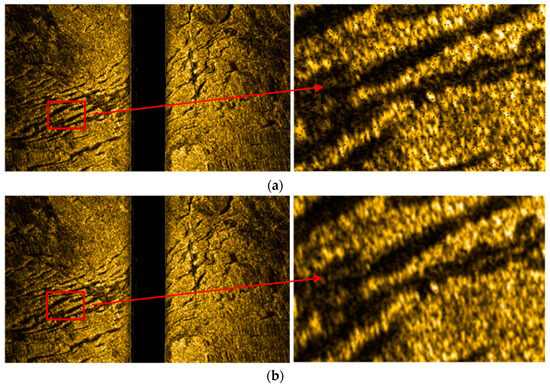
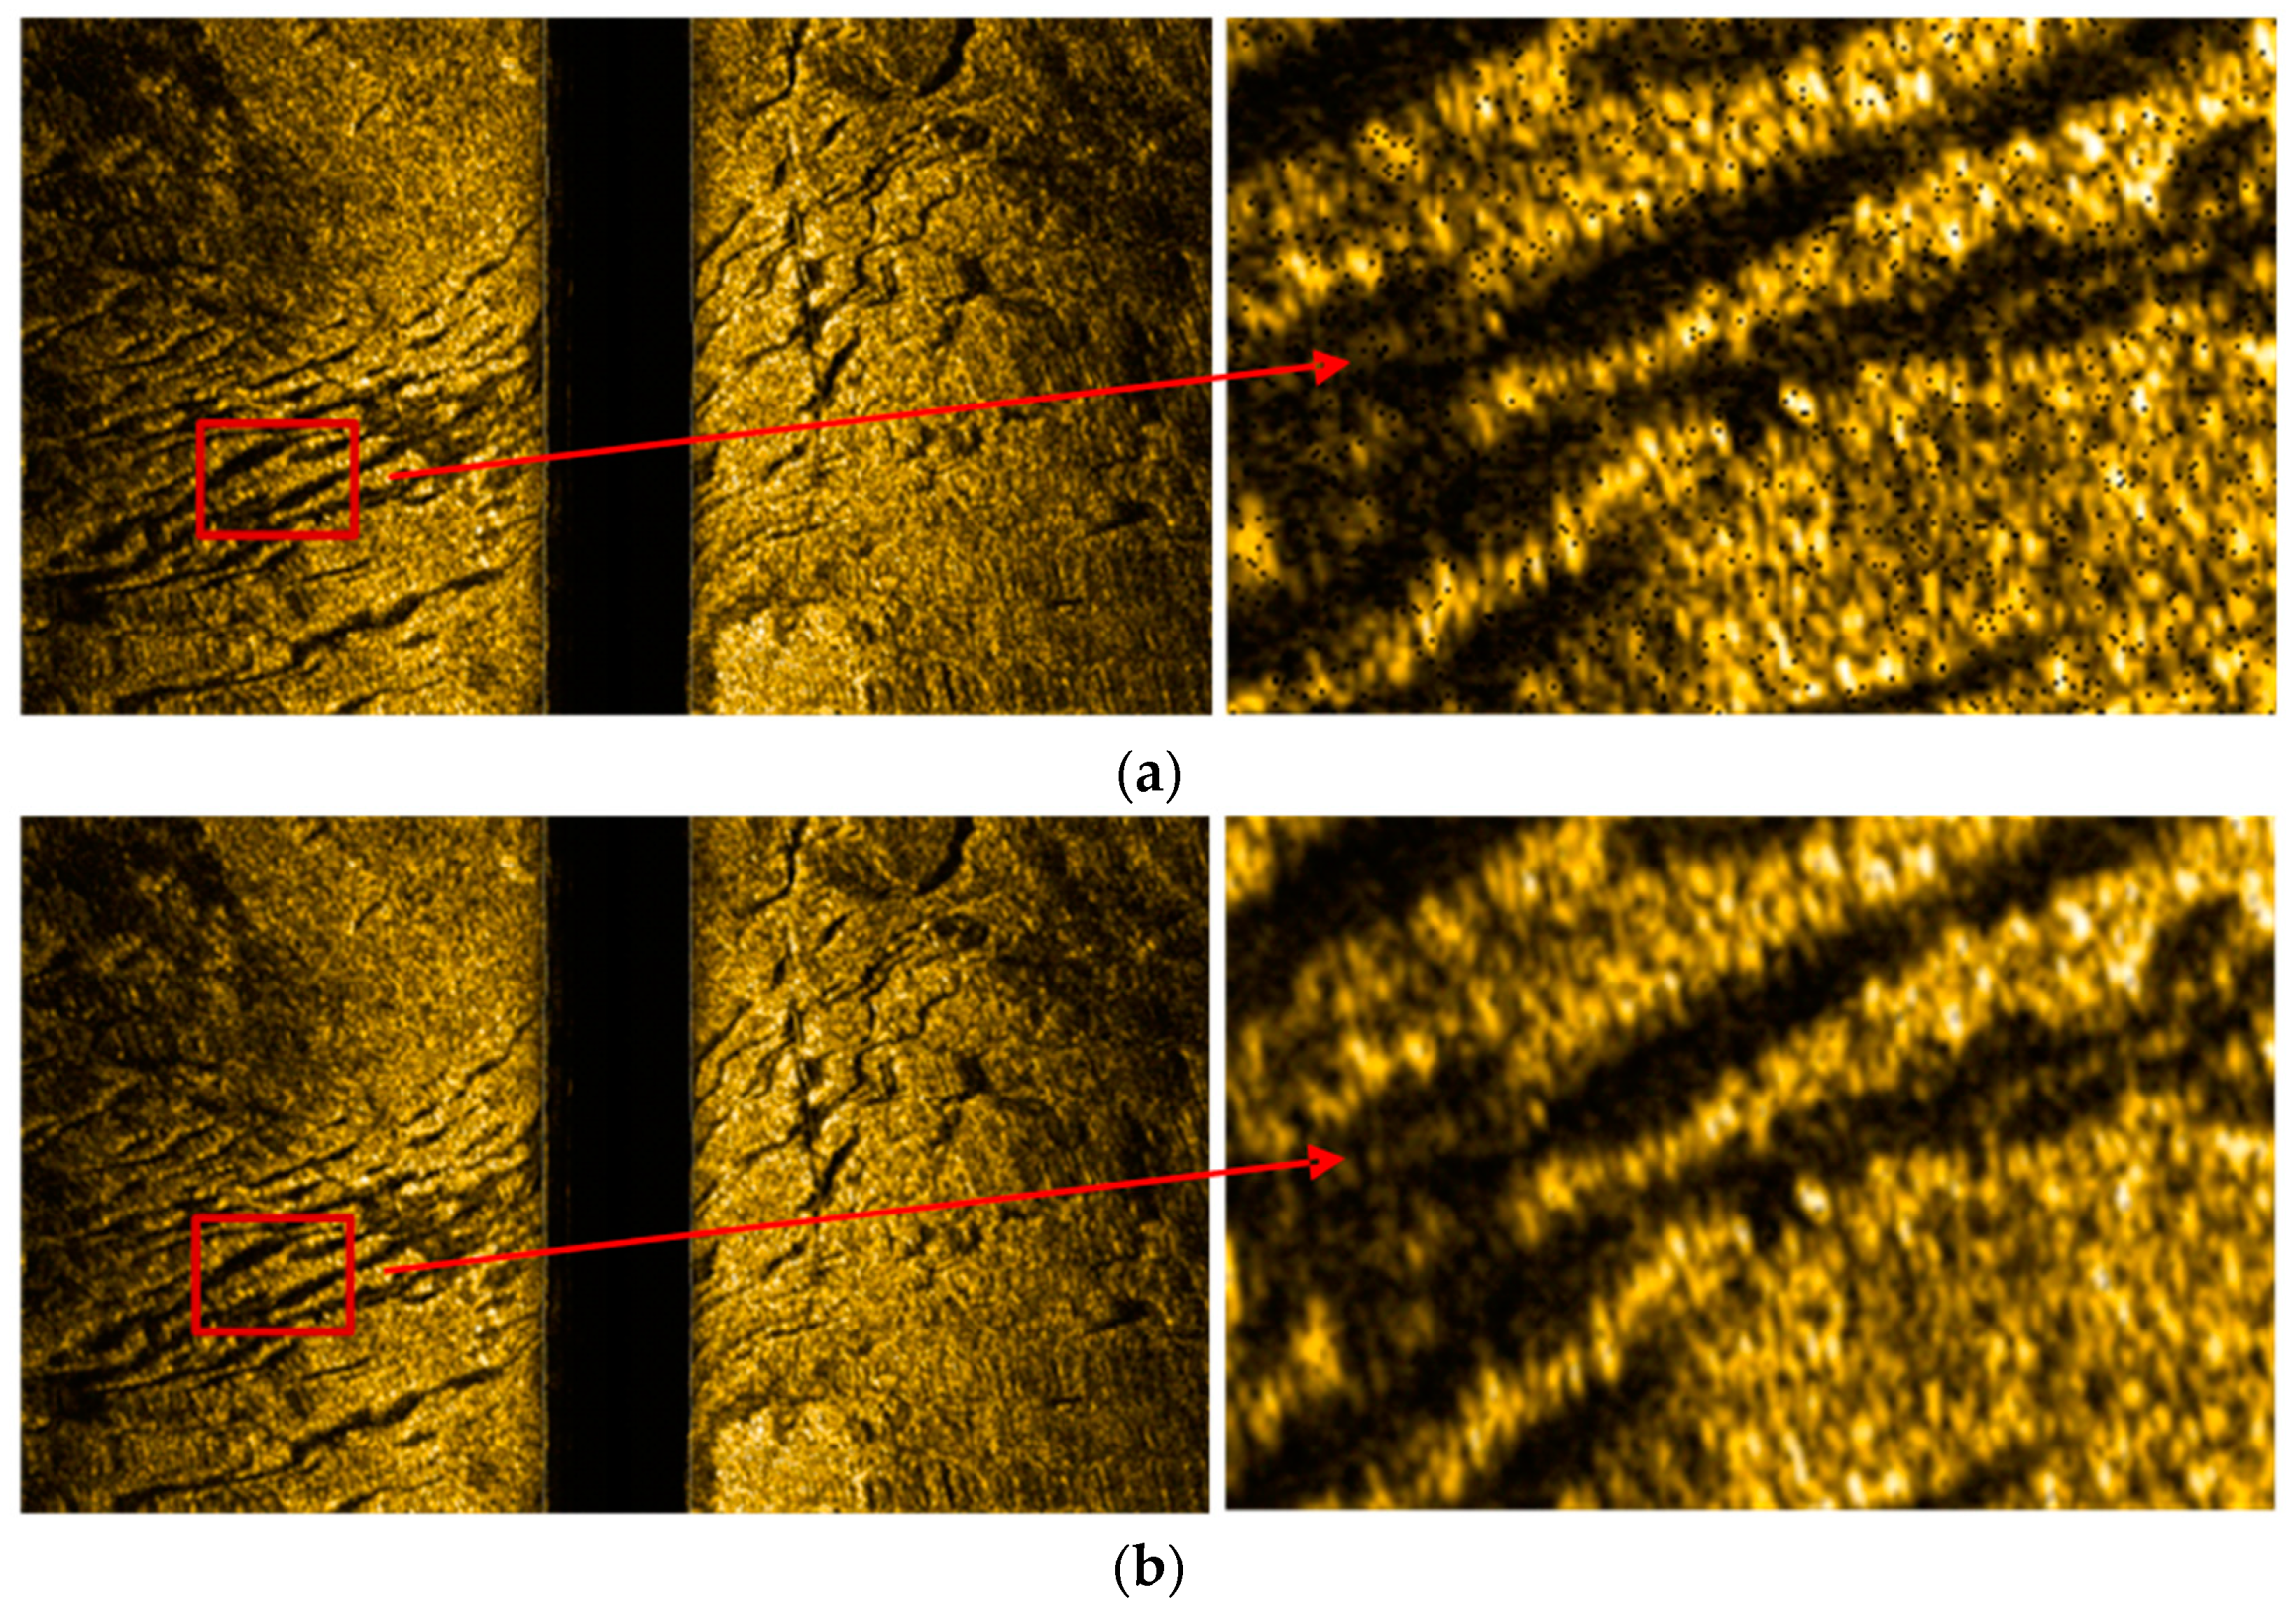
The real-time noise reduction method proposed in this paper was used to perform real-time noise reduction corrections on the waterfall map; a comparison of the results before and after is shown in Figure 14.
Figure 14.
Before and after comparison of the effect of noise reduction. (a) Image before noise reduction; (b) image after noise reduction.
From the comparative analysis of the effect of noise reduction in the above images, it can be seen that the method proposed in this paper can effectively eliminate the noise in the SSS waterfall image, while retaining the texture information and background information of the image itself; the noise reduction effect is good, and the time required is only 0.6 s.
3.2.4. Geographic Coding and Swath Image Stitching
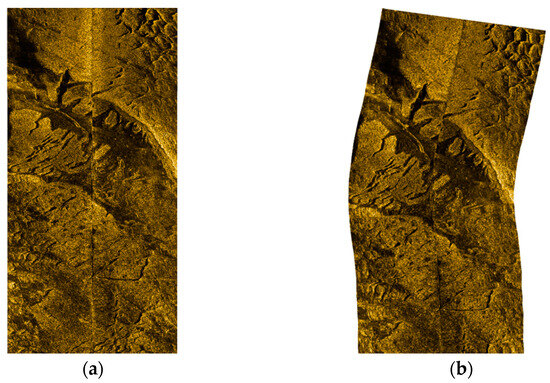
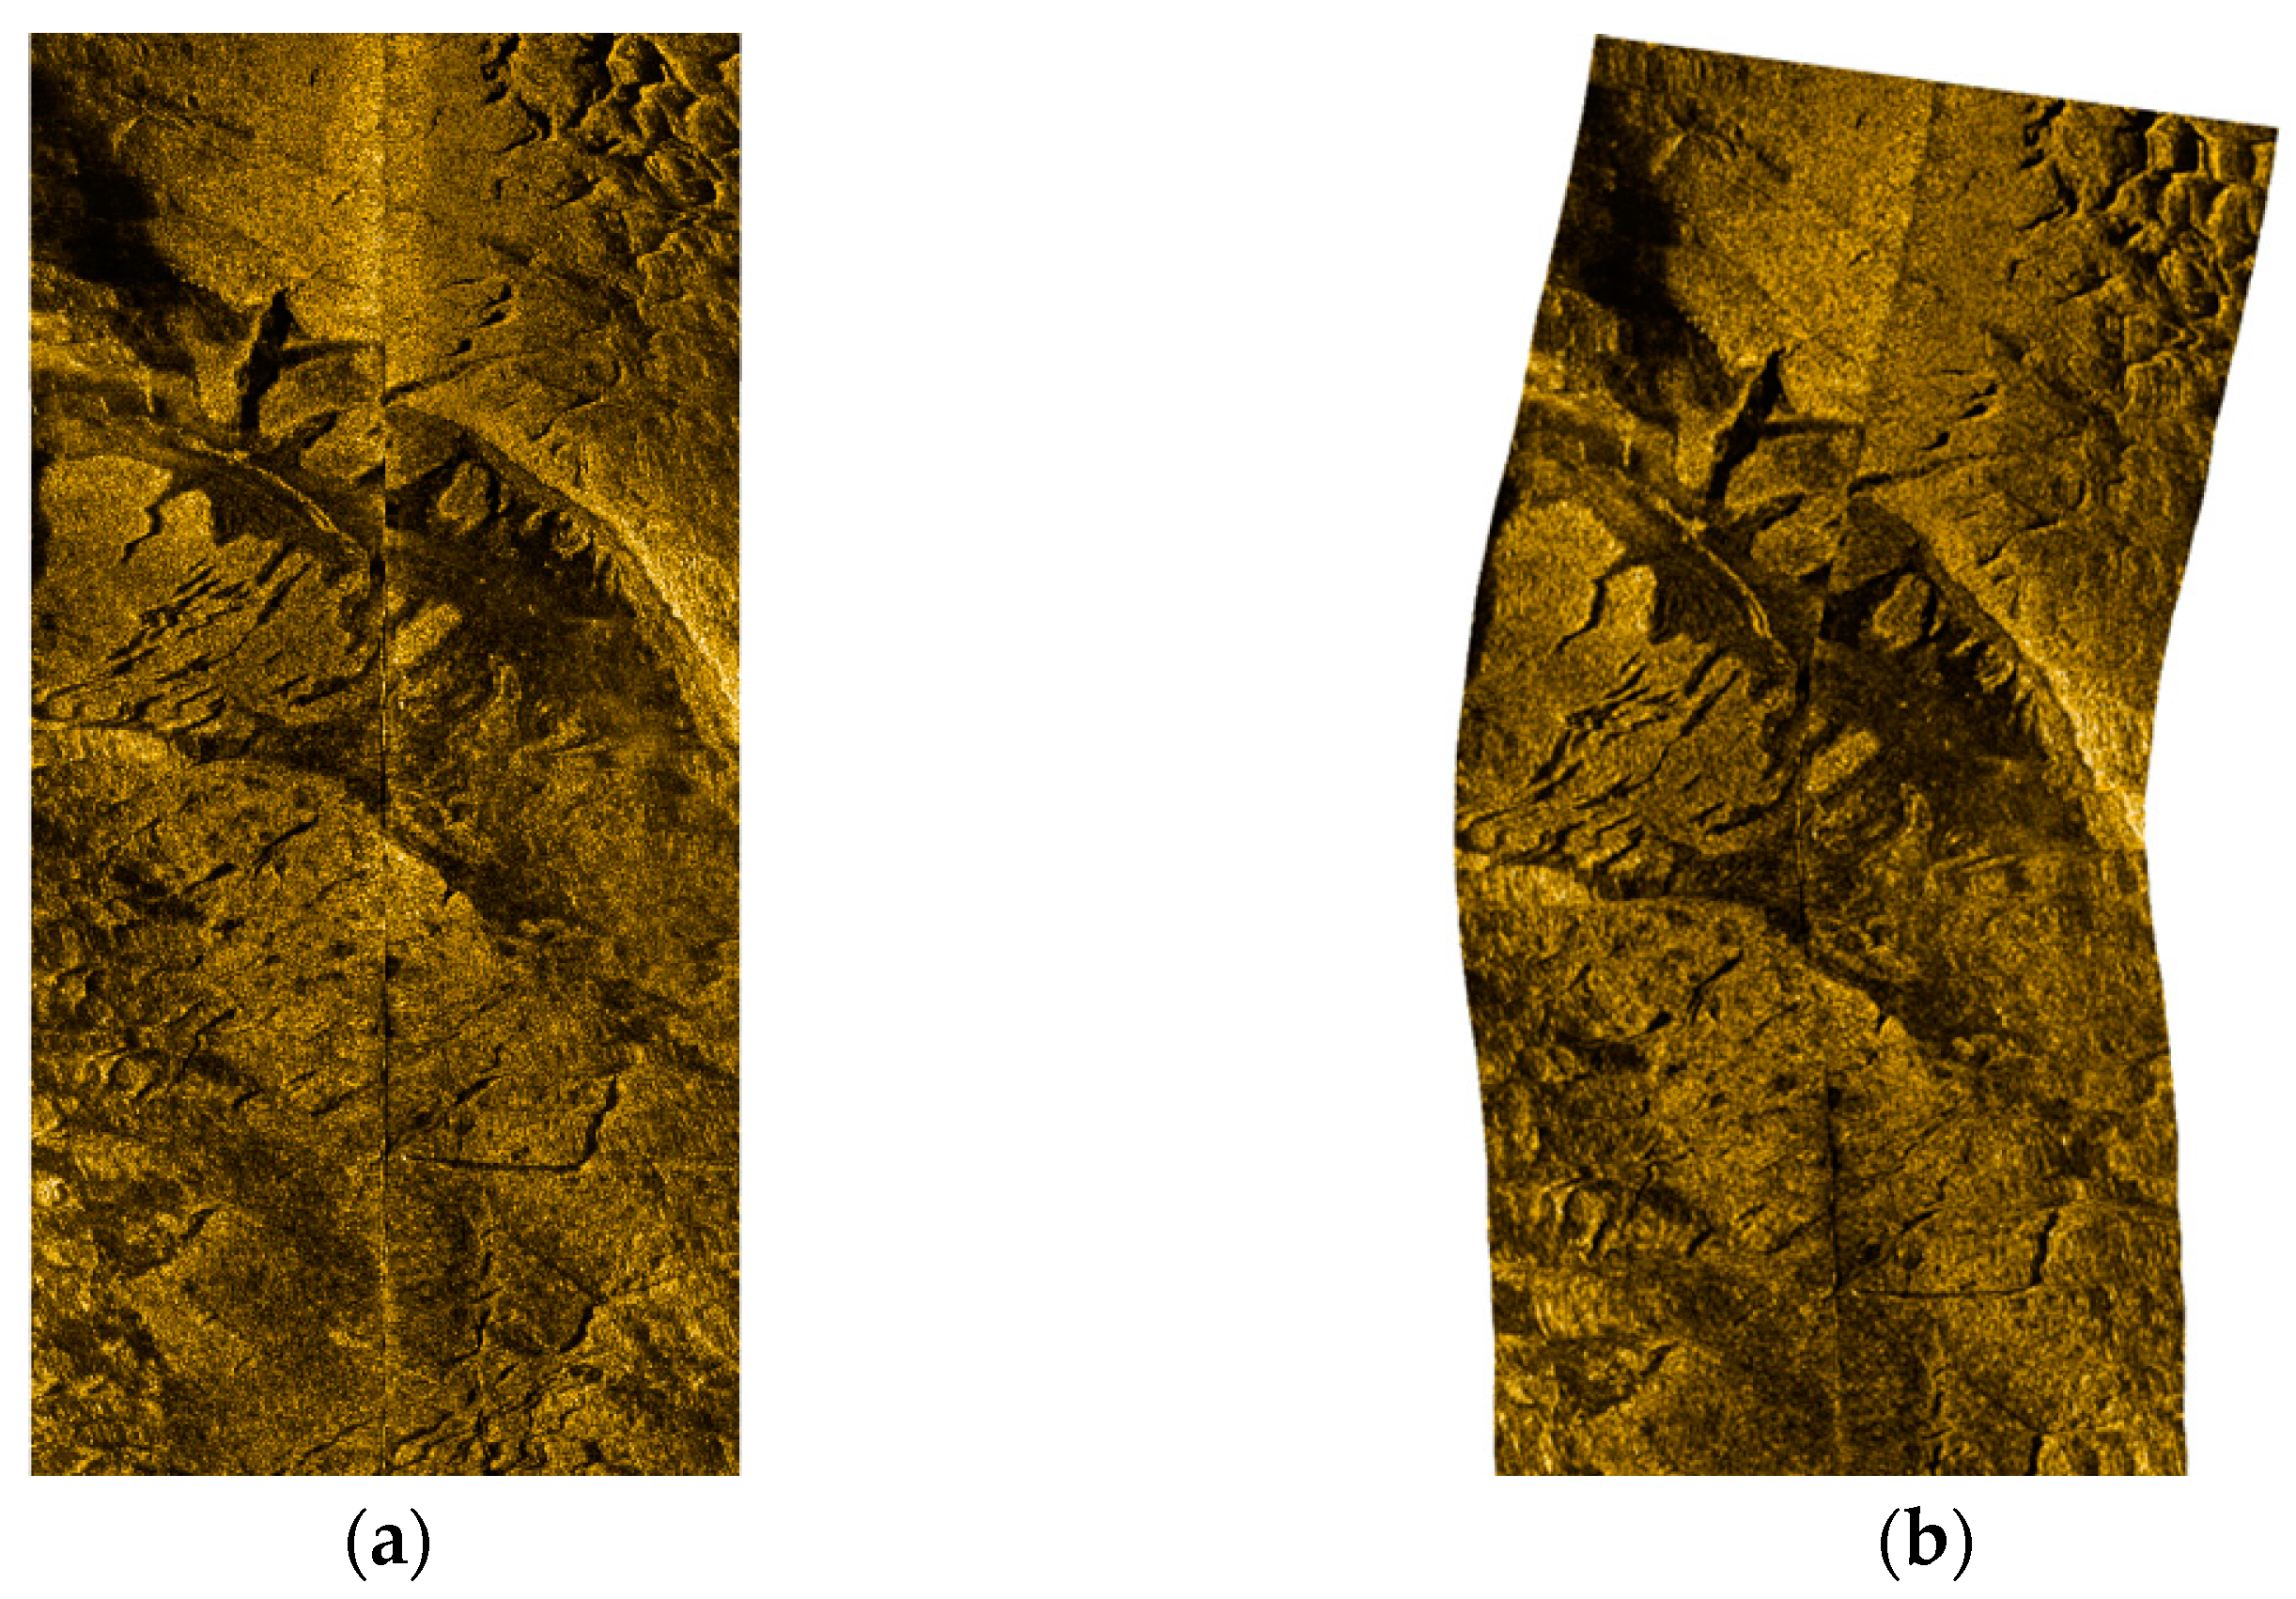
After the real-time bottom line tracking, radiation distortion correction, and noise reduction processing of the original data, a high-quality single-swath along-track image was obtained. In order to further obtain a high-quality swath image with geographic coordinates and realize large-area image stitching based on geographic coding, the waterfall map is corrected for slant distance on the basis of the seabed line extraction results. After the waterfall image has been corrected for slant distance, theoretically, the pixel in the center of each row corresponds to the position directly below the AUV. The geographic coordinates of the pixel in the middle of each row can be determined on the basis of the AUV’s position. Each row of pixels is perpendicular to the current heading of the AUV, and the width from each pixel to the center is all plane distance. Based on the above relationship, the position of each echo in terms of geographic coordinates can be calculated, and the geographic coding of a single swath image can be achieved, as shown in Figure 15.
Figure 15.
Images before and after swath geographic coding. (a) Swath planar image; (b) swath geographic coding image.
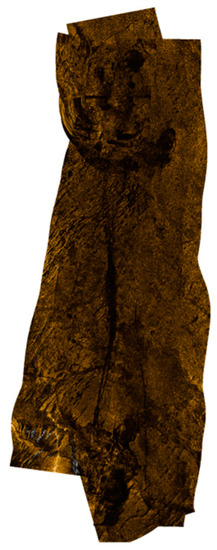
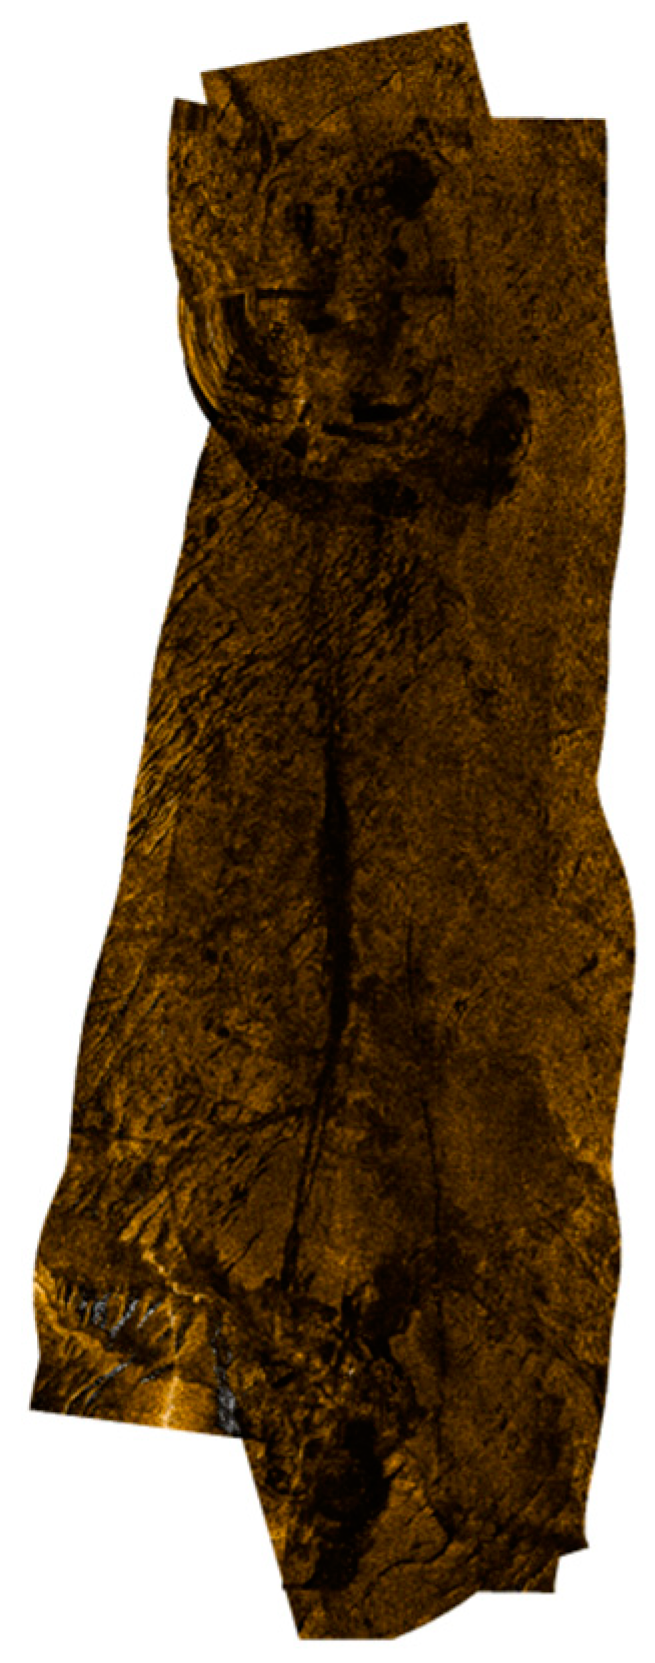
After real-time processing of the original data of the SSS, a high-quality SSS swath image with geographic coordinates was finally obtained. In order to obtain a large-area seafloor sonar image, it is necessary to mosaic multiple swath images after geographic coding to form a large-area seafloor topographic image. The five swath images measured in this area were processed as described above to obtain geographic coded images, and then the stitching of all swath images was performed in real time, and the resulting seafloor topographic image of the area is shown in Figure 16. The cumulative amount of time required for a single strip was about 3 s, and the total time was about 15 s.
Figure 16.
Multi-swath image stitching and seabed topography image of the measurement area.
4. Conclusions and Recommendation
In this paper, research was performed on a real-time processing and high-quality mapping method for SSS swath data obtained from an AUV, providing a process for real-time data processing, and solving the four key difficulties related to the real-time processing of SSS data, namely, real-time quality control of the original data, real-time automatic tracking of seabed lines, real-time correction of radiation distortion, and real-time image denoising. Real-time processing and acquisition of SSS swath images from an AUV was achieved, laying the foundation for the smooth implementation of highly time-sensitive tasks such as underwater real-time target detection. The primary contributions of this paper can be summarized as follows:
- Overview of post-processing procedures and methods for side-scan sonar data: A detailed analysis was conducted on the main issues faced by current methods when performing real-time processing.
- Real-time quality control of original observational data: A new control procedure was proposed, including the fusion of INS and DVL navigation data using Kalman filtering, bi-directional filtering methods for echo intensity, and a data filtering method using sliding average or comparison with seabed line tracking for altimeter and pressure gauge data.
- Automatic seabed line tracking: Based on the characteristics of waterfall images, a method based on the Unet network was designed. For real-time processing of single-swath data in the Bohai Bay, this method took only 0.4 s, achieving a high level of accuracy that was consistent with the post-processing results.
- Real-time correction of radiometric distortion: A method was introduced for automatically determining the baseline based on historical echo data. For real-time single-swath data in the Bohai Bay, this method was able to achieve angle-related radiometric distortion correction within 1 s.
- Real-time noise elimination: A method based on the Alternating Direction Multiplier Method (ADMM) was introduced for real-time noise elimination. For real-time processing of single-swath data in the Bohai Bay, this method took only 0.6 s, significantly improving the signal-to-noise ratio of swath images compared to traditional methods.
Overall, in actual experiments performed in the Bohai Bay, the processing time for real-time single-swath data was approximately 3 s, and the total processing time for five survey lines was also around 3 s, largely meeting the demands for real-time processing.
However, having achieved our current results in real-time processing, areas can be recognized that still need further refinement and enhancement:
- Further Optimization of Real-time Processing: Although we achieved real-time data processing, there is still room for improvement in processing efficiency and immediacy. Our method might face challenges especially in scenarios with large data volumes and complex conditions. Future work should further optimize our algorithm for such scenarios.
- Generalizability and Robustness of the Algorithm: While our real-time processing method performs excellently under certain specific scenarios, its general applicability and robustness remain to be addressed. Future research should focus on ensuring consistent and efficient performance across various scenes and environmental conditions.
- Integration with Other Advanced Technologies: Considering the advancements in modern deep learning and AI technologies, integrating our method with these cutting-edge technologies should be explored to further improve the accuracy and efficiency of data processing.
- Holistic System-Level Considerations: In real-time processing, beyond the algorithm itself, there is a need to consider the synergistic operation of the entire system, including sensor selection, data transmission, and storage, all of which can influence the effectiveness of real-time processing.
To better serve practical marine research and resource exploration applications, we recommend that future studies consider the aforementioned directions in greater depth, aiming to achieve more efficient, accurate, and robust real-time processing methods.
Author Contributions
Conceptualization, Y.T. and J.W.; methodology, Y.T. and J.W.; software, Y.T.; validation, S.J. and J.Z.; formal analysis, S.J. and G.B.; investigation, Y.T. and J.W.; resources, S.J., L.W. and J.Z.; data curation, Y.T. and X.Z.; writing—original draft preparation, Y.T.; writing—review and editing, S.J. and G.B.; visualization, Y.T. and X.Z.; supervision, G.B. and J.Z.; project administration, J.Z. and S.J.; funding acquisition, J.Z. and S.J. All authors have read and agreed to the published version of the manuscript.
Funding
This research was funded by the National Natural Science Foundation of China, grant numbers 41876103 and 42176186, and the National Key Research and Development Program, grant number 2022YFC2808303.
Institutional Review Board Statement
Not applicable.
Informed Consent Statement
Not applicable.
Data Availability Statement
Access to the data will be considered upon request to the authors.
Conflicts of Interest
The authors declare no conflict of interest.
References
- Arshad, M.R. Recent advancement in sensor technology for underwater applications. Indian J. Mar. Sci. 2009, 38, 267–273. [Google Scholar]
- Anderson, J.T.; Van Holliday, D.; Kloser, R.; Reid, D.G.; Simard, Y. Acoustic seabed classification: Current practice and future directions. ICES J. Mar. Sci. 2008, 65, 1004–1011. [Google Scholar] [CrossRef] [Scilit]
- Coiras, E.; Petillot, Y.; Lane, D.M. An expectation-maximization framework for the estimation of bathymetry from side-scan sonar images. In Proceedings of the IEEE Europe OCEANS Conference, Brest, France, 20–23 June 2005; pp. 261–264. [Google Scholar]
- Johnson, S.G.; Deaett, M.A. The application of automated recognition techniques to side-scan sonar imagery. IEEE J. Ocean. Eng. 1994, 19, 138–144. [Google Scholar] [CrossRef] [Scilit]
- Petillot, Y.R.; Reed, S.R.; Bell, J.M. Real time AUV pipeline detection and tracking using side scan sonar and multi-beam echo-sounder. In Proceedings of the OCEANS ‘02 MTS/IEEE, Biloxi, MI, USA, 29–31 October 2002; Volume 1, pp. 217–222. [Google Scholar]
- Sahoo, A.; Dwivedy, S.K.; Robi, P. Advancements in the field of autonomous underwater vehicle. Ocean. Eng. 2019, 181, 145–160. [Google Scholar] [CrossRef] [Scilit]
- Yu, S.C. Development of real-time acoustic image recognition system using by autonomous marine vehicle. Ocean. Eng. 2008, 35, 90–105. [Google Scholar] [CrossRef] [Scilit]
- Wu, Y.; Zhao, Y.; Lang, S. Development of Autonomous Underwater Vehicles Technology. Strateg. Study CAE 2020, 22, 26–31. [Google Scholar] [CrossRef] [Scilit]
- Tang, Y.; Wang, L.; Jin, S.; Zhao, J.; Huang, C.; Yu, Y. AUV-Based Side-Scan Sonar Real-Time Method for Underwater-Target Detection. J. Mar. Sci. Eng. 2023, 11, 690. [Google Scholar] [CrossRef] [Scilit]
- Coiras, E.; Petillot, Y.; Lane, D.M. Multiresolution 3-D Reconstruction From Side-Scan Sonar Images. IEEE Trans. Image Process. 2007, 16, 382–390. [Google Scholar] [CrossRef] [Scilit]
- Blondel, P. The Handbook of Sidescan Sonar; Springer Science & Business Media: Berlin/Heidelberg, Germany, 2009; pp. 249–276. [Google Scholar] [CrossRef] [Scilit]
- Bochkovskiy, A.; Wang, C.Y.; Liao, H.Y. YOLOv4: Optimal Speed and Accuracy of Object Detection. arXiv 2020, arXiv:2004.10934. [Google Scholar]
- Peng, C.; Fan, S.; Cheng, X.; Cao, Y.; Zeng, G. An Improved Side Scan Sonar Image Processing Framework for Autonomous Underwater Vehicle Navigation. In Proceedings of the 15th International Conference on Underwater Networks & Systems, Guangdong, China, 22–24 November 2021; p. 1. [Google Scholar]
- Yan, J.; Meng, J.; Zhao, J. Bottom Detection from Backscatter Data of Conventional Side Scan Sonars through 1D-UNet. Remote Sens. 2021, 13, 1024. [Google Scholar] [CrossRef] [Scilit]
- Zheng, G.; Zhang, H.; Li, Y.; Zhao, J. A Universal Automatic Bottom Tracking Method of Side Scan Sonar Data Based on Semantic Segmentation. Remote. Sens. 2021, 13, 1945. [Google Scholar] [CrossRef] [Scilit]
- Yu, H.; Li, Z.; Li, D.; Shen, T. Bottom Detection Method of Side-Scan Sonar Image for AUV Missions. Complexity 2020, 2020, 1. [Google Scholar] [CrossRef] [Scilit]
- Zhao, J.; Yan, J.; Zhang, H.; Meng, J. A New Radiometric Correction Method for Side-Scan Sonar Images in Consideration of Seabed Sediment Variation. Remote. Sens. 2017, 9, 575. [Google Scholar] [CrossRef] [Scilit]
- Zhao, J.H.; Wang, X.; Zhang, H.M.; Wang, A.X. A Comprehensive Bottom-Tracking Method for Sidescan Sonar Image Influenced by Complicated Measuring Environment. IEEE J. Ocean. Eng. 2017, 42, 619–631. [Google Scholar] [CrossRef]
- Wang, X.; Wu, Q.H.; Wang, A.X. A Comprehensive Radiometric Distortion Correction Method for Side-scan Sonar. J. Geod. Geodyn. 2018, 38, 1174–1179. [Google Scholar]
- Wang, A.X.; Church, I.; Gou, J.; Zhao, J.H. Sea bottom line tracking in side-scan sonar image through the combination of points density clustering and chains seeking. J. Mar. Sci. Technol. 2020, 25, 849–865. [Google Scholar] [CrossRef] [Scilit]
- Wang, A.X. 3D Seabed Terrain Recovery Based on Side-Scan Sonar Images; Wuhan University: Wuhan, China, 2014. [Google Scholar]
- Buscombe, D. Shallow water benthic imaging and substrate characterization using recreational-grade sidescan-sonar. Environ. Model. Softw. 2017, 89, 1–18. [Google Scholar] [CrossRef] [Scilit]
- Shih, C.C.; Horng, M.F.; Tseng, Y.R.; Su, C.F.; Chen, C.Y. An Adaptive Bottom Tracking Algorithm for Side-Scan Sonar Seabed Mapping. In Proceedings of the 2019 IEEE Underwater Technology (Ut), Taiwan, China, 16–19 April 2019. [Google Scholar]
- Zerr, B.; Mailfert, G.; Bertholom, A.; Ayreault, H. Sidescan Sonar Image Processing for AUV Navigation. Eur. Ocean. 2005, 1, 124–130. [Google Scholar]
- Langer, D.; Hebert, M. Building qualitative elevation maps from side scan sonar data for autonomous underwater navigation. In Proceedings of the IEEE International Conference on Robotics and Automation, Sacramento, CA, USA, 9–11 April 1991; Volume 3, pp. 2478–2483. [Google Scholar]
- Chen, G.Y.; Bui, T.D. Image denoising with neighbour dependency and customized wavelet and threshold. Pattern Recognit 2005, 38, 115–124. [Google Scholar] [CrossRef] [Scilit]
- Acosta, G.G.; Villar, S.A. Accumulated CA-CFAR process in 2-D for online object detection from sidescan sonar data. IEEE J. Ocean. Eng. 2015, 40, 558–569. [Google Scholar] [CrossRef] [Scilit]
- Ding, G.; Song, Y.; Guo, J.; Feng, C.; Li, G.; Yan, T.; He, B. Side-scan sonar image segmentation using kernel based extreme learning machine. In Proceedings of the 2017 IEEE Underwater Technology (UT), Busan, Republic of Korea, 21–24 February 2017; pp. 1–5. [Google Scholar] [CrossRef] [Scilit]
- Long, Z.Y. A sea surface detection and eliminating method of side-scan sonar image. Hydrogr. Surv. Charting 2022, 42, 13–17. [Google Scholar]
- Huang, X.D. A new image fusion method based on Laplacian pyramid in wavelet field. Electron. Sci. Technol. 2014, 27, 170–173. [Google Scholar]
- Ye, X.; Li, P.; Deng, Y. A side scan sonar image denoising algorithm based on compound of fuzzy weighted average and Kalman filter. In Proceedings of the 2012 IEEE International Conference on Mechatronics and Automation, Chengdu, China, 5–8 August 2012; pp. 720–724. [Google Scholar]
- Tin, H.W.; Leu, S.W.; Wang, F.T.; Wen, C.C.; Chang, S.H. Denoising Algorithm Based on Fractal-Wavelet coding and its Application to Side-scan Sonar Image. In Proceedings of the 2013 International Symposium on Physics and Mechanics of New Materials and Underwater Applications (PHENMA 2013), Kaohsiung, Taiwan, 5–8 June 2013; p. 30. [Google Scholar]

Disclaimer/Publisher’s Note: The statements, opinions and data contained in all publications are solely those of the individual author(s) and contributor(s) and not of MDPI and/or the editor(s). MDPI and/or the editor(s) disclaim responsibility for any injury to people or property resulting from any ideas, methods, instructions or products referred to in the content. |
© 2023 by the authors. Licensee MDPI, Basel, Switzerland. This article is an open access article distributed under the terms and conditions of the Creative Commons Attribution (CC BY) license (https://creativecommons.org/licenses/by/4.0/).