


Abstract
Plant disease detection in natural environments is significantly challenged by variations in lesion scales and interference from complicated background clutter. Nevertheless, current models often remain limited in effectively capturing multi-scale features and mitigating background interference simultaneously. To tackle these challenges, we present TGL-YOLO, an improved detection network built on the YOLO11 framework. Methodologically, we introduce the Tri-Scale Dynamic Block (TSDBlock) to adaptively extract fine-grained features across highly variable lesion sizes. Furthermore, a Gated Pyramid Spatial Transformer (GPST) is designed to fuse cross-scale features and suppress background interference, while a Large Separable Pyramid Attention (LSPA) module expands the spatial receptive field to capture global context. Experimental results on two public datasets show that TGL-YOLO demonstrates improved performance over the YOLO11s baseline. On the PlantDoc dataset, it improves mAP50 and mAP50:95 by 4.7% and 3.7%, reaching 0.591 and 0.449, respectively. On the FieldPlant dataset, it reaches 0.793 and 0.608, yielding improvements of 2.3% and 1.9%. The proposed method demonstrates the capability to reduce missed detections and false positives caused by multi-scale lesions and environmental noise, providing a competitive and computationally viable solution for agricultural disease monitoring in natural environments.
1. Introduction
For the precise development of smart agriculture, plant disease detection, as a core technology for ensuring crop yield, reducing pesticide abuse, and achieving green production, has been widely applied in various field crop and orchard management scenarios [1]. Failure to achieve accurate and timely identification enables the rapid proliferation of plant diseases and insect pests, which causes yield losses of 17.2% to 30.0% in major global food crops and poses a severe threat to the stability of the global food security system [2]. However, in practical field applications, achieving high detection accuracy remains challenging due to complex natural conditions. Specifically, disease lesions exhibit extreme scale variations, ranging from micro-spots to massive blights. Furthermore, severe background noise, such as illumination changes, overlapping leaves, and weed interference, significantly disrupts feature extraction. Therefore, developing robust detection technologies that can effectively overcome background noise and multi-scale variations has become an urgent requirement to drive smart agriculture from theory to practical application [3,4].
From the perspective of technological evolution, current deep learning-based object detection methods are mainly divided into three mainstream technical routes: The first is the two-stage detector centered on region proposal generation and fine-grained classification regression, such as Faster R-CNN [5], Mask R-CNN [6], and Cascade R-CNN [7]. The second is the single-stage detector centered on end-to-end regression, such as SSD [8] and the YOLO series [9]. The third is the end-to-end detector based on the Transformer architecture, with representative algorithms including DETR [10], Deformable-DETR [11], RT-DETR [12], and DINO [13]. However, in variable real-world field environments, extreme multi-scale characteristics mean that existing models still face severe bottlenecks in small object recall, robustness under complex backgrounds, and cross-crop generalization capabilities.
Among two-stage detectors, Faster R-CNN and its derivatives remain common choices for high-precision tasks due to the refinement of region proposal generation. For apple leaf diseases, Gong et al. [14] integrated Res2Net and FPN into Faster R-CNN to enhance the feature expression of multi-scale lesions. Zhao et al. [15] achieved high-precision detection of multiple diseases in strawberry leaves, flowers, and fruits using a multi-scale feature fusion strategy. Bondre et al. [16] employed Mask R-CNN for pixel-level segmentation and damage severity quantification of tea pests. Prashanth et al. [17] demonstrated that the step-by-step correction mechanism of the Cascade structure effectively reduces the missed detection rate of fine-grained small corn lesions. Although two-stage methods offer excellent accuracy in pathological feature extraction, their massive parameter counts and intensive computational overhead for candidate boxes make them extremely difficult to deploy on computing-constrained agricultural drones or low-power Internet of Things (IoT) monitoring devices, thus restricting their widespread adoption in large-scale farmlands.
In contrast, single-stage detectors represented by the YOLO series have become mainstream for real-time field detection due to their end-to-end efficient inference and lightweight architectures. Wang et al. [18] proposed a YOLOv5 model replacing the backbone with CSPNet and optimizing the feature pyramid, drastically reducing parameters while maintaining accuracy. Qi et al. [19] and Zhu et al. [20] embedded the SE module and Coordinate Attention mechanism, respectively, to effectively suppress high-frequency field noise and alleviate missed detections caused by dense leaf occlusions. Furthermore, the SerpensGate-YOLOv8 model proposed by Miao et al. [21] integrated dynamic snake convolution with super token attention, significantly strengthening the extraction capability for slender and twisted lesion structures.
With its robust feature extraction and multi-scale fusion, the latest YOLO11 [22] has rapidly become a preferred framework for agricultural applications. Consequently, various innovative solutions have emerged to push the boundaries of agricultural visual detection. For example, to address the performance degradation caused by environmental shifts, Cardellicchio et al. [23] proposed an incremental learning framework integrated with domain adaptation for tomato plant phenotyping, significantly enhancing the model’s continuous generalization capability across complex agricultural scenarios. Concurrently, focusing on structural innovation within the YOLO11 framework, Tang et al. [24] proposed YOLOv11-AIU, realizing end-to-end grading detection of tomato early blight via adaptive feature fusion. Yao et al. [25] constructed WTAD-YOLO, combining wide convolution and dynamic attention to successfully compress parameters to 3.2M, perfectly accommodating field edge deployment. Tao et al. [26] designed CEFW-YOLO with cross-layer feature enhancement and wavelet fusion to accurately suppress complex background interference. Meanwhile, YOLO-ACT by Chen et al. [27] effectively resolved the loss of multi-scale feature transmission through adaptive cross-layer integration. Nevertheless, most existing research focuses on localized structural lightweight design and still lacks a systematic cross-layer fusion design targeting extreme multi-scale lesion characteristics, leaving considerable room for improvement in capturing micro-lesions.
In recent years, the Transformer architecture has provided an entirely new technical direction with its exceptional global context modeling capabilities. Tong et al. [28] introduced task-adaptive feature fusion into RT-DETR, achieving generalized real-time detection of multi-crop diseases. PL-DINO by Li et al. [29] designed an adaptive attention branch combining disease priors, substantially surpassing baseline detection accuracy. MHDI-DETR by Fu et al. [30] significantly enhanced micro-lesion capture in complex backgrounds via efficient local attention. However, to break the computational bottleneck where Transformer complexity grows quadratically with high-resolution agricultural images, the recent YOLO-BSMamba model [31] innovatively and deeply fused the linear-complexity Mamba (State Space Model) module with YOLO. By overcoming micro-lesion feature loss through a selective scan mechanism, it provides a novel paradigm that balances long-range global perception with extremely high inference efficiency.
In summary, when confronting core challenges such as multi-scale lesions, complex backgrounds, and leaf occlusions in real field environments, existing methods still struggle to achieve an optimal trade-off between model accuracy and inference speed. In response to the above challenges, we design an improved plant disease detector, TGL-YOLO, constructed on the YOLO11 network. By systematically optimizing feature extraction, cross-scale fusion, and global context modeling, TGL-YOLO effectively mitigates missed and false detection rates in natural scenes. The main contributions of this paper are summarized as follows:
- (1)
- A Tri-Scale Dynamic Block (TSDBlock) is proposed in the backbone network. Utilizing a multi-branch divide-and-conquer strategy and dynamic weighted fusion of convolutions, this module can adaptively capture contextual information at different granularities. Meanwhile, it maintains favorable computational efficiency while enhancing detection accuracy for lesions with morphological variations and small scales.
- (2)
- A Gated Pyramid Spatial Transformation (GPST) module is designed in the neck network. Building upon spatial attention, GPST introduces a dynamic gating mechanism to transform traditional linear feature aggregation into gated feature selection. This suppresses complex background noise and improves the localization accuracy of disease targets.
- (3)
- A Large-kernel Separable Pyramid Attention (LSPA) module is constructed to optimize the spatial pyramid pooling structure. By combining cascaded max-pooling with large-kernel separable convolutional attention, LSPA expands the receptive field range and enhances global context interaction, improving the overall recognition capability for large-scale and irregularly shaped lesions.
2. Materials and Methods
2.1. Datasets
This study utilizes a combination of the PlantDoc dataset [32] from the open-source Roboflow platform and the FieldPlant dataset [33] for model training and performance evaluation. The PlantDoc dataset, developed by researchers at the Indian Institute of Technology (IIT), serves as a standard benchmark in plant disease detection, comprising 2569 high-quality images across 13 crop species and 30 disease categories. The FieldPlant dataset covers three main tropical crops: corn, cassava, and tomato, which correspond to 27 different disease categories, with all images captured on-site from various plantations across Cameroon.
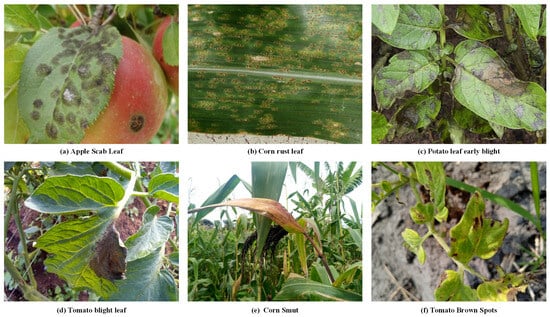
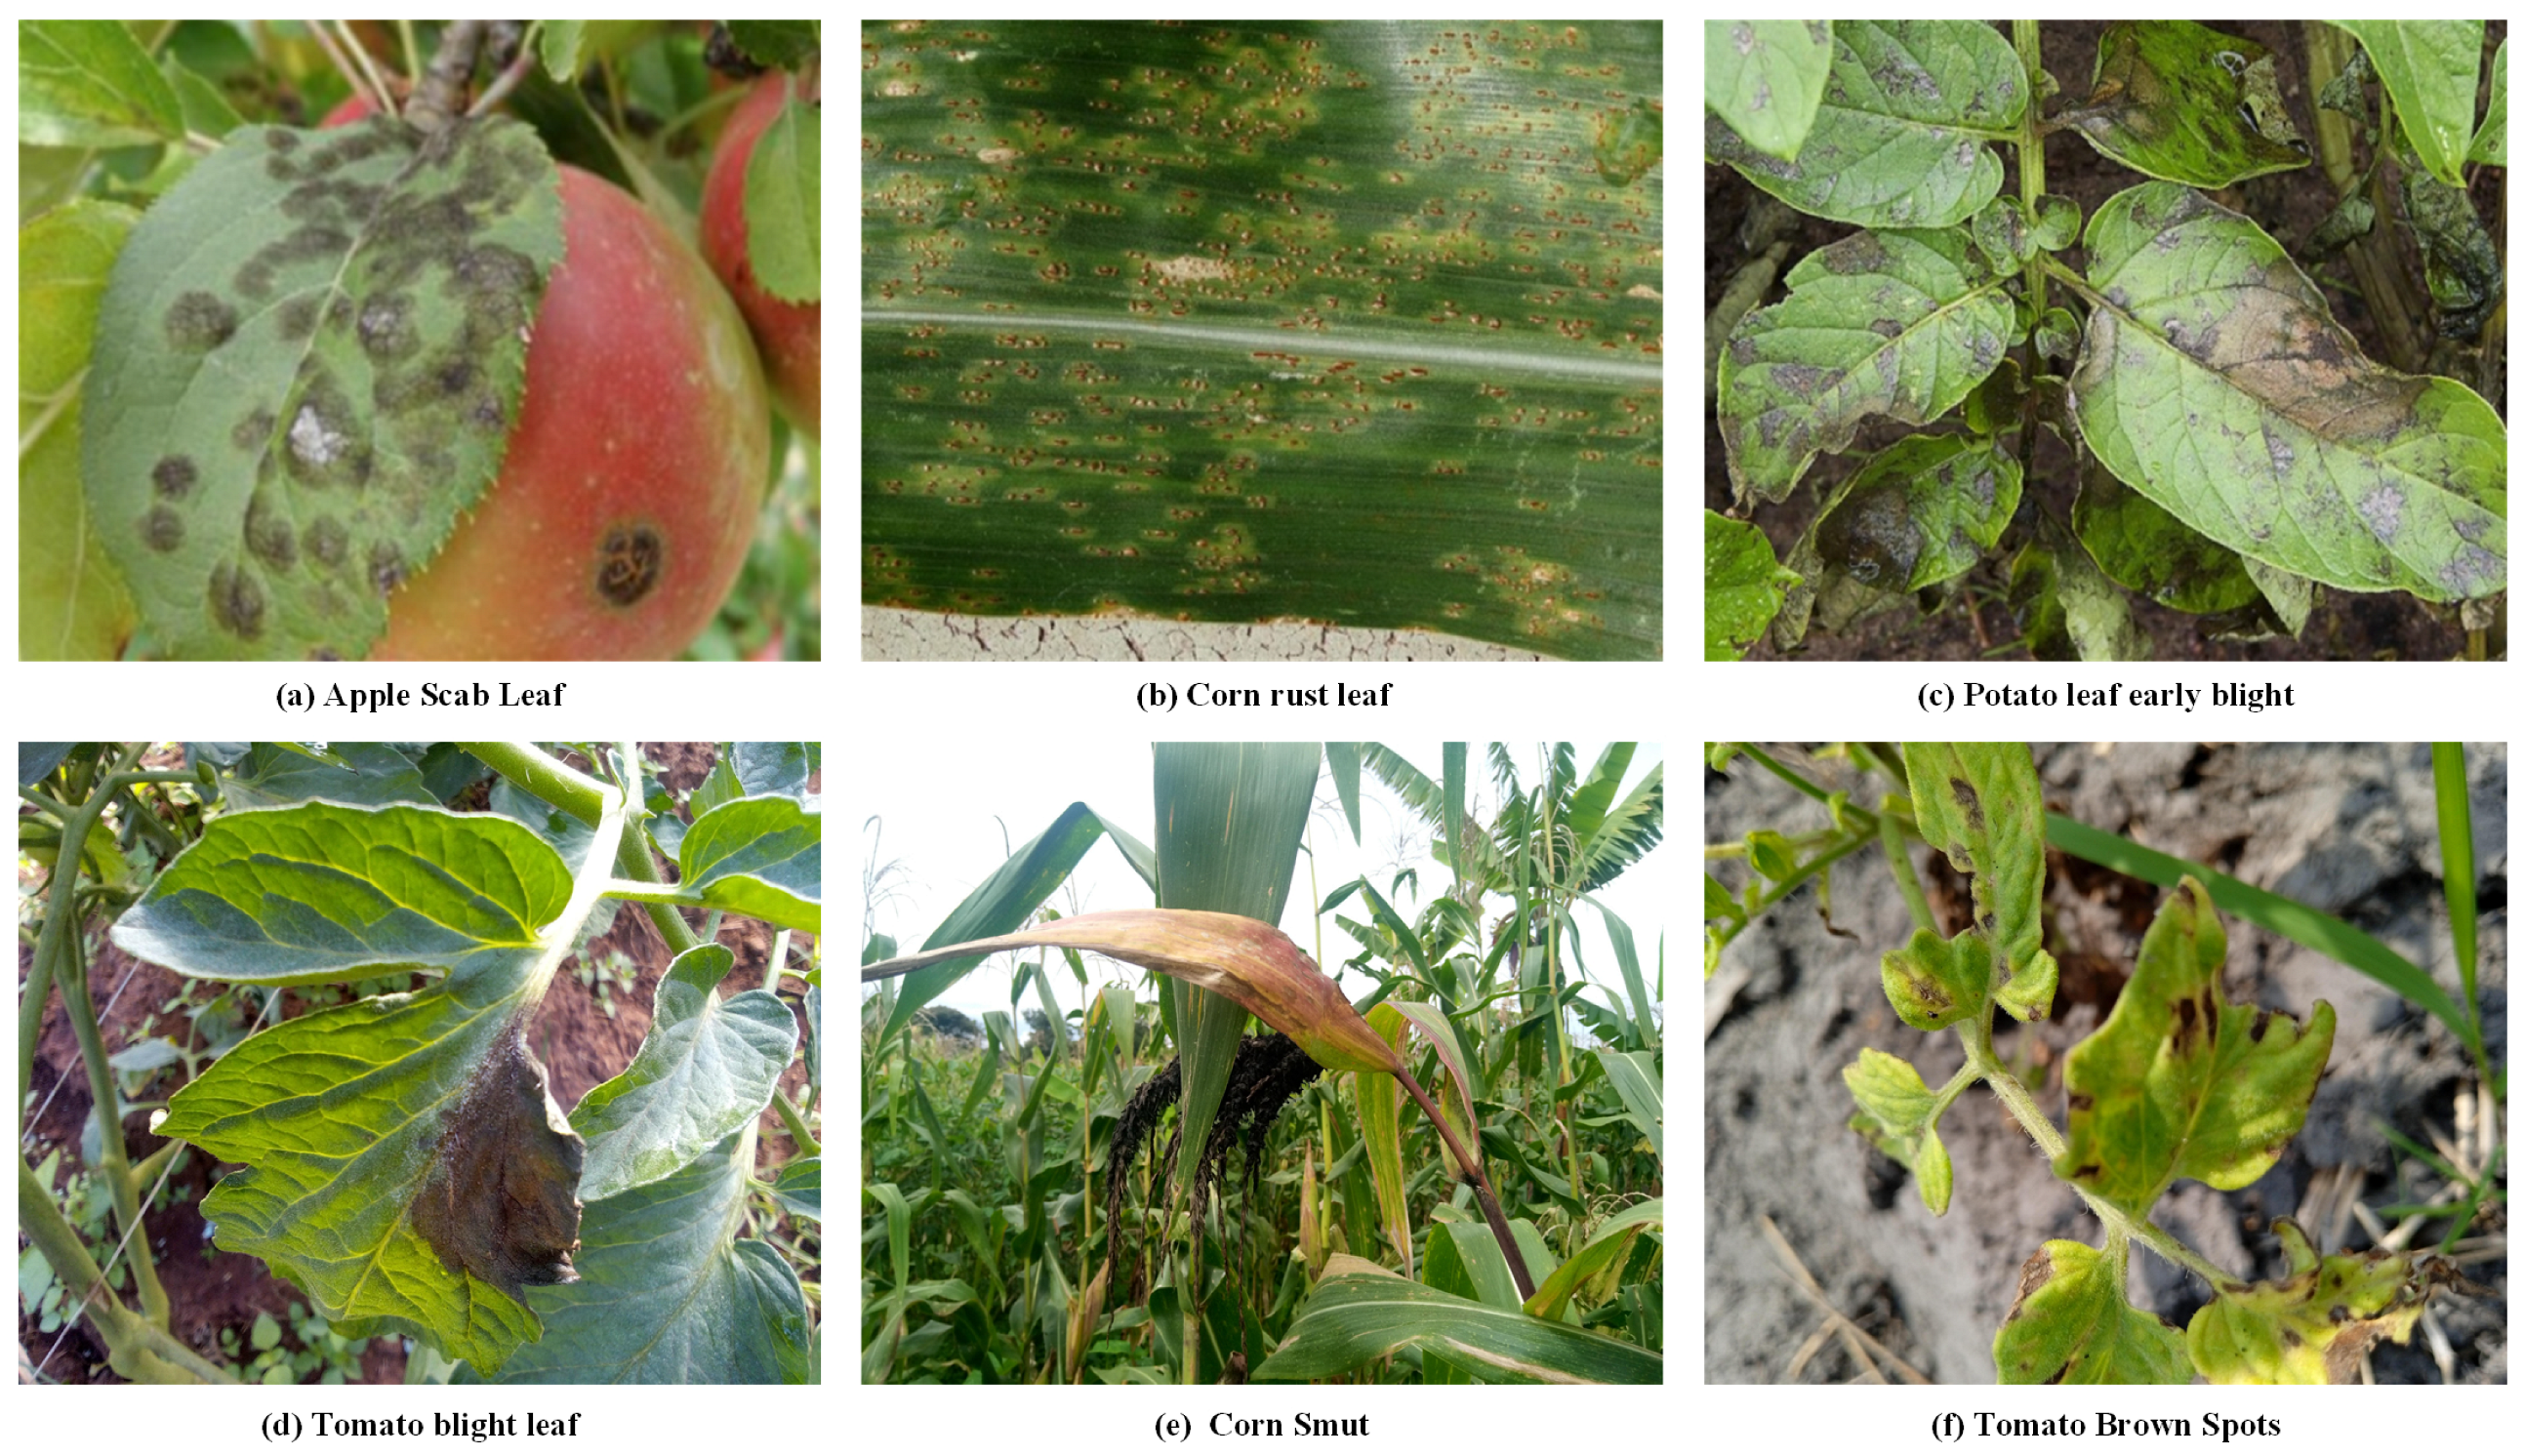
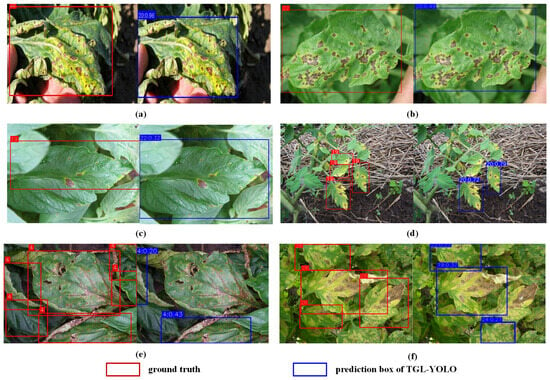
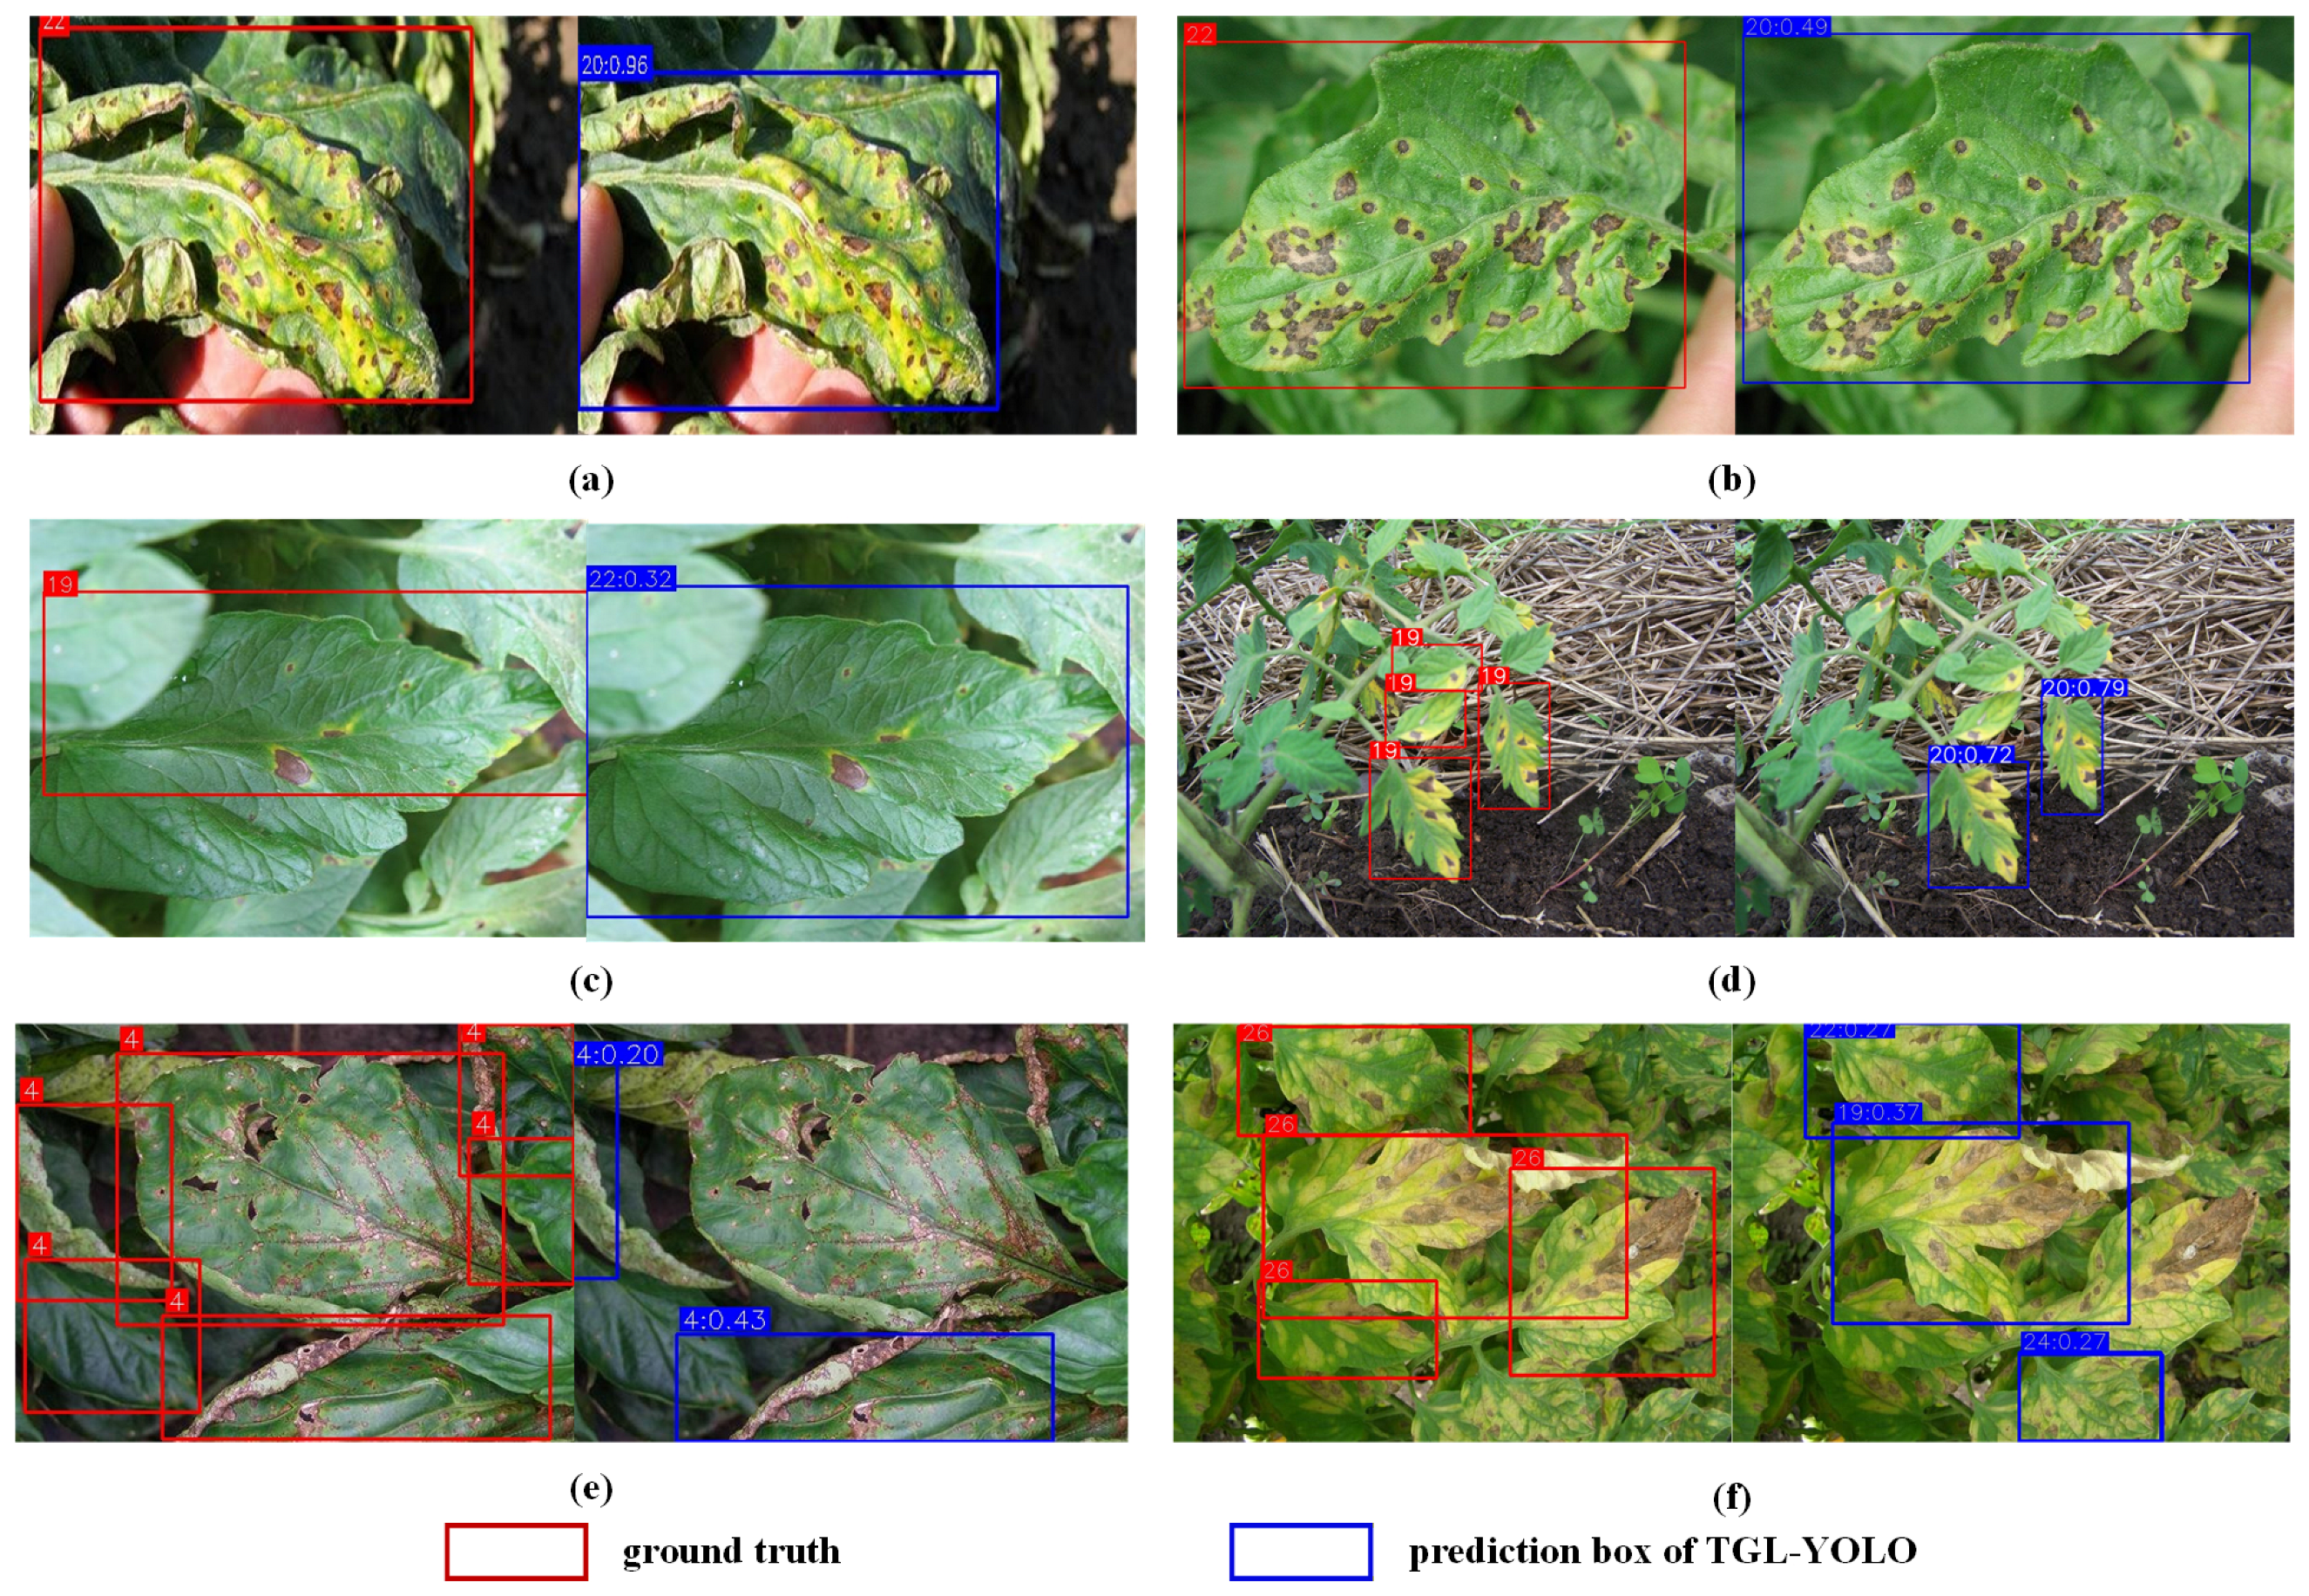
Both datasets feature a wide variety of plant disease types captured under complex, real-world field conditions. The presence of severe background interference, fluctuating illumination, and dense leaf occlusions makes accurate disease detection within these datasets highly challenging. Figure 1a–c display samples from the PlantDoc dataset, while Figure 1d–f showcase samples from the FieldPlant dataset.
Figure 1.
Sample images of crop diseases. (a–c) are from the PlantDoc dataset, and (d–f) are from the FieldPlant dataset.
For rigorous performance validation, the PlantDoc dataset adopts the partitioning scheme provided by the Roboflow platform, allocating 2009 images for training, 314 for validation, and 246 for testing. A strict 8:1:1 train–validation–test split is applied to the FieldPlant dataset, generating 4124 training images, 516 validation images, and 516 test images. To maintain a clear performance baseline, all images are processed in their original state without artificial data augmentation. This ensures that any observed improvements accurately reflect the efficacy of the proposed architectural enhancements and guarantees experimental reproducibility.
2.2. TGL-YOLO Network
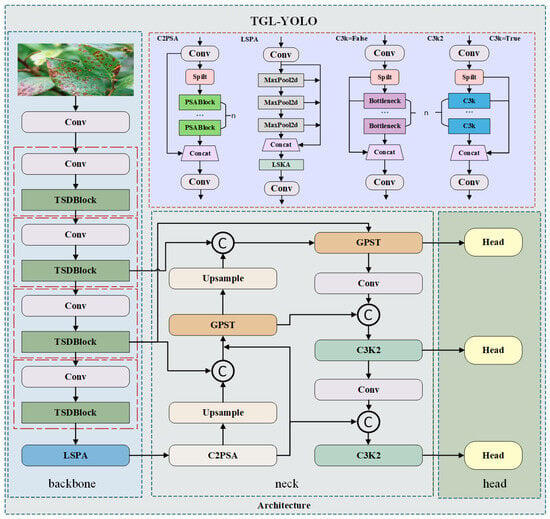
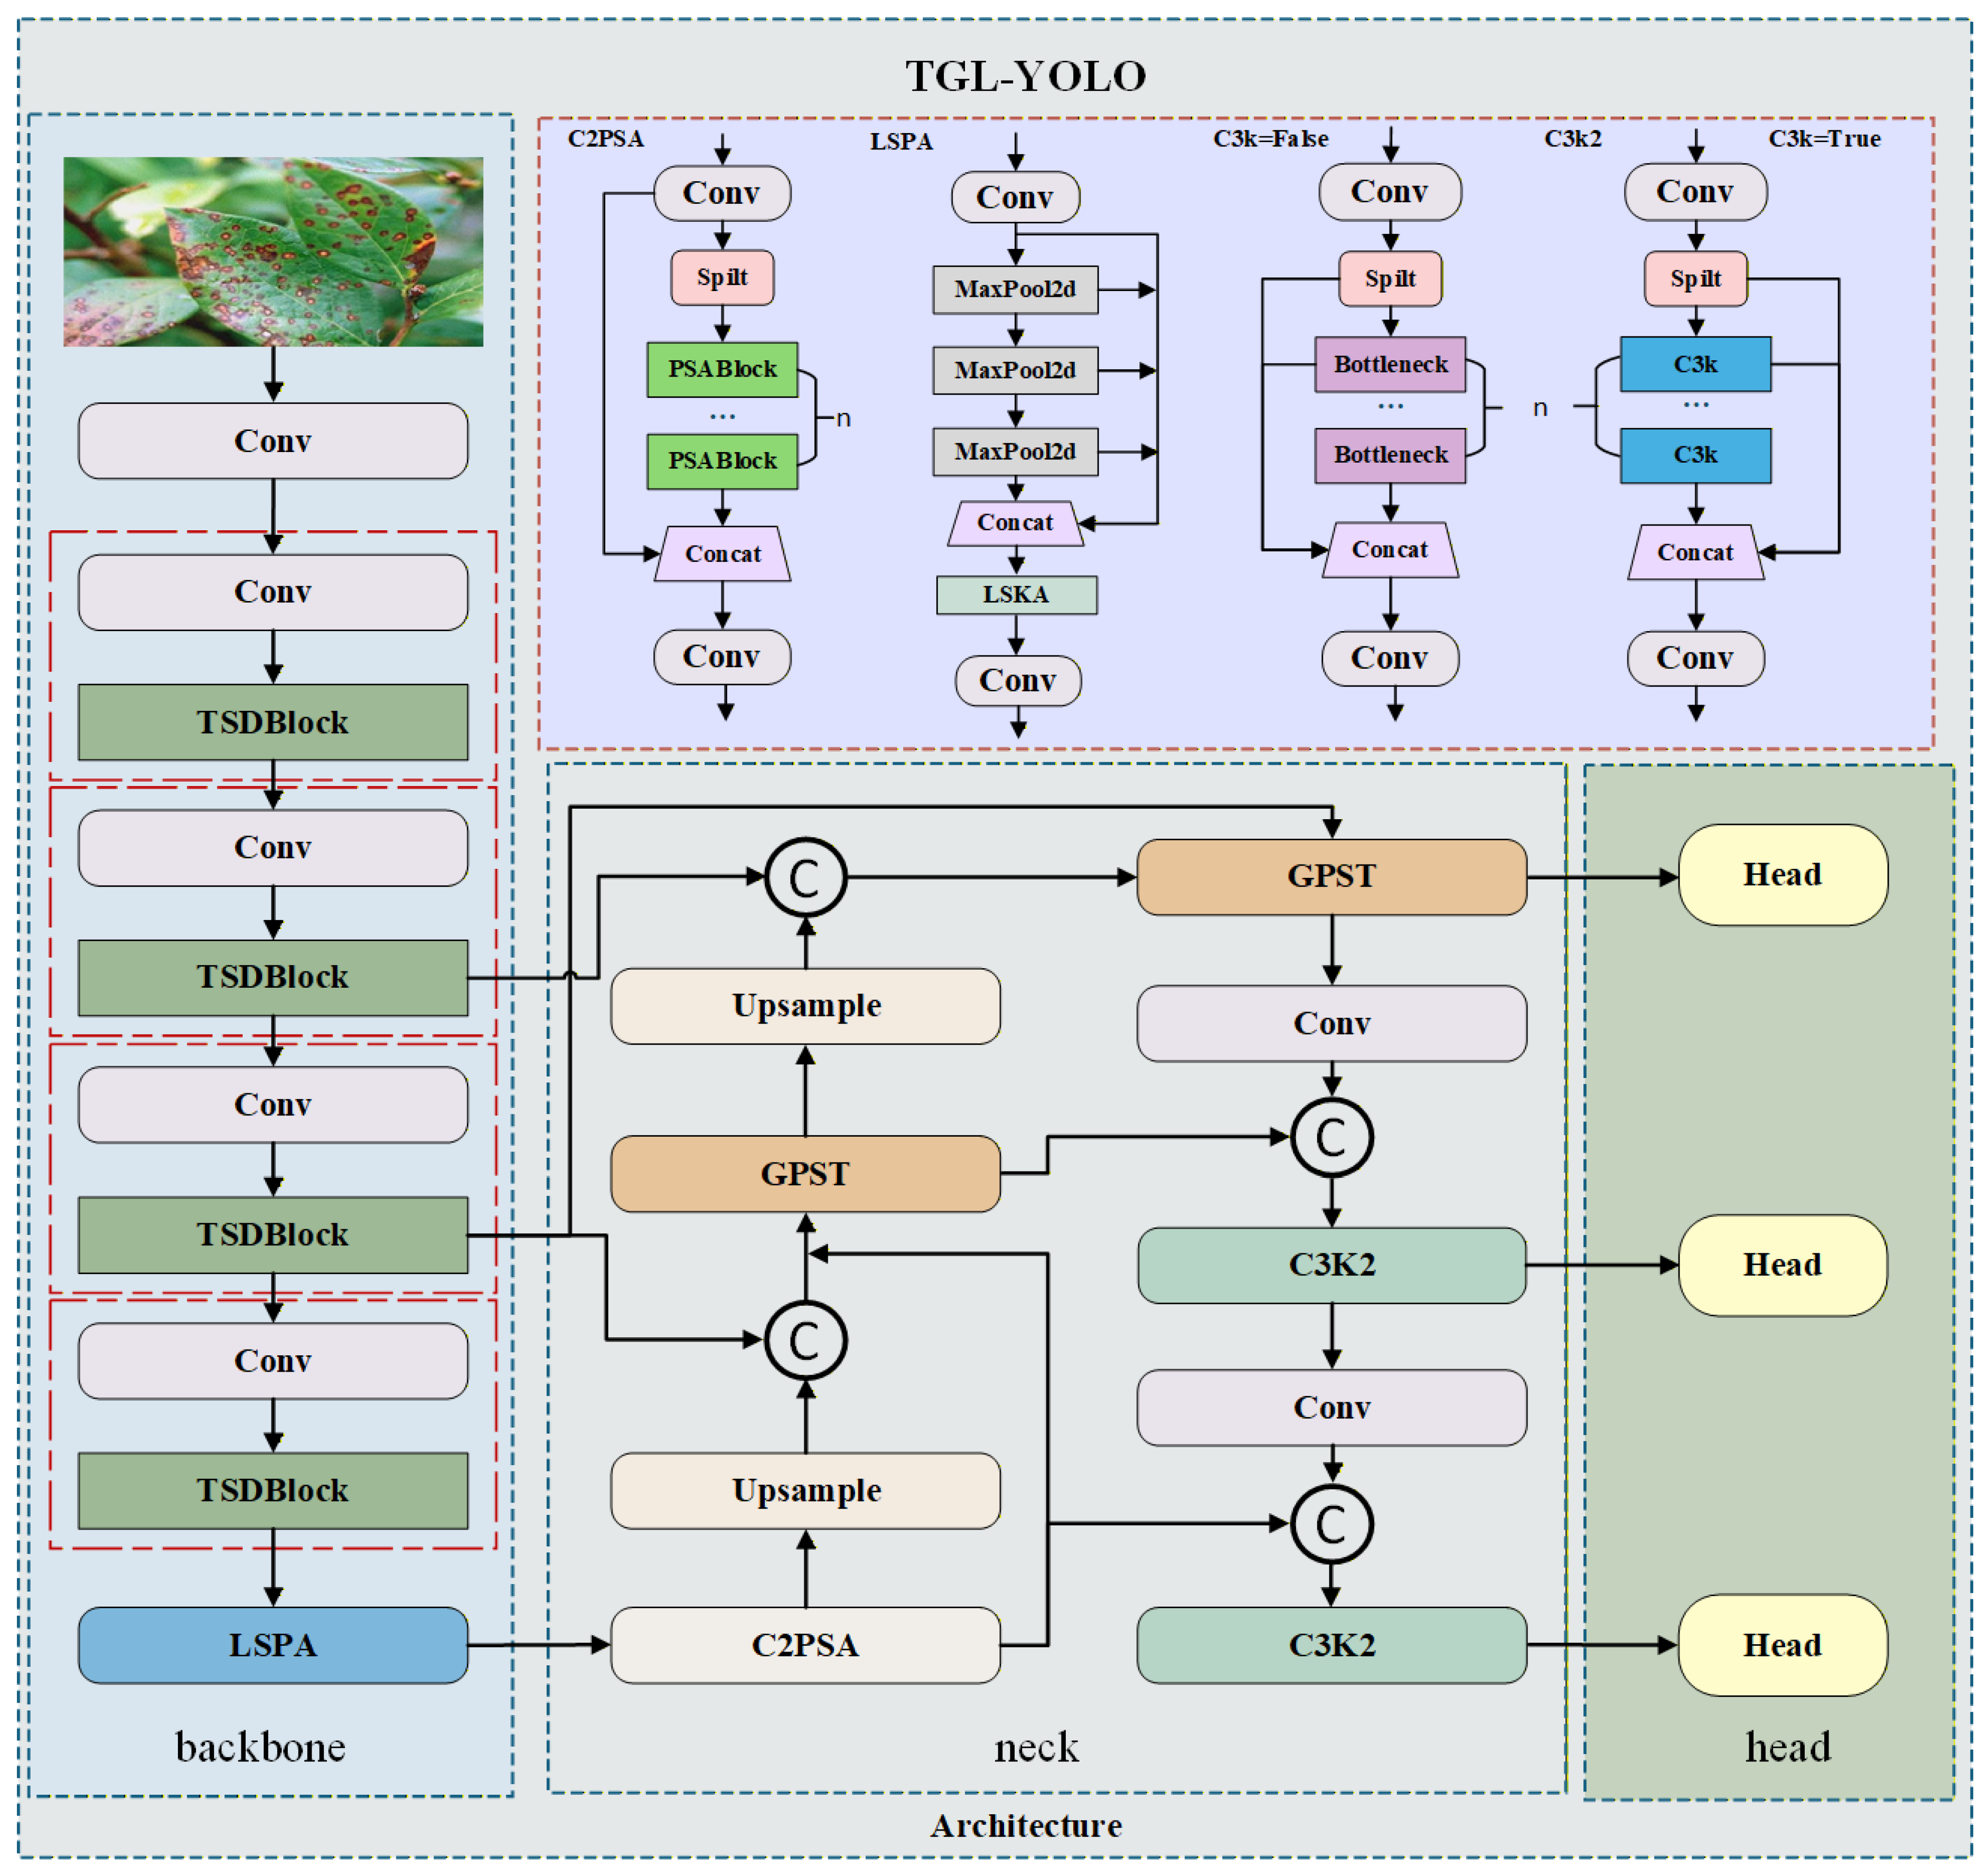
This study selects YOLO11s, which achieves an effective balance between computational efficiency and detection accuracy, as the baseline model. To address the detection difficulties caused by variable scales of plant disease targets and complex backgrounds, a multi-scale feature enhancement model, TGL-YOLO, is proposed. The architecture of TGL-YOLO is specifically designed to sequentially resolve the core physical challenges of agricultural lesions: scale variation, background interference, and semantic ambiguity. The complete architecture of our model is depicted in Figure 2.
Figure 2.
The structure diagram of TGL-YOLO.
While maintaining the efficient single-stage detection framework, we perform systematic reconstructions at three core nodes. First, to address the spatial heterogeneity of lesions, a Tri-Scale Dynamic Block (TSDBlock) is designed to replace the original C3k2 feature extraction unit. This module modifies the traditional Bottleneck residual structure by adopting a multi-branch divide-and-conquer strategy: it splits the input feature channels at a ratio of 50:25:25 and feeds them into separate dynamic convolution (DConv) [34,35] branches with different kernel sizes ( and ). By dynamically generating weights and performing weighted fusion of information from different receptive fields, the TSDBlock achieves multi-scale adaptive perception of fine-grained lesions at the front end of the network. Second, a Gated Pyramid Spatial Transformation (GPST) module [36] is deployed in the neck network to optimize cross-scale feature interaction. During this stage, standard feature concatenation often retains high-frequency agricultural background noise. This module introduces a dual-path gating mechanism to conduct dynamic spatial weight screening and weighted concatenation fusion on multi-level features, which focuses on key lesion information while filtering out such noise. Finally, a Large-Kernel Separated Pyramid Attention (LSPA) module is constructed at the end of the backbone network to replace the standard Spatial Pyramid Pooling Fast (SPPF). By fusing cascaded Max Pooling with the Large Separable Kernel Attention (LSKA) [37], this module expands the global receptive field of the feature maps, providing support for the model to capture global contextual semantic information, which is essential for distinguishing actual disease spots from similar background structures. Through this sequential processing—scale adaptation at the front end, global anchoring at the deep end, and noise filtering during fusion—these three modules form a synergistic data flow, enabling TGL-YOLO to achieve effective localization and recognition of multi-scale plant diseases in complex scenarios.
2.3. Tri-Scale Dynamic Block (TSDBlock)
In real-world agricultural scenarios, plant diseases present complex morphological evolution with substantial scale variations, ranging from minute early-stage spore heaps to extensive late-stage lesions. The baseline YOLO11s backbone relies on static, single-scale convolutions and Bottleneck structures, which lack the spatial flexibility to simultaneously capture fine-grained textures of micro-lesions and the broader context of diffusive spots. To overcome this inherent limitation in feature perception, we propose the Tri-scale Dynamic Block (TSDBlock) to replace the original feature extraction units, enabling adaptive mining of multi-scale pathological features.
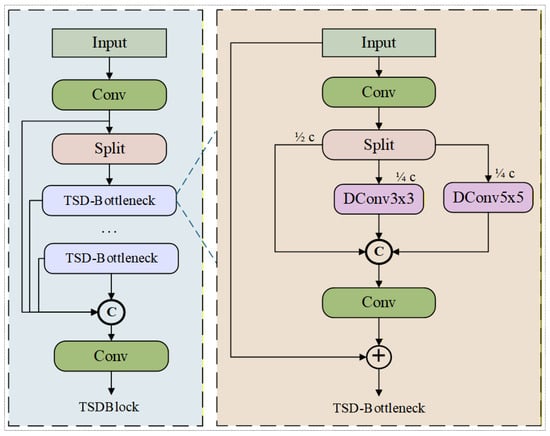
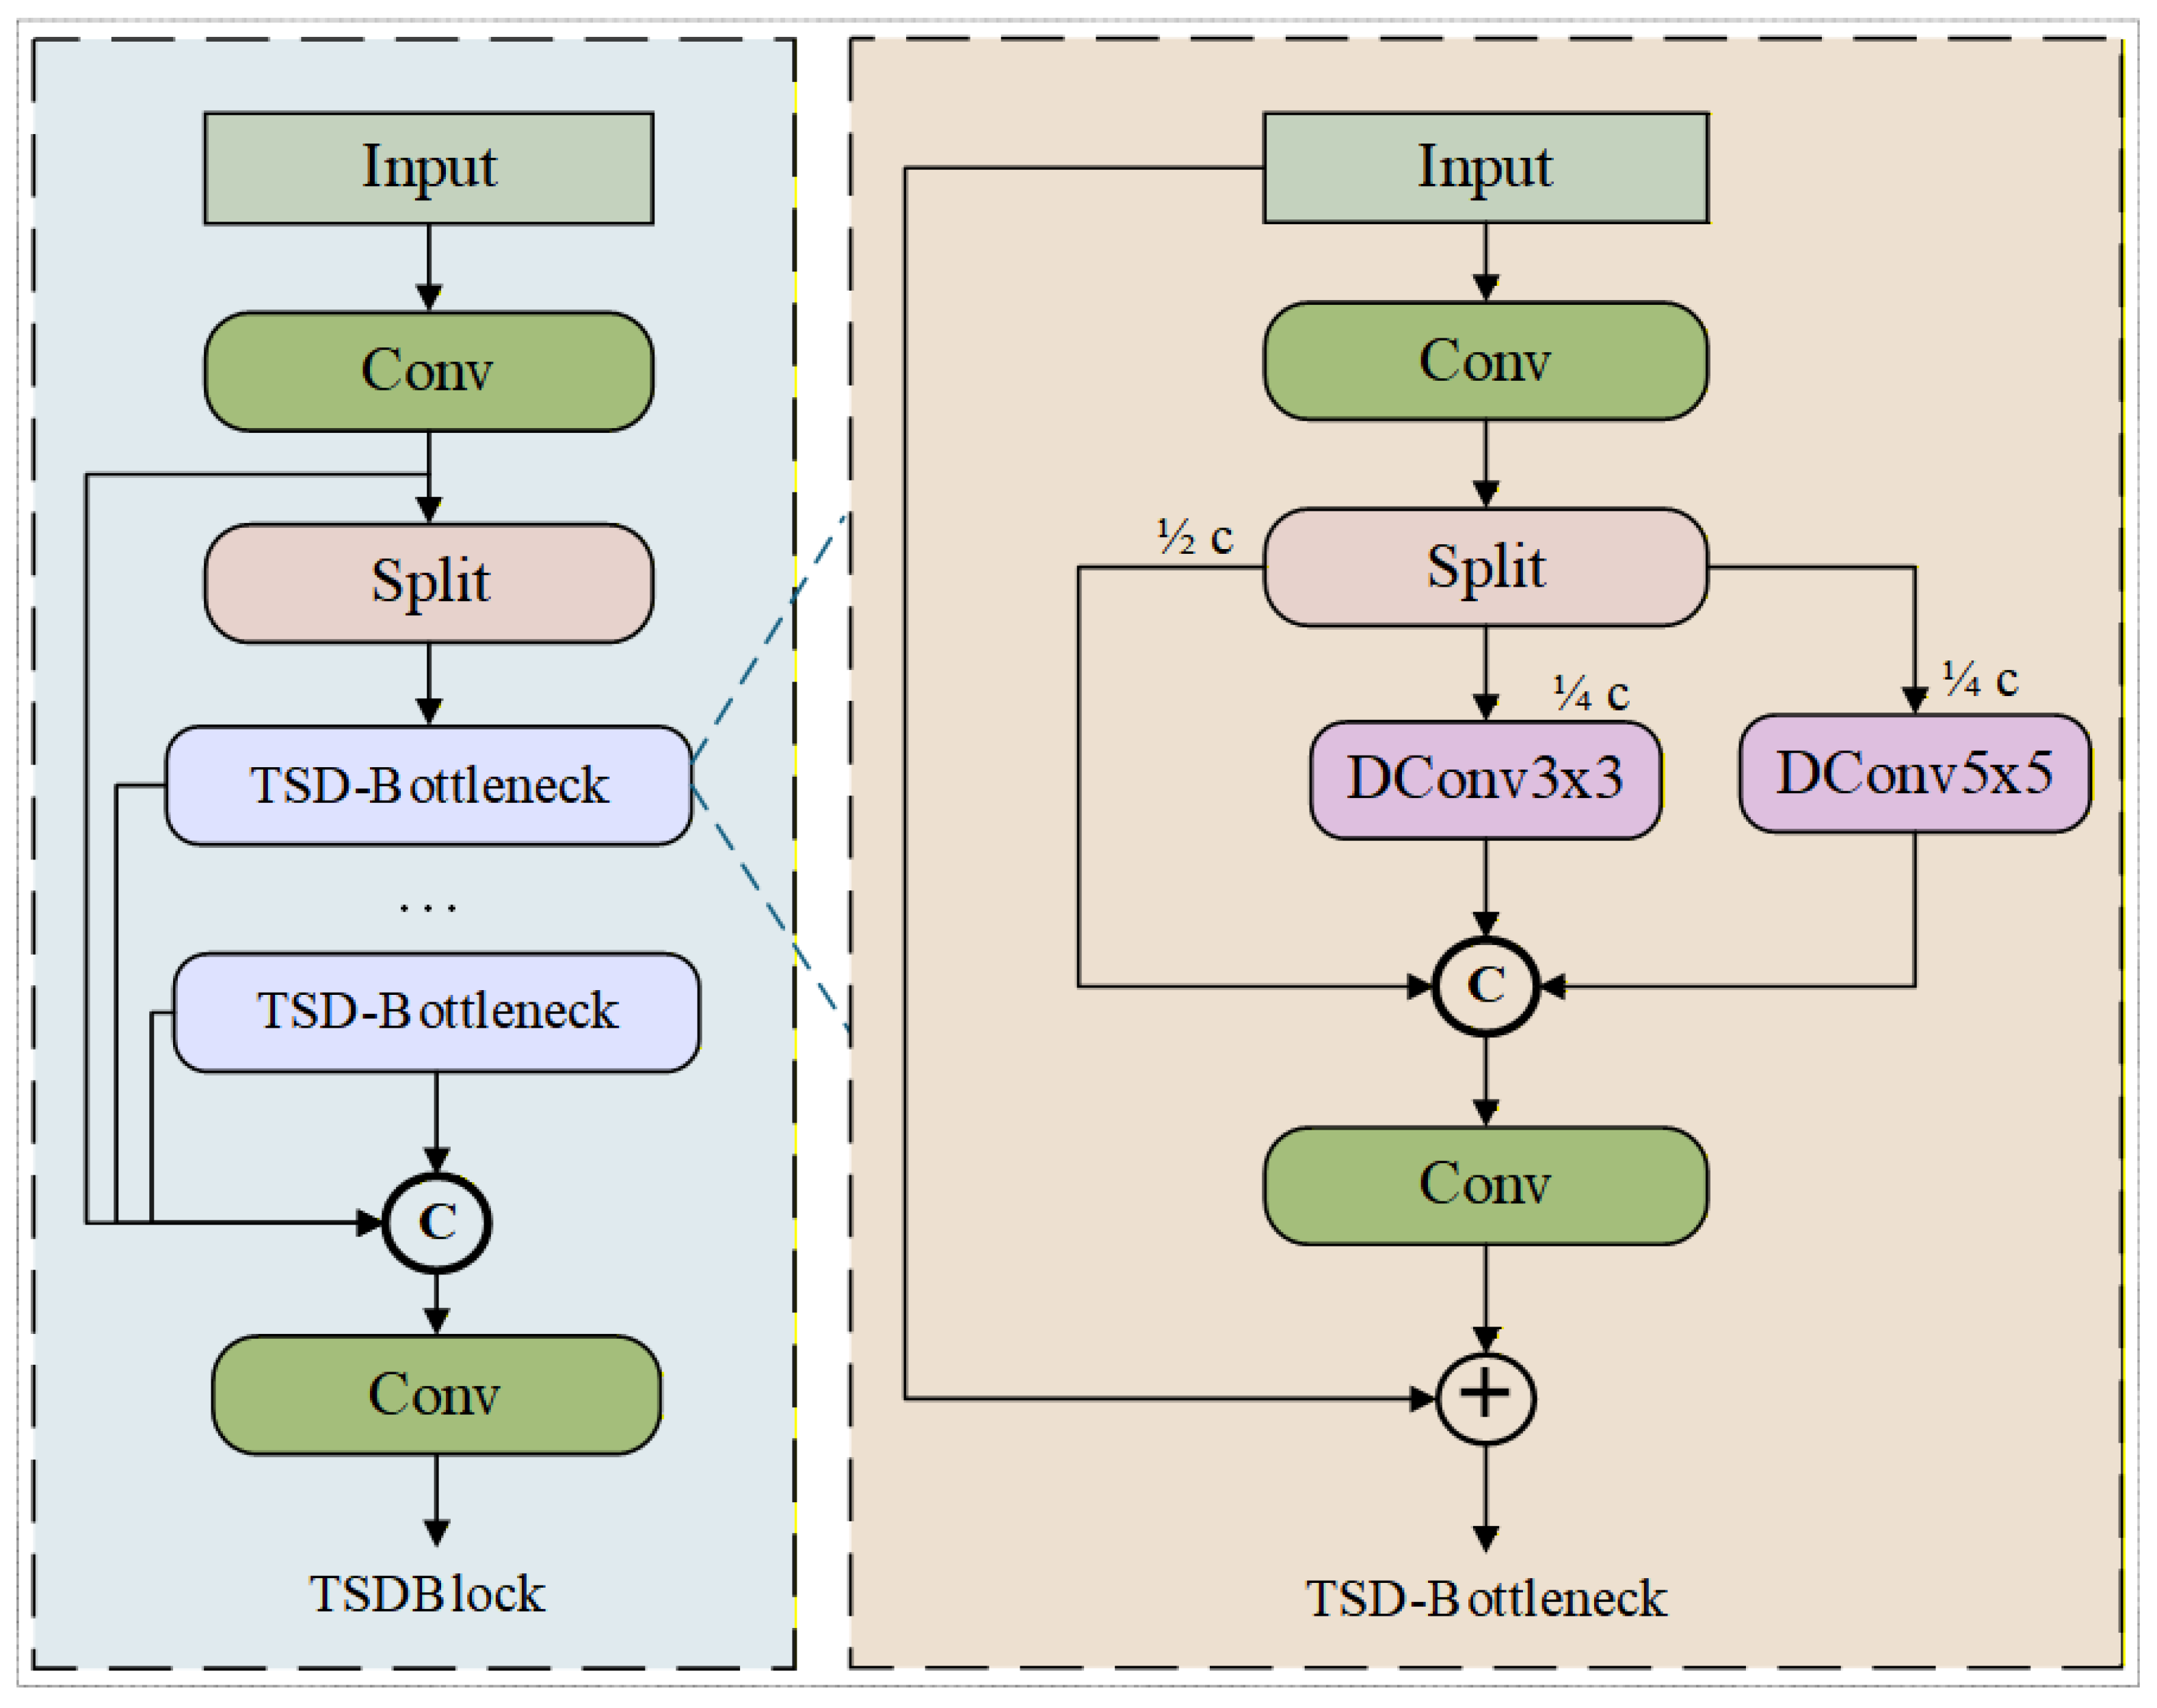
The core architecture of the TSDBlock is illustrated in Figure 3. Unlike conventional Bottleneck residuals, the TSDBlock employs an efficient multi-branch divide-and-conquer strategy via channel splitting. Given an input feature map , a convolutional layer first aligns the channels. The map is then divided into three parallel pathways: a main branch ( of channels) that preserves low-level fine-grained textures, and two sub-branches and ( each). These sub-branches are processed by and dynamic convolutions (DConv) respectively, allowing the network to capture both local details and broader contexts in parallel. The complete multi-scale forward propagation can be uniformly formulated as:
where the split operation is defined as . This asymmetric parallel design adaptively aggregates multi-receptive field features at the same depth, thereby mitigating the excessive parameter counts and computational overhead that would arise from applying large-sized convolutions across all channels.
Figure 3.
Structure Diagram of the Tri-Scale Dynamic Block (TSDBlock).
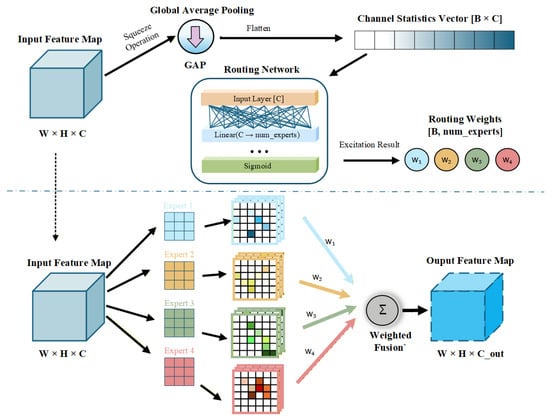
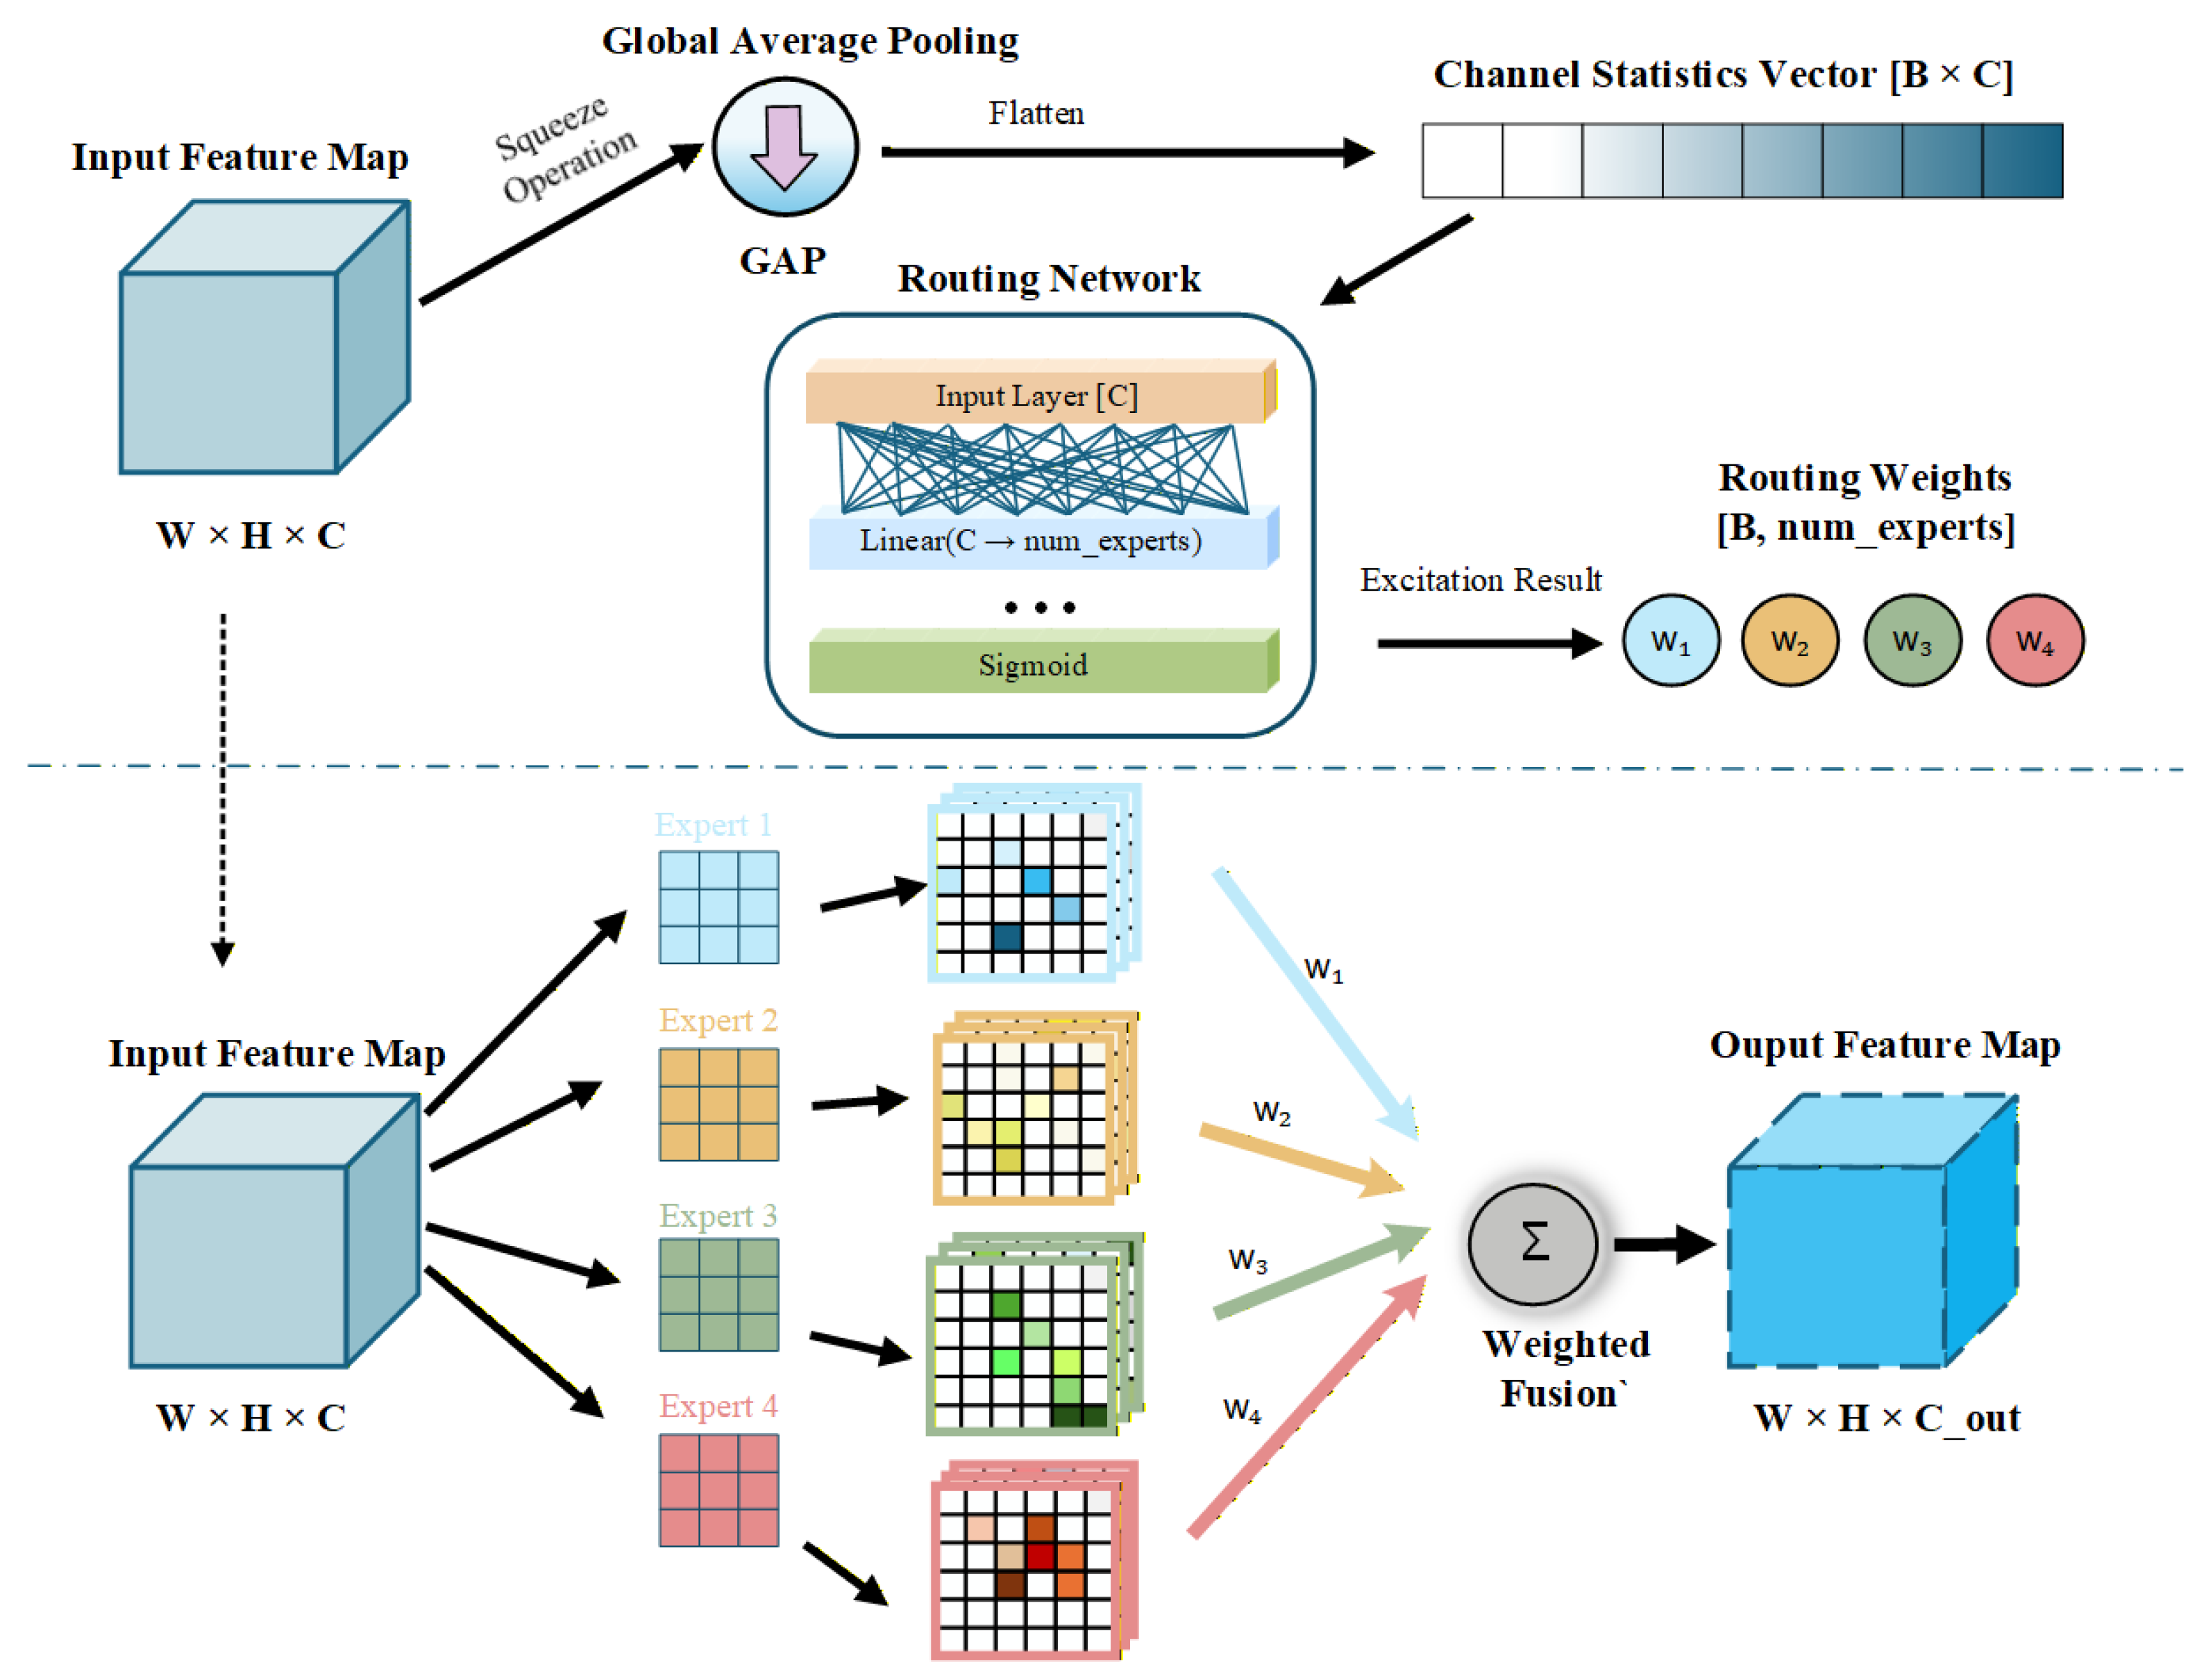
The core operator driving this spatial adaptivity is the DConv (Figure 4), which addresses the constraint of static weights by dynamically assembling its kernel parameters conditioned on the specific input image. For a given sub-feature map , DConv first extracts a global context prior via Global Average Pooling (GAP). This spatial compression yields a channel statistics vector that feeds into a lightweight Routing Network. Through a fully connected (FC) layer and a Sigmoid activation , the network generates a dynamic routing weight vector tailored to the current features:
Figure 4.
Mechanism Diagram of Dynamic Convolution (DConv).
During the feature excitation phase, rather than executing multiple computationally expensive parallel convolutions, the network performs a linear weighted fusion of n pre-configured expert kernels and corresponding biases at the parameter level. The synthesized dynamic kernel is then applied to via a single standard convolution to yield the final output :
Through this comprehensive mechanism—ranging from macroscopic channel splitting to microscopic dynamic weight generation—the TSDBlock systematically optimizes the static extraction logic of the baseline model. By adjusting feature flows and kernel responses in real time according to the actual size of the lesions, the model achieves robust representational adaptability. This synergy reliably addresses missed detections for minute lesions and feature fragmentation for irregular large spots all while maintaining the model’s overall computational efficiency.
2.4. Gated Pyramid Spatial Transformation Module (GPST)
In the feature fusion stage of object detection, systematically bridging different network levels to facilitate interaction between deep semantic context and shallow high-resolution details is a crucial step for improving multi-scale object recognition. The Pyramid Spatial Transformer (PST) provides a promising feature interaction architecture. By mitigating the constraints of the local receptive fields inherent in traditional convolutions, PST constructs global spatial dependencies across feature maps of varying resolutions through the introduction of a multi-head attention mechanism.
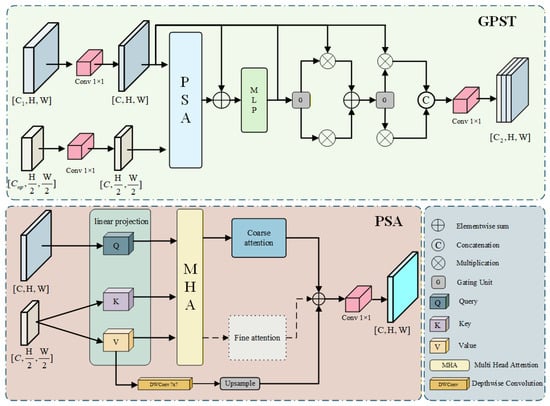
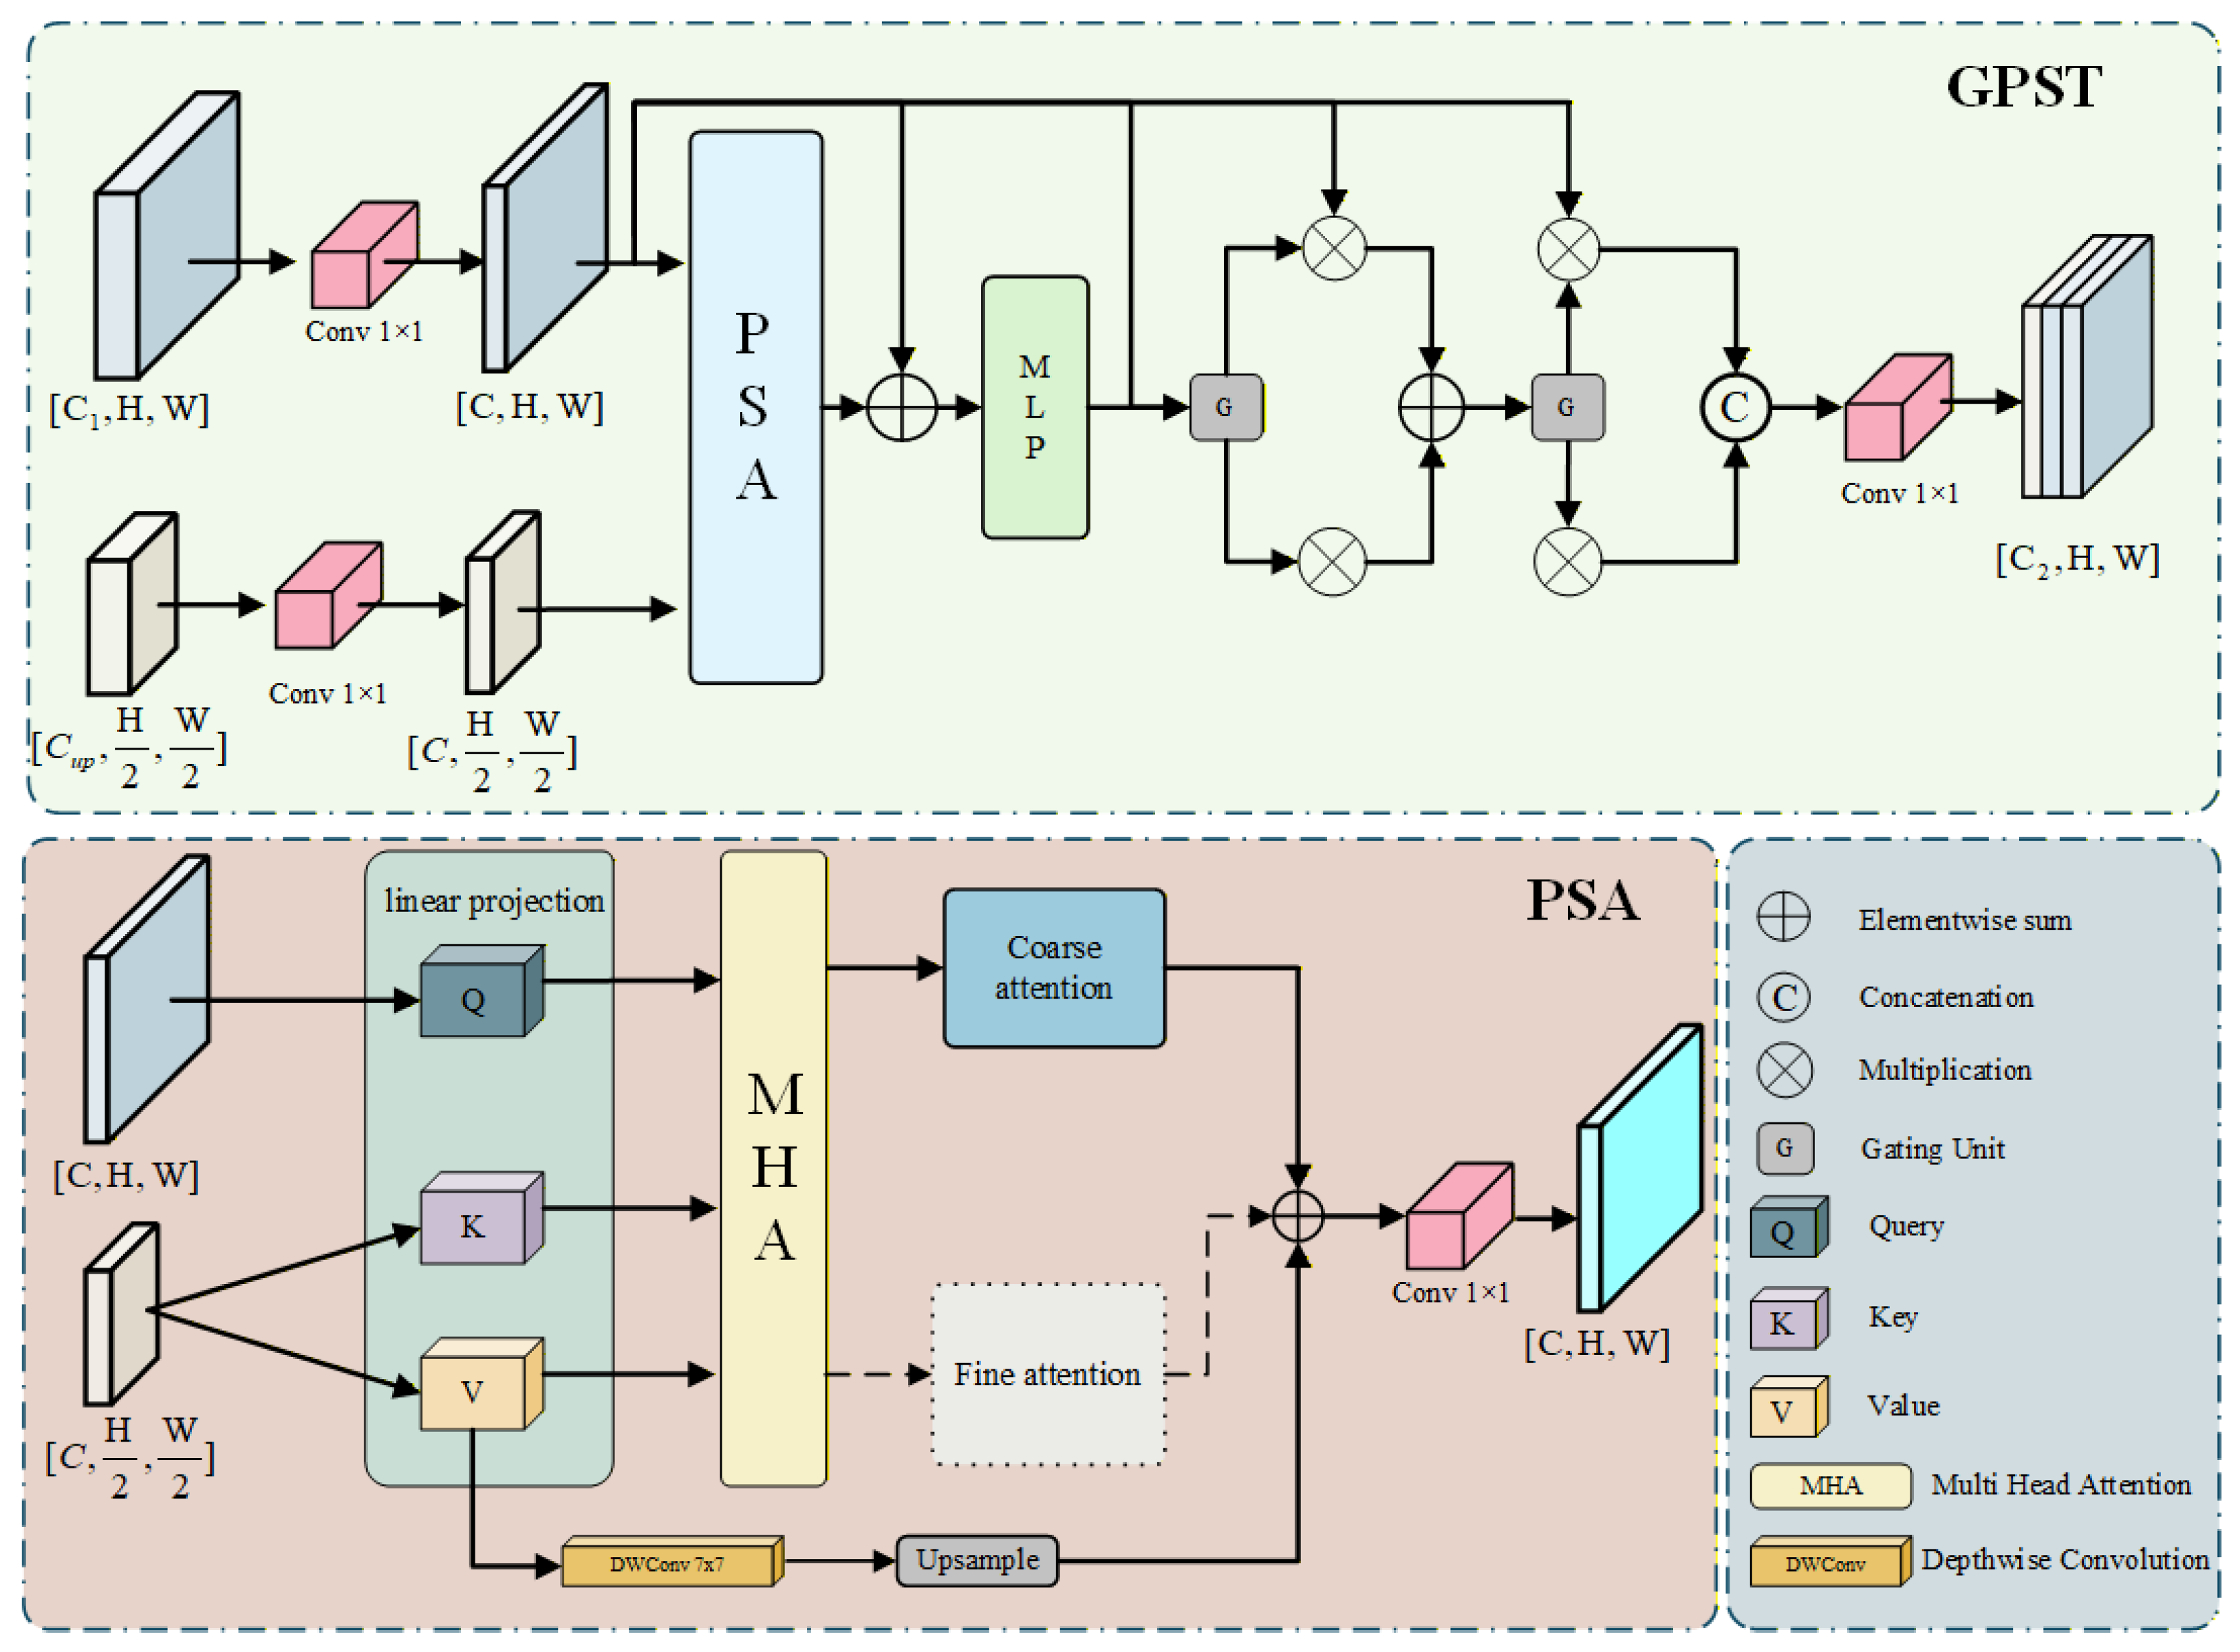
Regarding the specific data flow, PST first receives inputs from two different levels of the backbone network: a shallow feature with high spatial resolution but weak semantics, and a deep feature with lower resolution but rich global abstract semantics. To perform cross-scale computation, the Pyramid Spatial Attention (PSA) sub-module in PST linearly maps the high-resolution into a query vector Q, while mapping the low-resolution into a key vector K and a value vector V. The core cross-scale interaction formula can be expressed as:
Through this attention mechanism, shallow features can adaptively aggregate deep global contextual information, bridging the semantic gap between features of different scales and providing a robust basis for subsequent feature fusion. This is the principal rationale why this paper chooses to retain the core computational chassis of PST.
However, the fusion strategies (element-wise addition and channel concatenation) adopted by PST during the feature aggregation phase exhibit certain deficiencies. In natural agricultural scenarios, image backgrounds are often complex (e.g., weed occlusion, uneven illumination, and soil reflections). If standard direct fusion methods are employed, these background noises are prone to mixing with key lesion features in equal proportions. This interference degrades the semantic features extracted by deep networks, thereby compromising detection precision.
To alleviate this disturbance, this paper proposes the Gated Pyramid Spatial Transformation (GPST) module, which refines the backend feature fusion mechanism while retaining the core cross-scale attention (PSA) mechanism of PST. The specific network structure of GPST is illustrated in Figure 5. This module modifies the traditional direct addition and concatenation into “gated fusion addition” and “gated fusion concatenation” to reduce the transmission of background noise.
Figure 5.
Structure Diagram of the Gated Pyramid Spatial Transformation (GPST) Module.
In this structure, the Gating Unit [38] (denoted as G in Figure 5) is the fundamental component that controls the feature fusion ratio. Its internal computation process primarily involves cross-channel integration and numerical mapping of features. Let the feature matrix input to this unit be . Information is first extracted through a convolutional layer (), and a Sigmoid activation function () is subsequently used to map the results into the interval , yielding the weight matrix for feature screening. The calculation formula is as follows:
Using this weight matrix, the network can dynamically weight the input features based on the importance of different spatial locations. Based on the aforementioned Gating Unit, the feature fusion process of GPST is divided into two steps:
First, gated fusion addition. Let F be the deep feature processed by PSA and a Multi-Layer Perceptron (MLP), and be the shallow high-resolution feature. At the first fusion node shown in Figure 5, feature F is input into a Gating Unit to compute the spatial weight . Subsequently, this weight is utilized to perform a weighted sum of the features:
Second, gated fusion concatenation. At the final feature output node, obtained from the first step is fed into a second Gating Unit to generate another set of spatial weights . Before channel concatenation, and are used to weight and allocate the two feature streams. The formula is as follows:
The concatenated features finally pass through a convolutional layer for channel dimension adjustment and output. By introducing this gated screening mechanism, complex background noise is effectively filtered out with the aid of cross-scale attention, further boosting the localization and recognition performance of diseased regions.
2.5. Large-Kernel Separated Pyramid Attention (LSPA) Module
Toward the final stage of feature extraction in the backbone, capturing sufficient global contextual information is critical for identifying large-scale plant lesions. The baseline model uses Spatial Pyramid Pooling Fast (SPPF) to obtain multi-scale receptive fields. However, standard SPPF directly concatenates pooling features with equal weights, lacking a local spatial focusing mechanism. In complex natural agricultural images, this frequently entangles background interference with disease features, limiting localization accuracy.
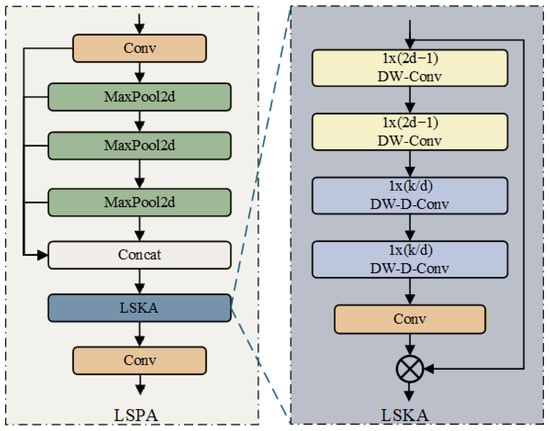
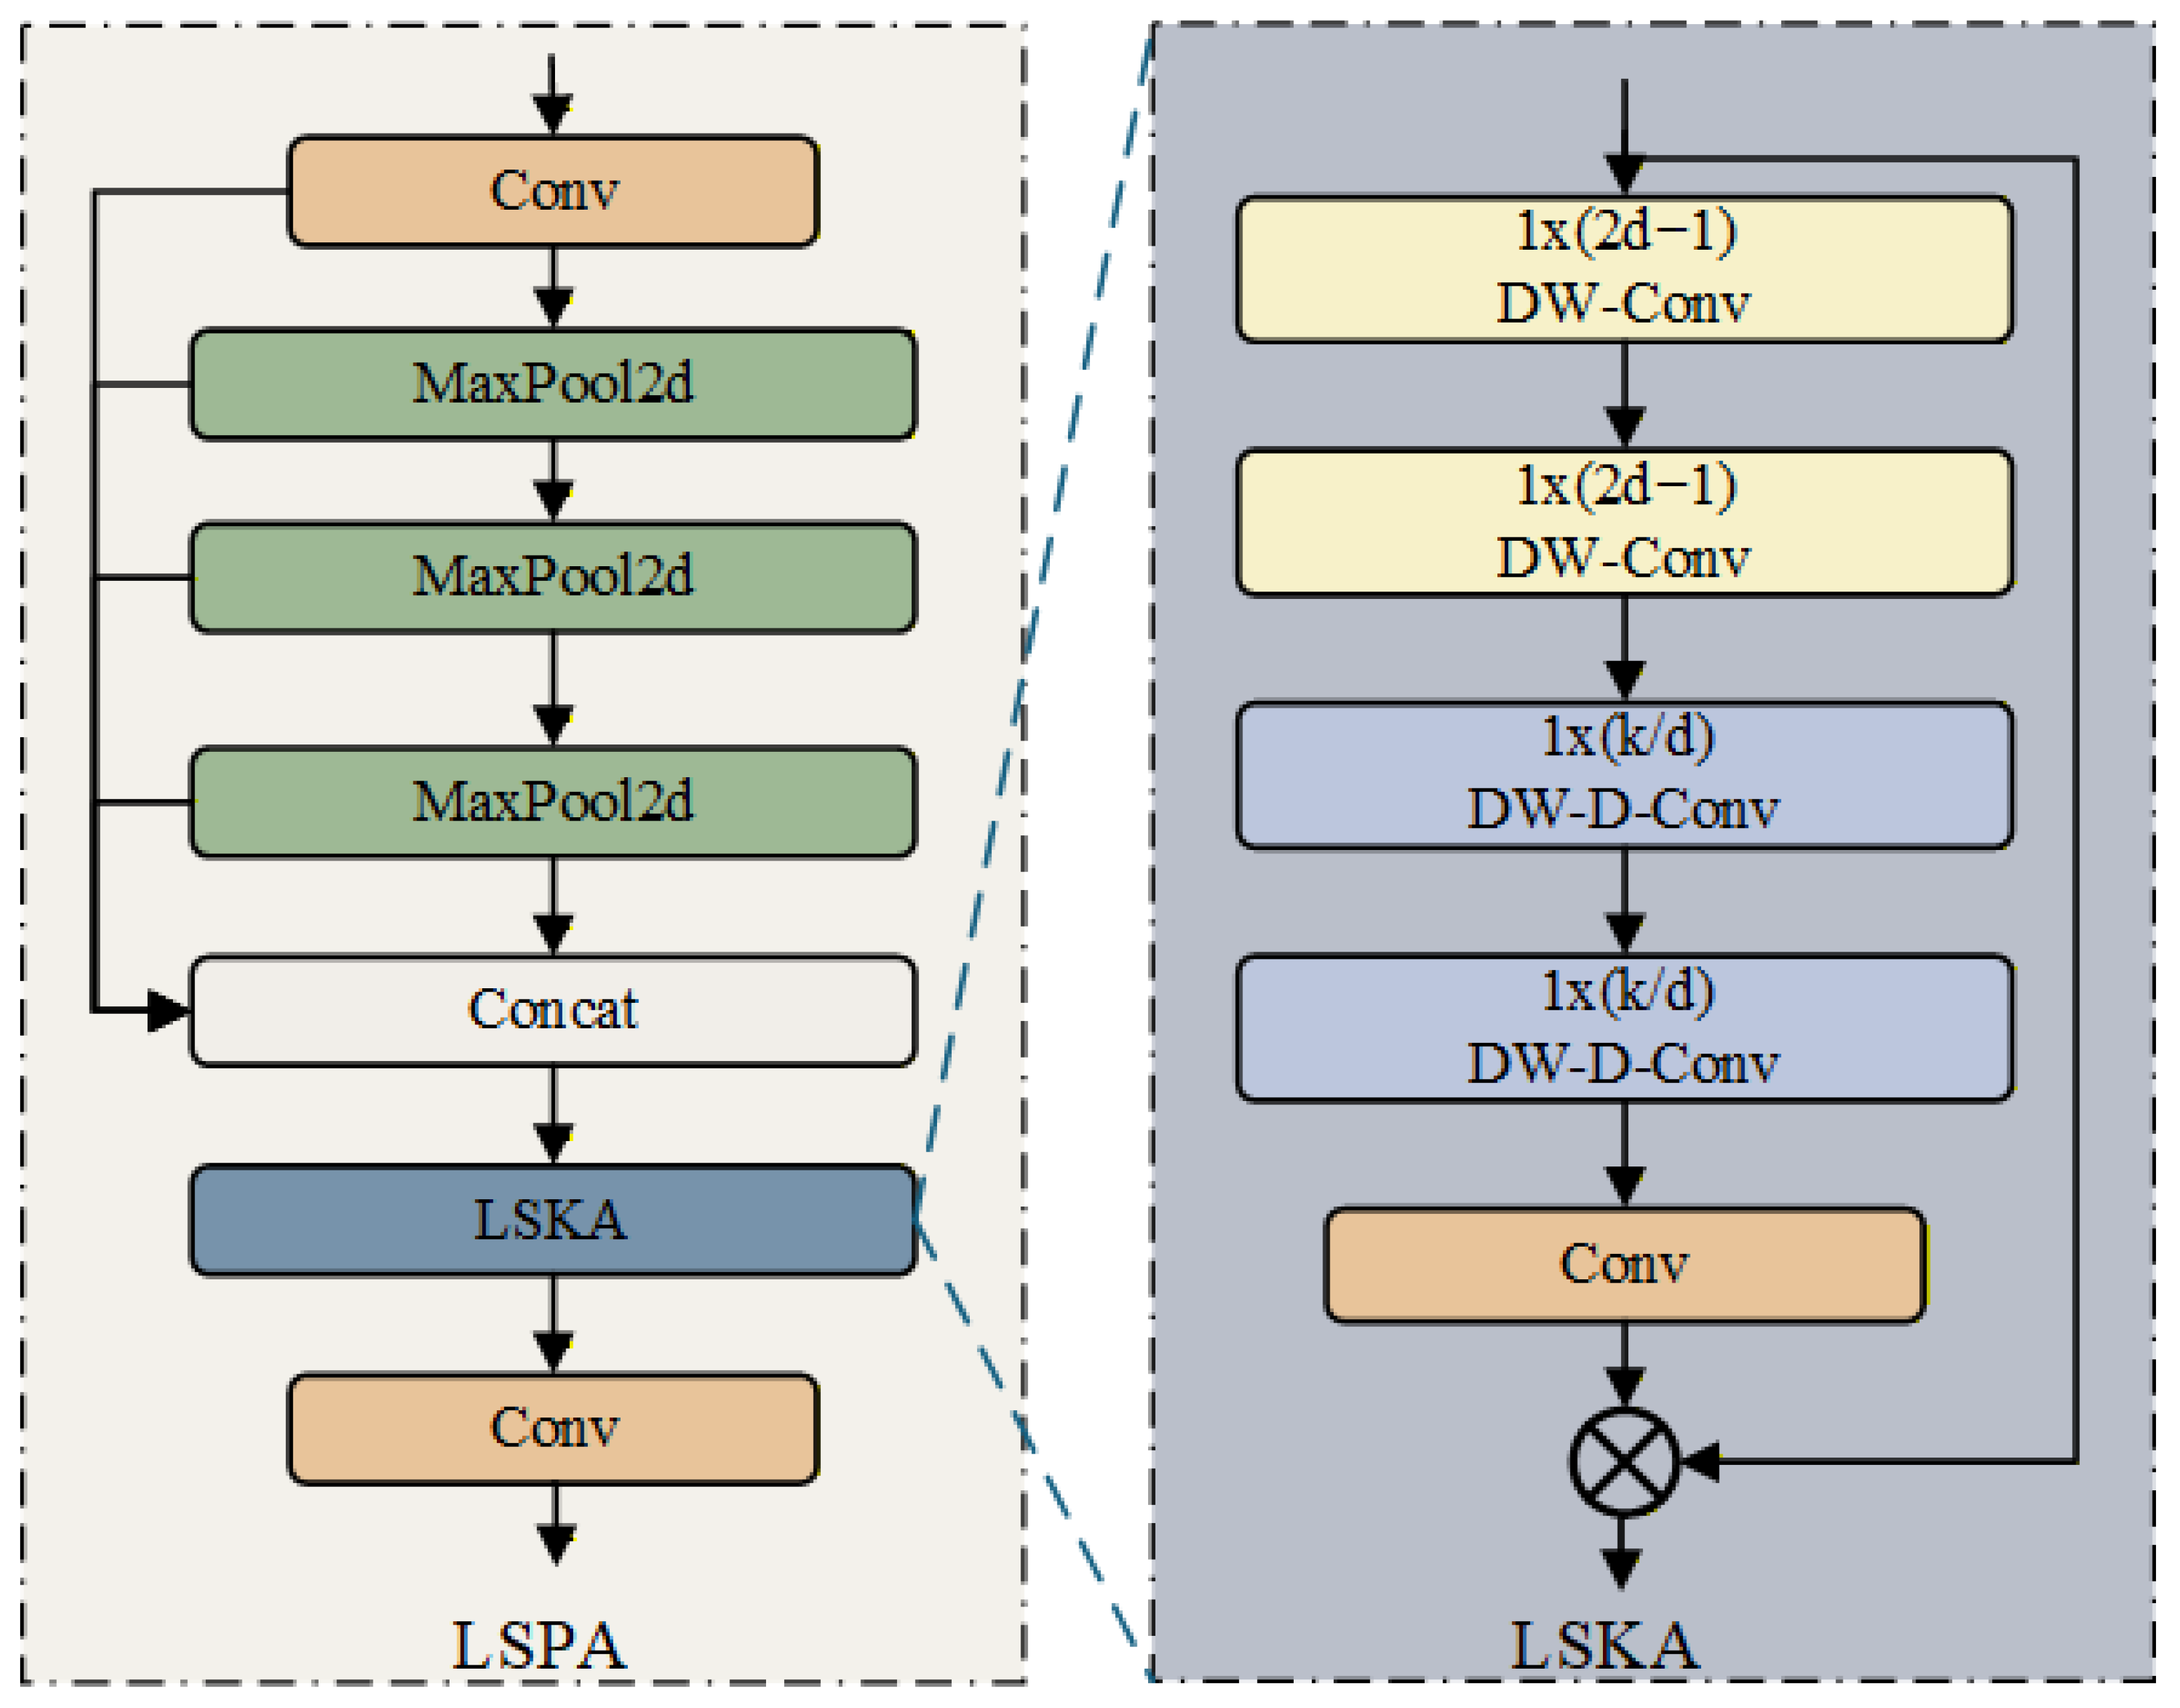
To address this limitation, we restructure the spatial pyramid pooling into the Large-kernel Separated Pyramid Attention (LSPA) module. As illustrated in Figure 6, this module embeds Large Separable Kernel Attention (LSKA) after multi-scale cascaded pooling to adaptively screen global features.
Figure 6.
Structure Diagram of the Large-Kernel Separated Pyramid Attention (LSPA) Module.
As shown in the left part of Figure 6, the input feature passes through an initial convolution and three cascaded max-pooling layers. The unpooled feature and the pooled outputs () are combined through channel-wise concatenation to generate a contextual feature with multi-scale receptive fields:
To suppress background redundancy, is fed into the LSKA sub-module (Figure 6, right). To avoid the substantial parameter burden of standard large 2D kernels, LSKA spatially decomposes a equivalent kernel into cascaded 1D depth-wise separable convolutions and 1D dilated depth-wise separable convolutions. Let d be the dilation rate and W be the learnable weight matrix. The data flow processes the feature tensor directly:
First, passes through depth-wise separable convolutions with horizontal and vertical kernel sizes of and . This captures local spatial details, yielding the intermediate feature :
Next, enters orthogonal dilated convolutional layers with kernel sizes of and . Using a dilation rate of d, this expands the receptive field to capture long-range spatial dependencies, producing :
A standard convolution then compresses the cross-channel information, generating a 2D spatial attention weight map A:
Finally, this attention map dynamically recalibrates the original concatenated features via element-wise multiplication (⊗):
Fused by a final standard convolution, the output retains the multi-scale advantages of SPPF while acquiring an extended receptive field with low computational overhead via separated large-kernel convolutions. This attention-guided recalibration adaptively focuses the network on the lesion bodies, thereby enhancing the representation of large and irregularly shaped diseases.
3. Results and Discussion
3.1. Experimental Settings
All experiments were conducted on an Ubuntu 22.04 operating system, equipped with an Intel Xeon(R) Gold 6330 processor (14 cores) and 60 GB of RAM. Hardware acceleration was driven by a single NVIDIA GeForce RTX 3090 GPU (24 GB VRAM). The software stack consisted of Python 3.10 and the PyTorch 2.3.0 deep learning framework, utilizing CUDA 12.1 and cuDNN libraries for optimized GPU computation.
To ensure fair comparisons, the training hyperparameters were uniformly set across all models, as detailed in Table 1. Specifically, we set an initial learning rate of 0.01, momentum of 0.937, and adopted the SGD optimizer. The input images were resized to with a batch size of 16. The loss function followed the baseline YOLO11 configuration, incorporating Complete Intersection over Union (CIoU) and Distribution Focal Loss (DFL). This setup was maintained to strictly control experimental variables, ensuring that all performance gains were objectively attributed to the proposed structural enhancements. The maximum training duration was capped at 200 epochs, incorporating an early stopping mechanism: the training process was terminated if the validation performance failed to improve for 50 consecutive epochs, thereby preventing overfitting and conserving computational resources.
Table 1.
The specific hyperparameter information of the model.
3.2. Model Evaluation
This paper assesses the performance of the designed TGL-YOLO model under complicated field conditions from two crucial aspects: detection accuracy and real-time running efficiency. Precise recognition and positioning can effectively reduce missed and false detections, while efficient inference speed lays the foundation for real-time monitoring and large-scale field detection applications. Therefore, Precision (P), Recall (R), mean Average Precision (mAP), F1-score, and GFLOPs are adopted as the main evaluation indexes.
In this study, multiple core indicators are adopted to measure the model’s overall performance. Precision refers to the percentage of genuinely positive samples among all samples judged as positive by the model, which reflects the credibility of its detection outputs. Recall indicates the percentage of actual objects successfully recognized, characterizing the model’s ability to capture all targets. Average Precision (AP) corresponds to the area under the Precision–Recall curve for a single class, offering an overall assessment of class-specific detection quality. Mean Average Precision (mAP), computed as the mean of AP across all categories, reflects the overall model effectiveness on the dataset. Two mAP standards are applied: mAP@0.5 and mAP@0.5:0.95. The former is calculated at an IoU threshold of 0.5 to assess classification performance, while the latter averages AP over IoU thresholds from 0.5 to 0.95 at 0.05 intervals, enabling a stricter evaluation of localization accuracy for multi-scale objects. The F1-score serves as the harmonic mean of Precision and Recall, used to balance overall detection performance. In addition, Params and GFLOPs are adopted to quantify the model’s scale and computational cost respectively. The formal definitions of these indicators are presented below:
where represents the number of correctly detected targets (true positives), represents the number of false detections (false positives), and represents the number of missed detections (false negatives). N is the total number of categories in the dataset. represents the precision–recall curve function for a specific category i, and is the average precision for that category.
3.3. Ablation Experiments
We first conducted hyperparameter experiments on the TSDBlock to determine the suitable channel split ratio and dynamic convolution kernel sizes, as shown in Table 2. Group 1 represents the baseline dynamic convolution without the split strategy. As observed in Group 2, directly increasing the kernel size without employing a multi-branch split leads to a parameter increase to 14.42 M. Compared to the evenly split multi-branch designs (Groups 3 and 4), our proposed 2:1:1 split ratio (Group 6) preserves 50% of the channels unprocessed as an identity mapping, which helps prevent the loss of fine-grained details. Furthermore, increasing the kernel size to (Group 5) yielded marginal performance improvements but introduced redundant parameters. Consequently, the 2:1:1 split combined with multi-scale kernels of 3 and 5 provides an effective balance, efficiently reducing the computational cost to 20.7 GFLOPs while obtaining a mean mAP@0.5 of 0.569.
Table 2.
Hyperparameter analysis of the TSDBlock module with different channel split ratios and dynamic convolution kernel sizes.
For the LSPA module, to balance the global receptive field and resource overhead, we drew upon the empirical conclusions of the original LSKA literature. By cascading standard and dilated separable convolutions with a dilation rate of 2, this module performs mathematical reconstruction to form an receptive field, enabling better adaptation to the diverse scales of plant disease spots, thereby mitigating the high computational cost associated with standard large kernels. Additionally, the GPST module requires no manual tuning, as its gating mechanism relies solely on dynamically optimized learnable weights via a convolution and a Sigmoid function.
To validate the effectiveness of these proposed modules, comprehensive ablation experiments were conducted on both the PlantDoc and FieldPlant datasets using YOLO11s as the baseline (Group 1). To rigorously assess model stability and account for initialization variance, all experiments were independently repeated three times. The mAP metrics are reported as the mean ± standard deviation. The quantitative results are detailed in Table 3 and Table 4.
Table 3.
Ablation Experiments of Different Improved Modules on the PlantDoc Dataset.
Table 4.
Ablation Experiments of Different Improved Modules on the FieldPlant Dataset.
The experimental data indicate that the independent introduction of any single module (Groups 2–4) consistently improves the baseline metrics across both datasets. On the PlantDoc dataset, single modules increase the mean mAP@0.5 by 2.1% to 3.2%. Similarly, on the FieldPlant dataset, they provide a 0.8% to 1.5% improvement in mean mAP@0.5 over a higher initial baseline. This suggests that the multi-scale dynamic extraction of TSDBlock, the gated background noise reduction in GPST, and the large-receptive-field global interaction of LSPA each contribute to addressing the actual challenges of lesion scale variations and background interference.
With progressive module integration, the model achieves further performance optimizations. On the PlantDoc dataset, the full TGL-YOLO configuration (Group 8) yields a mean mAP@0.5 of 0.591 and an mAP@0.5:0.95 of 0.449. On the FieldPlant dataset, Group 8 achieves the best comprehensive performance, reaching 0.793 in mean mAP@0.5 and 0.608 in mAP@0.5:0.95. Moreover, as shown in Table 3 and Table 4, the reduced standard deviation of the final configuration indicates enhanced training stability. Notably, the efficient structural synergy allows the final model’s overall computational cost to drop from the baseline’s 21.4 GFLOPs to 20.7 GFLOPs. This ablation study demonstrates that the architectural optimizations in TGL-YOLO effectively improve detection accuracy in natural environments while maintaining a streamlined computational structure.
3.4. Comparison Experiments
3.4.1. Comparison with YOLO11s
To evaluate the class-wise detection capability of the proposed method, we compare TGL-YOLO with the YOLO11s baseline on the PlantDoc and FieldPlant datasets. Given the numerous disease categories in both datasets, we report the detection results for the top ten categories with the highest number of instances in the test sets, as presented in Table 5 and Table 6.
Table 5.
The PlantDoc dataset results of TGL-YOLO and YOLO11s (C01: Tomato leaf yellow virus, C02: Blueberry leaf, C03: Tomato leaf mosaic virus, C04: Strawberry leaf, C05: Tomato leaf, C06: Tomato Septoria leaf spot, C07: Soyabean leaf, C08: Tomato Early blight leaf, C09: Cherry leaf, C10: Potato leaf late blight).
Table 6.
The FieldPlant dataset results of TGL-YOLO and YOLO11s (C01: Tomato Brown Spots, C02: Cassava Mosaic, C03: Corn leaf blight, C04: Corn Yellowing, C05: Tomato blight leaf, C06: Tomato healthy, C07: Cassava Healthy, C08: Corn Streak, C09: Corn Stripe, C10: Corn Brown Spots).
As observed in Table 5 and Table 6, TGL-YOLO shows improved metrics over the YOLO11s baseline. On the PlantDoc dataset, the for Tomato leaf (C05) increases from 0.413 to 0.558, and the rises from 0.262 to 0.385. Observations on the FieldPlant dataset also indicate a steady increase in detection accuracy, with the for Tomato Brown Spots (C01) and Corn Brown Spots (C10) improving by 3.2% and 2.9%, respectively, meaning a higher share of correct positive results in all predicted samples. Overall, the experimental results on both datasets verify that the proposed method effectively improves the accuracy of plant disease object detection.
3.4.2. Comparative Analysis of the Proposed Modules
To verify the effectiveness of the proposed improved modules, ablation experiments were carried out on the PlantDoc dataset for each key component (TSDBlock, GPST, and LSPA) in comparison with several state-of-the-art methods.
First, in the feature extraction stage, the proposed TSDBlock was compared with control groups that retained the original C3k2 module but replaced its internal Bottleneck with advanced convolutions, including PConv [39], WTConv [40], and dynamic convolution (DConv). As presented in Table 7, while replacing individual operators brings moderate performance improvements (e.g., C3k2-DConv reaches an mAP@0.5 of 0.558), the proposed TSDBlock fundamentally reconstructs the extraction module. By adopting a 50:25:25 channel splitting strategy combined with multi-size dynamic kernels, TSDBlock achieves an mAP@0.5 of 0.569 and an mAP@0.5:0.95 of 0.444. This indicates that, compared to simply integrating a single advanced convolution operator, the multi-receptive field collaborative design provides a more effective approach for capturing multi-scale agricultural lesions.
Table 7.
Performance comparison of different feature extraction modules on the PlantDoc dataset.
Second, for cross-scale feature interaction in the neck network, Table 8 compares the proposed GPST module with the original PST, as well as representative neck network variants including BiFPN [41] and AFPN [42]. While the original PST and other FPN variants improve upon the YOLO11s baseline, standard addition and concatenation fusions often retain complex agricultural background noise. In contrast, the GPST module helps mitigate background interference by introducing a dynamic gating mechanism. It yields an mAP@0.5 of 0.565 and an mAP@0.5:0.95 of 0.442, demonstrating its suitability for processing disease images with highly complex backgrounds.
Table 8.
Performance comparison of different cross-scale interaction modules on the PlantDoc dataset.
Finally, to evaluate the global context extraction capability at the end of the backbone network, the proposed LSPA was compared against standard attention mechanisms (SimAM [43], CBAM [44], CA [45], EMA [46]) and advanced spatial pooling modules (ASPP [47], SPPCSPC [48]). As shown in Table 9, although pooling structures like SPPCSPC yield mAP@0.5 improvements (0.570), the proposed LSPA provides a more balanced performance among the tested variants. By capturing a broader receptive field while maintaining precise spatial focus via the LSKA operator, LSPA achieves an mAP@0.5 of 0.576 and an mAP@0.5:0.95 of 0.445. This suggests that LSPA offers improved anti-interference capabilities for handling multi-scale plant lesions compared to traditional attention and pooling designs.
Table 9.
Comparative Analysis of Different Attention and Pooling Improvement Modules.
3.4.3. Comparison with State-of-the-Art Models
The comprehensive capability of the proposed TGL-YOLO model is validated through extensive benchmarking against several state-of-the-art (SOTA) object detection algorithms on both the PlantDoc and FieldPlant datasets. The control models include the two-stage Faster R-CNN, the RT-DETR-R18, and mainstream single-stage models ranging from YOLOv5s to YOLO12s, alongside YOLO11 variants of different scales including 11n, 11s, and 11m. The quantitative evaluation results are presented in Table 10 and Table 11.
Table 10.
Comprehensive performance comparison between TGL-YOLO and other state-of-the-art (SOTA) object detection models on the PlantDoc dataset.
Table 11.
Comprehensive performance comparison between TGL-YOLO and other state-of-the-art (SOTA) object detection models on the FieldPlant dataset.
According to the experimental results in the tables, TGL-YOLO exhibits competitive performance in multi-scale object detection tasks. On the PlantDoc dataset, the model achieves mean mAP@0.5 and mAP@0.5:0.95 values of 0.591 and 0.449, respectively, representing improvements of 4.7% and 3.7% over the YOLO11s baseline. Similar performance trends are observed on the FieldPlant dataset, where TGL-YOLO achieves an mAP@0.5 of 0.793, surpassing the baseline method by 2.3%.
When considering both efficiency and precision, TGL-YOLO achieves an effective balance between model complexity and detection quality. Compared to YOLO11m, TGL-YOLO delivers comparable detection performance, with mAP@0.5 differences of only 1.8% and 1.2% on the two datasets, respectively. However, TGL-YOLO reduces the hardware burden, requiring approximately 40% fewer parameters and less than one-third of the GFLOPs compared to the 11m variant. Furthermore, the YOLO-based architecture of TGL-YOLO exhibits a clear advantage over RT-DETR-R18. For instance, on the PlantDoc dataset, TGL-YOLO surpasses RT-DETR-R18 by 9.3% in mAP@0.5 despite utilizing approximately 40% fewer parameters. While YOLO11n minimizes memory footprint and maximizes inference speed, its lower precision makes it unsuitable for identifying subtle disease features in natural environments. On the other hand, although the introduction of functional modules results in a slight increase in latency compared to YOLO11s, this strategic trade-off is supported by the improvements in detection recall. Quantitative results confirm that TGL-YOLO provides a balanced architectural trade-off between accuracy and computational overhead, offering potential for future integration into high-precision agricultural monitoring systems.
3.5. Visualization Analysis
3.5.1. Comparative Visual Analysis
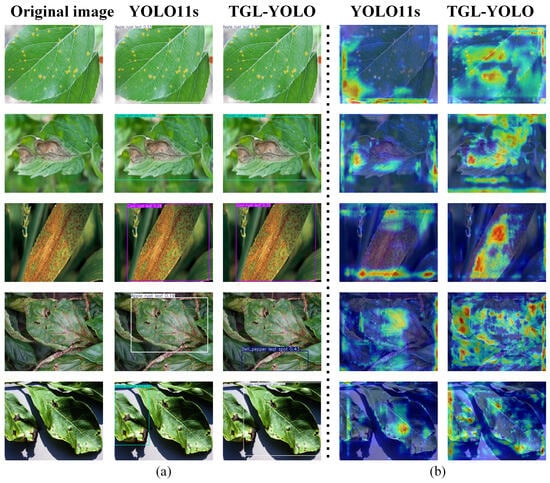
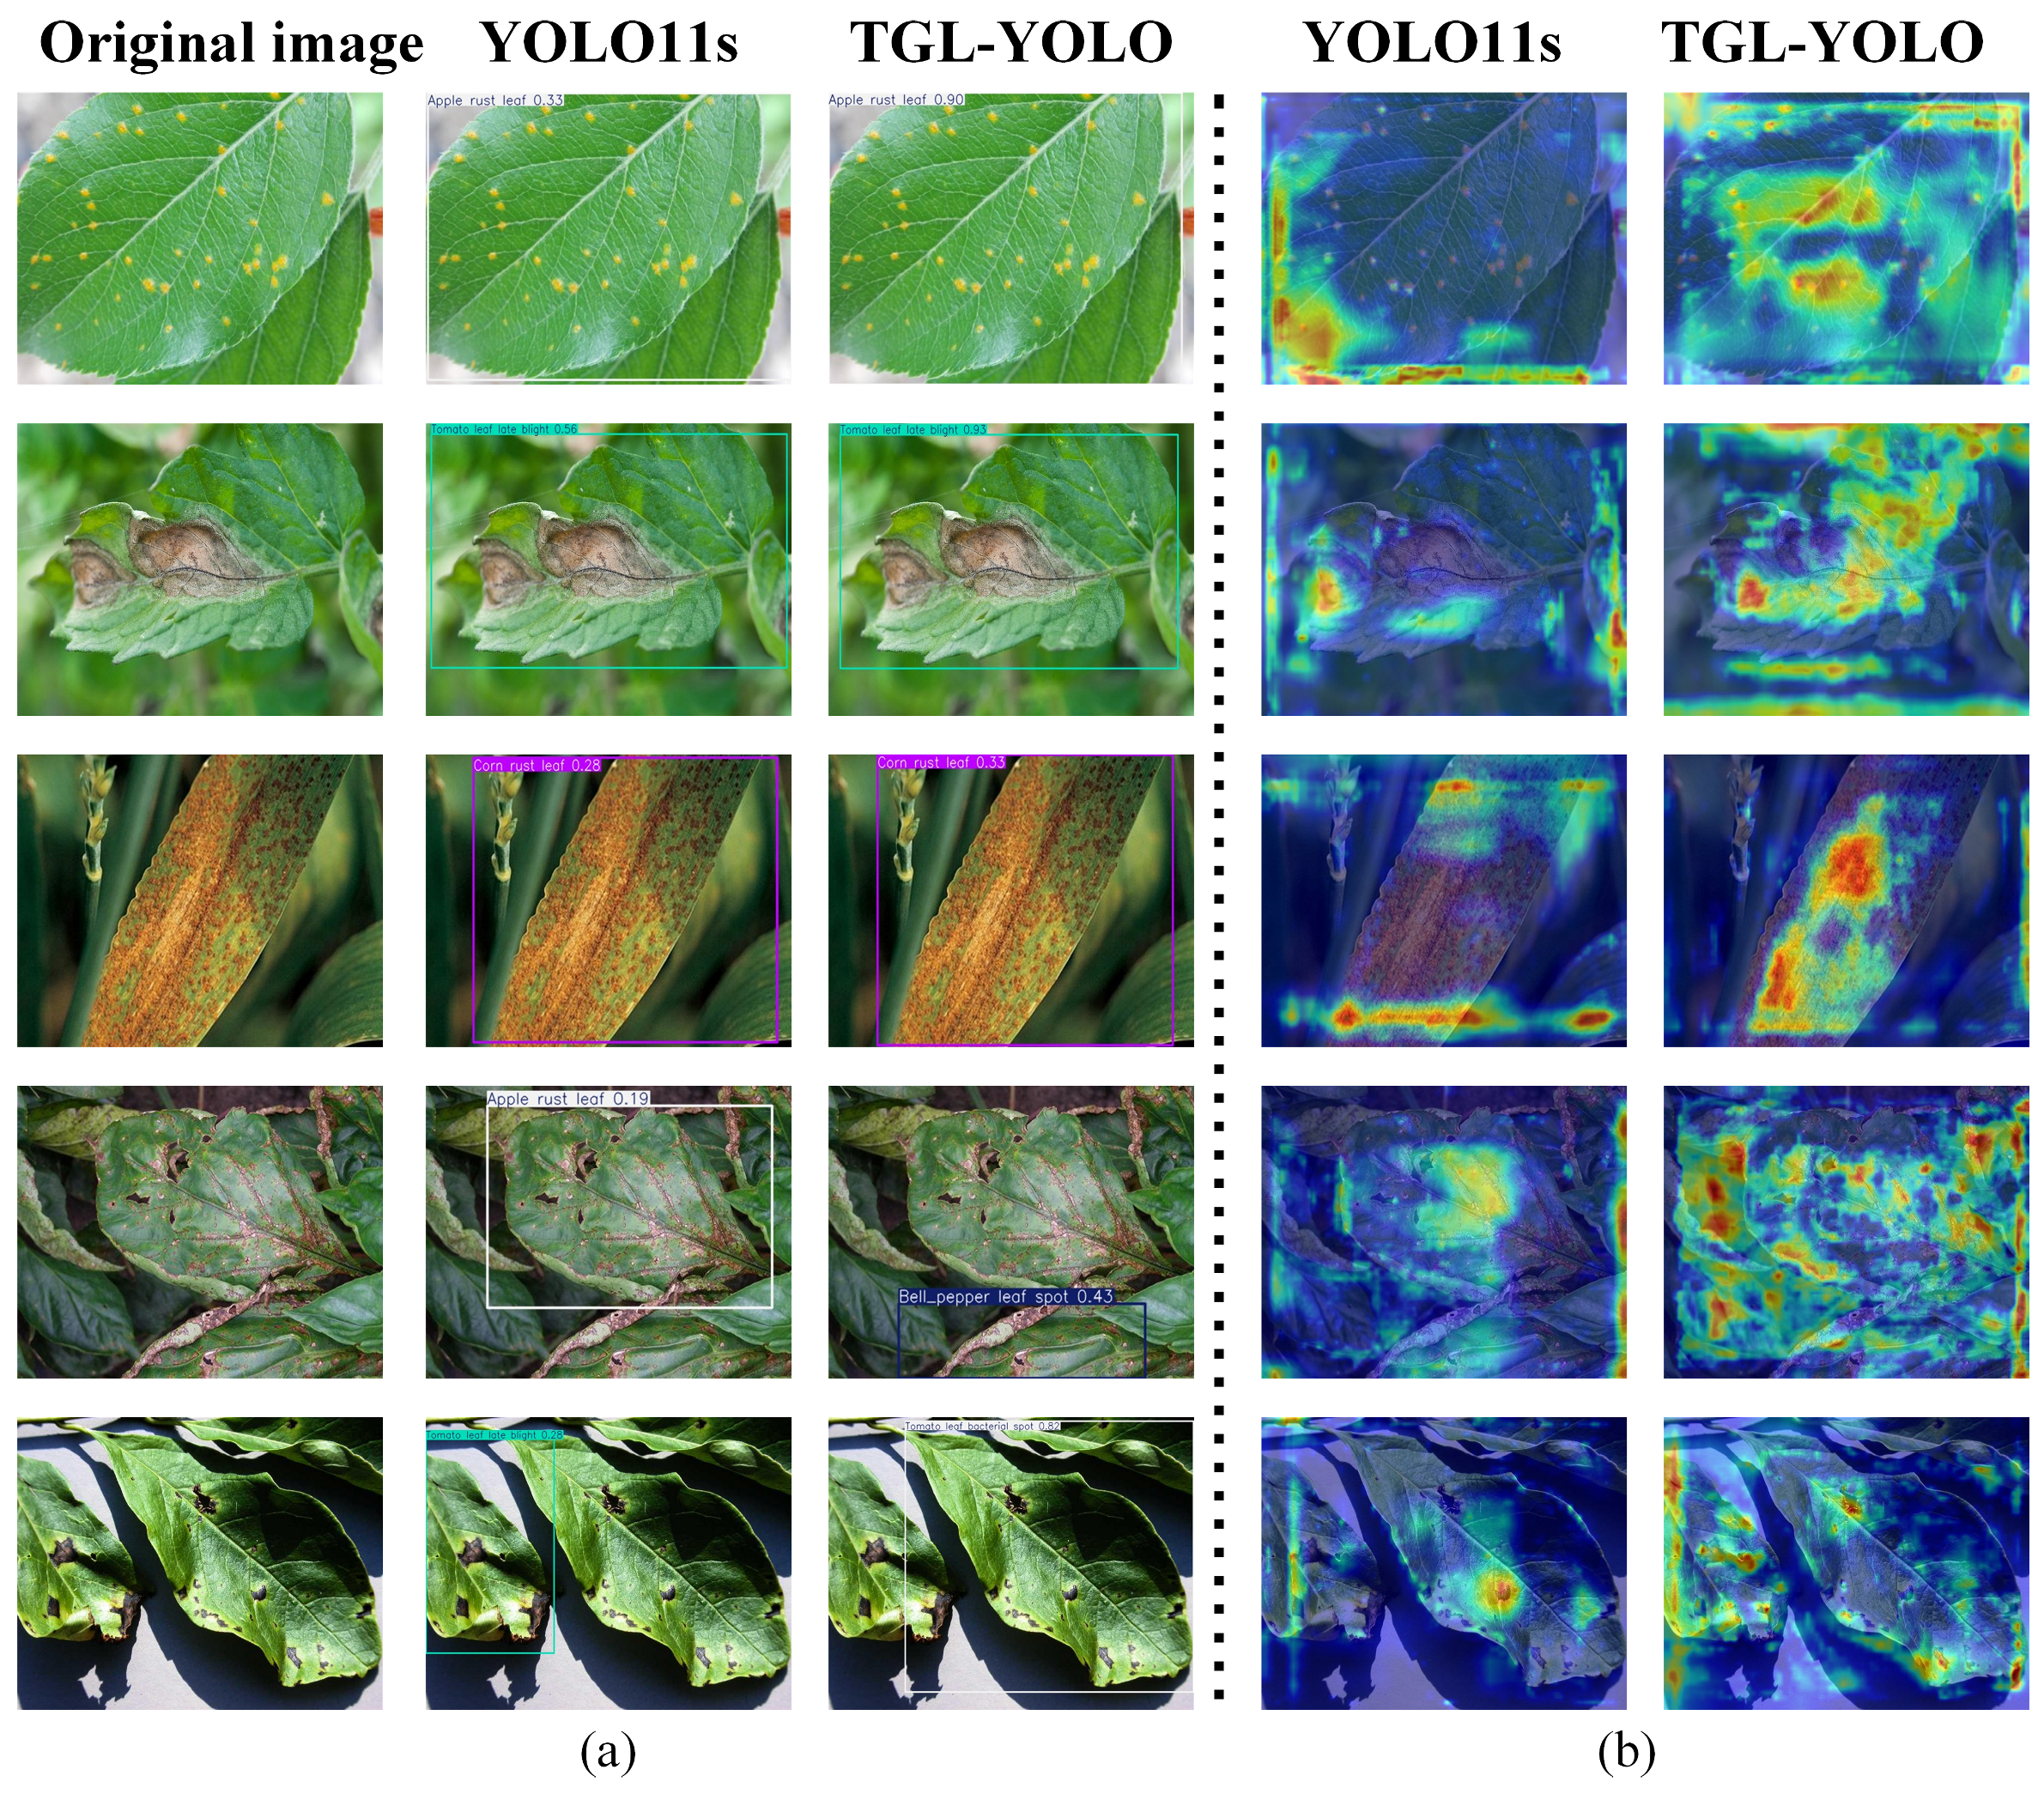
To intuitively assess the model’s actual detection performance in complex agricultural scenes, five representative samples are chosen for visualization, including Apple rust leaf, Tomato leaf late blight, Corn rust leaf, Bell_pepper leaf spot, and Tomato Septoria leaf spot. Figure 7 presents the visualization results, including detection result comparisons (Figure 7a) and SS-Grad-CAM++ heatmaps (Figure 7b) [49], an advanced visual explanation framework tailored for the spatial localization nuances of object detectors. In the detection results of Figure 7a, TGL-YOLO demonstrates advantages in both localization accuracy and classification reliability. For the first three samples, TGL-YOLO not only encloses the lesion areas but also achieves higher confidence scores than the YOLO11s baseline. Specifically, in the second row, the bounding box generated by TGL-YOLO closely matches the necrotic lesion region. Crucially, YOLO11s exhibits instances of missed detections and misclassifications when facing background interference. For instance, in the last two samples, YOLO11s outputs incorrect category labels and bounding box colors; in contrast, TGL-YOLO successfully corrects these classification deviations and identifies the true disease types and locations.
Figure 7.
Comparison of detection results and SS-Grad-CAM++ heatmaps between the baseline YOLO11s and TGL-YOLO: (a) visual detection results; (b) interpretability analysis via SS-Grad-CAM++ heatmaps.
The heatmaps in Figure 7b further reveal the internal decision-making mechanism behind the performance gap mentioned above. Taking the Corn rust leaf in the third row as an example, the attention of YOLO11s is diffused, failing to cover the dense lesion areas effectively; conversely, the high-response regions of TGL-YOLO align with the physical distribution of the strip-like lesions, demonstrating anti-interference localization capabilities. Likewise, for the apple rust leaf sample in the first row, the baseline model tends to focus on leaf edges and background noise, while TGL-YOLO concentrates on the small, scattered spot lesions. Furthermore, as observed in the second and fifth rows, while YOLO11s generates fragmented activations or is misled by leaf shadows, TGL-YOLO forms a concentrated, contiguous response directly over the necrotic center of the late blight and generates a high-intensity response exactly on the small black Septoria leaf spot. This precise focusing on both macroscopic structures and microscopic lesions, further validated by the spatial sensitivity of SS-Grad-CAM++, proves that TGL-YOLO possesses improved capabilities in multi-scale feature extraction and complex background filtering.
3.5.2. Systematic Error Analysis
We systematically evaluated the performance boundaries of TGL-YOLO by analyzing categories with lower detection accuracy (Figure 8). By integrating overall confusion trends with specific failure cases, we attribute the remaining bottlenecks to pathological similarity, dataset constraints, and spatial interference.
Figure 8.
Systematic failure analysis: (a–f) visualization of typical failure cases.
First, mutual misclassification frequently occurs among three confusing diseases: Tomato Early blight, Septoria leaf spot, and Bacterial spot (Figure 8a–d). In Figure 8a,b, Bacterial spot is consistently misidentified as Septoria leaf spot. Because both manifest as small, dark necrotic lesions, this severe morphological overlap challenges the network’s ability to decouple fine-grained textures, leading to semantic confusion.
Second, inherent dataset ambiguity exacerbates these errors. Figure 8c shows that early-stage Early blight lesions lack distinct structural edges, causing misclassification as Bacterial spots. Furthermore, Figure 8d highlights extreme scale constraints. When target leaves occupy a minimal image fraction, unstructured backgrounds (soil, straw) overwhelm the feature extraction process. This limits the GPST module’s noise-filtering capacity, causing Early blight to be incorrectly predicted as Septoria leaf spot.
Finally, Figure 8e,f contextualize these issues within extreme edge cases. Figure 8e illustrates “saliency-driven suppression” in Bell_pepper leaf spots, where visually dominant peripheral lesions suppress the detection of shadowed central clusters. Figure 8f demonstrates severe multi-class misclassification for Tomato mold leaf, driven by its diffuse and unstructured symptoms. Lacking clear morphological boundaries, the chlorotic patches disrupt the network’s spatial feature extraction, causing it to erroneously predict multiple distinct categories within the same continuous lesion. Collectively, these cases confirm that while TGL-YOLO optimizes multi-scale contextual fusion, precise semantic decoupling of visually diffuse classes remains a primary focus for future refinement.
4. Conclusions
Faced with the challenges of complex agricultural background interference and inconsistent lesion scales in plant disease detection, this paper presents TGL-YOLO, a multi-scale feature enhancement network built upon the YOLO11s framework. For the adaptive capture of multi-scale features, we design the TSDBlock, which adopts a channel-wise divide-and-conquer strategy and multi-scale dynamic convolutions to collaboratively extract receptive fields. During the feature fusion phase, the GPST module employs a gated mechanism to dynamically screen cross-scale information, mitigating the interference of complex backgrounds on lesion localization. Additionally, the integrated LSPA module leverages a large-kernel selective attention mechanism to provide a broad global receptive field while maintaining precise spatial focus, improving the model’s robustness to variable diseases.
Experimental evaluations carried out on both the PlantDoc and FieldPlant datasets fully demonstrate the strong detection performance of the proposed TGL-YOLO. In terms of quantitative results, the model yields mean mAP@0.5 scores of 0.591 and 0.793 on the two datasets, which are 4.7% and 2.3% higher than those of the original YOLO11s baseline, respectively. SS-Grad-CAM++ visualizations confirm that TGL-YOLO filters complex field backgrounds to anchor on scattered lesions. Nevertheless, systematic error analysis reveals specific performance boundaries in complex agricultural scenarios. Morphological similarities lead to high mutual misclassification rates among specific tomato diseases (e.g., Tomato Early blight, Septoria leaf spot, and Bacterial spot). Furthermore, the diffuse nature of certain lesions (such as Tomato mold leaf) disrupts precise spatial feature extraction, resulting in semantic drift and false detections.
In response to these issues, several targeted improvement directions will be explored. First, future research will focus on validation and optimization on specific edge-computing platforms. This includes measuring hardware-level latency and memory footprints, followed by implementing lightweighting strategies such as structural pruning and knowledge distillation to further enhance deployment readiness. Second, specifically addressing the high misclassification rates among the aforementioned tomato diseases, we aim to develop dedicated fine-grained feature extraction modules to decouple highly similar textures. Third, further optimization of bounding box regression losses will be explored to better fit diffuse plant disease characteristics. Finally, to transcend the physical limitations of RGB sensors, we plan to investigate multi-modal data fusion techniques, such as integrating visible light with infrared or multispectral data, to achieve reliable detection results under diverse environmental conditions.
Author Contributions
Q.W. and Z.W. jointly conceived the study and designed the research framework. Z.W. developed the methodology, carried out validation, and prepared the original draft. Formal analysis was performed by both Q.W. and Z.W. The manuscript was reviewed and edited by Q.W. and Z.W. Z.W. was responsible for visualization. Q.W. provided supervision throughout the project. All authors have read and agreed to the published version of the manuscript.
Funding
This work was supported by the Postgraduate Research & Practice Innovation Program of Jiangsu Province (grant number SJCX25_0525).
Data Availability Statement
The data presented in this study are available in public repositories at https://github.com/pratikkayal/PlantDoc-Dataset (accessed on 21 April 2026) and https://universe.roboflow.com/bleh-kssi2/fieldplant-jjtn4 (accessed on 21 April 2026), reference numbers [32,33]. The full source code is available at https://github.com/wzyu1314/TGL-YOLO (accessed on 21 April 2026).
Conflicts of Interest
The authors declare no conflicts of interest.
References
- Kamilaris, A.; Prenafeta-Boldú, F.X. Deep learning in agriculture: A survey. Comput. Electron. Agric. 2018, 147, 70–90. [Google Scholar] [CrossRef] [Scilit]
- Savary, S.; Willocquet, L.; Pethybridge, S.J.; Esker, P.; McRoberts, N.; Nelson, A. The Global Burden of Pathogens and Pests on Major Food Crops. Nat. Ecol. Evol. 2019, 3, 430–439. [Google Scholar] [CrossRef] [Scilit]
- Ferentinos, K.P. Deep learning models for plant disease detection and diagnosis. Comput. Electron. Agric. 2018, 145, 311–318. [Google Scholar] [CrossRef] [Scilit]
- Mohanty, S.P.; Hughes, D.P.; Salathé, M. Using Deep Learning for Image-Based Plant Disease Detection. Front. Plant Sci. 2016, 7, 1419. [Google Scholar] [CrossRef] [Scilit] [PubMed]
- Ren, S.; He, K.; Girshick, R.; Sun, J. Faster R-CNN: Towards Real-Time Object Detection with Region Proposal Networks. IEEE Trans. Pattern Anal. Mach. Intell. 2017, 39, 1137–1149. [Google Scholar] [CrossRef] [Scilit]
- He, K.; Gkioxari, G.; Dollar, P.; Girshick, R. Mask R-CNN. In Proceedings of the 2017 IEEE International Conference on Computer Vision (ICCV), Venice, Italy, 22–29 October 2017; IEEE: New York, NY, USA, 2017. [Google Scholar] [CrossRef] [Scilit]
- Cai, Z.; Vasconcelos, N. Cascade R-CNN: Delving into High Quality Object Detection. arXiv 2017, arXiv:1712.00726. [Google Scholar] [CrossRef] [Scilit]
- Liu, W.; Anguelov, D.; Erhan, D.; Szegedy, C.; Reed, S.; Fu, C.-Y.; Berg, A.C. SSD: Single Shot MultiBox Detector. In Computer Vision–ECCV 2016; Springer: Cham, Switzerland, 2016; Volume 9905, pp. 21–37. [Google Scholar] [CrossRef] [Scilit]
- Redmon, J.; Divvala, S.; Girshick, R.; Farhadi, A. You Only Look Once: Unified, Real-Time Object Detection. In Proceedings of the 2016 IEEE Conference on Computer Vision and Pattern Recognition (CVPR), Las Vegas, NV, USA, 27–30 June 2016; IEEE: New York, NY, USA, 2016; pp. 779–788. [Google Scholar] [CrossRef] [Scilit]
- Carion, N.; Massa, F.; Synnaeve, G.; Usunier, N.; Kirillov, A.; Zagoruyko, S. End-to-End Object Detection with Transformers. In Computer Vision–ECCV 2020; Springer: Cham, Switzerland, 2020; Volume 12346, pp. 213–229. [Google Scholar] [CrossRef] [Scilit]
- Zhu, X.; Su, W.; Lu, L.; Li, B.; Wang, X.; Dai, J. Deformable DETR: Deformable Transformers for End-to-End Object Detection. arXiv 2021, arXiv:2010.04159. [Google Scholar] [CrossRef] [Scilit]
- Lv, W.; Xu, S.; Zhao, Y.; Wang, G.; Wei, J.; Cui, C.; Du, Y.; Dang, Q.; Liu, Y. DETRs Beat YOLOs on Real-time Object Detection. arXiv 2023, arXiv:2304.08069. [Google Scholar]
- Zhang, H.; Li, F.; Liu, S.; Zhang, L.; Su, H.; Zhu, J.; Ni, L.M.; Shum, H.-Y. DINO: DETR with Improved DeNoising Anchor Boxes for End-to-End Object Detection. arXiv 2022, arXiv:2203.03605. [Google Scholar]
- Gong, X.; Zhang, S. A High-Precision Detection Method of Apple Leaf Diseases Using Improved Faster R-CNN. Agriculture 2023, 13, 240. [Google Scholar] [CrossRef] [Scilit]
- Zhao, S.; Liu, J.; Wu, S. Multiple disease detection method for greenhouse-cultivated strawberry based on multiscale feature fusion Faster R_CNN. Comput. Electron. Agric. 2022, 199, 107176. [Google Scholar] [CrossRef] [Scilit]
- Bondre, S.; Patil, D. Crop disease identification segmentation algorithm based on Mask-RCNN. Agron. J. 2023, 116, 1088–1098. [Google Scholar] [CrossRef] [Scilit]
- Prashanth, K.; Harsha, J.S.; Kumar, S.A.; Srilekha, J. Towards Accurate Disease Segmentation in Plant Images: A Comprehensive Dataset Creation and Network Evaluation. In Proceedings of the 2024 IEEE/CVF Winter Conference on Applications of Computer Vision (WACV), Waikoloa, HI, USA, 3–8 January 2024; IEEE: New York, NY, USA, 2024; pp. 7071–7079. [Google Scholar] [CrossRef] [Scilit]
- Wang, H.; Shang, S.; Wang, D.; He, X.; Feng, K.; Zhu, H. Plant Disease Detection and Classification Method Based on the Optimized Lightweight YOLOv5 Model. Agriculture 2022, 12, 931. [Google Scholar] [CrossRef] [Scilit]
- Qi, J.; Liu, X.; Liu, K.; Xu, F.; Guo, H.; Tian, X.; Li, M.; Bao, Z.; Li, Y. An improved YOLOv5 model based on visual attention mechanism: Application to recognition of tomato virus disease. Comput. Electron. Agric. 2022, 194, 106780. [Google Scholar] [CrossRef] [Scilit]
- Zhu, S.; Ma, W.; Wang, J.; Yang, M.; Wang, Y.; Wang, C. EADD-YOLO: An efficient and accurate disease detector for apple leaf using improved lightweight YOLOv5. Front. Plant Sci. 2023, 14, 1120724. [Google Scholar] [CrossRef] [Scilit]
- Miao, Y.; Meng, W.; Zhou, X. SerpensGate-YOLOv8: An enhanced YOLOv8 model for accurate plant disease detection. Front. Plant Sci. 2025, 15, 1514832. [Google Scholar] [CrossRef] [Scilit]
- Khanam, R.; Hussain, M. YOLOv11: An Overview of the Key Architectural Enhancements. arXiv 2024, arXiv:2410.17725. [Google Scholar] [CrossRef] [Scilit]
- Cardellicchio, A.; Renò, V.; Cellini, F.; Summerer, S.; Petrozza, A.; Milella, A. Incremental learning with domain adaption for tomato plant phenotyping. Smart Agric. Technol. 2025, 12, 101324. [Google Scholar] [CrossRef] [Scilit]
- Tang, X.; Sun, Z.; Yang, L.; Chen, Q.; Liu, Z.; Wang, P.; Zhang, Y. YOLOv11-AIU: A lightweight detection model for the grading detection of early blight disease in tomatoes. Plant Methods 2025, 21, 118. [Google Scholar] [CrossRef] [Scilit]
- Yao, J.; Li, Y.; Xia, Z.; Nie, P.; Li, X.; Li, Z. WTAD-YOLO: A lightweight tomato leaf disease detection model based on YOLO11. Smart Agric. Technol. 2025, 12, 101349. [Google Scholar] [CrossRef] [Scilit]
- Tao, J.; Li, X.; He, Y.; Islam, M.A. CEFW-YOLO: A High-Precision Model for Plant Leaf Disease Detection in Natural Environments. Agriculture 2025, 15, 833. [Google Scholar] [CrossRef] [Scilit]
- Zhang, S.; Wang, J.; Yang, K.; Guan, M. YOLO-ACT: An adaptive cross-layer integration method for apple leaf disease detection. Front. Plant Sci. 2024, 15, 1451078. [Google Scholar] [CrossRef] [Scilit]
- Tong, J.; Zhang, L.; Tian, J.; Yu, Q.; Lang, C. ToT-Net: A generalized and real-time crop disease detection framework via task-level meta-learning and lightweight multi-scale transformer. Smart Agric. Technol. 2025, 12, 101249. [Google Scholar] [CrossRef] [Scilit]
- Li, W.; Zhu, L.; Liu, J. PL-DINO: An Improved Transformer-Based Method for Plant Leaf Disease Detection. Agriculture 2024, 14, 691. [Google Scholar] [CrossRef] [Scilit]
- Fu, Z.; Yin, L.; Cui, C.; Wang, Y. A lightweight MHDI-DETR model for detecting grape leaf diseases. Front. Plant Sci. 2024, 15, 1499911. [Google Scholar] [CrossRef] [Scilit]
- Liu, Z.; Guo, X.; Zhao, T.; Liang, S. YOLO-BSMamba: A YOLOv8s-Based Model for Tomato Leaf Disease Detection in Complex Backgrounds. Agronomy 2025, 15, 870. [Google Scholar] [CrossRef] [Scilit]
- Singh, D.; Jain, N.; Jain, P.; Kayal, P.; Kumawat, S.; Batra, N. PlantDoc: A Dataset for Visual Plant Disease Detection. In Proceedings of the 7th ACM IKDD CoDS and 25th COMAD, Hyderabad, India, 5–7 January 2020; Association for Computing Machinery: New York, NY, USA, 2020; pp. 249–253. [Google Scholar] [CrossRef] [Scilit]
- Moupojou, E.; Tagne, A.; Retraint, F.; Tadonkemwa, A.; Dongmo, W.; Tapamo, H.; Nkenlifack, M. FieldPlant: A Dataset of Field Plant Images for Plant Disease Detection and Classification with Deep Learning. IEEE Access 2023, 11, 35398–35410. [Google Scholar] [CrossRef] [Scilit]
- Chen, Y.; Dai, X.; Liu, M.; Chen, D.; Yuan, L.; Liu, Z. Dynamic Convolution: Attention over Convolution Kernels. arXiv 2019, arXiv:1912.03458. [Google Scholar]
- Han, K.; Wang, Y.; Guo, J.; Wu, E. ParameterNet: Parameters Are All You Need. arXiv 2023, arXiv:2306.14525. [Google Scholar]
- Hu, J.; Bai, T.; Wu, F.; Peng, Z.; Zhang, Y. Pyramid Sparse Transformer: Enhancing Multi-Scale Feature Fusion with Dynamic Token Selection. arXiv 2025, arXiv:2505.12772. [Google Scholar] [CrossRef] [Scilit]
- Lau, K.W.; Po, L.-M.; Rehman, Y.A. Large Separable Kernel Attention: Rethinking the Large Kernel Attention Design in CNN. arXiv 2023, arXiv:2309.01439. [Google Scholar] [CrossRef] [Scilit]
- Dauphin, Y.N.; Fan, A.; Auli, M.; Grangier, D. Language Modeling with Gated Convolutional Networks. arXiv 2016, arXiv:1612.08083. [Google Scholar] [CrossRef] [Scilit]
- Chen, J.; Kao, S.; He, H.; Zhuo, W.; Wen, S.; Lee, C.-H.; Chan, S.-H.G. Run, Don’t Walk: Chasing Higher FLOPS for Faster Neural Networks. arXiv 2023, arXiv:2303.03667. [Google Scholar] [CrossRef] [Scilit]
- Finder, S.E.; Amoyal, R.; Treister, E.; Freifeld, O. Wavelet Convolutions for Large Receptive Fields. arXiv 2024, arXiv:2407.05848. [Google Scholar] [CrossRef] [Scilit]
- Tan, M.; Pang, R.; Le, Q.V. EfficientDet: Scalable and Efficient Object Detection. In Proceedings of the IEEE/CVF Conference on Computer Vision and Pattern Recognition (CVPR), Seattle, WA, USA, 13–19 June 2020; IEEE: New York, NY, USA, 2020; pp. 10781–10790. [Google Scholar] [CrossRef] [Scilit]
- Yang, G.; Lei, J.; Zhu, Z.; Cheng, S.; Feng, Z.; Liang, R. AFPN: Asymptotic Feature Pyramid Network for Object Detection. arXiv 2023, arXiv:2306.15988. [Google Scholar] [CrossRef] [Scilit]
- Yang, L.; Zhang, R.-Y.; Li, L.; Xie, X. SimAM: A Simple, Parameter-Free Attention Module for Convolutional Neural Networks. In Proceedings of the International Conference on Machine Learning (ICML), Virtual, 18–24 July 2021. [Google Scholar]
- Woo, S.; Park, J.; Lee, J.-Y.; Kweon, I. CBAM: Convolutional Block Attention Module. In Proceedings of the European Conference on Computer Vision (ECCV), Munich, Germany, 8–14 September 2018. [Google Scholar]
- Hou, Q.; Zhou, D.; Feng, J. Coordinate Attention for Efficient Mobile Network Design. In Proceedings of the IEEE/CVF Conference on Computer Vision and Pattern Recognition, Nashville, TN, USA, 20–25 June 2021; IEEE: New York, NY, USA, 2021. [Google Scholar]
- Ouyang, D.; He, S.; Zhang, G.; Luo, M.; Guo, H.; Zhan, J.; Huang, Z. Efficient Multi-Scale Attention Module with Cross-Spatial Learning. arXiv 2023, arXiv:2305.13563. [Google Scholar] [CrossRef] [Scilit]
- Chen, L.-C.; Papandreou, G.; Schroff, F.; Adam, H. Rethinking Atrous Convolution for Semantic Image Segmentation. arXiv 2017, arXiv:1706.05587. [Google Scholar] [CrossRef] [Scilit]
- Wang, C.-Y.; Bochkovskiy, A.; Liao, H.-Y.M. YOLOv7: Trainable Bag-of-Freebies Sets New State-of-The-Art for Real-Time Object Detectors. In Proceedings of the IEEE/CVF Conference on Computer Vision and Pattern Recognition (CVPR), Vancouver, BC, Canada, 17–24 June 2023; IEEE: New York, NY, USA, 2023; pp. 7464–7475. [Google Scholar] [CrossRef] [Scilit]
- Yamauchi, T. Spatial Sensitive Grad-CAM++: Improved Visual Explanation for Object Detectors via Weighted Combination of Gradient Map. In Proceedings of the IEEE/CVF Conference on Computer Vision and Pattern Recognition (CVPR) Workshops, Vancouver, BC, Canada, 17–24 June 2023; IEEE: New York, NY, USA, 2023; pp. 3676–3684. [Google Scholar] [CrossRef] [Scilit]

Disclaimer/Publisher’s Note: The statements, opinions and data contained in all publications are solely those of the individual author(s) and contributor(s) and not of MDPI and/or the editor(s). MDPI and/or the editor(s) disclaim responsibility for any injury to people or property resulting from any ideas, methods, instructions or products referred to in the content. |
© 2026 by the authors. Licensee MDPI, Basel, Switzerland. This article is an open access article distributed under the terms and conditions of the Creative Commons Attribution (CC BY) license.