


Abstract
To investigate the thermal environments of three large-span plastic tunnels with different orientations and shapes (two east–west-oriented asymmetrical tunnels, WE15-5 and WE13-7, and one north–south-oriented symmetrical tunnel, NS10-10) under summer high-temperature and winter low-temperature conditions, we continuously monitored the air and soil temperature and conducted a comparative analysis of both under typical weather conditions. Computational fluid dynamics (CFD) simulations were used to further analyze the temperature and airflow fields. The results showed that, in summer, NS10-10 exhibited a superior ventilation and cooling performance with the most uniform temperature distribution, making it more suitable for summer crop cultivation. In winter, WE13-7 demonstrated optimal insulation and heat retention, with the highest minimum air temperatures and best daylighting capacity. CFD model validation showed a good agreement with the measured data (RMSE: 0.73–0.85 °C). These findings provide structural optimization recommendations for large-span plastic tunnels in different seasons.
1. Introduction
Plastic tunnels are widely employed in China because they are inexpensive and easy to construct. Large-span plastic tunnels have become an essential component of modern protected agriculture, playing a crucial role in extending the growing season, improving crop yield and quality, and adapting to regional climate characteristics. However, the thermal environment and airflow dynamics inside large-span plastic tunnels are significantly influenced by their structural parameters (e.g., orientation, geometric shape, ventilation configuration), and an unreasonable structural design often leads to problems such as poor heat preservation in winter, excessive heat accumulation in summer, and an uneven microclimate distribution, which restrict the efficient utilization of such facilities. It is difficult to control the internal environment in tunnels built using traditional designs [1,2], and their limited space and low land utilization have constrained their efficiency [3,4,5,6]. In recent years, these limitations have driven the rapid development of large-span plastic tunnels. For example, the large-span design developed by Zhou et al. [7], covering an area of 1200 square meters, achieves a land utilization rate of 90%. This approach successfully addresses the low land-use efficiency of small plastic tunnels, thus offering significant potential for wider application. Studies have shown that the orientation of the lighting surface in plastic tunnels directly impacts their light-receiving capacity, consequently influencing internal environmental factors. Typically, east–west plastic tunnels provide more light than north–south ones [8,9]. For east–west plastic tunnels, the shape of the lighting surface, specifically the roof angle of lighting, significantly influences the internal environment because this angle plays a decisive role in greenhouse day lighting. Within a certain range, a larger roof angle of lighting can increase both the intensity and stability of the internal thermal environment by allowing more solar radiation to enter. Therefore, an optimally designed roof angle of lighting is essential for maximizing a tunnel’s overall light availability and thermal insulation capacity [10,11,12,13]. Wu et al. designed several sets of large-span asymmetric tunnels [6], among which the 18-2 model demonstrated an optimal lighting and thermal insulation performance, characterized by the highest light transmittance and the most uniform distribution of temperature and light.
CFD offers an efficient and reliable method for simulating a greenhouse microclimate; it can accurately reproduce the spatial and temporal distribution of temperature, humidity, and airflow inside facilities [14,15]. Despite the extensive application of large-span plastic tunnels in agricultural production, most studies have focused on small-/medium-span plastic tunnels, lack a systematic comparative analysis of structures with different orientations (north–south vs. east–west) and geometric shapes (symmetrical vs. asymmetrical), and rarely integrate field monitoring with computational fluid dynamics (CFD) simulations to comprehensively evaluate the coupling relationship between the tunnel structure and thermal environment/airflow dynamics. Moreover, the application of CFD in large-span plastic tunnel research lacks sufficient discussion on its inherent assumptions and limitations, which affects the reliability and interpretability of the simulation results. Over the past two decades, research has increasingly focused on the distribution of indoor airflow fields in ventilation processes; for example, Haxaire et al. [16] established a CFD model of a greenhouse, precisely illustrating the influence of a sunshade net on the internal environment with a varied model. Brugger et al. [17] simulated the internal environment of a greenhouse under different wind speed conditions. Shen et al. [18] conducted a three-dimensional simulation of the internal flow field in a greenhouse with different wind directions. With the development of CFD technology, more detailed studies have been performed on air thermal buoyancy, convection coupling, and radiation exchange between greenhouse covers and roofs [19,20,21]. Cheng et al. [22,23] studied the internal environment of a Venlo glass greenhouse with or without crops.
To fill this research gap, this study innovatively conducted a systematic comparative analysis of the thermal environment characteristics of three large-span plastic tunnels with different orientations and symmetry (two east–west-oriented asymmetrical tunnels: WE15-5, WE13-7; one north–south-oriented symmetrical tunnel: NS10-10) under extreme summer and winter conditions, integrating field monitoring and CFD simulations to clarify the mechanism by which structural parameters affect the internal thermal environment. The novelties of this study are: (1) a systematic comparison of the thermal environment parameters among three large-span plastic tunnels with different structures under both summer and winter conditions; (2) validation of CFD models using field-monitoring data to clarify the coupling relationship between the tunnel structure and the thermal environment and airflow dynamics; and (3) the provision of targeted technical recommendations for the design and optimization of large-span plastic tunnels in different seasons.
2. Materials and Methods
2.1. Test Plastic Tunnels
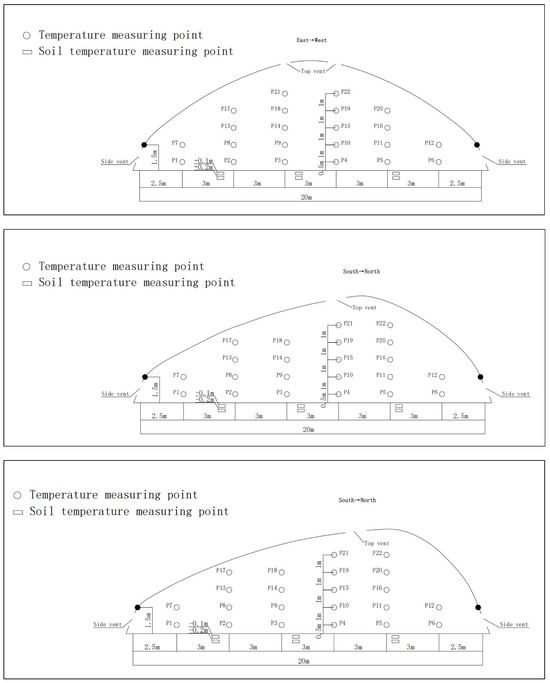
Three experimental long-span plastic tunnels were designed and constructed at Anxin Agricultural Technology Co., Ltd. (36.53° N, 117.48° E), Laiwu, Shandong Province, China: two east–west-oriented tunnels (WE13-7 and WE15-5) and one north–south-oriented tunnel (NS10-10) (Figure 1). The specific structural parameters are shown in Table 1. All tunnels featured a single-layer 0.1 mm polyolefin (PO) film covering and a hot-dip galvanized steel frame. Ventilation was provided by side vents (located 50 cm above the base along the truss, with a 60 cm opening) and top vents (located 1.5 m below the ridge on the southern roof along the truss, with a 120 cm opening). During the entire experimental period (5 January 2019 to 2 July 2019), all three plastic tunnels were kept uncultivated (bare soil) to avoid the interference of crop growth on the internal thermal environment. External insulation quilts were employed in winter and rolled up from 8:30 to 16:30 daily; in summer, side vents and top vents were fully opened from 8:30 to 18:00 daily for natural ventilation.
Figure 1.
The three plastic tunnels with different structures and arrangement of the sensor observation points in the plastic tunnels.
Table 1.
Structural parameters of the plastic tunnels with different orientations and structures.
2.2. Measurement Methods
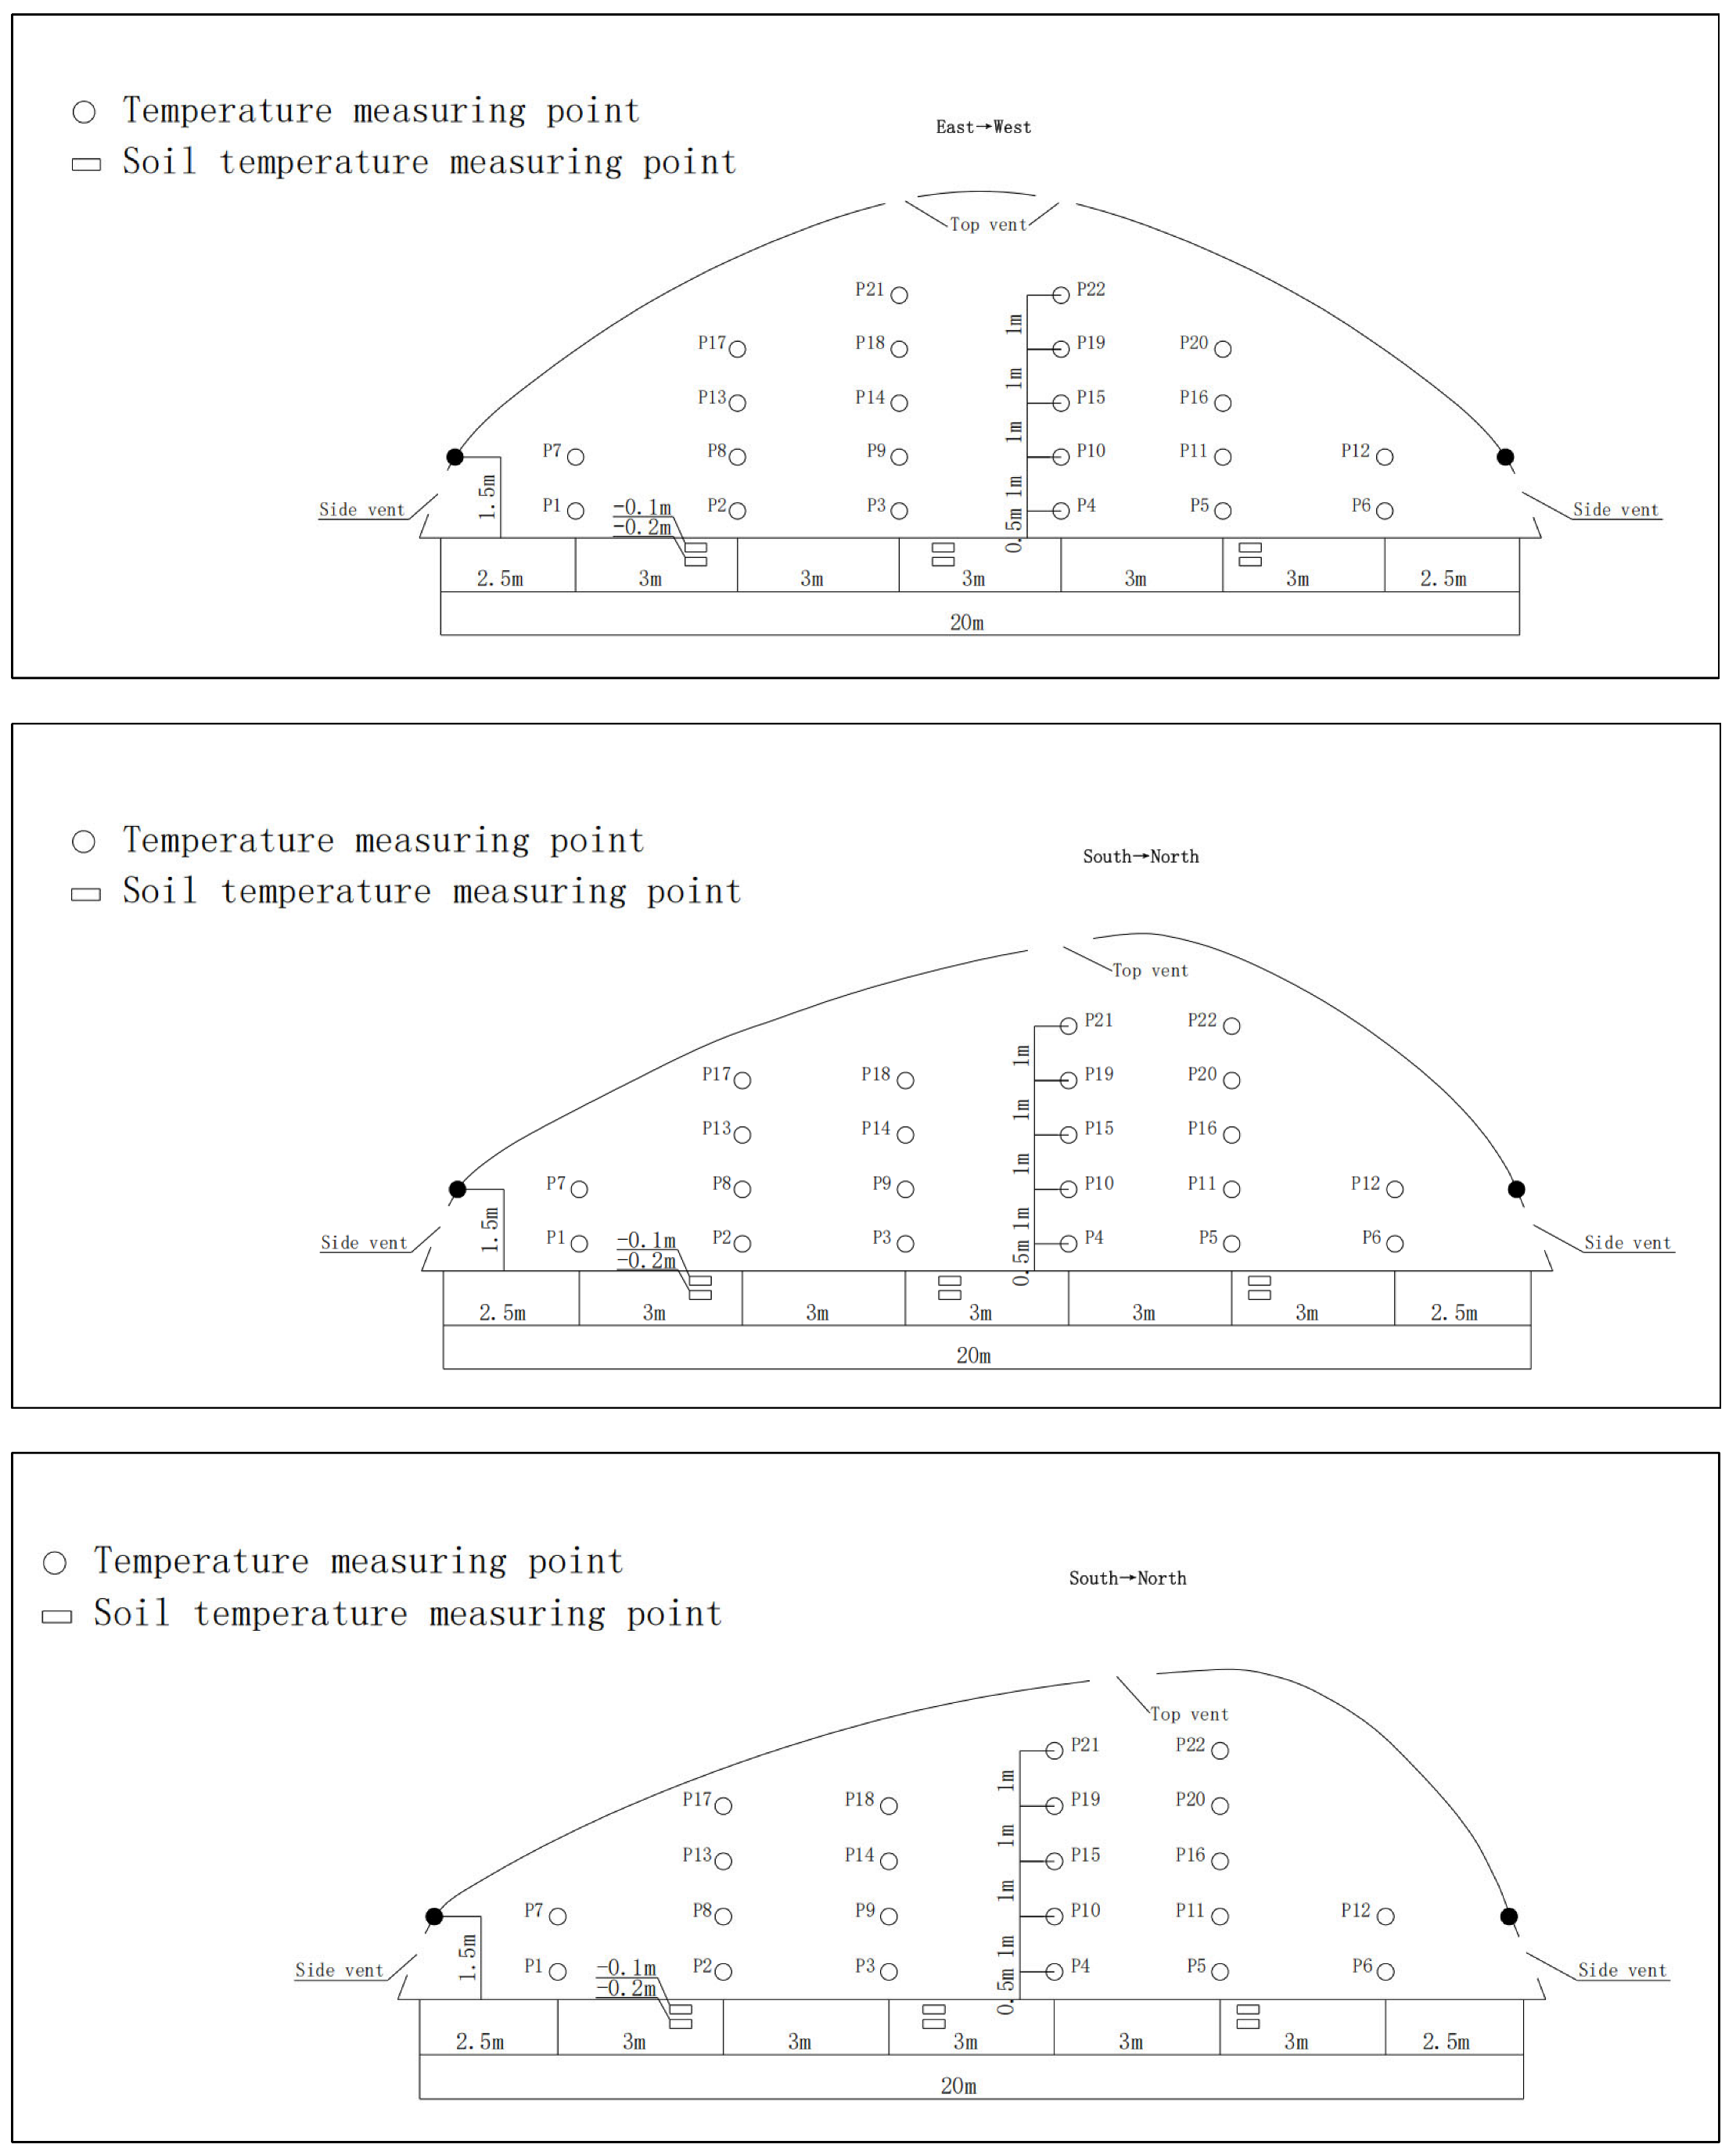
The observation points were arranged in a grid pattern for all three tunnels. Six locations were spaced out at 2.5 m intervals in the span direction (north–south for WE13-7 and WE15-5, east–west for NS10-10), and measurements were taken at five heights at each location: 1.5 m, 2.5 m, 3.5 m, and 4.5 m. The specific layout is shown in Figure 2. The environmental parameters were monitored as follows: the indoor and outdoor temperature and humidity were measured with HOBO U23-001 data loggers (Onset Computer Corporation, Bourne, MA, USA); the outdoor wind speed and direction were measured with Luger L99-FSFX anemometers (Hangzhou luge Technology Co., Ltd., Hangzhou, China); the solar radiation and light intensity were measured with TR-74UI sensors (TANDD Tiante Co., Ltd., Gifu, Japan); and the surface temperature (both ground and film) was measured with a Luge L93-4 probe recorder (Hangzhou luge Technology Co., Ltd., Hangzhou, China). All instruments recorded data at 10 min intervals. The soil temperature was measured at depths of 10 cm and 20 cm, with sensors placed at three locations (5 m, 10 m, and 15 m) along the span of the tunnel. Based on the size of the vents and the measured wind speed, the natural ventilation rates of the three tunnels were calculated as follows: NS10-10: 0.82 m3·s−1, WE13-7: 0.78 m3·s−1, and WE15-5: 0.79 m3·s−1. For the numerical models, a reference meteorological station was established 15 m northwest of the tunnel, recording the wind direction, wind speed, and outdoor temperature.
Figure 2.
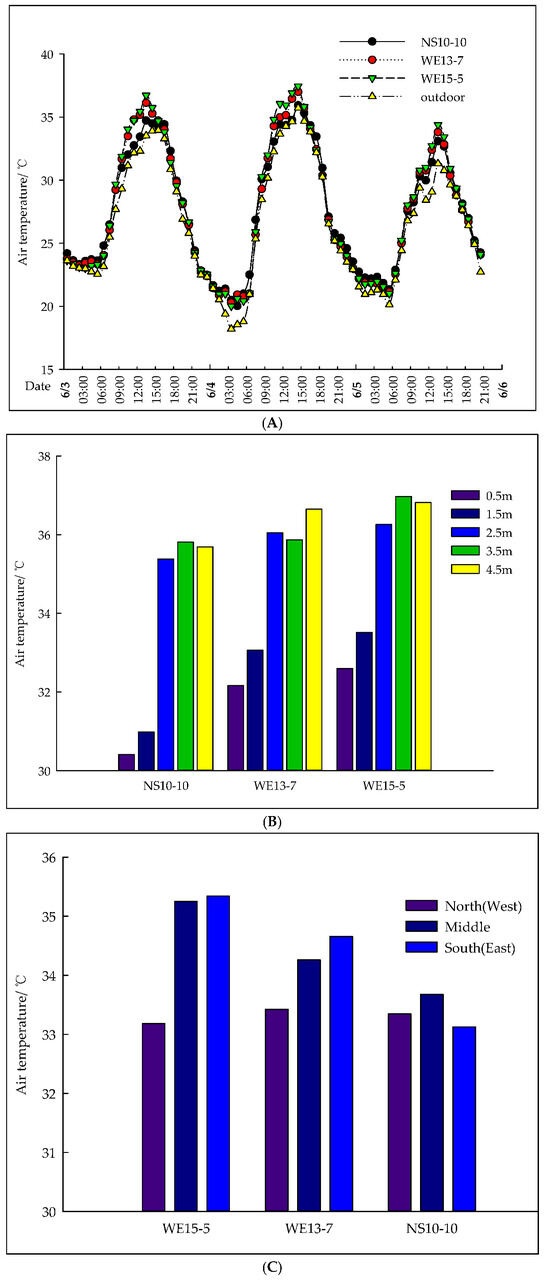
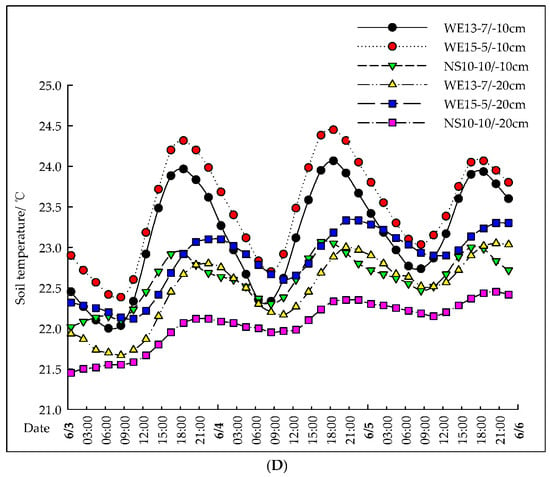
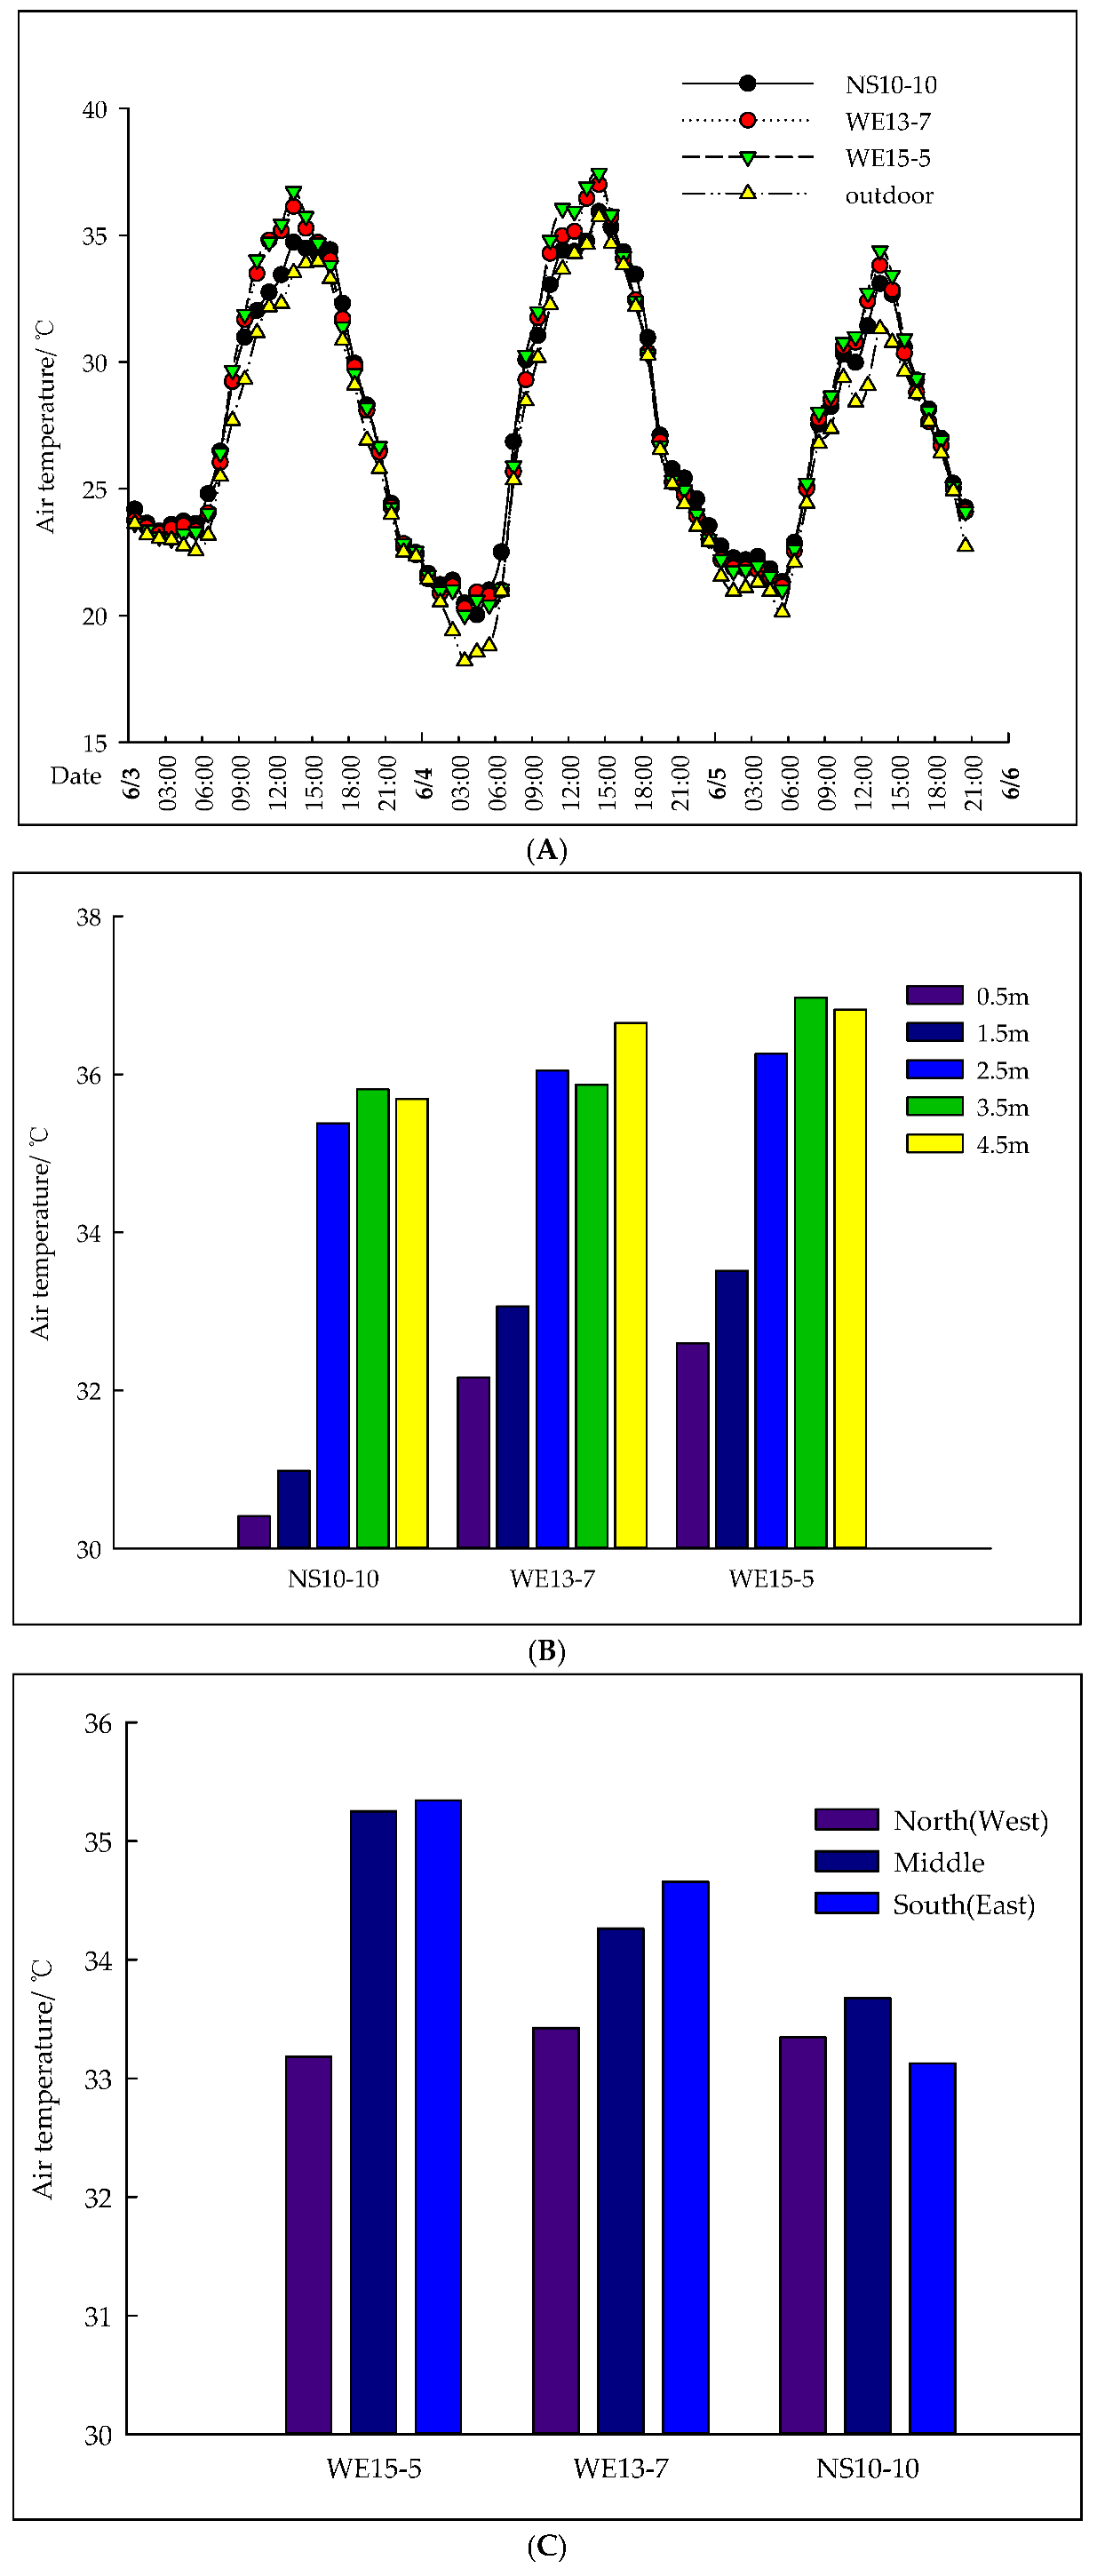
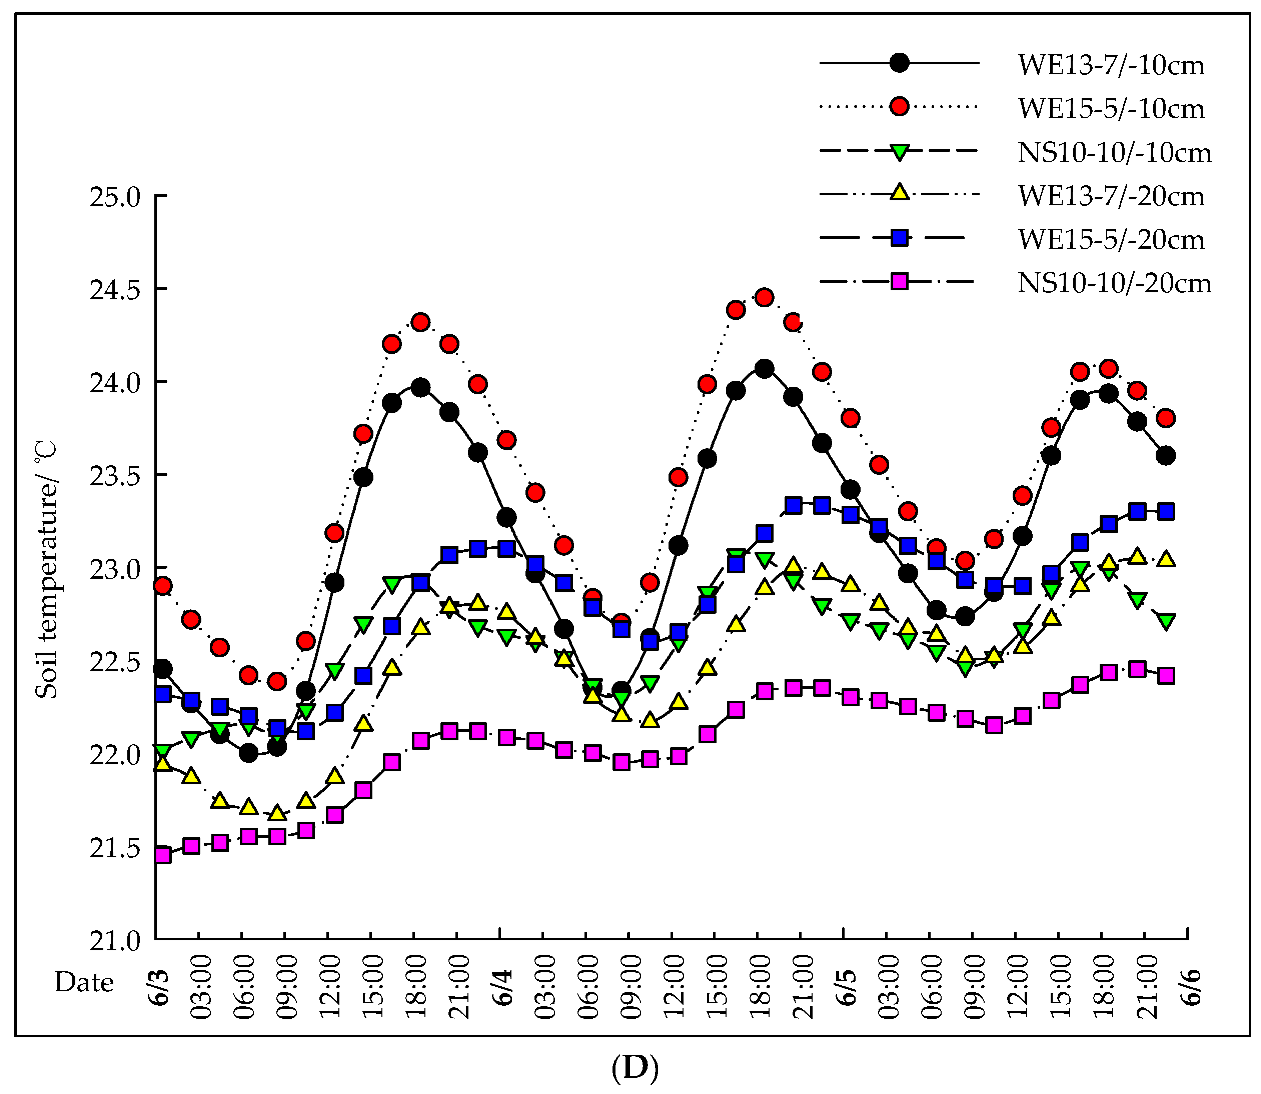
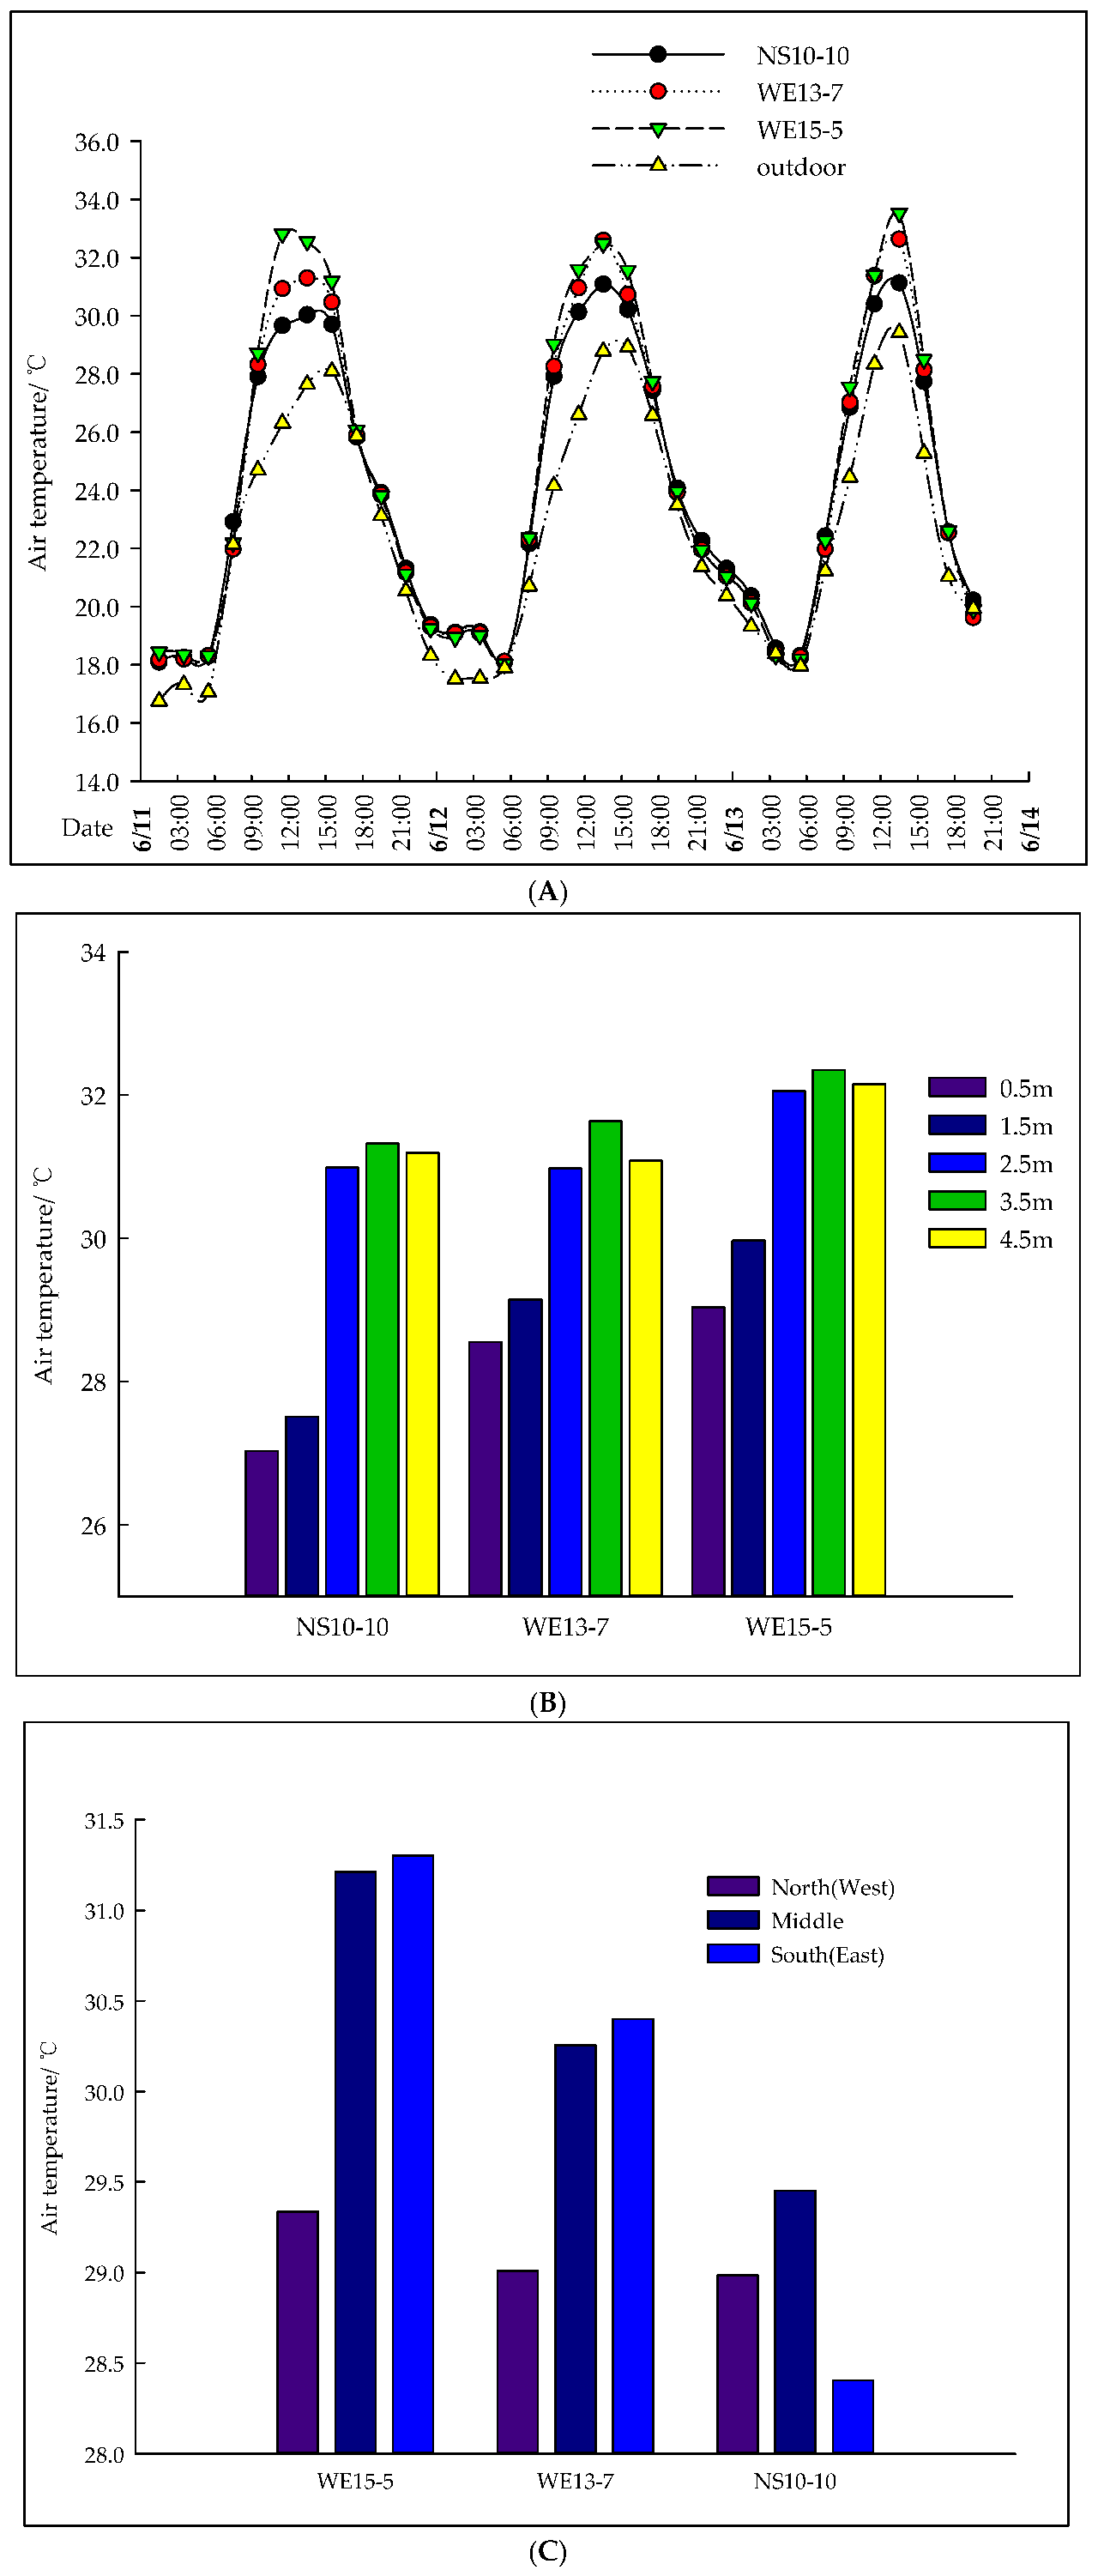
Curves of the variation in the air and soil temperature in the plastic tunnels under typical sunny conditions in summer (average external solar radiation: 801 W·m−2, peak value: 1020 W·m−2 at 12:00–13:00). (A). Curves of the change in the air temperature in the plastic tunnels on typical sunny days in the summer. (B). Comparison of the vertical air temperature for the plastic tunnels on typical sunny days in the summer (average temperature from 8:00 to 16:00 on 4 June). (C). Comparison of the average air temperature across the entire span of the plastic tunnels on typical sunny days in the summer. (D). Curves of the change in the soil temperature in the plastic tunnels on typical sunny days in the summer.
2.3. Numerical Simulation Method
2.3.1. Geometric Model Construction and Mesh Generation
The three-dimensional geometry of the plastic tunnels was created at a 1:1 scale using the CATIA software (V5R20); structural details are provided in Table 1. A Cartesian coordinate system was defined, aligning the positive Z-axis with east, the positive X-axis with north, and the positive Y-axis with the vertical direction. To accurately simulate the natural ventilation microclimate, we ensured that the computational domain encompassed both the inside of the tunnel and a substantial external region. The dimensions of the external domain were set to 120 m (length) × 100 m (width) × 40 m (height), satisfying established guidelines for windward (6H), leeward (15H), and vertical (9H) extents relative to the tunnel ridge height. The final mesh consisted of approximately 1.2 million cells for WE13-7 (800,000 internal) and 1.16 million cells for WE15-5 (770,000 internal).
A mesh independence test was conducted by comparing the simulated temperature of 3 mesh schemes (0.8 million, 1.2 million, and 1.6 million cells). The results showed that the relative deviation in the simulated temperature between the 1.2 million and 1.6 million cell schemes was less than 0.5%, indicating that the 1.2 million cell scheme can meet the calculation accuracy requirements while ensuring computational efficiency.
2.3.2. Governing Equations, Turbulence Model and Boundary
We simulated airflow and heat transfer inside and outside the plastic tunnel by solving the three fundamental conservation equations (mass, momentum, and energy). Given the turbulent nature of the flow, the standard k-ε model was applied for turbulence closure, with the near-wall treatment using standard wall functions. Buoyancy effects were included via the Boussinesq approximation. The dominant heat source, solar radiation, was modeled using the solar ray tracing method with the DO radiation model, using the local latitude and longitude for accurate solar loading.
The boundary conditions for the computational domain (encompassing both the tunnel’s interior and the external region) were defined as follows: the windward surface was set as a velocity inlet with measured wind speed; the opposite surface was set as a pressure outlet; the side and bottom surfaces were set as convective walls; and the top surface was set symmetrically. The tunnel cover and the ground were also set as convective walls, while the vents were treated as internal boundaries. Heat transfer through these surfaces involved both convection and radiation.
The boundary parameters of the NS greenhouse were different from those of the WE greenhouses, mainly due to the difference in orientation: (1) Solar radiation: The WE greenhouses received more solar radiation, leading to higher outdoor/indoor ground temperatures and cover temperatures. (2) Wind speed: The NS greenhouse had less wind resistance under westerly wind, resulting in a slightly lower average outdoor wind speed (0.7 m·s−1) compared to the WE greenhouses (0.8 m·s−1) (Table 2).
Table 2.
Boundary parameters of different plastic tunnels.
2.4. Data Processing and Statistical Analysis
All the data were processed using Microsoft 365 and JASP (version 0.18.1, JASP Team, University of Amsterdam, Amsterdam, The Netherlands). Normality was tested using the Shapiro–Wilk test, and homogeneity of variances was tested using Levene’s test. A one-way analysis of variance (ANOVA) followed by Tukey’s HSD post hoc test was used to compare the mean air temperatures, soil temperatures, and other environmental parameters among the three tunnel types. Statistical significance was set at p < 0.05. All values are presented as the mean ± standard deviation (SD). For CFD model validation, the root mean square error (RMSE) and mean absolute deviation were calculated.
3. Results and Discussion
3.1. Typical Sunny Days in Summer
To assess the thermal performance under high outdoor temperatures, data from three consecutive sunny days were used (3–5 June; maximum outdoor temperature, 31.0 °C; average outdoor wind speed, 0.7–0.8 m·s−1; westerly wind). Under typical summer sunny conditions, the daily average air temperature of the three tunnels was significantly different (p < 0.05), with the ranking of WE15-5 > WE13-7 > NS10-10. NS10-10 peaked between 12:00 and 13:00, while WE15-5 and WE13-7 peaked between 13:00 and 14:00. WE15-5 and WE13-7 averaged 36.3 °C and 35.7 °C, 2.5 °C and 1.9 °C above the ambient temperature, respectively, while NS10-10 averaged 34.4 °C, only 0.6 °C above the ambient temperature (Figure 2A). The temperatures at the 0.5 m height were lowest in NS10-10 (30.7 °C), followed by WE13-7 (32.6 °C) and WE15-5 (33.1 °C) (Figure 2B). The WE15-5 and WE13-7 showed the highest temperatures in the south, followed by the center, and the lowest in the north, north–south differences of 2.2 °C and 1.2 °C, respectively. In contrast, NS10-10 exhibited a more uniform horizontal distribution (with an east–center–west difference of 0.5 °C), with its highest temperature still being lower than the highest temperatures in the east–west tunnels (Figure 2C). Under summer conditions, all tunnels were uncultivated (bare soil), and NS10-10 also maintained the lowest soil temperatures at depths of both 10 cm (22.6 °C) and 20 cm (22.1 °C), followed by WE13-7 (23.2 °C, 22.4 °C) and WE15-5 (23.5 °C, 22.9 °C), indicating that NS10-10’s ventilation and cooling design was the most effective at mitigating heat accumulation in the soil. For comparison, the average outdoor soil temperatures (15 m away from the tunnels) at 10 cm and 20 cm depths were 28.5 °C and 27.8 °C, respectively, which were significantly higher than the soil temperatures inside all the tunnels, indicating that the tunnel structure can effectively reduce soil heat accumulation (Figure 2D).
3.2. Typical Cloudy Days in Summer
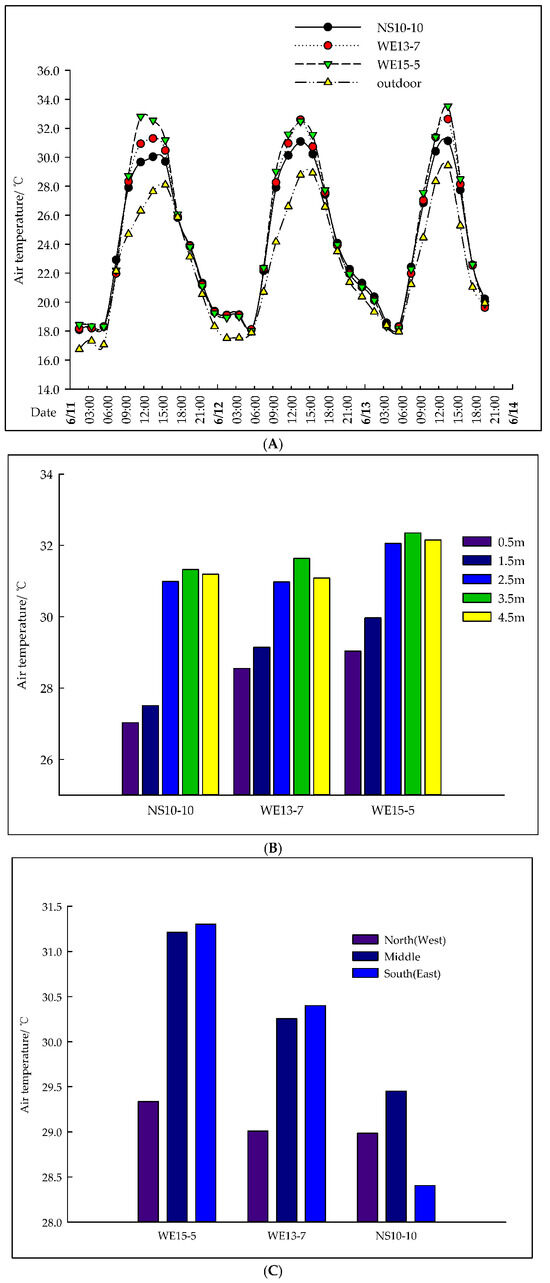
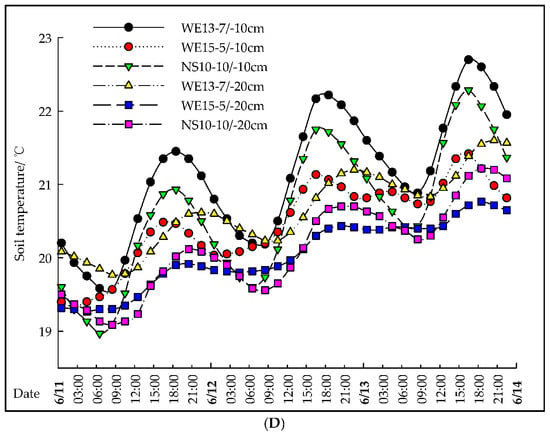
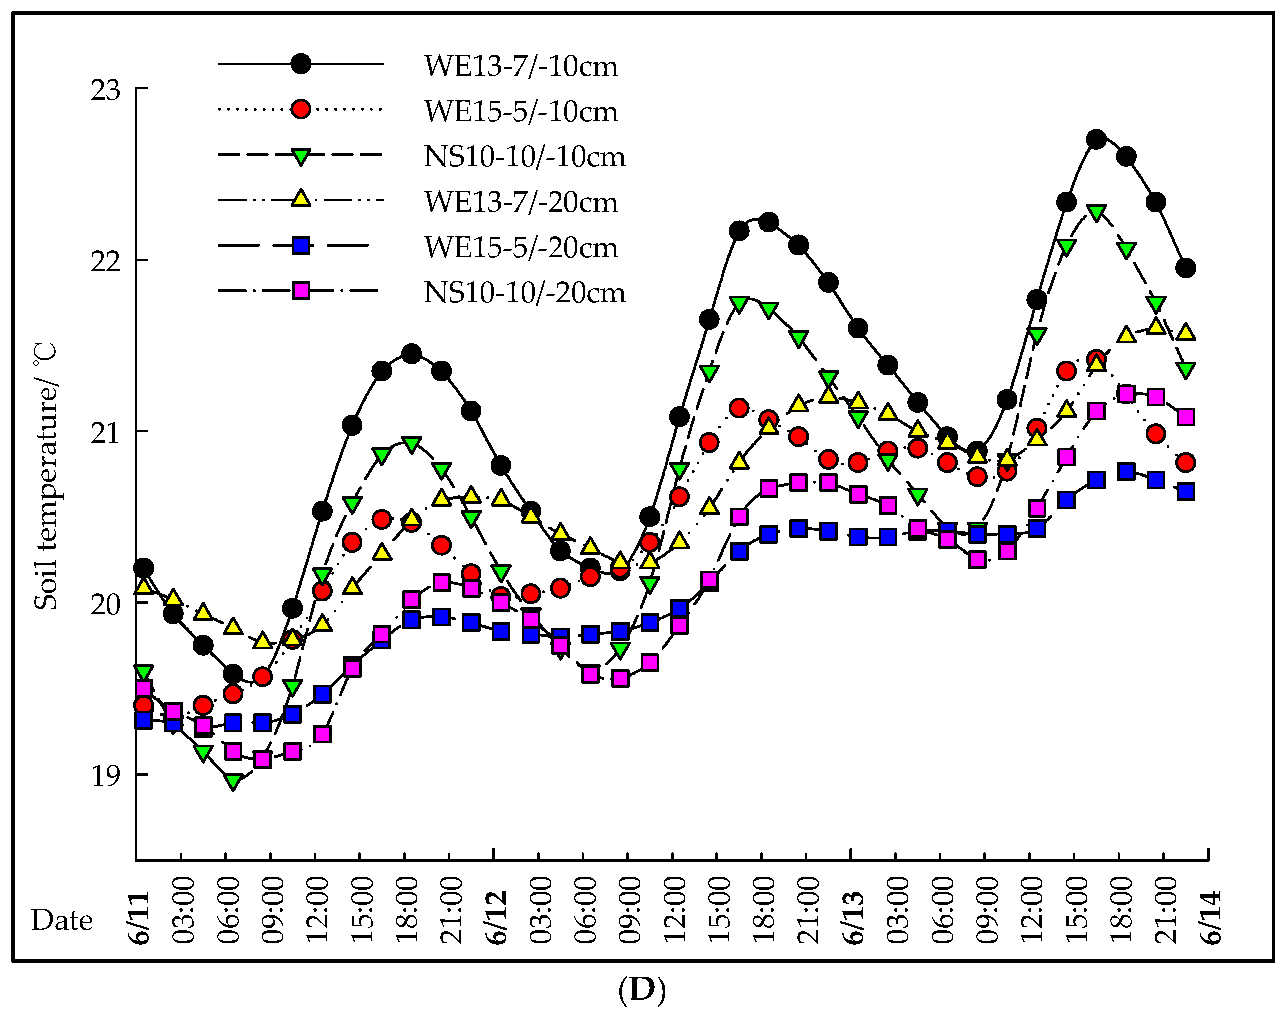
To characterize the thermal environment under typical cloudy conditions in the summer, data from three consecutive cloudy days (11–13 June; average outdoor temperature, 28.6 °C; average outdoor wind speed, 0.7–0.8 m·s−1; westerly wind) were analyzed. Despite the reduction in direct solar radiation, the internal temperatures of the tunnels increased via absorption of scattered radiation. Also, the daily average air temperature of the three tunnels was significantly different (p < 0.05), with the ranking of WE15-5 > WE13-7 > NS10-10. The peak temperatures occurred almost simultaneously, with WE15-5 being the highest (33.2 °C, 4.6 °C above the ambient temperature), followed by WE13-7 (32.2 °C, +3.6 °C) and NS10-10 (30.8 °C, +2.2 °C) (Figure 3A). All tunnels shared a similar vertical trend—the crop canopy layer was cooler than regions at 2.5 m and above, with the high-temperature zone concentrated around 3.5 m (Figure 3B). NS10-10 was warmest in the center, followed by the east and west in descending order. In contrast, WE13-7 and WE15-5 were warmest in the south, followed by the center and the north in descending order. The average spanwise temperature difference was smallest in NS10-10 (0.7 °C), indicating the best horizontal uniformity, while WE13-7 and WE15-5 showed larger differences of 0.9 °C and 1.3 °C, respectively (Figure 3C). At depths of both 10 cm and 20 cm, WE13-7 maintained the highest temperatures (22.7 °C and 21.6 °C, respectively), followed by NS10-10 (22.3 °C and 21.2 °C), with WE15-5 being the coolest (21.4 °C and 20.8 °C). For comparison, the average outdoor soil temperatures (15 m away from the tunnels) at the 10 cm and 20 cm depths were 26.3 °C and 25.7 °C, respectively, which were higher than the soil temperatures inside all the tunnels. The reason for the larger indoor–outdoor temperature increase on cloudy days than on sunny days is that, on sunny days, the higher outdoor temperature (31.0 °C) and stronger solar radiation (average 801 W·m−2) reduced the indoor–outdoor temperature difference and enhanced natural ventilation, thereby inhibiting an indoor temperature rise; on cloudy days, the lower outdoor temperature (28.6 °C) and weaker solar radiation (average 450 W·m−2) increased the indoor–outdoor temperature difference and weakened ventilation, leading to a larger indoor temperature increase (Figure 3D).
Figure 3.
Curves of the variation in the air and soil temperature in the plastic tunnels under typical cloudy conditions in summer. (A). Curves of the change in the air temperature in the plastic tunnels on typical cloudy days in the summer. (B). Comparison of the vertical air temperature for the plastic tunnels on typical cloudy days in the summer. (C). Comparison of the average air temperature across the entire span of the plastic tunnels on typical cloudy days in the summer. (D). Curve of the change in the soil temperature in the plastic tunnels on typical cloudy days in the summer.
3.3. Typical Sunny Days in Winter
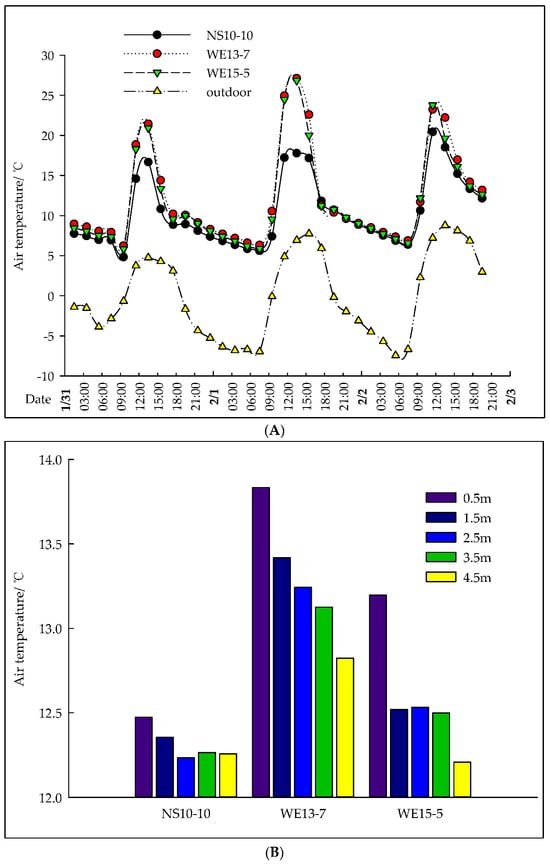
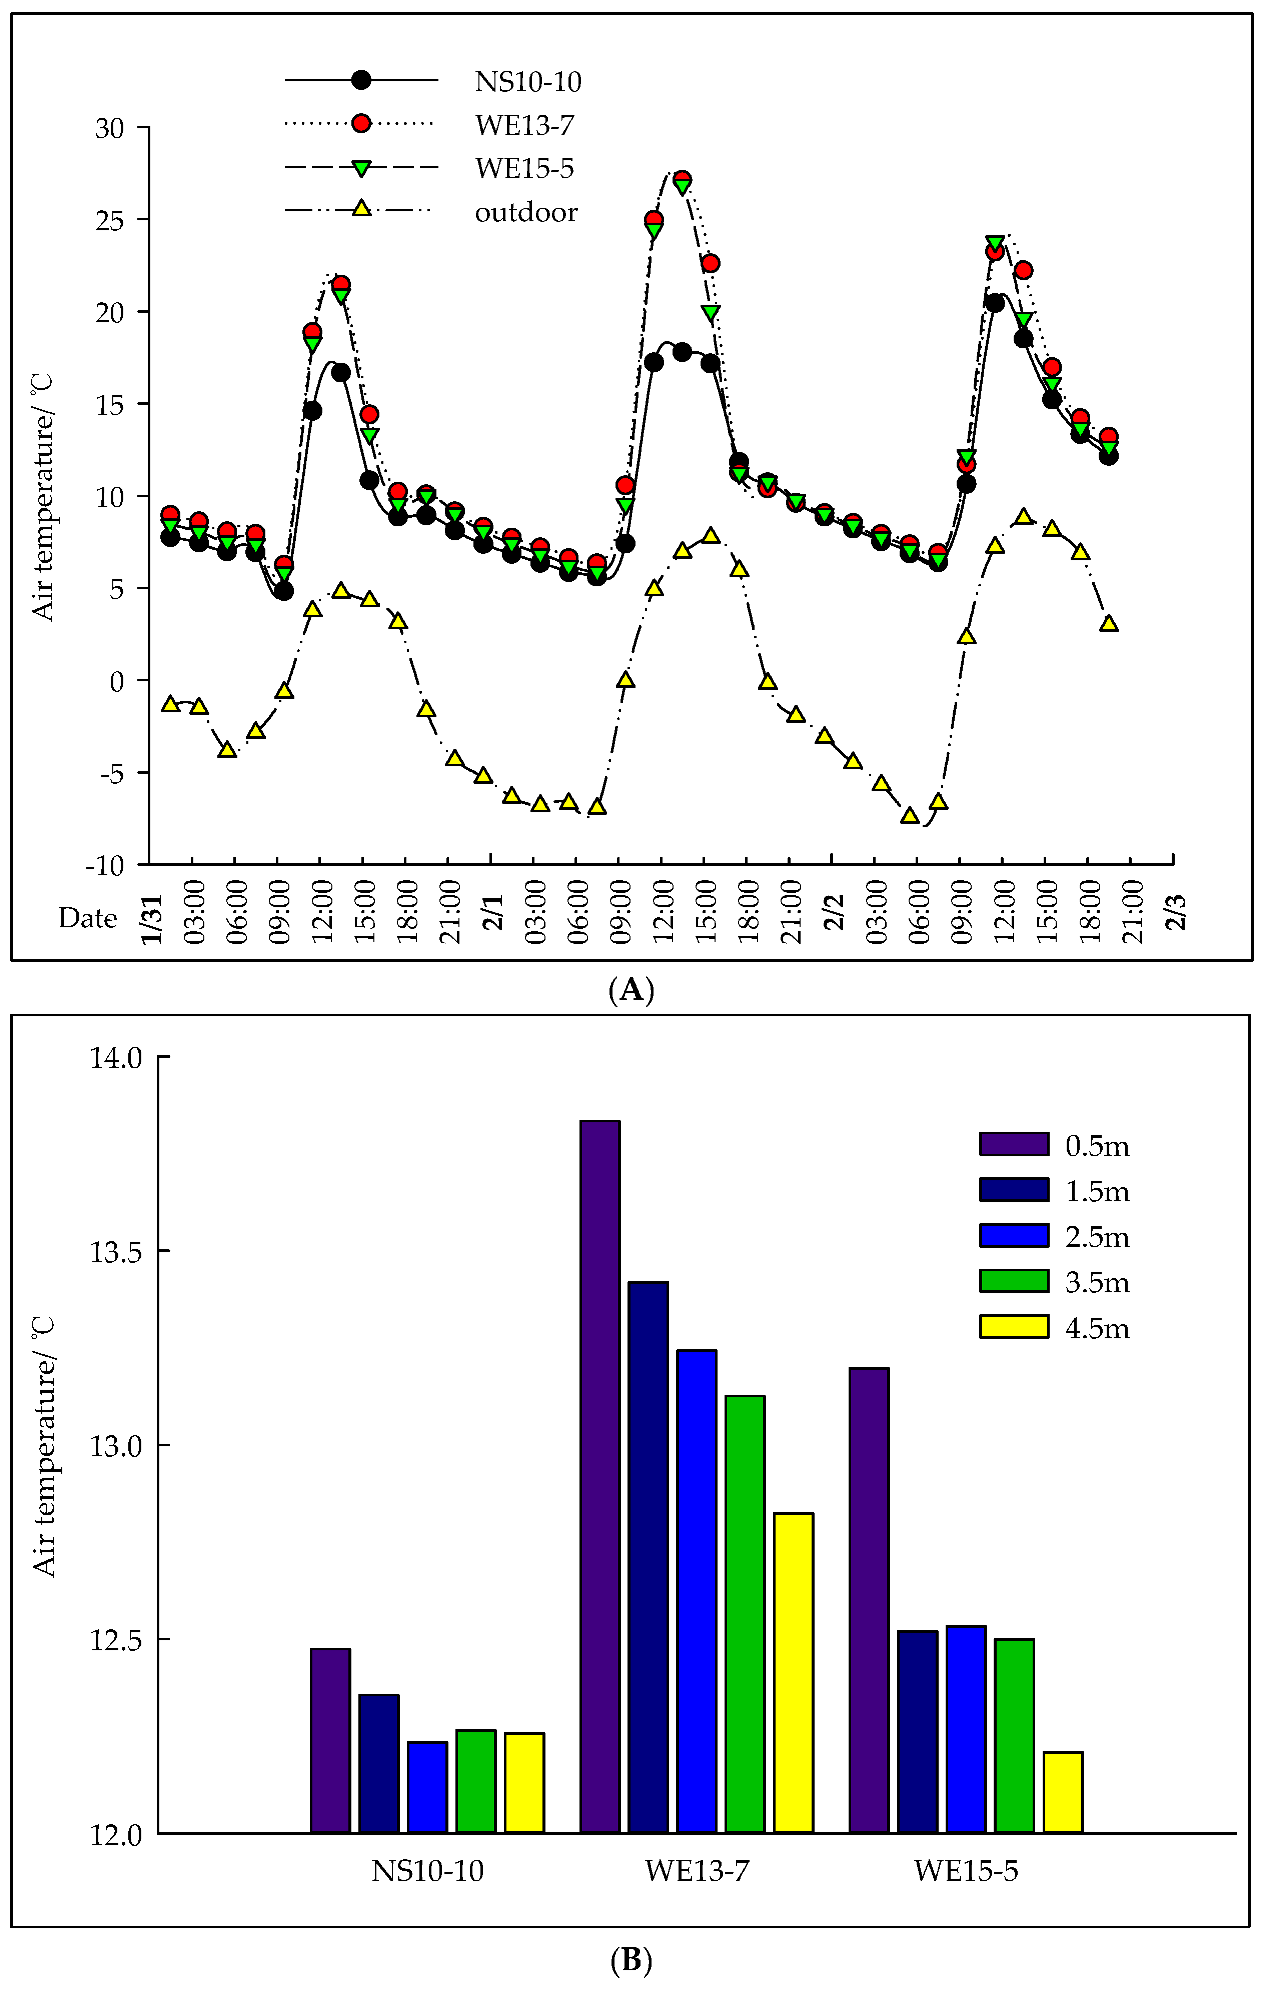
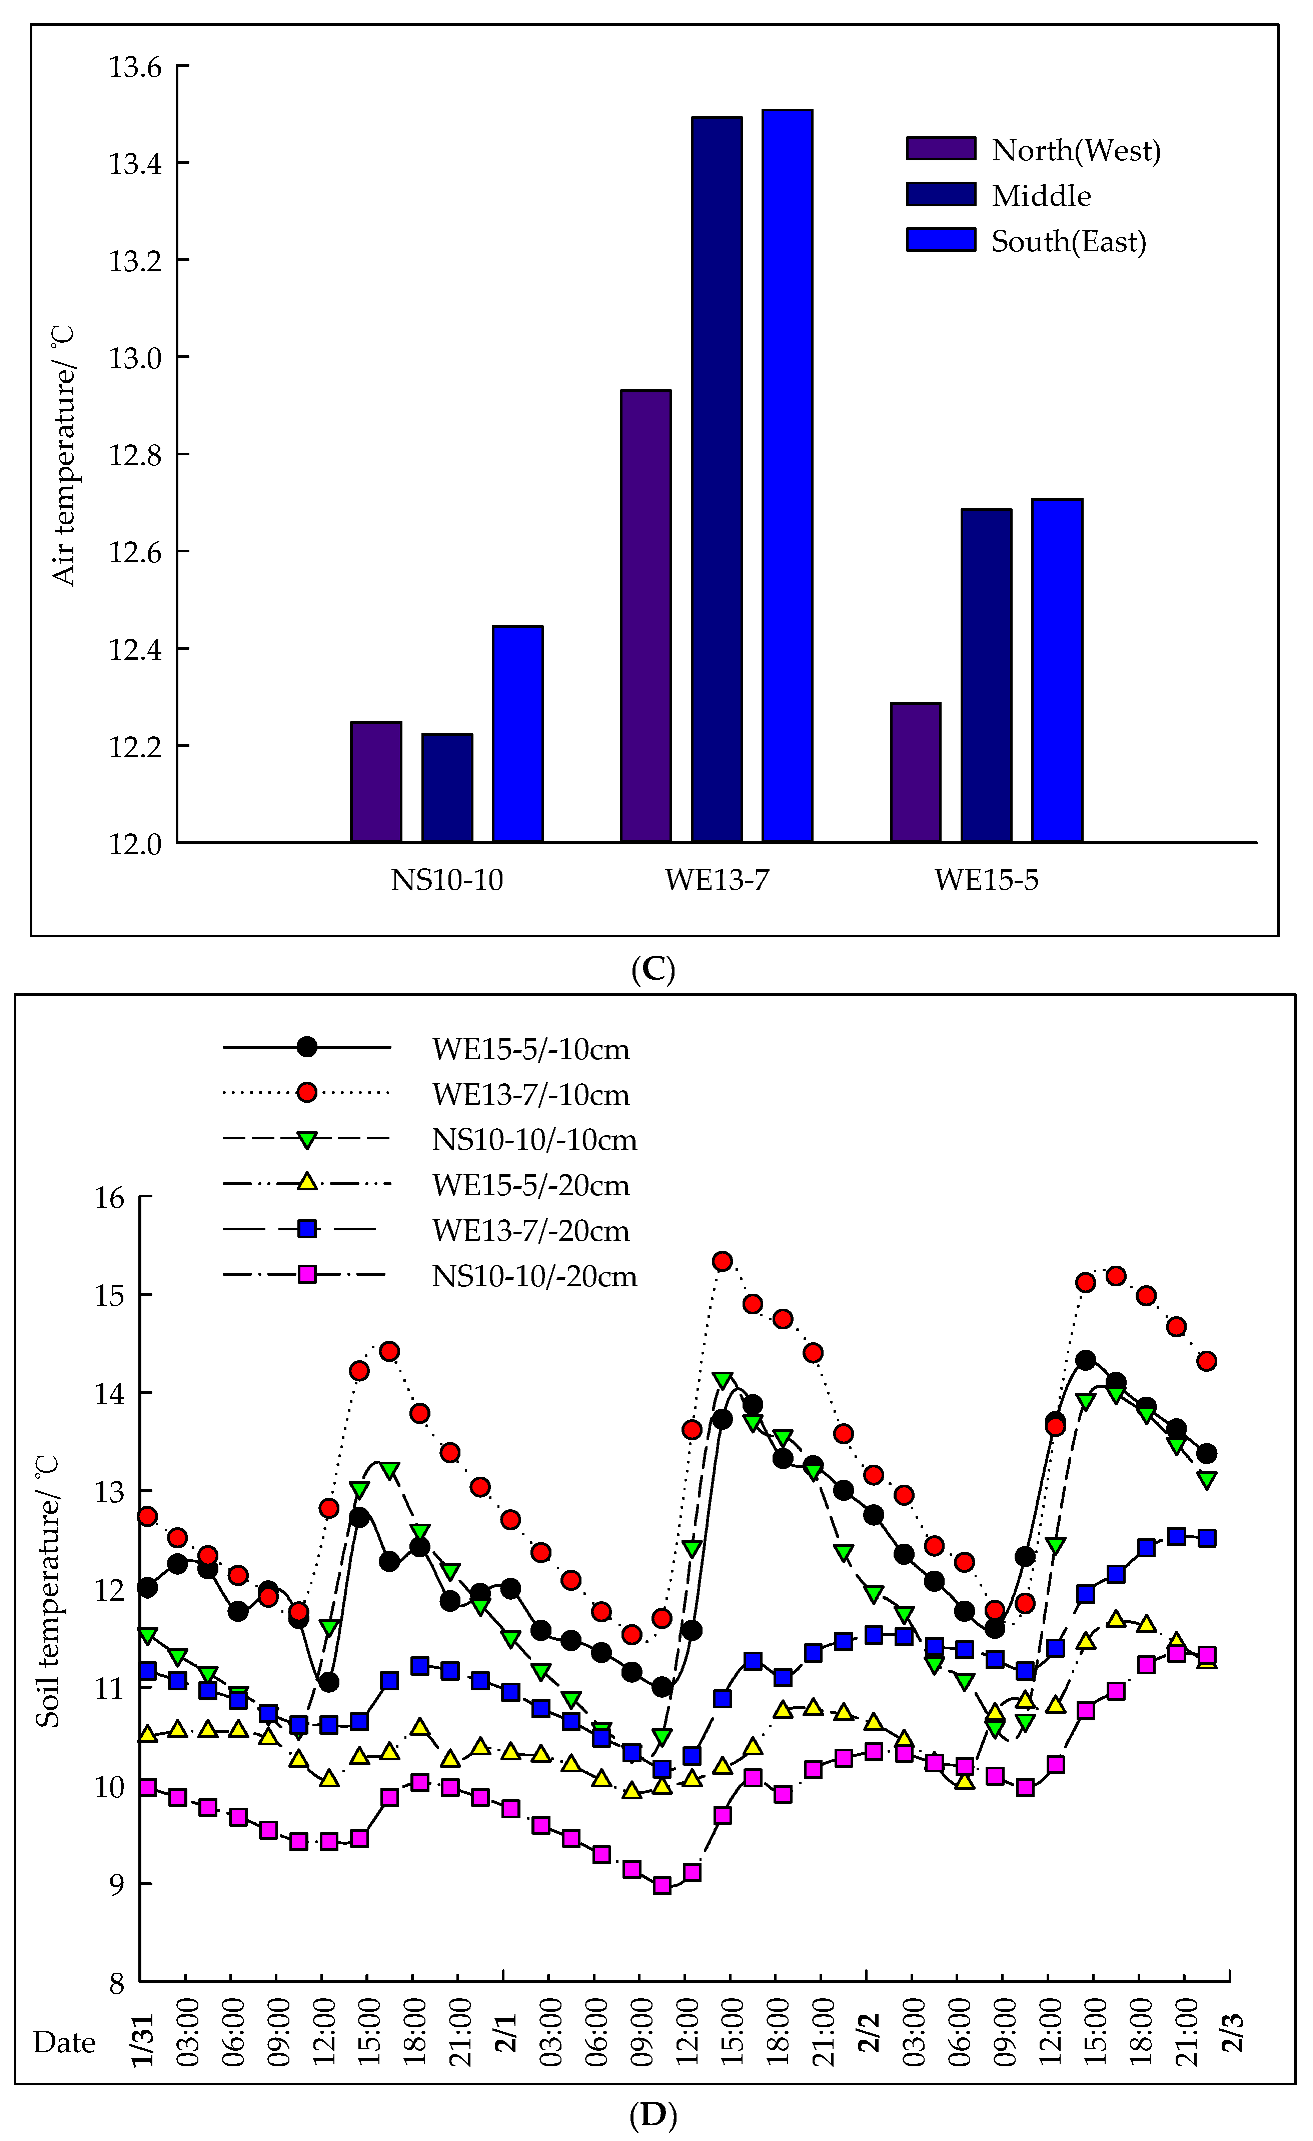
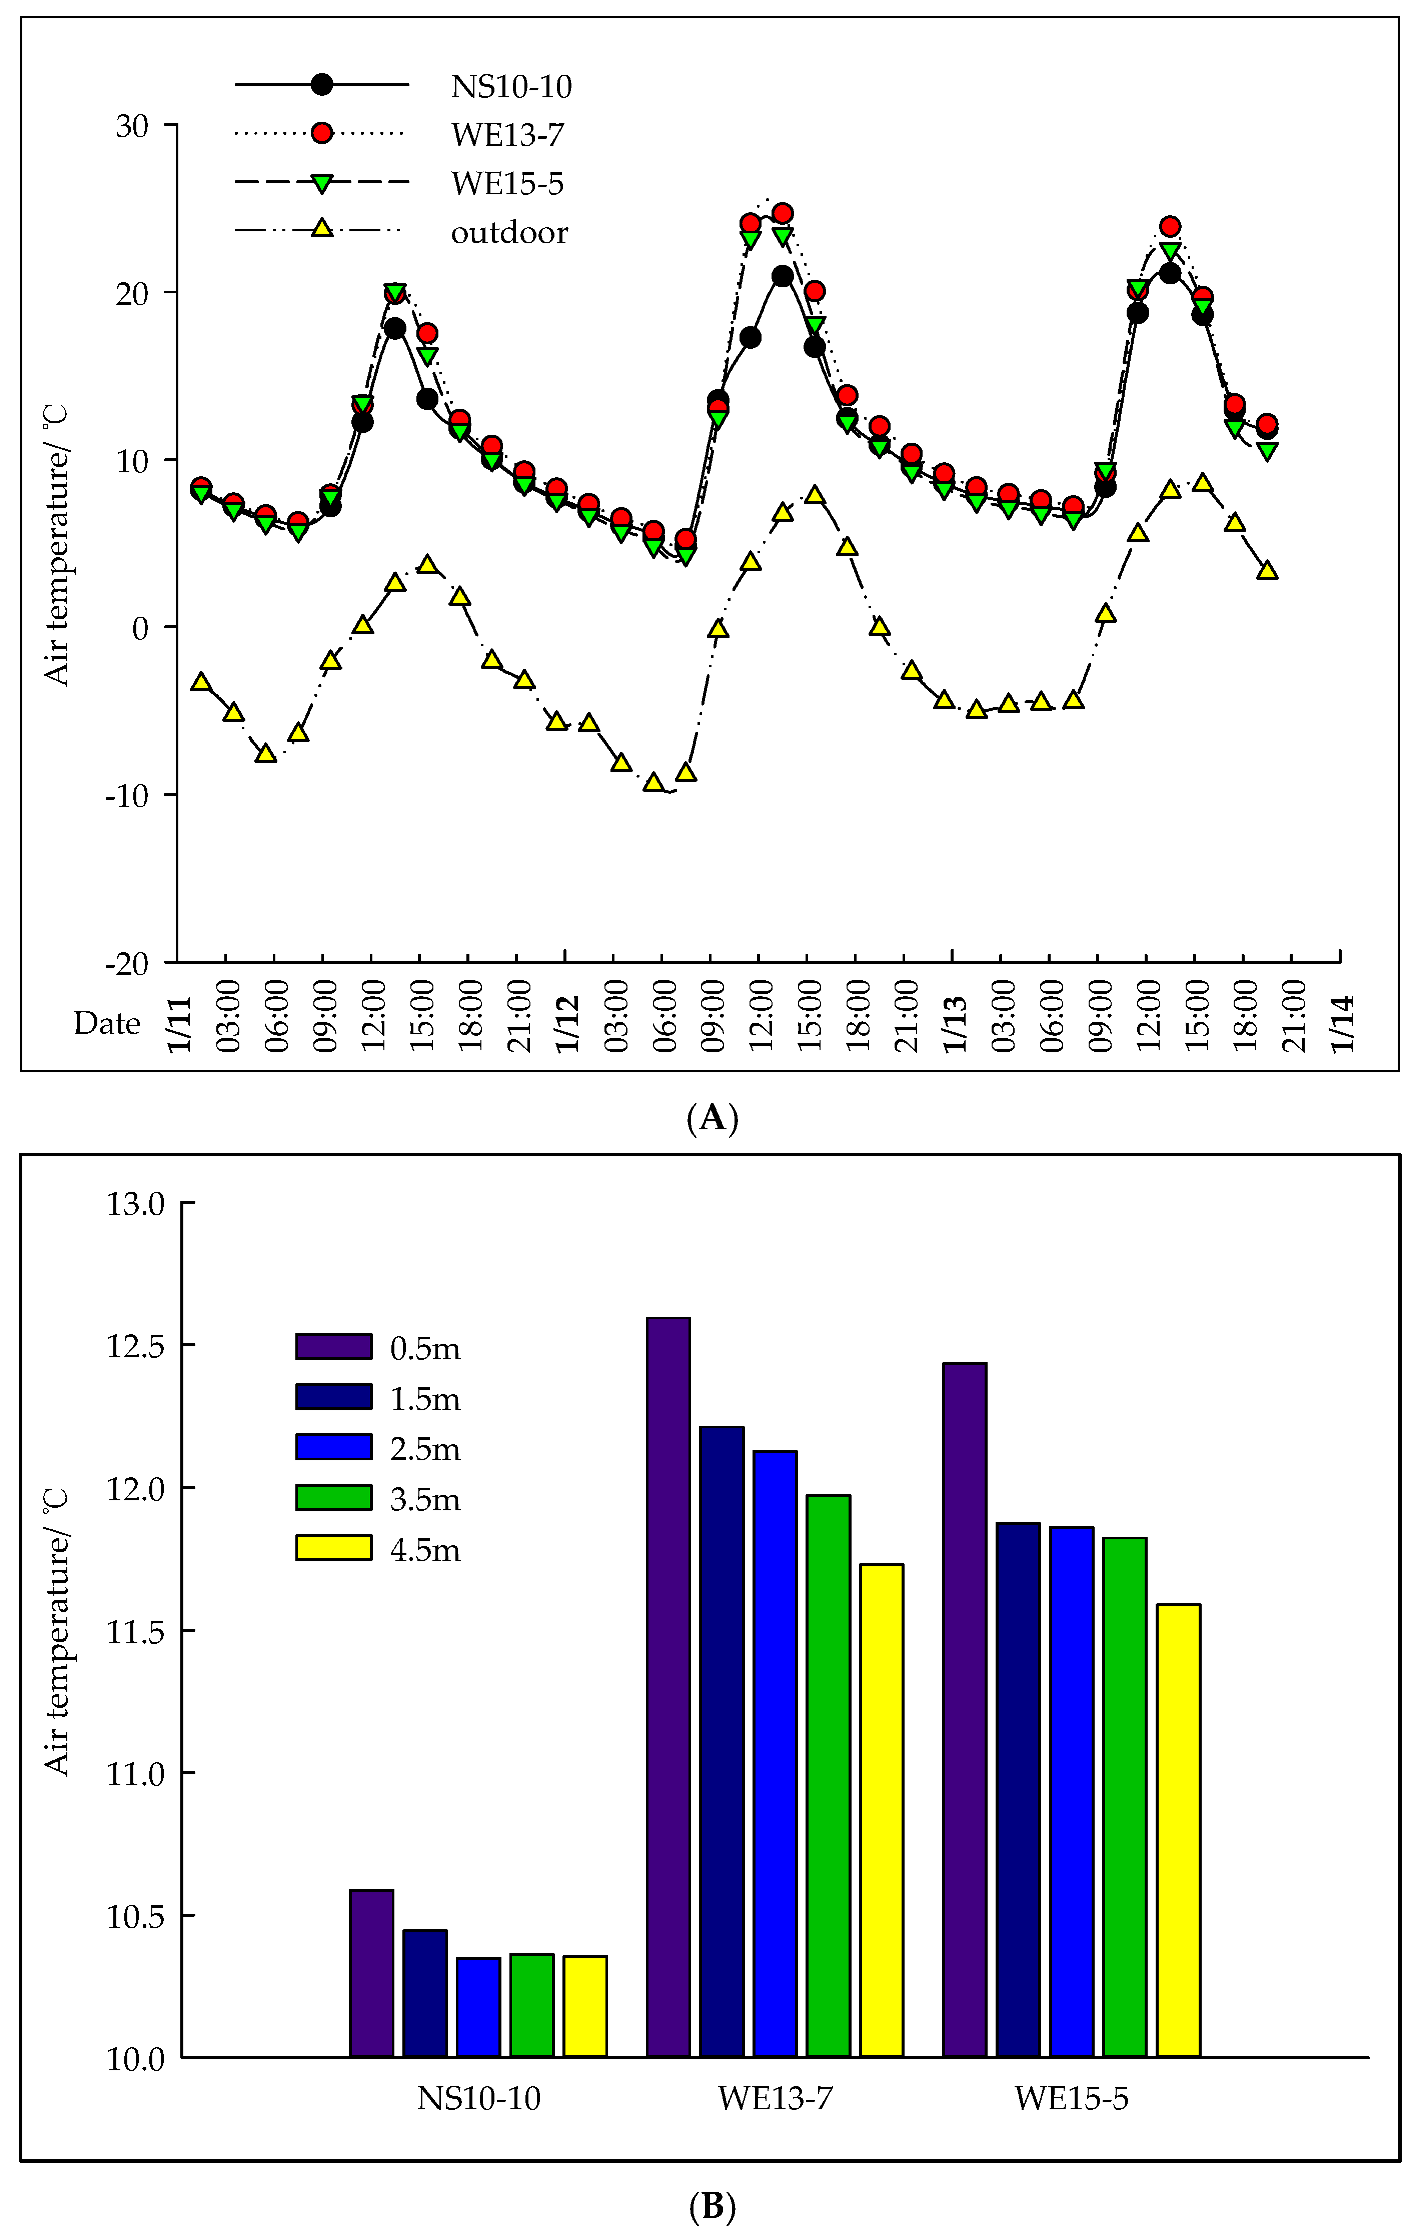
In winter (31 January to 2 February) with external insulation (thermal blankets) deployed, all tunnels maintained internal temperatures significantly above the outdoor air temperature (Figure 4A). On a sunny day, WE13-7 achieved the highest maximum air temperature (25.4 °C, i.e., 17.3 °C above the outdoor temperature), followed by WE15-5 (24.7 °C, +16.1 °C) and then NS10-10 (19.8 °C, +11.7 °C). The nighttime minimum temperatures followed the same order, with all tunnels staying above 10 °C, which is sufficient for most crops. The temperature at the 0.5 m height was the warmest, demonstrating effective insulation that protected crops from cold stress. The average temperature was highest in WE13-7 (12.6 °C), followed by WE15-5 (12.4 °C) and then NS10-10 (10.6 °C) (Figure 4B). WE15-5 and WE13-7 were warmest in the south, followed by the center and then the north, with north–south differences of 0.38 °C and 0.4 °C, respectively. In contrast, NS10-10 was warmest in the east, cooler in the west, and coolest in the center (maximum spanwise difference: 0.2 °C), displaying the best horizontal uniformity. This central cooling may be due to shading via daytime insulation, reducing solar gain and heat conversion. The southern part of WE13-7 was the warmest overall, at 13.5 °C (Figure 4C). NS10-10 maintained the lowest soil temperatures (average maxima: 10.9 °C, 11.9 °C, and 12.3 °C), while WE13-7 maintained the highest temperatures (14.0 °C, 15.1 °C, and 14.7 °C), and the temperatures in WE15-5 were intermediate (13.1 °C, 14.6 °C, and 14.4 °C). These findings indicate that WE13-7, with its superior insulation, was also the most effective at preserving soil heat (Figure 4D). The reason why the NS10-10 tunnel had the lowest daytime air and soil temperatures, but similar nighttime air temperatures to the EW tunnels, is that, during the day, the NS10-10 tunnel (north–south orientation) received less solar radiation, resulting in less heat absorption; at night, all three tunnels were covered with the same external insulation quilt (from 18:00 to 8:30 the next day), which effectively reduced heat loss, and the soil heat stored during the day supplemented the indoor temperature, leading to consistent nighttime air temperatures.
Figure 4.
Curves of the variation in the air and soil temperatures in the plastic tunnels under typical sunny conditions in winter. (A). Curves of the change in the air temperature in the plastic tunnels on typical sunny days in the winter. (B). Comparison of the vertical air temperature for the plastic tunnels on typical sunny days in the winter. (C). Comparison of the average air temperature across the entire span of the plastic tunnels on typical sunny days in the winter. (D). Curves of the change in the soil temperature in the plastic tunnels on typical sunny days in the winter.
3.4. Typical Cloudy Days in Winter
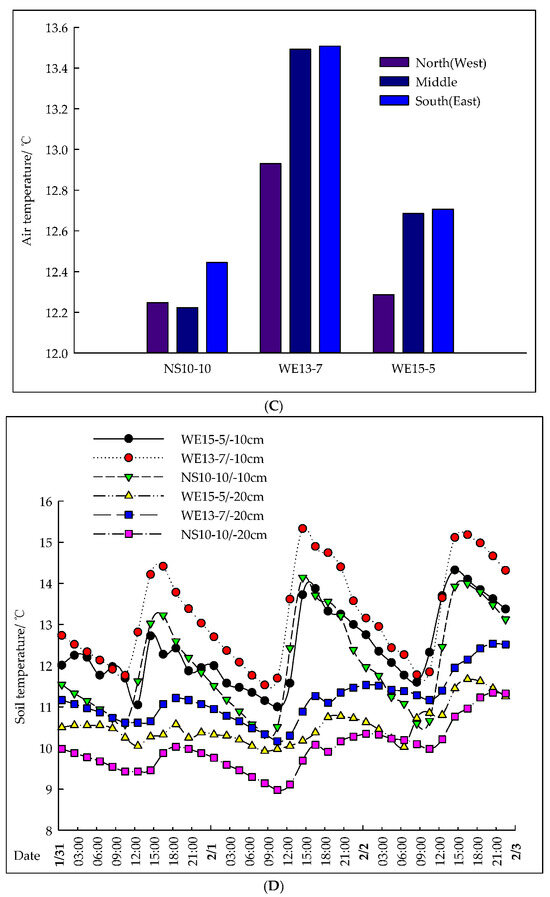
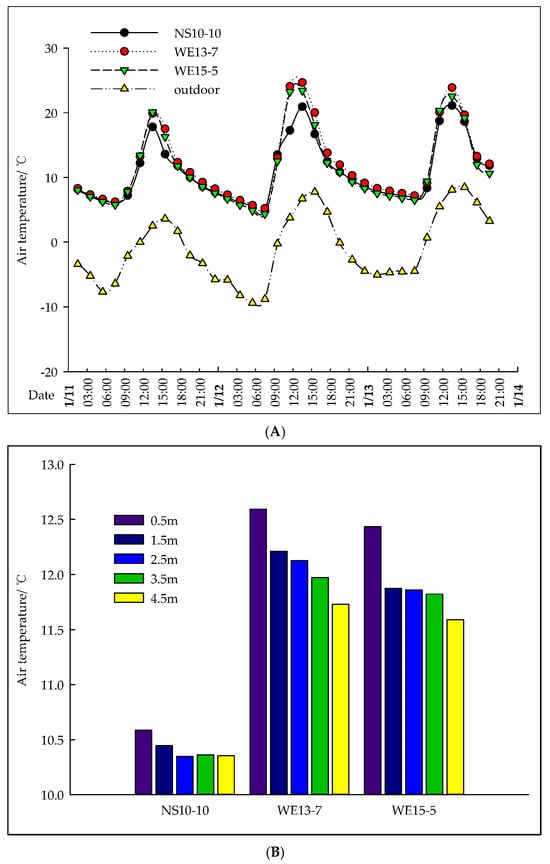
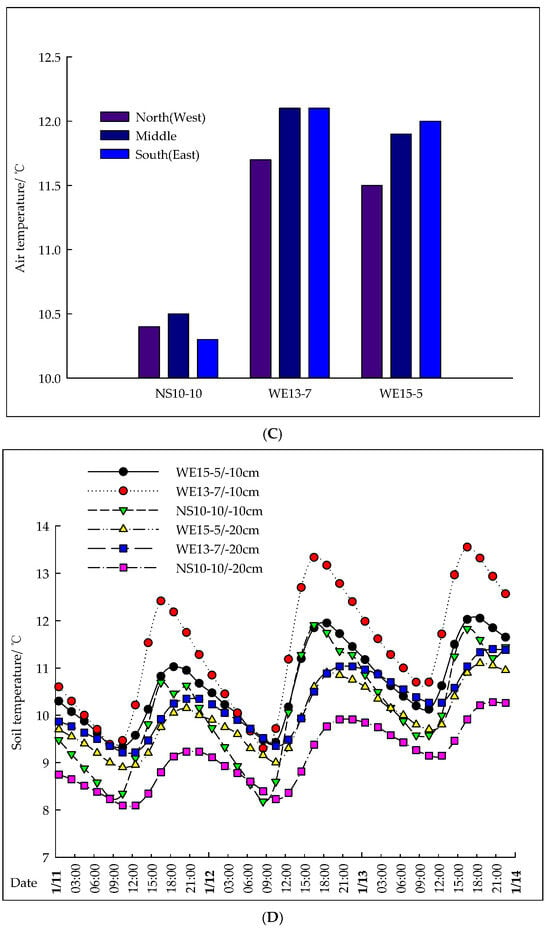
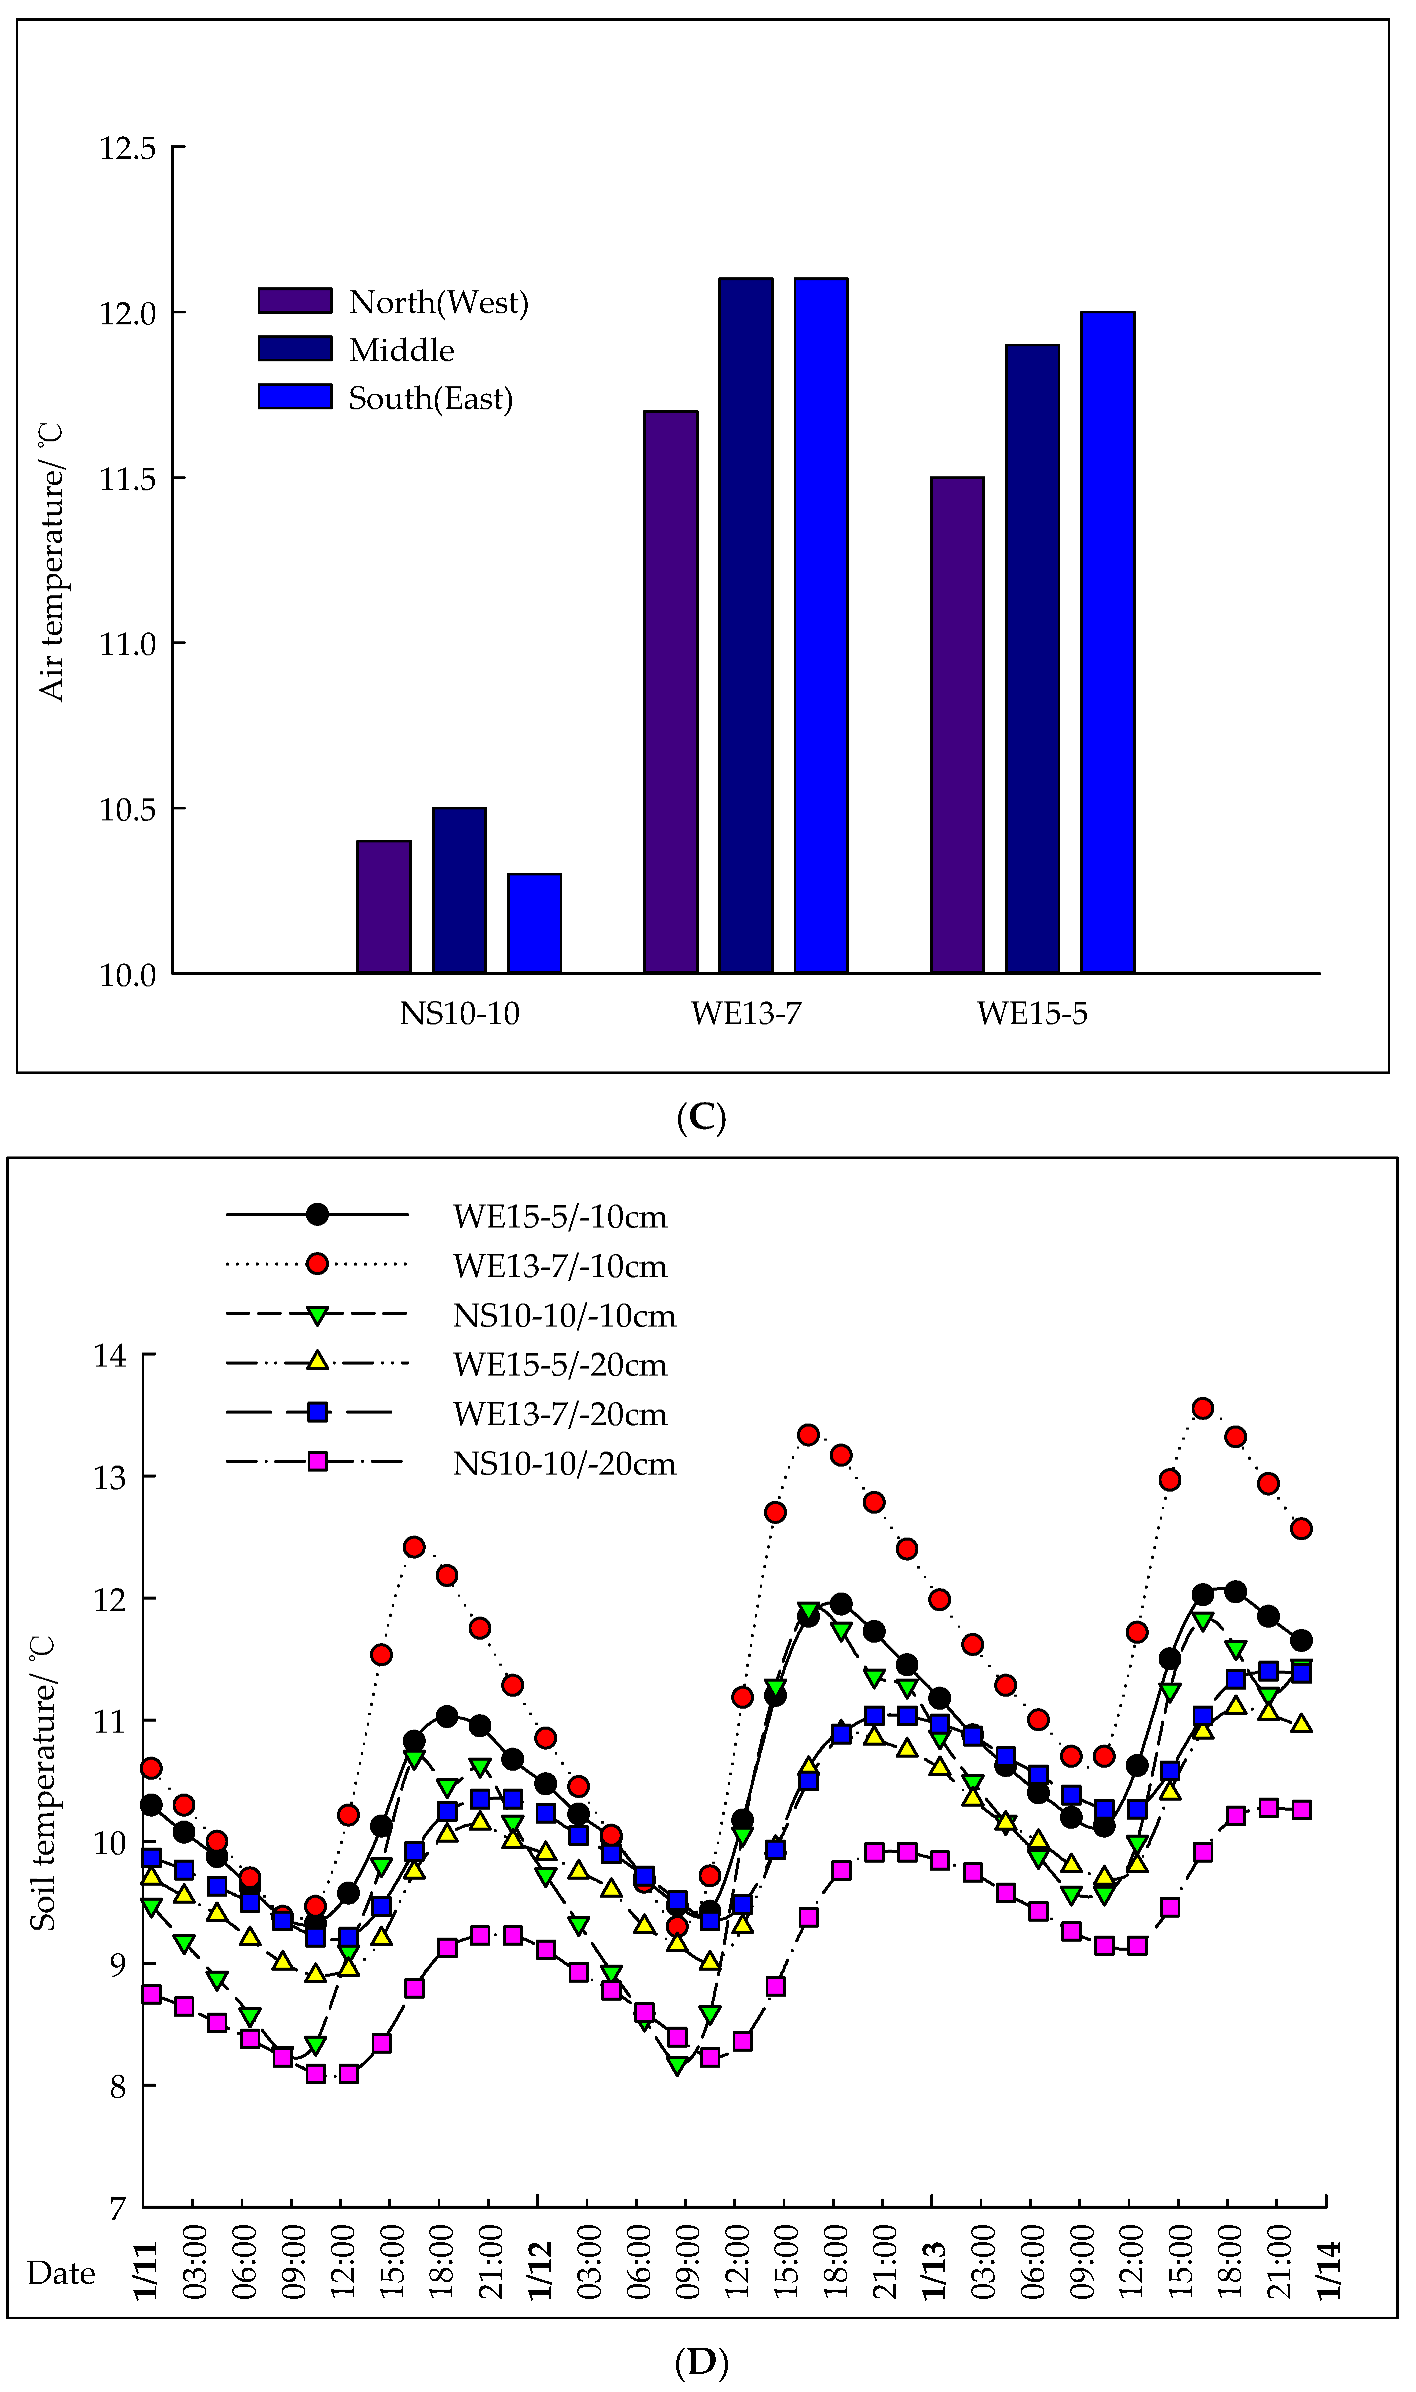
On cloudy days in winter (11–13 January), the maximum temperatures differed significantly (p < 0.05): WE13-7 had the highest maximum temperature (average: 23.6 °C, 16.3 °C above the ambient temperature), followed by WE15-5 (22.8 °C, +15.5 °C), while NS10-10 had the lowest (20.3 °C, +13.0 °C) (Figure 5A). The average temperature at the 0.5 m height was highest in WE13-7 (12.6 °C), followed by WE15-5 (12.4 °C), and it was lowest in NS10-10 (10.6 °C) (Figure 5B). NS10-10 was warmest in the east, followed by the west, and coolest in the center. In contrast, WE13-7 and WE15-5 were warmest in the center, followed by the south and then the north. The average spanwise temperature difference was smallest in NS10-10 (0.2 °C), indicating a superior uniformity, while both WE13-7 and WE15-5 showed a larger difference of 0.4 °C (Figure 5C). The soil temperature was highest in WE13-7 (11.0 °C), followed by WE15-5 and NS10-10 in descending order (Figure 5D).
Figure 5.
Curves of the variation in the air and soil temperatures in the plastic tunnels under typical cloudy conditions in winter. (A). Curves of the change in the air temperature in the plastic tunnels on typical cloudy days in the winter. (B). Comparison of the vertical air temperature for the plastic tunnels on typical cloudy days in the winter. (C). Comparison of the average air temperature across the entire span of the plastic tunnels on typical cloudy days in the winter. (D). Curve of the change in the soil temperature in the plastic tunnels on typical cloudy days in the winter.
3.5. Verification of Numerical Models
To validate the three numerical models, simulated air temperatures were compared against measured data from two typical periods (summer sunny days: 3–5 June 2019; winter sunny days: 31 January to 2 February 2019), each covering three consecutive days. The established models are transient models that simulate the dynamic changes in the internal thermal environment with the change in the external climatic parameters at 10 min intervals (consistent with the experimental data-recording interval).
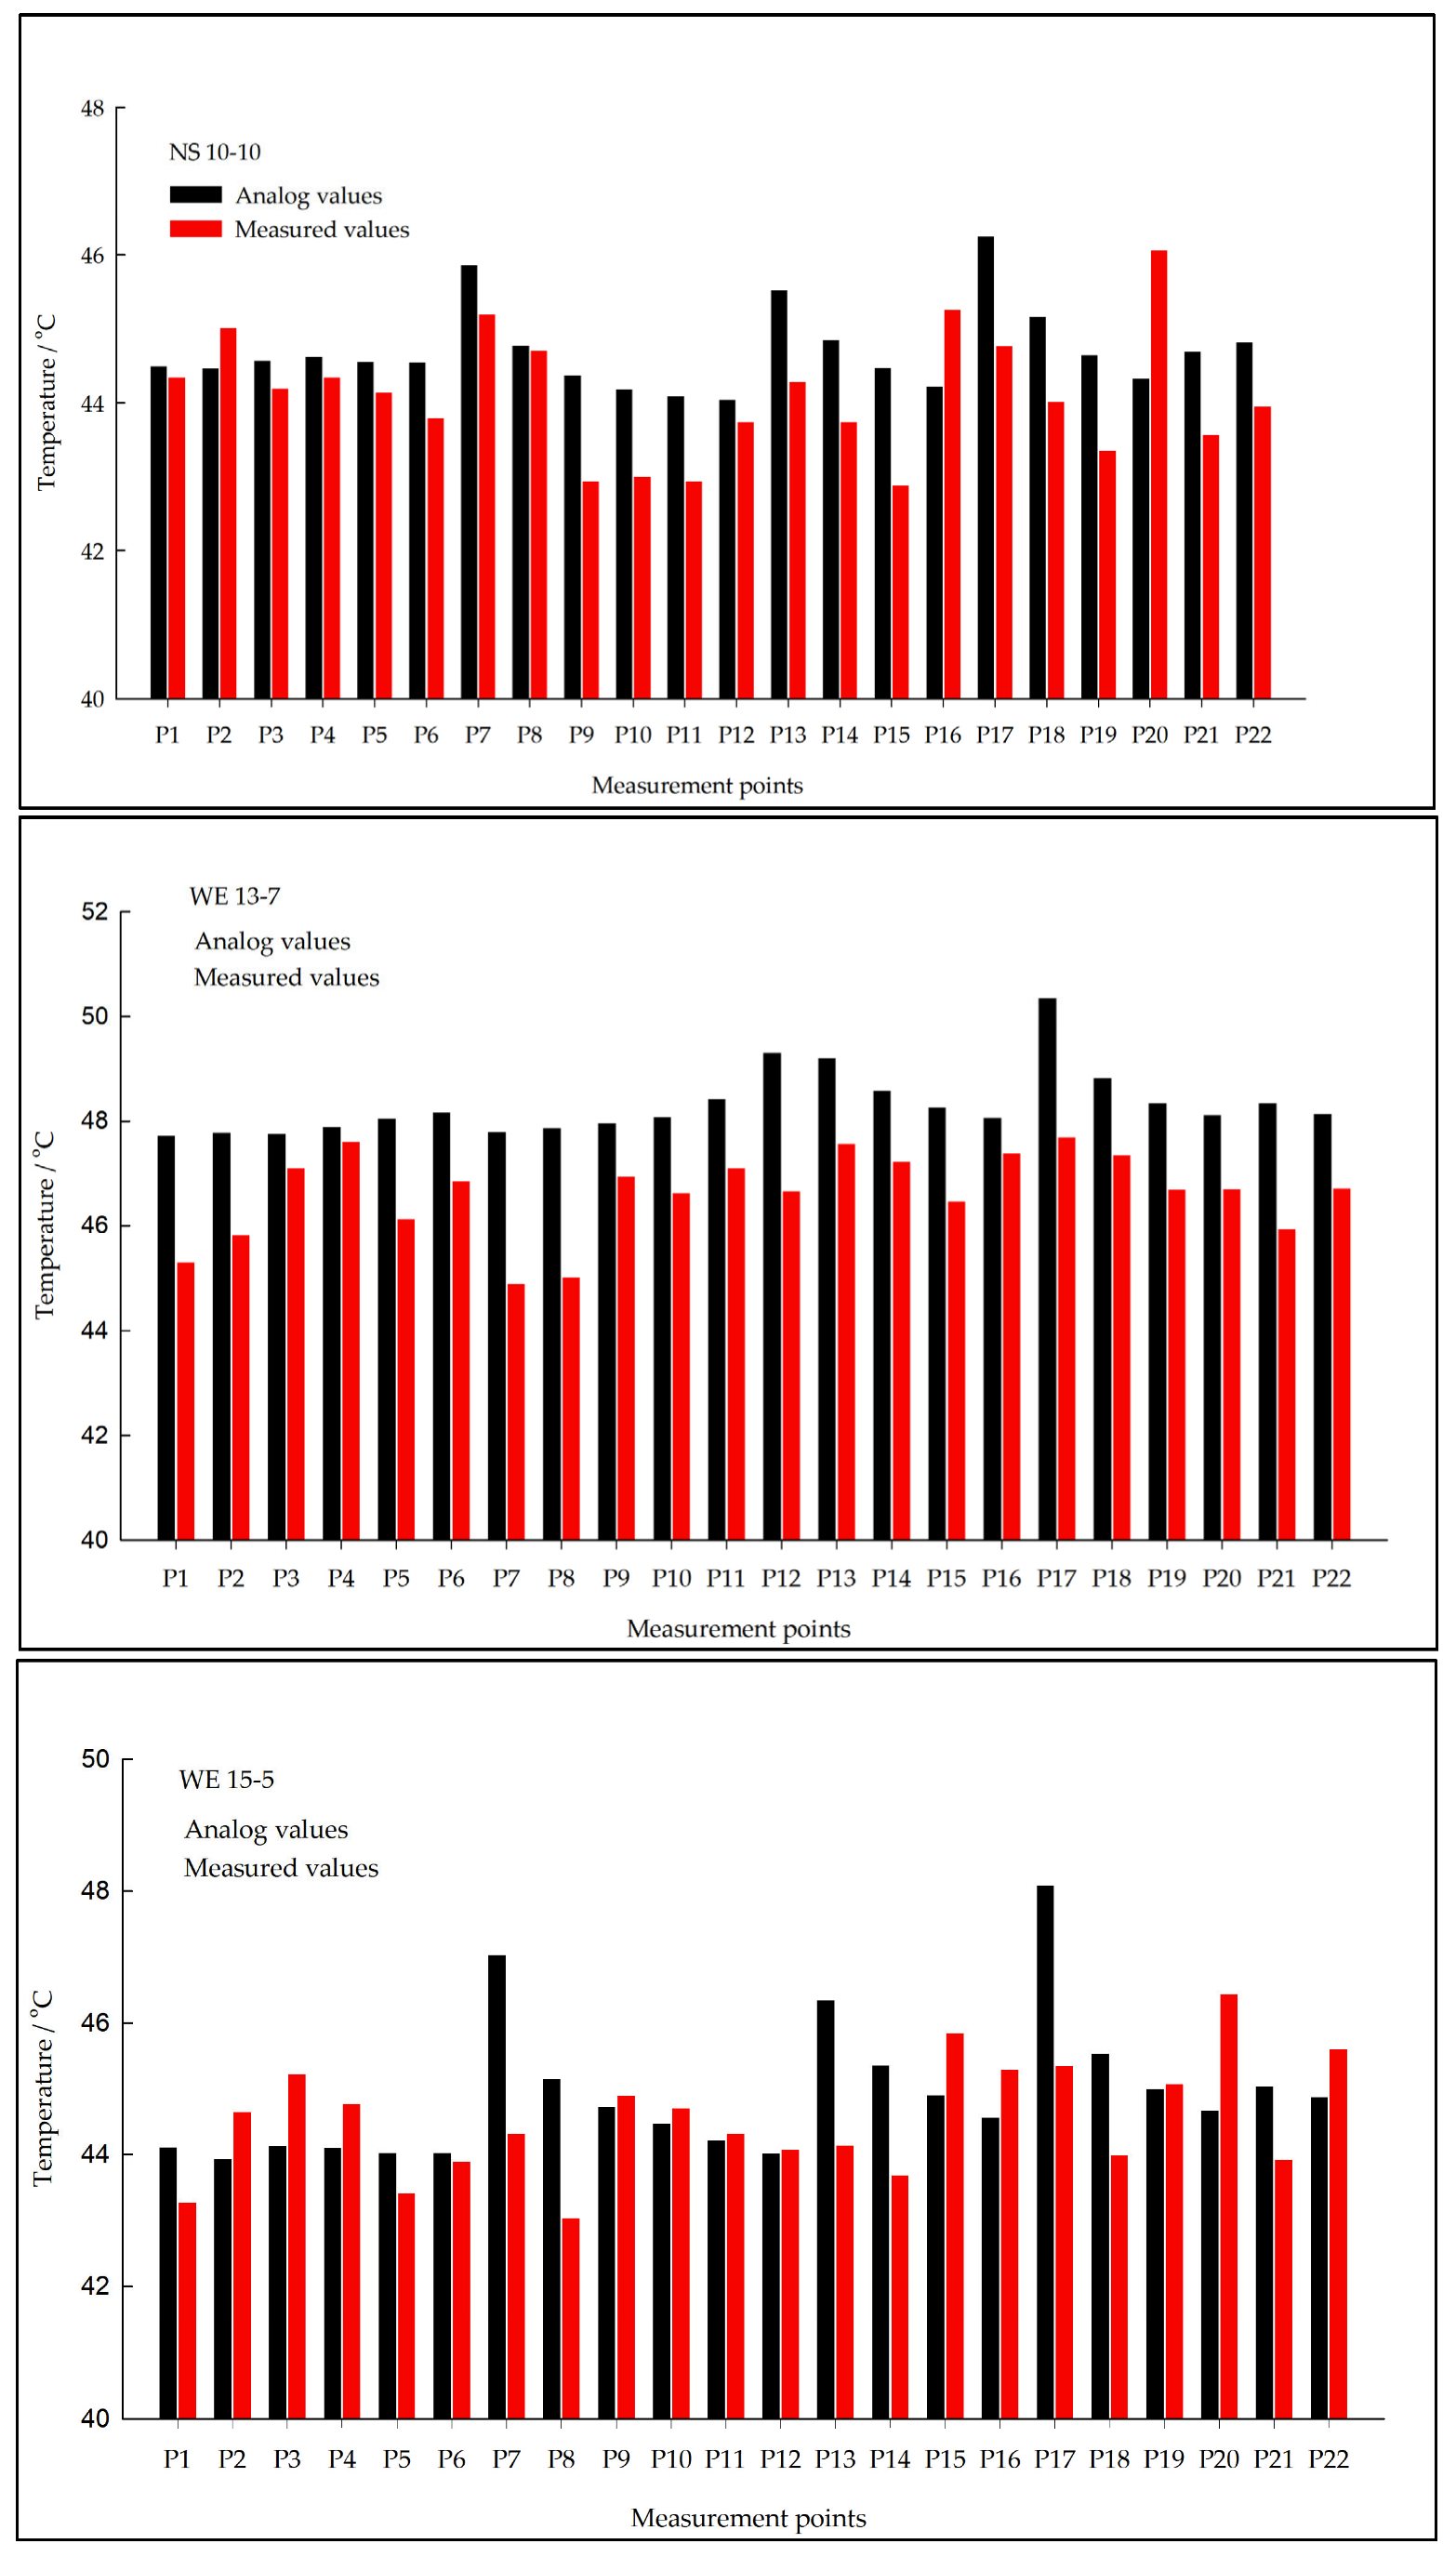
As shown in Figure 6, the simulated and measured temperature trends showed a good agreement for all tunnels. The quantitative accuracy was assessed using the root mean square error (RMSE) and absolute deviation ranges: for WE13-7, the absolute deviation ranged from 0.05 to 2.71 °C (RMSE = 0.8467 °C); for WE15-5, it ranged from 0.2 to 2.4 °C (RMSE = 0.7253 °C); and for NS10-10, it ranged from 0.1 to 1.7 °C (RMSE = 0.7265 °C), with a maximum single-point deviation of 3.4 °C. These results indicate that, while localized deviations existed, all errors fell within an acceptable range for agricultural building simulations. Therefore, the established CFD models are considered valid for simulating the thermal environment within the plastic tunnels.
Figure 6.
Simulation-derived and measured values for each measuring point in the plastic tunnels.
3.6. Analysis of the Simulation Results
The CFD simulation effectively delineated the spatial distribution of the temperature and airflow within the three plastic tunnels. An analysis was conducted on specified vertical sections (Z = 1, 12, 24, 36, 47 m) and horizontal sections (X = 2.5, 10, 17.5 m) to quantify internal environmental patterns.
- (1)
- Temperature distribution
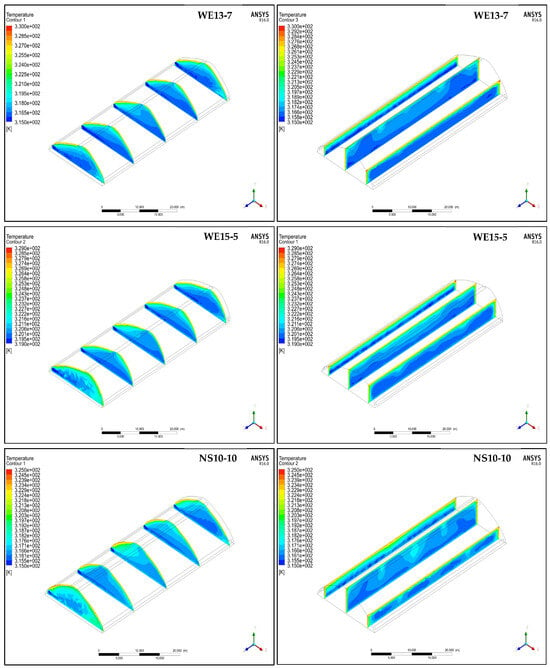
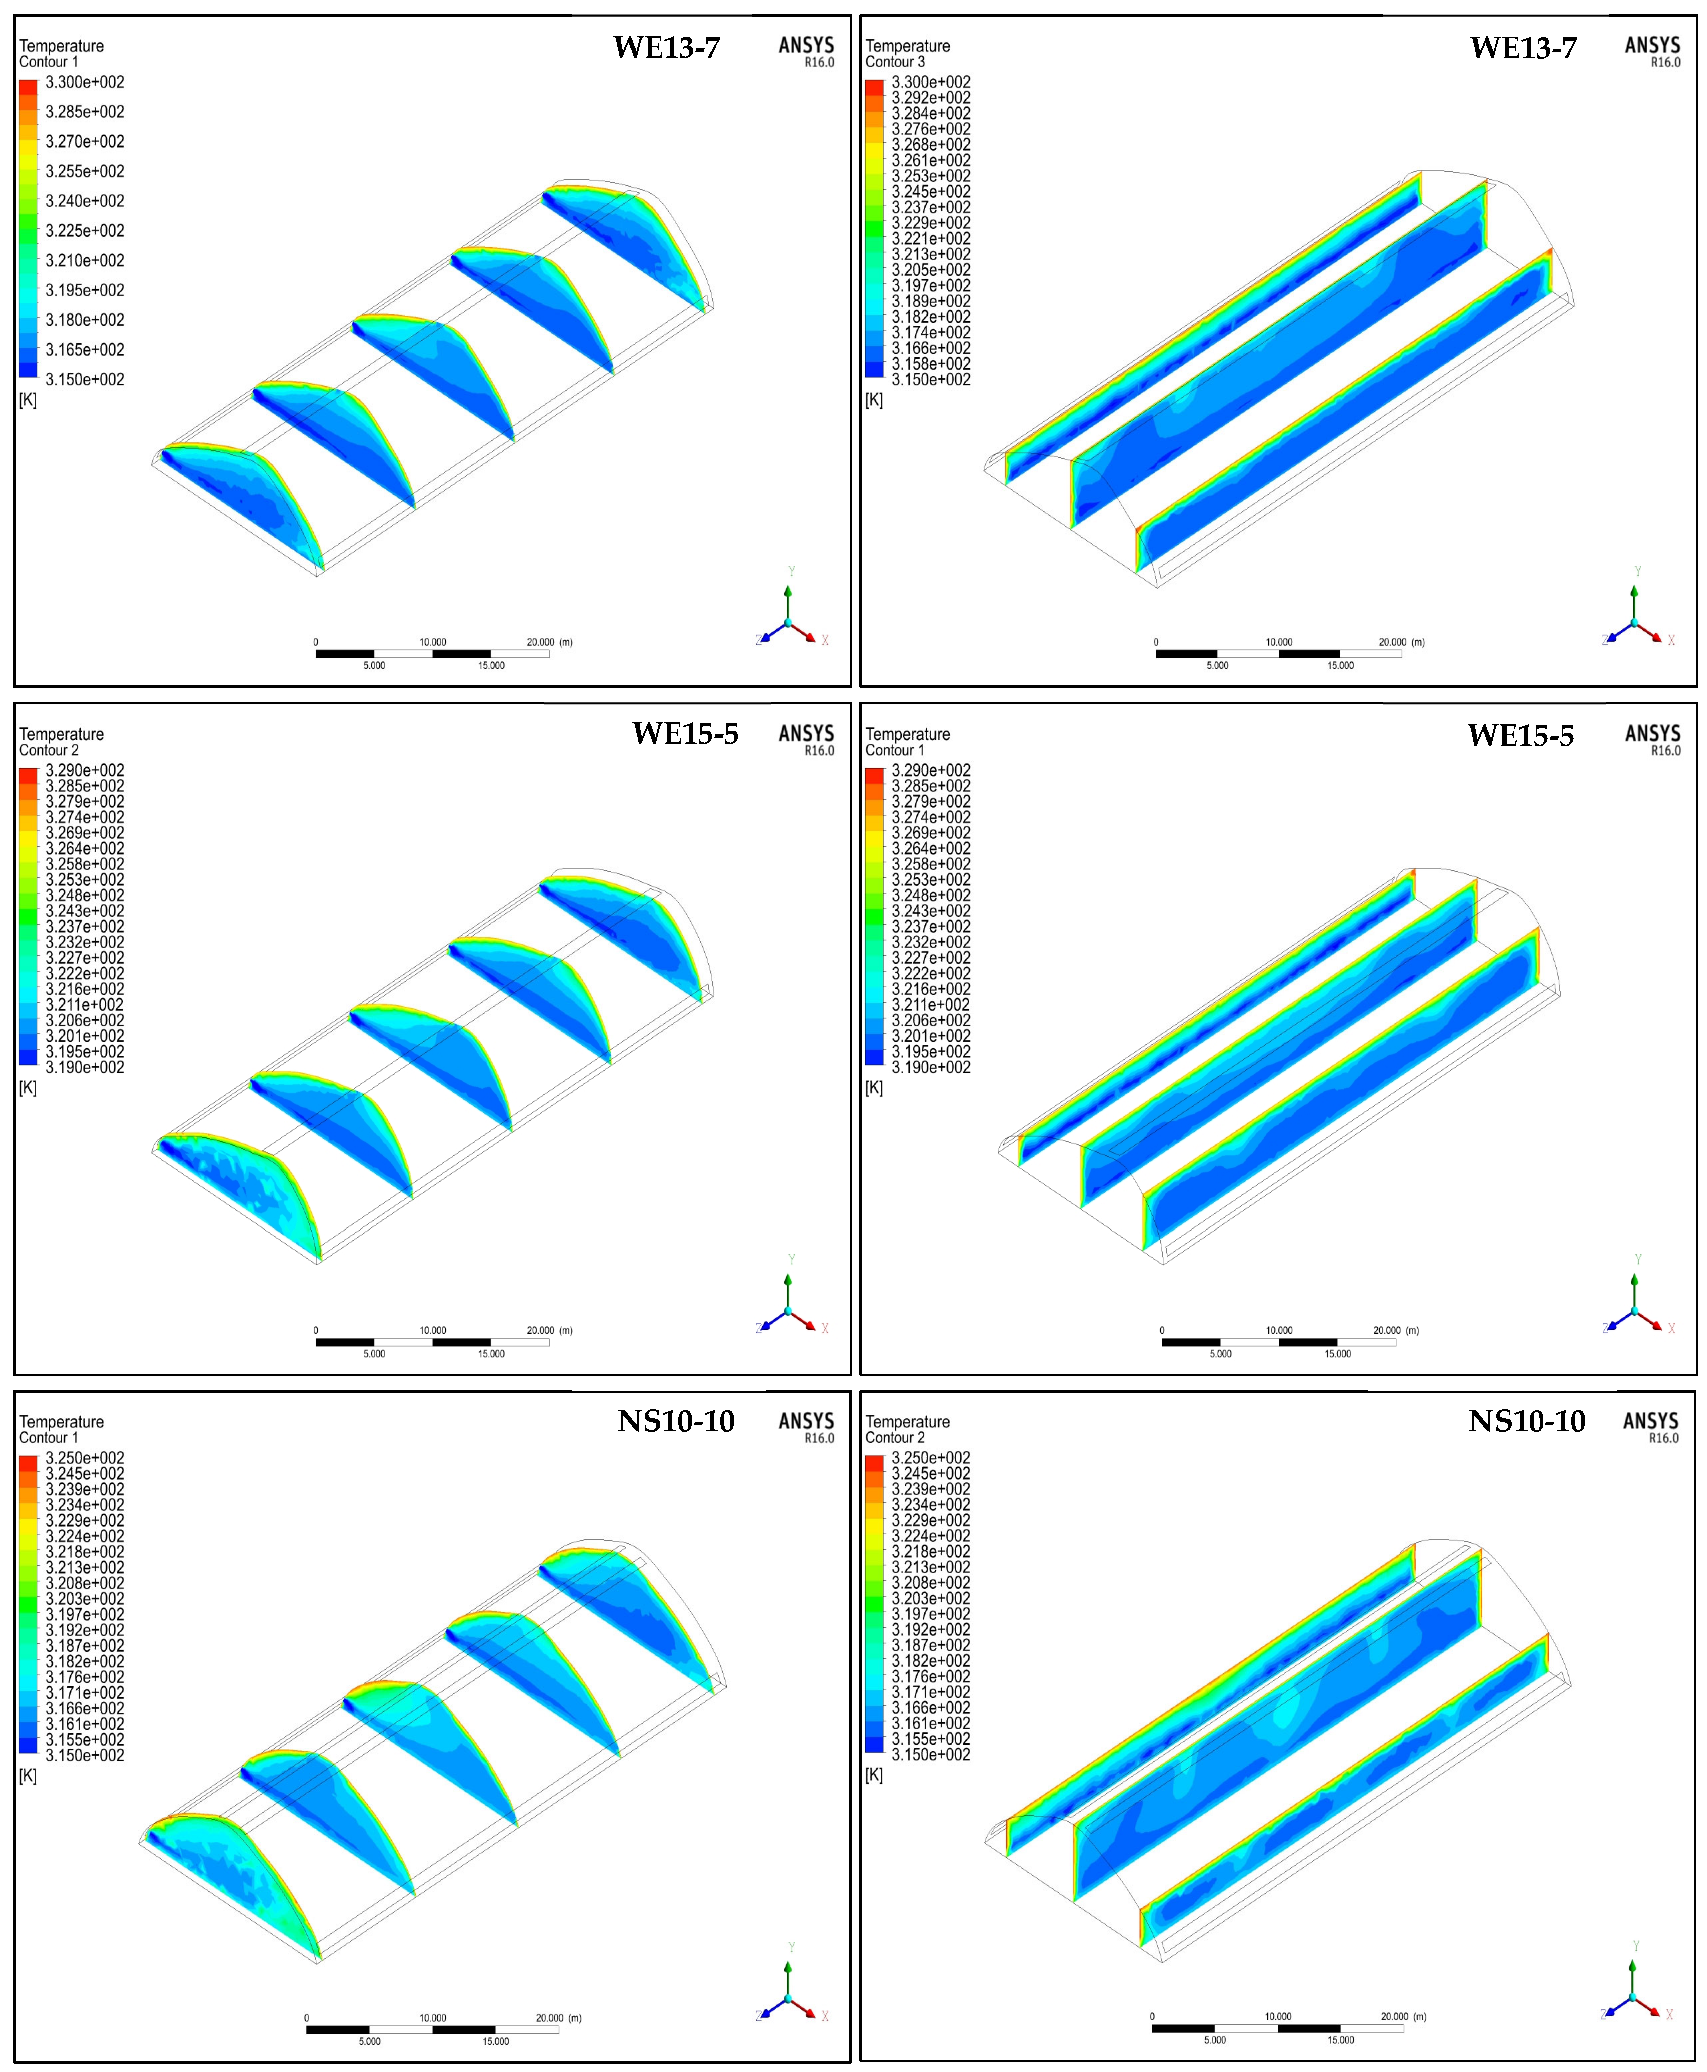
The temperature contour maps in Figure 7 intuitively show the spatial temperature distribution characteristics of the three tunnels. For the two east–west asymmetrical tunnels (WE13-7 and WE15-5), the high-temperature zone was mainly concentrated in the upper part of the northern roof, which was due to the fact that the south-facing roof received more solar radiation, and the hot air flowed to the northern side under the action of buoyancy and wind pressure, forming heat accumulation in the northern upper space. The temperature gradient in WE15-5 was more pronounced than that in WE13-7, which was consistent with the measured spanwise temperature difference of 2.2 °C for WE15-5 and 1.2 °C for WE13-7. For the north–south symmetrical tunnel (NS10-10), the temperature distribution was more uniform in the horizontal direction, with no obvious local high-temperature zone, which was attributed to its dual-top ventilation design that can effectively discharge the hot air accumulated in the upper space. In the vertical direction, the contour maps clearly show the thermal stratification phenomenon in all three tunnels, with the temperature increasing with height, and the stratification was weakest in NS10-10, which was consistent with the measured vertical temperature difference of 0.8 °C for NS10-10, 1.3 °C for WE13-7, and 2.4 °C for WE15-5 (Figure 6).
Figure 7.
Temperature distribution in different sections of the three plastic tunnels.
- (2)
- Airflow patterns and ventilation modes
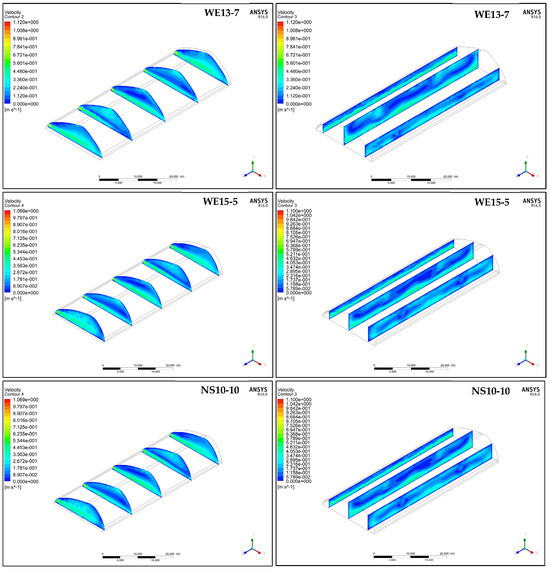
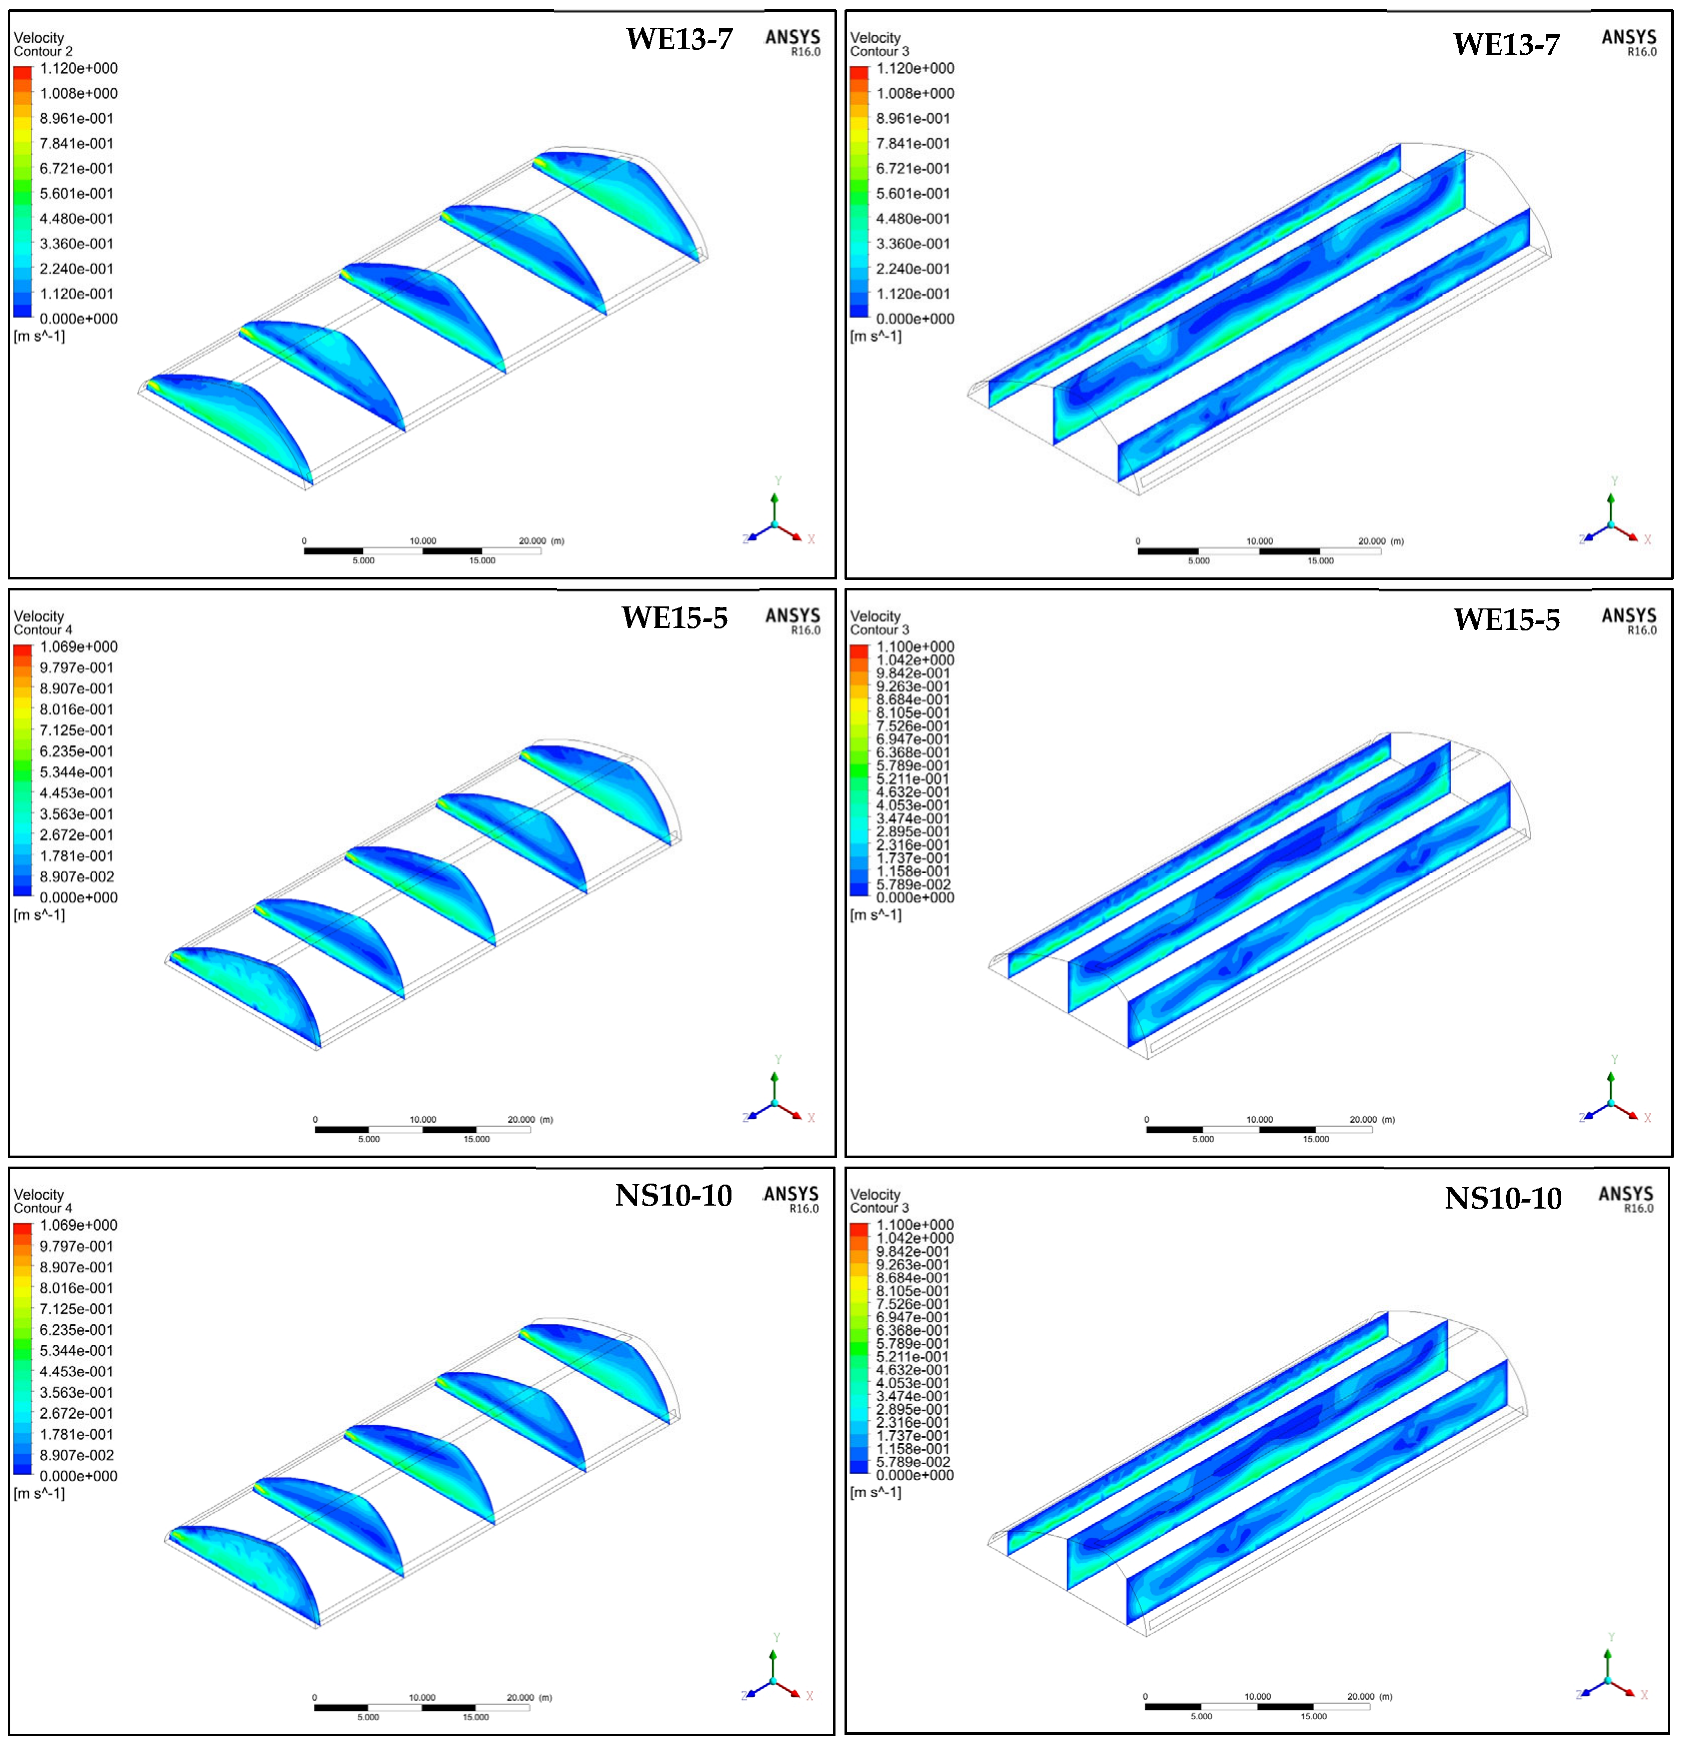
The velocity contour maps in Figure 8 reveal the distinct airflow organization characteristics of the three tunnels. For WE13-7, the high-velocity zone was concentrated at the side vent outlet, with a maximum velocity of 0.8 m/s at the south side inlet, and the airflow flowed from the south side to the north side along the roof, forming a large recirculation eddy in the middle-lower part of the tunnel. This airflow pattern explains why the side vent played a dominant role in the ventilation of WE13-7. For WE15-5, the high-velocity zones were distributed at both the top vent and the side vent, with similar velocity magnitudes, indicating the combined top-and-side-ventilation mode. The airflow entered from the south-side vent, part of which was discharged from the top vent, and the other part flowed to the north side and was discharged from the north-side vent, forming two small recirculation eddies in the tunnel. This airflow organization enhanced the air mixing, but the heat removal efficiency was lower than that of NS10-10. For NS10-10, under the prevailing westerly wind, the airflow entered from the west-side vent, flowed through the tunnel along the east–west direction, and was discharged from the east-side vent and the dual-top vents. The velocity distribution was more uniform in the spanwise direction, with no obvious stagnant zone, which was the key reason for the most uniform temperature distribution in NS10-10. The maximum exhaust velocity of 0.7 m/s at the east-side vent also indicated its higher ventilation efficiency compared with the two east–west tunnels (Figure 8).
Figure 8.
Distribution of airflow in different sections of the three plastic tunnels.
- (3)
- Integrated analysis
The results demonstrate direct coupling between airflow organization and the resulting temperature distribution. The ventilation mode and orientation fundamentally influence the thermal uniformity: NS10-10, with its north–south orientation and dual-top vents, achieved the most uniform vertical temperature profile and lateral airflow distribution. The east–west tunnels, benefiting from greater solar exposure, showed stronger thermal stratification and distinct south–north gradients, with their specific vent configurations (top-dominant or combined) modulating the internal flow field and local heat removal efficiency.
4. Discussion
The three newly designed 20 m span plastic tunnels successfully address the spatial limitations of traditional designs, expanding the planting area and improving the land-use efficiency, which are key objectives in developing large-span structures. Their elevated height of 6.5 m facilitated a pronounced “chimney effect” under high-temperature summer conditions, enhancing the natural ventilation capacity and effective cooling. Furthermore, this inherent ventilation capacity suggests that, if supplemented with effective cooling measures (e.g., wet-curtain systems), these tunnels could support continuous production even during the summer. NS10-10 exhibited the best cooling effect, which was attributed to a combination of its ventilation strategy and orientation. First, its double-top ventilation design enabled greater expulsion of internal hot air, a finding consistent with prior conclusions indicating that double-top ventilation outperforms the single-top form in terms of cooling efficiency. Second, its north–south orientation resulted in a lower daytime solar radiation input compared to the east–west tunnels, resulting in the lowest internal temperature among the three. This result confirms that, for equivalent spans, a north–south orientation enhances summer cooling compared to an east–west one. Under low winter temperatures without active heating or heat storage, both east–west plastic tunnels maintained the minimum air and soil temperatures sufficient for most crops. This capacity stemmed from their superior capacity to capture solar radiation and convert it into heat. Due to their asymmetric east–west orientation, these tunnels achieved a stronger light interception and lighting efficiency than the traditional north–south designs. Our results showed that NS10-10 had a better summer cooling effect than the east–west-oriented tunnels, with a daily average air temperature 1.3–1.9 °C lower than the east–west tunnels under typical summer sunny conditions. This result is consistent with the findings of Huang et al. [9], who reported that a north–south-oriented multi-span plastic greenhouse had a 1.2 °C lower daily average air temperature than an east–west-oriented one in summer in southern China. The WE13-7 model, with an average roof angle of lighting of 26.76°, and the WE15-5 model, with an angle of 23.52°, exemplify this effectiveness. According to the principle of greenhouse lighting, a larger roof angle of lighting with an optimal range enhances light capture. Thus, with its larger average angle (26.76° vs. 23.52°), WE13-7 was endowed with a stronger capacity to absorb solar radiation than WE15-5. Consequently, the average, maximum, and minimum air temperatures, as well as the soil temperatures, in WE13-7 were consistently higher than those in WE15-5, indicating that the shape and orientation of the lighting surfaces directly influence the key determinants of the internal environment in plastic tunnels. Furthermore, the experimental greenhouse in this study, with its 20 m span, demonstrated an effective thermal insulation and heating performance, confirming that increasing the span of plastic tunnels can enhance their thermal retention and warming capacity. Our results showed that the east–west-oriented asymmetrical tunnel WE13-7 had a daily average air temperature 2.2–2.8 °C higher than the north–south-oriented NS10-10 under typical winter sunny conditions. This is consistent with the results of Wu et al. [6], who found that an east–west-oriented asymmetric large-span plastic greenhouse had a 2.5 °C higher daily average air temperature than a symmetrical greenhouse in winter. In this study, all three self-designed plastic tunnels were equipped with thermal insulation quilts in the winter, with identical deployment schedules, significantly improving the thermal insulation performance. Further comparative research using structurally identical tunnels lacking insulation quilts is required in order to precisely investigate and quantify the corresponding thermal insulation performance. Due to the limitations of the experimental site and research funds, this study only constructed one symmetrical north–south tunnel and two asymmetrical east–west tunnels; future research will supplement symmetrical east–west and asymmetrical north–south tunnels to conduct a more systematic and comprehensive comparative analysis of the influence of tunnel type and orientation on the internal thermal environment.
A close correlation between airflow movement and the temperature distribution in greenhouses was also observed in this study. In our numerical simulations, we observed a characteristic pattern: the inlet air temperature was lower, while the outlet air temperature was higher. This is a product of the incoming cooler external air undergoing continuous heat exchange with the warmer internal environment as it flows through the tunnel. This heat transfer progressively raises the air temperature, leading to the highest record at the outlet. The elevated temperatures near the covering material resulted from its interaction with sunlight—besides receiving solar radiation, part of the light was reflected, while another part was absorbed and converted into thermal energy. This energy was then transferred to the adjacent air inside the plastic tunnel through heat exchange, thereby heating the local environment. Meanwhile, a consistent pattern was observed in the three tunnels: strong, cool airflow near the ground contrasted with relatively stagnant, warmer air in the upper high-temperature zone. Notably, there was an eddy current at a height of around 3.5 m in the center of the tunnel; this current coincided with a measured high-temperature region, which was corroborated by actual measurement data. This structure of thermal stratification created a vertical temperature buffer within the large-span tunnel, effectively protecting ground-level crops from excessive heat stress. We established three numerical models of a plastic tunnel, providing a basis for stimulating indoor microclimate changes under varying external conditions. Previous research underscores the importance of such models; for instance, Ren et al. [24] demonstrated the influence of the sizes and locations of vents on the internal climate. While some researchers have used CFD models to predict temperature distributions and propose optimized ventilation schedules (e.g., natural ventilation from 8:00 to 11:00, with wet-curtain fan cooling from 11:00 to 15:30) to effectively reduce high indoor temperatures, others have examined the effects of different types of windows and designs of back-wall vents on the ventilation efficiency [25]. Based on this foundation, we employed these validated models to symmetrically study microclimate behavior under different boundary conditions, thereby facilitating the exploration and optimization of plastic tunnel performance. In this study, all three self-designed plastic tunnels were equipped with thermal insulation quilts in the winter, with identical deployment schedules, significantly improving the thermal insulation performance. However, the absence of a control group (structurally identical tunnels without insulation quilts) limits our ability to precisely quantify the exact contribution of the insulation quilts to thermal retention. Further comparative research using structurally identical tunnels lacking insulation quilts is required in order to precisely investigate and quantify the corresponding thermal insulation performance. Future studies should also consider long-term crop cultivation experiments and optimize tunnel structures based on year-round performance data.
5. Conclusions
- (1)
- The orientation and shape of lighting surfaces are critical factors influencing the ventilation and cooling performance of large-span plastic tunnels during the summer. To effectively reduce high temperatures, an optimal tunnel design must facilitate reductions in both air and soil temperatures. Among the three configurations evaluated, the NS10-10 design and dual-vent roof structure exhibited a superior ventilation and cooling efficiency, as well as the most uniform temperature distribution. When combining the air temperature, soil temperature, humidity, and ventilation efficiency, these attributes render it a relatively suitable design for high-temperature summer conditions.
- (2)
- The orientation and shape of the lighting surface play a decisive role in the heat preservation and temperature increase capacity of plastic tunnels in the winter. Under typical winter weather conditions and with the use of nighttime insulation blankets, all three tunnel designs maintained adequate nocturnal air temperatures, exceeding 10.0 °C on sunny days and 5.5 °C on cloudy days. Notably, the WE13-7 design consistently achieved the highest maximum daytime air temperatures and the highest average soil temperatures at depths of 10 cm and 20 cm, followed by WE15-5 and NS10-10. These results demonstrate that WE13-7 exhibits superior heat retention under low-temperature conditions.
- (3)
- Numerical models were developed for the three plastic tunnel designs. Validation against measured data showed a strong agreement (RMSE: 0.73–0.85 °C), thereby confirming the reliability of the established models for simulating thermal environments in large-span plastic tunnels, which can be used for the simulation and prediction of the thermal environment of large-span plastic tunnels under different climatic conditions.
Future research directions should include long-term crop cultivation experiments to validate the optimal tunnel selection for specific crops, the addition of a control group without thermal blankets to quantify the insulation performance, the optimization of tunnel structures based on year-round performance data, and the extension of the experimental design to include symmetrical east–west and asymmetrical north–south tunnels for a more comprehensive comparative analysis.
Author Contributions
Conceptualization, Q.L. and B.L.; investigation and writing—original draft preparation, X.L. (Xinying Liu), W.S. and Q.S.; writing—review and editing, X.L. (Xin Liu), Q.L. and B.L.; supervision and funding acquisition, Q.L. All authors have read and agreed to the published version of the manuscript.
Funding
This research was funded by the Agricultural Science and Technology Innovation Program (34-IUA-03); the National Natural Science Foundation of China (32573125); the Sichuan Provincial Natural Science Foundation Project (2024NSFSC0397); and the Local Financial Funds of National Agricultural Science and Technology Center, Chengdu (NASC2022KR01, NASC2023ST06, and NASC2024KR03).
Data Availability Statement
The data presented in this study are available from the corresponding author upon request.
Conflicts of Interest
The authors declare no conflicts of interest.
References
- Wei, Q.; Ma, Y. Discussion on land utilization in the development of solar greenhouse. Agric. Eng. Technol. 2006, 1, 22–23. [Google Scholar]
- Zhang, Y.; Chen, X. Practice and thoughts on popularizing mechanized technology for vegetable production in greenhouses. Mod. Agric. Mach. 2015, 2, 20–22. [Google Scholar]
- Cui, S.; Chen, Y.; Huo, X.; Wang, X.; Ma, C.; Li, R. Design of the solar lean-to greenhouse without wall and preliminary study on the photoeffect. Trans. Chin. Soc. Agric. Eng. 2005, 21, 214–217. [Google Scholar]
- Mobtaker, H.G.; Ajabshirchi, Y.; Ranjbar, S.F.; Matloobi, M. Solar energy conservation in greenhouse: Thermal analysis and experimental validation. Renew. Energy 2016, 96, 509–519. [Google Scholar] [CrossRef] [Scilit]
- Yang, W.X.; Ma, C.W. Simulation study on the influence of greenhouse span on the lighting environment of solar greenhouse. Res. Agric. Mech. 2015, 37, 70–72+82. [Google Scholar]
- Wu, Y.; Li, J.; Xiao, J.; Zhuang, Y.; Liao, M. Winter temperature and sunlight variation characteristics in large-span asymmetric plastic greenhouses. J. Northwest A F Univ. (Nat. Sci. Ed.) 2019, 47, 97–106. [Google Scholar] [CrossRef]
- Zhou, S.; Zhang, Y.; Cheng, R.; Yang, Q.; Fang, H.; Zhou, B.; Lu, W.; Zhang, F. Evaluation on heat preservation effects in micro-environment of large-scale greenhouse with active heat storage system. Trans. Chin. Soc. Agric. Eng. 2016, 32, 218–225. [Google Scholar]
- Sethi, V.P. On the selection of shape and orientation of a greenhouse: Thermal modeling and experimental validation. Sol. Energy 2009, 83, 21–38. [Google Scholar] [CrossRef] [Scilit]
- Huang, Z.Y.; Gao, H.T.; Zhu, S.L.; Zhao, C.Y.; Cai, C.H. Optimization design of mechanical ventilation for multi-span plastic greenhouses in southern China during summer. Trans. Chin. Soc. Agric. Mach 2017, 48, 252–259. [Google Scholar]
- Tong, G.; Li, T.; Wang, T.; Yamaguchi, T.; Bai, Y. Experimental research on microclimate environment in a large-scale sunlight greenhouse. J. Huazhong Agric. Univ. 2004, 35, 67–73. [Google Scholar]
- Che, Z.; Tong, G.; Wang, T.; Yamaguchi, T.; Wen, Z. Environments of large-scale sunlight greenhouse under clear and overcast days. J. Shenyang Agric. Univ. 2005, 36, 462–465. [Google Scholar]
- Yang, D.; Guo, W.; Zhang, L.; Yang, C.; Han, J. Test and analysis of winter temperature and light environment of solar greenhouses with different structures. Agric. Eng. Technol. 2010, 2, 18–21. [Google Scholar]
- Li, S.; Ji, J.; Sun, Z.; Dong, G. A Study on temperature performances of wide-span plastic covered tunnel greenhouse. Chin. J. Agrometeorol. 2008, 29, 58–61. [Google Scholar]
- Xu, Y.; Lyu, X.; Song, H.; Lin, B.; Wei, M.; Yin, Y.; Wang, S. Large-span M-shaped greenhouse with superior wind resistance and ventilation performance. J. Wind Eng. Ind. Aerodyn. 2023, 238, 105410. [Google Scholar]
- Lin, B.; Song, H.; Liu, G.; Qi, Z.; Guan, R.; Wei, M.; Zhang, G.; Jia, Y.; Wang, S. In-situ testing and analysis of aerodynamic characteristics of tomato plants in large-span arched greenhouse. Comput. Electron. Agric. 2025, 230, 109891. [Google Scholar]
- Haxaire, R.; Boulard, T.; Mermier, M. Greenhouse natural ventilation by wind forces. Acta Hortic. 2000, 534, 31–40. [Google Scholar] [CrossRef] [Scilit]
- Brugger, M.; Montero, J.; Baeza, E.; Perez-Parra, J. Computational fluid dynamic modeling to improve the design of the spanish parral stype greenhouse. In Proceedings of the ASAE Annual Meeting, Las Vegas, NV, USA, 27–30 July 2003; p. 034046. [Google Scholar]
- Shen, M.; Hao, F. Steady State Numerical Simulation of Airflow Pattern in Natural Ventilated Tunnel Greenhouse. Trans. Chin. Soc. Agric. Mach. 2006, 37, 101–105. [Google Scholar]
- Roy, J.C.; Boulard, T.; Kittas, C.; Wang, S. Convective and ventilation transfers in greenhouses: Part 1: The greenhouse considered as a perfectly stirred tank. Biosyst. Eng. 2002, 83, 1–20. [Google Scholar] [CrossRef] [Scilit]
- Saneinejad, S.; Moonen, P.; Defraeye, T.; Derome, D.; Crmeliet, J. Coupled CFD, radiation and porous media transport model for evaluating evaporative cooling in an urban environment. J. Wind. Enginnering Ind. Aerodyn. 2012, 104–106, 455–463. [Google Scholar] [CrossRef] [Scilit]
- Majdoubi, H.; Boulard, T.; Fatnassi, H.; Bouirden, L. Airflow and microclimate patterns in a one-hectare Canary type greenhouse: An experimental and CFD assisted study. Agric. For. Meteorol. 2009, 149, 1050–1062. [Google Scholar] [CrossRef] [Scilit]
- Cheng, X.; Mao, H.; Ni, J. Simulation and test of heat and humidity in natural ventilated glasshouse by CFD method. J. Yangzhou Univ. Agric. Life Sci. Ed. 2010, 31, 90–94. [Google Scholar]
- Cheng, X.; Mao, H.; Ni, J. Numerical prediction and CFD modeling of relative humidity and temperature for greenhouse-crops system. Trans. Chin. Soc. Agric. Mach. 2011, 42, 157+173–179. [Google Scholar]
- Ren, S.; Yang, W.; Wang, H.; Xue, W.; Xu, H.; Xu, Y. Prediction model on temporal and spatial variation of air temperature in greenhouse and ventilation control measures based on CFD. Trans. Chin. Soc. Agric. Eng. 2015, 31, 207–214. [Google Scholar]
- He, K.; Chen, D.; Sun, L.; Liu, Z. Effects of Wind Regime and Vent Configuration on Microclimate in Tunnel Greenhouses in Summer. Trans. Chin. Soc. Agric. Mach. 2017, 48, 311–318+339. [Google Scholar]

Disclaimer/Publisher’s Note: The statements, opinions and data contained in all publications are solely those of the individual author(s) and contributor(s) and not of MDPI and/or the editor(s). MDPI and/or the editor(s) disclaim responsibility for any injury to people or property resulting from any ideas, methods, instructions or products referred to in the content. |
© 2026 by the authors. Licensee MDPI, Basel, Switzerland. This article is an open access article distributed under the terms and conditions of the Creative Commons Attribution (CC BY) license.