


Abstract
Climate change poses significant challenges to global agricultural systems, exerting profound impacts on crop yields and water resource management, which are particularly pronounced in cold-region rice-growing systems. This study employed the AquaCrop model to assess the spatiotemporal distribution characteristics of rice yield, crop water requirement (ETc), irrigation water requirement (Ir), and water use efficiency (WUE) in Heilongjiang Province under the RCP4.5 and RCP8.5 scenarios from 2021 to 2080. The results indicate that the average rice yield in Heilongjiang Province will increase by approximately 2% to 5%, with more significant gains observed in the western and southern regions. However, climate warming will cause ETc to increase by 3–7%, leading to a rise in Ir of about 5–12%, which is particularly pronounced under the RCP8.5 scenario. Compared to RCP4.5, the yield under RCP8.5 will increase by 1–2%, but the increase in Ir will be more significant. Despite these changes, WUE remains within a relatively constrained range (approximately 1.55~1.75 kg·m−3), as yield increases are largely offset by corresponding rises in ETc. Overall, the findings reveal a pronounced yield–water trade-off in cold-region rice systems under future climate scenarios, indicating that yield gains may be accompanied by heightened Ir.
1. Introduction
Climate change, as a global environmental challenge, has profoundly permeated agricultural production systems and has become an issue of common concern to the scientific community and all sectors of society [1]. Climate change poses a significant threat to agricultural water supply, the stability of crop yields, and food security through means such as altering temperature and precipitation patterns. According to the latest IPCC Assessment Report (AR6), it is projected that by 2100, global temperatures will rise by an average of more than 2 °C [2]. The temperature rise in high-latitude regions is more pronounced [3]. High-latitude regions are experiencing pronounced warming, which may substantially alter crop growth conditions and regional water demand [4]. Climate-driven yield variability exhibits significant spatial differences globally, particularly in climate-sensitive regions where minor shifts in precipitation patterns can trigger substantial yield declines. Warming increases evaporation, amplifying the global hydrological cycle, and irrigation water requirement (Ir) is projected to rise significantly under future scenarios. These changes are expected to further amplify the risks faced by agricultural production, thereby threatening the long-term stability and sustainable guarantee of global food security. Therefore, in future irrigation systems, balancing crop yields with water requirements has become a critical issue in both agriculture and water resource management.
The lack of certainty with respect to the spatiotemporal distribution of increasing warmth and precipitation is dramatically changing the nature of the connection between water supply and demand on farms. Rising temperatures significantly increase crop transpiration rates, thereby increasing crop water requirements (ETc) [5]. At the same time, precipitation patterns exhibit unpredictable growth trends both temporally and spatially. While total precipitation has increased in some regions, uneven distribution may reduce precipitation (Pe), thereby intensifying irrigation pressures [6]. Studies show that for every 1 °C increase in air temperature, the mean Ir of the globe changes by about 9.77% and a 1% decrease in precipitation leads to an increase in the demand of irrigation water by about 0.28% [7]. As an example, under the scenario of climate change, effective precipitation could be reduced by more than half, almost doubling the water needed to irrigate rice production [8]. The seasonality of precipitation and intense precipitation in certain countries has strongly shaped the allocation of water resources in agriculture and competition over the resource [9]. Also, the amount of solar radiation (Rn), which is an important climatic variable that affects photosynthesis and evapotranspiration in croplands, has a significant effect on the interaction between water supply and demand in agricultural soils [10]. More solar Rn increases the water needs of crops due to increased crop evapotranspiration [11]. In humid regions, insufficient Rn limits crop yields, while in semi-arid areas, the combination of high Rn and lower soil moisture further reduces yields [12]. It is important to study the relations between increases in temperature, precipitation fluctuations, and Rn alteration effects on ETc because the knowledge of such relations is necessary to achieve regional prosperity in agriculture, arrange irrigation processes, and manage water resources in the best possible way.
In order to explain how climate change impacts crop yields and the dynamics of water supply and demand, scientists have used two main approaches, namely, field experiments and crop simulation models. Field experiments make possible the direct observation of the effect of climate variables on plant development and ETc, yet they tend to be spatially non-representative, making it challenging to cover different levels of climates. They are also limited by their time frame, making it difficult to analyze long-term tendencies of trends [13,14]. Conversely, numerous scholars have employed mainstream models such as ORYZA2000, AquaCrop, DSSAT, and CERES-Rice to simulate key aspects of crop growth processes—including evapotranspiration and soil water balance—and assess the combined impact of future climate change on yield and water supply–demand dynamics [15]. This provides important evidence for understanding the impact of future climate change on rice in different regions. It is worth noting that the AquaCrop model, a water-driven model developed by the Food and Agriculture Organization of the United Nations (FAO), is especially popular because it requires very few inputs, is easily calibrated, is very accurate, and has wide applicability [16]. Nie et al. have validated the AquaCrop model in Heilongjiang Province by simulating maize yield and water-related indicators, and the calibrated simulated values were in good agreement with field measured data [17,18], which verified the model’s ability to accurately simulate crop–water processes under the local climatic conditions of this region. As shown by research, AquaCrop is an excellent fit for predicting yields of cotton, tomatoes, rice, and corn. Moreover, it has been found to be even more accurate than other models when it comes to predicting the influence of meteorological factors on the yield and water supply and demand of different crops and it has become extensively applied in studies assessing the consequences of climate change on agriculture [19,20]. However, most current studies focus solely on the impact of climate change on individual rice indicators. This single-indicator approach overlooks the inherent interconnections and interactions among different indicators. Increased yields may be accompanied by higher Ir, thereby affecting water use efficiency (WUE). Improvements in WUE may also depend on synergistic changes in yield and climatic conditions. The lack of a systematic analysis of these coupled relationships not only limits models’ ability to capture the complexity of agricultural systems but may also lead to biases in developing strategies for climate change adaptation or optimizing resource allocation. A combined analysis of multiple indicators enables production research to transition from “single-indicator analysis” to “multi-indicator coordination,” thereby enhancing research quality across various dimensions—including cognition, evaluation, and simulation—and helping to achieve a balance between stable production, water conservation, and efficient resource utilization in actual production.
Being one of the largest developing nations, China houses 22% of the world’s population with only 9% of world’s arable land [21], and the rice output of the country represents about 30% of the world’s production [22]. On the list of the biggest rice-growing regions of China, Heilongjiang Province takes a special place. Being an important hub of commercial grain production, Heilongjiang is a key element in food security within the country. In recent decades, the area under rice cultivation in Heilongjiang has increased at a regular rate and is close to 4 million hectares [23,24]. Moreover, over 95% of the agricultural water supplied to this area goes into irrigating the rice fields [25]. Heilongjiang Province lies in a climate-sensitive mid–high-latitude region, where climate change can greatly influence agricultural activities [26]. In recent years, there have been climate change processes such as increased temperature and changes in the spatiotemporal nature of precipitation that have impacted the growth cycles, yield, and WUE of rice adversely [27]. Such modifications are not only potentially dangerous to regional food safety but also make water resource management, farmland administration, and agricultural policy formulation more demanding [28]. Therefore, it is theoretically and practically significant to study the characteristics of the space–time distribution of these changes and their causative factors in depth to achieve regional food security and create efficient irrigation systems.
This study employs the AquaCrop model to quantify the spatiotemporal trade-offs among rice yield, evapotranspiration, WUE, and Ir in Heilongjiang Province under RCP4.5 and RCP8.5 climate scenarios during 2021–2080. Specifically, the objectives of this study are to (1) assess future changes in rice yield and ETc under different climate scenarios; (2) examine how WUE responds to concurrent changes in yield and evapotranspiration; (3) identify key climatic drivers shaping production–water trade-offs and their implications for regional irrigation management. Through a comprehensive analysis of various climatic factors and rice production, this study offers sustainable recommendations regarding the future relationship between rice yield and water use in high-latitude, cold-climate rice-growing regions.
2. Materials and Methods
2.1. Study Area and Data Sources
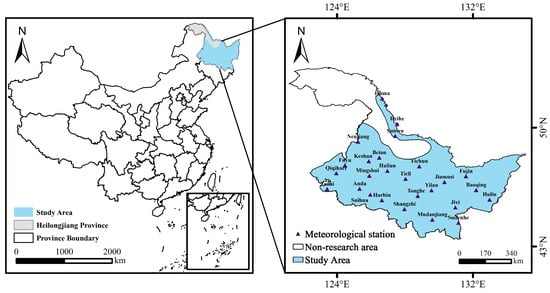
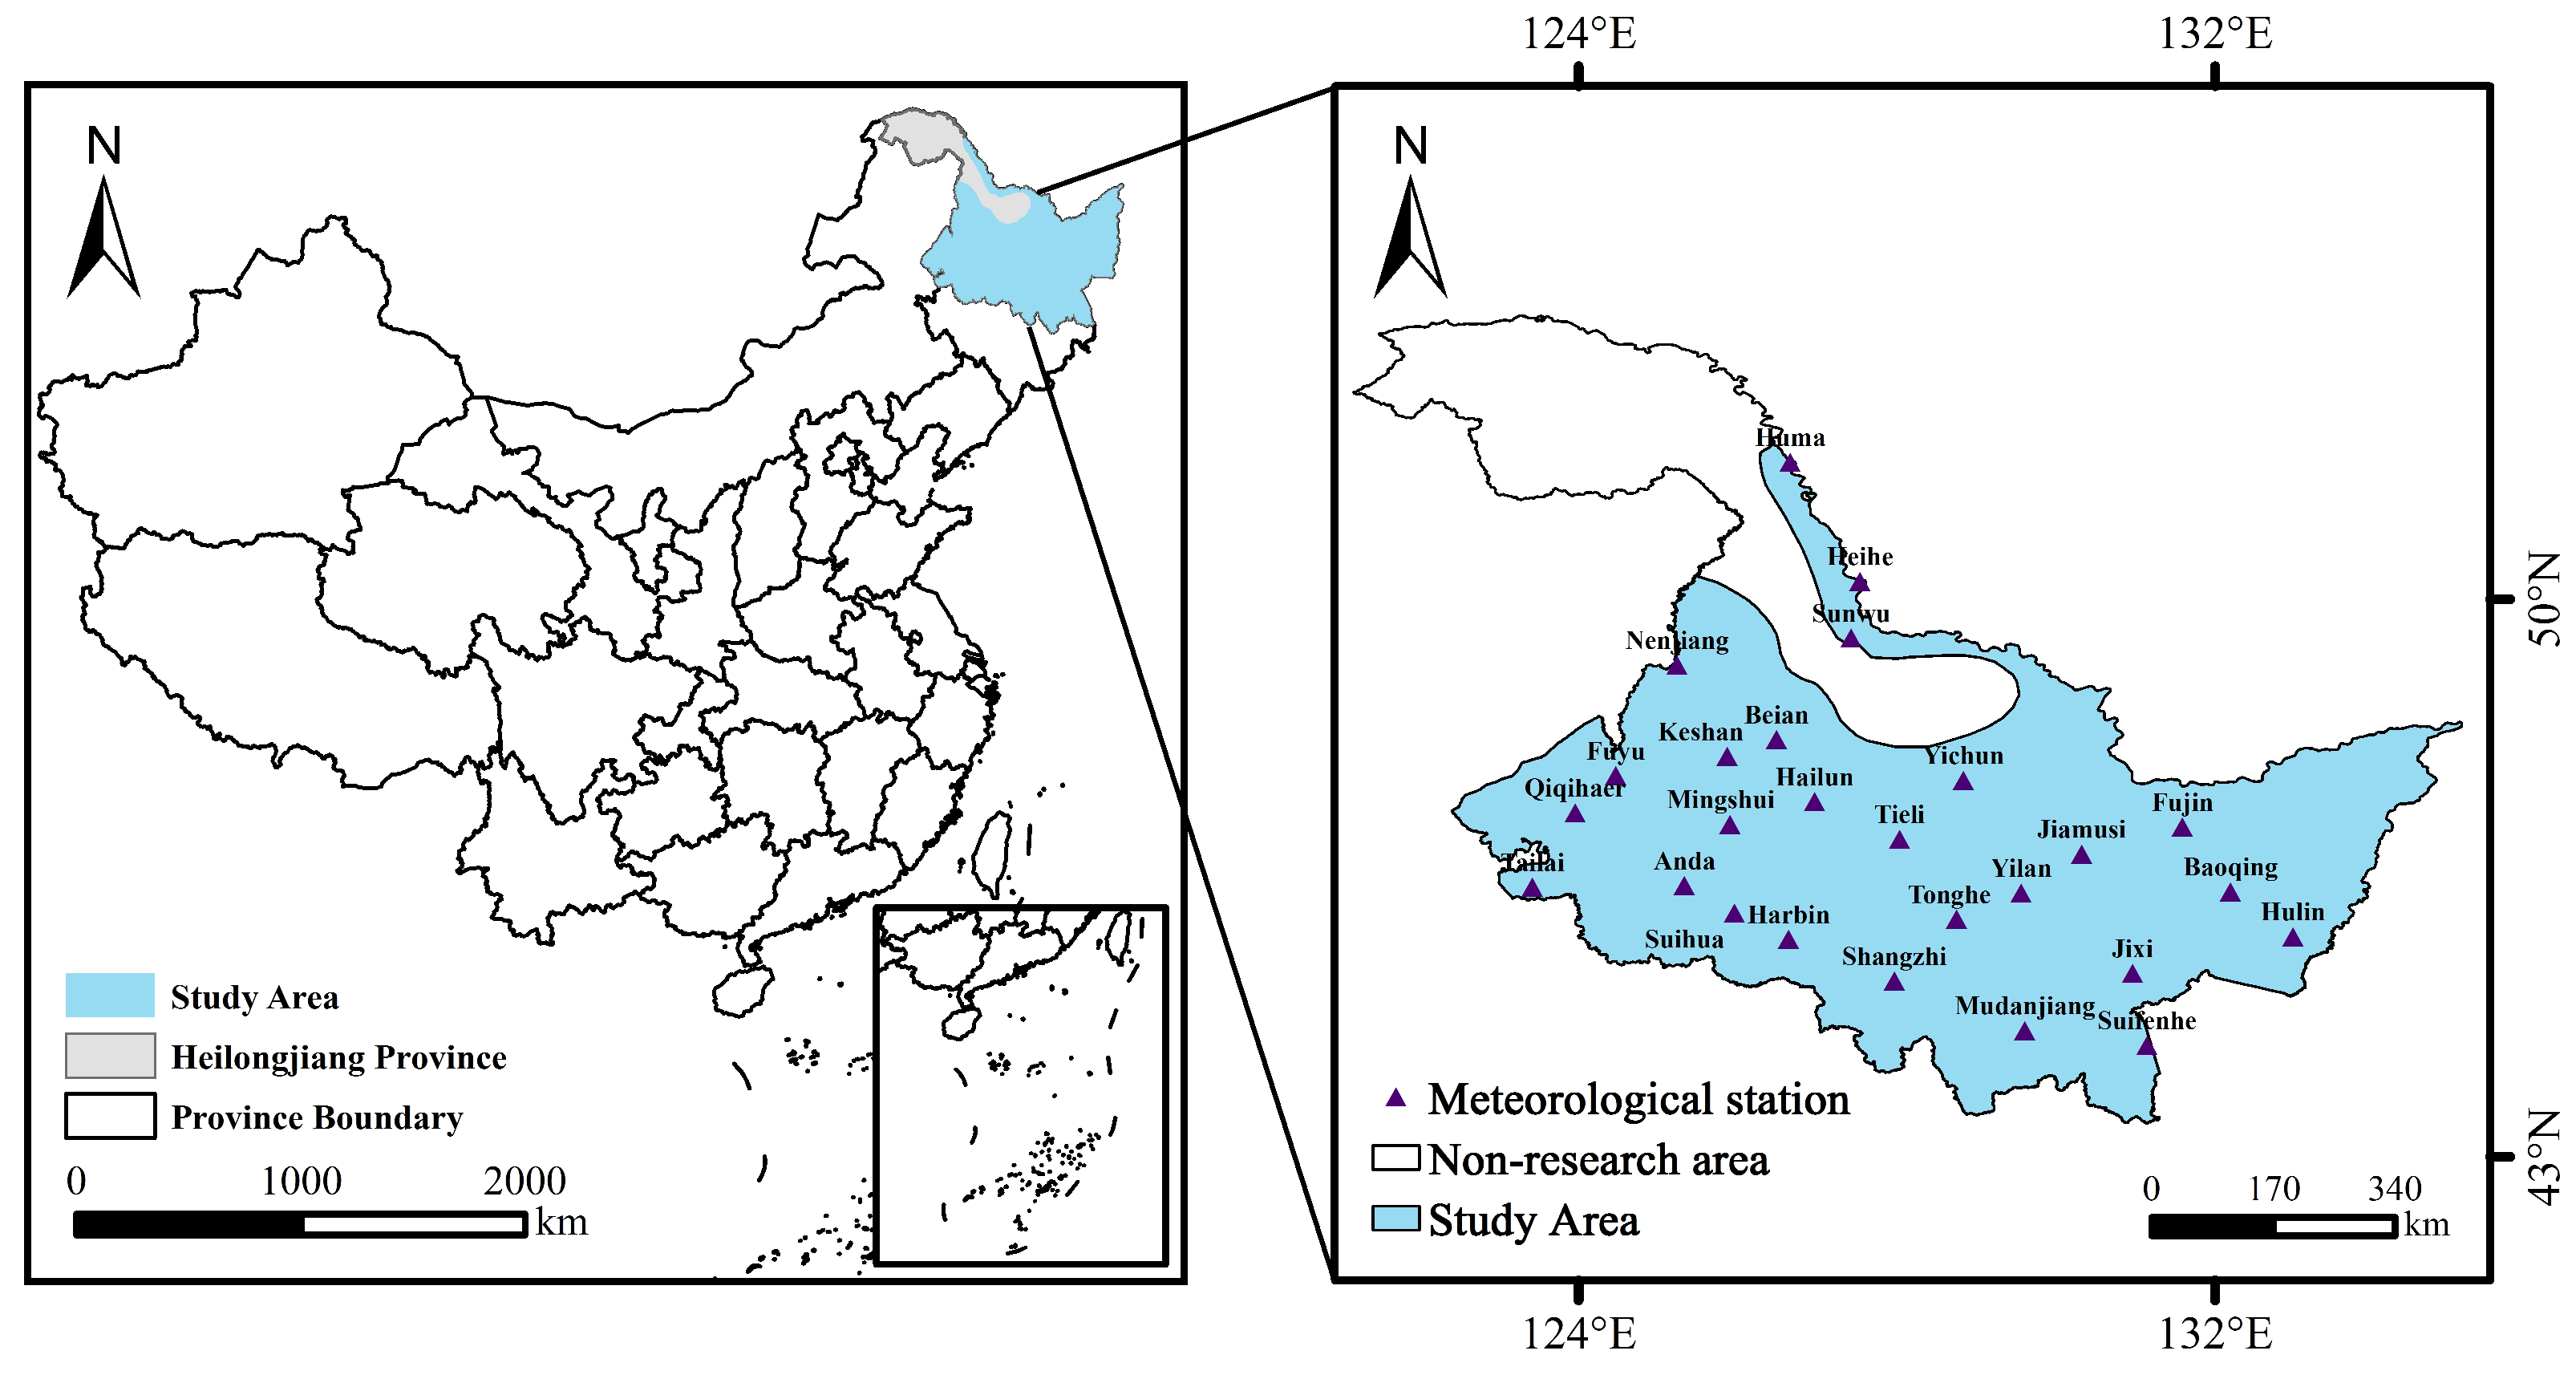
The research area is situated in Heilongjiang Province, China, characterized by a cold–temperate and continental monsoon climate, with an average annual temperature between 3.1 and 4.6 °C. Within this region, 26 meteorological observation stations are evenly distributed (Figure 1), and meteorological data is sourced from the China Meteorological Data Network. Heilongjiang Province represents a typical cold region with an irrigated rice system, where rice production is highly dependent on irrigation and sensitive to temperature and precipitation variability.
Figure 1.
Map of the study area and distribution of meteorological stations.
Future meteorological data are generated by inputting 60 years of historical meteorological data into the LARS-WG random weather generator, utilizing the regional downscaling method for calculations. To mitigate the uncertainties associated with tools for studying global climate, this paper employs average values derived from four models: MIRCO5, EC-EARTH, HadGEM2-ES, and MPI-ESM-MR. Data on the various growth stages of rice are taken from Research on Rice Irrigation Trials and Regional Irrigation Evaluation in Heilongjiang Province. To enhance the dataset’s accuracy, it incorporates two scenarios: one in which the radiative forcing level reaches 4.5 W/m2 (RCP4.5) and another in which the radiative forcing level reaches 8.5 W/m2 (RCP8.5). The CO2 concentrations are derived from the RCP concentration dataset, and the ppm values selected for different time periods in the AquaCrop model are shown in Table 1.
Table 1.
CO2 concentrations applied during the simulation period.
Different GCMs exhibit varying sensitivities to climate variables such as air temperature increases, Pe changes, and Rn changes. Relying on a single model would result in significant variability in the simulated outcomes for rice yield, ETc, Ir, and WUE, leading to a wide range of prediction uncertainty. An ensemble mean of four GCMs was adopted to reduce uncertainty associated with individual climate model projections. SSPs emphasize assumptions regarding socioeconomic drivers, governance structures, and technological developments; these assumptions are complex and vary significantly across models [29]. In contrast, RCPs, as climate physical pathways, are classified by radiative forcing values, offering clearer physical quantification that does not rely on socioeconomic assumptions. They provide greater operational flexibility and standardization advantages in the simulation of climate physical variables such as air temperature and Pe, thereby reducing uncertainty in research [30] (Table 2).
Table 2.
Information tables for four global meteorological models.
2.2. Future Climate Generation
Future climate data is generated using the LARS-WG stochastic weather generator. The climate generation process consists of the following three steps: (1) Model Calibration: The “Site Analysis” function is used to analyze the statistical characteristics of historical meteorological parameters Tmax, Tmin, Pe, and Rn, and stores them in corresponding parameter files. (2) Model Validation: During the model calibration process, synthetic meteorological data with the same statistical characteristics as the historical meteorological data is generated using the parameter files derived from the historical meteorological data. By comparing the statistical characteristics of the historical meteorological data with those of the synthetic meteorological data, the simulation capability and applicability of the LARS-WG model were evaluated. (3) Generation of Synthetic Meteorological Data: Using the parameter files from the model calibration process, synthetic meteorological data corresponding to GCM climate scenarios were generated.
2.3. Calibration and Validation of the AquaCrop Model
The model is calibrated using a trial-and-error approach. This involves first running the model with default parameters, then gradually adjusting the non-conservative parameters, particularly WP and HI, that are most sensitive to yield and growth processes, so that the simulated values align as closely as possible with the observed values. During calibration, the conservative parameters are typically kept constant, and the model is repeatedly run with various parameter combinations to select the set of parameters that yields the smallest deviation in simulated yield as the final calibration result. The experimental ETc of rice for AquaCrop model calibration and validation are showed in Table 3.
Table 3.
Experimental ETc of rice for AquaCrop model calibration and validation.
2.4. Calculation of Water Requirement and Yield for Rice
In this study, seasonal evapotranspiration simulated by AquaCrop is defined as ETc and is used to represent ETc during the rice growing season. the Penman–Monteith model recommended by FAO is adopted to calculate the daily reference evapotranspiration (ET0) of 26 stations in Heilongjiang Province. The calculation formula is as follows:
In the formula, ET0 denotes potential evapotranspiration measured in millimeters (mm). signifies the slope of the temperature relative to saturated water vapor pressure, expressed in kilopascals per degree Celsius (kPa/°C). Rn represents net surface radiation, quantified in megajoules per square meter per day (MJ/(m2·d)). G indicates soil heat flux, also measured in megajoules per square meter per day (MJ/(m2·d)). The symbol refers to the hygrometer constant, given in kilopascals per degree Celsius (kPa/°C). The u2 denotes wind speed at a height of 2 m above the ground, measured in meters per second (m/s). Additionally, es represents saturated vapor pressure in kilopascals (kPa), while ea indicates actual vapor pressure, also in kilopascals (kPa). Lastly, T denotes average temperature, expressed in degrees Celsius (°C).
In the AquaCrop model, the water requirement ET of rice crops consists of two parts: soil evaporation E and crop transpiration Tr.
In which
In the formulae, denotes the coefficient of reduction in evaporation under conditions of insufficient water, and represents the actual canopy coverage rate of rice crops, expressed as a percentage. The term indicates the maximum evaporation coefficient of the soil, and ET0 refers to the reference crop evapotranspiration, measured in mm/day. Additionally, signifies the coefficient specific to rice crops, and is the temperature stress coefficient, which is dimensionless. Finally, represents the transpiration coefficient of rice crops under optimal conditions.
Rice yield () is calculated based on biomass (B) and harvest index (HI), and the specific formula is as follows:
In the formula, WP represents the water production efficiency of rice, kg·m−3; Tr represents the transpiration of rice crops, in mm.
Ir was calculated using the water balance equation. The formula is as follows:
In the formula, Ir represents irrigation water, mm; represents changes in crop root zone water storage, mm; Pe represents precipitation, mm; G represents groundwater recharge, mm; ETc represents the water requirement of crops, mm; D represents deep percolation, mm; R represents surface runoff, mm; L represents lateral seepage, mm.
2.5. Calculation of Water Use Efficiency
WUE is defined as the mass of dry matter produced per unit weight of water evaporated and consumed by agricultural crops, expressed in kg·m−3. The formula is as follows:
In the formula, Y represents the yield of the crop, t·ha−1; ETc represents the water requirement of crops, mm.
2.6. Performance Evaluation of the Model
In this research project, four different evaluation metrics were utilized. Root mean square error (RMSE), normalized root mean square error (NRMSE), the Nash–Sutcliffe model efficiency coefficient (EF), and Willmott’s determinative agreement index (d) were used as performance metrics for the model in relation to simulating water needs and yields of rice crops. These evaluation results indicate that AquaCrop performs satisfactorily in simulating rice yield and ETc in the study area.
In the formulae, Si and Mi (i = 1,2,…, n) represent the simulated and measured values, respectively, while and denote the average values of the measured and simulated values. In this case, n indicates how many parameters were used in a study. There is a root mean square error (RMSE), which can be anywhere between 0 and +∞. A lower RMSE indicates better model performance while a larger RMSE indicates worse model performance. The normalized root mean square error (NRMSE) should ideally be below 10%. An NRMSE between 10% and 20% is acceptable; an NRMSE between 20% and 30% is acceptable; an NRMSE that exceeds 30% indicates that very poor simulated results are expected. The Nash–Sutcliffe coefficient should approach 1, indicating that the simulated results have very few residual values and therefore represent a very good fit in the model. The d value will always be in the range from 0 to 1. Increases towards 1 are indicative of better model performance.
2.7. Pearson’s Correlation Coefficient Method
The Pearson correlation coefficient quantifies the relationship between two variables, X and Y. Its values range from −1 to 1. A coefficient r between 0 and 1 signifies that variable Y increases as variable X increases. Conversely, a coefficient between −1 and 0 indicates that variable Y decreases as variable X increases. The absolute value of the correlation coefficient r reflects the strength of the correlation; larger absolute values correspond to stronger correlations. This paper employs the Pearson correlation coefficient to investigate the relationships among rice yield, water requirements, and various meteorological factors.
In the formula, represents the values of each meteorological factor, is their average value, is the output and water demand, and is their average value. The Pearson correlation analysis was conducted at a significance level of p < 0.05 using spss25.0.
2.8. Meteorological Factor Climate Tendency Rate
In this study, the least squares method was employed to compute the climate trend rates of minimum air temperature (Tmin), maximum air temperature (Tmax), Pe, Rn, and ET0 across 26 meteorological stations within the study area. The univariate linear regression equations for Yi and Xi are established as follows:
In the formula, A and B represent regression constants, while A × 10 denotes the climate trend rate, which indicates the rate of change for each meteorological factor over a decade (10a). A positive value signifies an increase in the meteorological factor within the corresponding time series, whereas a negative value reflects a decline.
2.9. Data Processing
The future daily climate data from 26 meteorological stations within the study area were generated by employing the LARS-WG random weather generator, which operates through a regional downscaling method. Reference crop evapotranspiration (ET0) was calculated using the Penman–Monteith model, as recommended by the Food and Agriculture Organization of the United Nations, by inputting essential variables such as Tmin and Tmax. The change rates for ET0, Tmax, Tmin, Pe, and Rn were determined using Matlab2021a. Based on inputting meteorological, crop, soil, and management data into the AquaCrop model after calibration and validation to simulate rice growth and development, crop yield and water requirements were established. ArcMap 10.4 (ESRI, Redlands, CA, USA) was also used for performing the spatial analysis of each variable. Spatial interpolation was performed for each variable through the use of various methods such as Inverse Distance Weighted (IDW) and recoding, and a spatial resolution of 500 dpi was used. The correlation of Pearson’s correlation coefficient was also used to assess the relationships between rice yield, water requirements, and other variables, along with variations in the meteorological factors.
3. Results
3.1. Performance Evaluation of the AquaCrop Model
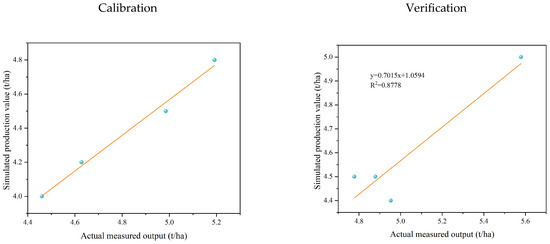
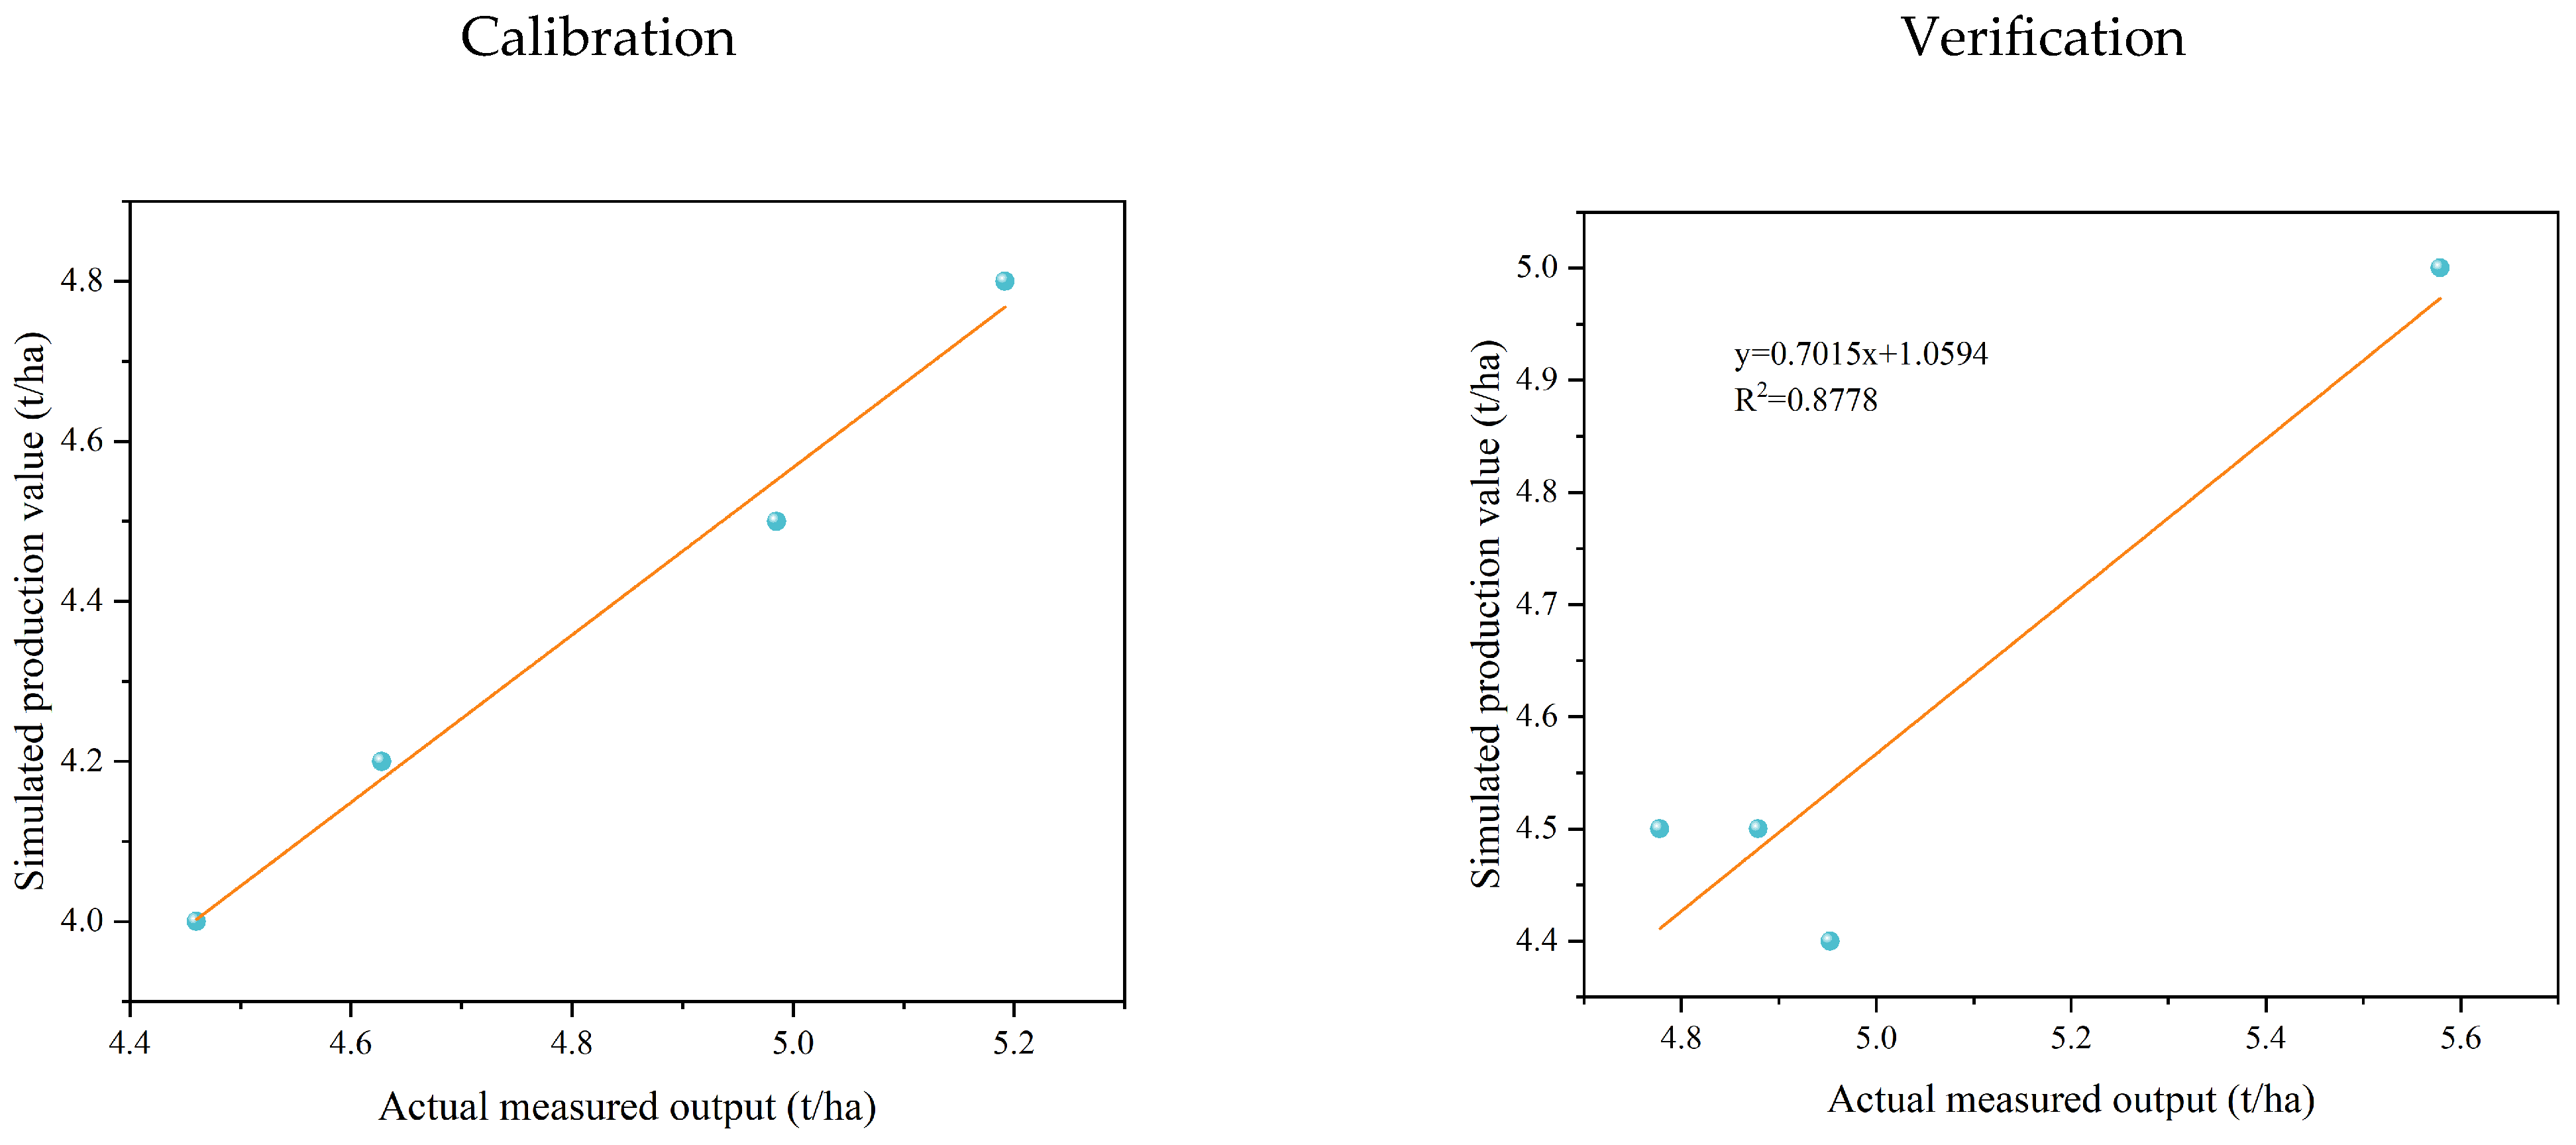
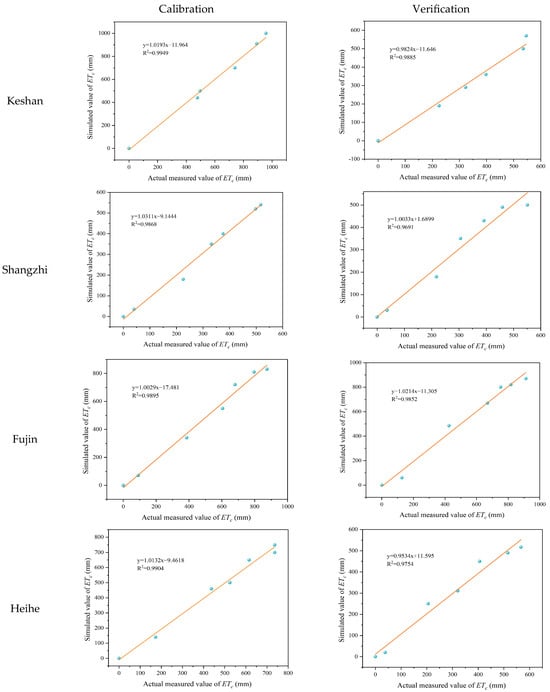
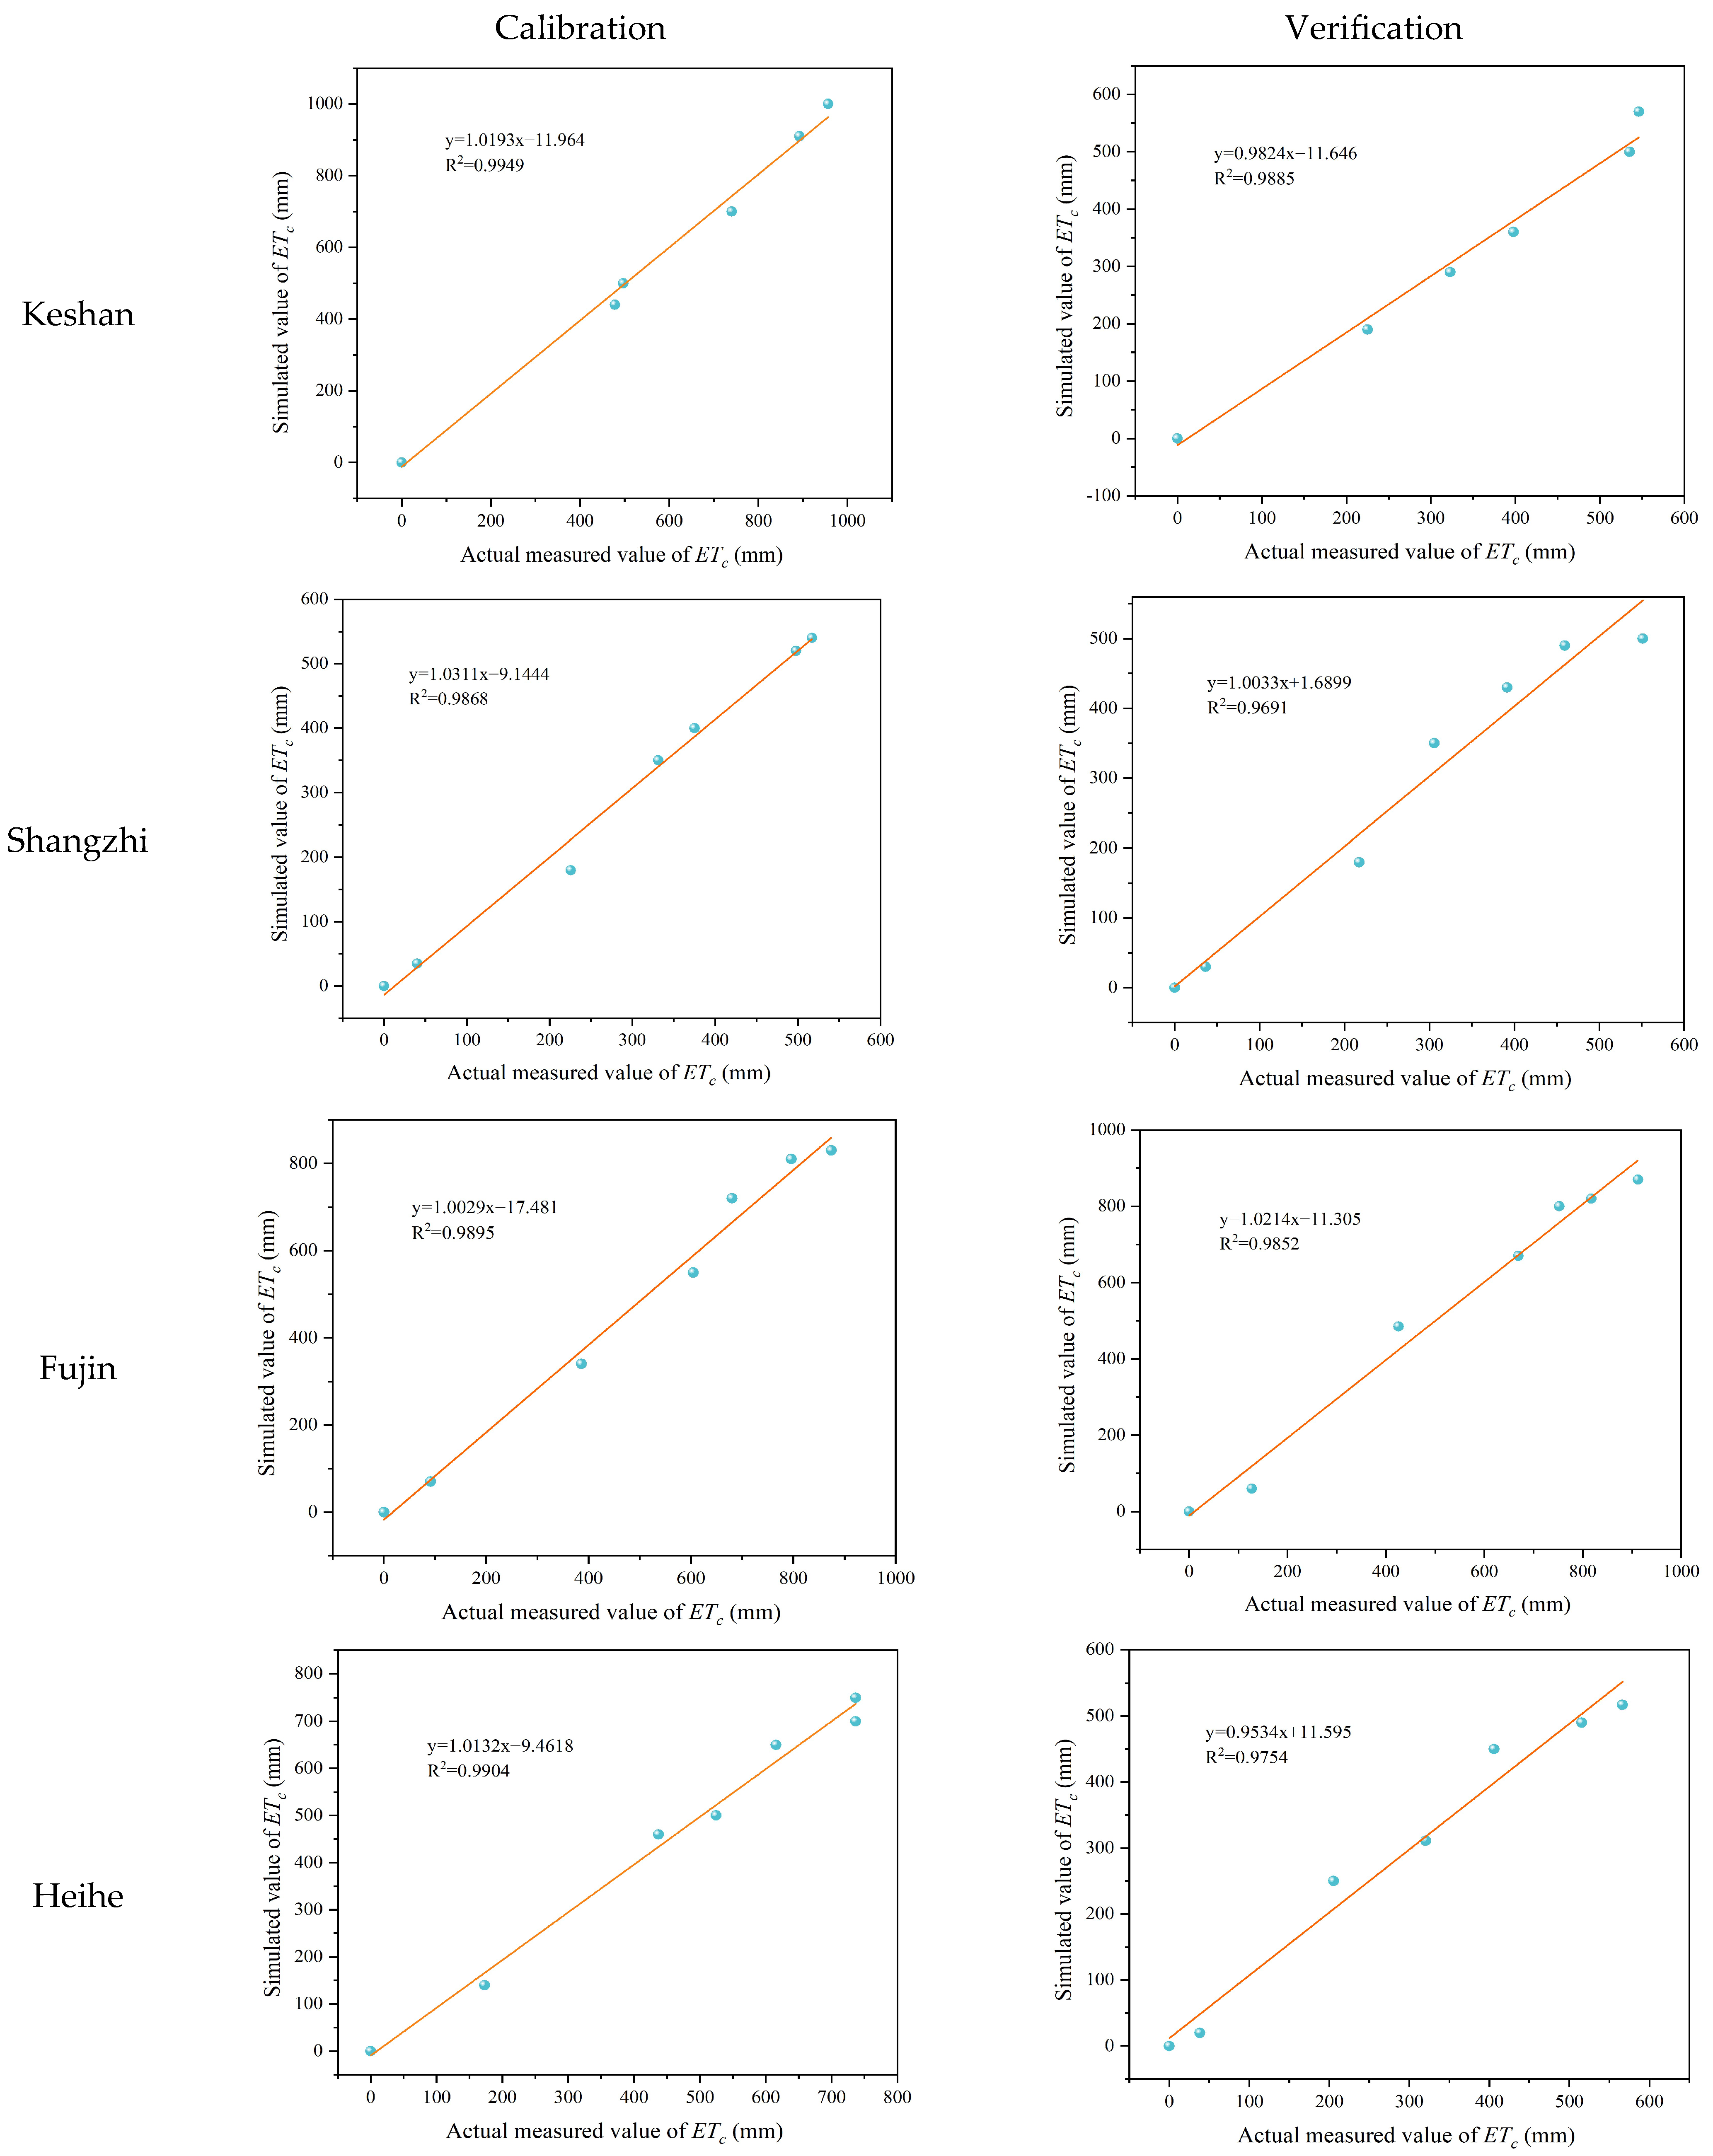
The calibration and verification of rice yield and water requirements in Heilongjiang Province, based on the AquaCrop model, are illustrated in Figure 1 and Figure 2. Four representative stations—Keshan, Shangzhi, Fujin, and Heihe—were selected for this purpose. The measured production volumes for Keshan, Shangzhi, Fujin, and Heihe used to calibrate the model were 4.99 t·ha−1, 5.19 t·ha−1, 4.46 t·ha−1, and 4.63 t·ha−1, respectively. The calibrated simulated yields produced by the AquaCrop model were 4.51 t·ha−1, 4.80 t·ha−1, 4.11 t·ha−1, and 4.23 t·ha−1, respectively. The calibration verification results indicate that the model’s simulated outputs were lower than the measured outputs. Evaluation using four coefficients demonstrated good simulation performance. The R2 values for the rice yield determination coefficients were 0.99 and 0.88, respectively. Additionally, the discrepancy between simulated and measured values of cumulative water requirements during the rice growth period for each treatment was less than 50 mm. Among the four treatment groups in the verification phase, the simulation results of this model for rice were deemed reasonable and reliable (Figure 3). Consequently, the yield simulation results of the AquaCrop model under various irrigation schemes at different stages of rice growth are considered reliable and applicable to the study area (Table 4 and Table 5).
Figure 2.
Calibration and verification of measured and simulated values of rice field test yield in Heilongjiang Province.
Figure 3.
Calibration and verification results of the measured and simulated values of the accumulated ETc demand at each growth stage of the rice field experiment in Heilongjiang Province.
Table 4.
The fitting parameters of the evaluated AquaCrop model to simulate the experimental yield of rice in Heilongjiang Province.
Table 5.
The fitting parameters of the evaluated AquaCrop model to simulate the experimental ETc of rice in Heilongjiang Province.
3.2. Projected Climatic Changes
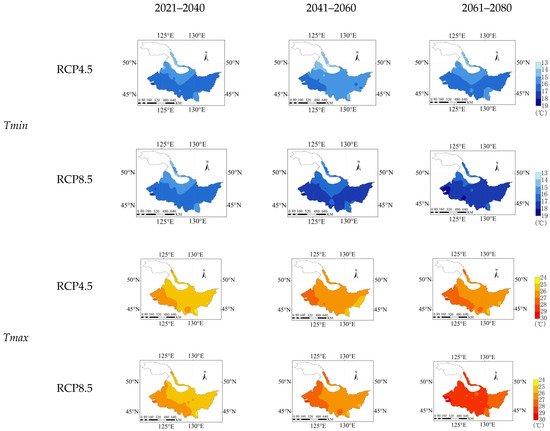
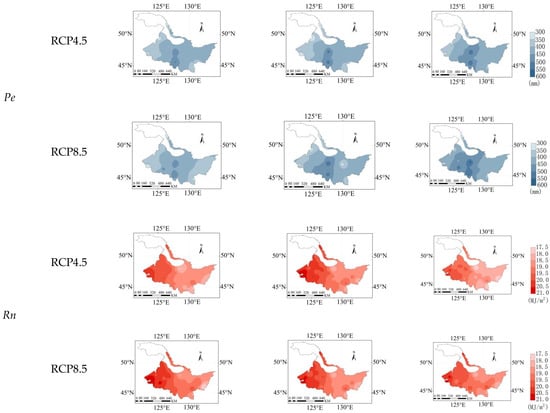
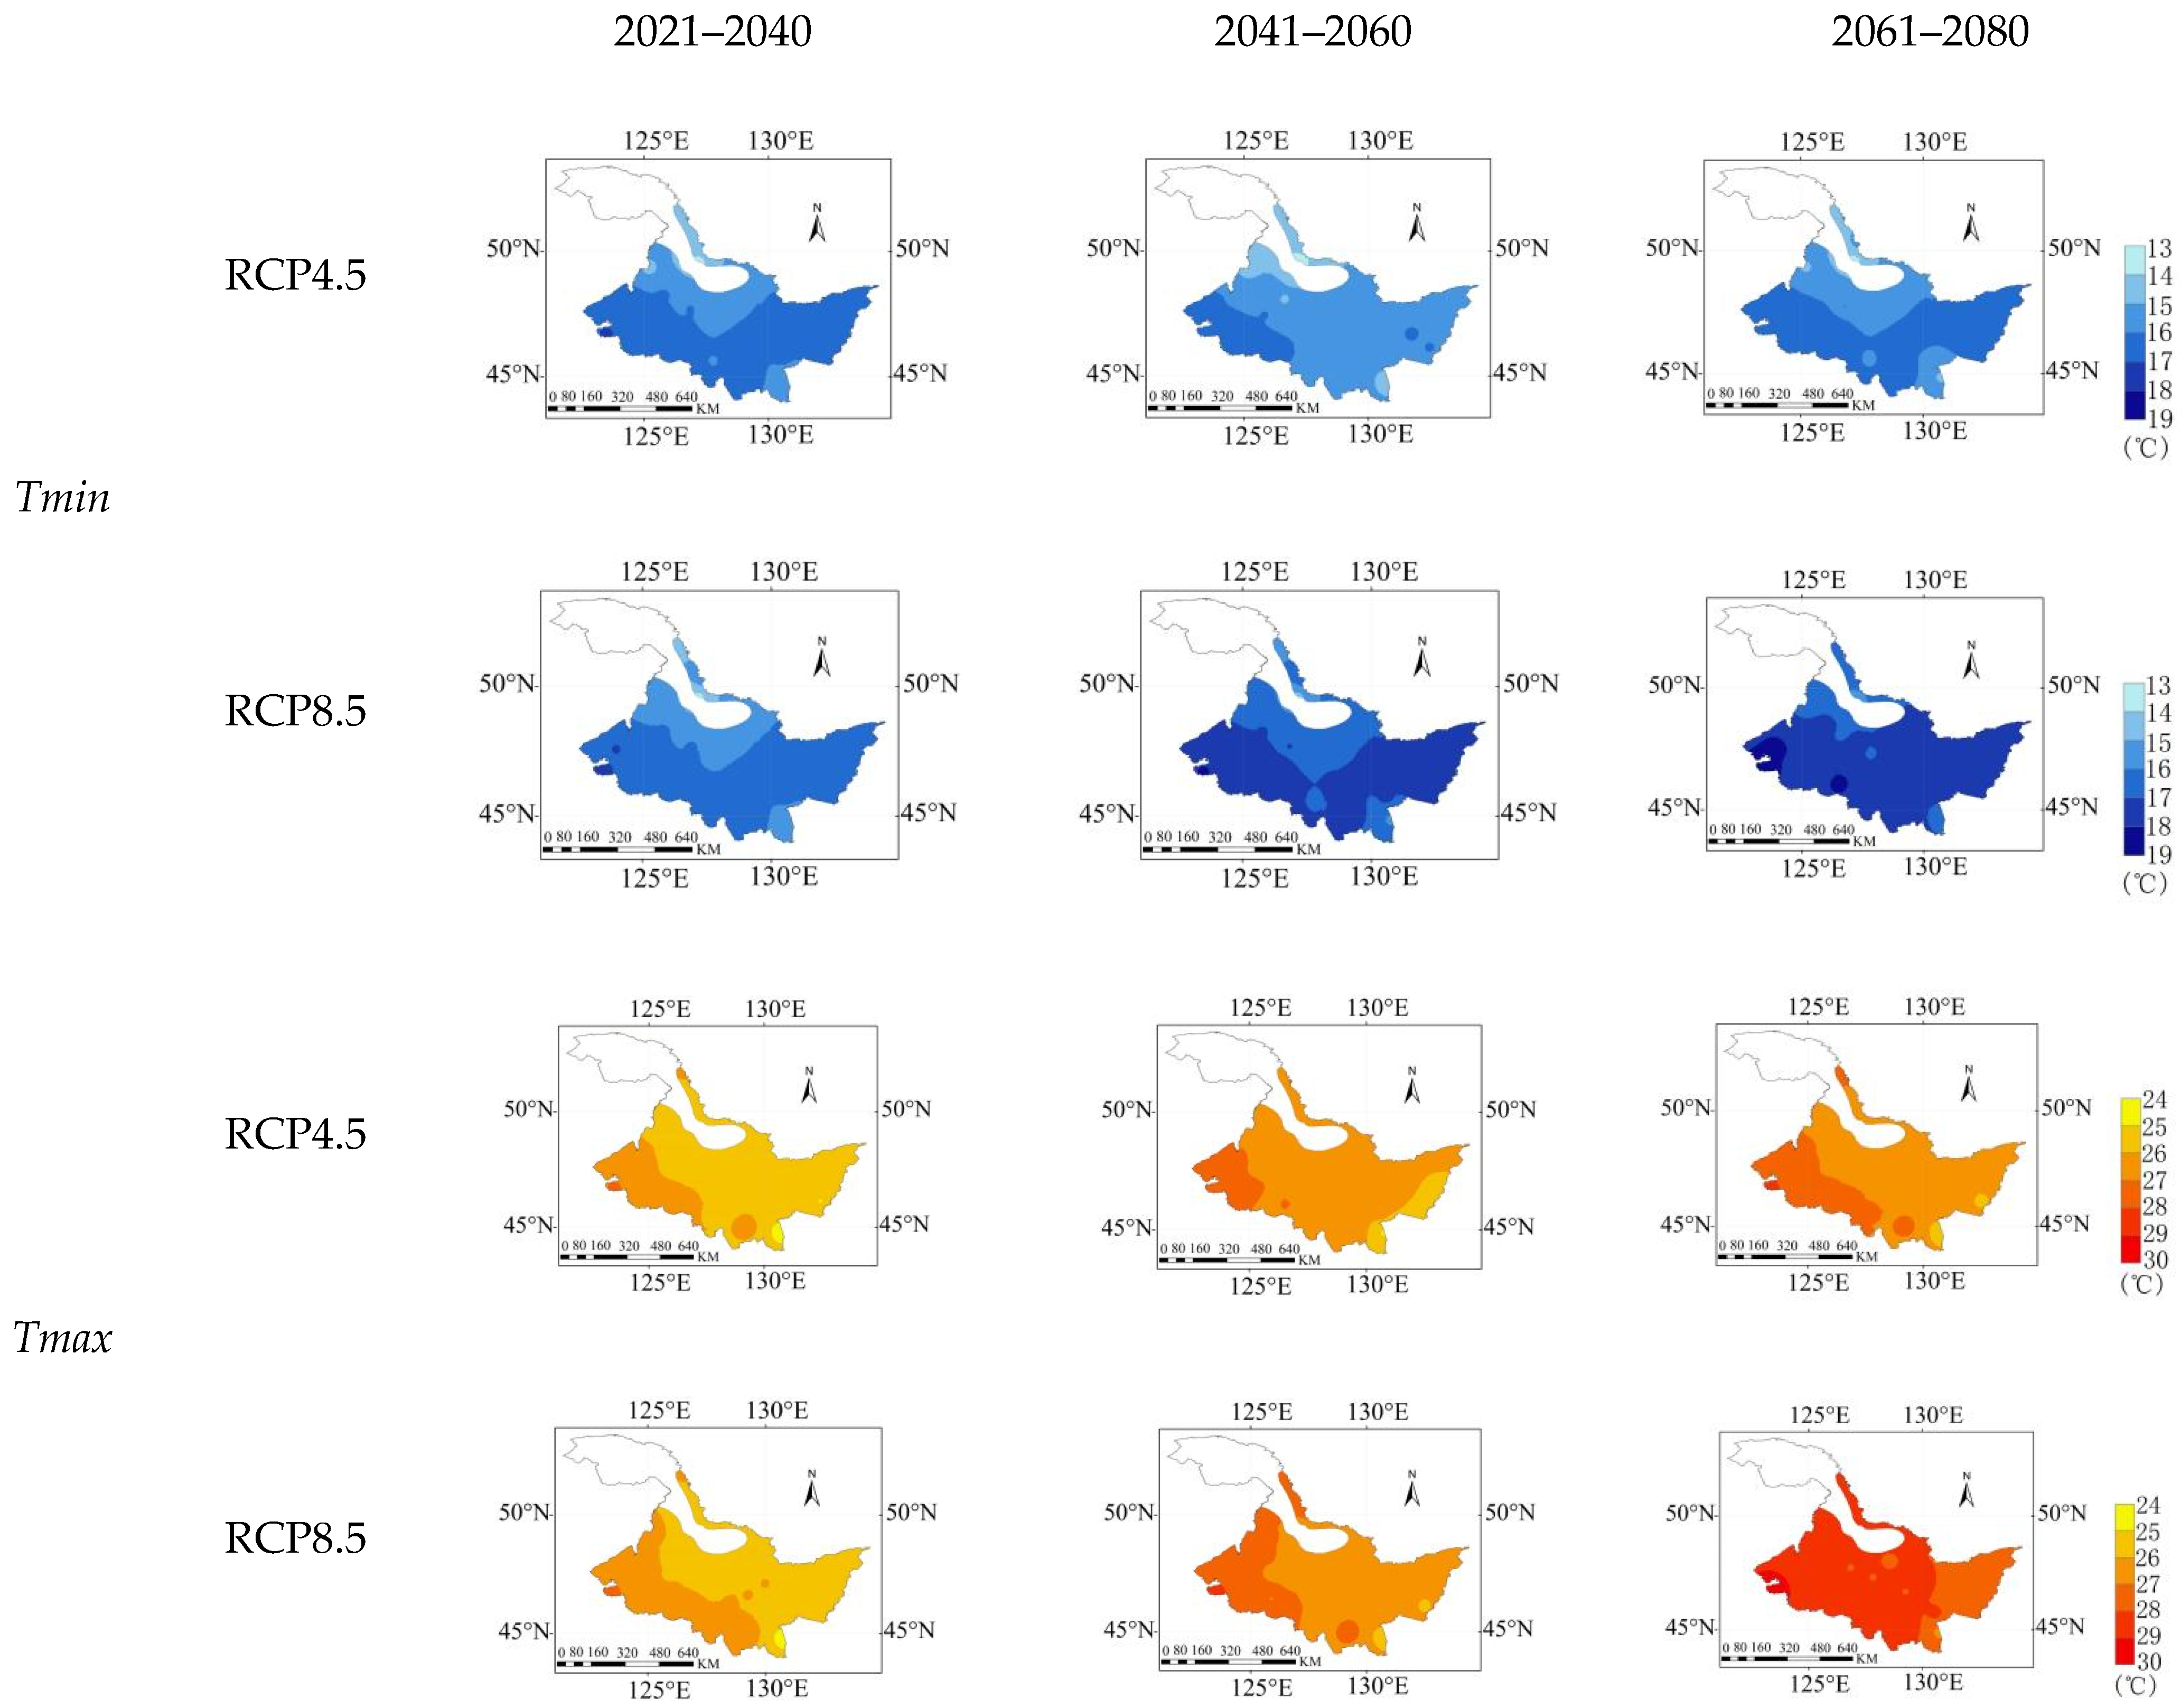
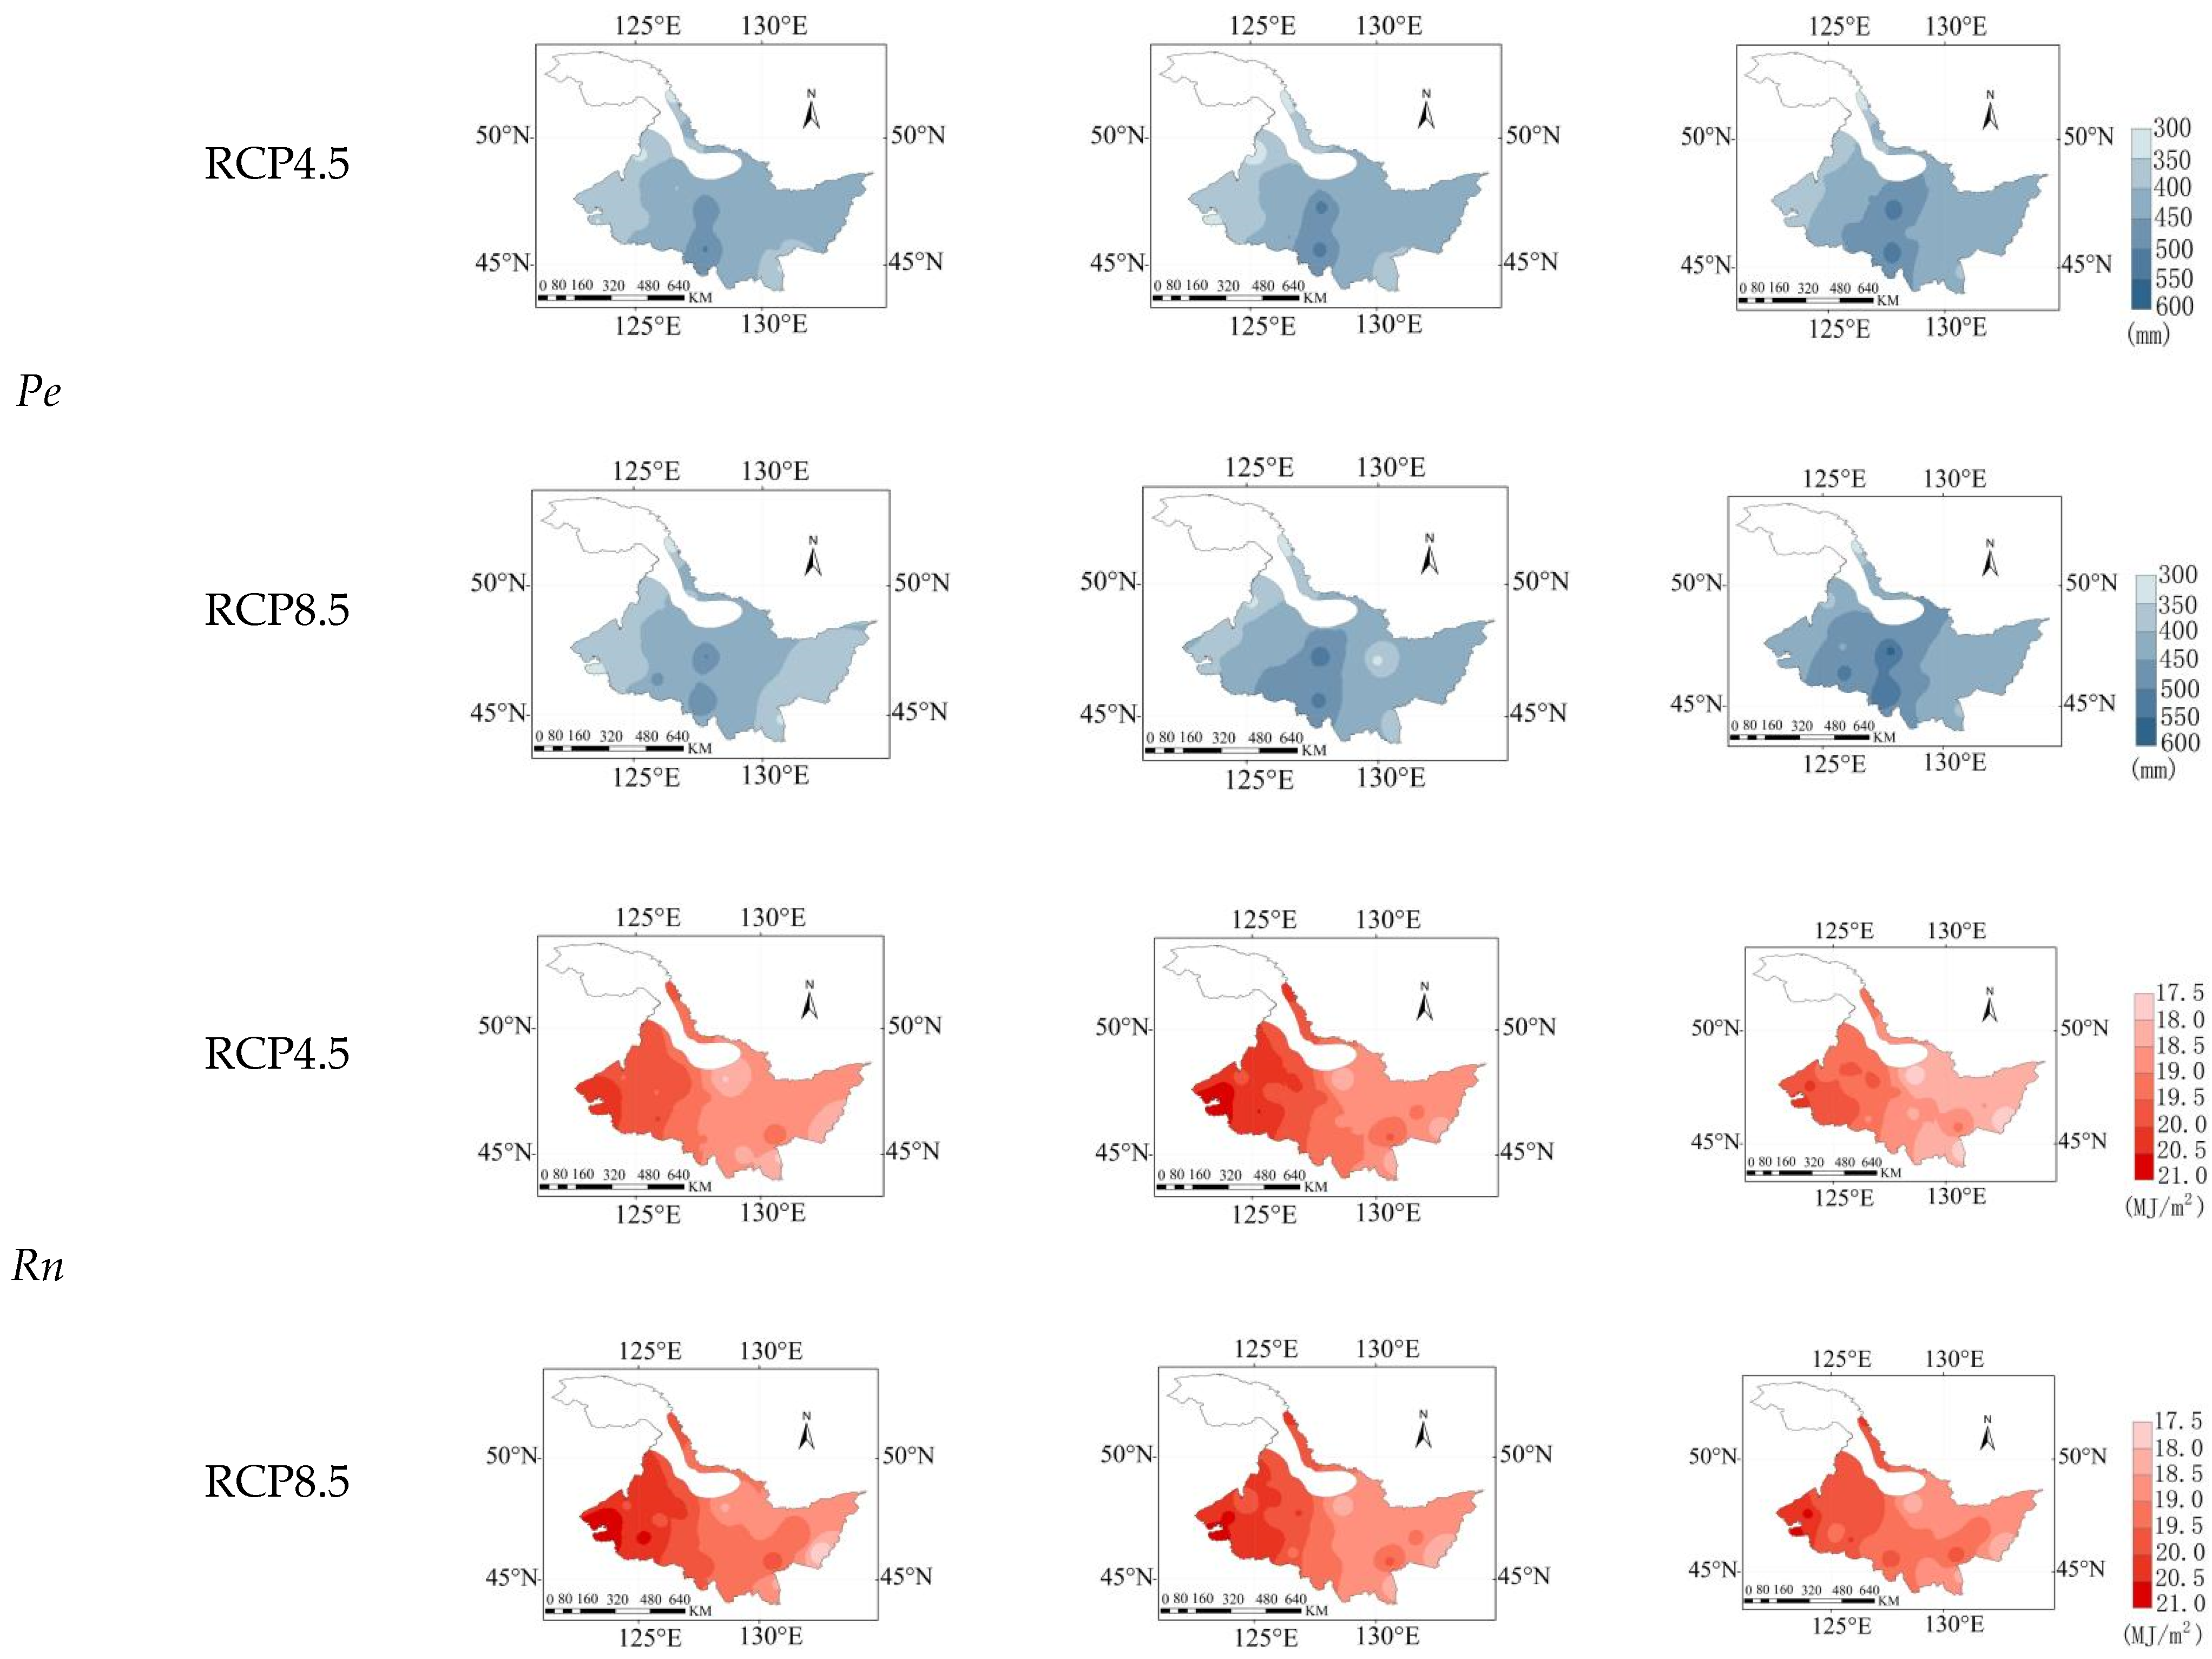
During the rice growing season in Heilongjiang Province from 2021 to 2080, future climate change will exhibit a warming and moistening trend. The average Tmin under RCP4.5 and RCP8.5 scenarios is 15.45 °C and 16.09 °C, respectively; the average Tmax under both scenarios is 26.44 °C and 27.06 °C. The highest values for both Tmin and Tmax occur between 2061 and 2080. Pe shows an increasing trend, with average values of 412.02 mm and 423.70 mm under RCP4.5 and RCP8.5 scenarios, respectively. Rn exhibits smaller variations, averaging 19.38 MJ·m−2 and 19.24 MJ·m−2 under RCP4.5 and RCP8.5 scenarios, with RCP8.5 slightly lower than RCP4.5 (Figure 4). Overall, the warming and humidification under the RCP8.5 scenario are more pronounced.
Figure 4.
Spatial and temporal distribution of Tmin, Tmax, Pe, and Rn during rice growth period under RCP4.5 and RCP8.5 scenarios from 2021 to 2040, 2041 to 2060, and 2061 to 2080.
3.3. Spatial and Temporal Variations in Future Rice Yields, ETc, and Ir
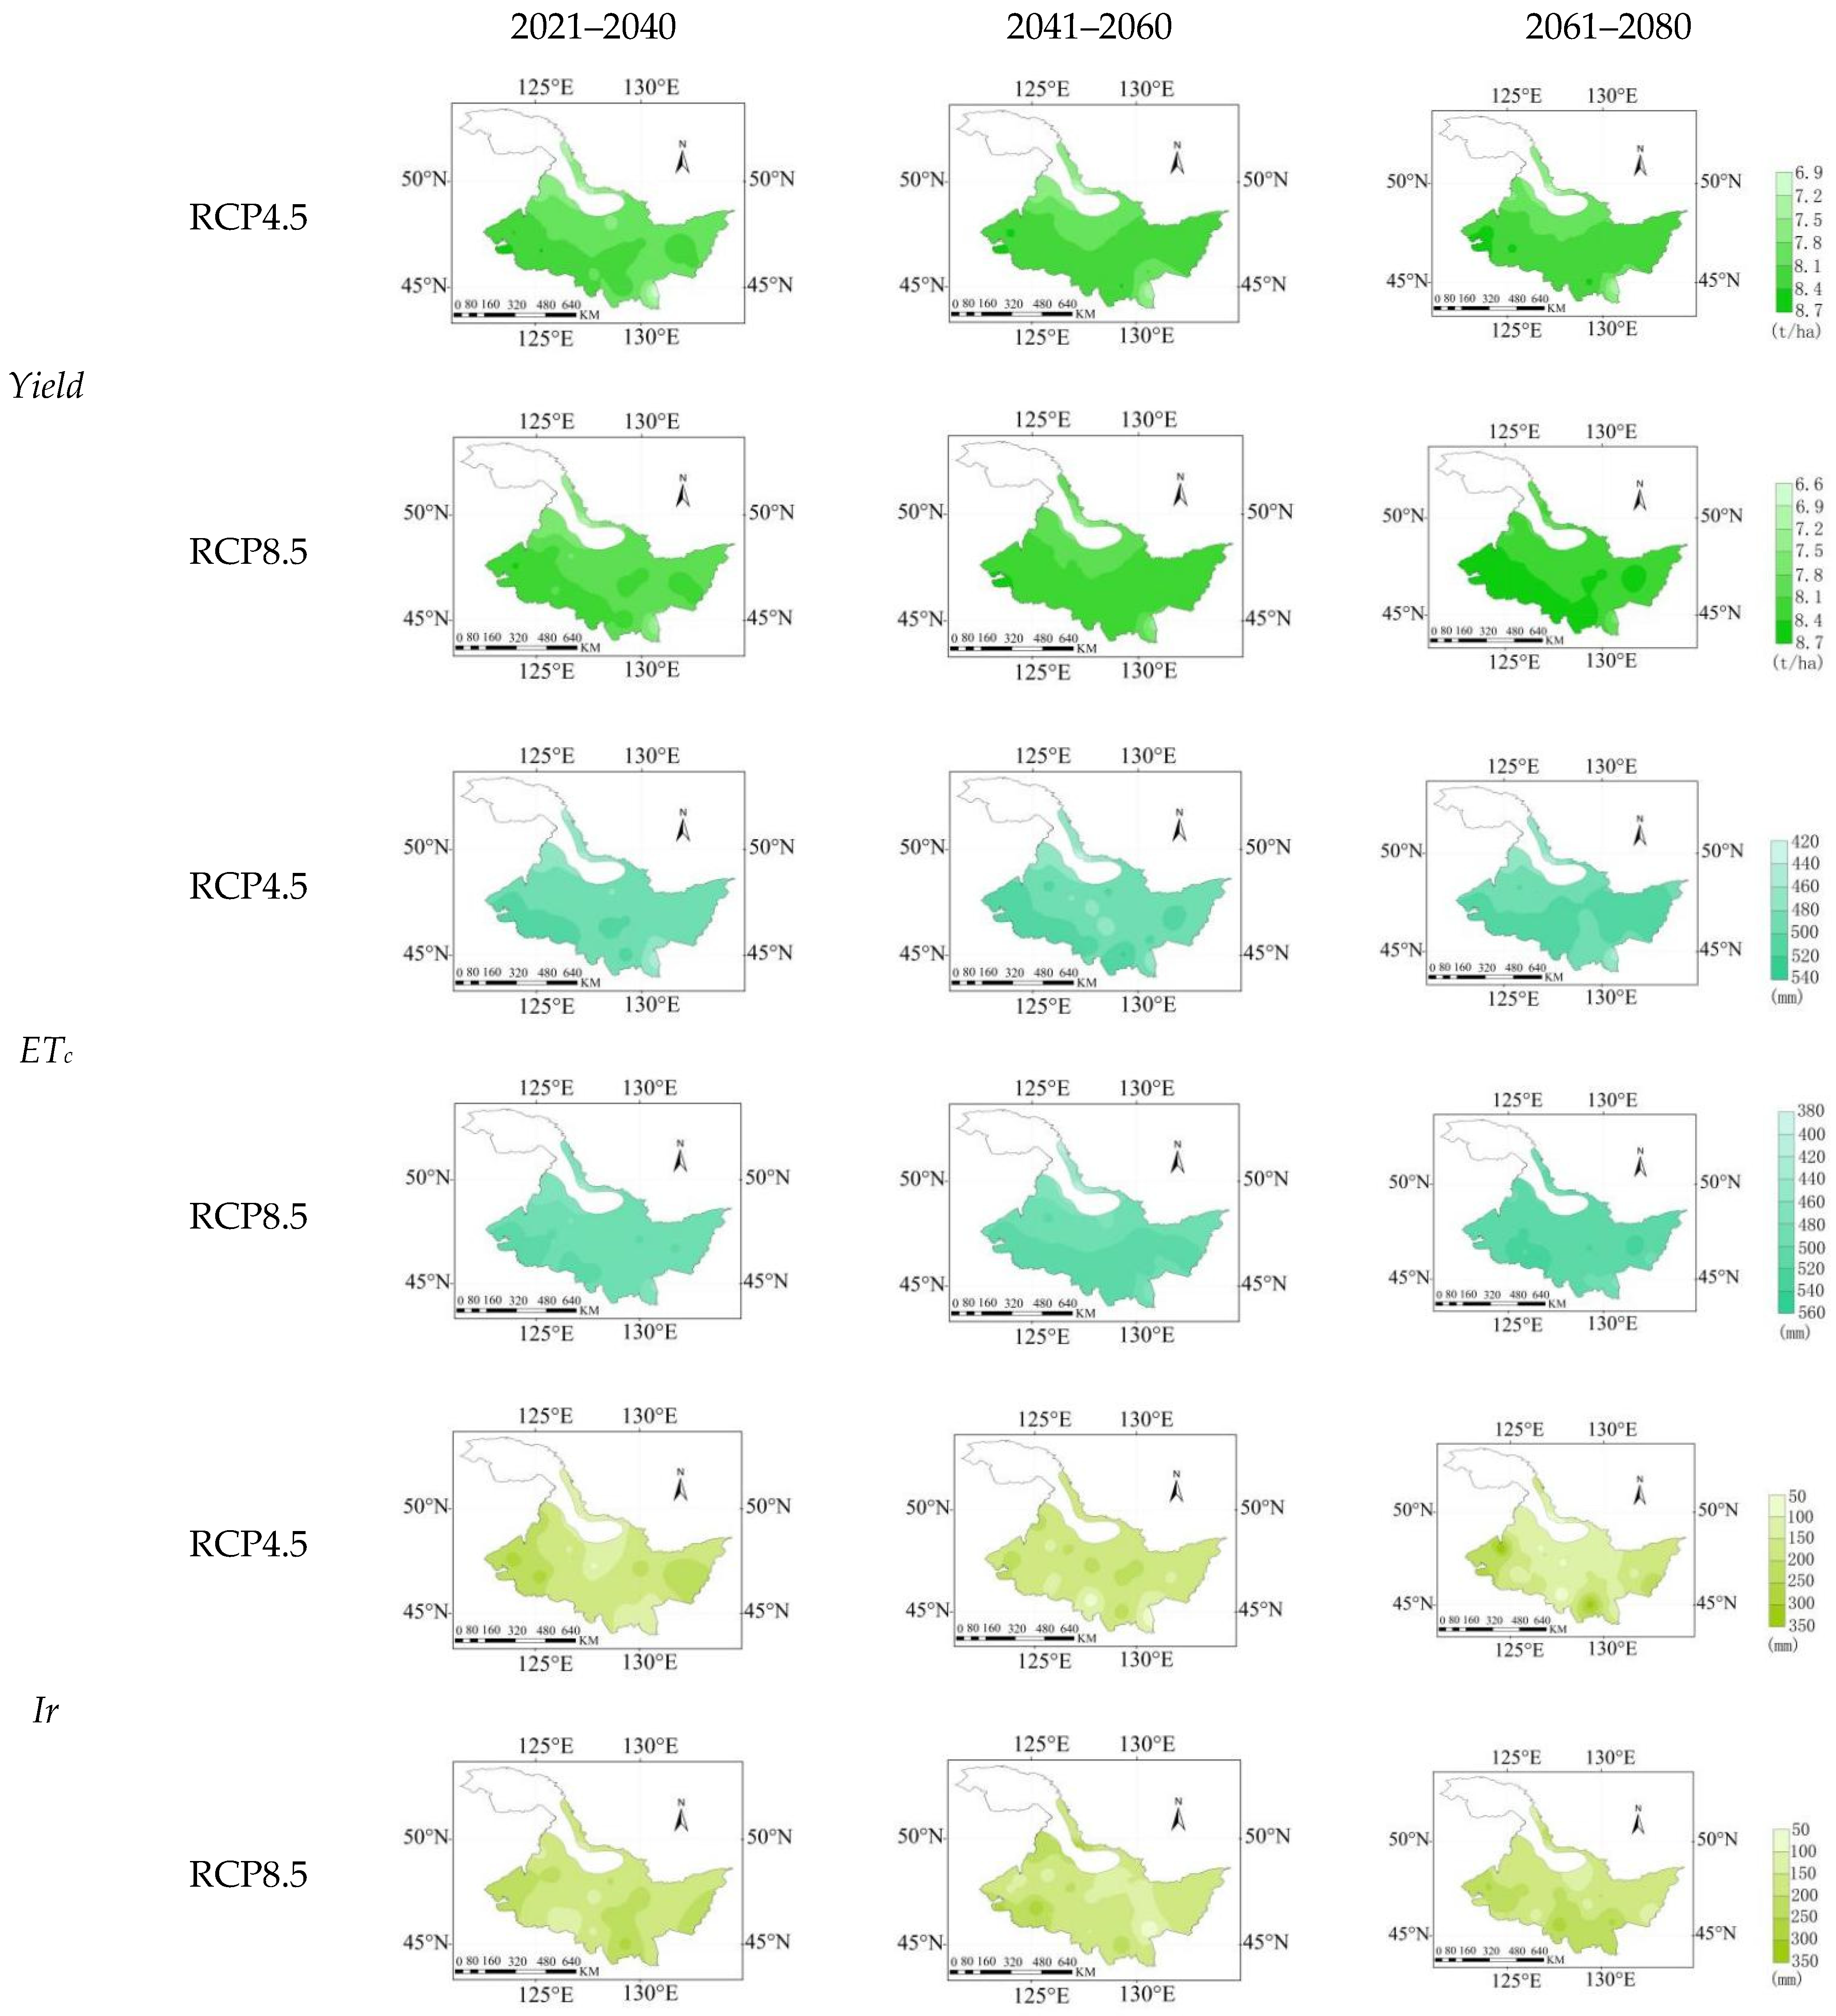
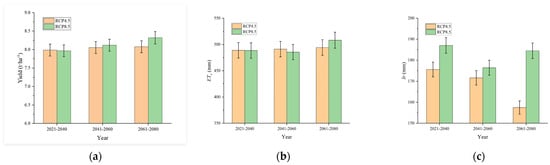
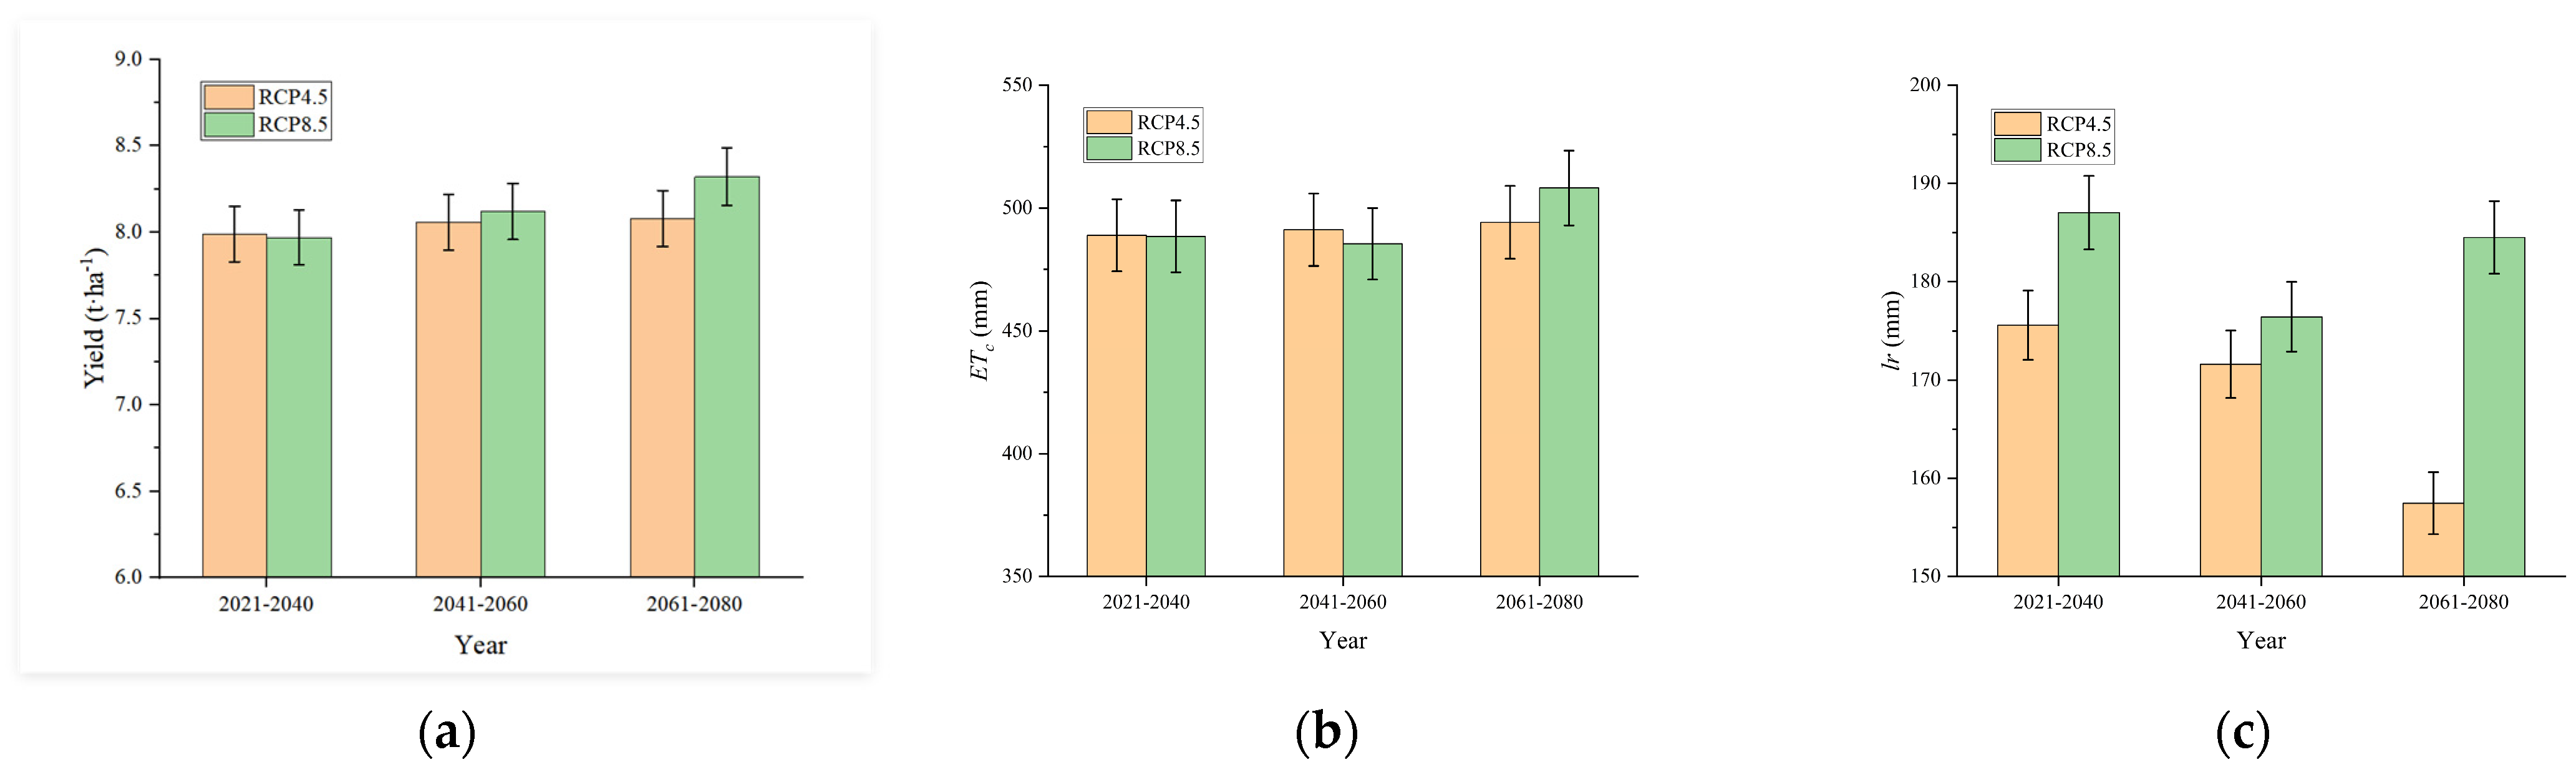
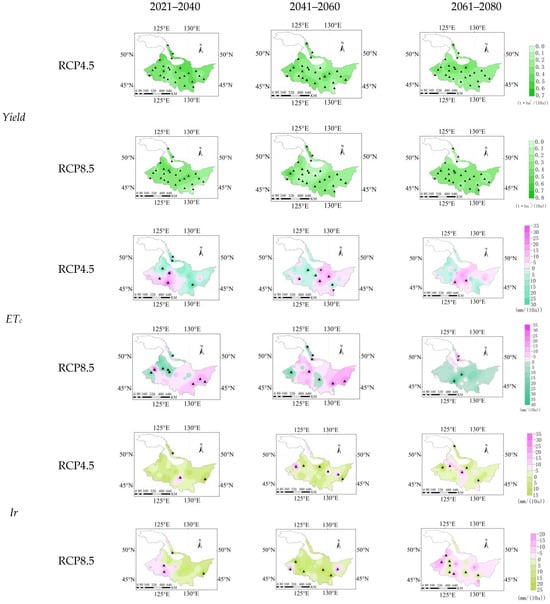
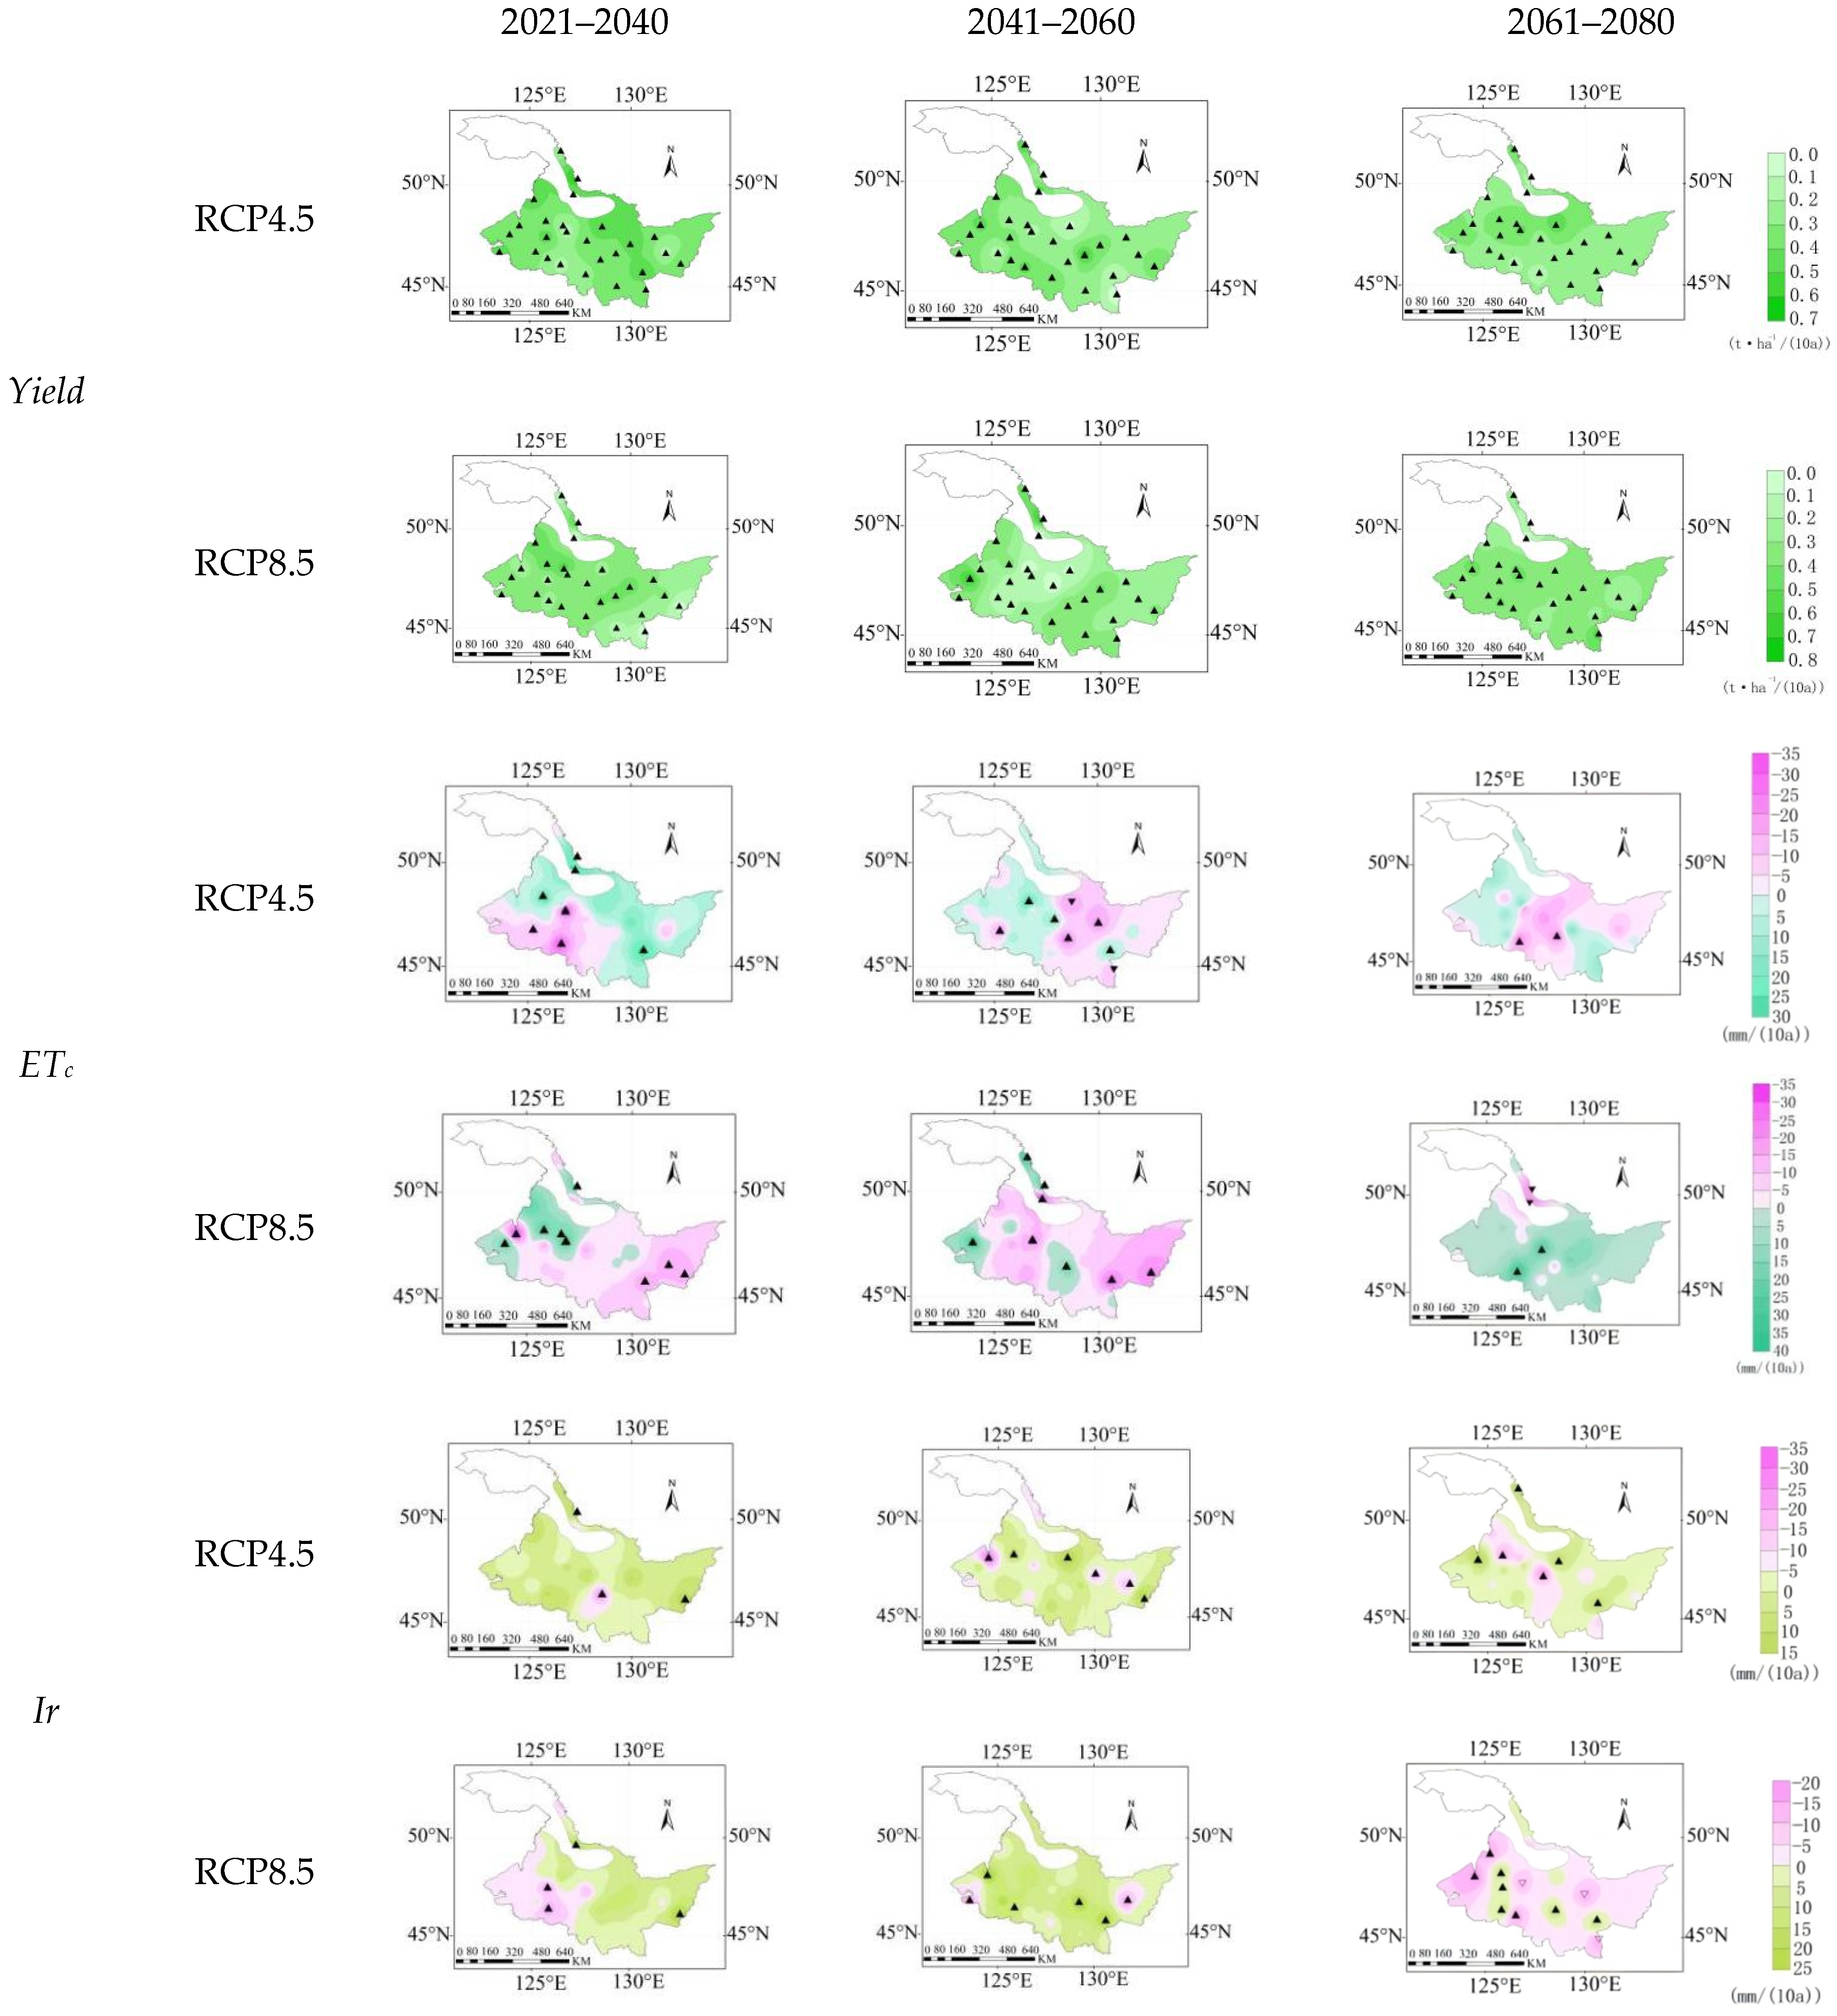
Under future climate conditions, rice yields in Heilongjiang Province are projected to increase slightly. Under the RCP4.5 scenario, the average yields for the periods 2021–2040, 2041–2060, and 2061–2080 are 7.99 t·ha−1, 8.06 t·ha−1, and 8.10 t·ha−1 (Figure 5 and Figure 6), respectively. Under the RCP8.5 scenario, the corresponding average yields are 7.97 t·ha−1, 8.12 t·ha−1, and 8.32 t·ha−1 (Figure 6). Between 2021 and 2080, the yield trend rate ranges from 0.02 to 0.64 t·ha−1/10a under RCP4.5 and from 0 to 0.72 t·ha−1/10a under RCP8.5 (Figure 6). The trend of yield increasing is projected to slow, with smaller average trend rates, but yields in high-trend areas will continue to rise. Fluctuations in yield trends may stem from interannual variations in climate, changes in the temperature–moisture regime, and the gradual weakening of the warming effect.
Figure 5.
Spatial and temporal distribution of rice yield, ETc, and Ir under RCP4.5 and RCP8.5 scenarios from 2021 to 2040, 2041 to 2060, and 2061 to 2080.
Figure 6.
Rice (a) yield, (b) ETc and (c) Ir under the RCP4.5 and RCP8.5 scenarios for the periods 2021–2040, 2041–2060, and 2061–2080.
However, yield gains are accompanied by changes in ETc and Ir. ETc show a gradual increase under both scenarios. Under RCP4.5, the average ETc for 2021–2080 is 491.40 mm; under RCP8.5, the average is 495.31 mm (Figure 6). The ETc trend rate ranges from −33.3 to 29.6 mm/10a under RCP4.5 and from −33.6 to 35.8 mm/10a under RCP8.5, with annual averages of 0.18 mm/10a and 0.16 mm/10a, respectively. Compared to the RCP4.5 scenario, the rate of ETc increase is reduced under the RCP8.5 scenario. This finding may be because high concentrations of CO2 suppress rice transpiration rates, thereby partially offsetting the increase in ETc caused by rising air temperatures. In addition, factors such as changes in Rn and a shortened growing season due to high temperatures may collectively contribute to greater interannual fluctuations in ETc under the RCP8.5 scenario, while the long-term average growth rate shows a slight downward trend.
Ir varies across different scenarios and time periods. Under the RCP4.5 scenario, Ir ranges from 50.5 to 344.75 mm during 2021–2080, with an average of 168.22 mm, exhibiting a declining trend over time with average values of 175.59 mm, 171.62 mm, and 157.46 mm for the periods 2021–2040, 2041–2060, and 2061–2080 (Figure 6), respectively. Under the RCP8.5 scenario, the Ir variation range for 2021–2080 is 53.5–303.8 mm, with an average of 182.66 mm. It exhibits a trend of decreasing initially and then increasing over time, with average values of 187.03 mm, 176.44 mm, and 184.50 mm for the three periods, respectively. Overall, Ir under the RCP8.5 scenario is greater than that under the RCP4.5 scenario.
Spatially, under both RCP4.5 and RCP8.5 climate scenarios, the high-value zones for future rice yield in Heilongjiang Province are concentrated in the southwestern region. During 2021–2060, high-yield-tendency zones primarily cluster around the Heihe area in the north, while spatial distribution becomes more evenly distributed overall from 2061 to 2080.
The spatial patterns of ETc and Ir are more complex and do not fully overlap with the high-yield zones. Spatially, ETc shows a decreasing trend in eastern regions and an increasing trend in western regions. Ir is spatially higher in western and southern regions from 2021 to 2080. This indicates that high-yield areas are not synonymous with low ETc or low-irrigation-requirement zones. Under the RCP8.5 scenario, the spatial conflict between high yields and high irrigation requirements may become more pronounced (Figure 7).
Figure 7.
Climate tendency rate of rice yield, ETc, and Ir from 2021 to 2040, 2041 to 2060, and 2061 to 2080. The triangular symbol in the figure indicates the upward trend of the relevant parameters.
3.4. Spatial and Temporal Variations in Future WUE
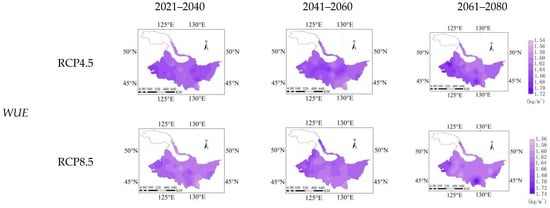
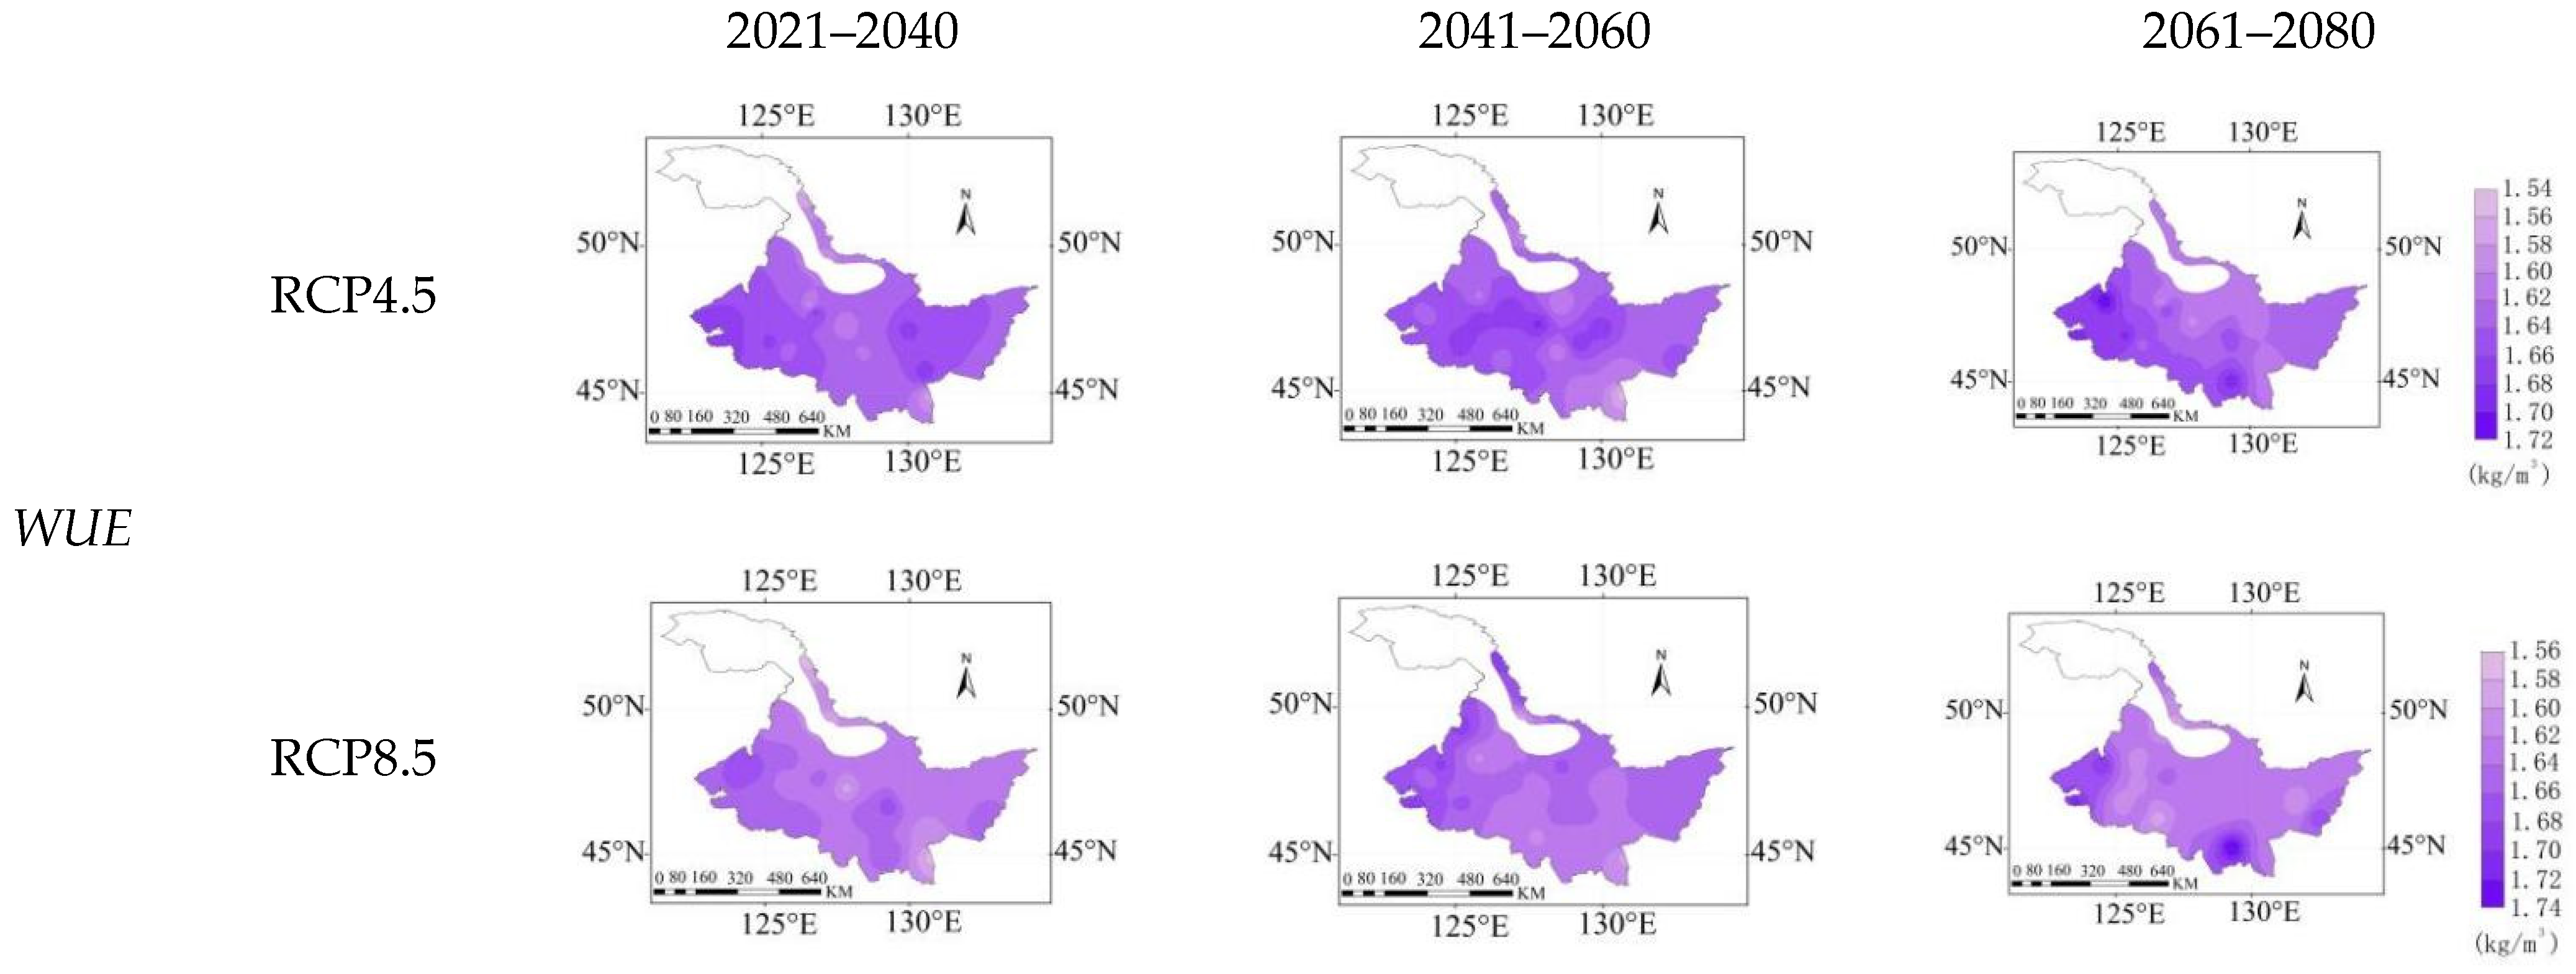
Under the RCP4.5 future climate scenario, the WUE of rice in Heilongjiang Province during 2021–2080 ranges from 1.55 to 1.72 kg·m−3, with an average value of 1.63 kg·m−3. Under the RCP8.5 scenario, the WUE of rice in Heilongjiang Province will range from 1.56 to 1.74 kg·m−3 between 2021 and 2080, with an average value of 1.64 kg·m−3 (Figure 8). Overall, the variation is relatively small, and the differences in WUE are not significant.
Figure 8.
Spatial and temporal distribution of rice WUE under RCP4.5 and RCP8.5 scenarios from 2021 to 2040, 2041 to 2060, and 2061 to 2080.
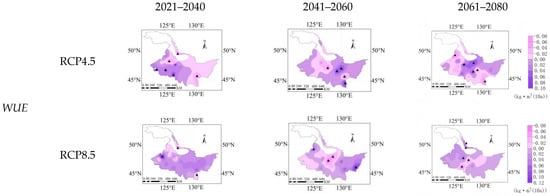
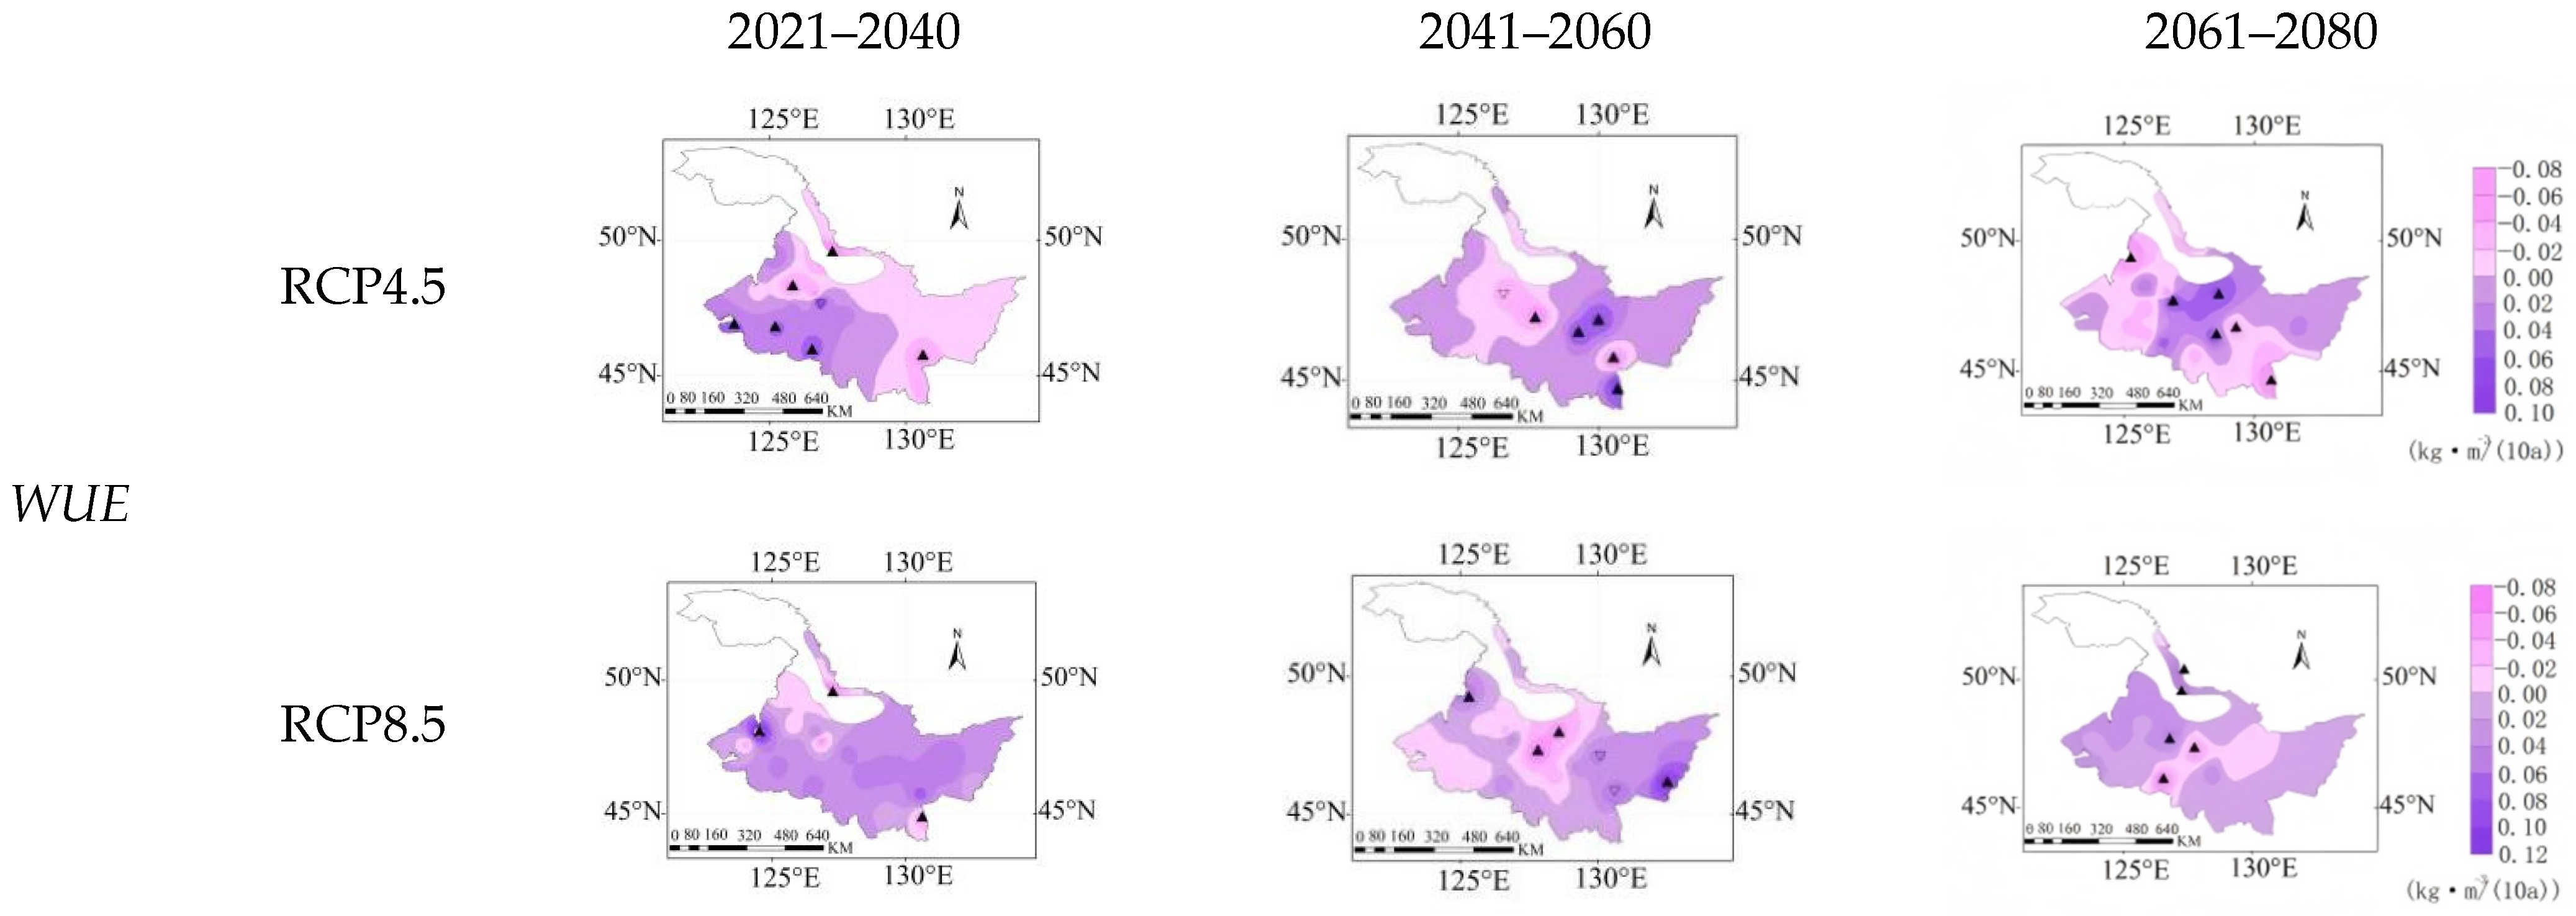
The spatial distribution of WUE varies across time periods and scenarios. Under the RCP4.5 scenario, WUE increases from central to eastern and western regions during 2021–2040, remains elevated in central regions during 2041–2060, and rises from north-central to southwestern regions during 2061–2080. Under the RCP8.5 scenario, high-WUE zones primarily occur in western regions during 2041–2060, while high-value areas concentrate in western and southern regions from 2061 to 2080. The spatial pattern of WUE does not fully align with high-yield or low-irrigation zones, reflecting the heterogeneity of regional production–water use relationships (Figure 9).
Figure 9.
Climate tendency rate of rice WUE from 2021 to 2040, 2041 to 2060, and 2061 to 2080. The triangular symbol in the figure indicates the upward trend of WUE.
3.5. The Impact of Climate Change on Rice
Under the RCP4.5 and RCP8.5 scenarios, the rice yield in Heilongjiang Province exhibited a positive correlation with Tmin, Tmax, Pe, and Rn. The water requirement for rice in this region was significantly positively correlated with Tmax and Rn, while it was negatively correlated with Tmin and Pe. Table 6 illustrates the impact of meteorological elements on rice yield in the study area from 2021 to 2080, as well as the relationships among water requirement, WUE, and Ir. In both future scenarios, the WUE of rice in Heilongjiang Province showed a positive correlation with changes in Tmin, Tmax, and Rn, and a negative correlation with Pe. Notably, in the RCP4.5 scenario, the influence of Tmin, Tmax, and Rn on changes in WUE progressively increased from 2021 to 2080. Among these factors, the correlation coefficient for Rn surpassed those of Tmin, Tmax, and Pe, indicating that changes in the WUE of rice are primarily influenced by Rn. In the RCP8.5 scenario, the correlations between WUE and Tmin, Tmax, and Rn were diminished compared to those observed in the RCP4.5 scenario, although they increased in relation to Pe. The variation in Ir for rice in Heilongjiang Province exhibited the strongest negative correlation with Pe, with correlation values exceeding −0.920. In contrast, positive correlations were noted with Tmin, Tmax, and Rn. From 2021 to 2080, the correlation between Ir, Tmin, and Tmax gradually weakened, while the relationship with Pe became more robust. Overall, the correlation between Ir and various meteorological factors is projected to be stronger in the future RCP8.5 scenario than in the RCP4.5 scenario.
Table 6.
Correlation coefficient between yield, ETc, WUE, Ir, and meteorological factors during rice growth periods in the future. The * indicates that the probability value is less than 0.05, indicating a significant correlation. ** indicates that the probability value is less than 0.01, indicating a highly significant correlation.
4. Discussion
4.1. Climate Warming and Yield Potential in Cold-Region Rice Systems
This study found that under both RCP4.5 and RCP8.5 scenarios, rice yields in Heilongjiang Province exhibit a gradual upward trend, with a more pronounced increase observed in the later stages under the RCP8.5 scenario. Rice cultivation in mid-to-high-latitude cold regions faces significant limitations in thermal resources, primarily manifested as low average temperatures during the growing season, insufficient effective accumulated temperature, uneven thermal distribution, and spatial variations in thermal resources influenced by latitude and topography [31]. These areas are typically located in the temperate or subarctic zones, where insufficient thermal resources constrain the suitable planting range and stable yields of rice [32]. Furthermore, the considerable interannual variability in thermal resources increases production risks. In some high-latitude areas, even the introduction of early-maturing or cold-tolerant varieties may still result in yield limitations due to insufficient heat. Heilongjiang Province, located in northeastern China, belongs to a high-latitude cold-temperate climate zone with low base temperatures. In high-latitude regions, elevated temperatures can partially offset the adverse effects of accelerated phenology, ultimately leading to increased yields [33]. Climate warming presents opportunities for improved thermal resources in these regions. Studies indicate that temperature increases can shift growing season temperatures—previously below optimal levels—toward suitable ranges, thereby enhancing dry matter accumulation efficiency and partially boosting yields. However, this gain is limited. When temperatures continue rising beyond the optimal range, heat stress offsets the benefits of enhanced thermal resources and may even cause yield declines [34]. The increased evaporation accompanying warming may introduce new production risks in mid-to-high-latitude regions [35]. Overall, climate warming offers opportunities for improved thermal resources in low-temperature rice production zones at mid-to-high latitudes, but these gains are limited. During the initial warming phase, thermal constraints ease, allowing cultivation zones to expand and yields to increase. However, as warming intensifies, these yield gains are offset or even reversed. While climate change may positively impact Heilongjiang Province’s rice yields in the short term, future attention must focus on identifying critical temperature thresholds and their potential risks to production. It is recommended that Heilongjiang adjusts its rice planting dates to leverage the positive effects of rising temperatures [36]. Against the backdrop of increased thermal resources, adopting long-season, heat-tolerant japonica rice varieties can fully utilize extended effective accumulated temperatures to boost yields [37]. Additionally, human activities such as fertilization can enhance the stability and sustainability of rice yields [38]. Integrating the influence mechanisms of natural climate, human interventions, and other factors on yield represents a critical future research focus. Attention should be directed toward temperature thresholds and regional variations to develop refined temperature management and varied layout strategies.
4.2. The Trade-Off Between Yield Increase and Water Cost
This study systematically assessed the dynamic impacts of climate change on WUE in Heilongjiang Province from 2021 to 2080 under RCP4.5 and RCP8.5 climate scenarios. The results indicate that under the context of persistent future warming, regional rice WUE exhibits an overall stable trend with slight improvement. Under future climate change, driven by multiple factors including rising temperatures, changes in the spatiotemporal distribution of Pe, and increased CO2 concentrations, rice production in mid-to-high-latitude cold regions will face dual changes: increased yields and increased Ir [39]. Rice is a typical C3 crop; therefore, under the RCP4.5 and RCP8.5 scenarios, rising atmospheric CO2 levels generally lead to the “CO2 fertilization effect,” characterized by enhanced photosynthesis, reduced transpiration, and increased dry matter and yield. Extensive simulation and FACE evidence indicates that elevated CO2 increases photosynthetic rates, improves water use efficiency, and boosts yields. Under warming scenarios such as RCP4.5, these effects often partially offset the yield-reducing effects of rising temperatures, leading to modest yield increases in some regions. However, under the more extreme warming of the RCP8.5 scenario, high temperatures gradually weaken or even offset the positive effects of CO2, causing yields in many regions to decline or grow at a significantly reduced rate [40]. While rising temperatures may boost rice yields to some extent, they simultaneously accelerate transpiration rates. This acceleration, compounded by the uneven spatiotemporal distribution of precipitation during critical growth stages, leads to a significant increase in Ir [41]. This contradiction offsets or even reverses the potential yield gains due to water limitations. While improved thermal conditions create yield potential, sustaining these gains demands higher water costs. This signals that future agriculture will rely even more heavily on water resource regulation and irrigation management. In contrast, low-latitude rice-growing regions face dual pressures from intensified thermal stress and significantly elevated evapotranspiration under future climate change. Multiple studies indicate that elevated temperatures reduce WUE by increasing transpiration and suppressing photosynthesis. Wang et al. found in model simulations for southeastern China that while WUE showed a short-term increase in the 2020s, it declined by the 2080s under RCP4.5 and RCP8.5 scenarios. This decline stemmed from heightened thermal stress, shortened growing seasons, and reduced photosynthetic efficiency driven by high temperatures [42]. Under drier and hotter scenarios, simulations for U.S. rice also indicate a potential 14–42% decline in future WUE, demonstrating how the coupled effects of elevated temperatures and increased transpiration in low-latitude regions severely undermine WUE [43]. Differences in research outcomes stem from variations in climatic and moisture conditions across study regions. Future warming alleviates low-temperature constraints in Heilongjiang Province, enhancing the utilization of light and heat resources, thereby slightly improving WUE [44]. Overall, climate adaptation strategies for rice systems in cold regions must achieve a clearer trade-off between boosting productivity and controlling ETc. Under climate warming scenarios, rice yields exhibit potential for increase. However, the long-term sustainability of such gains depends on whether regional irrigation systems can effectively support growing water demands. It is crucial to emphasize that this trade-off between yield and water use does not manifest uniformly across regions and climate scenarios, indicating that climate drivers exert critical influence in shaping the interplay between yield and water resources. In future climate adaptation strategies, relying solely on Pe will not be sufficient to optimize WUE in rice cultivation in Heilongjiang Province; instead, it is necessary to comprehensively consider the synergistic effects of multiple climatic factors. It is recommended that water-saving irrigation methods be adopted more widely in the future to ensure yield while improving rice WUE.
4.3. The Dominant Mechanism of Climate Factors and Regional Variations
Future climate warming exerts a significant positive impact on rice yield in cold regions. Temperature, particularly Tmax, plays a dominant role in yield changes by influencing crops’ effective accumulated temperature and development rate. This phenomenon likely stems from warming increasing crops’ effective accumulated temperature and improving thermal conditions during the growing season, thereby substantially enhancing rice yield potential in high-latitude cold–temperate zones [45]. Studies indicate that moderate warming accelerates rice growth processes and markedly improves growth environments and yield performance in thermally constrained regions [46,47]. Similar trends have been verified in other mid-to-high-latitude areas, such as northern Japan and parts of South Korea, where a significant positive correlation between temperature increase and yield growth has been observed over the past two decades [48,49]. Compared to temperature, Pe is the primary factor determining Ir. Pe amounts and their temporal distribution directly influence Ir. Multiple studies indicate that increased precipitation or improved WUE can significantly reduce Ir, thereby alleviating water resource pressure [50]. In some regions, precipitation has even become the dominant driver of irrigation volume variation [51]. WUE exhibits significant positive correlations with Rn and air temperature, while showing negative correlations with Pe, with the strongest correlation observed with Rn. This pattern reveals the critical role of radiative resources in maintaining and even enhancing rice WUE [52]. In Heilongjiang Province, rice cultivation relies heavily on irrigation or seasonal precipitation. While increased precipitation provides favorable conditions for rice growth and development, it reduces the crop’s ability to fully utilize water, thereby inhibiting WUE improvement [53]. In regions such as Thailand or the middle and lower reaches of the Yangtze River, changes in the spatiotemporal distribution of Pe and high temperatures are the primary drivers of declining WUE. The relative dominance of these climatic factors results in significant spatial heterogeneity in the relationship between crop yields and water resources. Areas with favorable thermal conditions and high Rn typically achieve higher yields, but due to insufficient Pe, Ir often increases accordingly. Conversely, regions with relatively abundant Pe have lower Ir but may fail to fully realize their yield potential. This spatial decoupling between yield performance and ETc indicates that the distribution of advantages in rice production systems in cold regions is uneven and closely linked to regional climatic conditions. Therefore, while future warming offers the clear potential to boost rice yields in cold, high-latitude regions by enhancing thermal resources, the overall outcome hinges on the intricate balance of water and heat. Finally, against a backdrop of increasing climate uncertainty, optimizing the synergistic interactions between rising temperatures, Pe, and Rn, all of which jointly drive WUE, is crucial for maintaining productivity and managing water resources.
4.4. Limitations of the Study
This study focuses primarily on climatic factors to identify their key impacts on future rice yields, ETc, Ir, and WUE. Within this research framework, we prioritized the development of a climate-driven yield response mechanism. Other potential factors, such as crop varieties, management practices, and irrigation techniques, may cause yield fluctuations under specific conditions. Water-saving technologies such as alternating wet and dry irrigation (AWD) and controlled irrigation have significantly reduced irrigation inputs; numerous studies have confirmed that technologies like AWD can reduce irrigation inputs by 7–70% [54], while the combined use of high-WUE varieties and AWD can further improve WUE while increasing yields, thereby mitigating future increases in Ir [55]. Overall, the effects of these factors typically exhibit regional characteristics, are constrained by management practices, or require more detailed agricultural process data to support their analysis. Given that this study aims to provide an overall assessment of climate change effects, we opted for a more universal climate-driven model framework at this stage. In the future, access to higher-resolution data on management practices and technological advancements will help refine model performance, making the assessment more region-specific. Overall, the factors not deeply incorporated in this study do not affect the main conclusions regarding climate impact trends but rather provide a natural avenue for future research.
5. Conclusions
This study employed the AquaCrop model to simulate trends in rice yield, ETc, Ir, and WUE under future RCP4.5 and RCP8.5 scenarios in Heilongjiang Province, revealing the impacts of climate change on cold-region rice production systems. The results indicate that climate warming will lead to a slight upward trend in future rice yields. However, this will be accompanied by increases in ETc and Ir, with the latter showing a more pronounced rise under the RCP8.5 scenario, but WUE has yet to show significant improvement, remaining at a relatively limited level over the long term. Future efforts should focus on balancing rice yield with WUE. These findings indicate a clear trade-off between yield and water use in irrigated rice systems in cold regions, suggesting that future gains in productivity may come with increased pressure on irrigation resources. This provides a quantitative basis for assessing the sustainability of rice production and irrigation management in high-latitude agricultural areas under projected climate change.
Author Contributions
Z.Z.: investigation, methodology, data curation, writing—original draft. T.N.: conceptualization, supervision, validation, writing—review & editing. R.Y., Z.G., Z.W., L.Z. and W.X.: investigation, formal analysis, writing—review & editing. C.D. (Chong Du), L.J., T.W., M.L. and C.D. (Changlei Dai): validation, writing—review & editing. All authors have read and agreed to the published version of the manuscript.
Funding
This research was funded by the Heilongjiang Provincial College Student Innovation and Entrepreneurship Training Program (202510212185) and the 2025 Annual Ecological Environment Protection Scientific Research Project of Heilongjiang Province (HST2025ST014).
Data Availability Statement
The original contributions presented in this study are included in the article. Further inquiries can be directed to the corresponding author.
Acknowledgments
We thank the anonymous reviewers and the editor for their suggestions, which substantially improved the manuscript.
Conflicts of Interest
The authors declare no conflicts of interest.
References
- Tripathi, A.; Tripathi, D.K.; Chauhan, D.K.; Kumar, N.; Singh, G.S. Paradigms of climate change impacts on some major food sources of the world: A review on current knowledge and future prospects. Agric. Ecosyst. Environ. 2016, 216, 356–373. [Google Scholar] [CrossRef] [Scilit]
- Raftery, A.E.; Zimmer, A.; Frierson, D.M.W.; Startz, R.; Liu, P. Less than 2 °C warming by 2100 unlikely. Nat. Clim. Change 2017, 7, 637–641. [Google Scholar] [CrossRef] [Scilit]
- Wu, G.; Wei, J.; Deng, H.; Zhao, J. Nutrient cycling in an Alpine tundra ecosystem on Changbai Mountain, Northeast China. Appl. Soil Ecol. 2005, 32, 199–209. [Google Scholar] [CrossRef] [Scilit]
- Deng, C.; Xiong, Q.; Harrison, M.T.; Xu, F.; Xiang, Q.; Li, L.; Liu, K. Declining frequency yet increasing intensity of crop waterlogging events under future climates. J. Hydrol. 2025, 663, 134178. [Google Scholar] [CrossRef] [Scilit]
- Liu, H.; Long, A.; Yang, Y.; Yu, J. Advantages of the E-CMRSET model in unveiling evapotranspiration water consumption patterns in the inland river basin. J. Environ. Manag. 2025, 384, 125426. [Google Scholar] [CrossRef] [Scilit] [PubMed]
- Wang, X.; Gao, R.; Wang, Y.; Yang, X.; Cai, Z.; Fang, L. Precipitation spatiotemporal variations: Overview. In Water-Soil-Vegetation Nexus and Climate Change; Elsevier: Amsterdam, The Netherlands, 2024; pp. 1–54. [Google Scholar] [CrossRef] [Scilit]
- Han, X.; Hua, E.; Engel, B.A.; Guan, J.; Yin, J.; Wu, N.; Sun, S.; Wang, Y. Understanding implications of climate change and socio-economic development for the water-energy-food nexus: A meta-regression analysis. Agric. Water Manag. 2022, 269, 107693. [Google Scholar] [CrossRef] [Scilit]
- Yang, A.; Sun, Z.; Zhang, P.; Hu, K.; Luo, S.; Dong, W.; Li, M. Dynamic multi-objective optimization of rice irrigation integrating crop growth and water cycle dynamics: Promoting synergies in water conservation, production enhancement, and emission reduction. Environ. Technol. Innov. 2025, 39, 104241. [Google Scholar] [CrossRef] [Scilit]
- Maharjan, S.; Li, W.; Fazli, S.; Tariq, A.; Thomas, R.; Rakovski, C.; El-Askary, H. Enhancing water scarcity resilience in Egypt through machine learning-driven phenological crop mapping and water use efficiency analysis. Int. J. Appl. Earth Obs. Geoinf. 2025, 141, 104668. [Google Scholar] [CrossRef] [Scilit]
- Xing, L.; Cui, N.; Guo, L.; Gong, D.; Wen, S.; Zhang, Y.; Fan, M. Predicting daily solar radiation using a novel hybrid long short-term memory network across four climate regions of China. Comput. Electron. Agric. 2023, 212, 108139. [Google Scholar] [CrossRef] [Scilit]
- Yang, Y.; Tang, Y.; Sun, S.; Yang, Z.; Wang, S.; Zhang, P.; Wang, Y. Characterization of greenhouse gas emissions and water requirement of farmland in China’s main grain-producing areas under future climate scenarios. Agric. Syst. 2025, 225, 104293. [Google Scholar] [CrossRef] [Scilit]
- Holzman, M.E.; Carmona, F.; Rivas, R.; Niclòs, R. Early assessment of crop yield from remotely sensed water stress and solar radiation data. ISPRS J. Photogramm. Remote Sens. 2018, 145, 297–308. [Google Scholar] [CrossRef] [Scilit]
- Liu, M.; Xu, X.; Jiang, Y.; Huang, Q.; Huo, Z.; Liu, L.; Huang, G. Responses of crop growth and water productivity to climate change and agricultural water-saving in arid region. Sci. Total Environ. 2019, 703, 134621. [Google Scholar] [CrossRef] [Scilit]
- Craufurd, P.Q.; Vadez, V.; Jagadish, S.V.K.; Prasad, P.V.V.; Zaman-Allah, M. Crop science experiments designed to inform crop modeling. Agric. For. Meteorol. 2011, 170, 8–18. [Google Scholar] [CrossRef] [Scilit]
- Tsujimoto, K.; Kuriya, N.; Ohta, T.; Homma, K.; Im, M.S. Quantifying the GCM-related uncertainty for climate change impact assessment of rainfed rice production in Cambodia by a combined hydrologic-rice growth model. Ecol. Model. 2021, 464, 109815. [Google Scholar] [CrossRef] [Scilit]
- Steduto, P.; Hsiao, T.C.; Raes, D.; Fereres, E. AquaCrop—The FAO Crop Model to simulate yield response to water: I. Concepts and underlying principles. Agron. J. 2009, 101, 426–437. [Google Scholar] [CrossRef] [Scilit]
- Nie, T.; Jiao, Y.; Tang, Y.; Li, N.; Wang, T.; Du, C.; Zhang, Z.; Li, T.; Zhu, S.; Sun, Z.; et al. Study on the water supply and the requirements, yield, and water use efficiency of maize in Heilongjiang Province based on the AquaCrop model. Water 2021, 13, 2665. [Google Scholar] [CrossRef] [Scilit]
- Nie, T.; Tang, Y.; Jiao, Y.; Li, N.; Wang, T.; Du, C.; Zhang, Z.; Chen, P.; Li, T.; Sun, Z.; et al. Effects of Irrigation Schedules on Maize Yield and Water Use Efficiency under Future Climate Scenarios in Heilongjiang Province Based on the AquaCrop Model. Agronomy 2022, 12, 810. [Google Scholar] [CrossRef] [Scilit]
- Xu, J.; Bai, W.; Li, Y.; Wang, H.; Yang, S.; Wei, Z. Modeling rice development and field water balance using AquaCrop model under drying-wetting cycle condition in eastern China. Agric. Water Manag. 2018, 213, 289–297. [Google Scholar] [CrossRef] [Scilit]
- Amiri, E.; Rezaei, M.; Rezaei, E.E.; Bannayan, M. Evaluation of Ceres-Rice, Aquacrop and Oryza2000 models in simulation of rice yield response to different irrigation and nitrogen management strategies. J. Plant Nutr. 2014, 37, 1749–1769. [Google Scholar] [CrossRef] [Scilit]
- Yang, Y.; Feng, P.; Guo, J. How does agricultural resilience in China vary by region? Ecol. Indic. 2025, 174, 113513. [Google Scholar] [CrossRef] [Scilit]
- Cao, J.; Zhang, Z.; Tao, F.; Zhang, L.; Luo, Y.; Zhang, J.; Han, J.; Xie, J. Integrating multi-source data for rice yield prediction across China using machine learning and deep learning approaches. Agric. For. Meteorol. 2020, 297, 108275. [Google Scholar] [CrossRef] [Scilit]
- Xin, F.; Xiao, X.; Dong, J.; Zhang, G.; Zhang, Y.; Wu, X.; Li, X.; Zou, Z.; Ma, J.; Du, G.; et al. Large increases of paddy rice area, gross primary production, and grain production in Northeast China during 2000–2017. Sci. Total Environ. 2019, 711, 135183. [Google Scholar] [CrossRef] [Scilit]
- Lei, Y.; Zhang, Y.; Xu, L.; Ma, W.; Zhou, Z.; Li, J.; Quan, P.; Faruquee, M.; Yang, D.; Zhang, F.; et al. Pedigree genome data of an early-matured Geng/japonica glutinous rice mega variety Longgeng 57. Sci. Data 2024, 11, 230. [Google Scholar] [CrossRef] [Scilit]
- Li, M.; Hu, K.; Fu, Q.; Yang, A.; Wang, X.; Zhang, P.; Dong, W.; Sun, Z. Regulation of efficient water use in paddy fields via the simulation of the water cycle in cold regions under random precipitation conditions. Environ. Model. Softw. 2025, 192, 106520. [Google Scholar] [CrossRef] [Scilit]
- Gao, J.B.; Liu, L.L.; Guo, L.H.; Sun, D.; Liu, W.; Hou, W.; Wu, S. Synergic effects of climate change and phenological variation on agricultural production and its risk pattern in black soil region of Northeast China. Acta Geogr. Sin. 2022, 77, 1681–1700. [Google Scholar] [CrossRef]
- Wang, L.; Zhong, D.; Chen, X.; Niu, Z.; Cao, Q. Impact of climate change on rice growth and yield in China: Analysis based on climate year type. Geogr. Sustain. 2024, 5, 548–560. [Google Scholar] [CrossRef] [Scilit]
- Zhan, P.; Zhu, W.; Zhang, T.; Li, N. Regional inequalities of future climate change impact on rice (Oryza sativa L.) yield in China. Sci. Total Environ. 2023, 898, 165495. [Google Scholar] [CrossRef] [Scilit]
- Riahi, K.; Van Vuuren, D.P.; Kriegler, E.; Edmonds, J.; O’Neill, B.C.; Fujimori, S.; Bauer, N.; Calvin, K.; Dellink, R.; Fricko, O.; et al. The Shared Socioeconomic Pathways and their energy, land use, and greenhouse gas emissions implications: An overview. Glob. Environ. Change 2016, 42, 153–168. [Google Scholar] [CrossRef] [Scilit]
- Van Vuuren, D.P.; Edmonds, J.; Kainuma, M.; Riahi, K.; Thomson, A.; Hibbard, K.; Hurtt, G.C.; Kram, T.; Krey, V.; Lamarque, J.; et al. The representative concentration pathways: An overview. Clim. Change 2011, 109, 5–31. [Google Scholar] [CrossRef] [Scilit]
- Zheng, B.; Wang, J.; Wu, S.; Wu, H.; Xie, Z.; Wan, W. Spatio-temporal patterns and driving mechanisms of rice biomass during the growth period in China since 2000. Ecol. Indic. 2023, 153, 110389. [Google Scholar] [CrossRef] [Scilit]
- Yan, X.; Guo, Y.; Ma, B.; Zhao, Y.; Guga, S.; Zhang, J.; Liu, X.; Tong, Z.; Zhao, C. Hazard assessment of rice cold damage based on energy balance in paddy field. Agric. For. Meteorol. 2024, 358, 110233. [Google Scholar] [CrossRef] [Scilit]
- Berg, A.; De Noblet-Ducoudré, N.; Sultan, B.; Lengaigne, M.; Guimberteau, M. Projections of climate change impacts on potential C4 crop productivity over tropical regions. Agric. For. Meteorol. 2012, 170, 89–102. [Google Scholar] [CrossRef] [Scilit]
- Liu, Y.; Tang, L.; Qiu, X.; Liu, B.; Chang, X.; Liu, L.; Zhang, X.; Cao, W.; Zhu, Y. Impacts of 1.5 and 2.0 °C global warming on rice production across China. Agric. For. Meteorol. 2020, 284, 107900. [Google Scholar] [CrossRef] [Scilit]
- Abedin, M.A.; Hosenuzzaman, M. Change in cropping pattern and soil health in relation to climate change and salinity in coastal Bangladesh. In Multi-Hazard Vulnerability and Resilience Building; Elsevier: Amsterdam, The Netherlands, 2023; pp. 315–332. [Google Scholar] [CrossRef] [Scilit]
- Feng, Y.W.; Wang, J.L.; Wang, M.M.; Yang, S.H.; Zhang, R.R.; Yang, J.; Zhu, G.F.; Yu, F.M.; Li, Y.T.; Zhang, X.M. Progress on molecular mechanism of heat tolerance in rice. Rice Sci. 2024, 31, 673–687. [Google Scholar] [CrossRef] [Scilit]
- Hameed, F.; Rahim, S.F.; Khalil, A.U.; Ray, R.L.; Junzeng, X.; Hamoud, A.Y.; Ali, A.; Tangyuan, N. Comparing genotype and climate change effects on simulated historical rice yields using AquaCrop. Rice Sci. 2025, 32, 845–856. [Google Scholar] [CrossRef] [Scilit]
- Fei, L.; Pan, Y.; Ma, H.; Guo, R.; Wang, M.; Ling, N.; Shen, Q.; Guo, S. Optimal organic-inorganic fertilization increases rice yield through source-sink balance during grain filling. Field Crops Res. 2024, 308, 109285. [Google Scholar] [CrossRef] [Scilit]
- Rezaei, E.E.; Webber, H.; Asseng, S.; Boote, K.; Durand, J.L.; Ewert, F.; Martre, P.; MacCarthy, D.S. Climate change impacts on crop yields. Nat. Rev. Earth Environ. 2023, 4, 831–846. [Google Scholar] [CrossRef] [Scilit]
- Elsadek, E.A.; Zhang, K.; Hamoud, Y.A.; Mousa, A.; Awad, A.; Abdallah, M.; Shaghaleh, H.; Hamad, A.a.A.; Jamil, M.T.; Elbeltagi, A. Impacts of climate change on rice yields in the Nile River Delta of Egypt: A large-scale projection analysis based on CMIP6. Agric. Water Manag. 2024, 292, 108673. [Google Scholar] [CrossRef] [Scilit]
- Ding, Y.; Wang, W.; Zhuang, Q.; Luo, Y. Adaptation of paddy rice in China to climate change: The effects of shifting sowing date on yield and irrigation water requirement. Agric. Water Manag. 2019, 228, 105890. [Google Scholar] [CrossRef] [Scilit]
- Wang, W.; Yuan, S.; Wu, C.; Yang, S.; Zhang, W.; Xu, Y.; Gu, J.; Zhang, H.; Wang, Z.; Yang, J.; et al. Field experiments and model simulation based evaluation of rice yield response to projected climate change in Southeastern China. Sci. Total Environ. 2020, 761, 143206. [Google Scholar] [CrossRef] [Scilit]
- Li, S.; Fleisher, D.H.; Barnaby, J.Y. Quantifying the impact of climate change and extreme heat on rice in the United States. Agric. For. Meteorol. 2024, 355, 110145. [Google Scholar] [CrossRef] [Scilit]
- Wang, Y.; Zhou, L.; Jia, Q.; Yu, W. Water use efficiency of a rice paddy field in Liaohe Delta, Northeast China. Agric. Water Manag. 2017, 187, 222–231. [Google Scholar] [CrossRef] [Scilit]
- Zhou, Y.; Li, N.; Dong, G.; Wu, W. Impact assessment of recent climate change on rice yields in the Heilongjiang Reclamation Area of north-east China. J. Sci. Food Agric. 2013, 93, 2698–2706. [Google Scholar] [CrossRef] [Scilit]
- Xu, J.; Henry, A.; Sreenivasulu, N. Rice yield formation under high day and night temperatures—A prerequisite to ensure future food security. Plant Cell Environ. 2020, 43, 1595–1608. [Google Scholar] [CrossRef] [Scilit]
- Yang, Z.; Zhang, Z.; Zhang, T.; Fahad, S.; Cui, K.; Nie, L.; Peng, S.; Huang, J. The effect of season-long temperature increases on rice cultivars grown in the central and southern regions of China. Front. Plant Sci. 2017, 8, 1908. [Google Scholar] [CrossRef] [Scilit]
- Li, C. Climate change impacts on rice production in Japan: A Cobb-Douglas and panel data analysis. Ecol. Indic. 2023, 147, 110008. [Google Scholar] [CrossRef] [Scilit]
- Ju, O.J.; Choi, B.R.; Jang, E.K.; Soh, H.; Lee, S.W.; Lee, Y.S. Climate change and rice yield in Hwaseong-si Gyeonggi-do over the past 20 years (2001–2020). Korean J. Environ. Agric. 2022, 41, 16–23. [Google Scholar] [CrossRef] [Scilit]
- Luo, W.; Chen, M.; Kang, Y.; Li, W.; Li, D.; Cui, Y.; Khan, S.; Luo, Y. Analysis of crop water requirements and irrigation demands for rice: Implications for increasing effective rainfall. Agric. Water Manag. 2022, 260, 107285. [Google Scholar] [CrossRef] [Scilit]
- Okura, F.; Budiasa, I.W.; Kato, T. Exploring a Balinese irrigation water management system using agent-based modeling and game theory. Agric. Water Manag. 2022, 274, 107951. [Google Scholar] [CrossRef] [Scilit]
- Zhou, H.; Zhou, G.; Zhou, L.; Lv, X.; Ji, Y.; Zhou, M. The interrelationship between water use efficiency and radiation use efficiency under progressive soil drying in maize. Front. Plant Sci. 2021, 12, 794409. [Google Scholar] [CrossRef] [Scilit] [PubMed]
- Hatfield, J.L.; Dold, C. Water-use efficiency: Advances and challenges in a changing climate. Front. Plant Sci. 2019, 10, 103. [Google Scholar] [CrossRef] [Scilit] [PubMed]
- Hameed, F.; Afzal, M.M.; Khalil, A.U.R.; Xu, J.; Rahim, S.F.; Osman, R.; Ahmad, K.; Li, Y.; Ning, T. Integrated water and nitrogen management sustains rice yield and efficiency under changing climate scenarios. Agric. Syst. 2025, 231, 104540. [Google Scholar] [CrossRef] [Scilit]
- Wang, C.; Fa, X.; Meng, Q.; Zhang, Y.; Wang, W.; Zhu, K.; Zhang, W.; Gu, J.; Liu, L.; Zhang, J.; et al. Comparison of Agronomic and Physiological Characteristics for Rice Varieties Differing in Water Use Efficiency under Alternate Wetting and Drying Irrigation. Agronomy 2024, 14, 1986. [Google Scholar] [CrossRef] [Scilit]

Disclaimer/Publisher’s Note: The statements, opinions and data contained in all publications are solely those of the individual author(s) and contributor(s) and not of MDPI and/or the editor(s). MDPI and/or the editor(s) disclaim responsibility for any injury to people or property resulting from any ideas, methods, instructions or products referred to in the content. |
© 2026 by the authors. Licensee MDPI, Basel, Switzerland. This article is an open access article distributed under the terms and conditions of the Creative Commons Attribution (CC BY) license.