


Abstract
Aux/IAA proteins function as central transcriptional repressors in auxin signaling and have been implicated in coordinating developmental responses to environmental stress, particularly through modulation of root system architecture. However, the contribution of auxin signaling components to drought-associated root plasticity in improving drought resilience in potato (Solanum tuberosum L.) remains unclear. In this study, we profiled Aux/IAA responses to water deficit across underground tissues by RNA sequencing of root tips, stolon tips, and tubers from two cultivars (Qingshu 9 and Atlantic) with contrasting drought tolerance. Drought treatment induced broad transcriptional changes in the Aux/IAA family, with the majority of members showing increased expression in at least one tissue. qRT-PCR across tissues and developmental stages validated distinct spatiotemporal patterns for selected candidates. Among these, the StIAA3, StIAA6, StIAA22, and StIAA25 genes displayed drought-inducible expression, whereas StIAA24 showed an opposite trend. To probe functional relevance, we generated overexpression and knockdown lines for StIAA3, StIAA6, StIAA22, and StIAA24. Altered expression of these genes was consistently associated with measurable changes in root architecture traits, including root length, diameter, and volume, under water-deficit conditions. These findings reveal insights into the contribution of auxin signaling components to drought-associated root plasticity in potato. The identified drought-responsive Aux/IAA candidates that link root architectural remodeling provide a foundation for mechanistic dissection and underground tissue remodeling of architecture enhancement in root crops.
1. Introduction
Drought stress has emerged as a preeminent abiotic constraint that jeopardizes global food security under the pressures of anthropogenic climate change [1,2]. Plants have evolved sophisticated signaling networks to perceive, transduce, and respond to abiotic stress [3] through tryptophan metabolism and the associated crosstalk in regulating plant stress resistance [4]. Integrating environmental stimuli with endogenous defense systems via the biosynthesis and biofunctions of metabolites can enhance plant abiotic resilience [5]. Central to these adaptive mechanisms are phytohormone-mediated signaling pathways [6], which serve as molecular hubs orchestrating a suite of drought-responsive traits through transcriptional reprogramming and post-translational modifications [7]. For root-centric crops such as potato (Solanum tuberosum L.), whose productivity is intrinsically linked to the functional plasticity of underground organs (e.g., water acquisition, assimilate partitioning), elucidating the signaling mechanisms governing drought-induced root system remodeling is of paramount importance [8]. Deciphering these molecular cascades can advance our understanding of plant–environment interactions and unveil actionable targets for precision anthropogenic interventions [9,10]. Additionally, by harnessing the inherent plasticity of plant signaling systems, it is possible to engineer crops with enhanced drought tolerance while preserving yield stability—a critical imperative for sustaining agricultural productivity under future climate scenarios. Here, we investigate the role of key auxin signaling components, particularly Aux/IAA transcription factors, in mediating drought-responsive traits in potato, bridging the gap between basic research and translational crop improvement strategies.
Potato—an important food crop worldwide—is highly sensitive to water availability [11,12]. Drought stress during potato cultivation severely restricts tuber initiation and bulking, ultimately leading to substantial yield losses [13,14]. Potato underground tissues—including roots, stolons, and tubers—play a central role in water acquisition, assimilate allocation, and yield formation [15]. Therefore, improving drought tolerance through the optimization of underground organ development has become an important goal in potato stress biology and breeding [16].
Root system architecture is a key determinant of plant drought tolerance, as it directly influences water uptake and adaptive responses to water deficits [17,18,19,20]. The coordination among roots, stolons, and tubers constitutes an integrated underground system that determines not only stress resilience but also tuber formation and productivity in potato [21]. Drought-induced alterations in root growth patterns, such as changes in root length, branching, and diameter, are closely associated with drought adaptation strategies [22,23]. However, the molecular mechanisms regulating underground organ development in response to drought stress in potato remain unelucidated.
Auxin is a central phytohormone that controls root development, lateral root formation, and cell elongation, and is heavily involved in plant responses to drought [24,25,26]. The Aux/IAA gene family encodes short-lived nuclear proteins that act as key repressors in the auxin signaling pathway, mediating early auxin-responsive transcriptional regulation [27,28,29,30]. Numerous studies in model plants such as Arabidopsis thaliana and in food crops including rice (Oryza sativa) and maize (Zea mays) have demonstrated that Aux/IAA genes participate in the regulation of root architecture in response to drought stress [25,31,32,33,34,35]. These findings suggest that Aux/IAA proteins may function as critical nodes linking auxin signaling with drought-adaptive root development [36,37,38,39].
To the best of our knowledge, there is no systematic analysis of the spatiotemporal expression profiles of the Aux/IAA gene family across potato underground organs under drought stress. It remains unclear which Aux/IAA genes are specifically associated with drought-responsive root system remodeling and whether these genes contribute to drought tolerance through modulating underground organ development. In particular, the functional relevance of drought-responsive Aux/IAA genes identified by transcriptomic approaches has rarely been validated in potato. In this study, we elucidate the role of Aux/IAA genes in regulating potato underground organs under drought stress. By integrating transcriptome analysis of root tips, stolons, and tubers from two potato cultivars with contrasting drought tolerance, we characterize the expression dynamics of Aux/IAA genes in response to drought water deficit. Key drought-responsive Aux/IAA genes are validated through expression analysis and functional characterization. Our results provide new insights into the auxin-mediated regulatory mechanisms underlying potato drought tolerance, and help identify potential molecular targets for root architecture and drought resilience, facilitating potato genetic enhancement programs.
2. Materials and Methods
2.1. Plant Materials and Drought Stress Treatments
This study utilized two tetraploid potato cultivars: the drought-sensitive Atlantic and the drought-tolerant Qingshu 9. Seed tubers of both cultivars were cut, treated, and sown in the field under rain-sheltered conditions. The experiment consisted of two treatments: a control group receiving normal drip irrigation throughout the entire growth cycle, and a treatment group subjected to drought stress by withholding irrigation from tuber initiation to maturity, following standard drip irrigation from planting to bud emergence. Each treatment was replicated with seven plants. Root tips, primary stolons, and tubers (except at the seedling stage when tubers are absent) were collected at the four developmental stages: seedling, tuber initiation, tuber bulking, and tuber maturity. For each developmental stage, different tissues were sampled from the same plant. Three biological replicates were established, with fresh samples immediately frozen in liquid nitrogen in the field and subsequently stored at −80 °C for further analysis. The Atlantic and Qingshu 9 potato samples used in this study were provided by the College of Life Science and Technology, Gansu Agricultural University.
For transcriptome sequencing, samples were collected exclusively under drought-stress conditions at the tuber bulking stage. Root tips, primary stolons, and tubers were sampled from individual plants of both Atlantic and Qingshu 9, with three biological replicates per tissue type and cultivar, totaling 18 samples. These were designated as: basal root tips (AtBR1-3 for Atlantic, QsBR1-3 for Qingshu 9), primary stolons (AtPS1-3 for Atlantic, QsPS1-3 for Qingshu 9), and tubers (AtT1-3 for Atlantic, QsT1-3 for Qingshu 9).
For qRT-PCR analysis, samples were collected from both cultivars (Atlantic and Qingshu 9), both treatments (adequate irrigation and drought stress), and all four developmental stages (seedling, tuber initiation, tuber bulking, and tuber maturity). Tissues collected included root tips, primary stolon apices, and tubers (except at the seedling stage, where tubers were absent). Three biological replicates were collected for each combination of cultivar, treatment, stage, and tissue, resulting in a total of 132 samples.
Four Aux/IAA transcription factors were selected from the DSR (Desiree, tetraploid cultivar) sample for genetic knockdown and overexpression, resulting in the establishment of 20 transgenic potato lines. These included StIAA3 knockdown lines (3R-2, 3R-7, 3R-15), StIAA3 overexpression line (3OE-4), StIAA6 knockdown lines (6R-17, 6R-18, 6R-35), StIAA6 overexpression lines (6OE-1, 6OE-21, 6OE-33), StIAA22 knockdown lines (22R-5, 22R-15, 22R-29), StIAA22 overexpression line (22OE-1), StIAA24 knockdown lines (24R-2, 24R-4, 24R-6), and StIAA24 overexpression lines (24OE-8, 24OE-10, 24OE-14). Both non-transgenic and transgenic potato plantlets used in this study were provided by the College of Life and Environmental Science, Wenzhou University. After a 21-day cultivation period on Murashige and Skoog (MS) medium, uniform potato plantlets were transplanted into plastic pots (160 mm × 110 mm in diameter, 145 mm in height) filled with pure vermiculite. The plants were cultivated under standard watering and fertilization conditions. Upon reaching the tuber expansion stage, the plants were subjected to drought stress for one month, during which the soil water content was maintained at 35–40% of field capacity, while the control group was maintained at 70–75%. Each treatment consisted of five pots with one plant per pot, representing five biological replicates. Following the stress period, root systems were carefully collected, cleaned, and scanned using a desktop scanner to obtain high-resolution images. Root morphological parameters were subsequently analyzed using WinRHIZO image analysis software (version WinRHIZO Pro 2024a).
2.2. Total RNA Extraction, cDNA Library Construction, and Reference-Free Transcriptome Sequencing
RNA extraction, reverse transcription, library construction, and sequencing were performed following the manufacturer’s standard protocols (Illumina, San Diego, CA, USA). Total RNA was extracted from 18 samples, with RNA concentration measured using a NanoDrop 2000 (Thermo, Waltham, MA, USA) and RNA integrity assessed via the RNA Nano 6000 Assay Kit on an Agilent Bioanalyzer 2100 system (Agilent Technologies, Santa Clara, CA, USA) to ensure sample qualification for transcriptome sequencing. For each sample, mRNA was purified using oligo(dT)-attached magnetic beads and subsequently fragmented at elevated temperature with divalent cations. First- and second-strand cDNA synthesis was performed using random hexamers, followed by library construction. The cDNA fragments underwent end repair and were ligated to paired-end adapters. Fragments of approximately 200 bp (±10 bp) were selected by agarose gel electrophoresis and amplified by PCR. The cDNA libraries were sequenced on an Illumina HiSeq 2000 platform (Illumina, Inc., San Diego, CA, USA) to generate paired-end reads. After obtaining high-quality sequencing data, sequence assembly was performed using Trinity. All procedures were conducted by Biomarker Technologies (Beijing, China). All sequence data have been deposited in the NCBI database under project accession number SUB6636959.
2.3. Gene Expression Abundance and Differentially Expressed Genes (DEGs)
Raw data in FASTQ format were processed to obtain clean reads for subsequent analyses. Quality metrics, including Q20, Q30, GC content, and sequence duplication levels, were calculated for the filtered data. RNA-seq reads were assembled efficiently and robustly using Trinity (v2.5.1) [40]. Trinity assemblies were clustered using CD-HIT-EST (v4.6.1) with a 95% sequence identity threshold to remove redundant transcripts [41]. The longest transcript per cluster was retained as the unigene for downstream analysis. Gene expression levels were estimated using raw read counts generated by RSEM (v1.2.19) [42] following read alignment with Bowtie [43]. These raw counts were used as input for differential expression analysis with DESeq2 (v1.6.3) [44]. FPKM values were calculated only for descriptive purposes and data visualization, including heatmaps and expression trend plots [45]. The Benjamini–Hochberg method was applied to adjust p-values for multiple testing, controlling the false discovery rate (FDR). Genes with |log2 (fold-change)| ≥ 1 and FDR < 0.05 were considered differentially expressed.
2.4. Gene Functional Annotation and Enrichment Analysis
Unigene sequences were annotated by performing BLAST (v2.2.31) searches against multiple databases: NR (https://ftp.ncbi.nih.gov/blast/db/, accessed on 11 January 2019), Swiss-Prot (http://www.uniprot.org/), GO (http://www.geneontology.org/), COG (http://www.ncbi.nlm.nih.gov/COG/, accessed on 11 January 2019), KOG (https://www.ncbi.nlm.nih.gov/research/cog-project/, accessed on 11 January 2019), eggNOG4.5 (http://eggnog45.embl.de/#/app/home, accessed on 11 January 2019), and KEGG (http://www.genome.jp/kegg/, accessed on 11 January 2019). KEGG Orthology assignments were obtained using KOBAS2.0 [46]. Protein domain annotations were generated by comparing predicted amino acid sequences against the Pfam database [47] using HMMER (v3.1b2) [48]. Functional categorization of DEGs was conducted by comparing enriched GO terms (p-adjust < 0.05) with the GO database, resulting in secondary classifications across the three major GO categories: Biological Process (BP), Cellular Component (CC), and Molecular Function (MF). Enrichment analysis of KEGG pathways was performed using KOBAS (v2.0) [49].
2.5. qRT-PCR Validation of Aux/IAA-Related Gene Expression
The reliability of transcriptome data was verified by quantitative real-time PCR (qRT-PCR) using SuperReal PreMix Plus (SYBR Green FP205) on a CFX96 system (Bio-Rad, Hercules, CA, USA). Sixteen DEGs with high FPKM values and fold changes were randomly selected as target genes potentially involved in potato drought tolerance response. The efla gene was used as an internal reference, and gene-specific primers were designed using Primer Premier 5.0 (Table 1). Subsequently, five Aux/IAA transcription factors were selected for expression analysis in different root tissues under drought stress. All reactions were performed with three technical replicates in a 20 μL reaction volume under the following conditions: 30 s at 95 °C, followed by 40 cycles of 5 s at 95 °C and 30 s at 60 °C, with a melt curve analysis from 65 °C to 95 °C. Relative gene expression levels were calculated using the 2−ΔΔCt method. Statistical analyses and graphing were performed using R Studio (v4.5.2), with t-tests and ANOVA applied to determine significance (p < 0.05).
Table 1.
Primer sequences.
3. Results
3.1. De Novo Transcriptome Sequencing and Quality Assessment
The transcriptome sequencing of the 18 samples generated 195.65 Gb of high-quality clean data. Each sample produced at least 6.21 GB of clean data, with Q30 base percentages exceeding 92.45%, and GC contents greater than 41.90% (Table 2). De novo assembly of the clean reads using Trinity yielded 142,188 transcripts. After redundancy filtering with CD-HIT-EST (95% sequence identity threshold), 59,234 unigenes were obtained, with an N50 length of 1877 bp, reflecting satisfactory transcript continuity (Table A1). A total of 59,234 unigenes were tested for differential expressions using DESeq2. The dispersion estimates were consistent with the model assumptions, confirming the reliability of the normalization and subsequent analysis. To assess assembly performance, clean reads from each sample were mapped back to the assembled unigene set, yielding alignment rates from 61.81% to 89.79% (Table 2). These results indicate that the transcriptome data and assembly quality were sufficient for subsequent expression profiling and comparative analyses.
Table 2.
Data summary of 18 RNA sequencing from Solanum tuberosum.
3.2. Differential Gene Expression Patterns Vary Among Underground Tissues
To evaluate the consistency of biological replicates and the relationships among samples, Pearson correlation coefficients were calculated between each pair of samples. There was a high degree of correlation among the three biological replicas of each variety, organization and treatment combination, indicating good reproducibility and reliable data quality (Figure A1).
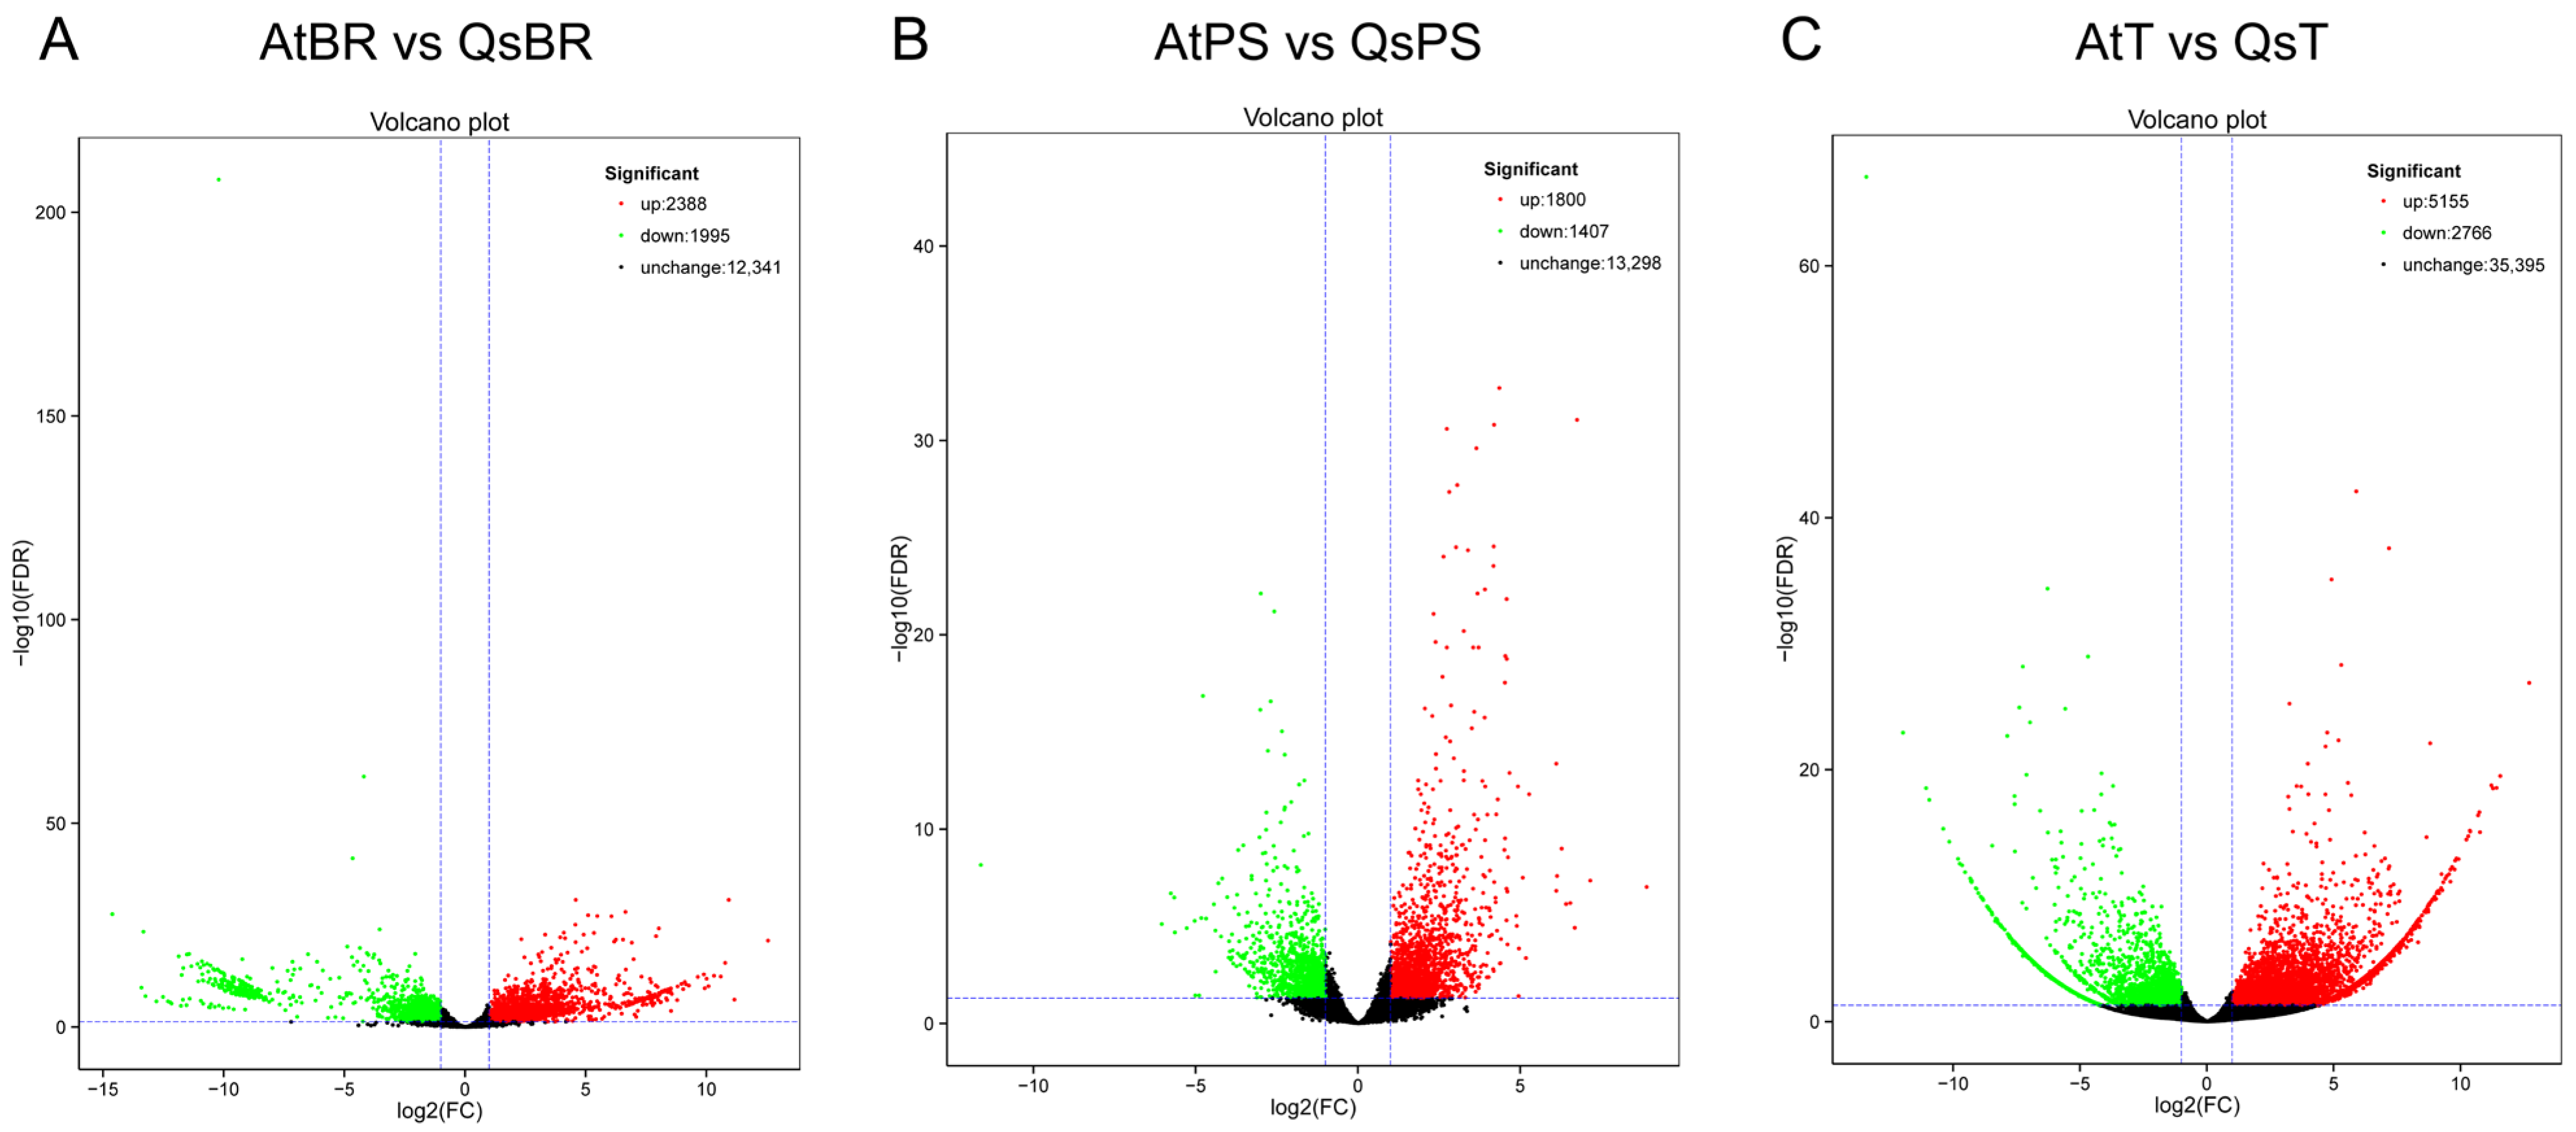
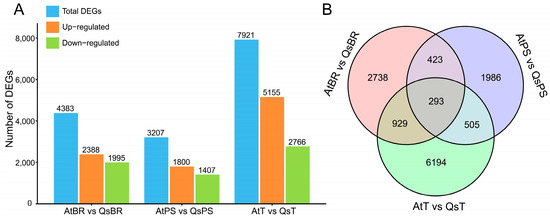
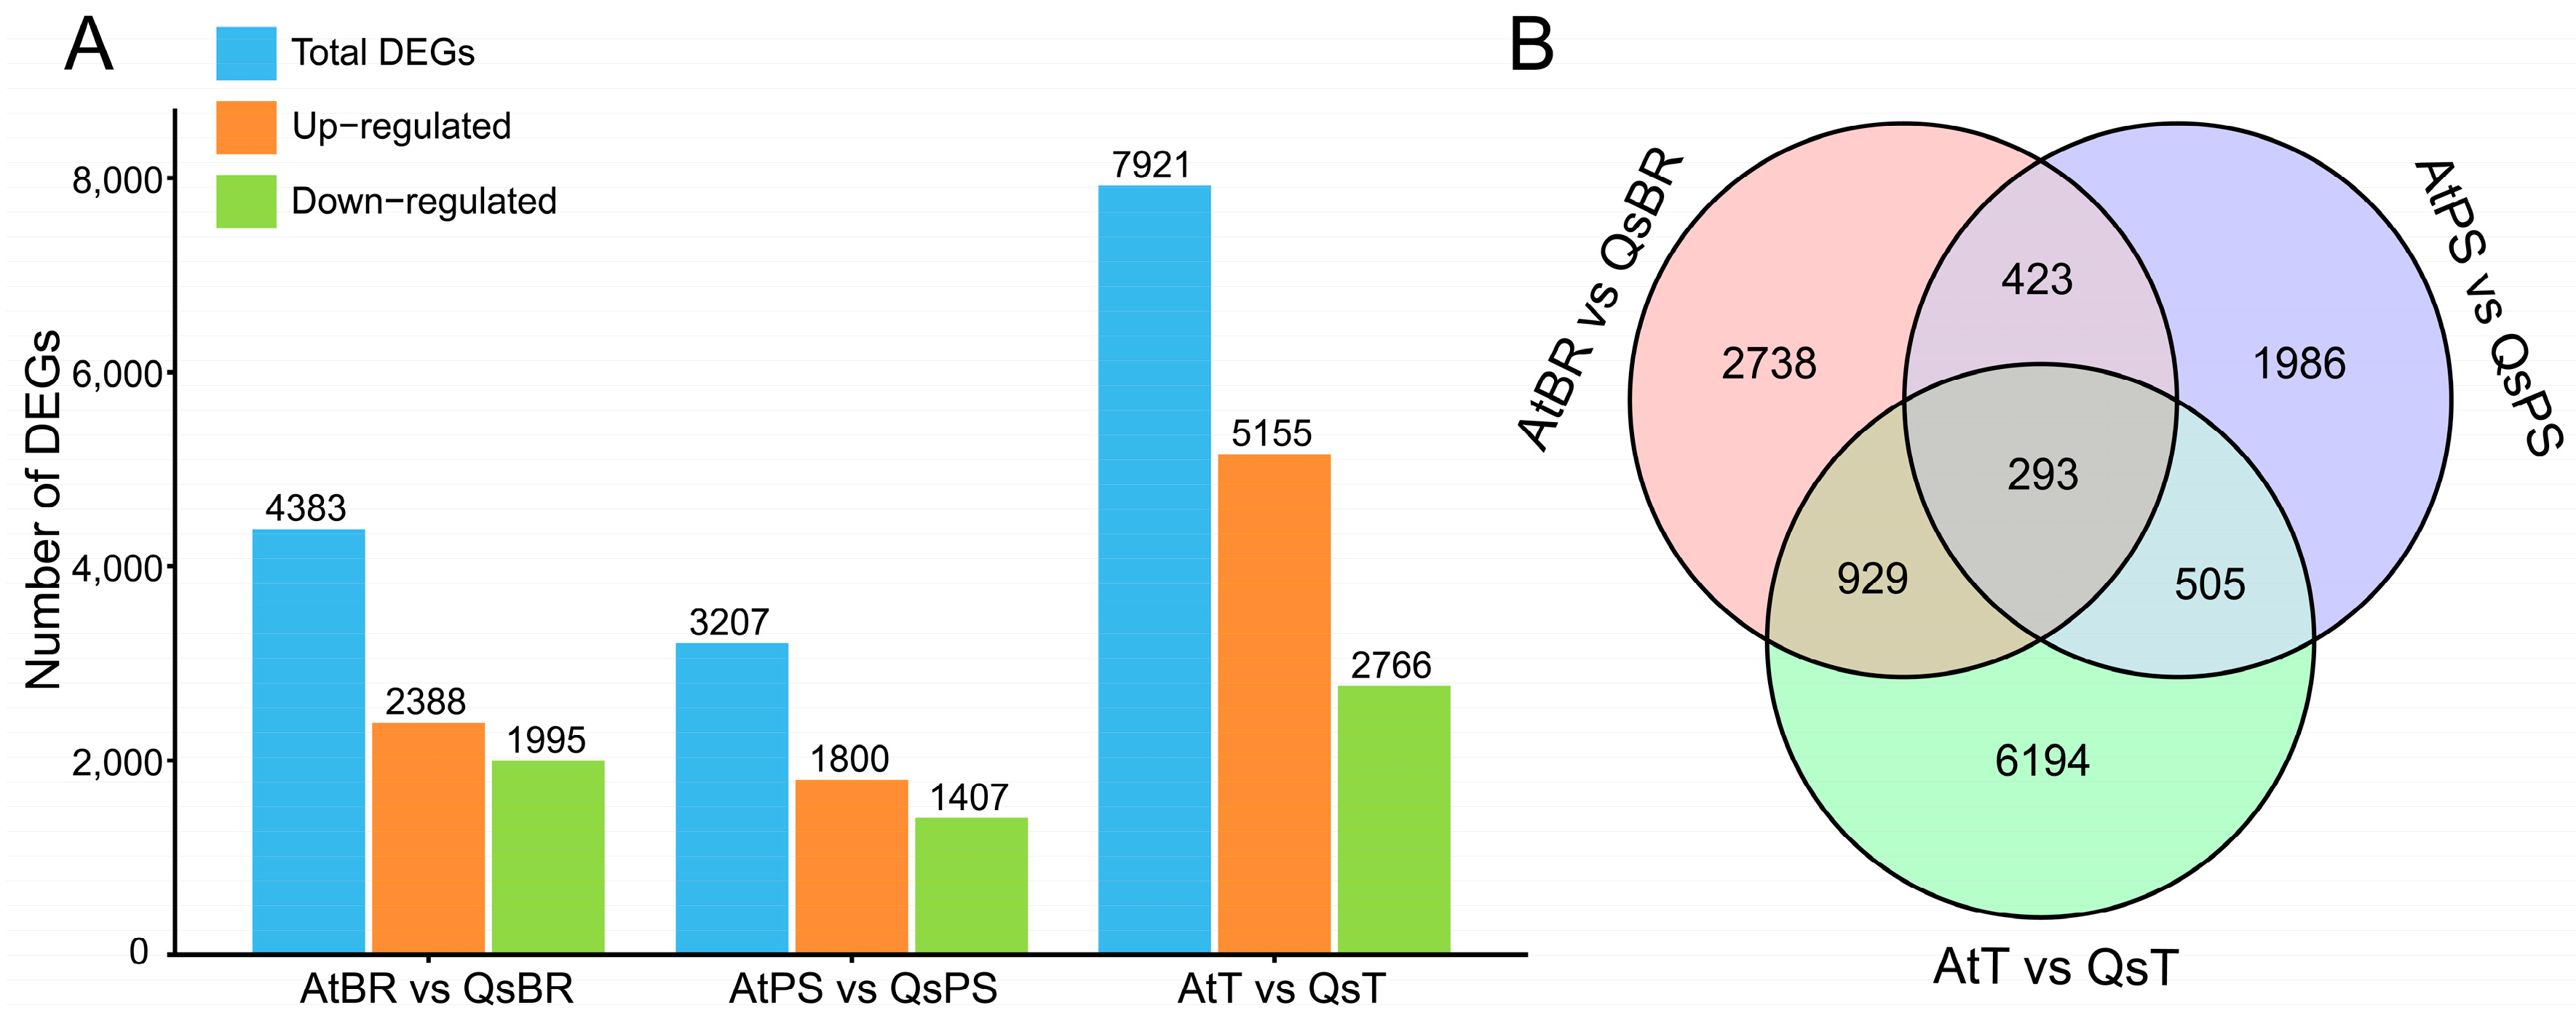
Differentially expressed genes (DEGs) between the two potato cultivars were identified using a threshold of |log2(fold-change)| ≥ 1 and a false discovery rate (FDR) < 0.05. Comparative transcriptome analyses revealed pronounced tissue-dependent differences in drought-responsive gene expression between Qingshu 9 and Atlantic. In basal root tips (AtBR vs. QsBR), a total of 4383 DEGs were detected, of which 2388 genes were upregulated, and 1995 were downregulated in Qingshu 9 relative to Atlantic. Primary stolon tissues (AtPS vs. QsPS) exhibited the smallest transcriptional divergence between cultivars, with 3207 DEGs identified, including 1800 upregulated and 1407 downregulated genes. In contrast, tuber tissues (AtT vs. QsT) displayed the largest extent of transcriptional differences, with 7921 DEGs, comprising 5155 upregulated and 2766 downregulated genes in Qingshu 9 compared with Atlantic (Figure 1A).
Figure 1.
Analysis of differentially expressed genes (DEGs) between the drought-sensitive cultivar Atlantic (At) and the drought-tolerant cultivar Qingshu 9 (Qs) in basal root tips (BR), tubers (T), and primary stolons (PS). (A) Bar plot showing the count of DEGs (|log2FC| ≥ 1, p < 0.05) in each tissue-specific comparison between cultivars At and Qs. (B) Venn diagram illustrating the overlap of DEG sets from the three comparisons in (A), highlighting the number of genes shared in each pairwise overlap and all three tissues.
To examine the degree of overlap in drought-responsive genes across tissues, Venn diagram analysis was performed (Figure 1B). Pairwise comparisons revealed 423 DEGs shared between basal root tips and primary stolons, 929 common DEGs between basal root tips and tubers, and 505 overlapping DEGs between primary stolons and tubers. Notably, 293 DEGs were consistently differentially expressed across all three tissues, indicating the presence of a core set of genes exhibiting stable cultivar-dependent expression differences under drought stress.
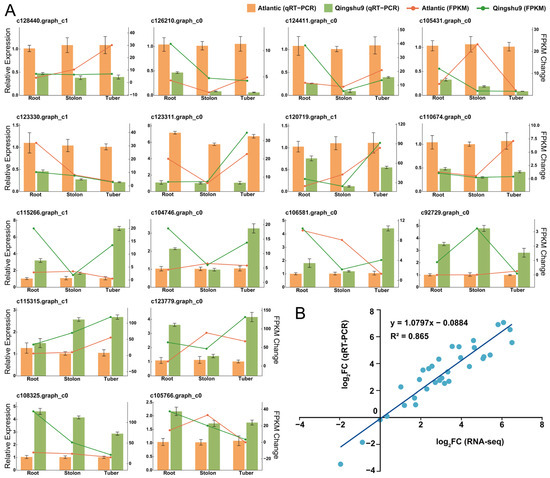
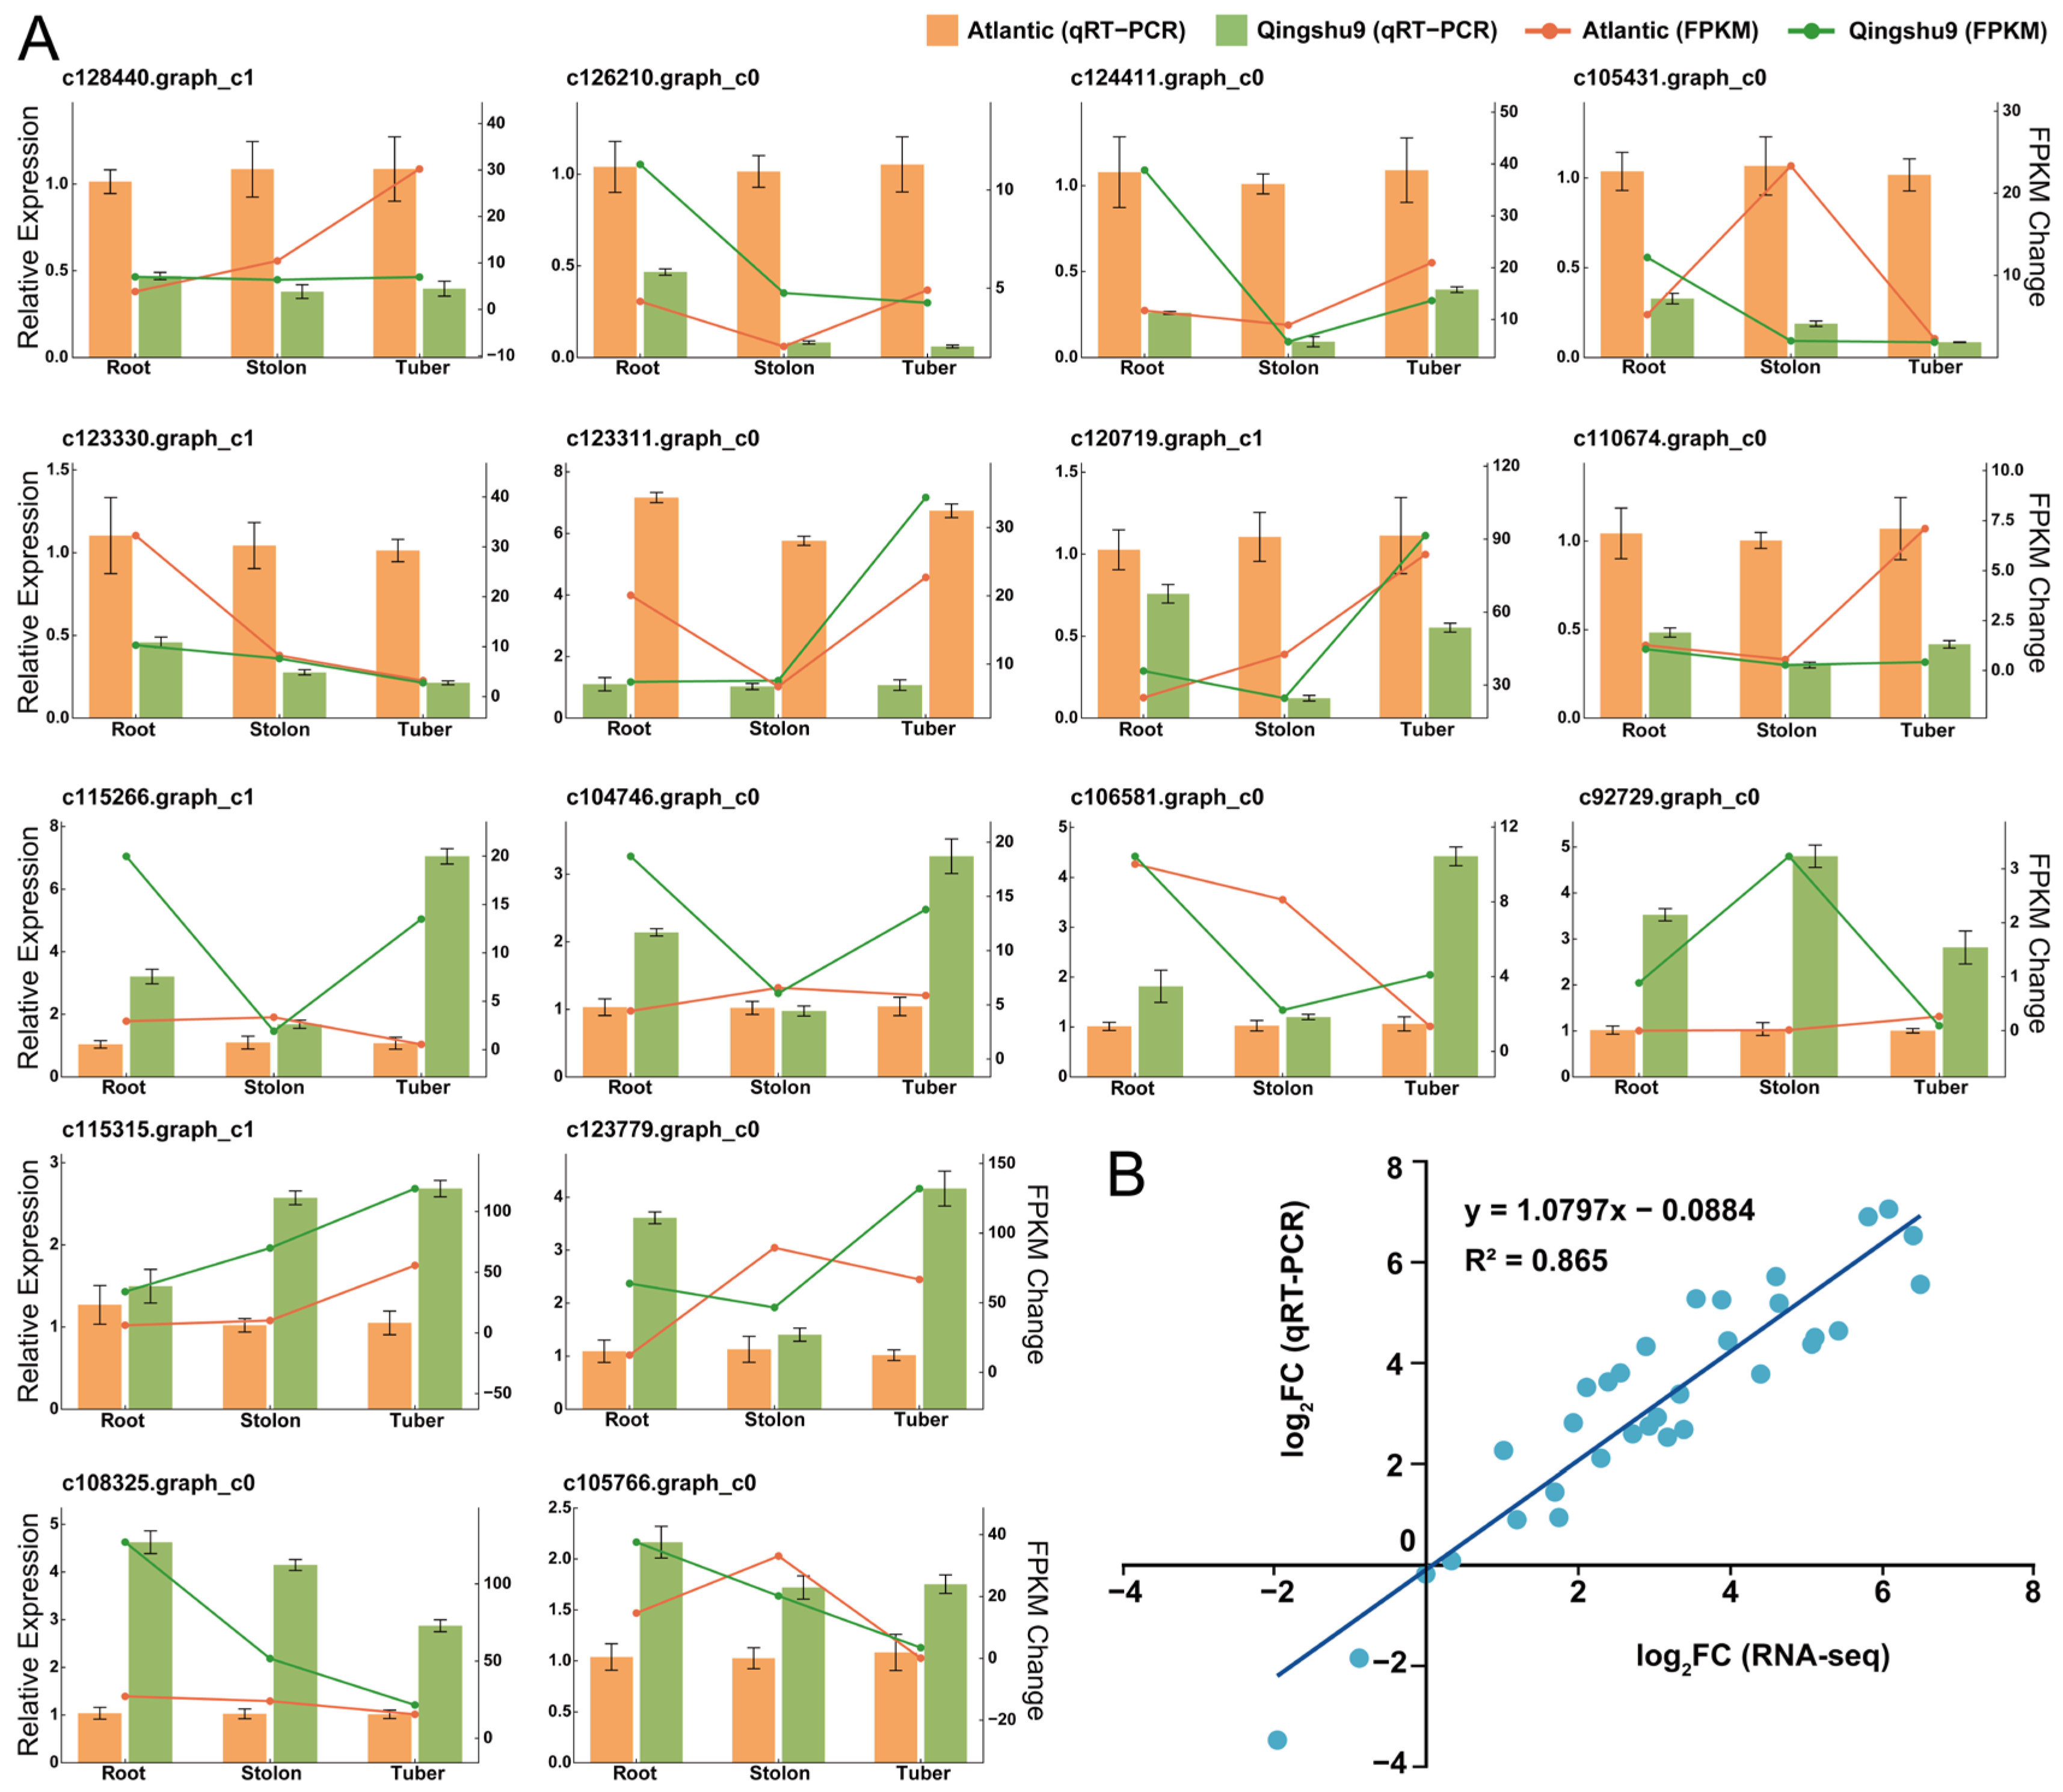
To validate the transcriptome data, the expression patterns of selected DEGs were examined by quantitative RT-PCR. The qRT-PCR results showed expression trends consistent with the RNA-seq data, showing a strong positive correlation between the two methods (R2 = 0.865; Figure 1B). Among the tested genes, nine genes exhibited higher expression in Qingshu 9 across all three tissues, whereas seven genes showed lower expression levels in Atlantic (Figure 2A), further supporting the reliability of the transcriptomic analysis.
Figure 2.
Validation of RNA-Seq data by qRT-PCR analysis in potato root tissues. (A) Expression patterns of 16 DEGs (identified from RNA-seq) in the cultivars Atlantic and Qingshu 9 across three tissues: root, stolon, and tuber (x-axis). For each gene, the relative expression level determined by qRT-PCR is shown as bar graphs (left y-axis), and the corresponding expression level (FPKM) from RNA-seq is shown as line graphs (right y-axis). Data represent mean ± SD (n = 3). (B) Correlation analysis between qRT-PCR and RNA-Seq methodologies. Llog2FC values from RNA-seq (x-axis) and qRT-PCR (y-axis) for 16 selected genes across two experimental treatments are significantly correlated. The linear regression line (blue), its equation, and the R2 value are shown.
3.3. GO and KEGG Enrichment Analyses of Differentially Expressed Genes
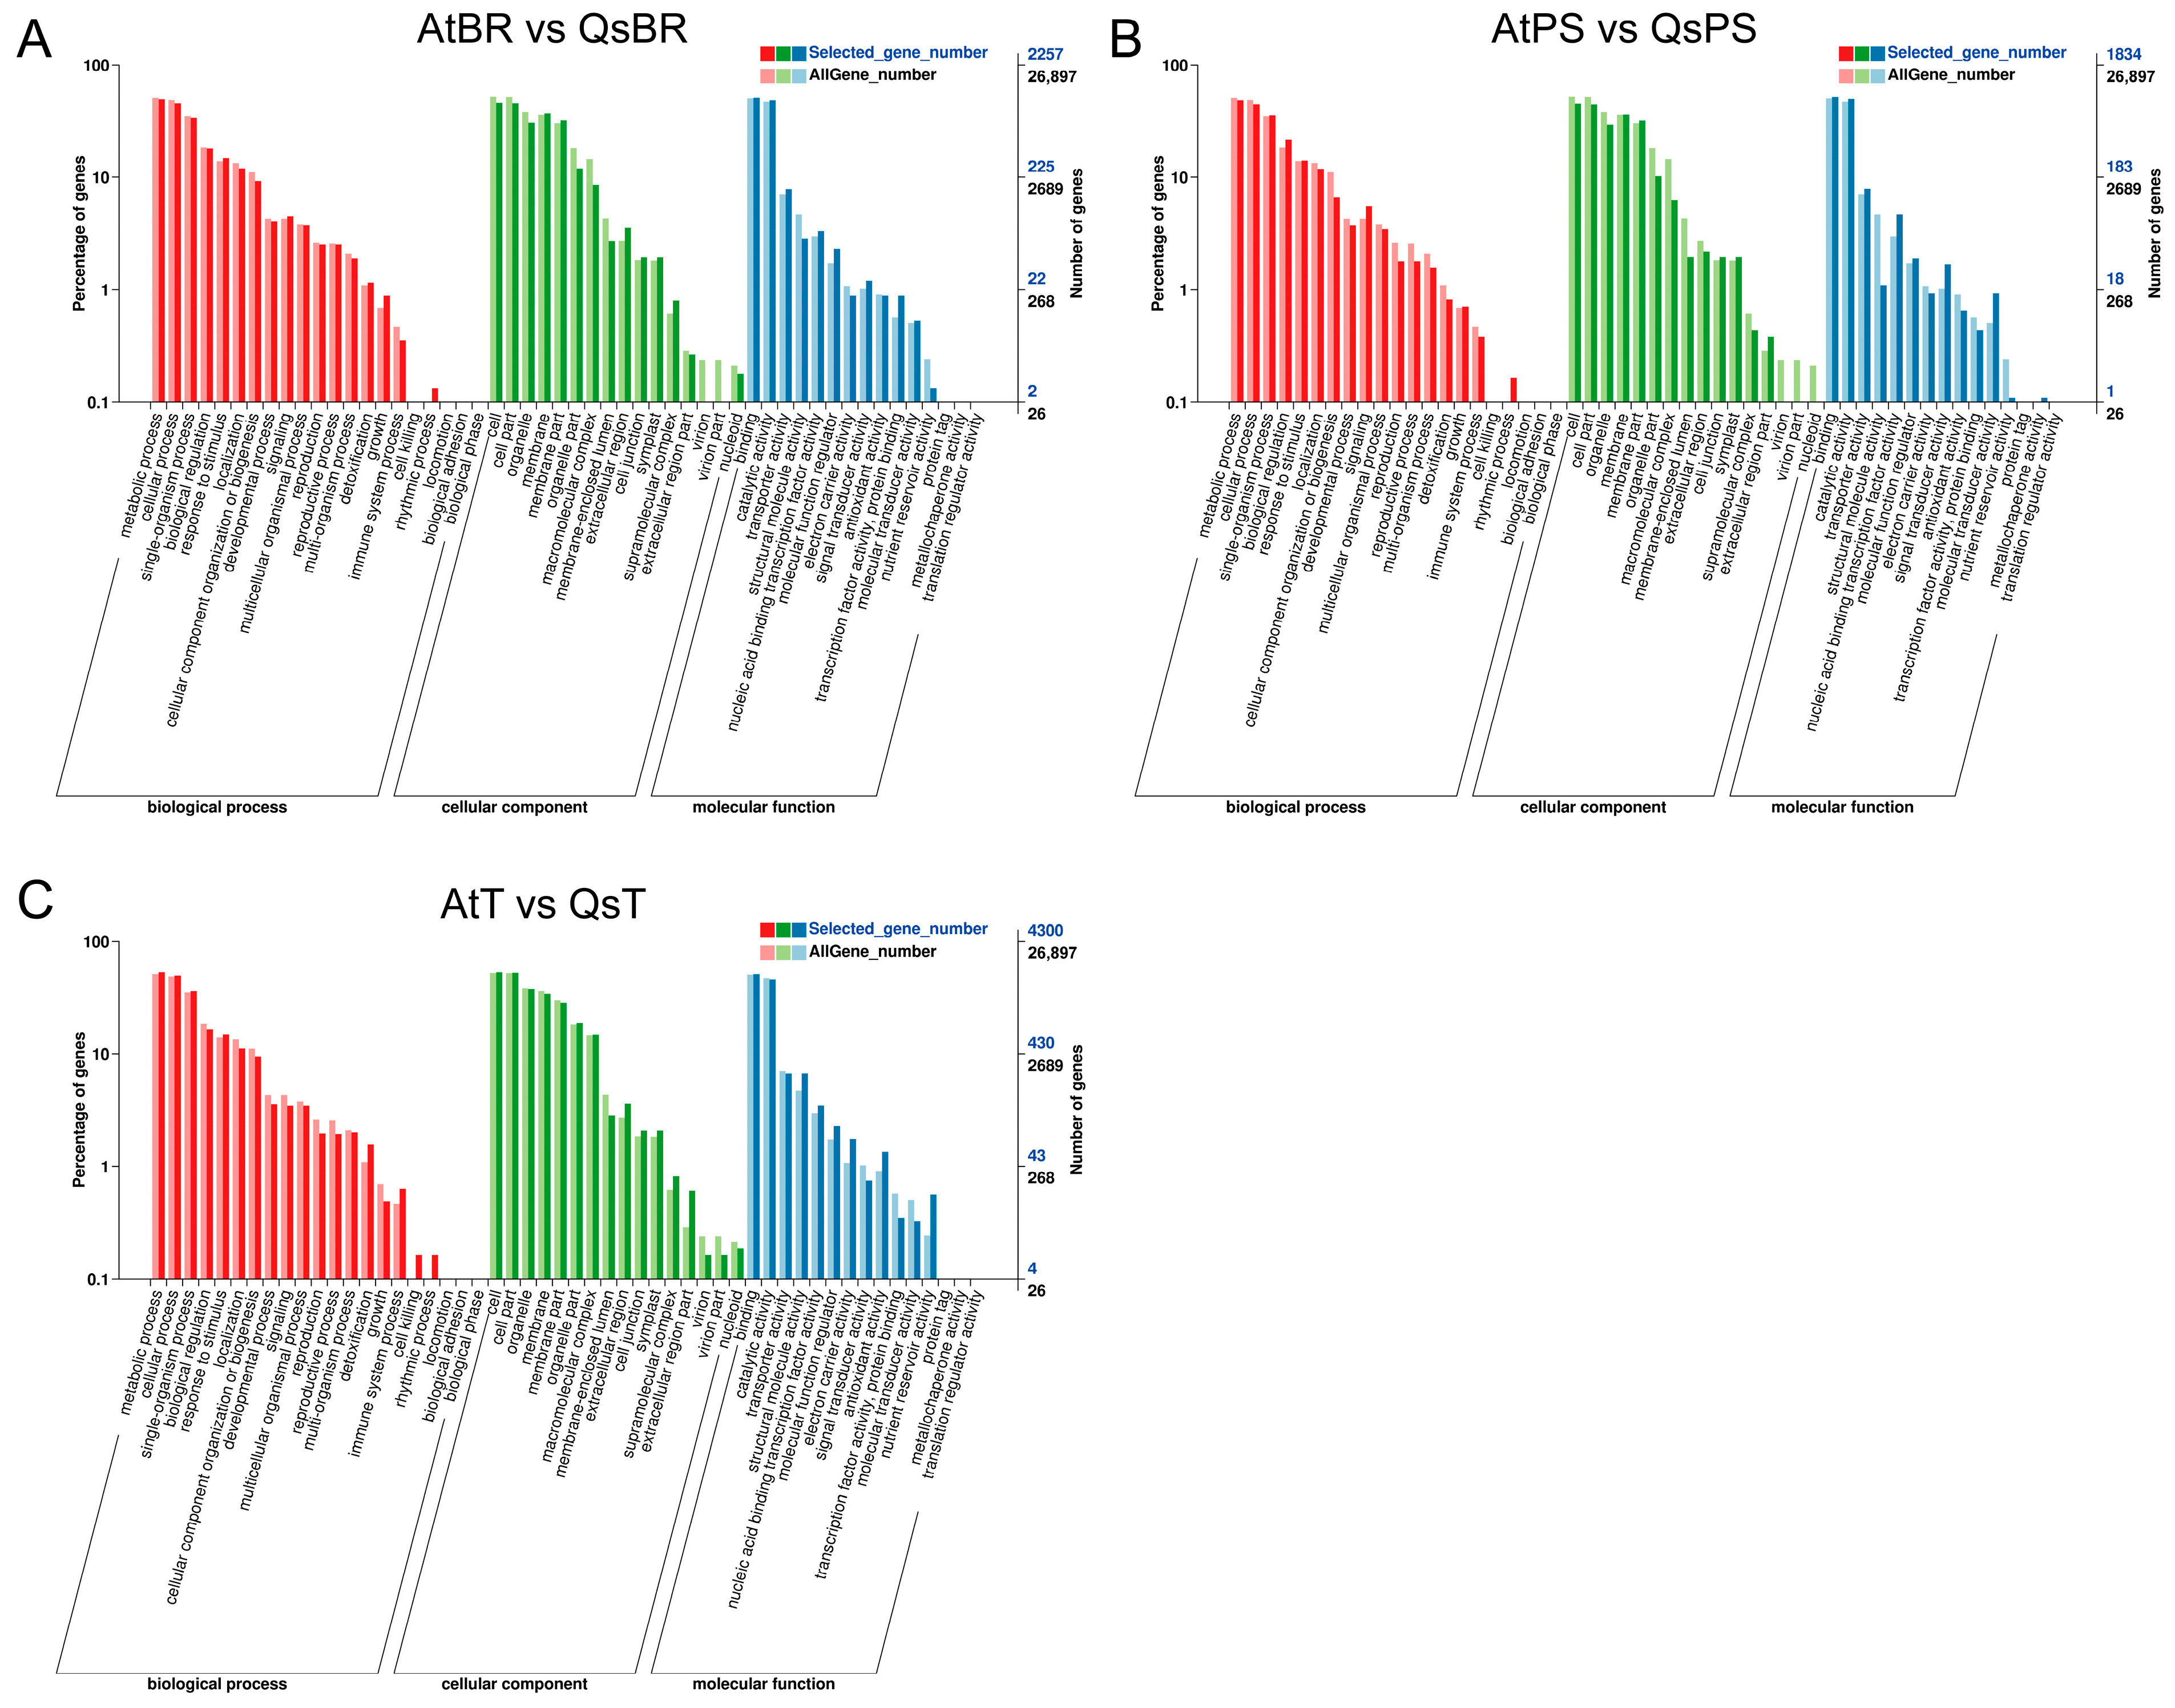
To characterize the functional attributes of drought-responsive genes, Gene Ontology (GO) enrichment analysis was performed for DEGs identified from the different underground tissues. Across tissues and cultivar comparisons, DEGs were significantly enriched in 21 biological process (BP) terms, with “metabolic process” (GO:0008152), “cellular process” (GO:0009987), and “single-organism process” (GO:0044699) representing the most prominent categories. In the cellular component (CC) category, 16 terms were enriched, among which “cell” (GO:0005623), “cell part” (GO:0044464), and “organelle” (GO:0043226) were the most abundant. Molecular function (MF) analysis identified 15 enriched terms, predominantly associated with “binding” (GO:0005488), “catalytic activity” (GO:0003824), and “transporter activity” (GO:0005215) (Figure 3).
Figure 3.
Gene Ontology (GO) enrichment analysis of tissue-specific DEGs. Significantly enriched GO terms for differentially expressed genes in pairwise comparisons between Atlantic (At) and Qingshu 9 (Qs) cultivars across three tissues: (A) basal root tips (BR), (B) primary stolons (PS), and (C) tubers (T). The bar chart displays the top enriched terms based on their statistical significance (|log2FC| ≥ 1, p < 0.05).
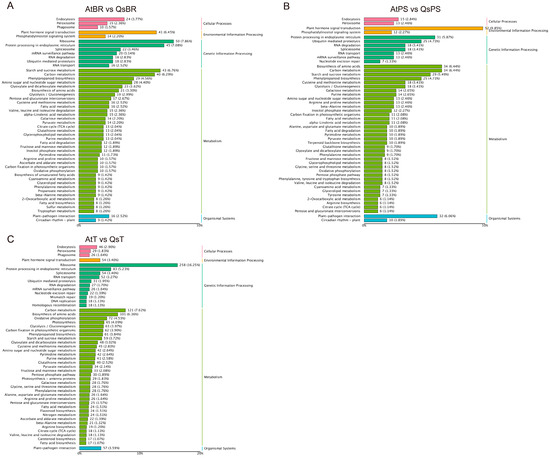
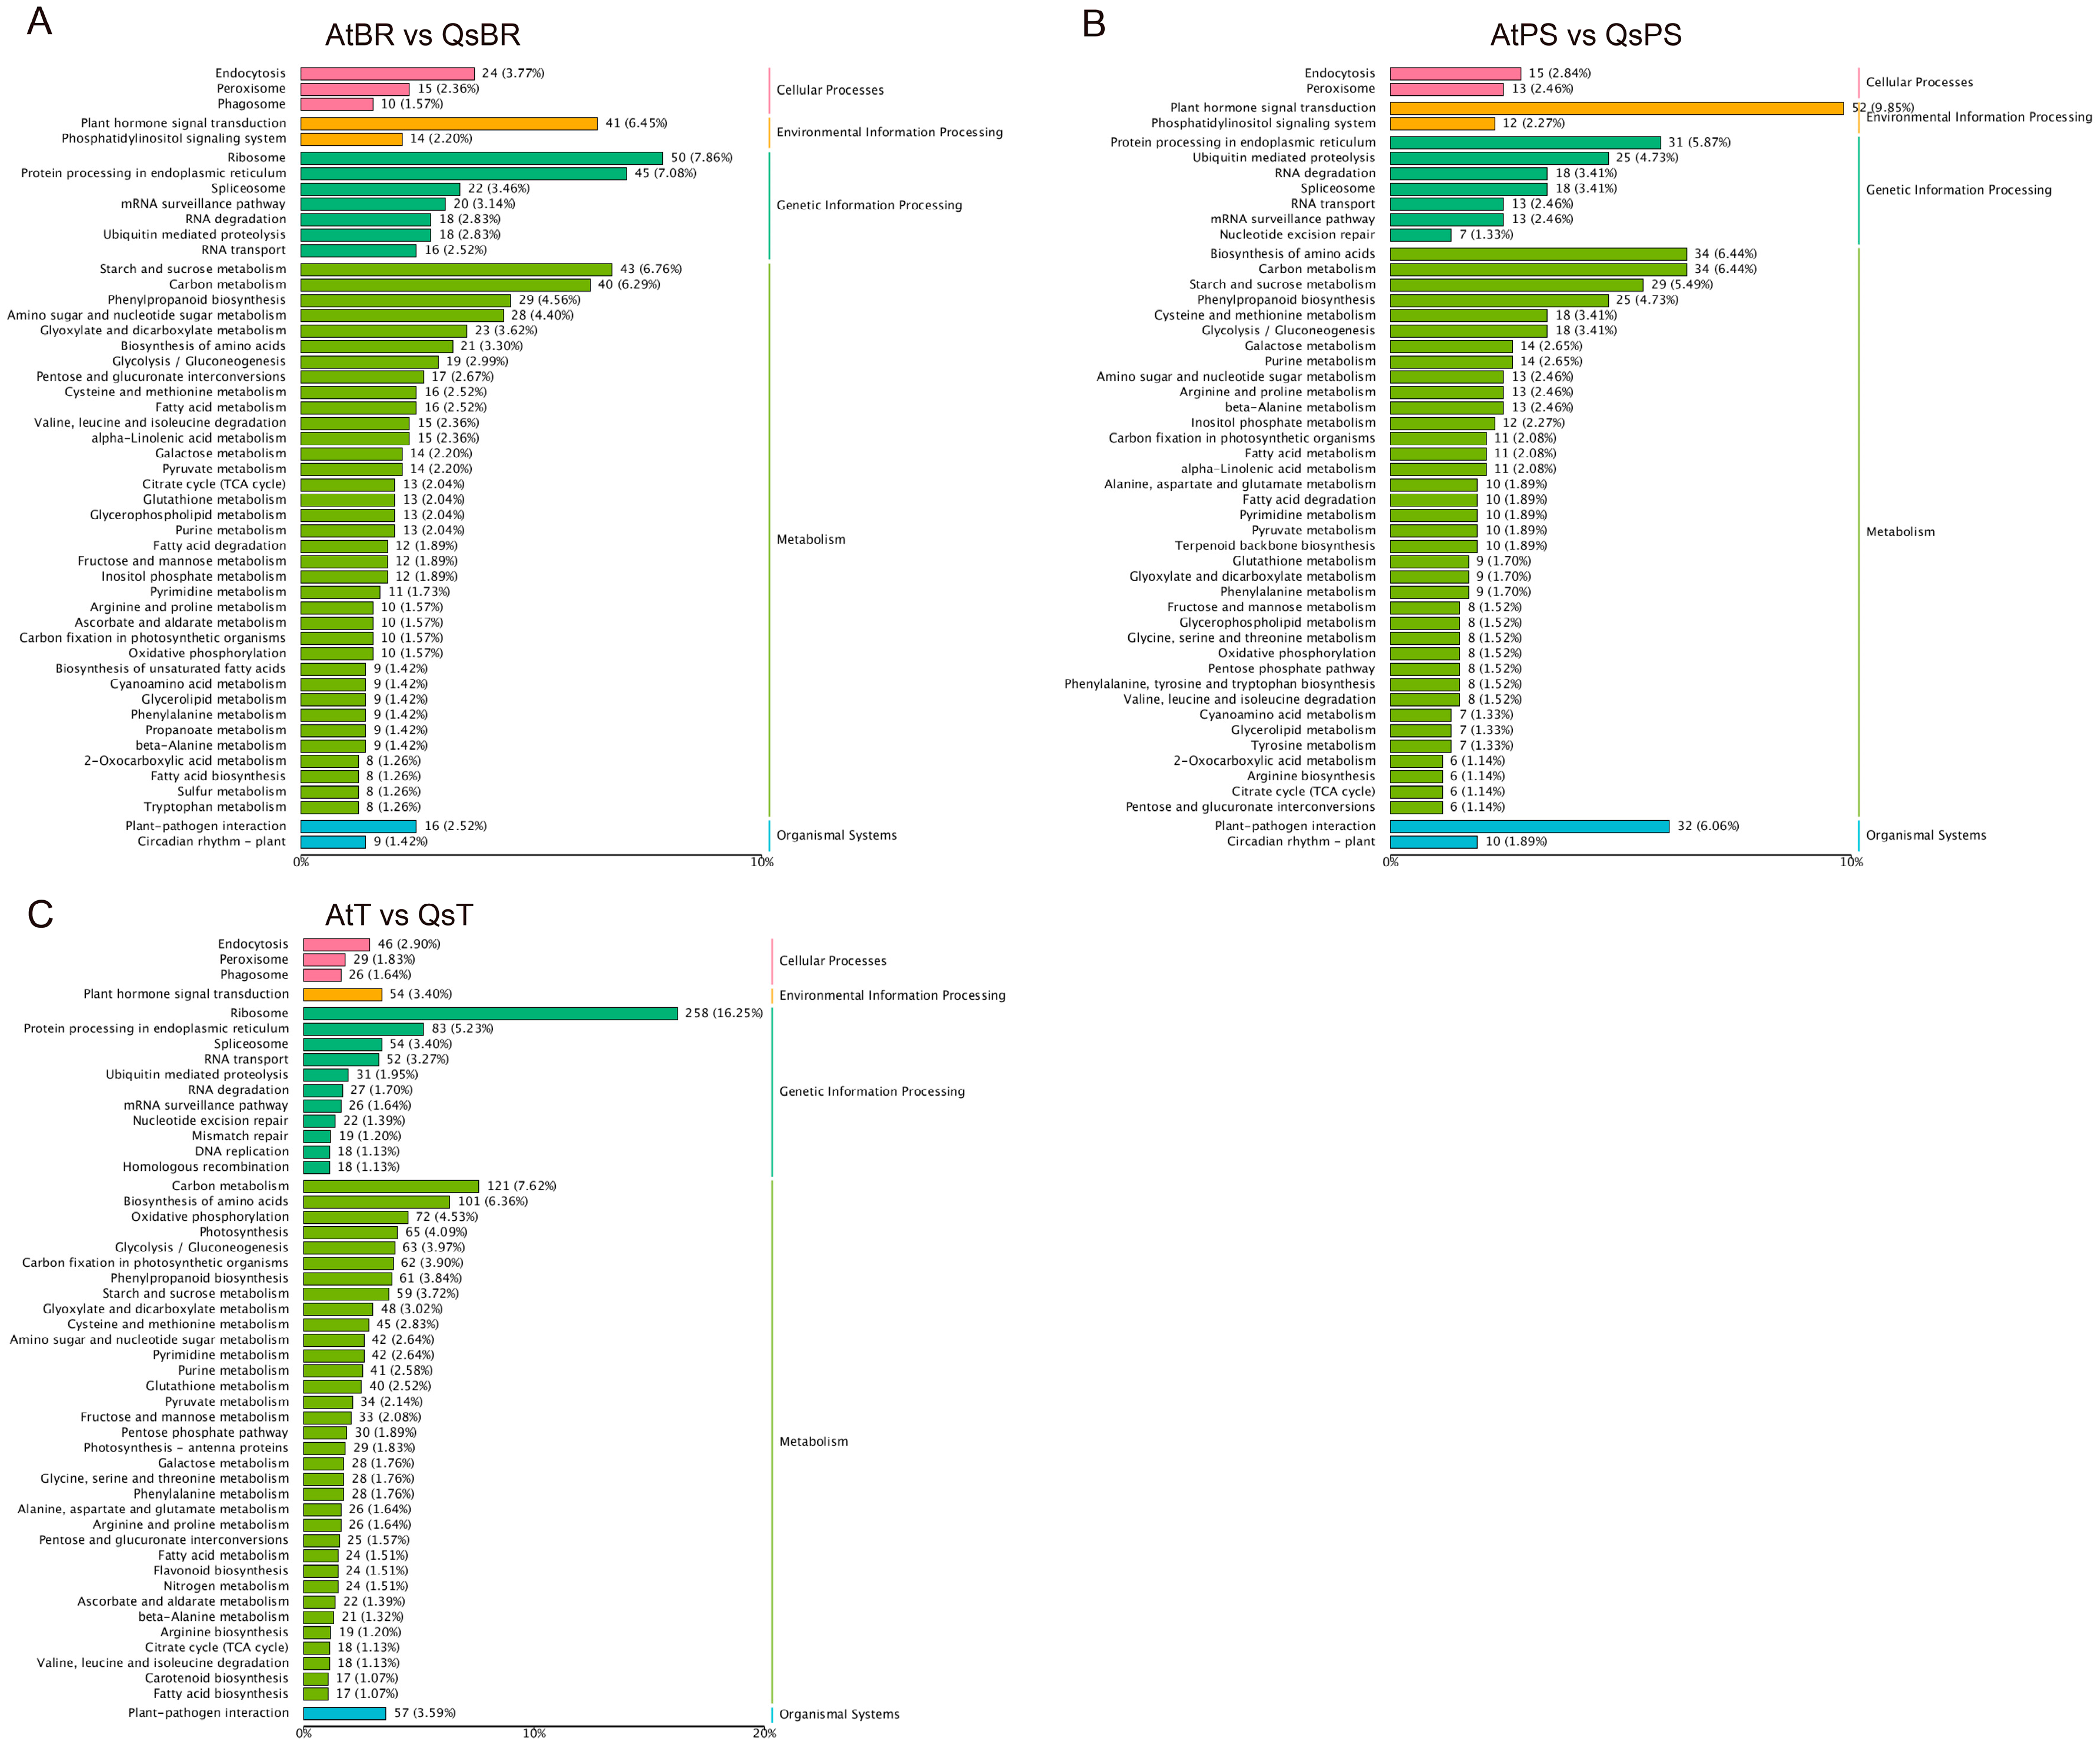
To further explore the biological pathways affected by drought stress, KEGG pathway enrichment analysis was conducted, with particular emphasis on comparisons at the tuber bulking stage. DEGs were enriched across five major KEGG functional categories: Cellular Processes (e.g., Endocytosis, ko04144), Environmental Information Processing (Plant hormone signal transduction, ko04075), Genetic Information Processing (Ribosome, ko03010), Metabolism (Carbon metabolism, ko01200), and Organismal Systems (Plant–pathogen interaction, ko04626). Among these, the metabolism category was the most extensively represented, encompassing a total of 38 enriched pathways. The most highly enriched metabolic pathways included Carbon metabolism (ko01200), starch and sucrose metabolism (ko00500), and Biosynthesis of amino acids (ko01230).
Distinct pathway enrichment patterns were observed among tissue comparisons. In both the basal root tip (AtBR vs. QsBR) and tuber (AtT vs. QsT) comparisons, Ribosome (ko03010) was the most significantly enriched pathway, containing 50 and 258 DEGs, respectively. In contrast, plant hormone signal transduction (ko04075) was the most enriched pathway in the primary stolon comparison (AtPS vs. QsPS), with 52 DEGs identified. This pathway was also enriched in the other two tissue comparisons, with 41 DEGs detected in basal root tips and 54 DEGs in tubers (Figure 4).
Figure 4.
KEGG pathway enrichment analysis of tissue-specific DEGs. Significantly enriched KEGG pathways for differentially expressed genes in pairwise comparisons between Atlantic (At) and Qingshu 9 (Qs) cultivars across three tissues: (A) basal root tips (BR), (B) primary stolons (PS), and (C) tubers (T). The bar chart displays the top enriched pathways based on their statistical significance (|log2FC| ≥ 1, p < 0.05).
3.4. Aux/IAA Transcription Factors Associated with Drought-Responsive Expression Patterns in Potato
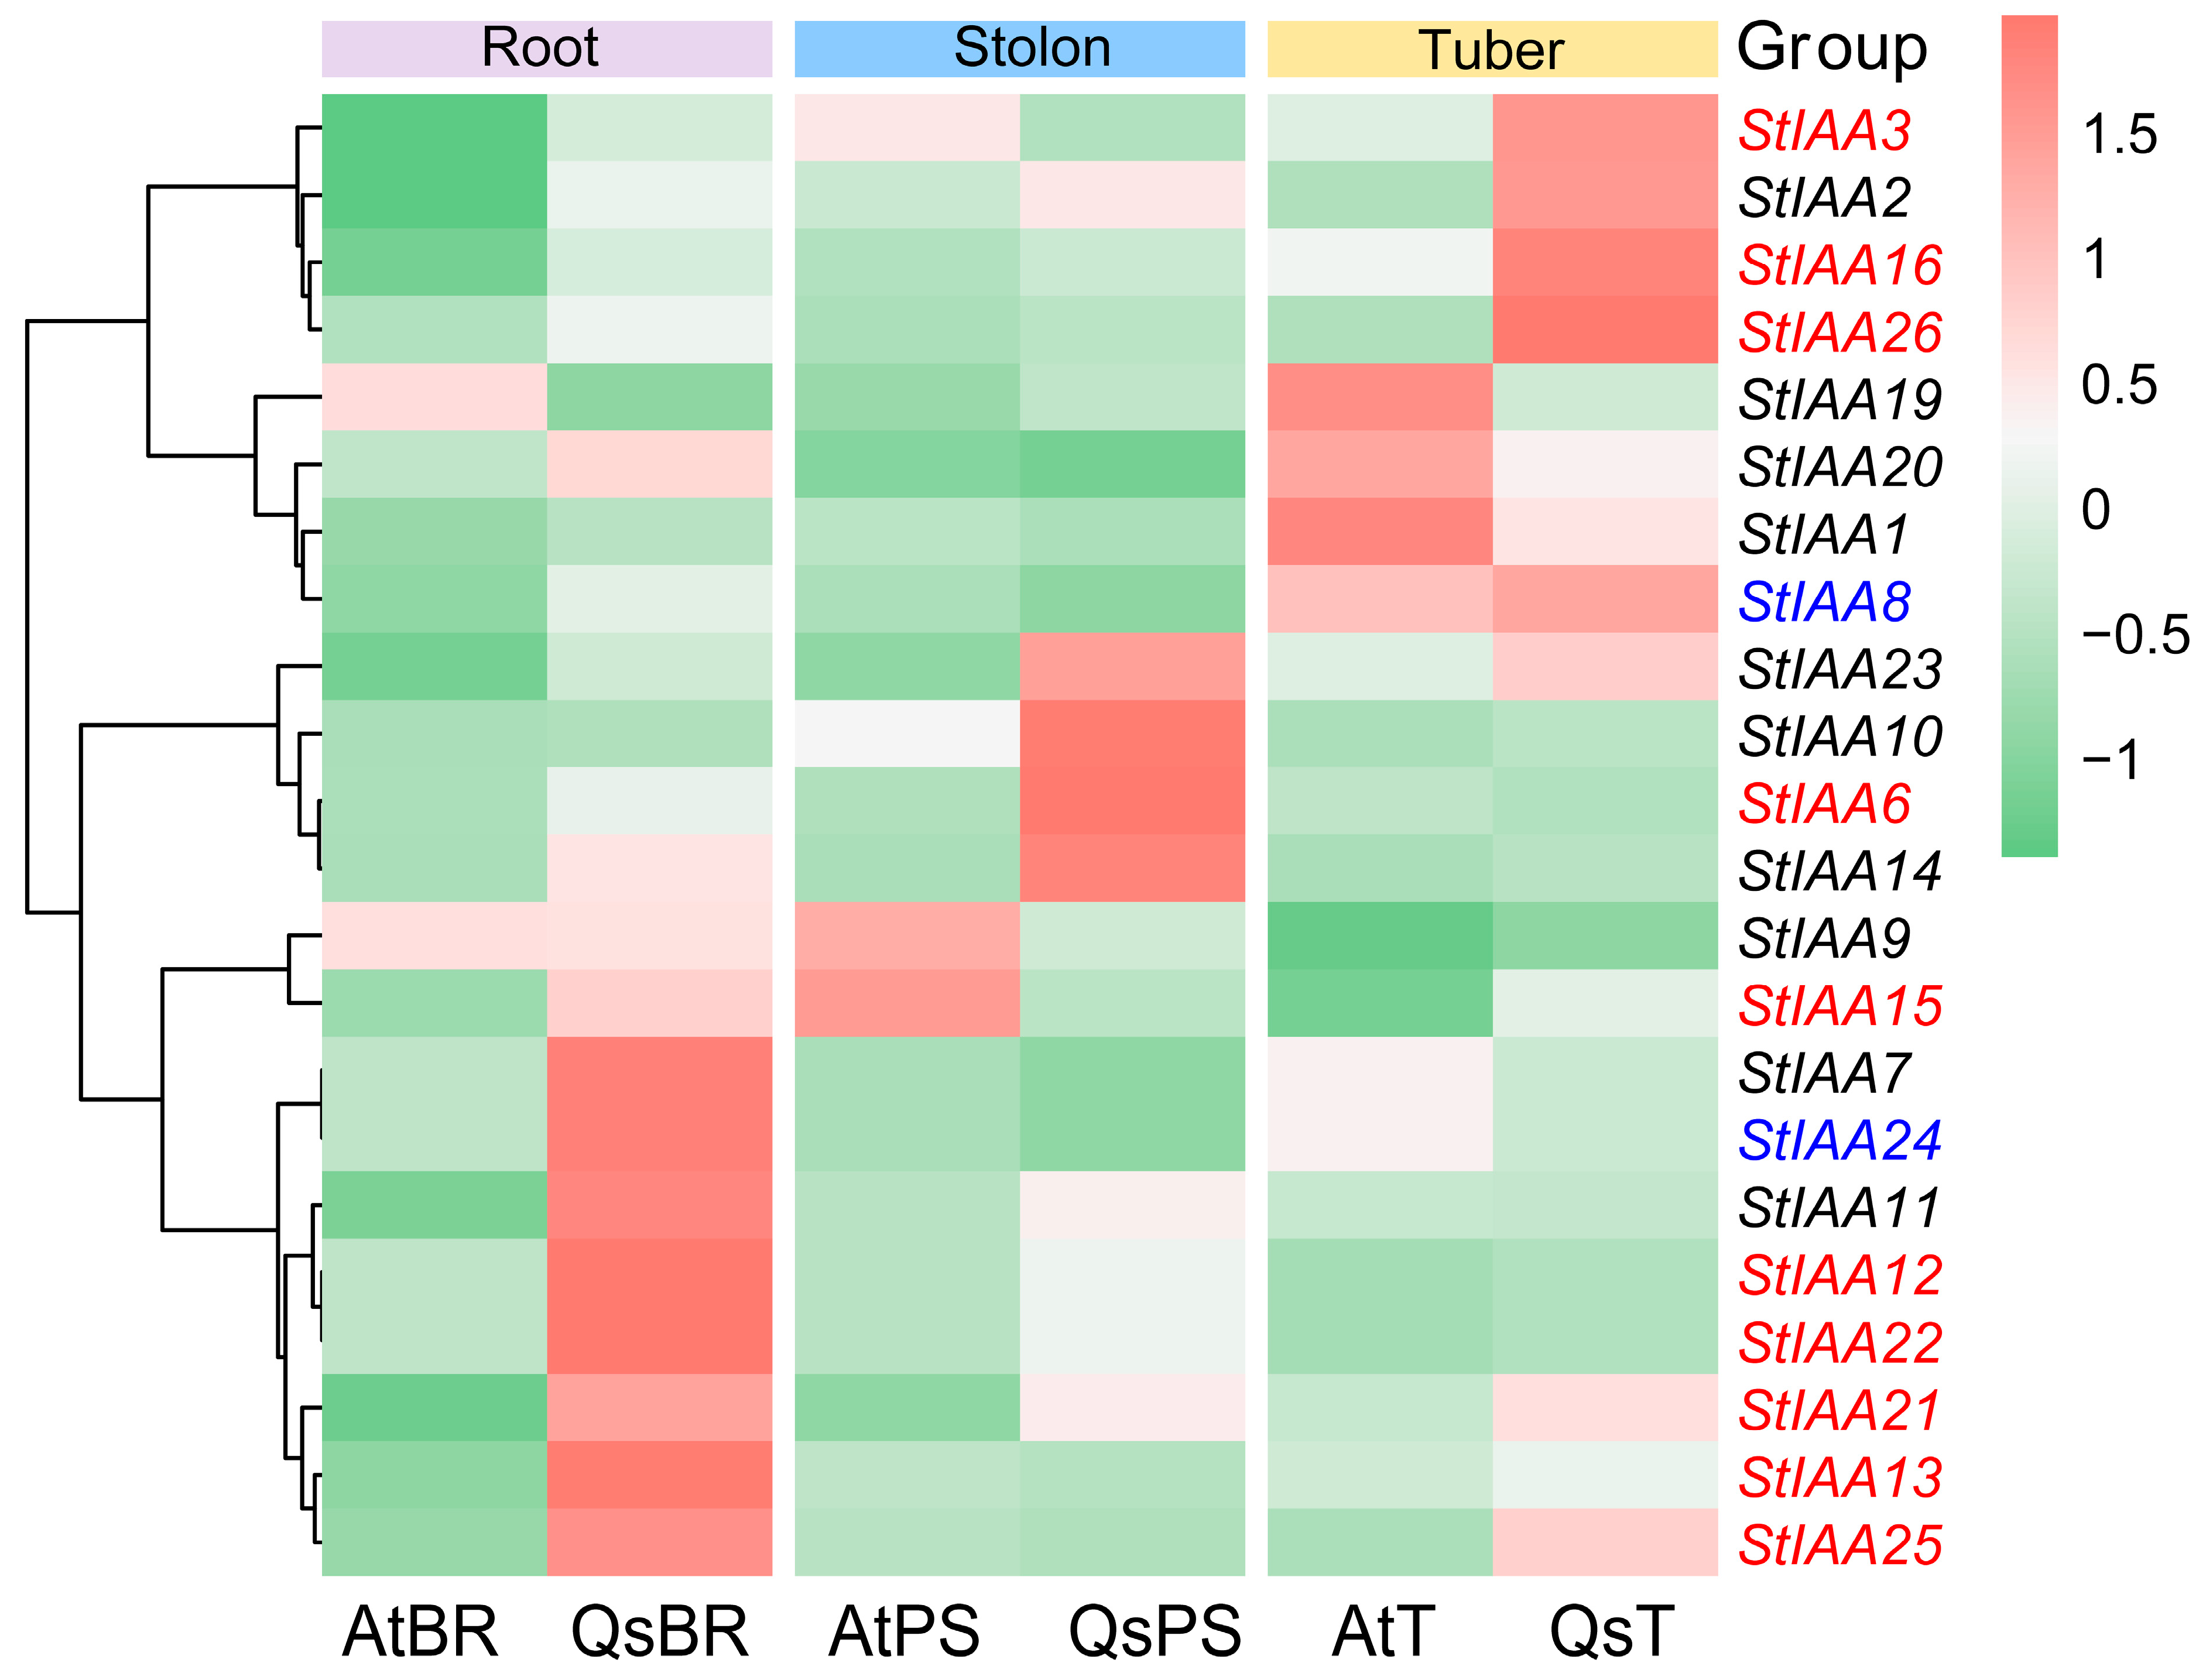
To identify Aux/IAA transcription factors potentially involved in drought responses, transcriptome data from different underground tissues of two potato cultivars were examined in conjunction with the previously identified set of 26 Aux/IAA family members [50]. Heatmap-based clustering analysis revealed marked tissue-dependent differences in Aux/IAA expression patterns between Qingshu 9 and Atlantic under drought stress (Figure 5).
Figure 5.
Heatmap of differentially expressed Aux/IAA genes in response to drought across cultivars and tissues. The heatmap displays the expression patterns of differentially expressed genes from the Aux/IAA family. These genes were identified from pairwise comparisons between the drought-sensitive Atlantic (At) and drought-tolerant Qingshu 9 (Qs) cultivars in three tissues: basal root tips (BR), primary stolons (PS), and tubers (T). Each row represents a gene, and each column represents a tissue-specific comparison. Expression levels are color-coded: red indicates significant up-regulation and blue indicates significant downregulation (|log2FC| ≥ 1, p < 0.05).
In basal root tips, seven Aux/IAA genes—StIAA3, StIAA12, StIAA13, StIAA16, StIAA21, StIAA22, and StIAA25—showed higher expression levels in Qingshu 9 relative to Atlantic. In primary stolons, StIAA6 was upregulated in Qingshu 9, whereas StIAA3, StIAA8, and StIAA24 were downregulated. In tuber tissues, StIAA15 and StIAA26 exhibited significant differential expressions, both showing increased transcript abundance in Qingshu 9 compared with Atlantic (Figure 5). These results indicate pronounced spatial variation in Aux/IAA gene expression across underground organs.
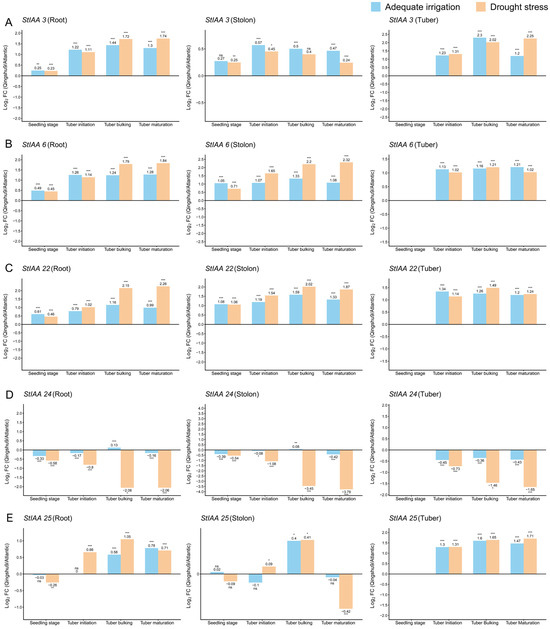
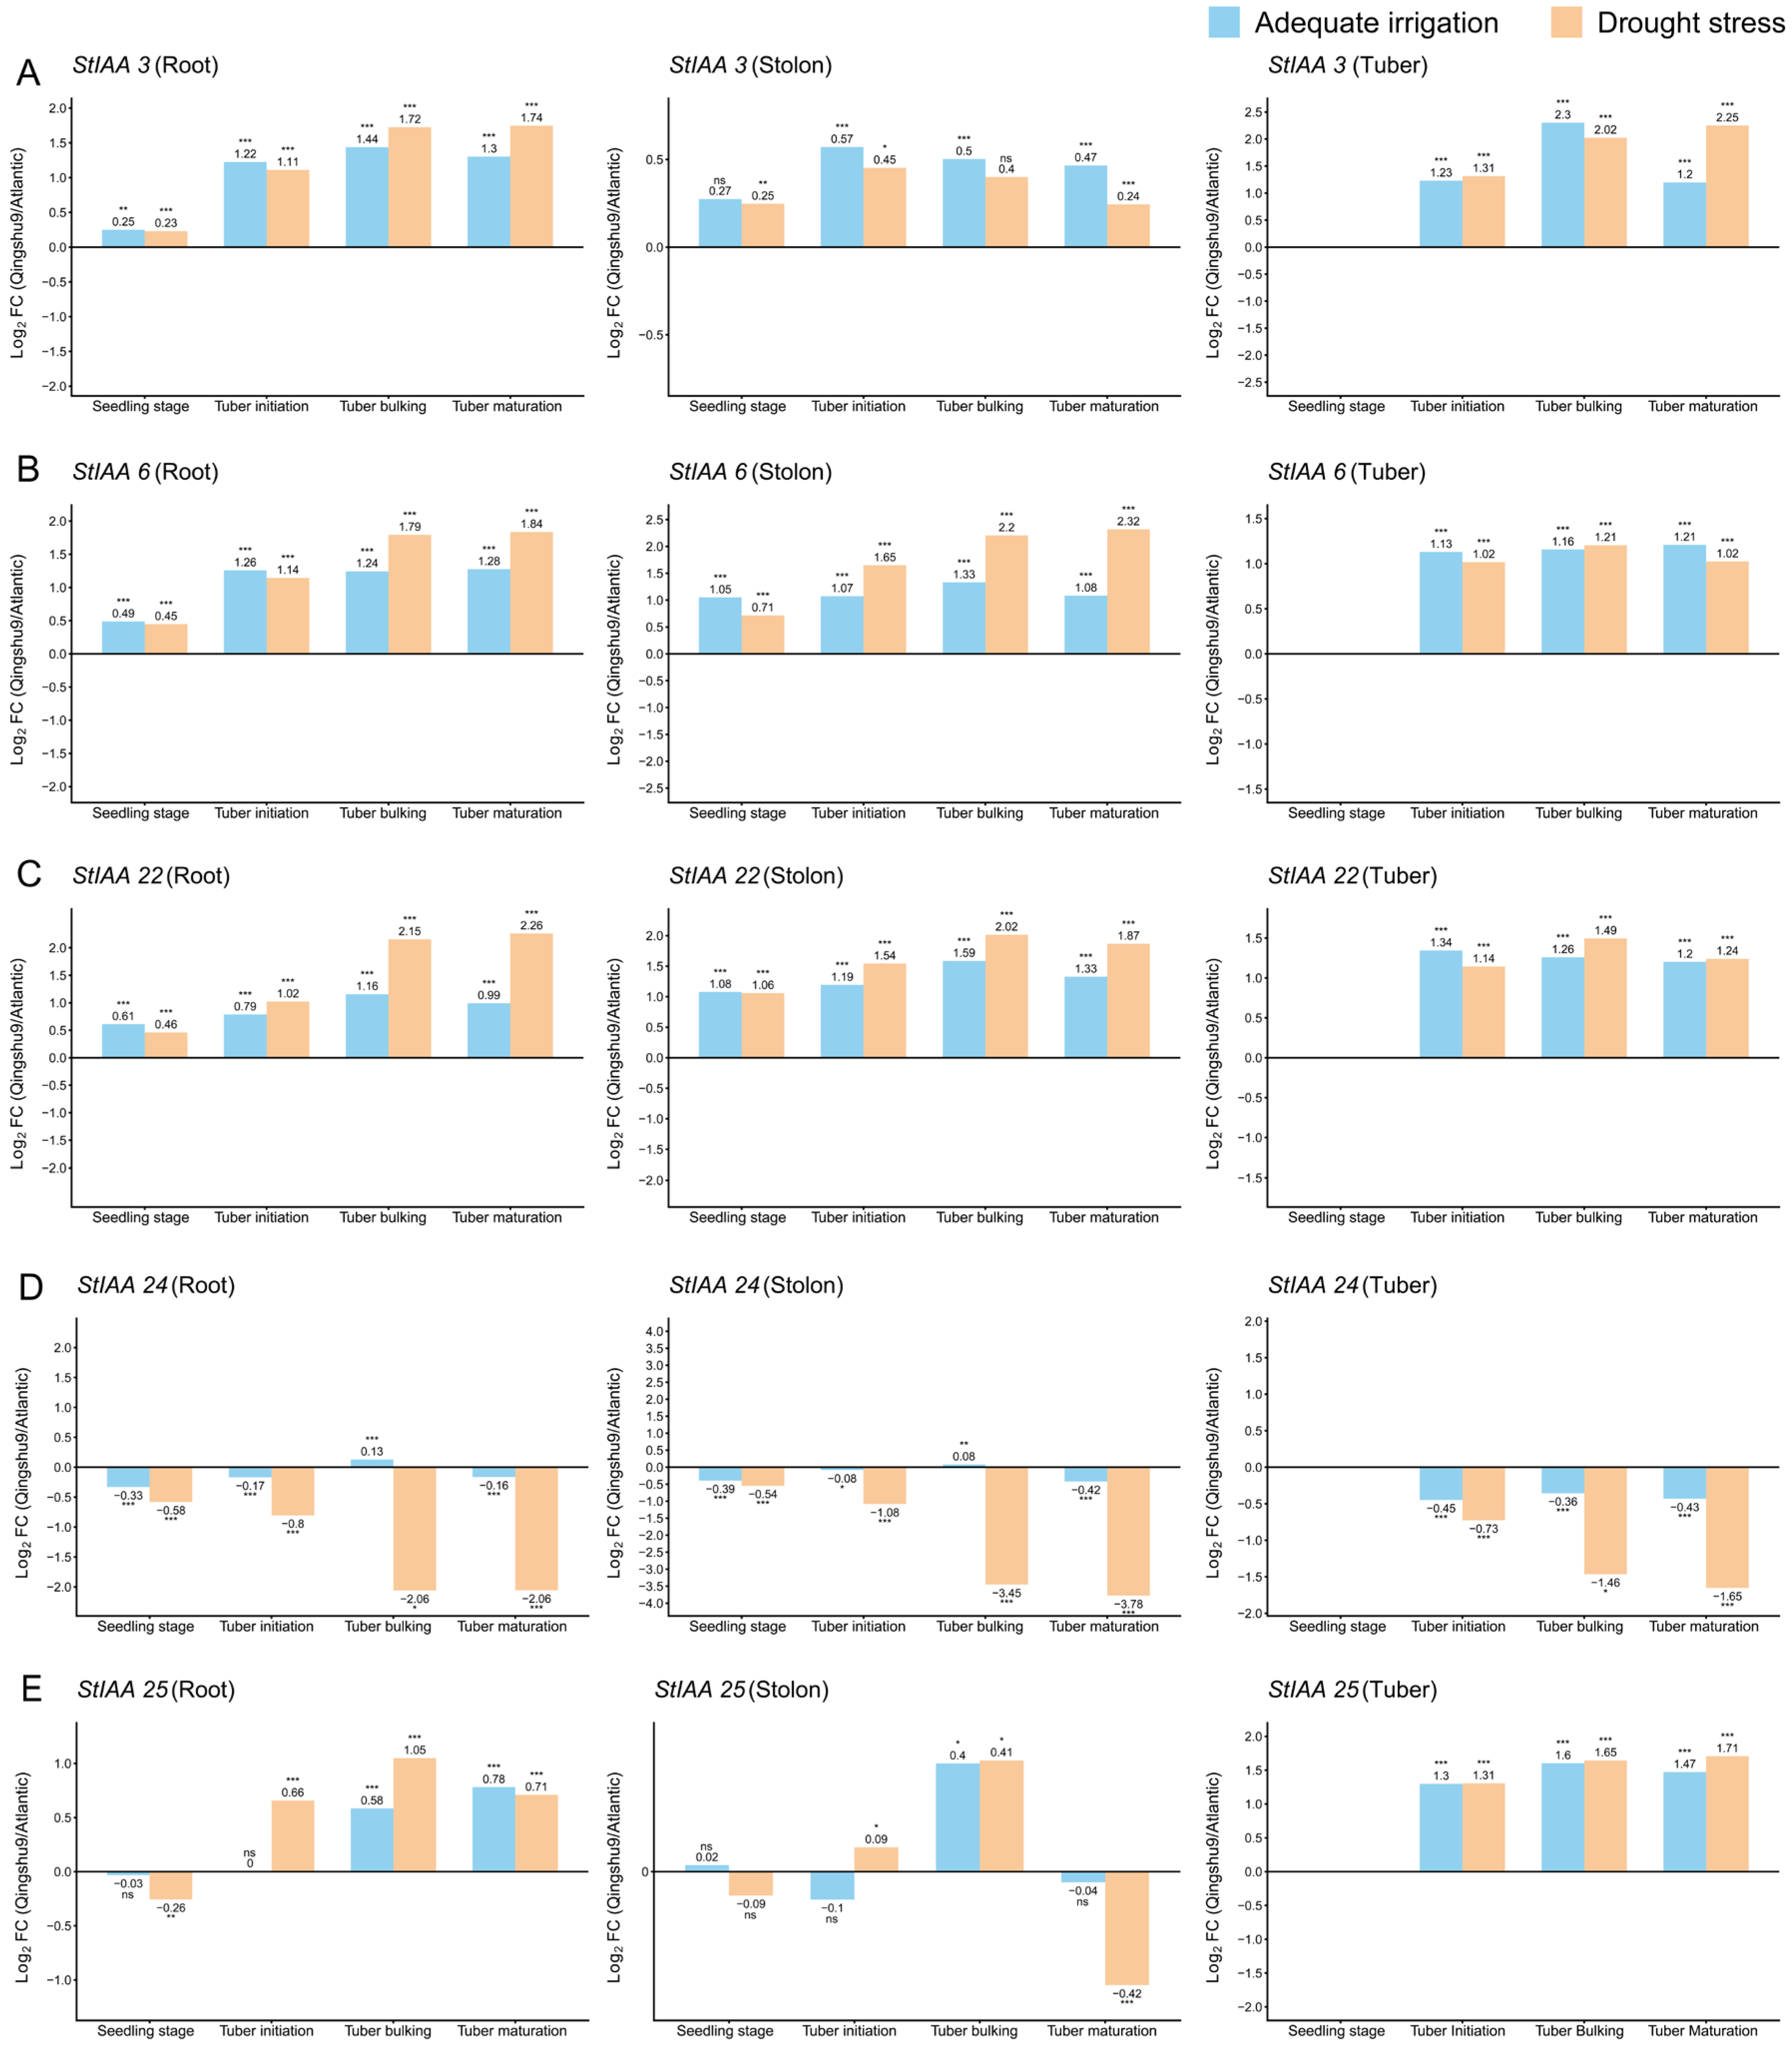
Based on differential expression patterns and tissue specificity, five Aux/IAA genes were selected for further validation by qRT–PCR: StIAA22 and StIAA25 (root tips), StIAA6 and StIAA24 (primary stolons), and StIAA3, which displayed contrasting expression trends between root tips and stolons. Expression profiles of these genes were examined in basal root tips, primary stolons, and tubers across four developmental stages (seedling, tuber initiation, tuber bulking, and tuber maturation) under well-watered and drought conditions (Figure 6). Cultivar-dependent expression differences were quantified as log2FC (mean of Qingshu 9/mean of Atlantic), with positive and negative values indicating higher or lower expression in Qingshu 9, respectively.
Figure 6.
Expression patterns of five Aux/IAA genes under different water regimes, tissues, and developmental stages. Expression patterns of five Aux/IAA genes (A–E) across three tissues (root, stolon, tuber) and four developmental stages under adequate irrigation and drought stress conditions. Bar graphs show the log2FC of gene expression (mean of Qingshu 9/mean of Atlantic) for (A) StIAA3, (B) StIAA6, (C) StIAA22, (D) StIAA24, and (E) StIAA25. Blue bars represent adequate irrigation, and orange bars represent drought stress. Within each panel, the x-axis denotes the four developmental stages: seedling stage, tuber initiation, tuber bulking, and tuber maturation. Data are presented as mean ± SEM (n = 3). Statistical significance was determined by Student’s t-test (ns, not significant; * p < 0.05, ** p < 0.01, *** p < 0.001).
StIAA3 showed elevated expression in Qingshu 9 across all three tissues, with more pronounced differences observed in basal root tips and tubers (log2FC > 1.2). The largest expression difference occurred in tubers during the tuber bulking stage under well-watered conditions (log2FC = 2.30; Figure 6A). StIAA6 was consistently upregulated across tissues and developmental stages, with the highest log2FC value detected in primary stolons during tuber maturation under drought stress (log2FC = 2.32; Figure 6B). A similar expression pattern was observed for StIAA22, which exhibited its maximum differential expression in basal root tips during tuber maturation under drought stress (log2FC = 2.26; Figure 6C). In contrast, StIAA24 showed pronounced downregulation, particularly in primary stolons during tuber maturation under drought conditions (log2FC = −3.78; Figure 6D). StIAA25 displayed tissue-dependent regulation, with significant upregulation in tubers (log2FC > 1.3) but variable expression patterns in other tissues (Figure 6E).
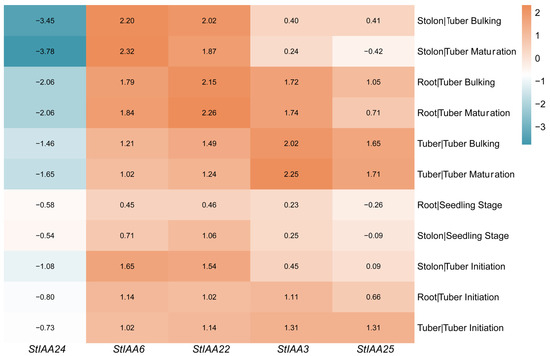
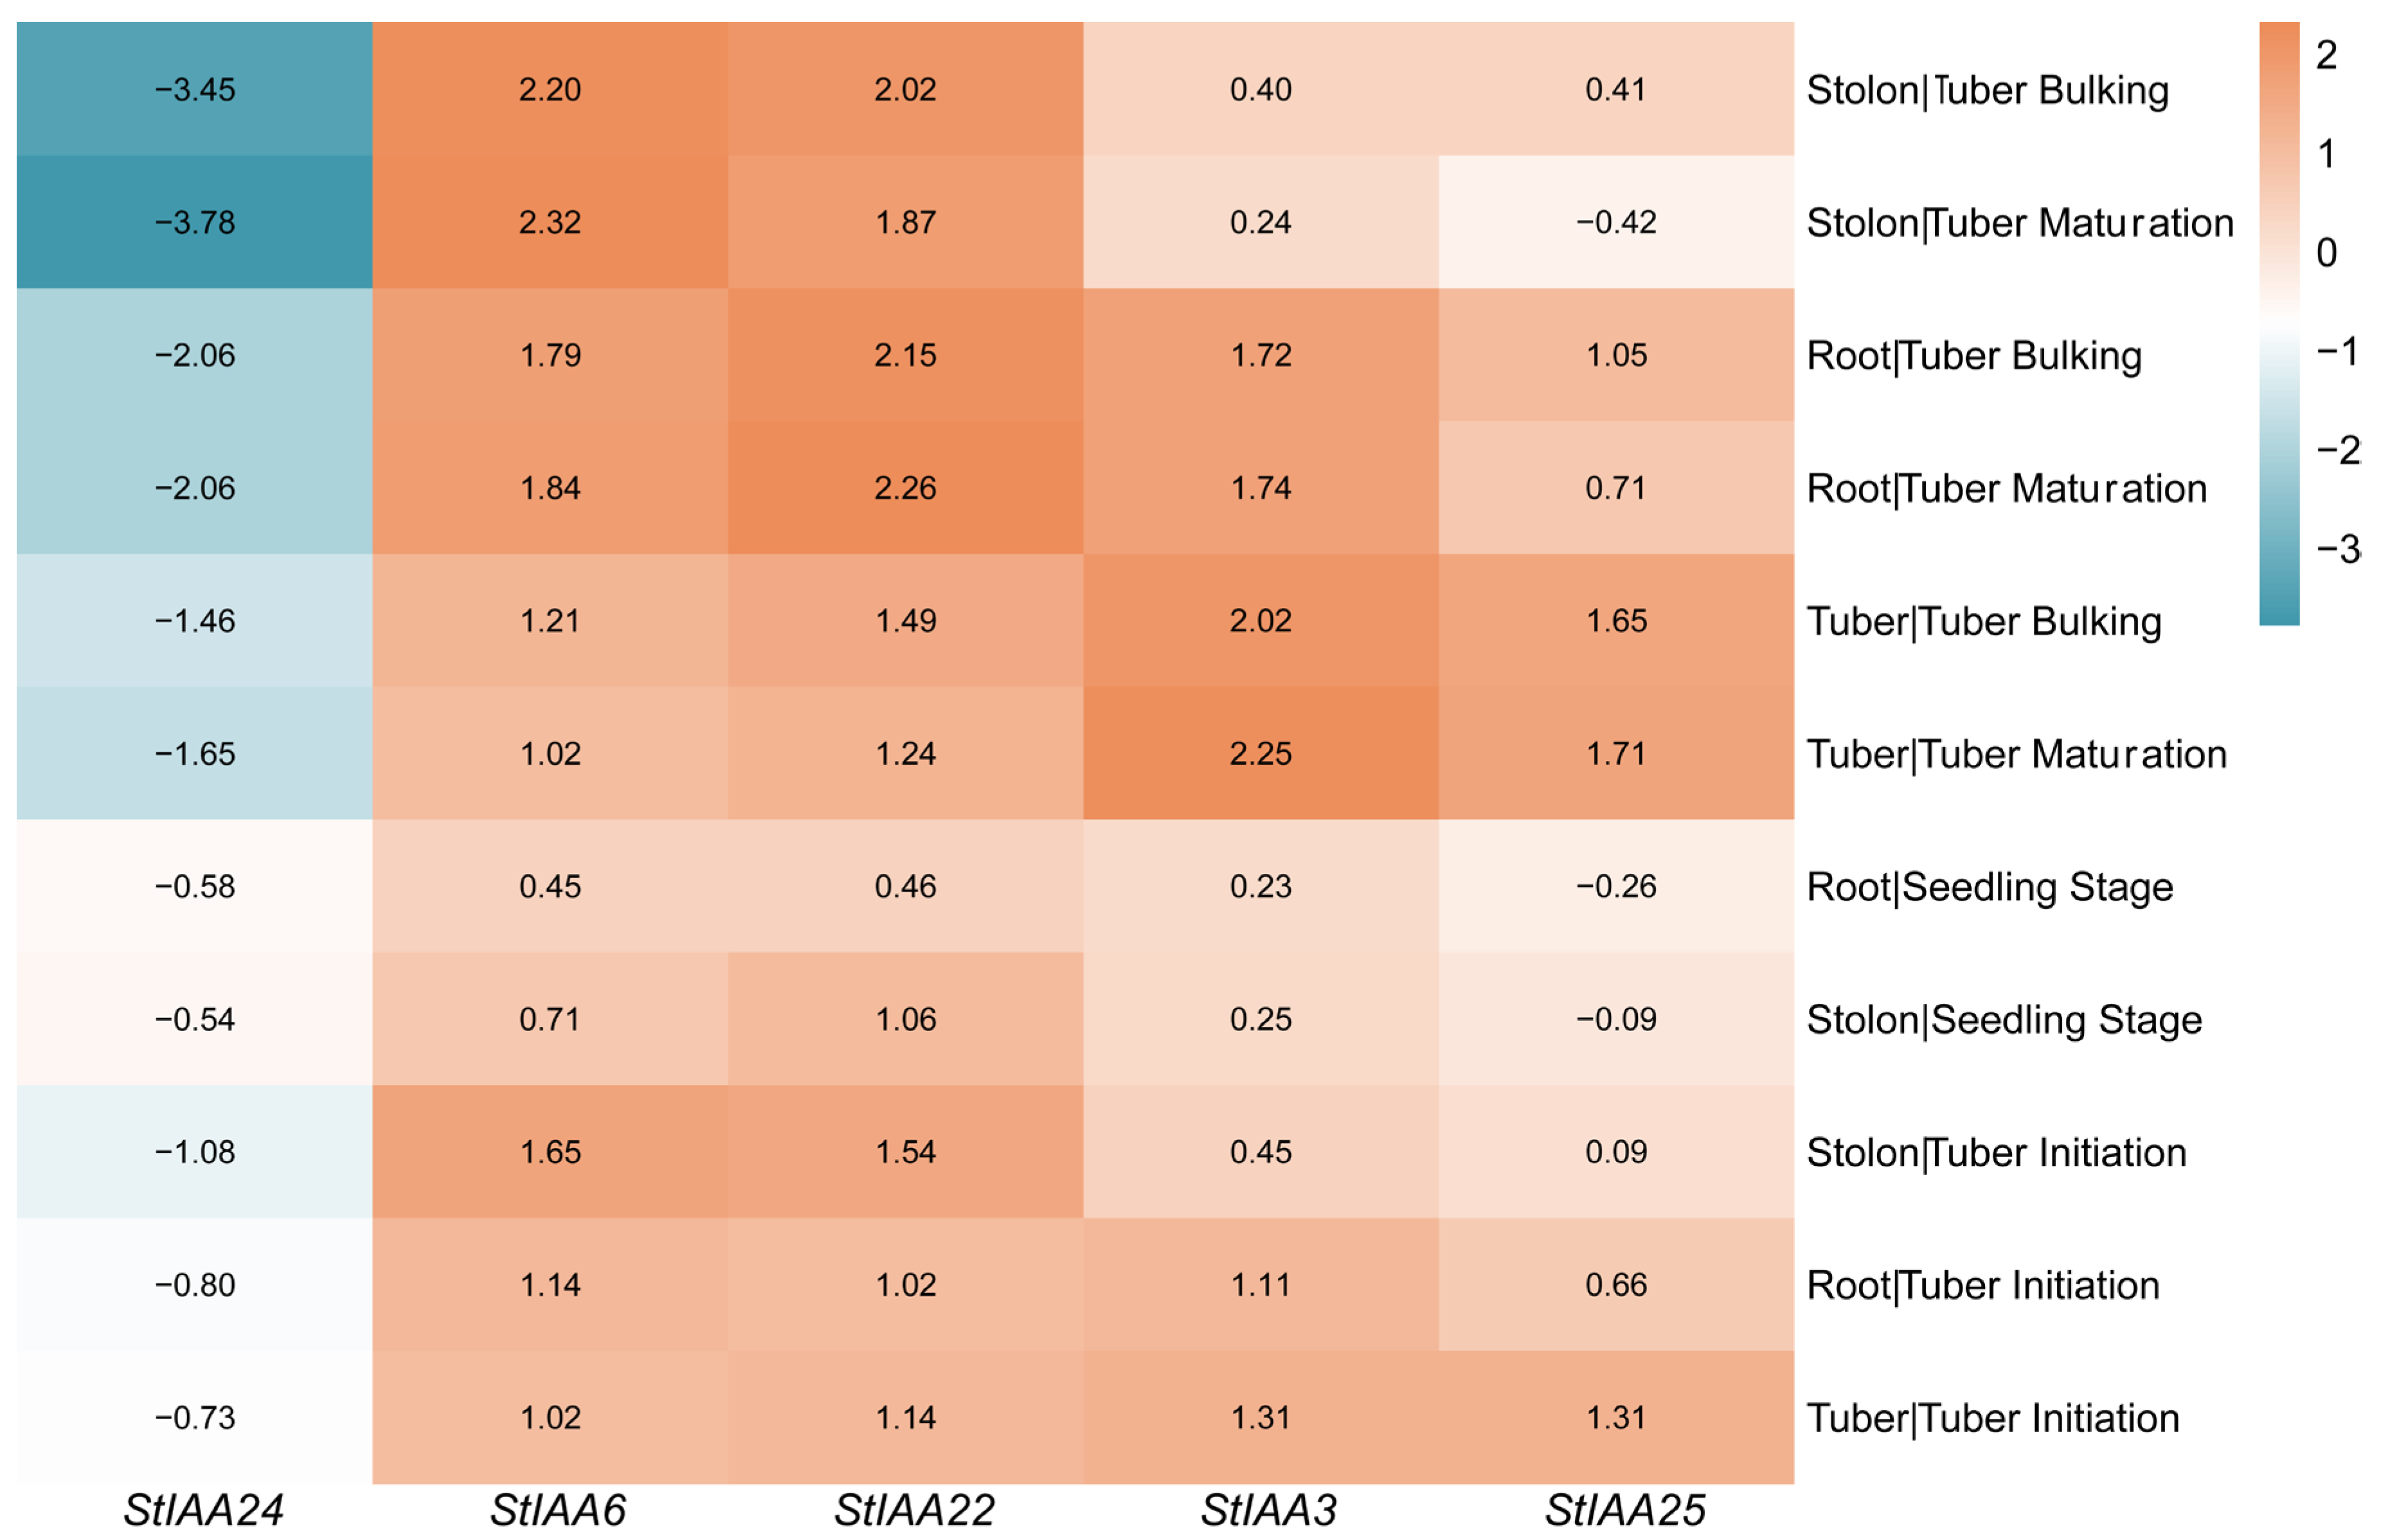
Heatmap clustering of the five selected Aux/IAA genes under drought stress further highlighted strong spatiotemporal specificity in their expression patterns (Figure 7). Differential expressions were most pronounced during the tuber bulking and tuber maturation stages, whereas minimal cultivar-dependent differences were observed at the seedling stage. Across tissues, the magnitude of expression differences generally followed the order primary stolon > basal root tip > tuber, although substantial transcriptional regulation was also evident in tubers, where all |log2FC| values exceeded 1.
Figure 7.
Hierarchical clustering reveals co-expression modules of Aux/IAA genes across tissues and development under drought. Heatmap visualization of expression patterns for five selected Aux/IAA genes under drought stress. The color scale represents the log2FC (mean of Qingshu 9/mean of Atlantic) in gene expression. Columns correspond to individual genes, while rows represent samples from three tissues—root, stolon, and tuber—across four developmental stages: seedling stage, tuber initiation, tuber bulking, and tuber maturation. Both columns (genes) and rows (samples) are clustered based on their expression similarity, highlighting groups of genes with coordinated expression responses to drought across specific tissue-stage combinations.
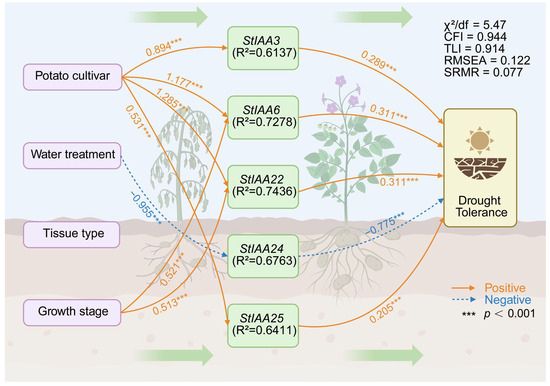
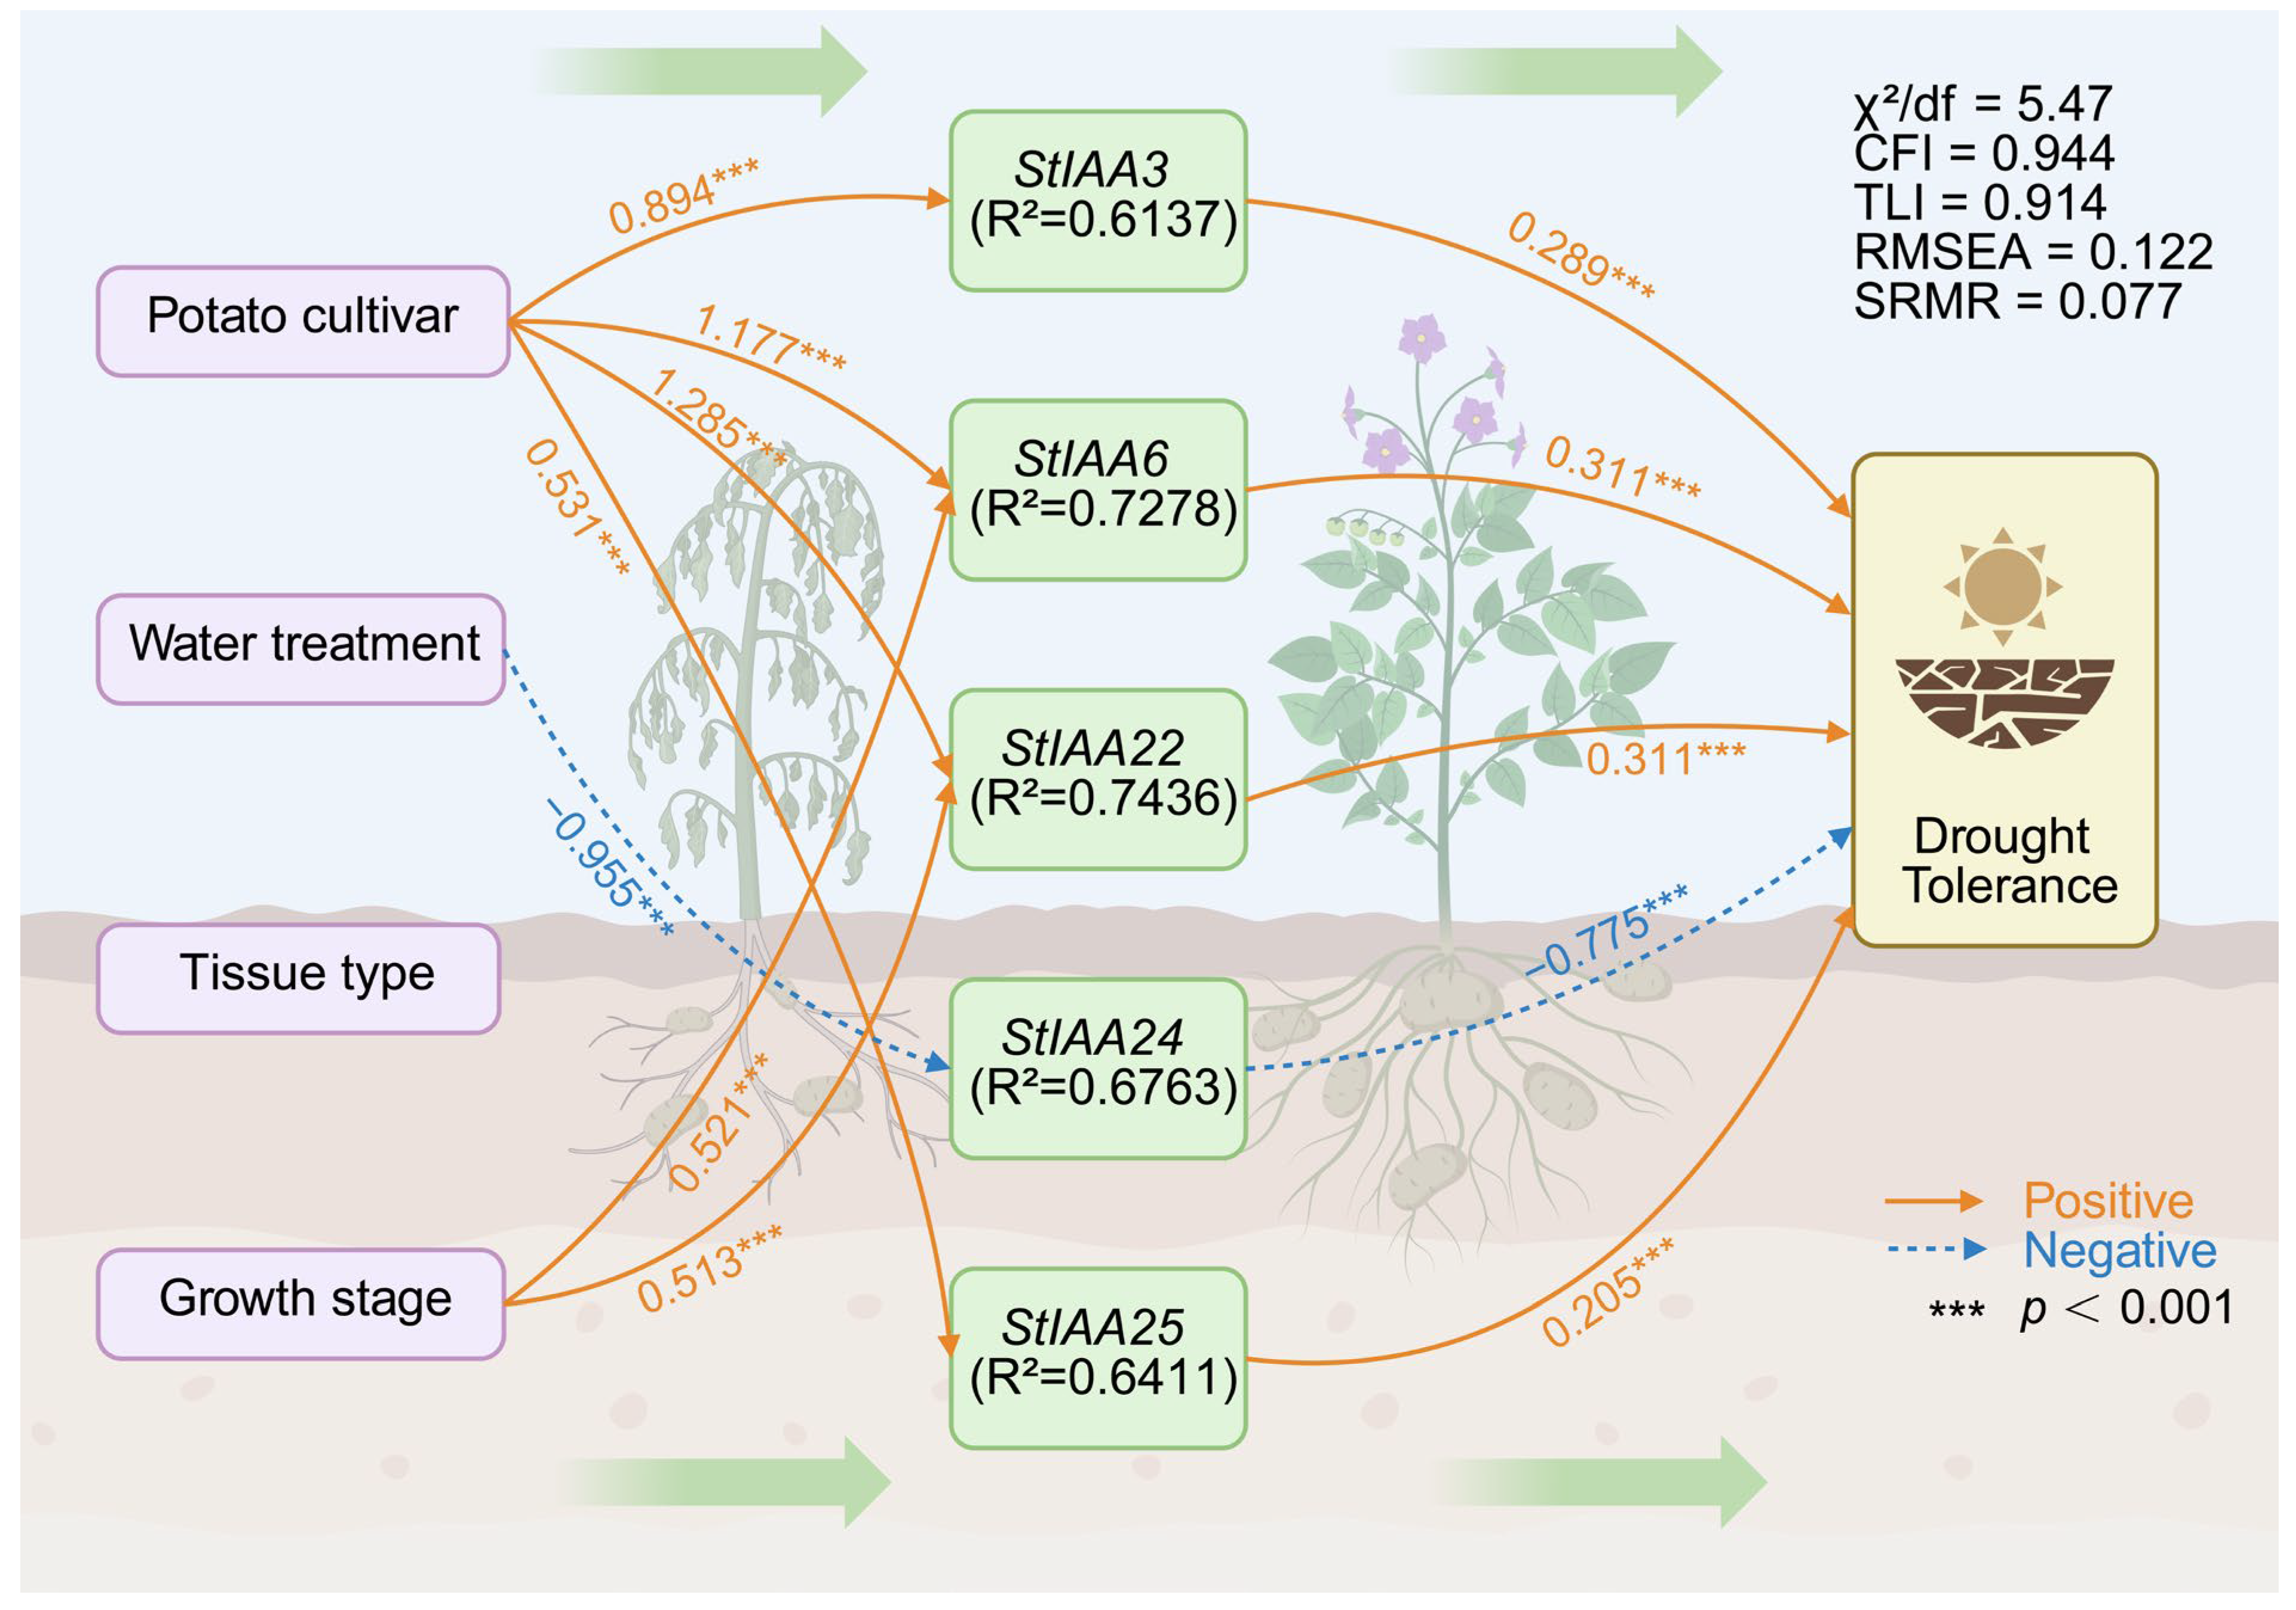
To explore statistical relationships between Aux/IAA expression patterns and drought-related traits, structural equation modeling (SEM) was applied across all treatments. The model exhibited acceptable fit indices (χ2/df = 5.47, CFI = 0.944, TLI = 0.914, RMSEA = 0.122, SRMR = 0.077). Path analysis revealed significant associations between the expression levels of the five Aux/IAA genes and drought-related response variables (p < 0.001). Positive path coefficients were observed for StIAA3 (β = 0.289), StIAA6 (β = 0.311), StIAA22 (β = 0.311), and StIAA25 (β = 0.205), whereas StIAA24 showed a negative association (β = −0.775) (Figure 8).
Figure 8.
Structural equation modeling of the genetic regulatory network underlying drought tolerance in potato. The model delineates hypothesized causal pathways among experimental factors (cultivar, water treatment, tissue, growth stage), the expression of five key Aux/IAA genes (StIAA3, StIAA6, StIAA22, StIAA24, StIAA25), and the composite phenotype of drought tolerance. Solid (orange) arrows denote significant positive regulatory effects, and dashed (blue) arrows denote significant negative effects. Path coefficients are standardized estimates (β), with significance levels: *** p < 0.001. The proportion of variance explained for each endogenous gene expression variable is given by its coefficient of determination (R2). Model fit indices: χ2/df = 5.47, CFI = 0.944, TLI = 0.914, RMSEA = 0.122, SRMR = 0.077.
3.5. Involvement of Aux/IAA Transcription Factors in Potato Root Morphology
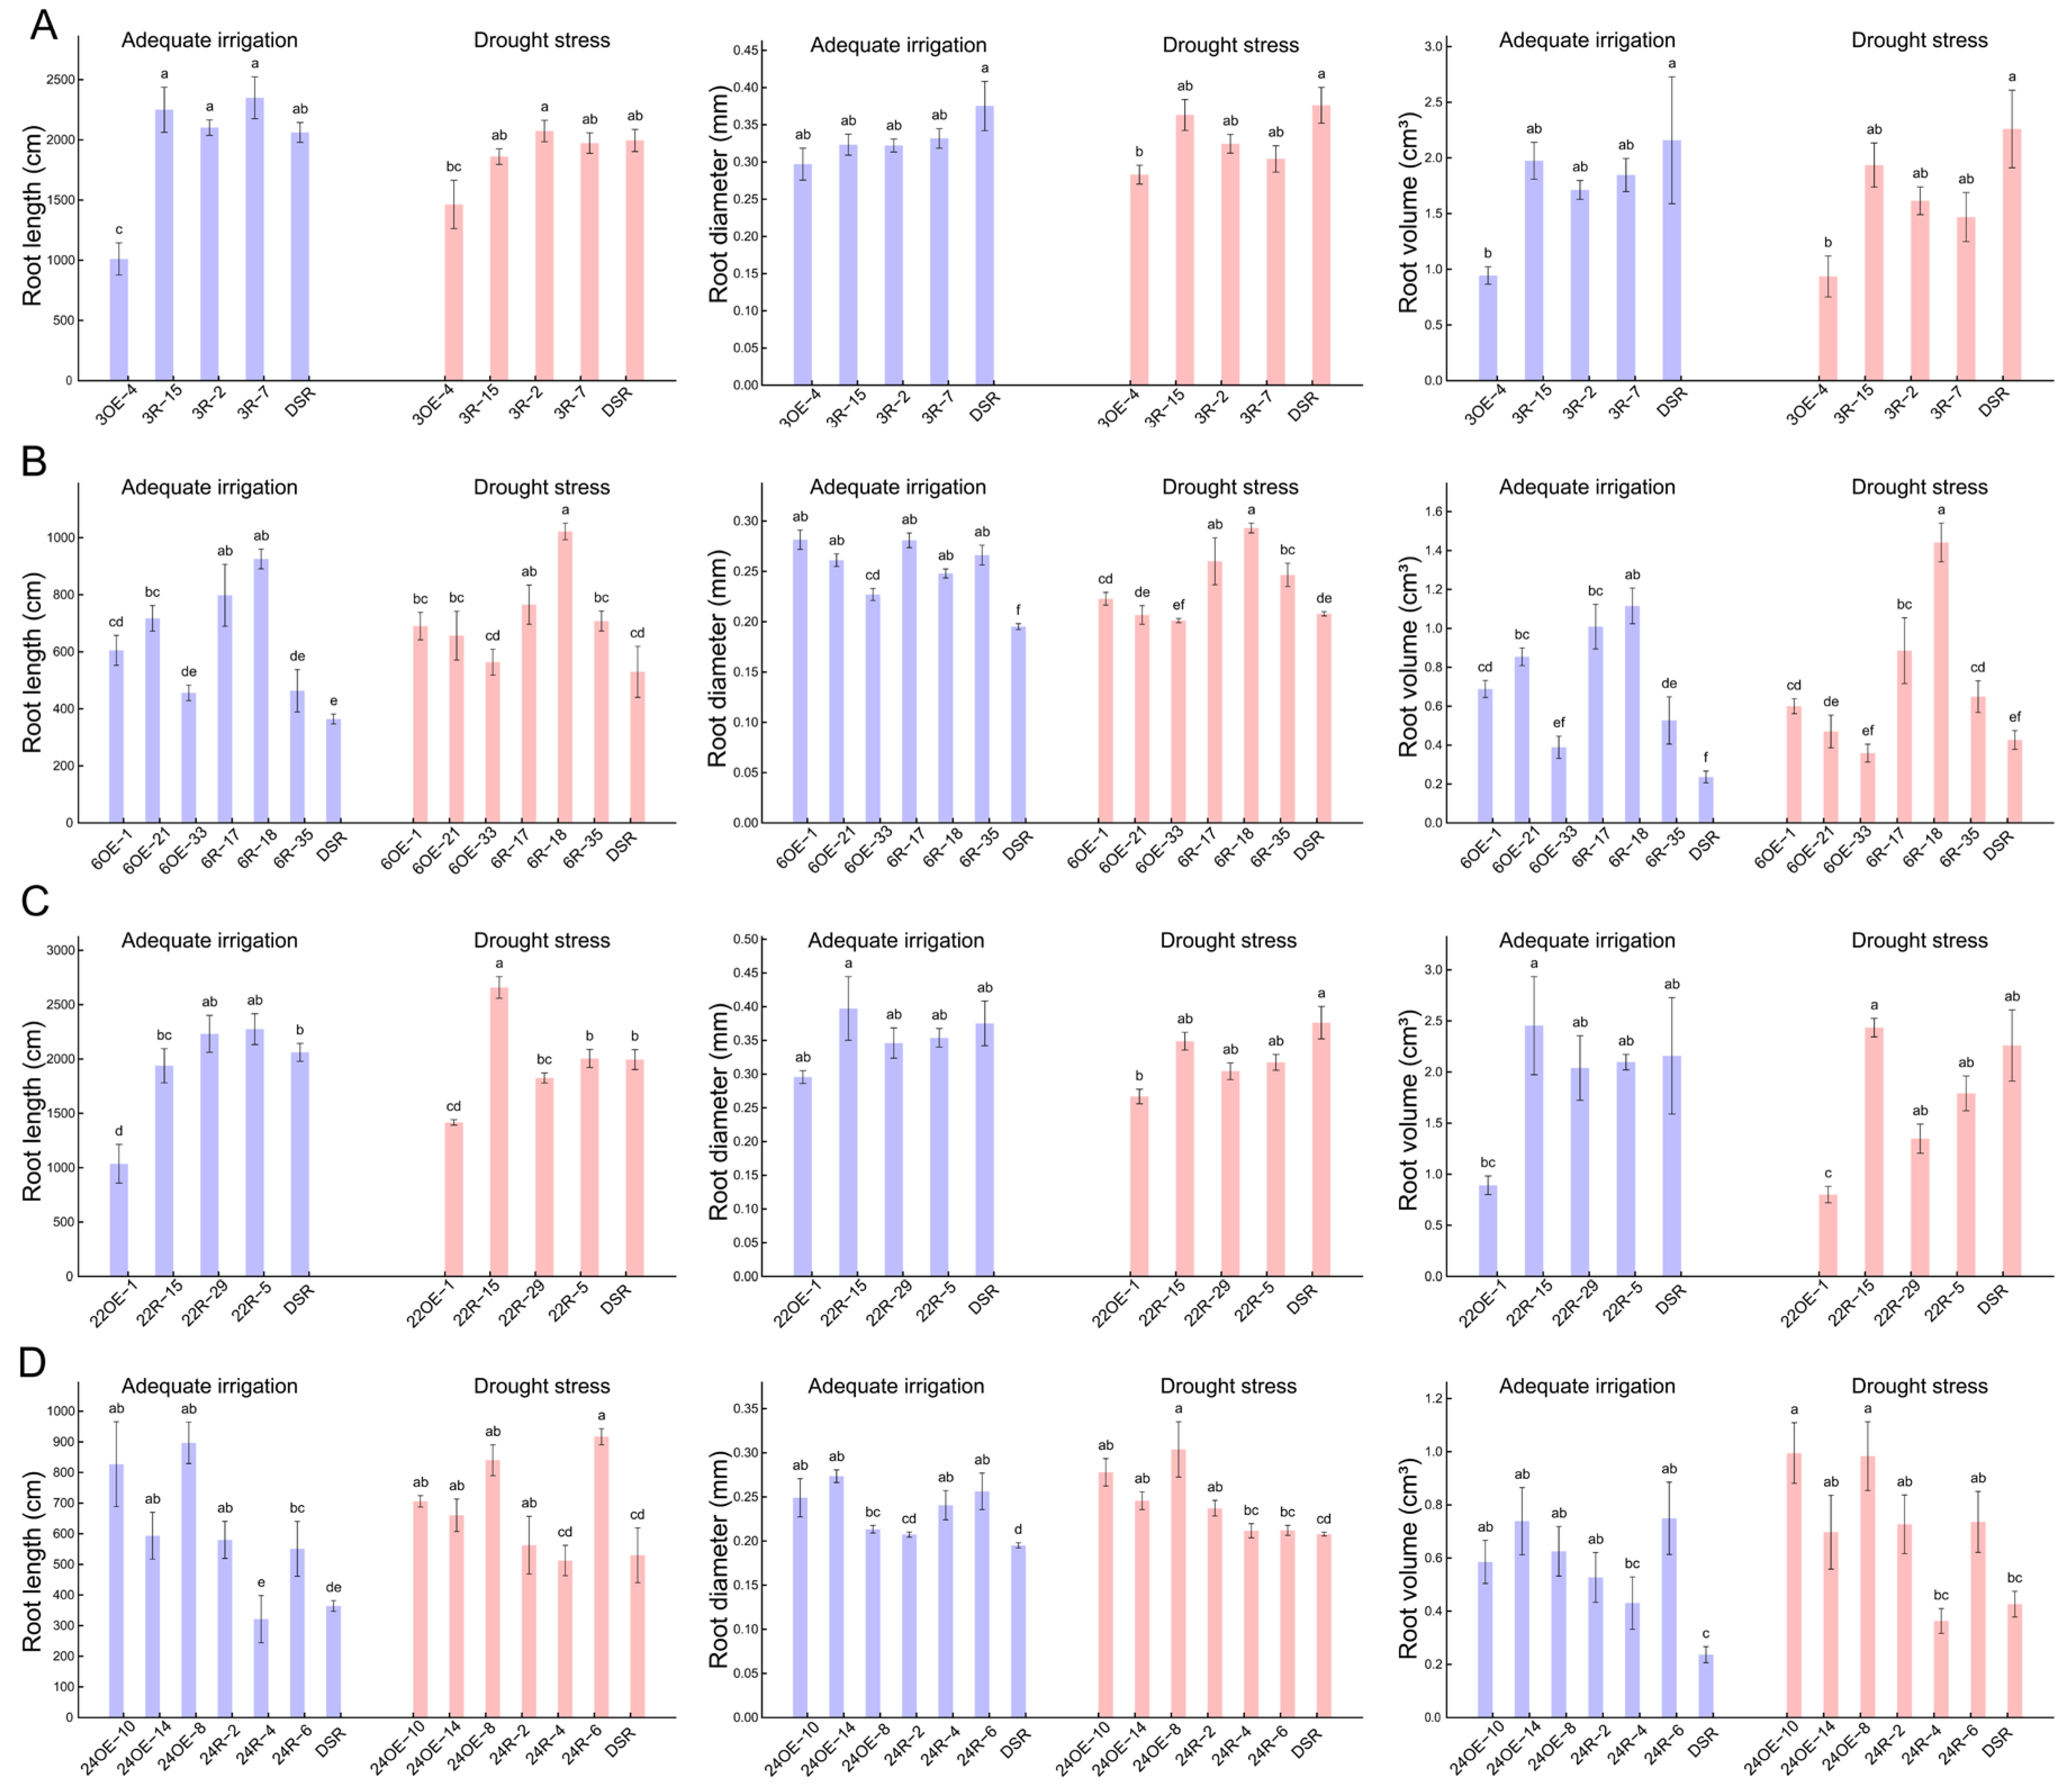
Based on the association patterns revealed by structural equation modeling, four Aux/IAA transcription factors—StIAA3, StIAA6, StIAA22, and StIAA24—were selected for further functional analysis. To examine their potential roles in regulating root development, both overexpression and knockdown transgenic lines were generated for each gene. Root morphological traits, including root length, diameter, and volume, were measured under well-watered and drought conditions to evaluate changes in root architecture associated with altered gene expression (Figure 9).
Figure 9.
Root architectural phenotypes of Aux/IAA transgenic lines under drought stress. Bar graphs compare three root architectural traits—root length, diameter, and volume—between adequate irrigation and drought stress conditions for transgenic potato lines. For each gene, independent transgenic lines are compared to “DSR” (control). Panels show data for (A) StIAA3, (B) StIAA6, (C) StIAA22, and (D) StIAA24. The analyzed lines include: StIAA3 knockdown (3R-2, 3R-7, 3R-15) and overexpression (3OE-4); StIAA6 knockdown (6R-17, 6R-18, 6R-35) and overexpression (6OE-1, 6OE-21, 6OE-33); StIAA22 knockdown (22R-5, 22R-15, 22R-29) and overexpression (22OE-1); StIAA24 knockdown (24R-2, 24R-4, 24R-6) and overexpression (24OE-8, 24OE-10, 24OE-14). Data are presented as mean ± SEM (n = 5). Different lowercase letters above bars within each trait indicate statistically significant differences (p < 0.05) as determined by one-way ANOVA followed by Tukey’s HSD post hoc test.
Distinct root morphological responses were observed among the four genes. Overexpression of StIAA3 (Figure 9A), StIAA6 (Figure 9B), and StIAA22 (Figure 9C) resulted in reduced root length, diameter, and volume compared with their corresponding knockdown lines and the wild-type control. These reductions were consistently observed under both well-watered and drought conditions. Among these genes, the inhibitory effects on root morphology were more pronounced in StIAA3- and StIAA22-overexpressing lines than in StIAA6-overexpressing lines. Under well-watered conditions, root traits in StIAA3 and StIAA22 overexpression lines were significantly lower than those in their respective knockdown lines, although these differences were attenuated under drought stress; root parameters remained below control levels.
In contrast, overexpression of StIAA24 was associated with enhanced root growth (Figure 9D). StIAA24-overexpressing lines generally exhibited increased root length, diameter, and diameter relative to knockdown lines and the wild-type control. This phenotype was evident under both watering regimes and was particularly pronounced under drought conditions, where root diameter in StIAA24-overexpressing lines was significantly greater than that of the control. Knockdown of StIAA24 resulted in reduced root growth relative to overexpression lines.
Taken together, these results demonstrate that the four selected Aux/IAA transcription factors are associated with distinct and gene-specific effects on potato root morphology under both well-watered and drought conditions. The observed root architectural changes are consistent with expression trends identified in the transcriptome analysis and support a role for Aux/IAA genes in modulating root development in potato.
4. Discussion
4.1. Aux/IAA Genes in Potato Drought Responses: Current Evidence and Knowledge Gap
Drought is a recurrent constraint for potato production, and responses in underground organs are particularly relevant because they integrate water acquisition with storage organ development [51,52]. Aux/IAA proteins are core repressors in canonical auxin signaling and are well established as regulators of developmental plasticity [53,54,55]. In several species, Aux/IAA family members have been implicated in abiotic stress responses, frequently through effects on growth traits such as root architecture [56,57,58]. However, for potato, the Aux/IAA family has not been evaluated in a tissue-resolved manner under drought, and functional evidence remains sparse. This gap is non-trivial because potato underground organs (roots, stolons, tubers) differ in developmental programs and sink behavior, so drought-responsive regulation may not be conserved across tissues.
4.2. Tissue-Dependent Transcriptomic Divergence Between Contrasting Cultivars Under Drought
Using two cultivars with contrasting drought tolerance, we observed pronounced tissue-dependent transcriptional divergence under drought. The magnitude of differential expression varied across basal root tips, primary stolons, and tubers, with tubers showing the largest number of DEGs. Enrichment analyses showed that DEGs were frequently assigned to broad functional categories (metabolic processes, catalytic activity, transporter activity), which is consistent with the extensive metabolic adjustment typically induced by water deficit. KEGG enrichment further indicated recurrent involvement of pathways related to carbon metabolism, starch and sucrose metabolism, ribosome, and plant hormone signal transduction. Importantly, hormone signal transduction appeared in all tissue comparisons, suggesting that cultivar-dependent drought responses in underground organs are coupled to hormone-mediated transcriptional regulation rather than being restricted to a single developmental module.
4.3. Candidate Drought-Responsive StIAA Genes Show Strong Spatiotemporal Structure
Within the 26 previously annotated potato Aux/IAA family members, transcriptome-based screening identified distinct cultivar- and tissue-dependent expression patterns. Several genes exhibited higher transcript abundance in the drought-tolerant cultivar in basal root tips, and primary stolons displayed a different pattern, including downregulation of specific Aux/IAA members alongside upregulation of others. Such divergence is consistent with functional specialization within the family and is compatible with the known context dependence of Aux/IAA–ARF interactions in auxin signaling [59,60].
Five genes (StIAA3, StIAA6, StIAA22, StIAA24, and StIAA25) were selected for qRT–PCR validation and spatiotemporal profiling across tissues and developmental stages. This analysis showed that cultivar-dependent differences were minimal at the seedling stage but became more pronounced during tuber bulking and tuber maturation. The opposite expression trend of StIAA24 relative to several other candidates further supports heterogeneity within the family and argues against treating Aux/IAA genes as a uniform drought-induced module in potato.
4.4. Root Architectural Phenotypes in Transgenic Lines and Implications
To link candidate gene expression patterns with developmental outputs, we generated overexpression and knockdown lines for four prioritized genes (StIAA3, StIAA6, StIAA22, and StIAA24) and quantified root morphological traits under well-watered and drought conditions. Altered expressions of StIAA3, StIAA6, and StIAA22 were associated with reduced root length, diameter, and volume, whereas StIAA24 overexpression was associated with increased root growth traits, including a larger root diameter under drought. These gene-specific phenotypes are consistent with the transcript-level divergence observed among tissues and between cultivars, and they support a role for Aux/IAA components in modulating root architecture.
At the same time, the present data link Aux/IAA genes primarily to root morphological variation. Whether these architectural shifts translate into improved whole-plant drought performance cannot be concluded without direct drought tolerance endpoints (e.g., survival, biomass maintenance, water status, gas exchange, or tuber yield) [61,62]. Future work should therefore couple genetic perturbation of these candidates with physiological measurements and yield-related traits, and test whether the effects are stable across genetic backgrounds and environmental settings.
5. Conclusions
This study provides a tissue-resolved view of drought-responsive transcriptional differences between two potato cultivars with contrasting drought tolerance and highlights hormone-related pathways as recurring features of the response in underground organs. Within the Aux/IAA family, we identified cultivar- and tissue-dependent expression patterns and validated spatiotemporal dynamics for five candidate genes across organs and developmental stages.
Functional analyses using overexpression and knockdown lines indicate that altered expressions of StIAA3, StIAA6, StIAA22, and StIAA24 are associated with distinct, gene-specific root architectural phenotypes under both well-watered and drought conditions. Together, these results support Aux/IAA transcription factors as components of the regulatory network controlling potato root development during water deficit and provide candidate entry points for subsequent mechanistic and trait-oriented studies.
Author Contributions
Conceptualization, X.Q., L.W. (Lin Wang), S.F. and L.W. (Li Wang); methodology, L.W. (Lin Wang), S.F. and L.W. (Li Wang); formal analysis, X.Q. and T.H.; investigation, X.Q., Y.W. and T.H.; resources, S.F. and L.W. (Li Wang); data curation, X.Q., Y.W. and T.H.; writing—original draft preparation, X.Q.; writing—review and editing, L.W. (Lin Wang) and L.W. (Li Wang); visualization, X.Q.; supervision, S.F. and L.W. (Li Wang); project administration, S.F. and L.W. (Li Wang); funding acquisition, L.W. (Li Wang). All authors have read and agreed to the published version of the manuscript.
Funding
This research was funded by the National Natural Science Foundation of China (31760407, 32472826), the Leading Project of the “Three Agri-Priorities with Nine Directions” Science and Technology Collaboration Plans in Zhejiang Province (2025SNJF016), the Wenzhou University research start-up fund (QD2024084), and the Wenzhou City Talent Introduction fund (R20241101), Central Government Funds for Guiding Local Scientific and Technological Development (2025ZY01039).
Institutional Review Board Statement
Not applicable.
Data Availability Statement
The original data presented in the study are openly available in the NCBI database at https://www.ncbi.nlm.nih.gov/sra/?term=PRJNA592879 (accessed on 2 December 2019), accession number SUB6636959.
Conflicts of Interest
The authors declare no conflicts of interest.
Appendix A
Appendix A.1
Table A1.
Length distribution of assembled transcripts and unigenes.
Figure A1.
Heatmap of Pearson correlation coefficients between samples. The color gradient represents the strength of correlation (scale bar). Sample abbreviations: At, Atlantic; Qs, Qingshu 9; BR, basal root tips; PS, primary stolons; T, tubers; numbers indicate biological replicates.
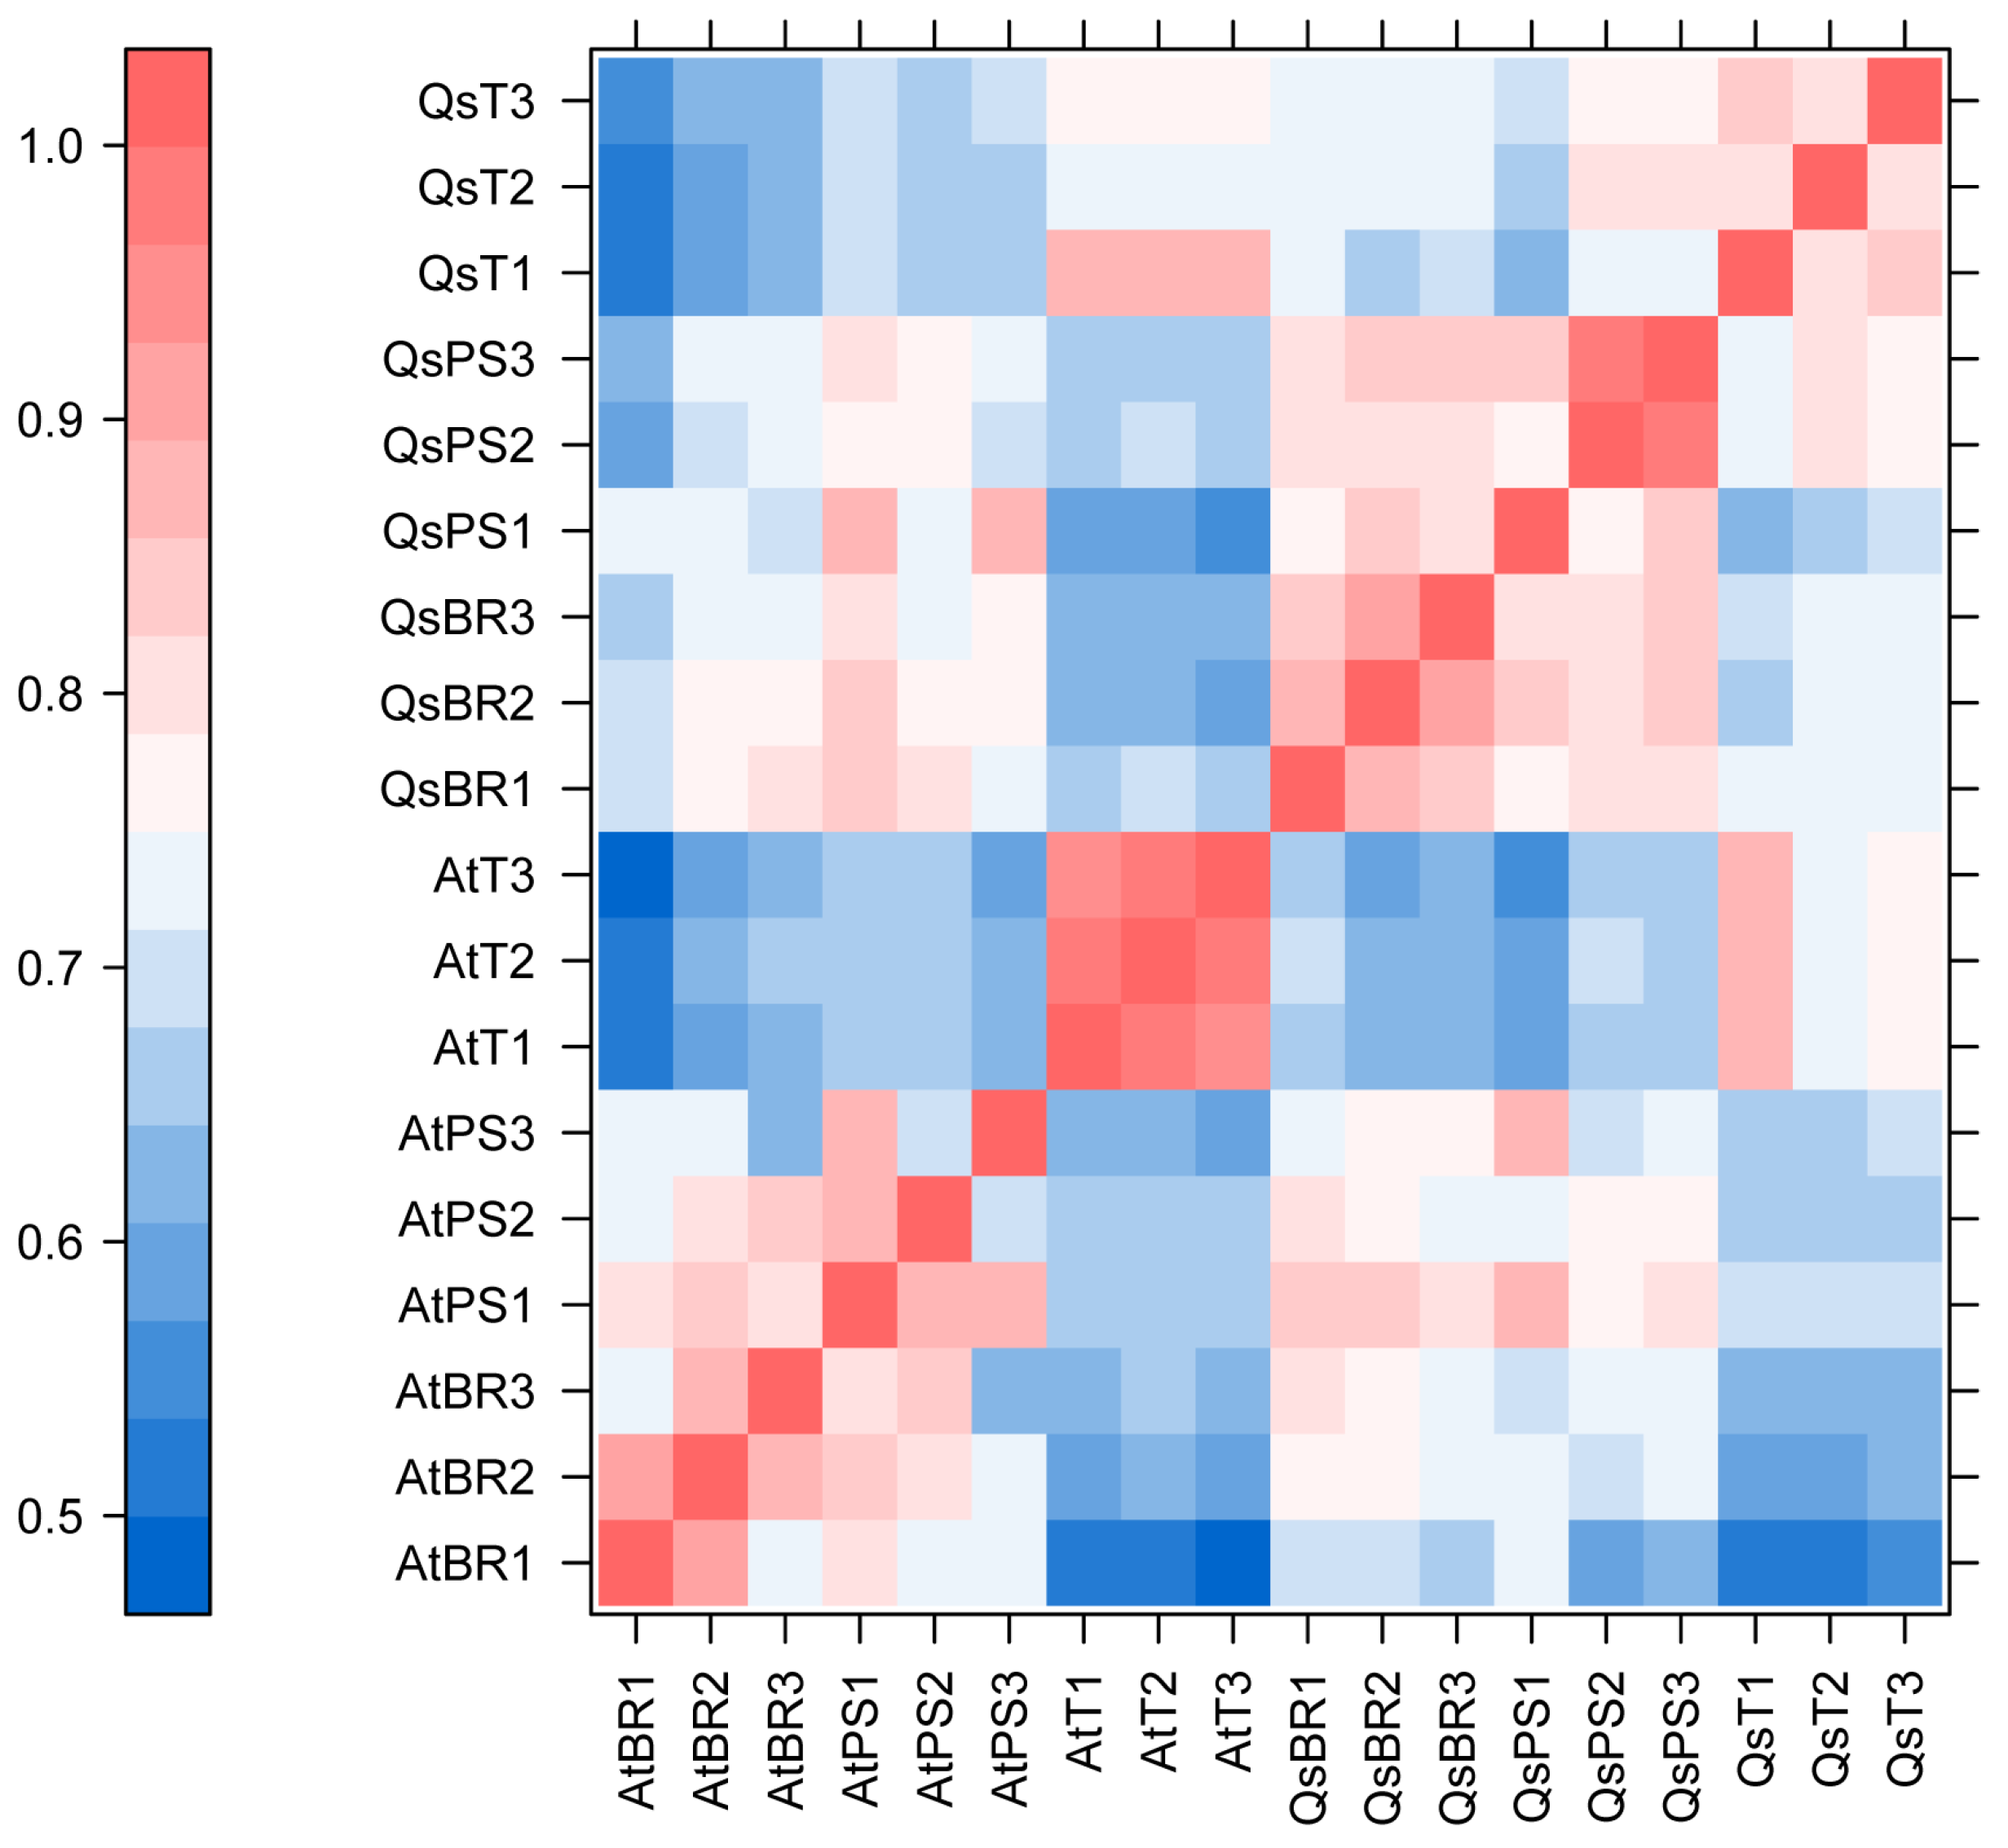
Figure A2.
Volcano plots of differentially expressed genes between Atlantic and Qingshu 9 under drought stress. Comparisons are shown for (A) basal root tips (AtBR vs. QsBR), (B) primary stolons (AtPS vs. QsPS), and (C) tubers (AtT vs. QsT). Red and green dots indicate significantly upregulated and downregulated genes, respectively (|log2FC| ≥ 1 and FDR < 0.05), while black dots represent non-significant genes. The numbers of upregulated, downregulated, and unchanged genes are displayed for each comparison.
Appendix A.2. SEM Construction
SEM model basic information: The model was constructed with a total of 264 independent biological replicate samples, including two potato cultivars (Atlantic and Qingshu 9), two water treatments (well-watered control and drought stress), three tissue types (basal root tips, primary stolons, tubers), and four developmental stages (seedling stage, tuber formation stage, tuber expansion stage, tuber maturation stage), with six biological replicates per treatment combination. The exogenous variables were cultivar, drought treatment, tissue type, and developmental stage; the observed variables were the expression levels of five Aux/IAA genes (StIAA3, StIAA6, StIAA22, StIAA24, StIAA25); and the latent variable was “drought tolerance”, which was synthesized by the five genes (StIAA24 was set as a negative regulator). The ratio of sample size to parameter number was 8.25:1, which meets the basic requirement of SEM (≥5:1).
Model fit: We acknowledge that the RMSEA value (0.122) of the SEM model is slightly higher than the ideal threshold (≤0.10), indicating a moderate fit of the model. This may be due to the complexity of the experimental design (multiple exogenous variables including cultivar, treatment, tissue, and developmental stage) and the tissue-specific and stage-specific expression patterns of the Aux/IAA genes, which lead to high heterogeneity of the gene expression data.
Data distribution diagnostics: Before constructing the SEM model, we tested the normality of the gene expression data (log2FC) using the Shapiro–Wilk test, and the results showed that the data conformed to the approximate normal distribution (p > 0.05), meeting the basic normality assumption of SEM.
Supplementary alternative analyses: To compensate for the moderate fit of the SEM model, we performed two supplementary analyses: (1) A forest plot of subgroup analysis was performed to visualize drought-induced expression changes for each gene across cultivars, confirming significant cultivar-dependent responses for all five Aux/IAA genes (interaction p < 0.05 for all genes), with StIAA24 showing opposite expression patterns consistent with its role as a negative regulator (Figure A3); (2) gene co-expression network analysis to explore the regulatory relationships between the five Aux/IAA genes under control and drought conditions. The results showed that StIAA24 was significantly negatively correlated with the other four genes under drought stress, which was consistent with the negative regulation setting in the original SEM model (Figure A4).
Figure A3.
Forest plot of subgroup analysis depicting drought-induced expression changes for five Aux/IAA genes in Atlantic and Qingshu9 cultivars. Statistical significance was determined by Student’s t-test (* p < 0.05, ** p < 0.01, *** p < 0.001).
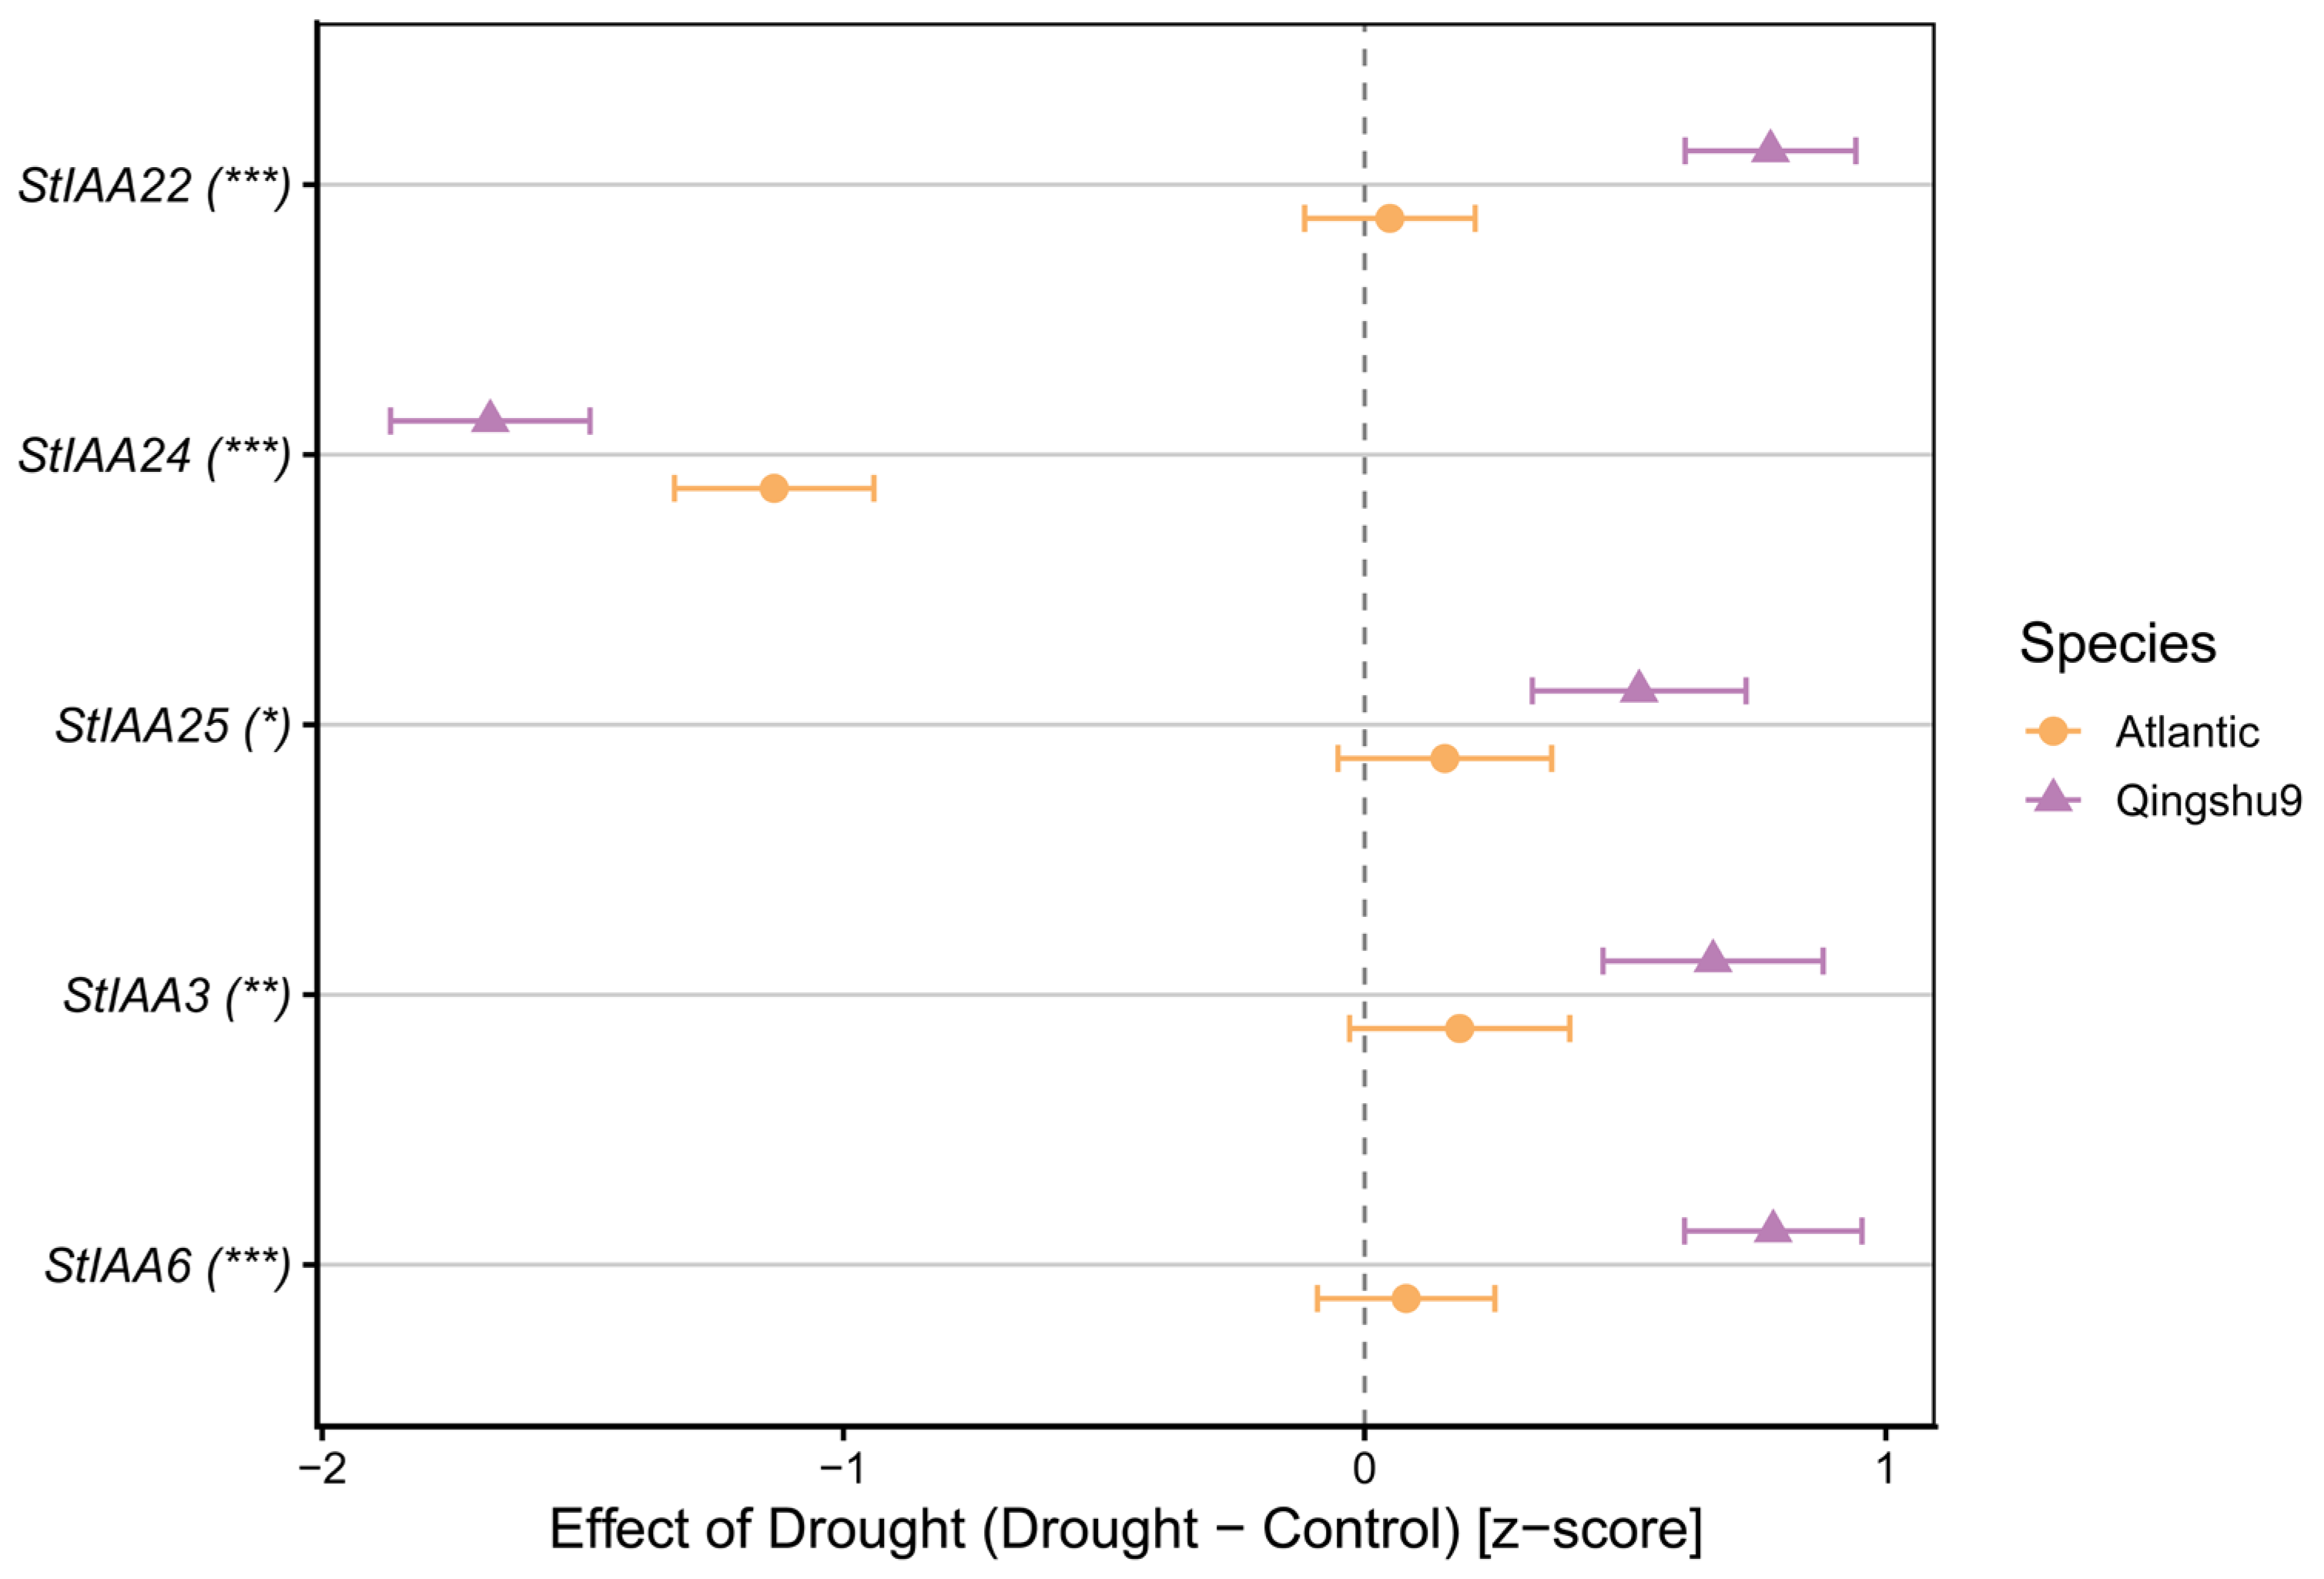
Effect sizes represent the standardized mean difference (z-score) between drought-stressed and control conditions for each cultivar, with error bars indicating 95% confidence intervals. All genes exhibited significant cultivar-dependent responses (p < 0.05), with StIAA24 showing opposite expression directions between cultivars, consistent with its proposed role as a negative regulator of drought tolerance.
Figure A4.
Co-expression network analysis of five Aux/IAA genes under control and drought stress conditions. Nodes represent individual genes, with colors assigned for visual distinction. Edges indicate Spearman’s rank correlation coefficients (|ρ| > 0.3 threshold shown); red and blue edges denote positive and negative correlations, respectively, with line thickness proportional to correlation strength. Networks were constructed separately for control (adequate irrigation) and drought-stressed samples to visualize treatment-dependent shifts in gene co-expression patterns.
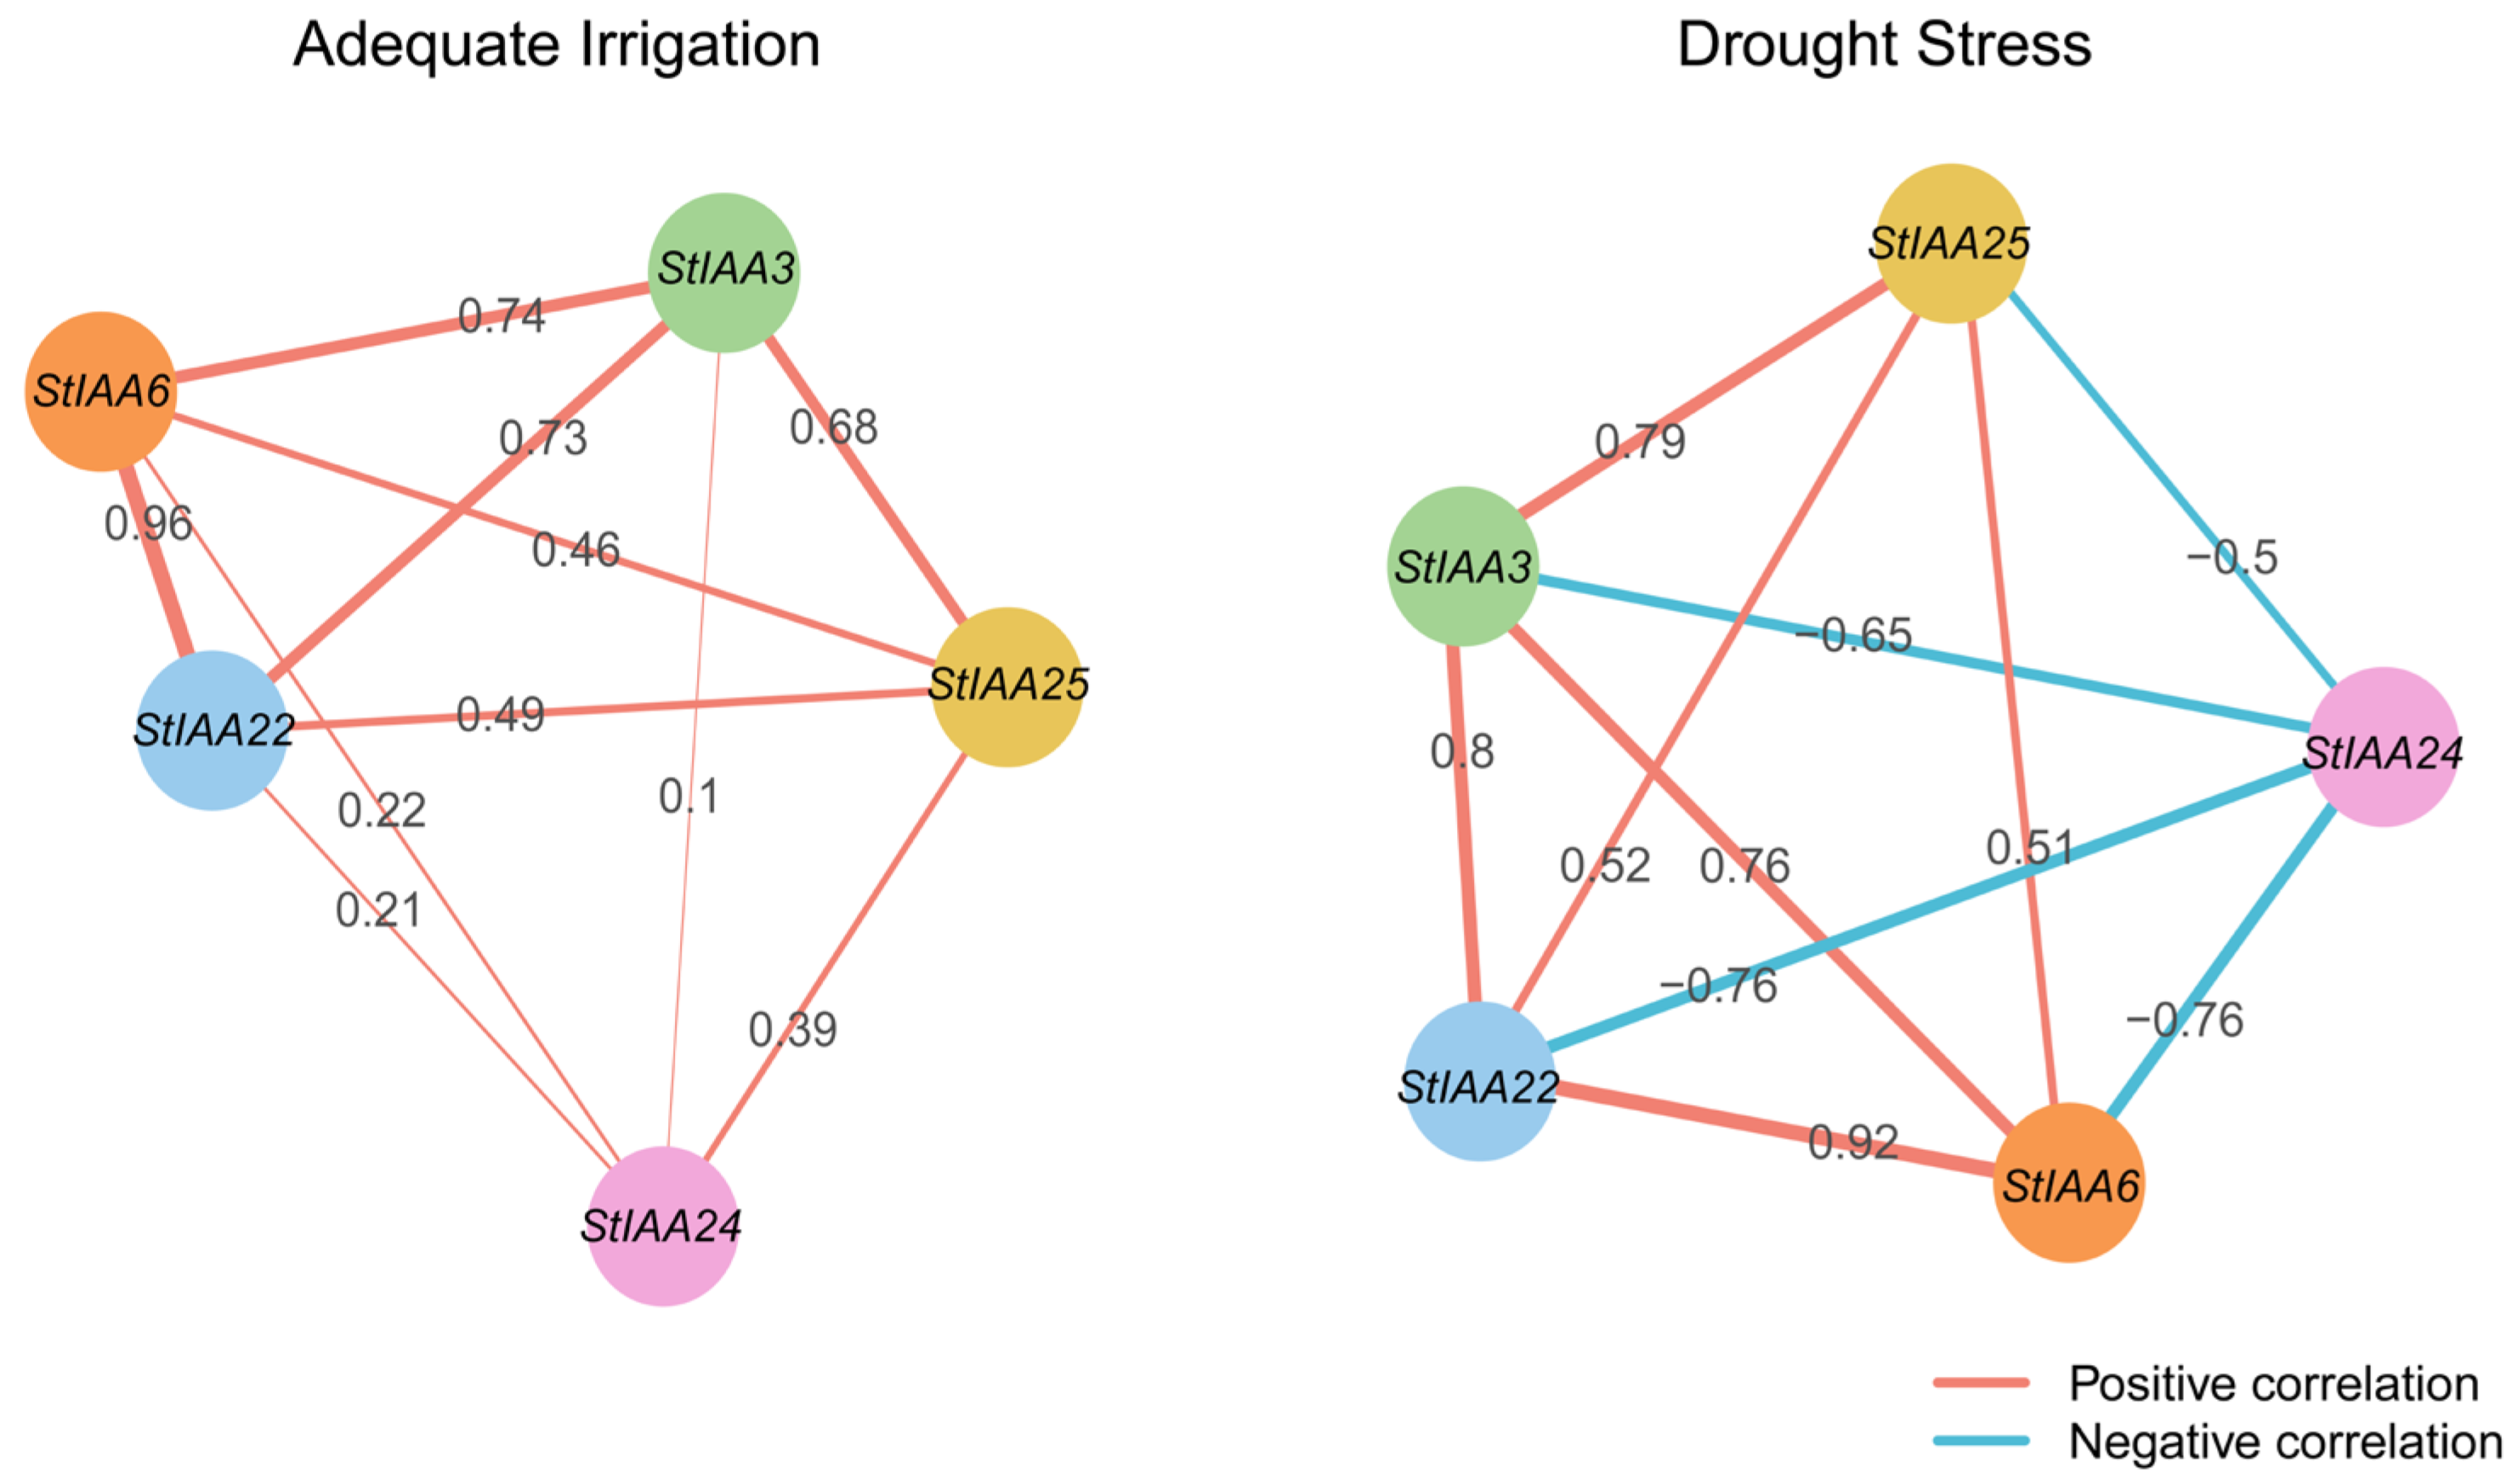
Figure A5.
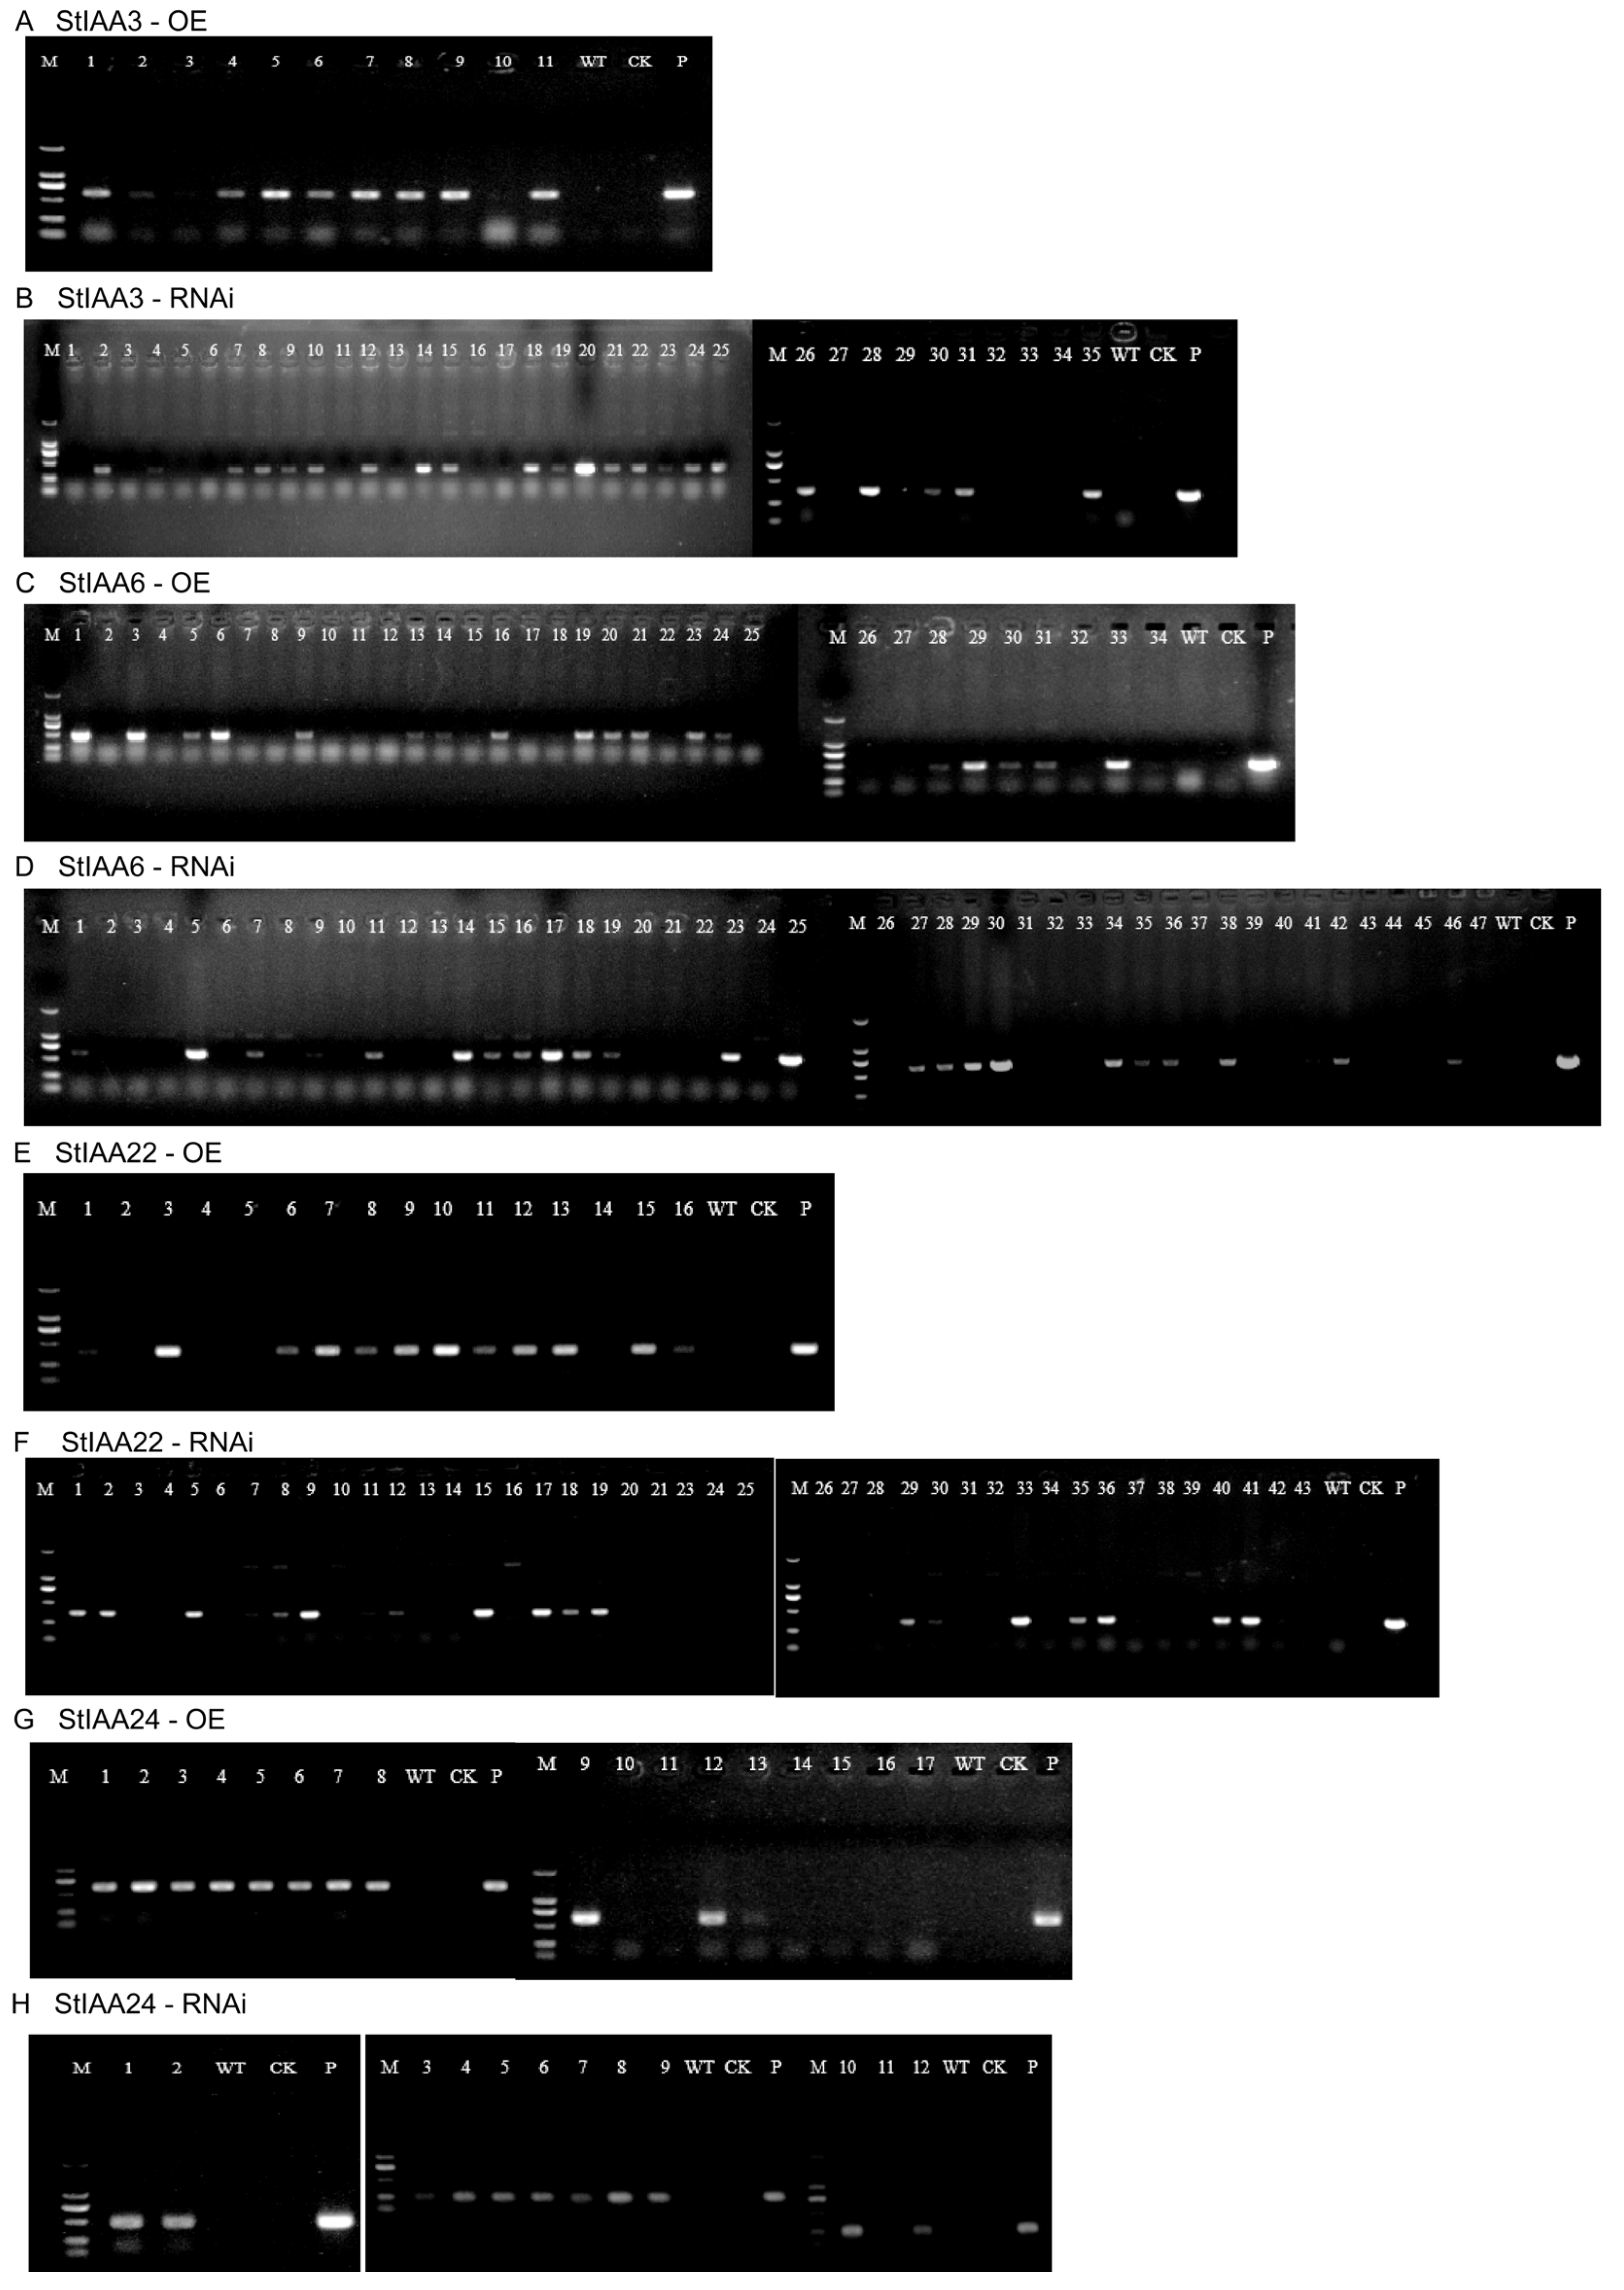
PCR validation of transgenic potato lines. For all panels, M: DL2000 DNA marker; lanes indicate independent T0 transgenic lines; WT: wild-type (negative control); CK: blank control (water); P: positive control (Agrobacterium culture). (A) Detection of StIAA3 overexpression lines (StIAA3-OE). Lanes 1–11: T0 lines. Positive lines: 1, 2, 4–9, 11. (B) Detection of StIAA3 RNAi lines (StIAA3-RNAi). Lanes 1–35: T0 lines. Positive lines: 2, 7–10, 12, 14, 15, 18, 20–22, 24–26, 28, 31, 35. (C) Detection of StIAA6 overexpression lines (StIAA6-OE). Lanes 1–34: T0 lines. Positive lines: 1, 3, 5, 6, 9, 16, 19–21, 23, 29, 33. (D) Detection of StIAA6 RNAi lines (StIAA6-RNAi). Lanes 1–47: T0 lines. Positive lines: 5, 11, 14–18, 23, 25, 27–30, 34–36, 38, 42, 46. (E) Detection of StIAA22 overexpression lines (StIAA22-OE). Lanes 1–16: T0 lines. Positive lines: 1, 3, 6–13, 15, 16. (F) Detection of StIAA22 RNAi lines (StIAA22-RNAi). Lanes 1–43: T0 lines. Positive lines: 1, 2, 5, 8, 9, 15, 17–19, 29, 33, 35, 36, 40, 41. (G) Detection of StIAA24 overexpression lines (StIAA24-OE). Lanes 1–17: T0 lines. Positive lines: 1–9, 12. (H) Detection of StIAA24 RNAi lines (StIAA24-RNAi). Lanes 1–12: T0 lines. Positive lines: 1–10, 12.
Appendix A.3. Experimental Limitations
We acknowledge that the experiment had several limitations in experimental design and data collection, which are briefly summarized as follows: First, some environmental and physiological metrics for quantifying drought stress (e.g., soil moisture content, leaf water potential, stomatal conductance) were not measured. Agronomic trait data (tuber yield, biomass, etc.) were not presented due to significant inter-operator measurement variability; survival rate was not assessed as the experiment involved mild-to-moderate non-lethal drought. Second, the molecular characterization of the transgenic lines was limited to PCR confirmation of transgene integration. Due to current instrumentation limitations in our laboratory, we are unable to perform additional qRT-PCR experiments to supplement these data at this time (Figure A5). Melting curve analysis and amplification efficiency data were not retained for the qRT-PCR primers. Third, Endogenous IAA/ABA content determination and auxin reporter assays (e.g., DR5-GUS/GFP) were not performed due to resource and technical limitations. Fourth, the SEM model for drought tolerance analysis had a slightly elevated RMSEA value (0.122), with moderate model fit that marginally limited its interpretive power (basic statistical assumptions were met).
Despite these limitations, the study has generated significant scientific data, and the novel findings met the study’s objectives. All limitations will be addressed in subsequent follow-up research to further extend scientific findings.
References
- Vadez, V.; Grondin, A.; Chenu, K.; Henry, A.; Laplaze, L.; Millet, E.J.; Carminati, A. Crop traits and production under drought. Nat. Rev. Earth Environ. 2024, 5, 211–225. [Google Scholar] [CrossRef] [Scilit]
- Wang, L.; Garland, G.M.; Ge, T.D.; Guo, S.Q.; Kebede, E.A.; He, C.G.; Hijri, M.; Plaza-Bonilla, D.; Stringer, L.C.; Davis, K.F.; et al. Integrated strategies for enhancing agrifood productivity, lowering greenhouse gas emissions, and improving soil health. Innovation 2025, 6, 101006. [Google Scholar] [CrossRef] [Scilit]
- Ngou, B.P.M.; Wyler, M.; Schmid, M.W.; Kadota, Y.; Shirasu, K. Evolutionary trajectory of pattern recognition receptors in plants. Nat. Commun. 2024, 15, 308. [Google Scholar] [CrossRef] [Scilit]
- Wang, S.; Zhang, X.; Gong, D.-H.; Huang, Q.-Q.; Kandegama, W.M.W.W.; Georgiev, M.I.; Gao, Y.-Y.; Liao, P.; Hao, G.-F. Sophisticated crosstalk of tryptophan-derived metabolites in plant stress responses. Plant Commun. 2025, 6, 101425. [Google Scholar] [CrossRef] [Scilit]
- Song, X.; Liu, Y.; Meng, X.; Chen, S.; Sang, K.; Zheng, Q.; Zhou, Y.; Considine, M.; Yu, J.; Xia, X. Warm temperature activates the TCP15-HDA4 module to suppress shoot branching by promoting auxin biosynthesis and signaling in tomato. Mol. Plant 2025, 18, 2082–2100. [Google Scholar] [CrossRef] [Scilit]
- Altmann, M.; Altmann, S.; Rodriguez, P.A.; Weller, B.; Elorduy Vergara, L.; Palme, J.; Marín-de la Rosa, N.; Sauer, M.; Wenig, M.; Villaécija-Aguilar, J.A.; et al. Extensive signal integration by the phytohormone protein network. Nature 2020, 583, 271–276. [Google Scholar] [CrossRef] [Scilit] [PubMed]
- Das, S.; de Roij, M.; Bellows, S.; Alvarez, M.D.; Mutte, S.; Kohlen, W.; Farcot, E.; Weijers, D.; Borst, J.W. Quantitative imaging reveals the role of MpARF proteasomal degradation during gemma germination. Plant Commun. 2024, 5, 101039. [Google Scholar] [CrossRef] [Scilit]
- Berdion Gabarain, V.; Núñez-Lillo, G.; Pěnčík, A.; Carignani Sardoy, M.; Ibeas, M.A.; Salinas-Grenet, H.; Pacheco, J.M.; Lopez, L.; Rossi, A.H.; Miglietta, E.A.; et al. Enhanced auxin signaling promotes root-hair growth at moderately low temperature in Arabidopsis thaliana. Plant Commun. 2025, 6, 101350. [Google Scholar] [CrossRef] [Scilit]
- Wang, L.; Lu, P.A.; Feng, S.J.; Hamel, C.; Sun, D.D.; Siddique, K.H.M.; Gan, G.Y. Strategies to improve soil health by optimizing the plant-soil-microbe-anthropogenic activity nexus. Agric. Ecosyst. Environ. 2024, 359, 108750. [Google Scholar] [CrossRef] [Scilit]
- Wang, L.; Guo, S.Q.; Hijri, M.; Farooq, M.; Rehman, A.; Ge, T.D.; Feng, S.J.; Wei, Z.Y.; Zhang, J.L.; Zhao, C.; et al. Enhancing carbon restoration and ecosystem resilience in global drylands via water-to-carbon biotransformation strategies. Commun. Earth Environ. 2025, 6. [Google Scholar] [CrossRef] [Scilit]
- Hill, D.; Nelson, D.; Hammond, J.; Bell, L. Morphophysiology of potato (Solanum tuberosum) in response to drought stress: Paving the way forward. Front. Plant Sci. 2020, 11, 597554. [Google Scholar] [CrossRef] [Scilit]
- Lahlou, O.; Ledent, J.F. Root mass and depth, stolons and roots formed on stolons in four cultivars of potato under water stress. Eur. J. Agron. 2005, 22, 159–173. [Google Scholar] [CrossRef] [Scilit]
- Zinta, R.; Tiwari, J.K.; Buckseth, T.; Thakur, K.; Goutam, U.; Kumar, D.; Challam, C.; Bhatia, N.; Poonia, A.K.; Naik, S.; et al. Root system architecture for abiotic stress tolerance in potato: Lessons from plants. Front. Plant Sci. 2022, 13, 926214. [Google Scholar] [CrossRef] [Scilit]
- Zaki, H.E.M.; Radwan, K.S.A. Response of potato (Solanum tuberosum L.) cultivars to drought stress under in vitro and field conditions. Chem. Biol. Technol. Agric. 2022, 9, 1. [Google Scholar] [CrossRef] [Scilit]
- Lal, M.K.; Tiwari, R.K.; Kumar, A.; Dey, A.; Kumar, R.; Kumar, D.; Jaiswal, A.; Changan, S.S.; Raigond, P.; Dutt, S.; et al. Mechanistic Concept of Physiological, Biochemical, and Molecular Responses of the Potato Crop to Heat and Drought Stress. Plants 2022, 11, 2857. [Google Scholar] [CrossRef] [Scilit]
- Kochian, L.V. Root architecture. J. Integr. Plant Biol. 2016, 58, 190–192. [Google Scholar] [CrossRef] [Scilit]
- Kim, Y.; Chung, Y.S.; Lee, E.; Tripathi, P.; Heo, S.; Kim, K.H. Root response to drought stress in rice (Oryza sativa L.). Int. J. Mol. Sci. 2020, 21, 1513. [Google Scholar] [CrossRef] [Scilit] [PubMed]
- Shoaib, M.; Banerjee, B.P.; Hayden, M.; Kant, S. Roots’ drought adaptive traits in crop improvement. Plants 2022, 11, 2256. [Google Scholar] [CrossRef] [Scilit]
- Nadarajah, K.; Kumar, I.S. Drought response in rice: The miRNA story. Int. J. Mol. Sci. 2019, 20, 3766. [Google Scholar] [CrossRef] [Scilit]
- Shekhawat, K.; Fröhlich, K.; García-Ramírez, G.X.; Trapp, M.A.; Hirt, H. Ethylene: A Mmster regulator of plant-microbe interactions under abiotic stresses. Cells 2022, 12, 31. [Google Scholar] [CrossRef] [Scilit] [PubMed]
- Mańkowska, D.; Zarzyńska, K.; Wasilewska-Nascimento, B. Potato (Solanum tuberosum L.) Plant Shoot and Root Changes under Abiotic Stresses-Yield Response. Plants 2022, 11, 3568. [Google Scholar] [CrossRef] [Scilit] [PubMed]
- Muñiz García, M.N.; Cortelezzi, J.I.; Fumagalli, M.; Capiati, D.A. Expression of the Arabidopsis ABF4 gene in potato increases tuber yield, improves tuber quality and enhances salt and drought tolerance. Plant Mol. Biol. 2018, 98, 137–152. [Google Scholar] [CrossRef] [Scilit]
- Lynch, J.P. Root phenotypes for improved nutrient capture: An underexploited opportunity for global agriculture. New Phytol. 2019, 223, 548–564. [Google Scholar] [CrossRef] [Scilit]
- Liao, Z.; Chen, B.; Boubakri, H.; Farooq, M.; Mur, L.A.J.; Urano, D.; Teo, C.H.; Tan, B.C.; Hasan, M.D.M.; Aslam, M.M.; et al. The regulatory role of phytohormones in plant drought tolerance. Planta 2025, 261, 98. [Google Scholar] [CrossRef] [Scilit]
- Roy, D.; Mehra, P.; Clark, L.; Mukkawar, V.; Bellande, K.; Martin-Arevalillo, R.; Ghosh, S.; Ingole, K.D.; Bhagat, P.K.; Brown, A.; et al. Redox-regulated Aux/IAA multimerization modulates auxin responses. Science 2025, 389, eadu1470. [Google Scholar] [CrossRef] [Scilit]
- Woodward, A.W.; Bartel, B. Auxin: Regulation, action, and interaction. Ann. Bot. 2005, 95, 707–735. [Google Scholar] [CrossRef] [Scilit]
- Bao, D.F.; Chang, S.Q.; Li, X.D.; Qi, Y.H. Advances in the study of auxin early response genes: Aux/IAA, GH3, and SAUR. Crop J. 2024, 12, 964–978. [Google Scholar] [CrossRef] [Scilit]
- Qi, L.; Kwiatkowski, M.; Chen, H.; Hoermayer, L.; Sinclair, S.; Zou, M.; Del Genio, C.I.; Kubeš, M.F.; Napier, R.; Jaworski, K.; et al. Adenylate cyclase activity of TIR1/AFB auxin receptors in plants. Nature 2022, 611, 133–138. [Google Scholar] [CrossRef] [Scilit]
- Morffy, N.; Strader, L.C. Structural aspects of auxin aignaling. Cold Spring Harb. Perspect. Biol. 2022, 14, a039883. [Google Scholar] [CrossRef] [Scilit] [PubMed]
- Die, J.V.; Gil, J.; Millan, T. Genome-wide identification of the auxin response factor gene family in Cicer arietinum. BMC Genom. 2018, 19, 301. [Google Scholar] [CrossRef] [Scilit] [PubMed]
- Yamauchi, T.; Tanaka, A.; Inahashi, H.; Nishizawa, N.K.; Tsutsumi, N.; Inukai, Y.; Nakazono, M. Fine control of aerenchyma and lateral root development through AUX/IAA- and ARF-dependent auxin signaling. Proc. Natl. Acad. Sci. USA 2019, 116, 20770–20775. [Google Scholar] [CrossRef] [Scilit]
- Zhang, T.; Li, R.; Xing, J.; Yan, L.; Wang, R.; Zhao, Y. The YUCCA-Auxin-WOX11 module controls crown root development in rice. Front. Plant Sci. 2018, 9, 523. [Google Scholar] [CrossRef] [Scilit] [PubMed]
- Su, X.; Zhang, X.; Luo, J.; Wang, Y.; Feng, B.; Yang, Y.; Zhang, B.; Li, Y.; Zhang, H.; Yuan, W.; et al. The IAA7-ARF7-ARF19 auxin signaling module plays diverse roles in Arabidopsis growth and development. Planta 2025, 262, 12. [Google Scholar] [CrossRef] [Scilit] [PubMed]
- Wang, R.; Zhong, Y.; Han, J.; Huang, L.; Wang, Y.; Shi, X.; Li, M.; Zhuang, Y.; Ren, W.; Liu, X.; et al. NIN-LIKE PROTEIN3.2 inhibits repressor Aux/IAA14 expression and enhances root biomass in maize seedlings under low nitrogen. Plant Cell 2024, 36, 4388–4403. [Google Scholar] [CrossRef] [Scilit]
- Song, Y.; You, J.; Xiong, L. Characterization of OsIAA1 gene, a member of rice Aux/IAA family involved in auxin and brassinosteroid hormone responses and plant morphogenesis. Plant Mol. Biol. 2009, 70, 297–309. [Google Scholar] [CrossRef] [Scilit]
- Song, X.; Xiong, Y.; Kong, X.; Huang, G. Roles of auxin response factors in rice development and stress responses. Plant Cell Environ. 2023, 46, 1075–1086. [Google Scholar] [CrossRef] [Scilit] [PubMed]
- Chen, Z.; Zhou, W.; Guo, X.; Ling, S.; Li, W.; Wang, X.; Yao, J. Heat stress responsive Aux/IAA protein, OsIAA29 regulates grain filling through OsARF17 mediated auxin signaling pathway. Rice 2024, 17, 16. [Google Scholar] [CrossRef] [Scilit]
- Zhang, A.; Yang, X.; Lu, J.; Song, F.; Sun, J.; Wang, C.; Lian, J.; Zhao, L.; Zhao, B. OsIAA20, an Aux/IAA protein, mediates abiotic stress tolerance in rice through an ABA pathway. Plant Sci. 2021, 308, 110903. [Google Scholar] [CrossRef] [Scilit]
- Zou, C.; Tan, H.; Huang, K.; Zhai, R.; Yang, M.; Huang, A.; Wei, X.; Mo, R.; Xiong, F. Physiological characteristic changes and transcriptome analysis of maize (Zea mays L.) roots under drought stress. Int. J. Genom. 2024, 2024, 5681174. [Google Scholar] [CrossRef] [Scilit]
- Grabherr, M.G.; Haas, B.J.; Yassour, M.; Levin, J.Z.; Thompson, D.A.; Amit, I.; Adiconis, X.; Fan, L.; Raychowdhury, R.; Zeng, Q.; et al. Full-length transcriptome assembly from RNA-Seq data without a reference genome. Nat. Biotechnol. 2011, 29, 644–652. [Google Scholar] [CrossRef] [Scilit]
- Fu, L.; Niu, B.; Zhu, Z.; Wu, S.; Li, W. CD-HIT: Accelerated for clustering the next-generation sequencing data. Bioinformatics 2012, 28, 3150–3152. [Google Scholar] [CrossRef] [Scilit]
- Li, B.; Dewey, C.N. RSEM: Accurate transcript quantification from RNA-Seq data with or without a reference genome. BMC Bioinform. 2011, 12, 323. [Google Scholar] [CrossRef] [Scilit]
- Langmead, B.; Trapnell, C.; Pop, M.; Salzberg, S.L. Ultrafast and memory-efficient alignment of short DNA sequences to the human genome. Genome Biol. 2009, 10, R25. [Google Scholar] [CrossRef] [Scilit]
- Anders, S.; Huber, W. Differential expression analysis for sequence count data. Genome Biol. 2010, 11, R106. [Google Scholar] [CrossRef] [Scilit]
- Trapnell, C.; Williams, B.A.; Pertea, G.; Mortazavi, A.; Kwan, G.; van Baren, M.J.; Salzberg, S.L.; Wold, B.J.; Pachter, L. Transcript assembly and quantification by RNA-seq reveals unannotated transcripts and isoform switching during cell differentiation. Nat. Biotechnol. 2010, 28, 511–515. [Google Scholar] [CrossRef] [Scilit]
- Xie, C.; Mao, X.; Huang, J.; Ding, Y.; Wu, J.; Dong, S.; Kong, L.; Gao, G.; Li, C.Y.; Wei, L. KOBAS 2.0: A web server for annotation and identification of enriched pathways and diseases. Nucleic Acids Res. 2011, 39, W316–W322. [Google Scholar] [CrossRef] [Scilit]
- Finn, R.D.; Bateman, A.; Clements, J.; Coggill, P.; Eberhardt, R.Y.; Eddy, S.R.; Heger, A.; Hetherington, K.; Holm, L.; Mistry, J.; et al. Pfam: The protein families database. Nucleic Acids Res. 2014, 42, D222–D230. [Google Scholar] [CrossRef] [Scilit]
- Nastou, K.C.; Tsaousis, G.N.; Papandreou, N.C.; Hamodrakas, S.J. MBPpred: Proteome-wide detection of membrane lipid-binding proteins using profile Hidden Markov Models. Biochim. Biophys. Acta 2016, 1864, 747–754. [Google Scholar] [CrossRef] [Scilit] [PubMed]
- Livak, K.J.; Schmittgen, T.D. Analysis of relative gene expression data using real-time quantitative PCR and the 2−ΔΔCt method. Methods 2001, 25, 402–408. [Google Scholar] [CrossRef] [Scilit] [PubMed]
- Gao, J.; Cao, X.; Shi, S.; Ma, Y.; Wang, K.; Liu, S.; Chen, D.; Chen, Q.; Ma, H. Genome-wide survey of Aux/IAA gene family members in potato (Solanum tuberosum): Identification, expression analysis, and evaluation of their roles in tuber development. Biochem. Biophys. Res. Commun. 2016, 471, 320–327. [Google Scholar] [CrossRef] [Scilit] [PubMed]
- Mthembu, S.G.; Magwaza, L.S.; Mashilo, J.; Mditshwa, A.; Odindo, A. Drought tolerance assessment of potato (Solanum tuberosum L.) genotypes at different growth stages, based on morphological and physiological traits. Agric. Water Manag. 2022, 261, 107361. [Google Scholar] [CrossRef] [Scilit]
- Kim, Y.H.; Hwang, S.J.; Waqas, M.; Khan, A.L.; Lee, J.H.; Lee, J.D.; Nguyen, H.T.; Lee, I.J. Comparative analysis of endogenous hormones level in two soybean (Glycine max L.) lines differing in waterlogging tolerance. Front. Plant Sci. 2015, 6, 714. [Google Scholar] [CrossRef] [Scilit] [PubMed]
- Jing, H.; Wilkinson, E.G.; Sageman-Furnas, K.; Strader, L.C. Auxin and abiotic stress responses. J. Exp. Bot. 2023, 74, 7000–7014. [Google Scholar] [CrossRef] [Scilit]
- Kong, X.; Zhang, L.; Ding, Z. 26S proteasome: Hunter and prey in auxin signaling. Trends Plant Sci. 2016, 21, 546–548. [Google Scholar] [CrossRef] [Scilit]
- Leyser, O. Auxin Signaling. Plant Physiol. 2018, 176, 465–479. [Google Scholar] [CrossRef] [Scilit]
- Zhang, X.; Fan, R.; Yu, Z.; Du, X.; Yang, X.; Wang, H.; Xu, W.; Yu, X. Genome-wide identification of GATA transcription factors in tetraploid potato and expression analysis in differently colored potato flesh. Front. Plant Sci. 2024, 15, 1330559. [Google Scholar] [CrossRef] [Scilit]
- Xie, Y.; Ying, J.; Tang, M.; Wang, Y.; Xu, L.; Liu, M.; Liu, L. Genome-wide identification of AUX/IAA in radish and functional characterization of RsIAA33 gene during taproot thickening. Gene 2021, 795, 145782. [Google Scholar] [CrossRef] [Scilit]
- Nam, H.; Han, S.; Lee, S.; Nam, H.; Lim, H.; Lee, G.; Cho, H.S.; Dang, T.V.T.; Choi, S.; Lee, M.M.; et al. CPR5-mediated nucleo-cytoplasmic localization of IAA12 and IAA19 controls lateral root development during abiotic stress. Proc. Natl. Acad. Sci. USA 2023, 120, e2209781120. [Google Scholar] [CrossRef] [Scilit]
- Li, Y.H.; Han, S.Q.L.; Qi, Y.H. Advances in structure and function of auxin response factor in plants. J. Integr. Plant Biol. 2023, 65, 617–632. [Google Scholar] [CrossRef] [Scilit]
- Cancé, C.; Martin-Arevalillo, R.; Boubekeur, K.; Dumas, R. Auxin response factors are keys to the many auxin doors. New Phytol. 2022, 235, 402–419. [Google Scholar] [CrossRef] [Scilit] [PubMed]
- Gervais, T.; Creelman, A.; Li, X.Q.; Bizimungu, B.; De Koeyer, D.; Dahal, K. Potato Response to Drought Stress Physiological and Growth Basis. Front. Plant Sci. 2021, 12, 698060. [Google Scholar] [CrossRef] [Scilit] [PubMed]
- Nasir, M.W.; Toth, Z. Effect of Drought Stress on Potato Production: A Review. Agronomy 2022, 12, 635. [Google Scholar] [CrossRef] [Scilit]

Disclaimer/Publisher’s Note: The statements, opinions and data contained in all publications are solely those of the individual author(s) and contributor(s) and not of MDPI and/or the editor(s). MDPI and/or the editor(s) disclaim responsibility for any injury to people or property resulting from any ideas, methods, instructions or products referred to in the content. |
© 2026 by the authors. Licensee MDPI, Basel, Switzerland. This article is an open access article distributed under the terms and conditions of the Creative Commons Attribution (CC BY) license.