


Abstract
Crop diversification is widely proposed as a resilience strategy, but whether regional crop diversity buffers crop-specific productivity after wildfire exposure remains uncertain. This study examines seven Portuguese agricultural regions using exposure years 2012–2024 and crop-specific productivity at t + 1. The primary sample comprises 972 Region × Crop × Year observations nested in 91 Region × Year cells. Pre-fire diversity is measured by a one-year-lagged Shannon index based on 11 crop groups. Models include Region × Crop and Year fixed effects, a lagged crop-area control, and few-cluster inference based on null-imposed wild cluster restricted bootstrap tests with Webb weights. Neither wildfire exposure nor crop diversity shows a statistically supported main association with subsequent productivity. The wildfire × diversity interaction is positive but unsupported at t + 1 (β = 0.0931; p = 0.491), t + 2 (β = 0.0623; p = 0.699), and t + 3 (β = 0.0348; p = 0.778). The interaction changes sign in a supplementary region-specific linear-trend specification (β = −0.0410), indicating sensitivity to regional trajectories; none of the preferred hypothesis tests support the proposed buffering mechanism. The results do not establish regional crop diversity as a wildfire-specific buffer for crop-specific productivity in this design, while remaining consistent with potential diversification benefits for other outcomes and spatial scales.
1. Introduction
Wildfire exposure is an important challenge for crop production and agricultural resilience in fire-prone Mediterranean environments because it can affect agricultural performance through direct damage to cultivated land, post-fire changes in plant–soil water relations, and smoke-related physiological stress. Across southern European and Mediterranean landscapes, fire occurrence reflects interactions among weather, drought, land cover, grazing, protection status, and land management [1,2]. Evidence from other agricultural contexts further shows that fire can alter plant–soil water relations [3] and that wildfire smoke can reduce subsequent orchard yields [4]. These mechanisms make wildfire exposure relevant to sustainable agriculture under changing environmental conditions while implying that post-fire responses may differ across crops, regions, exposure intensities, and time horizons.
Crop diversification is frequently proposed as a resilience strategy, but its expected benefits depend on the outcome and scale being evaluated. At national and regional portfolio scales, crop diversity can stabilise aggregate production because asynchronous crop responses offset one another [5,6]. Such portfolio stabilisation, however, is not equivalent to higher crop-specific productivity or the lower vulnerability of every crop. Evidence across diversification strategies shows substantial heterogeneity by production outcome, ecosystem service, climatic stress, and spatial scale [7,8,9,10,11,12]. Regional crop composition also differs conceptually from rotations, intercropping, or other field- and farm-level practices [13], and within-region diversity can involve trade-offs with short-run technical efficiency [14].
The key unresolved issue is whether a regional crop portfolio—rather than field- or farm-level diversification—changes the post-disturbance response of individual crop groups. Existing diversification studies primarily examine aggregate production stability, productivity, ecosystem services, profitability, or farm-level strategies, whereas wildfire studies emphasise fire occurrence, landscape processes, soil–water responses, smoke effects, and post-fire management. The studies cited here do not directly test whether crop diversity measured before a fire year moderates the association between the regional agricultural burned area and subsequent crop-specific productivity. The central research question is therefore “Does pre-fire regional crop diversity attenuate the association between wildfire exposure and subsequent crop-specific productivity?”
The main objective is to test this moderation relationship and whether it persists beyond the first post-fire year. Section 2 develops four testable expectations: at mean pre-fire diversity, greater wildfire exposure is expected to be associated with lower subsequent crop-specific productivity (H1); at mean wildfire exposure, greater pre-fire diversity is expected to be associated with higher productivity (H2); the wildfire × diversity interaction is expected to be positive, indicating a less adverse wildfire slope at higher diversity (H3); and this positive moderation is expected to persist through at least t + 2 (H4). These are hypotheses about conditional associations, not causal effects.
Empirically, the study combines official Statistics Portugal crop-area, crop-productivity, and rural-fire records. The primary design uses wildfire exposure years 2012–2024, with pre-fire diversity at t − 1 and crop-specific productivity observed at t + 1 in 2013–2025. Pre-fire regional diversity is measured with a one-year-lagged Shannon index constructed from a fixed set of 11 crop groups with complete crop-area coverage. The primary wildfire measure is ln(1 + agricultural burned area) aggregated to Region × Year; the total burned area, fire counts, level exposure, and normalised exposure are reserved for robustness analyses. The baseline sample contains 972 Region × Crop × Year observations nested in 91 Region × Year exposure cells across seven identifying agricultural regions. Region × Crop and Year fixed effects, together with a pre-fire crop-area control, address persistent crop-region heterogeneity and common annual shocks. Because inference rests on only seven regional clusters, confirmatory tests use the null-imposed wild cluster restricted bootstrap with Webb weights, supplemented by CR2-Satterthwaite and other sensitivity analyses. The design is interpreted as estimating conditional within-panel associations rather than causal wildfire effects.
The study contributes to the literature on sustainable agriculture and agricultural resilience in three specific ways. First, it links regional crop-portfolio diversity and wildfire exposure within a crop-specific panel, connecting two bodies of evidence usually studied separately. Second, it imposes a clear temporal ordering—pre-fire diversity, wildfire exposure, and subsequent crop productivity—and evaluates moderation at t + 1, t + 2, and t + 3. Third, it combines few-cluster inference with alternative exposure and diversity measures, influence diagnostics, a pre-fire placebo, common-horizon estimates, exploratory extensions, and a size-calibrated power diagnostic. The contribution is therefore a scale-specific test of a wildfire-related buffering mechanism, not a general test of whether diversification is beneficial.
The empirical results provide no confirmatory support for H1–H4. The primary wildfire × diversity interaction is positive but imprecisely estimated, and no statistically supported persistence is observed at later horizons. Because the design has limited power for modest interaction effects, the appropriate conclusion is non-support under the available regional panel rather than evidence that the population interaction is zero. The findings therefore narrow the conditions under which regional crop diversity can be defended as a wildfire-specific productivity buffer without contradicting broader diversification benefits documented for other outcomes and scales.
The remainder of the article is organised as follows. Section 2 develops the conceptual and empirical basis for H1–H4. Section 3, Materials and Methods, describes the data, variables, identification limits, estimators, and inferential hierarchy. Section 4 reports the results. Section 5 discusses the findings in relation to prior literature and the study’s identification limits. Section 6 presents the conclusions, policy implications, limitations, and priorities for future research.
2. Literature Review
Crop diversity has been linked to production stability through portfolio stabilisation, whereby crop responses can offset one another and reduce fluctuations in aggregate output. Renard and Tilman [5] associate crop diversity with more stable national food production, while Egli et al. [6] report a similar relationship across European regions. Because compensation across crops can stabilise the aggregate output without improving each crop’s performance, these findings do not establish higher crop-specific productivity or reduced vulnerability. Form and scale therefore matter. Portfolio diversity operates through the distribution of production across crops, whereas intercropping, varietal mixtures, and rotations alter interactions or sequencing within production systems. Regional crop composition differs from farm practices and landscape configuration, so evidence across these scales is not interchangeable [13]. Short-term productivity captures the current performance, whereas resilience concerns the maintenance or recovery of performance after a disturbance.
Productivity evidence reinforces this conditional interpretation. Positive effects across production and ecosystem services vary across strategies and outcomes [7], while longer-term evidence identifies socioeconomic and environmental benefits without a significant overall crop-yield effect [12]. Functionally richer rotations can compensate for yield losses under some adverse climatic conditions [8], whereas farm-level cereal diversification has been associated with smaller labour-productivity losses under reduced rainfall but not higher temperatures [9]. At the landscape level, the association between crop diversity and yield stability varies with pollinator dependence [10]. Meta-analytic evidence reports a positive average biodiversity–productivity association with substantial heterogeneity [11], while within-region increases in crop diversity have been associated with a lower short-term technical efficiency in Europe [14]. Diversification benefits therefore depend on practice, outcome, context, and scale, providing only indirect grounds for expecting regional diversity to moderate crop-specific wildfire responses.
Wildfire exposure may be associated with subsequent agricultural productivity through pathways operating at different spatial and temporal scales. Fire occurrence and spread depend on interactions among ignition sources, weather, topography, land cover, drought, protection status, and grazing regimes [1,2]. This evidence helps explain where fires occur but not subsequent crop-specific productivity. Once a fire has occurred, post-fire soil–water dynamics provide a separate pathway. Fires can accelerate soil-moisture loss and alter vegetation–water relations, with possible implications for post-fire recovery [3]. Smoke exposure provides another channel because physiological responses may be delayed. Evidence from California perennial orchards links wildfire smoke to reduced carbohydrate reserves and lower subsequent almond yields [4].
Post-fire responses may also depend on severity and local production conditions. In a Brazilian slash-and-burn system, soil moisture, erosion, weed competition, water deficit, and crop productivity varied with fire severity [15]. This illustrates the process complexity rather than directly transferable evidence for uncontrolled Portuguese wildfires. At the landscape scale, simulations show that fire-smart management can alter fire regimes under different climate and land-use scenarios [16]. These heterogeneous mechanisms cannot be distinguished by a single regional burned-area indicator, which cannot separately identify direct burning, smoke exposure, post-fire soil–water changes, or fire severity. Regional crop diversity could theoretically buffer some indirect or system-level pathways, but it may not uniformly buffer direct burning, smoke, severity, drought, or crop-specific physiological damage.
Recent agricultural sustainability research also addresses different empirical scales and outcomes. An analysis of the agricultural greenhouse-gas source composition across the EU-27 and Mercosur-4 [17] examines emission profiles, while a Portuguese food-system study [18] uses a constructed food-related carbon-pressure proxy based on dietary availability. Neither measures crop-specific post-wildfire productivity; rather, these studies underline the importance of distinguishing environmental-pressure indicators from the production outcome examined here.
Taken together, diversification and wildfire studies motivate a scale-specific question that remains unresolved: whether pre-fire regional crop diversity moderates the association between regional wildfire exposure and subsequent crop-specific productivity. On the basis of the mechanisms and empirical patterns reviewed above, four testable hypotheses are formulated:
H1.
At mean pre-fire crop diversity, greater wildfire exposure is associated with lower crop-specific productivity in the subsequent period.
H2.
At mean wildfire exposure, greater pre-fire regional crop diversity is associated with higher subsequent crop-specific productivity.
H3.
Pre-fire regional crop diversity positively moderates the wildfire–productivity association, such that the wildfire slope becomes less adverse as diversity increases.
H4.
The positive buffering interaction persists beyond the first post-fire year, remaining positive at both t + 1 and t + 2.
These hypotheses are motivated by mechanisms and empirical patterns that are relevant but not directly equivalent to the present design. H1 follows from soil–water, smoke-related, and severity-dependent pathways [3,4,15]. H2 draws on mixed and outcome-dependent evidence on the productivity implications of agricultural diversification [7,9,12], which provides an indirect basis for the expected positive association with subsequent crop-specific productivity. H3 is the primary moderation hypothesis and draws on aggregate stability, stress-contingent responses, and scale dependence [5,6,9,10,13]. H4 extends that moderation question across post-fire horizons, consistent with mechanisms that can persist after exposure [3,4]. None of these studies directly test the Region × Year exposure, pre-fire regional diversity, and crop-specific post-fire outcome combination used here. The hypotheses therefore define unresolved conditional associations and map directly to the temporal ordering and coefficient interpretation in Section 3; the inferential decision rule used to classify support is specified separately in Section 3.4.
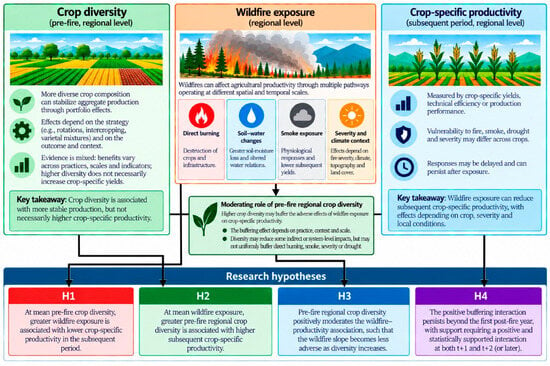
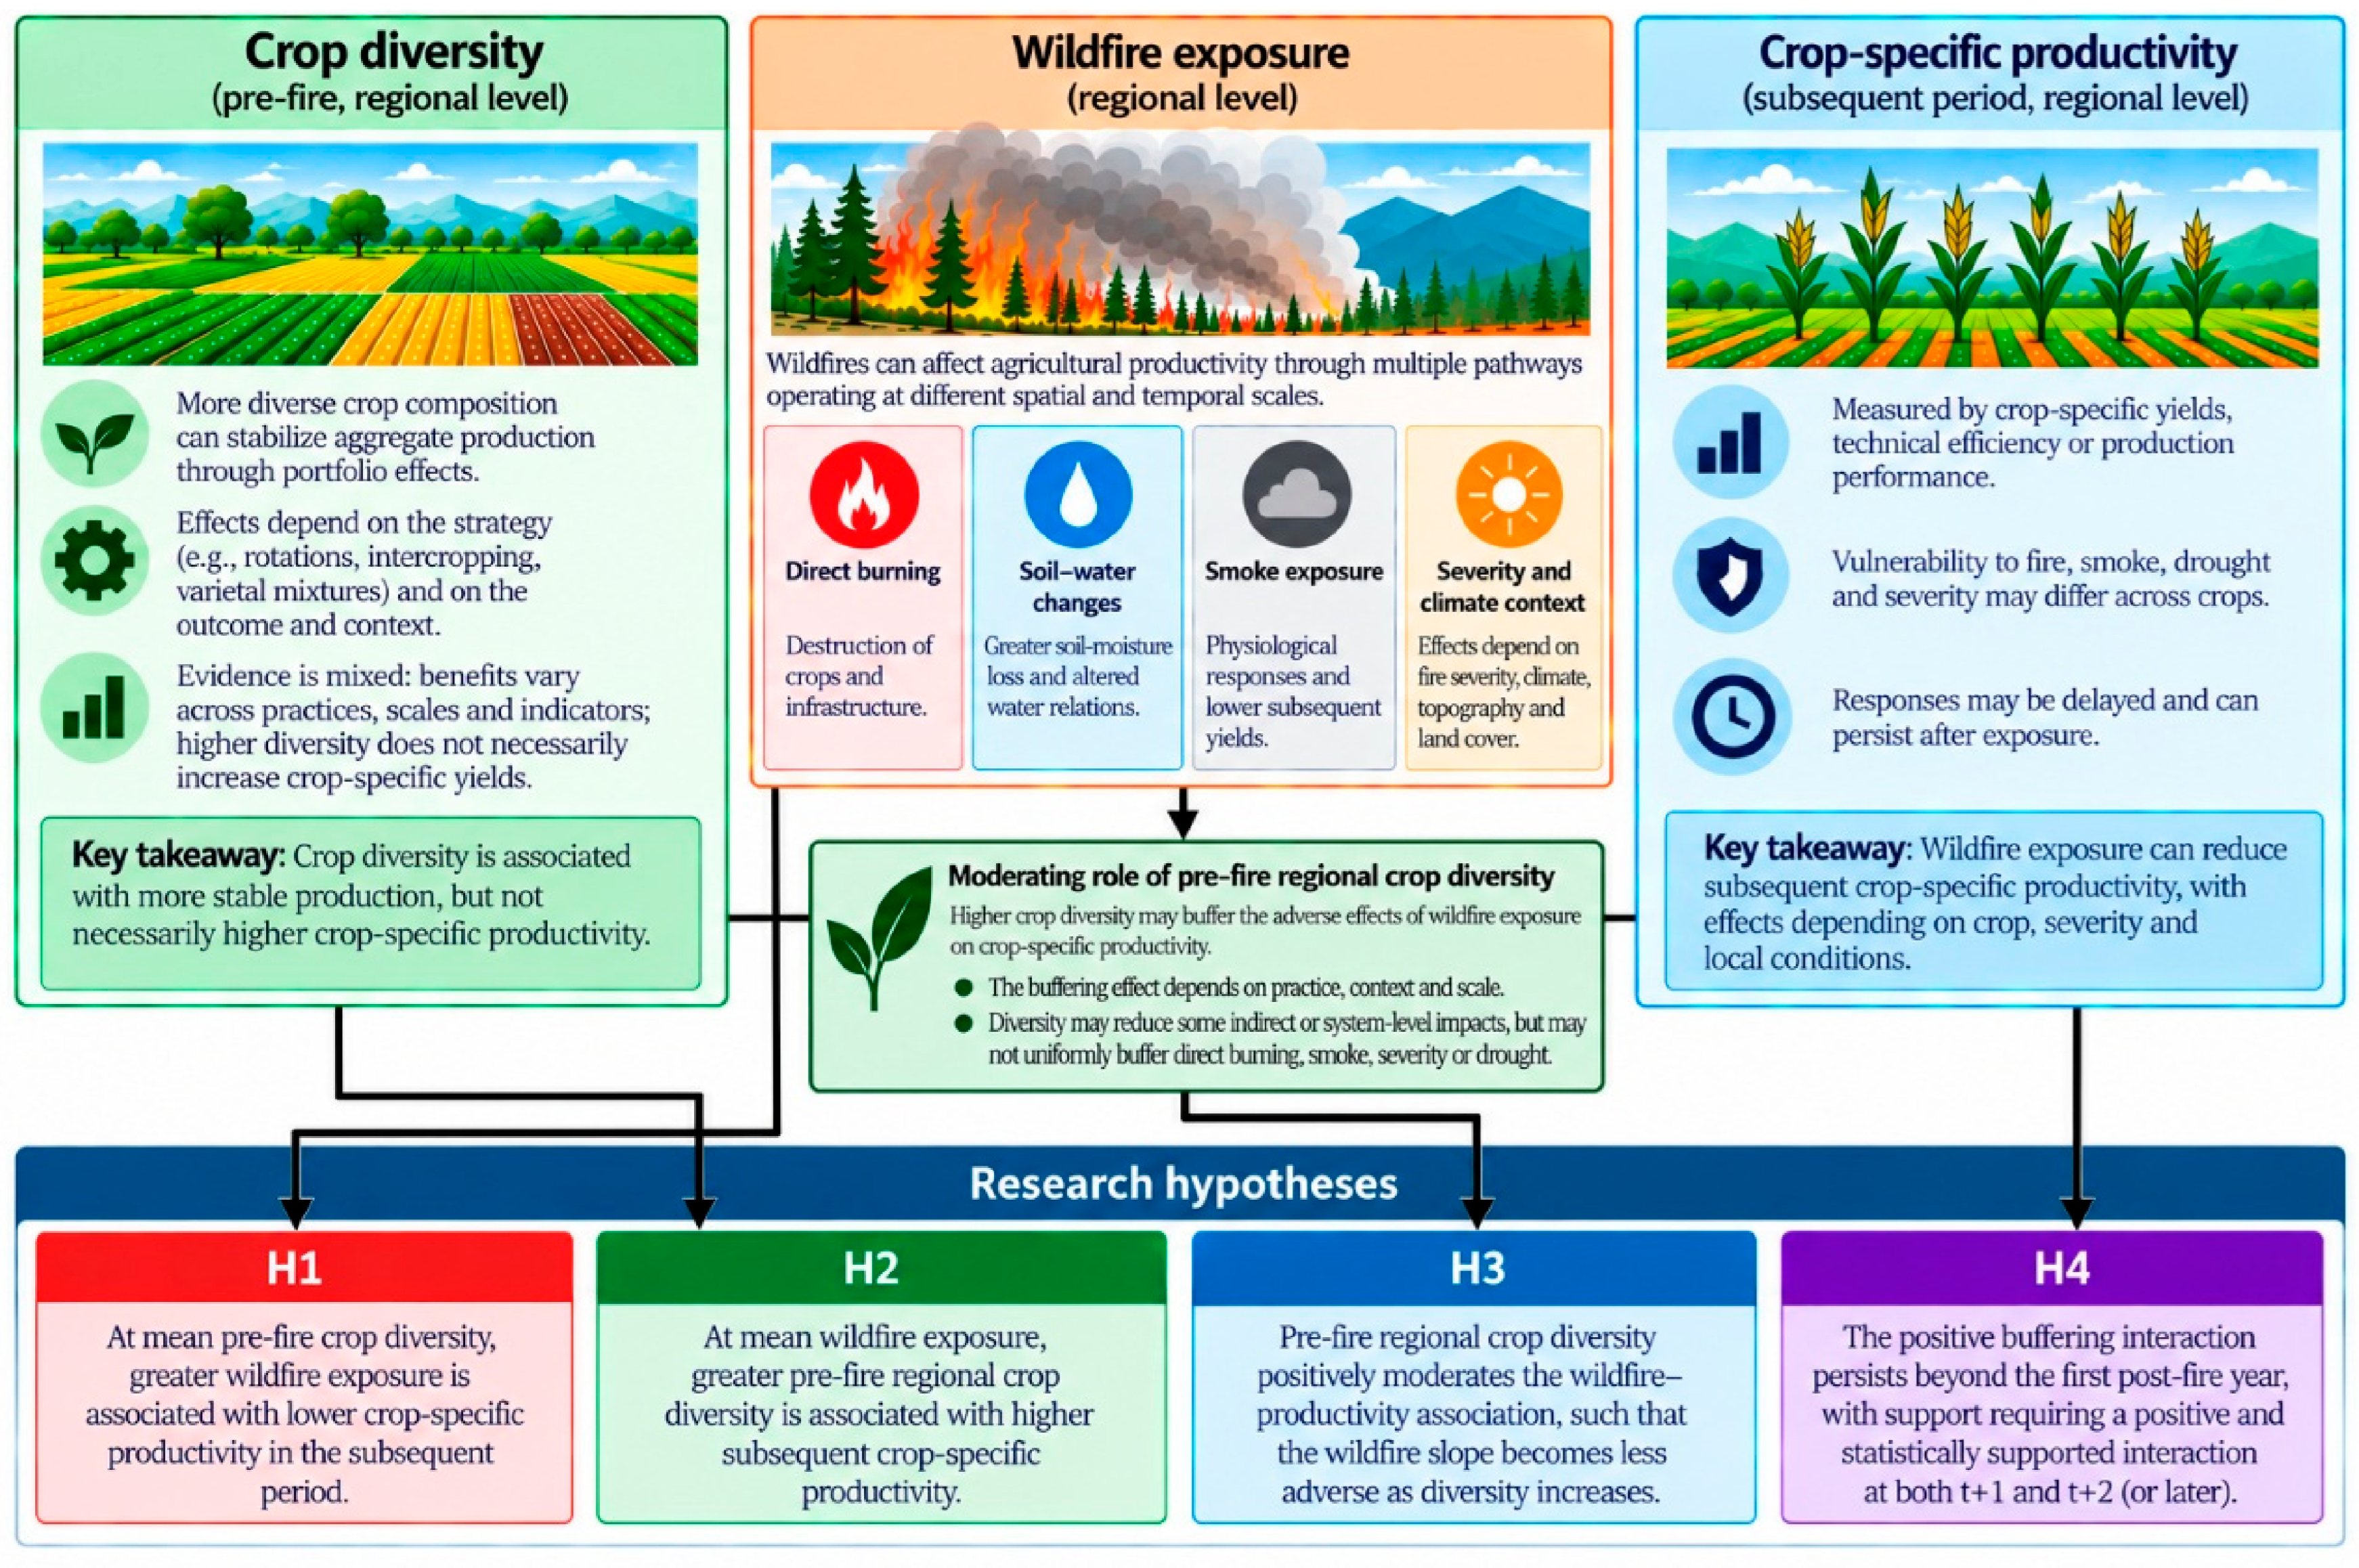
Figure 1 sets out the hypothesised relationships among regional crop diversity, wildfire exposure, and subsequent crop-specific productivity.
Figure 1.
Conceptual framework linking pre-fire regional crop diversity, wildfire exposure, and subsequent crop-specific productivity. The conceptual framework illustrates the hypothesised associations; it does not depict identified causal effects. The H4 panel also summarises the confirmatory support criterion operationalised in Section 3.4. The authors prepared the conceptual illustration using ChatGPT (GPT-6, High Thinking Effort; OpenAI, 2026); the scientific content and labels were reviewed by the authors.
3. Materials and Methods
Building on H1–H4, this section defines the data, analytical units, temporal ordering, identifying variation, econometric specification, and inferential hierarchy used to test them. The Appendix (see Table A1, Table A2, Table A3, Table A4 and Table A5; Figure A1 and Figure A2) documents crop coverage, regional exposure variation, influence diagnostics, and few-cluster diagnostics. The Supplementary Materials (see Tables S1–S12; Figures S1–S7) provide detailed variable documentation, robustness and dynamic specifications, marginal-effect and power diagnostics, exploratory analyses, and supplementary graphics. This separation keeps the main text focused while providing supporting methodological and empirical details.
3.1. Data Sources and Analytical Units
The empirical analysis combines official Statistics Portugal (Instituto Nacional de Estatística, INE) crop-productivity and crop-area series with rural-fire indicators for 2011–2025 [19,20,21,22]. Crop productivity (kg/ha) and crop area (ha) are measured at the Region × Crop × Year level. Rural-fire indicators originate at the municipality level and are summed to agricultural regions using a fixed municipality-to-agricultural-region concordance before merging with the crop panel. The NUTS framework [23] provides territorial context but does not independently establish the agricultural-region correspondence. After aggregation, a single fire value applies to each Region × Year cell. Accordingly, crop outcomes are summarised at Region × Crop × Year, whereas fire and diversity descriptives are calculated once per unique Region × Year cell. No missing values are imputed.
Throughout the empirical analysis, wildfire exposure is shorthand for the INE agricultural burned-area component of the rural-fire records. It is a regional exposure measure, not a crop-specific fire perimeter, severity measure, or direct indicator of crop damage; these limits are incorporated into the identification and interpretation below.
The annual “agricultural burned area” variable represents the agricultural land-cover component of the reported rural-fire burned surface (hectares), aggregated from municipalities to agricultural regions. The source also distinguishes forested and scrub/pasture burned areas. The administrative classification is not a georeferenced overlay of fire perimeters with any analysed crop: it cannot establish which crop group, field or hectare was burned, nor distinguish direct damage from smoke, heat or correlated regional disturbance. Consequently, the exposure is used solely as a region-year fire-activity proxy.
INE indicator 0013510, “Superfície ardida (ha) por Localização geográfica (NUTS–2024) e Tipo de superfície ardida”, reports the annual burned area in hectares using national forestry and fire-statistics sources [22]. Its surface categories distinguish the total burned area (T), forests (1), scrub and pasture (2), and agricultural surface (3). The FireAgricultural_ha variable corresponds to category 3, aggregated to agricultural regions. It measures the regional agricultural burned area rather than direct damage to individual crops; the crop-specific fire-perimeter overlaps cannot be identified from this series. Territorial changes over the study period may also affect geographic comparability. The definition and data-access record for this indicator are provided by INE [22].
The analytical dataset comprises nine agricultural or autonomous regions and 13 crop groups. Its municipality-to-region concordance assigns 308 distinct municipality codes to nine regions, and the regional fire series contains 135 Region × Year observations during 2011–2025. The aggregation relies on a fixed municipality–agricultural-region assignment; consistent municipality-level historical fire extracts and time-varying correspondence records were unavailable to evaluate changes in the territorial boundaries or assignment. The Shannon index is constructed from 11 crop groups with complete crop-area coverage across these 135 regional observations. Horticultural crops (code 105) are omitted because area values are unavailable, whereas small berry fruits (code 111) have area values in 72 cells (53.3%) and are therefore omitted. The fixed crop-group set prevents changes in the source coverage from mechanically changing the index (see Table A1). The availability of crop productivity and model covariates determines which crop-level observations enter each regression.
Variables are constructed with exact calendar-year alignment. Productivity is log-transformed when strictly positive, while burned area and crop area are transformed using ln(1 + x) to retain the observed zeros and reduce right-skewness [24]. Shannon crop shares are calculated from the same 11 crop groups in every Region × Year observation; zero shares contribute zero under the limit s ln(s) = 0 [5,6,25]. The Herfindahl–Hirschman index and effective crop diversity are used as alternative composition measures.
The analytical data do not contain spatially matched fire-perimeter and crop-location records or an independent annual measure of total cultivated land by agricultural region. The observed area summed over the 11 complete-coverage crop groups is a restricted crop-group denominator, not official total cultivated land or a utilised agricultural area. Ratios using that denominator are reported only as compositional/scale sensitivity metrics; they cannot be described as a fraction of the actually burned crop or region’s farmland.
The temporal ordering is pre-fire diversity at t − 1, wildfire exposure at t, and the primary productivity outcome at t + 1. The lagged crop area is also measured at t − 1, so the scale control precedes exposure rather than adjusting for a post-exposure variable [26,27,28]. Table S1 documents official indicators and aggregation rules; Table S2 documents variables excluded because their spatial or temporal definitions could not be harmonised to the agricultural-region design without unsupported assumptions. Table 1 summarises the analytical variables.
Table 1.
Variables, construction, analytical level and official sources.
Region-specific annual environmental and agricultural conditions, including precipitation, temperature, drought intensity, irrigation availability, fire severity, and crop phenology, may influence both wildfire exposure and subsequent crop productivity. However, these variables could not be incorporated into the empirical specifications because consistent information at the required spatial and temporal resolution was unavailable. Similarly, the absence of spatially matched fire-perimeter and crop-location data prevented the identification of direct wildfire exposure for individual crop groups. Consequently, the estimated relationships should be interpreted as conditional associations between regional wildfire exposure, pre-fire crop diversity, and subsequent crop-specific productivity, rather than causal effects or direct measures of wildfire damage. These data limitations also mean that unobserved region-specific annual conditions may influence the estimated wildfire–productivity relationship and its interaction with crop diversity.
3.2. Data Quality, Sample Restrictions, and Identification
The source identifier (Year × AgriculturalRegion × CropCode) is unique, and each fire variable is constant within a Region × Year cell before being repeated across crop rows.
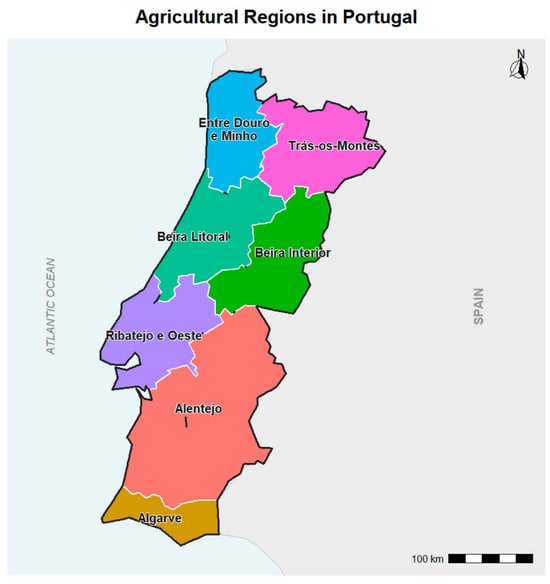
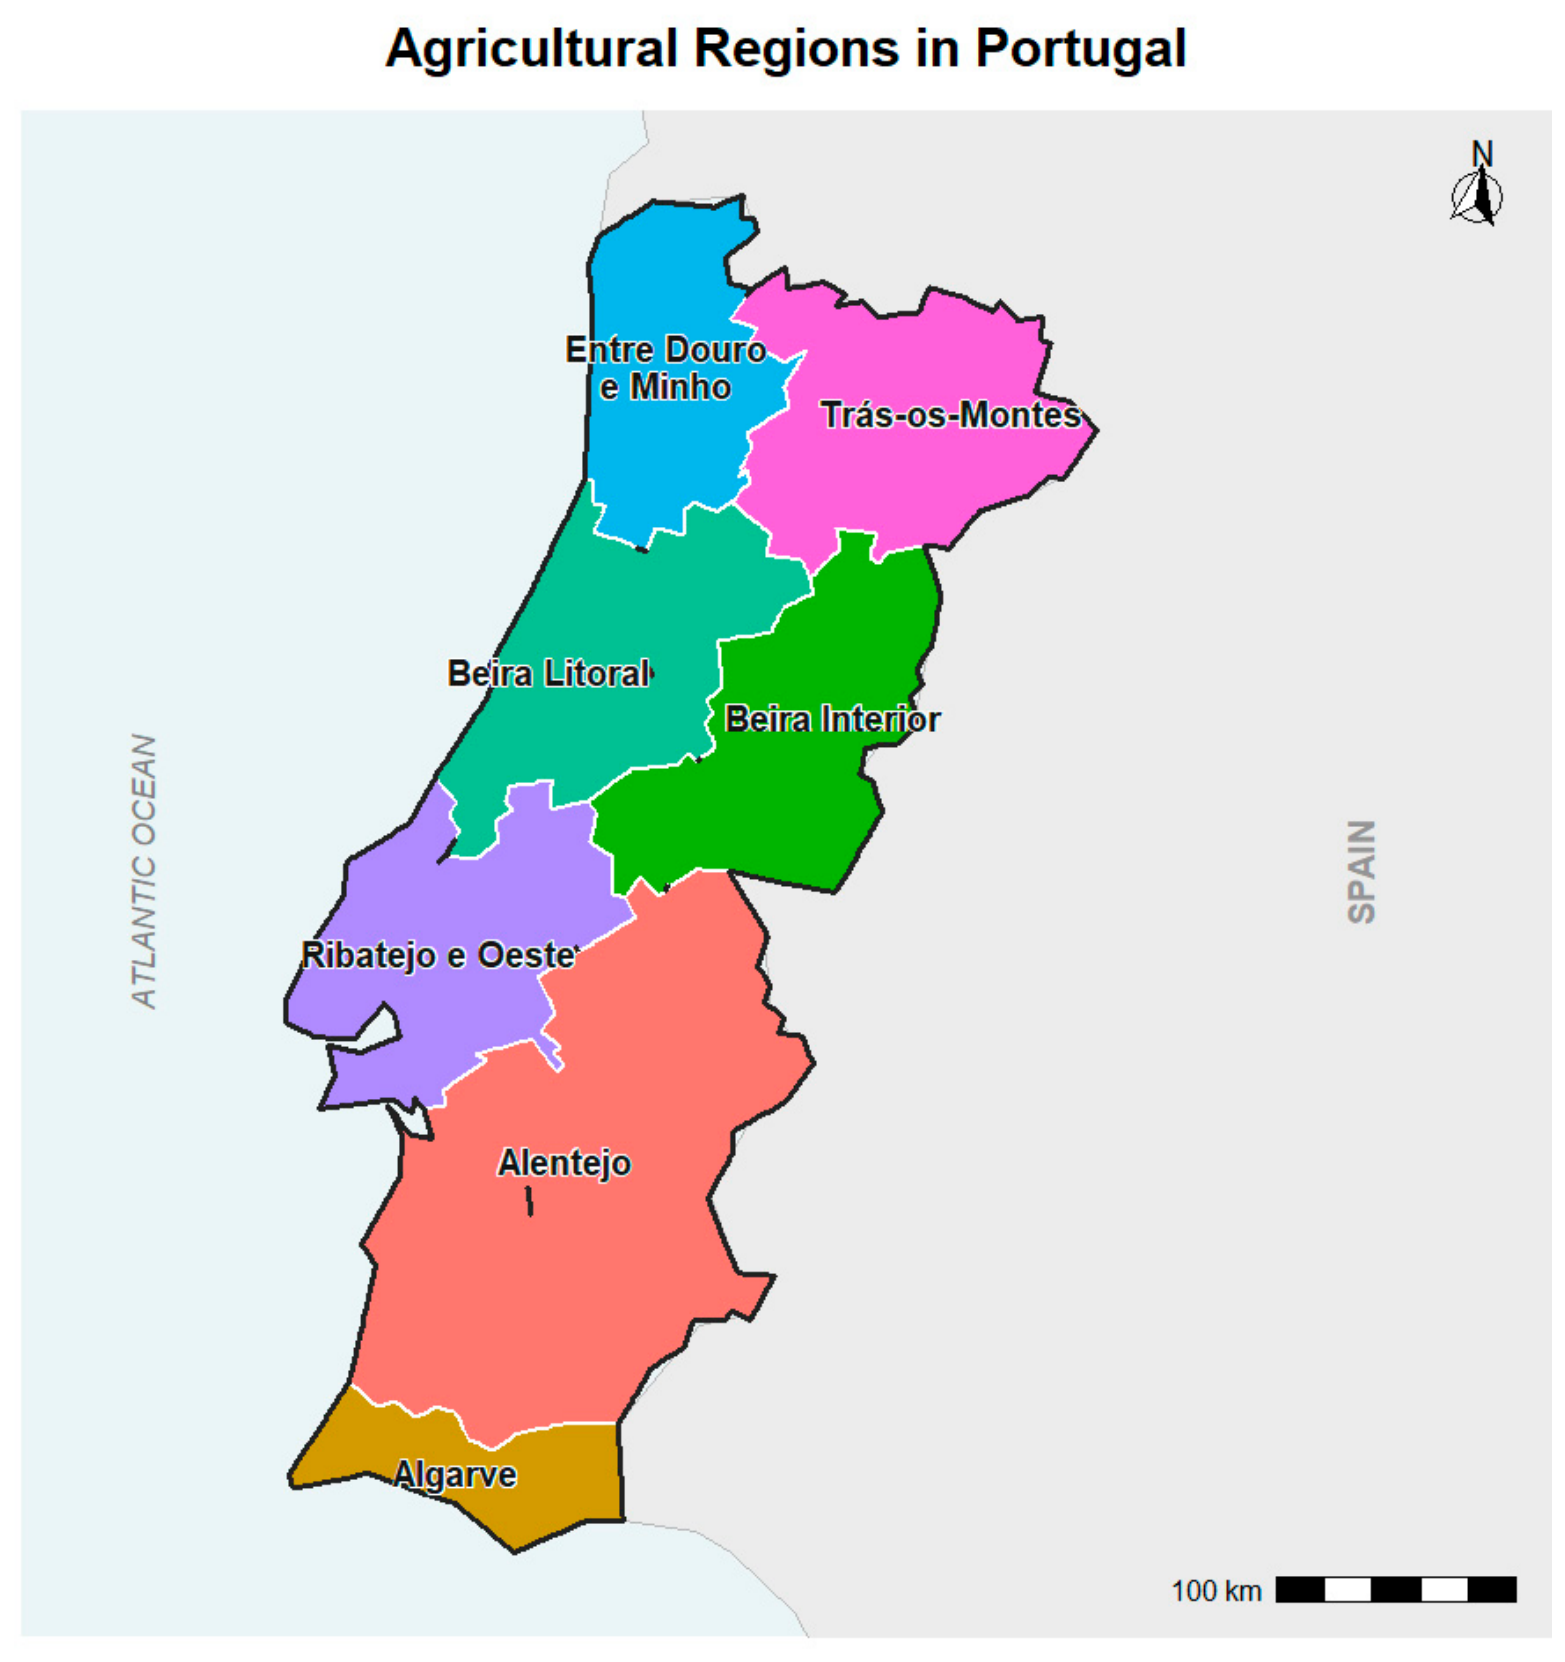
The baseline identifying sample is restricted to the seven agricultural regions that exhibit within-region temporal variation in the agricultural burned area: Alentejo, Algarve, Beira Interior, Beira Litoral, Entre Douro e Minho, Ribatejo e Oeste, and Trás-os-Montes (see Figure 2 below).
Figure 2.
Seven mainland agricultural regions used in the primary empirical analysis. The authors created this figure using R and the ggplot2 package in RStudio (version 2026.07.0).
Açores and Madeira are excluded from the primary seven-region specification because the recorded agricultural burned area is zero throughout the available period in both regions (minimum = 0; maximum = 0; SD = 0; see Table A2). This restriction defines an estimand for the continental agricultural regions with observed variation in the main exposure measure. Regions with constant zero exposure can, in principle, contribute to the estimation of other coefficients, so their exclusion is a sample-definition choice rather than an algebraic necessity. The two regions are retained in a nine-region sensitivity specification. The recorded zero values are not necessarily evidence of the physical absence of fires.
The recorded fire series for Açores contains zero burned-area and fire-count values in 2011–2025, while Madeira records zero for agricultural burned area despite positive values in some other fire measures. These observations cannot be distinguished conclusively from reporting or coverage limitations with the available information. The mainland coverage of the SGIFR system does not establish the classification of the corresponding INE series for the autonomous regions. The nine-region estimates are therefore interpreted as a sensitivity to the study population and source coverage, rather than a simple increase in statistical power.
The six observations for main industrial crops in Algarve (2019–2024) report zero crop area alongside positive productivity of 1000–1100 kg/ha. A zero crop area contributes a zero share to the Shannon index, while a zero lagged area enters the ln(1 + area) control without imputation. The reported values were retained. Table S3 presents the exclusion sensitivities; the underlying statistical explanation for these values is not available.
Because the source panel begins in 2011, one-year-lagged diversity is first available for a 2012 fire exposure. The t + 1 model uses fire exposure years 2012–2024 and productivity years 2013–2025; t + 2 uses fire years 2012–2023 and productivity years 2014–2025; and t + 3 uses fire years 2012–2022 and productivity years 2015–2025. The three-outcome common-horizon panel is restricted to fire years 2012–2022 (all outcomes observed at t + 1, t + 2 and t + 3). After specification-specific complete-case restrictions, the baseline contains 972 Region × Crop × Year rows, 91 unique Region × Year exposure cells (7 regions × 13 exposure years), 76 observed Region × Crop fixed-effect units, and seven identifying regional clusters. Multiple crop outcomes observed within the same Region × Year add crop-specific outcome variations but do not constitute independent wildfire shocks; inference is therefore clustered at the agricultural-region level. The 2025 fire record cannot enter the t + 1 model because 2026 productivity is unavailable.
The primary Shannon diversity index, H = −Σ pi log(pi), refers exclusively to 11 crop groups with an observed area in every region-year during the observation period. Its constant group set protects against artificial changes from intermittent reporting but excludes horticultural crops and small berry fruits where coverage is incomplete. In regions specialising in omitted activities, it may understate, overstate, or reorder actual broader portfolio diversity; evenness is measured only among the included crop groups. Because a compatible annual measure of the total cultivated area by agricultural region is unavailable, the share represented by the 11 included groups cannot be reliably quantified. A nine-group index varies the composition of the observed subset but cannot test the omission of unmeasured crops.
Missingness is handled by specification-specific complete-case estimation; no interpolation, carry-forward procedure, or model-based imputation is used. Sample size can therefore decline at longer horizons or under alternative specifications. To distinguish horizon effects from changes in outcome availability, the t + 1, t + 2, and t + 3 models are also estimated on a common-horizon sample that holds the estimation rows fixed across all three outcomes.
3.3. Variable Construction and Econometric Specification
Crop diversity is defined from crop-area shares because the substantive hypothesis concerns the composition of cultivated area before wildfire exposure, rather than the number of crop labels alone. Let denote the cultivated crop area and denote the fixed set of 11 crop groups with complete area coverage (e.g., Cereals for grain; Main dry pulses; Potatoes; Main industrial crops; Main forage crops; Main fresh fruits; Main subtropical fruits; Citrus fruits; Main nuts; Vineyards; and Olive groves); subscripts index agricultural region, crop, and year, respectively. The crop-area share is shown in Equation (1) below:
The primary diversity measure is the Shannon diversity index, which captures both crop richness and the evenness of cultivated-area shares. Because the 11-group crop set defined above is held constant over time, temporal changes in the index reflect changes in crop-area composition rather than data availability. Shannon diversity is calculated as shown in Equation (2) below:
where denotes the share of crop in the total area of the 11 crop groups in region and year , as defined in Equation (1). For zero crop shares, the standard limiting convention is applied.
The Herfindahl–Hirschman Index (HHI) and effective crop diversity (ECD) are retained as alternative diversity measures for sensitivity analysis, as shown in Equations (3) and (4) below:
and
Wildfire exposure is measured as the agricultural burned area () at the Region × Year level. Because burned area and crop area are non-negative and strongly right-skewed, transformations are used to retain genuine zero-exposure and zero-area observations while reducing right-skewness. The primary moderator is measured before the wildfire year.
To facilitate interpretation of the constituent coefficients in the interaction model, log wildfire exposure and lagged Shannon diversity are mean-centred using the estimation sample, as shown in Equation (5) below:
The temporal ordering is therefore pre-fire diversity at , wildfire exposure at , and crop productivity at . The lagged crop area is also measured at . This ordering ensures that the moderator and crop-area control are measured prior to wildfire exposure rather than after the event and reduces mechanical simultaneity between current crop composition and current productivity.
However, this temporal ordering does not establish exogeneity. Exact fire dates, harvest dates, and local weather conditions and the spatial overlap between burned agricultural land and individual crops are unavailable. The estimand should therefore be interpreted as a conditional within-panel association rather than a causal effect. The primary specification is a two-way fixed-effects model with Region × Crop and Year fixed effects, as shown in Equation (6) below:
Here, Y_{r,c,t + 1} denotes the crop-specific productivity in region r for crop group c in year t + 1; the dependent variable is ln(Y_{r,c,t + 1}). The coefficients β1 and β2 represent the wildfire and diversity slopes at their respective centring values, β3 is the wildfire × diversity interaction, and γ is the coefficient of ln(1 + crop area at t − 1). Region × Crop fixed effects (α_{r,c}) absorb time-invariant crop-region characteristics, including soil suitability, production systems, and specialisation. Year fixed effects (λ_t) absorb shocks common to regions and crops, while ε_{r,c,t + 1} is the regression disturbance.
Centring reference values are calculated across all 972 eligible Region × Crop × exposure-year rows: mean ln(1 + agricultural burned area) = 5.96909 and mean lagged Shannon = 1.64676. In contrast, Table 2 summarises the same regional exposures once in each of the 91 Region × Year cells (respective means 5.9567 and 1.6437). Thus, “at mean diversity” in the fitted coefficients refers to the crop-row-weighted model centring, not the unweighted Region × Year descriptive mean; the interaction coefficient itself is invariant to recentering.
Table 2.
Descriptive statistics by analytical grain.
Because both variables entering the interaction are centred, β1 is the wildfire–productivity slope at mean pre-fire diversity and β2 is the diversity–productivity slope at mean wildfire exposure. β3 indicates how the wildfire slope changes with pre-fire Shannon diversity and is the parameter for H3. Continuous interactions are interpreted using conditional slopes, not the sign or significance of β3 alone, following Berry et al. [29] and Brambor et al. [30]. Equation (7) defines the conditional wildfire slope; it is evaluated at observed diversity values to avoid extrapolation beyond the data.
Persistence is examined by replacing the productivity outcome with outcomes at horizons , while retaining the same wildfire exposure year, pre-fire diversity measure, lagged crop-area control, and centring constants, as shown in Equation (8) below:
where h ∈ {1, 2, 3}.
The same centring constants are used across horizons so that β1,h and β2,h retain a common reference for interpretation. In a model containing both constituent terms and their interaction, additive recentering changes these constituent coefficients but not β3,h, the interaction coefficient. Differences in β3,h across horizons therefore cannot be attributed to the choice of centring constants; they may reflect outcome dynamics, sample composition, or estimation uncertainty. H4 requires positive, statistically supported moderation at t + 1 and t + 2; t + 3 provides supplementary evidence.
An exploratory specification adds region-specific linear year trends to the Region × Crop and Year fixed effects, using the same 972 observations as the primary analysis. The redundant common linear trend is omitted. This specification accommodates smooth differences in regional trajectories but cannot absorb discrete region-specific climate shocks, drought episodes, or changes in fire intensity. Results from this model are assessed using conventional region-clustered CR1 inference and interpreted as supplementary sensitivity evidence, not as replacements for the primary WCR11 tests.
3.4. Estimator Choice, Inference, and Robustness Strategy
The two-way fixed-effects (TWFE) specification is preferred to pooled ordinary least squares (OLS) or random effects because time-invariant Region × Crop characteristics may be correlated with both regional fire exposure and crop composition. Region × Crop fixed effects therefore absorb persistent crop-region heterogeneity, while Year fixed effects absorb shocks common to all regions and crops [31,32]. A Region × Year fixed effect cannot be added because wildfire exposure, regional diversity, and their interaction all vary at that level and would be absorbed exactly. Consequently, unobserved region-specific year shocks cannot be eliminated nonparametrically and remain an explicit limitation of the design. Crop × Year fixed effects are algebraically feasible, but jointly absorbing Region × Crop and Crop × Year fixed effects makes the available null-imposed WCR11 bootstrap transformation computationally singular; no confirmatory inference is based on that variant.
No instrumental-variable (IV) or difference/system generalised method of moments (GMM) estimator is used. The data contain no defensible excluded instrument that shifts regional fire exposure while being plausibly unrelated to subsequent productivity except through fire, and the baseline equation is not a dynamic panel model with a lagged dependent variable requiring an Arellano–Bond-type estimator. Internal lag instruments would not resolve omitted region-year weather shocks and could create weak-identification or instrument-proliferation problems [33]. The TWFE design therefore makes a deliberately narrower claim: it controls for observed timing and time-invariant heterogeneity but estimates conditional within-panel associations rather than causal wildfire effects.
The additional region-specific linear trends account only for smooth differences in regional evolution; any unobserved drought or irrigation shock correlated with both wildfire and yields can bias the wildfire coefficient; the correlation between such shocks and the product of wildfire exposure and diversity can also bias the estimated interaction in either direction. Ordering diversity at t − 1 and yields at t + 1 does not establish a wildfire-specific causal pathway.
Because wildfire exposure and crop diversity vary at Region × Year and are repeated across crop rows, observations within an agricultural region can share serial and cross-crop disturbances. This is the aggregate-regressor dependence problem highlighted by Moulton [34]. Standard errors are therefore clustered at the agricultural-region level. With only seven regional clusters (G = 7), conventional cluster-asymptotic inference is fragile. Bootstrap approaches help address inferential size distortions that can arise with few clusters [35]. This number cannot be increased by treating crop rows or Region × Year cells as independent clusters because wildfire exposure is shared within agricultural regions; doing so would misrepresent the dependence structure. Increasing the number of independent clusters would require outcome and exposure data at a finer common spatial scale. The preferred hypothesis tests use the null-imposed wild cluster restricted bootstrap (WCR11) with Webb six-point weights [36,37]; related algorithms and implementations are detailed by Roodman et al. [38]. H1–H3 are tested with 99,999 bootstrap replications; the horizon-specific H4 tests use the same WCR11 procedure. CR2 cluster-robust inference with Satterthwaite degrees-of-freedom adjustment is reported as an additional small-sample diagnostic; Cameron and Miller discuss the broader challenges of cluster-robust inference with few clusters [39], while small-sample degrees-of-freedom adjustments are also examined by Imbens and Kolesár [40]. Regional clustering allows arbitrary within-region dependence but assumes that disturbances are sufficiently independent across agricultural regions for the chosen inference procedures; geographically shared shocks may weaken that assumption.
Driscoll–Kraay standard errors are not used as the principal correction because the panel has only 13 primary exposure years, whereas the central inferential problem is the very small number of regional clusters [37,41]. Region + Year two-way clustering is retained only as a secondary asymptotic sensitivity check. WCR11 governs the confirmatory decisions for H1–H4; conventional region-clustered p-values, CR2-Satterthwaite results, and other covariance estimators are supporting diagnostics. A hypothesis is classified as supported only when the coefficient has the hypothesised sign and the preferred two-sided WCR11 p-value is below 0.05. In Equation (6), H1 requires β1 < 0 at mean pre-fire diversity, H2 requires β2 > 0 at mean wildfire exposure, and H3 requires β3 > 0. H4 additionally requires the horizon-specific interaction to be positive and statistically supported at both t + 1 and t + 2; t + 3 is supplementary longer-horizon evidence. This hierarchy is applied consistently so that alternative p-values or exploratory specifications do not override the confirmatory conclusion.
The implementation of the preferred two-sided WCR11 tests applies Webb six-point weights and the fnw11 algorithm, with 99,999 bootstrap replications and clustering at the agricultural-region level. The R implementation uses fwildclusterboot::boottest with fixest estimates; the test statistic is recomputed under the null restriction. Bootstrap confidence intervals are obtained from the test procedure where inversion is numerically stable. CR2–Satterthwaite tests and conventional cluster-t intervals are reported separately because they rely on different finite-sample approximations. With seven independent regions, confidence intervals remain imprecise even under small-sample corrections.
Robustness analyses are organised around specific threats to interpretation rather than a search for significance. They vary the fire-exposure definition (agricultural burned area, total burned area, fire count, agricultural burned area in levels, and the normalised exposure defined in Table 1), diversity measurement (Shannon, HHI, effective crop diversity, and the alternative nine-group measure), sample composition, weighting, the pre-fire crop-area control, and the productivity outcome. Leave-one-region-out and leave-one-year-out analyses assess influence. The pre-fire productivity placebo is treated as a timing diagnostic rather than a definitive falsification test, and the common-horizon sample separates persistence from changing outcome availability. Exploratory regional aggregation, contemporaneous timing, one defined extreme-fire threshold, and annual-versus-permanent crop heterogeneity are kept outside H1–H4 and adjusted jointly with Holm correction as a four-test family. The residual cluster-wild power simulation is used only to characterise design sensitivity, not to reinterpret non-significance as evidence of no effect.
4. Results
Following the hypotheses in Section 2 and the design and inferential hierarchy in Section 3, this section reports the evidence in the same order: descriptive structure, baseline H1–H3 estimates and conditional slopes, H4 persistence, and then robustness, influence, placebo, exploratory, and power diagnostics. Confirmatory conclusions follow WCR11; alternative covariance estimators and exploratory specifications are interpreted as supporting evidence only.
4.1. Descriptive Evidence
Table 2 reports descriptive statistics for the variables used in the empirical analysis at their appropriate analytical grain. Crop-specific outcomes and crop area are summarised at the Region × Crop × Year level, whereas wildfire exposure and crop-diversity measures are summarised at the Region × Year level.
As shown in Table 2, the main sample contains 972 crop-level analytical rows but only 91 unique Region × Year exposure cells; exposure-level descriptives are therefore reported at the latter grain. The mean agricultural burned area is 1209.4 ha, with a strongly right-skewed distribution (median = 437.6 ha; maximum = 17,098.3 ha). The lagged Shannon diversity averages 1.644 and ranges from 1.367 to 1.905. The Spearman correlation between the log agricultural burned area and lagged Shannon diversity is −0.237 (p = 0.024) when calculated once per Region × Year cell.
This unclustered bivariate statistic is descriptive only: it neither conditions on the fixed effects nor addresses the seven-cluster inference problem and is not used to evaluate H1–H4. Table S4 provides a complementary Pearson correlation matrix calculated once per Region × Year cell. Because it uses variables in their tabulated forms, the raw agricultural-fire/Shannon Pearson correlation in Table S4 is not directly comparable to the Spearman correlation based on log agricultural burned area reported here.
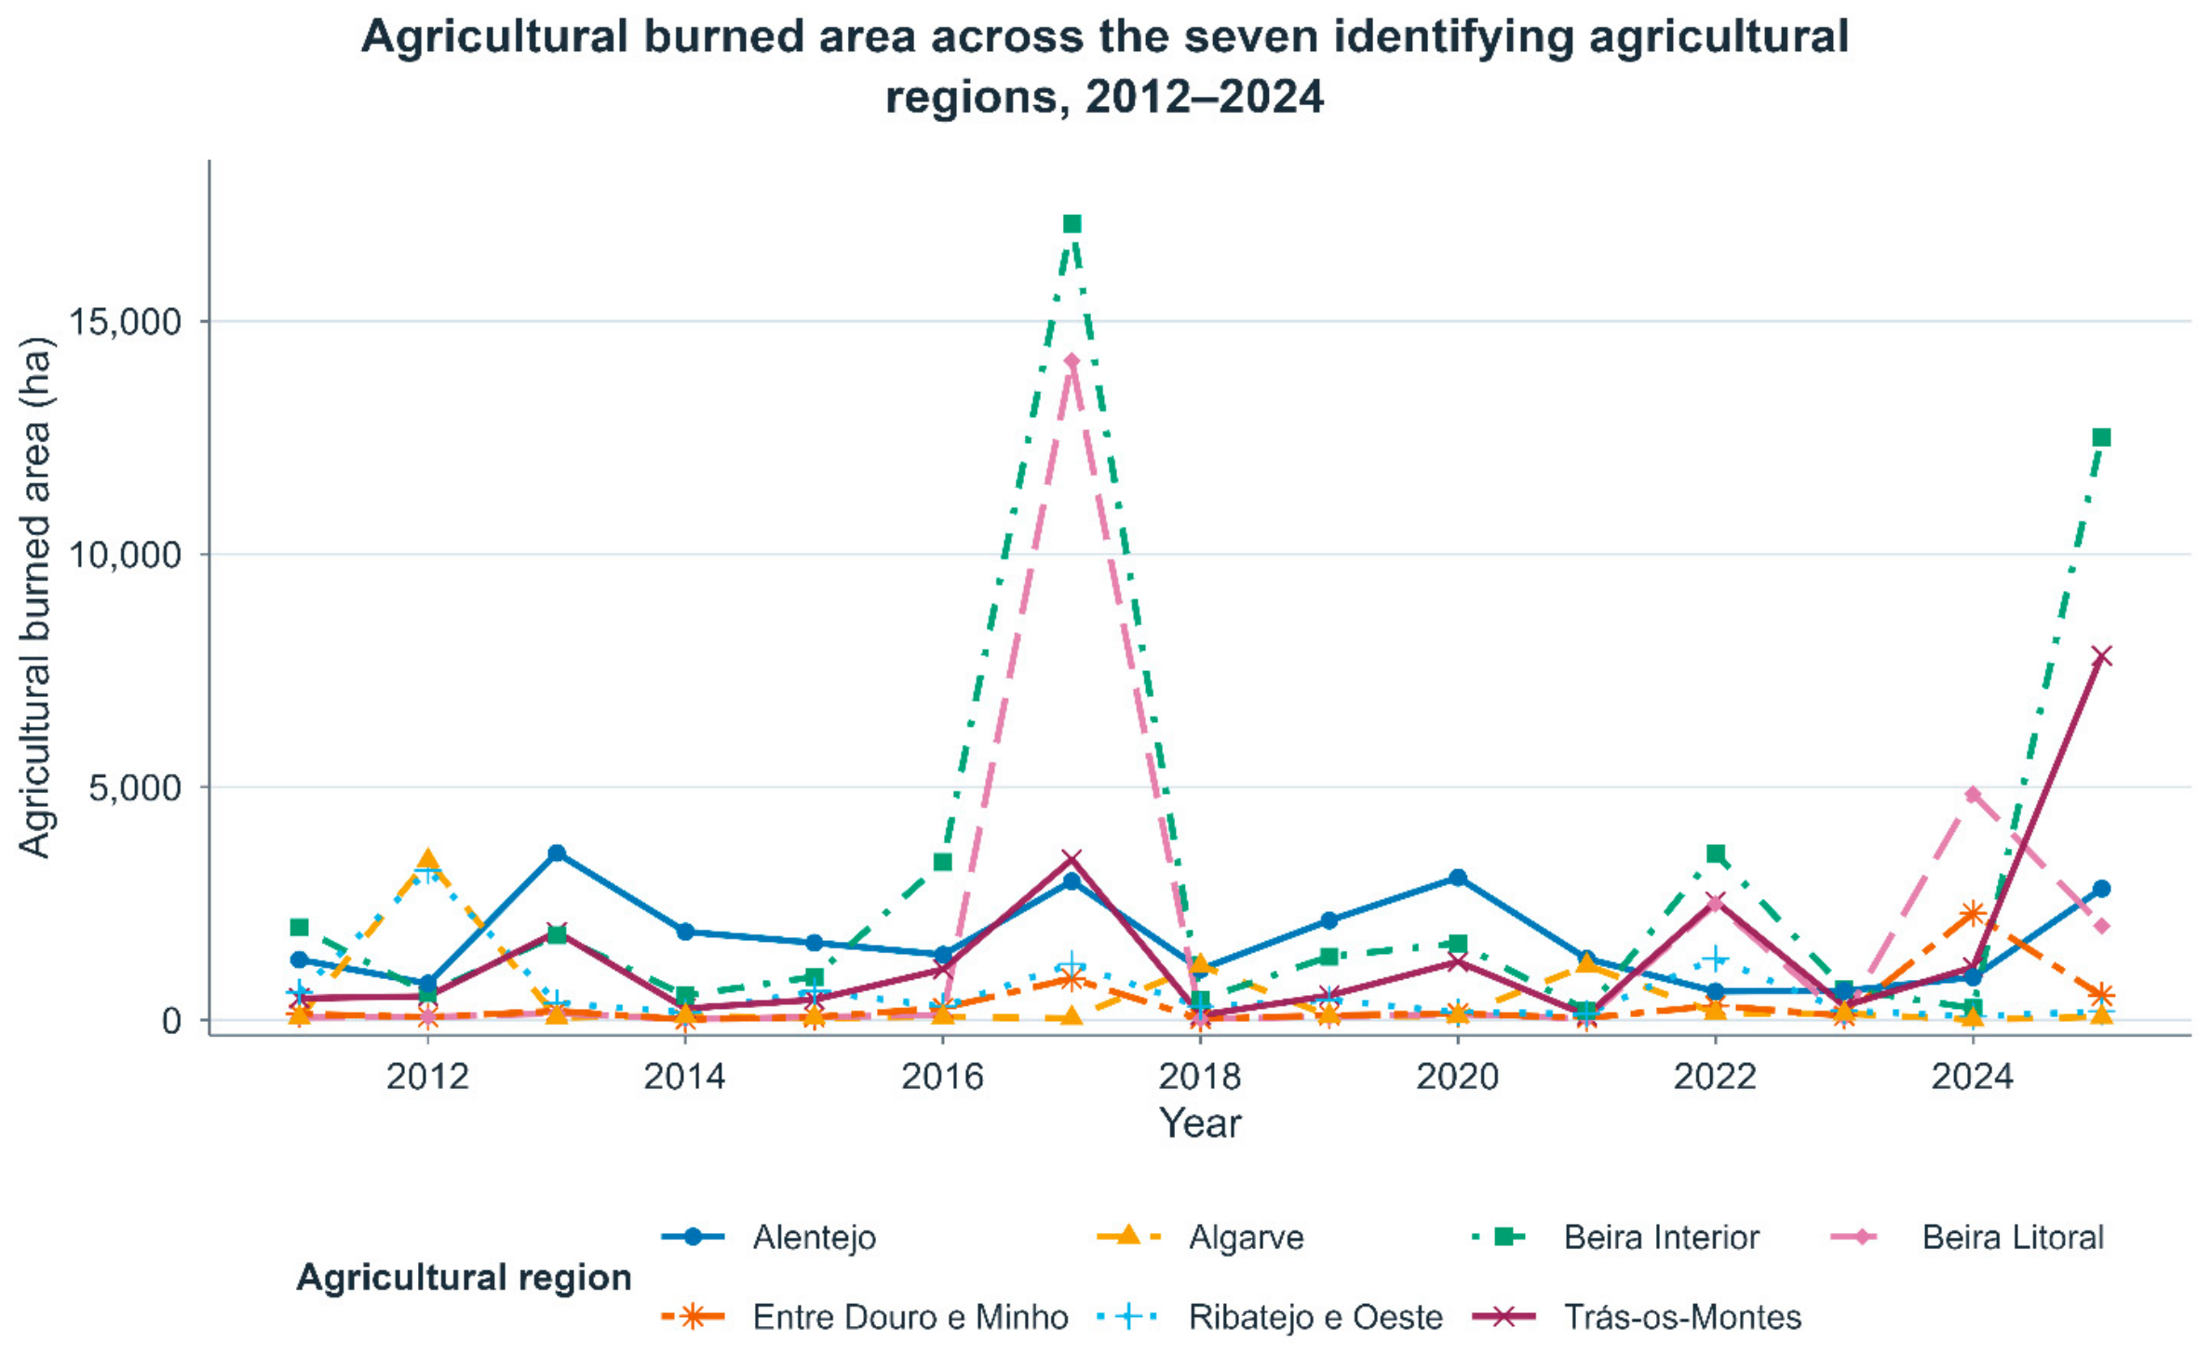
Figure 3 shows that exposure is concentrated in a limited number of high-fire region-years, particularly 2017 in Beira Interior and Beira Litoral.
Figure 3.
Agricultural burned area across the seven identified agricultural regions, 2012–2024. The authors created this figure using R and the ggplot2 package in RStudio (version 2026.07.0).
The high-fire region-years are retained rather than trimmed or winsorised because they are observed source values and may contain substantively relevant exposure variation. Their influence is evaluated through leave-one-region-out and leave-one-year-out diagnostics; Table A3 and Table A4 report the numerical estimates, and Figure A1 and Figure A2 visualise them.
4.2. Baseline Fixed-Effects Estimates and Primary Hypothesis Tests
The baseline fixed-effects model has an adjusted R2 of 0.941 but a within-R2 of 0.0019. The contrast indicates that most model fit is attributable to the Region × Crop and Year fixed effects, while the time-varying regressors account for little of the remaining within-unit variation. Applying the conditional hypotheses in Section 2 and the WCR11 decision rule in Section 3.4, H1–H3 are not supported. At mean pre-fire diversity, the wildfire coefficient is −0.00536, which has the hypothesised negative sign for H1 but is imprecisely estimated (WCR11 p = 0.396; 95% bootstrap CI −0.0156 to 0.0095). At mean wildfire exposure, the diversity coefficient is −0.1985 rather than positive and is also unsupported (p = 0.667; CI −2.452 to 1.662).
The positive H3 coefficient alone does not establish moderation because its bootstrap uncertainty includes both negative and positive associations. Conditional slopes and their uncertainty, rather than the sign of the interaction coefficient alone, are central to interpreting continuous moderation [29,30]. Table 3 summarises the confirmatory estimates; Table S5 provides full coefficient-level results under conventional region-clustered asymptotic inference, and Table S6 reports the preferred WCR11 robustness and selected conditional-slope and interquartile-contrast results.
Table 3.
Baseline fixed-effects results and wild-cluster inference.
The baseline interaction estimate is positive but imprecise (β = 0.0931; N = 972; 91 Region × Year exposure cells; G = 7 regional clusters). The preferred Webb-weight WCR11 test gives p = 0.4914 and a 95% bootstrap interval of [−0.3108, 0.3489], spanning both negative and positive interactions. CR2–Satterthwaite inference also indicates substantial uncertainty (SE = 0.1243; p = 0.5015; approximate degrees of freedom = 3.45). Table S7 presents the corresponding few-cluster inference results across the principal and additional specifications.
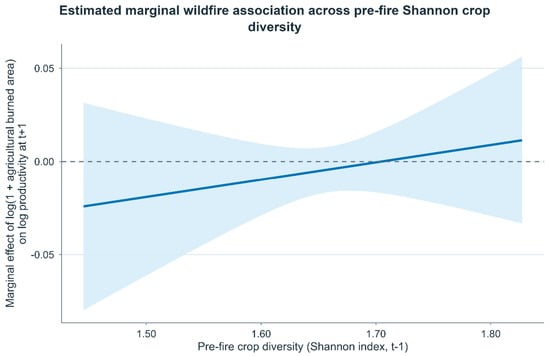
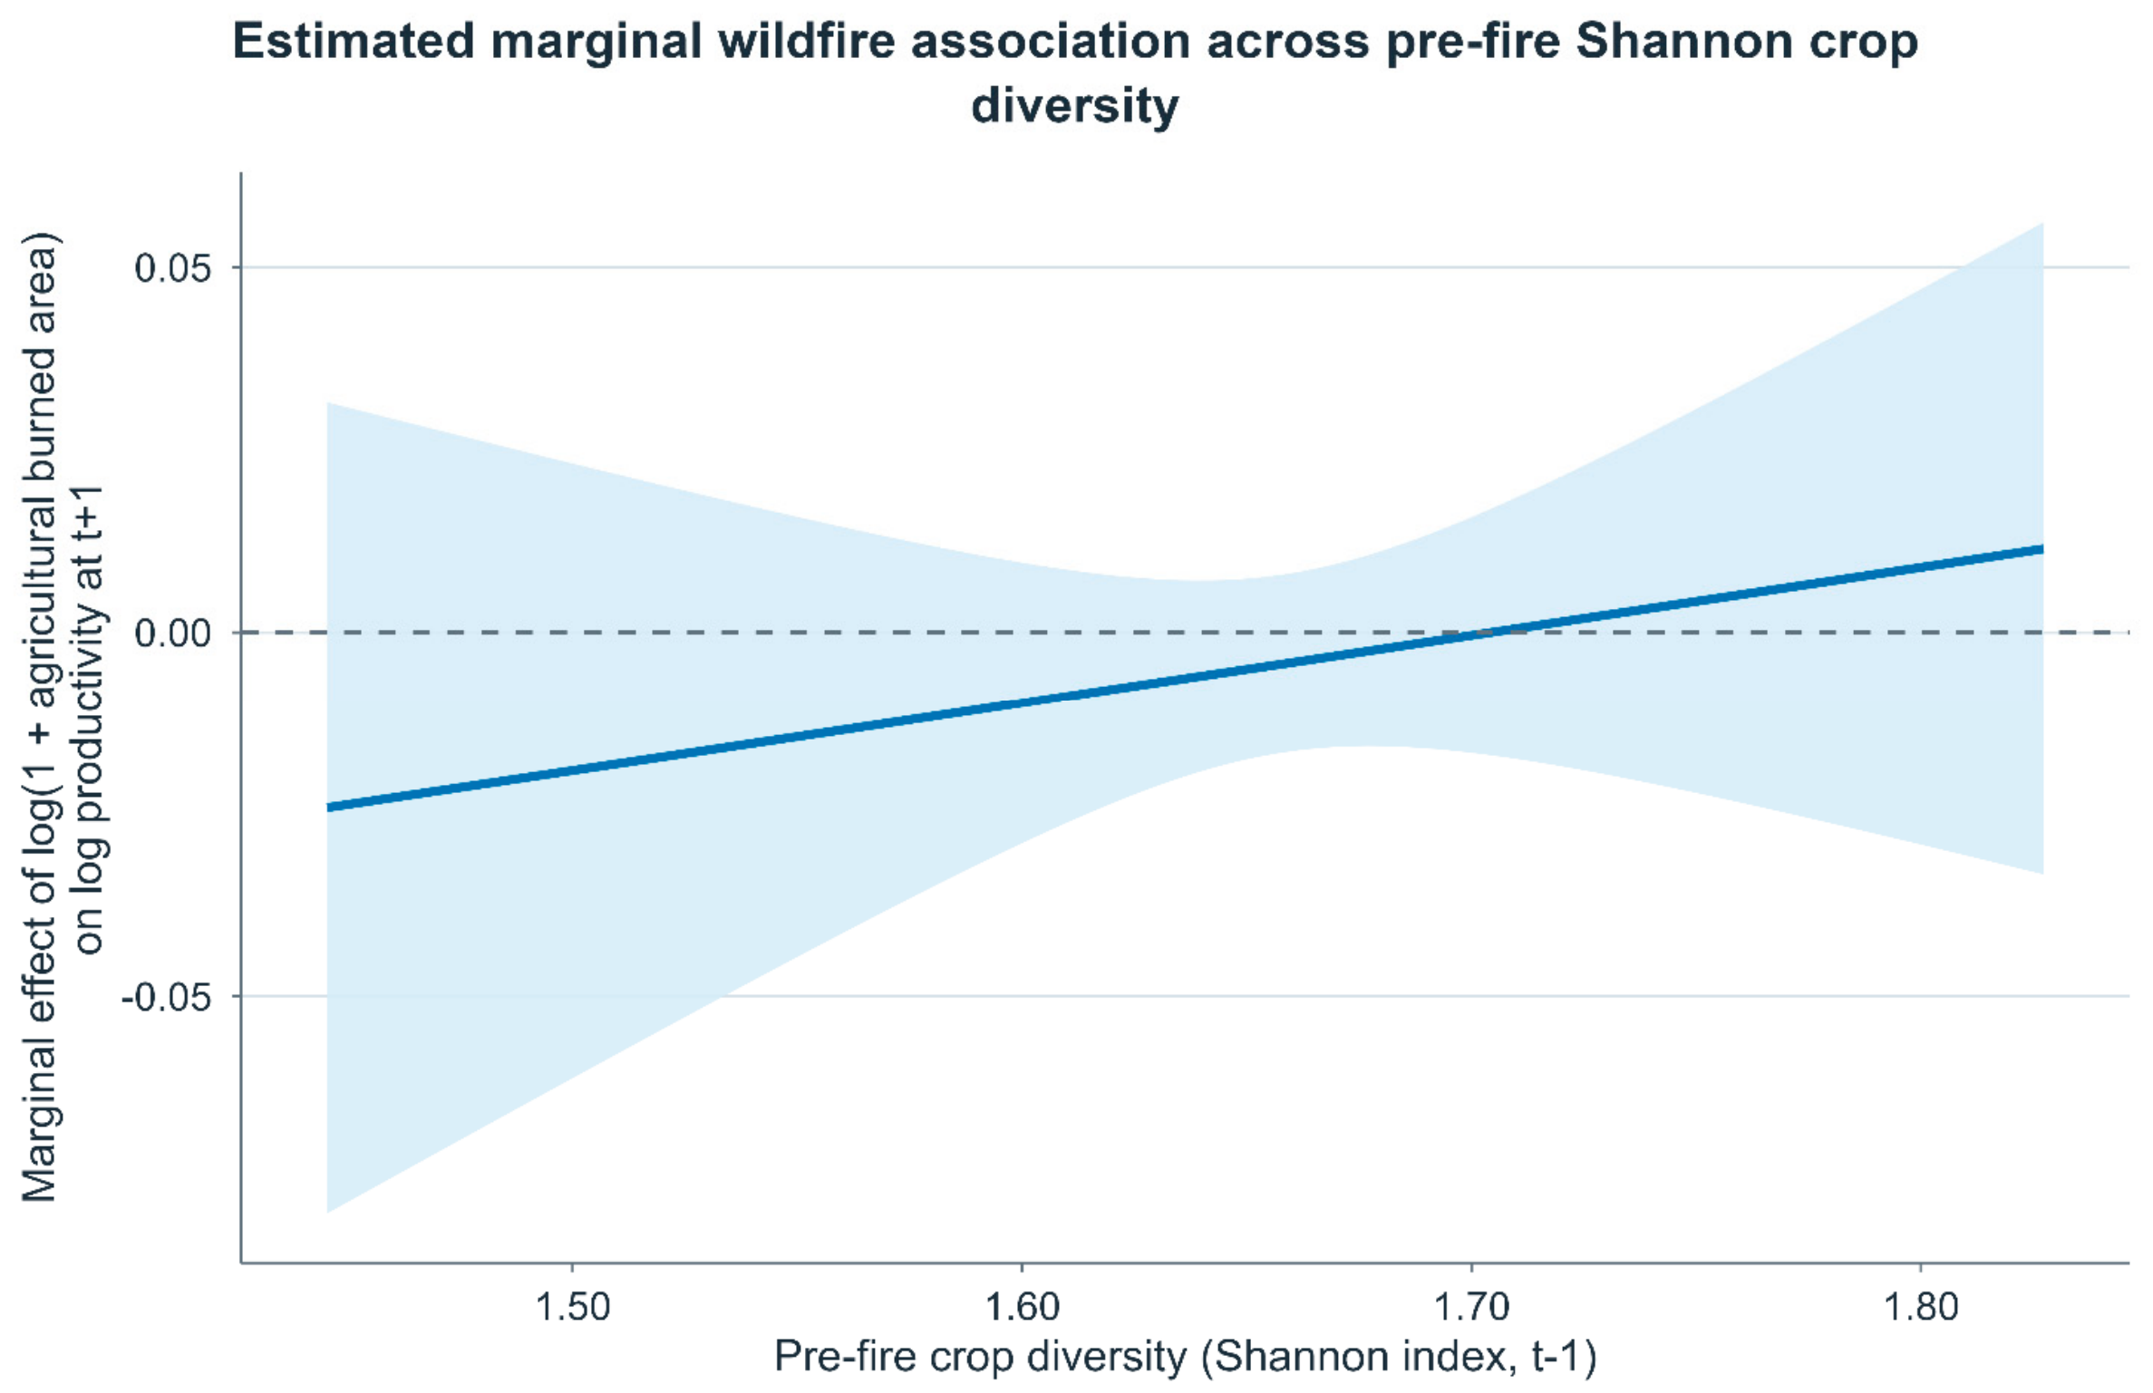
Because the wildfire slope depends on pre-fire diversity in the interaction model, conditional wildfire slopes are evaluated at P25, P50 and P75 of the Region × Year Shannon distribution. None is statistically distinguishable from zero under WCR11 (p = 0.342, 0.729 and 0.869, respectively). For an interquartile increase in ln(1 + agricultural burned area), fitted crop-productivity contrasts range from −3.68% at P25 diversity to +0.36% at P75 diversity; all conventional CR1 t(6) confidence intervals include zero (see Table 4 for CR1 contrasts and Table S6 for WCR11 slope tests). Figure 4 presents the conditional slope across the central P10–P90 of observed diversity and should not be interpreted as identifying a threshold at which wildfire becomes beneficial.
Table 4.
Conditional wildfire slopes and crop-productivity contrasts at observed Shannon quartiles.
Figure 4.
Estimated marginal wildfire association across the central P10–P90 of observed Region × Year Shannon crop diversity (approximately 1.4454–1.8273). The line is the model-implied wildfire slope; the shaded band is an asymptotic cluster-t uncertainty band shown for visualisation only. Preferred WCR11 tests at P25, P50, and P75 of diversity are reported in Table S6. The authors created this figure using R and the ggplot2 package in RStudio (version 2026.07.0).
The uncertainty band crosses zero throughout the displayed range; the graph identifies no statistically supported threshold of beneficial wildfire exposure. Its cluster-t interval is descriptive, not the preferred WCR11 inference. Figure S1 complements Table 4 by displaying the implied interquartile productivity contrasts at the three selected diversity quantiles.
4.3. Persistence and H4
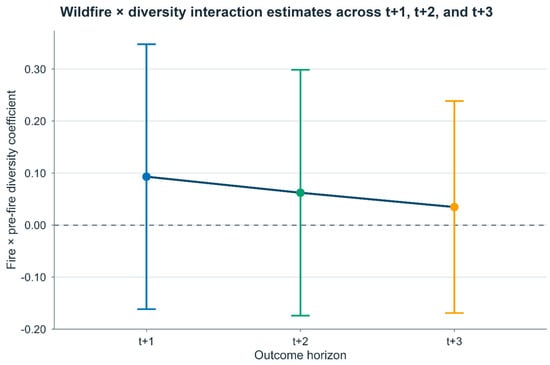
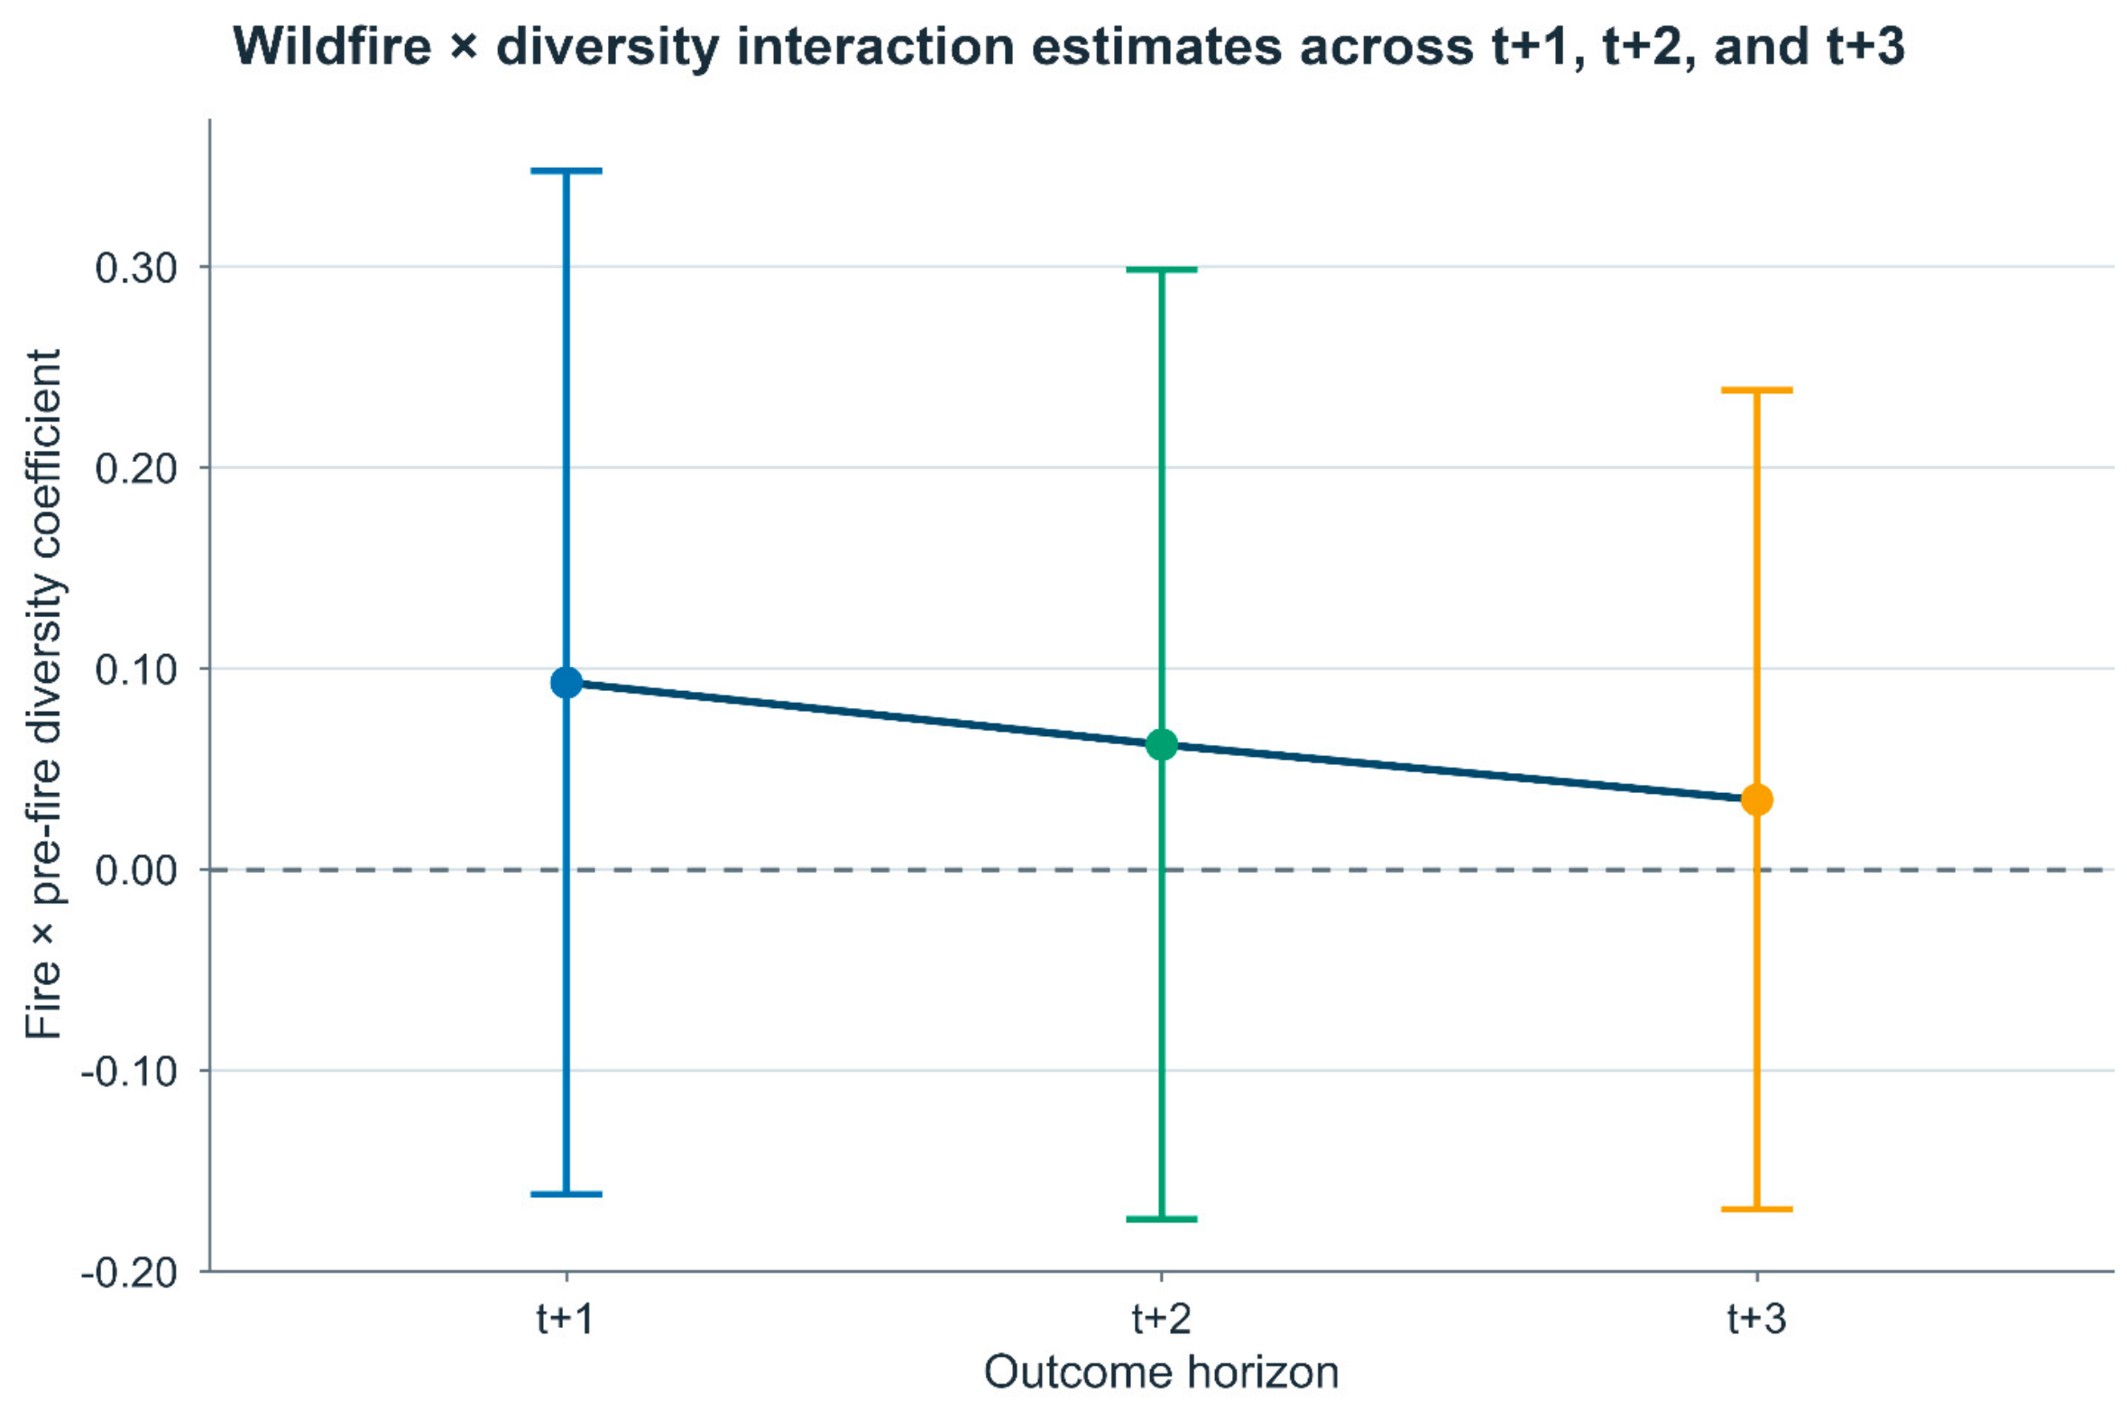
Using the H4 definition in Section 2 and the decision rule in Section 3.4, persistence requires a positive, statistically supported interaction at both t + 1 and t + 2; t + 3 is supplementary. The horizon-specific interaction declines from 0.0931 at t + 1 to 0.0623 at t + 2 and 0.0348 at t + 3, with preferred WCR11 p-values of 0.491, 0.699, and 0.778, respectively, so H4 is not supported. The horizon-specific sample contracts from N = 972 at t + 1 to 898 at t + 2 and 824 at t + 3. To separate horizon differences from changing sample composition, all three models are re-estimated on the common set of rows with t + 1, t + 2, and t + 3 outcomes. In that fixed sample, the interactions remain small and unsupported: 0.0007 at t + 1 (p = 0.995), 0.0327 at t + 2 (p = 0.804), and 0.0332 at t + 3 (p = 0.803; see Table S8). The observed horizon sequence therefore does not provide evidence of a persistent buffering effect (see Table 5 below).
Table 5.
Persistence of the wildfire × diversity interaction.
The confidence intervals include both interaction signs at every horizon. The common-sample comparison in Table S8 assesses whether varying outcome availability explains the observed differences. Figure 5 plots the horizon-specific estimates on a common scale; Figure S2 isolates the corresponding common-sample comparison (818 observations across 77 region–year cells).
Figure 5.
Wildfire × diversity interaction estimates across t + 1, t + 2, and t + 3. The points show the horizon-specific interaction estimates; the plotted intervals are cluster-t 95% intervals for visualisation, while preferred WCR11 inference is reported in Table 5. The fixed common-horizon comparison is shown in Figure S2. The authors created this figure using R and the ggplot2 package in RStudio (version 2026.07.0).
The overlap of all intervals with zero is consistent with the absence of statistically supported persistence, not proof that longer-run moderation is zero.
4.4. Robustness, Influence, Placebo, and Design Sensitivity
No alternative robustness specification provides WCR11 support for H3. The largest positive alternative point estimate occurs for fire count (0.3893; p = 0.134), but its uncertainty interval is wide. HHI produces a negative interaction (−0.1718; p = 0.638), the direction consistent with a buffering interpretation because higher HHI denotes greater concentration, but it is also unsupported. Effective crop diversity, agricultural burned area in levels, normalised exposure, the stable-panel restriction, omission of the crop-area control, pre-fire crop-area weighting, and the alternative nine-group Shannon specification likewise fail to meet the confirmatory criterion.
Adding region-specific linear time trends changes the wildfire × Shannon coefficient from +0.0931 to −0.0410 (N = 972; region-clustered CR1 SE = 0.0822; p = 0.636; see Table S9 and Figure S3). The trend-adjusted estimate is also imprecise. This change illustrates the sensitivity of the interaction to heterogeneous regional trajectories without accounting fully for discrete region-year environmental shocks.
The full nine-region model is interpreted strictly as a sample-sensitivity check because the island fire-exposure entries are constant zero and their data coverage cannot be independently authenticated; this changes sample composition and the estimand, not merely statistical precision; its interaction changes sign to −0.0284. The productivity-change outcome also yields a negative interaction (−0.0431). Across these specifications, signs and magnitudes vary and intervals remain wide, so no consistent positive moderation pattern emerges (see Table 6 below).
Table 6.
Robustness summary for the interaction term.
Two exclusions assess sensitivity to zero-area records with positive reported productivity (see Table S3). Removing four affected baseline observations gives an interaction estimate of +0.0925 (N = 968); excluding the Algarve × main-industrial-crop combination gives +0.0918 (N = 966), compared with +0.0931 in the primary model. These estimates use conventional region-clustered CR1 inference and are not additional WCR11 tests. Their similarity does not eliminate the possibility of measurement error.
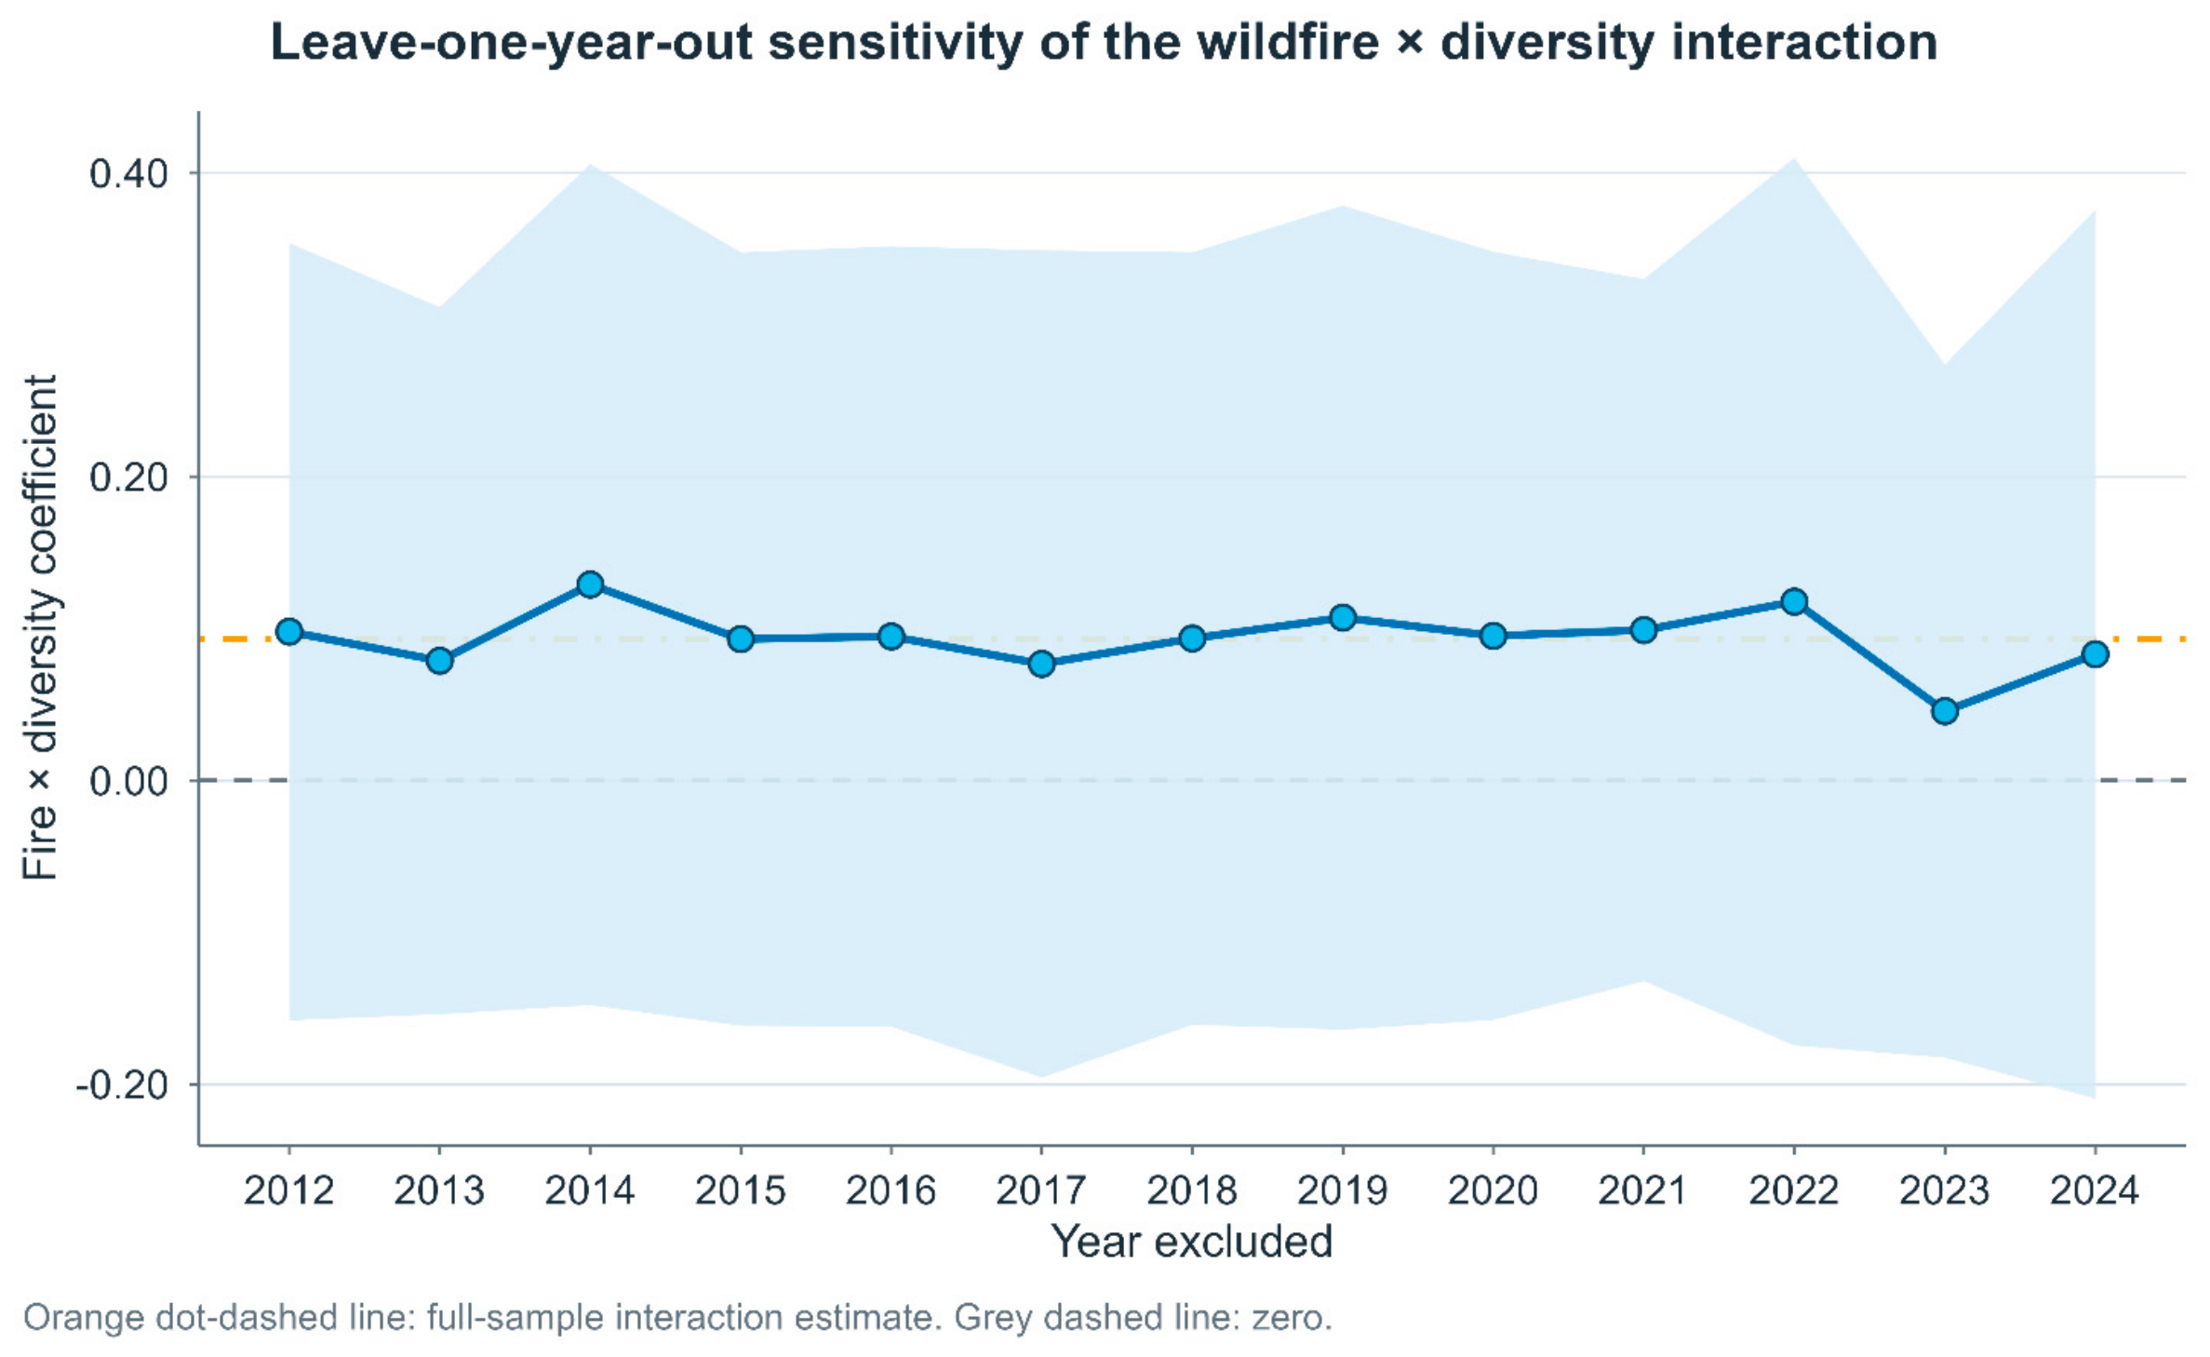
Influence diagnostics do not identify a single region or year that generates the baseline positive interaction. Leave-one-region-out estimates range from 0.0058 to 0.1745 and leave-one-year-out estimates from 0.0456 to 0.1290; every reported uncertainty interval includes zero (see Table A3 and Table A4; Figure A1 and Figure A2). The pre-fire placebo and the complementary small-sample diagnostic are shown in Table A5. The independent CR2-Satterthwaite diagnostic is consistent with the main inference (interaction p = 0.502; see Table A5).
The positive pre-fire placebo interaction (β = 0.1311; WCR11 p = 0.438) resembles the direction of the post-exposure association, even though the placebo outcome precedes the fire exposure. Persistent regional conditions, crop composition or underlying productivity trajectories may therefore contribute to the observed pattern. A nonsignificant placebo cannot rule out these explanations, particularly with seven clusters and limited statistical power. The placebo should be interpreted as a timing diagnostic, not evidence validating a wildfire-specific buffering mechanism.
Because both the placebo outcome and Shannon diversity are observed at t − 1, their association may also reflect contemporaneous crop composition. The placebo is therefore not a clean pre-trends test.
Four exploratory extensions—regional productivity weighting, contemporaneous timing, extreme-fire exposure and crop-system heterogeneity—remain unsupported after Holm adjustment (see Table S10; Figures S4 and S5). They do not alter the confirmatory H1–H4 assessments.
The size-calibrated power diagnostic qualifies the absence of statistical support. At the observed H3 estimate (0.0931, approximately 0.895 clustered standard errors), the simulated rejection rate is 14.7%; the smallest tested positive interaction reaching approximately 80% power is 0.3643 (see Table S11; Figure S6). Modest moderation remains difficult to detect, and no equivalence test was conducted. Table S12 provides the plotting values for Figure 4; Figure S7 documents regional diversity trajectories. Accordingly, the findings indicate non-support within this design, not proof that buffering effects are absent.
5. Discussion
The preferred WCR11 tests provide no confirmatory support for H1–H4. The wildfire slope at mean diversity has the hypothesised negative sign, whereas the diversity main effect has the opposite sign from that expected; both are imprecise. The positive baseline interaction likewise remains compatible with adverse as well as buffering associations. Conditional slopes and the common-horizon analysis do not remove that uncertainty. These results concern crop-specific productivity following regional fire exposure, rather than portfolio-level stability. Non-rejection is not an equivalence finding, especially with seven regional clusters [35,40].
The distinction also applies to environmental accounting studies: agricultural greenhouse-gas emission profiles [17] and food-availability-based carbon-pressure proxies [18] characterise different sustainability outcomes from crop-specific productivity. Their findings therefore cannot be used to infer a regional crop-diversity buffering effect after a wildfire.
This interpretation is consistent with the scale distinctions developed in Section 2. Renard and Tilman [5] and Egli et al. [6] are concerned with the stability of aggregate production, where asynchronous crop responses can stabilise a portfolio without reducing each crop’s exposure. Tobajas et al. [10] likewise show that diversity–stability relationships depend on climate and pollinator dependence. Productivity evidence is also conditional: Eder et al. [9] report the buffering of farm labour productivity under reduced rainfall but not under higher temperatures; Raveloaritiana and Wanger [12] find broad long-run benefits without a significant overall crop-yield effect; and Beillouin et al. [7] document positive but heterogeneous effects across diversification strategies. Arndt and Helming [13] further distinguish field-, farm-, and landscape-level diversification. The regional Shannon index used here should therefore be interpreted as a regional crop-portfolio composition, not as a proxy for within-field mixtures, rotations, or landscape configuration. Consequently, a statistically unsupported crop-specific interaction does not contradict the portfolio-level stability associations found at wider scales [5,6,7,12].
The exposure measure imposes a second interpretive boundary. The empirical wildfire-exposure variable is the regional agricultural burned area derived from rural-fire records, not crop-specific physical overlap, severity, smoke, or hydrological disturbance. Fire occurrence in Mediterranean landscapes varies with drought, land cover, season, and management [2], while southern European fire regimes reflect interactions among the weather, fuels, land cover, and landscape configuration [1]. Broader evidence links fire severity to soil–water and erosion processes [3,15] and smoke to delayed productivity effects in perennial crops [4]. Because the data do not contain region-specific weather and drought controls or crop-level fire overlap, the estimated coefficients remain conditional within-panel associations. This limitation is substantive rather than merely statistical: heterogeneous mechanisms can be averaged within the Region × Year exposure measure.
More particularly, neither the wildfire association nor the interaction has a guaranteed direction of confounding bias: drought can raise fire risks and lower productivity, while regional irrigation, phenological calendars, crop specialisation and land management may jointly modify the observed diversity and yield. Spatial mismatch further attenuates biological interpretability: a larger recorded regional agricultural burned area need not correspond to greater physical damage to the specific crop group. Thus, it would be inappropriate to construe a positive but imprecise interaction as an identified buffering mechanism.
The robustness exercises sharpen rather than resolve this uncertainty. Alternative exposure and diversity definitions, weighting, sample restrictions, influence diagnostics, the pre-fire placebo, and alternative covariance estimators do not provide confirmatory support for the interaction. Its sign reversal under region-specific linear trends indicates a sensitivity to heterogeneous regional trajectories. The power diagnostic further shows that modest moderation would be difficult to detect in this design. Together, these checks define the boundaries of the conclusions rather than identify a causal mechanism [35,38,40].
In the exploratory specification with region-specific linear trends, the interaction changes from +0.0931 to −0.0410, without statistical support for moderation under conventional region-clustered CR1 inference. This variation is consistent with potential sensitivity to unobserved regional temporal conditions; it neither establishes bias in the primary coefficient nor identifies a causal alternative.
Future work should move the exposure measure closer to the underlying agronomic mechanisms by linking georeferenced fire perimeters and severity to crop maps and farm- or parcel-level productivity, while incorporating drought, weather, soil moisture, irrigation, phenology, smoke, and harvest timing. Longer panels and more independent spatial clusters would improve precision, and stronger causal claims would require plausibly exogenous variation or a defensible quasi-experimental design. These methodological priorities follow directly from the identification limits in Section 3 and the uncertainty documented in Section 4.
Accordingly, the discussion supports a proportionate policy interpretation rather than a binary judgement on diversification. The present evidence does not justify treating regional crop diversity as a stand-alone wildfire-specific productivity buffer, while it remains compatible with broader diversification benefits documented for other outcomes and scales.
6. Conclusions
This study evaluated whether pre-fire regional crop diversity moderates the relationship between agricultural burned area and subsequent crop-specific productivity in seven Portuguese agricultural regions. The preferred WCR11 tests do not support H1–H4. The wildfire slope at mean diversity and the wildfire × diversity interaction have their hypothesised signs, but both are imprecisely estimated; the diversity main effect is also unsupported. The interaction remains unsupported at t + 2 and t + 3. These findings do not establish a persistent regional buffering relationship, but their uncertainty does not demonstrate a zero population effect.
The practical magnitude is likewise uncertain: interquartile increases in the regional log fire-exposure proxy imply point-estimate productivity contrasts from −3.68% at the lower Shannon quartile to +0.36% at the upper quartile; each diagnostic confidence interval crosses zero. These quantities concern associations in regional exposure proxies, not measured crop-level fire losses. The estimates lack sufficient precision to rule out modest buffering or adverse moderation effects.
The study adds a scale-specific test of regional crop-portfolio diversity against crop-specific productivity outcomes, which should not be conflated with the stability of aggregate production. The principal limitations are the seven regional clusters, the regional burned-area proxy rather than crop-level fire damage, incomplete crop-group coverage, and the absence of consistent environmental and agronomic controls. Accordingly, the estimates describe conditional within-panel associations and remain sensitive to model specification.
The policy implication is correspondingly narrow: regional crop diversity should not be treated as an empirically established, stand-alone protection against wildfire-related productivity losses in individual crop groups. This result does not invalidate diversification as a broader strategy for production stability, biodiversity, or agricultural sustainability. The effects of specific wildfire-risk interventions were not estimated and require separate evidence.
Future research should connect mapped wildfire perimeters and severity with crop- or parcel-level productivity, accounting for drought, temperature, irrigation, smoke, phenology, and harvest timing. Longer panels and more independent spatial units could improve precision, distinguish competing mechanisms, and support stronger causal identification strategies.
Supplementary Materials
The following supporting information can be downloaded at https://www.mdpi.com/article/10.3390/agriculture16222467/s1. The accompanying file includes Tables S1–S12 on source indicators, excluded variables, correlations, robustness, small-cluster inference, dynamic samples, power, regional trends and crop-area sensitivities and Figures S1–S7 on conditional productivity contrasts, sample-comparable persistence, regional-trend sensitivity, exploratory timing and crop-system differences, simulated power and regional diversity trajectories [19,20,21,22,23,42,43,44,45,46].
Author Contributions
Conceptualisation, M.K.; methodology, M.K.; validation, M.K.; formal analysis, M.K.; investigation, M.K., F.K., M.C.D.L. and J.A.F.; data curation, M.K.; writing—original draft preparation, M.K.; visualisation, M.K.; supervision, M.K. All authors have read and agreed to the published version of the manuscript.
Funding
This research was funded by national funds through FCT—Fundação para a Ciência e a Tecnologia, I.P.—under the strategic funding of the University of Coimbra Institute for Legal Research (UCILeR), project UIDB/04643/2025 (https://doi.org/10.54499/UID/04643/2025), and the Centre for Business and Economics Research (CeBER), project UIDB/05037/2025 (https://doi.org/10.54499/UIDB/05037/2020).
Institutional Review Board Statement
Not applicable. This study used aggregate secondary data and did not involve human participants or animals.
Informed Consent Statement
Not applicable. This study did not involve human participants.
Data Availability Statement
Publicly available datasets were analysed in this study. Statistics Portugal (INE) data are available from the INE database: crop area (indicator 0000019); crop productivity (indicator 0000023); rural-fire count (indicator 0013509); and rural-fire burned area (indicator 0013510) (all accessed on 25 August 2026). The processed dataset supporting the findings of this study is available from the corresponding author upon reasonable request.
Acknowledgments
During the preparation of this manuscript, the authors used Grammarly for language and grammatical editing and ChatGPT (GPT-6, High Thinking Effort; OpenAI, 2026) for language and structural editorial support and for Figure 1 design and visual refinement. The authors reviewed and edited all AI-assisted content and take full responsibility for the content of this publication.
Conflicts of Interest
The authors declare no conflicts of interest.
Appendix A
Table A1.
Crop coverage and inclusion in the primary diversity index.
Table A2.
Regional variation in agricultural burned area.
Table A3.
Leave-one-region-out interaction estimates.
Table A4.
Leave-one-year-out interaction estimates.
Table A5.
Placebo and CR2-Satterthwaite few-cluster diagnostics.
Figure A1.
Leave-one-region-out sensitivity of the wildfire × diversity interaction. Each point corresponds to the baseline t + 1 interaction re-estimated after omitting one identifying agricultural region. Numerical estimates and cluster-based uncertainty are reported in Table A3. The authors created this figure using R and the ggplot2 package in RStudio (version 2026.07.0).
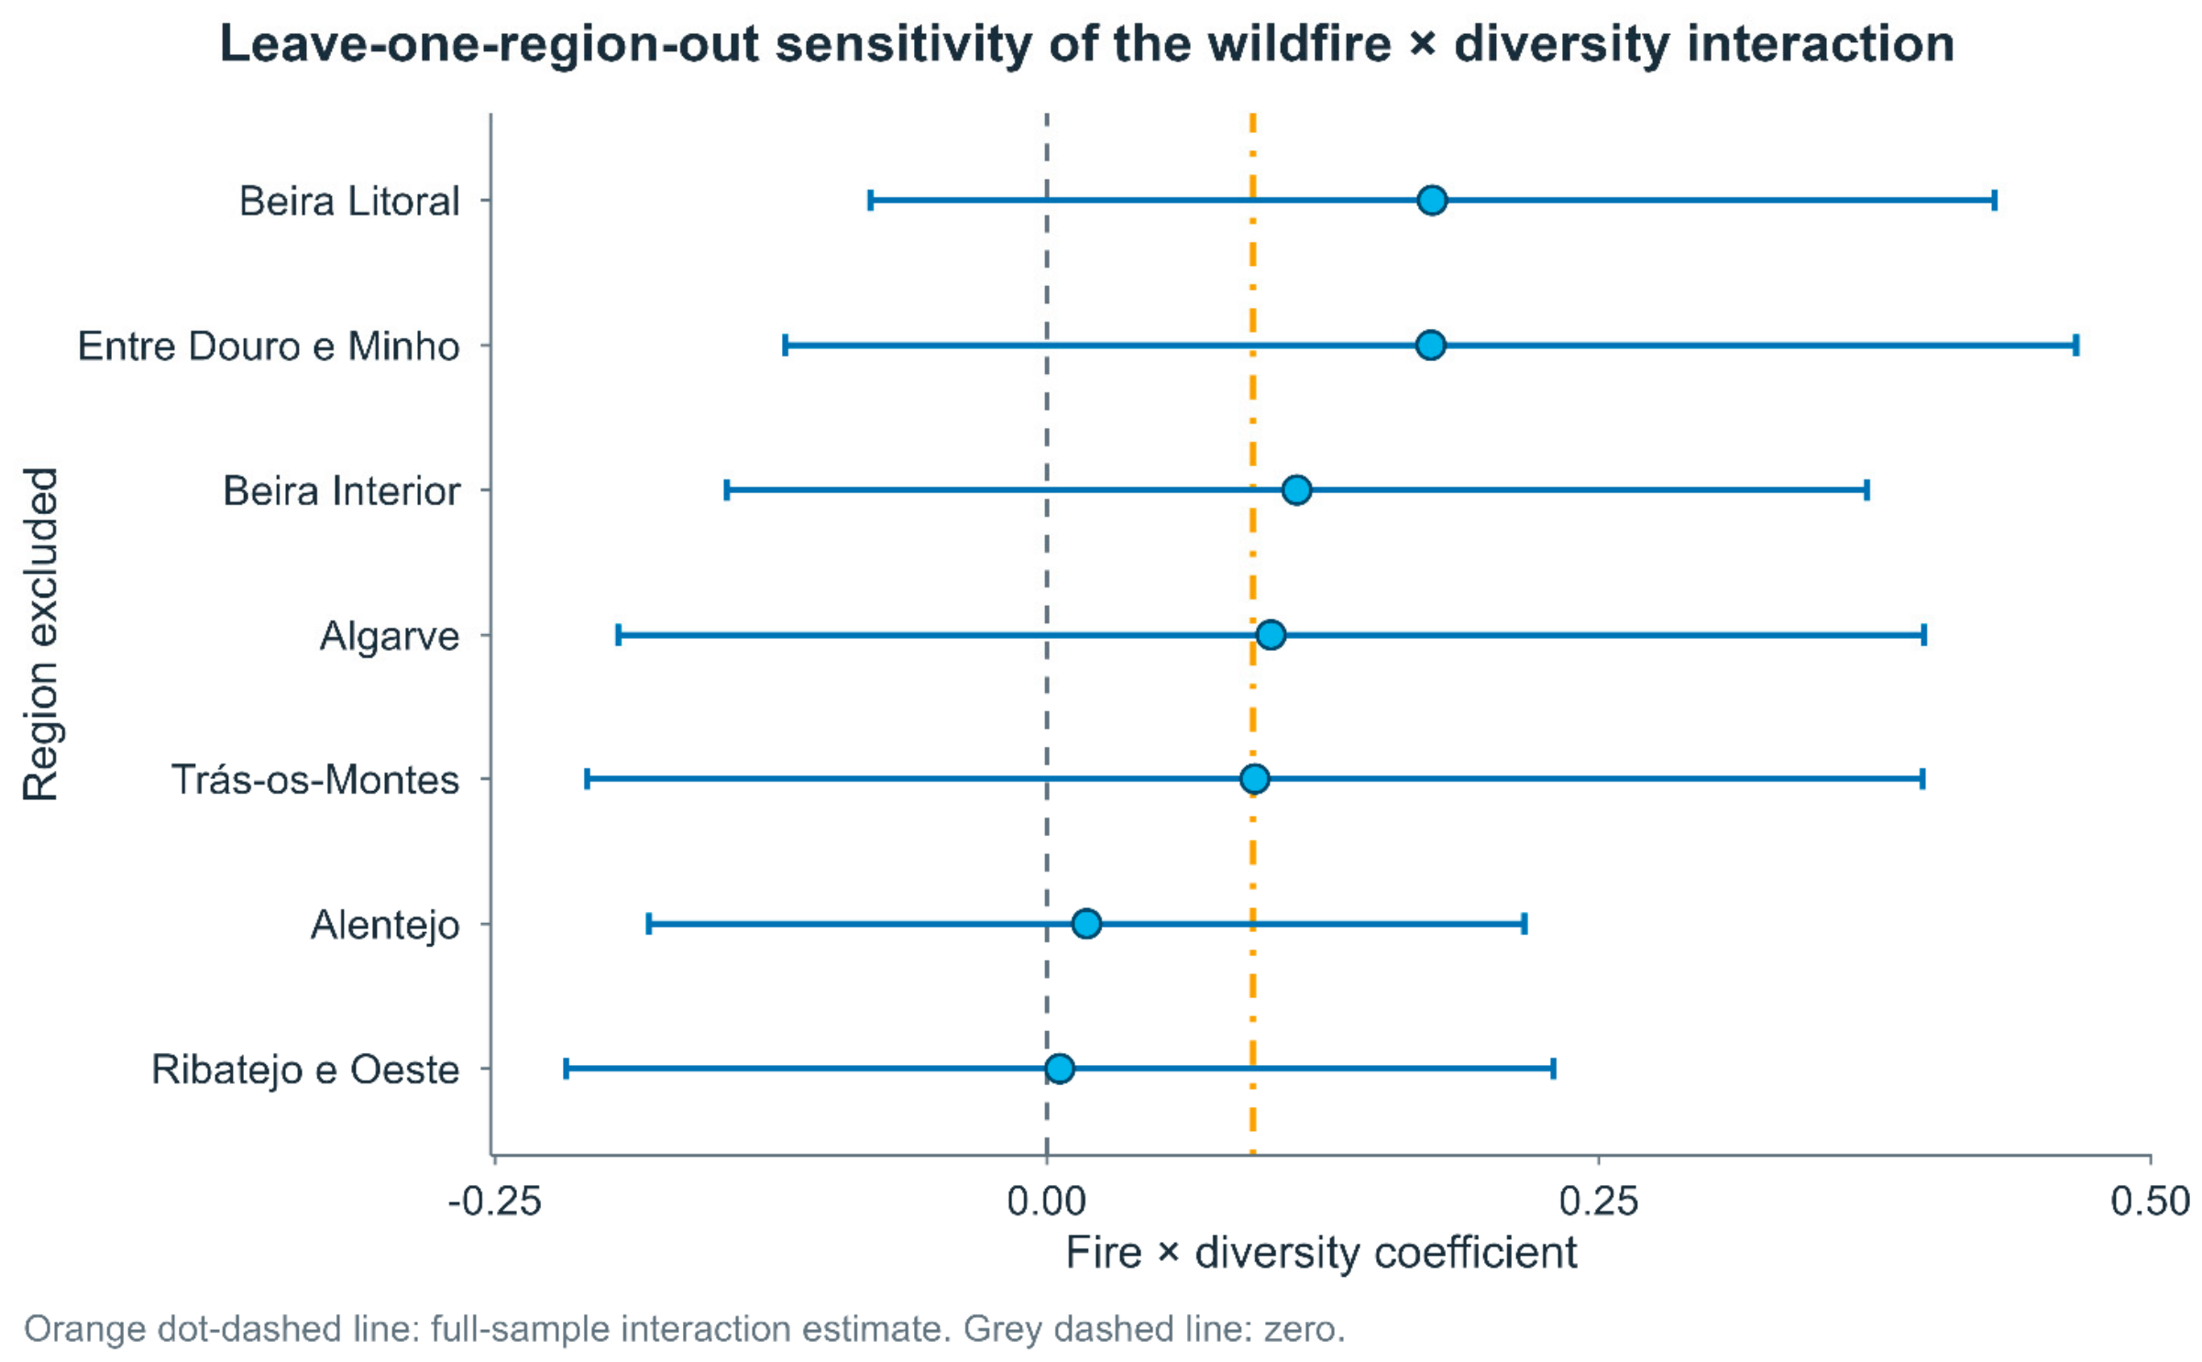
Figure A2.
Leave-one-year-out sensitivity of the wildfire × diversity interaction. Each point corresponds to the baseline t + 1 interaction re-estimated after omitting one exposure year. Numerical estimates and cluster-based uncertainty are reported in Table A4. The authors created this figure using R and the ggplot2 package in RStudio (version 2026.07.0).
References
- Moreira, F.; Viedma, O.; Arianoutsou, M.; Curt, T.; Koutsias, N.; Rigolot, E.; Barbati, A.; Corona, P.; Vaz, P.; Xanthopoulos, G.; et al. Landscape–wildfire interactions in southern Europe: Implications for landscape management. J. Environ. Manag. 2011, 92, 2389–2402. [Google Scholar] [CrossRef] [Scilit] [PubMed]
- Kirkland, M.; Atkinson, P.W.; Aliácar, S.; Saavedra, D.; De Jong, M.C.; Dowling, T.P.F.; Ashton-Butt, A. Protected areas, drought, and grazing regimes influence fire occurrence in a fire-prone Mediterranean region. Fire Ecol. 2024, 20, 88. [Google Scholar] [CrossRef] [Scilit]
- Baur, M.J.; Friend, A.D.; Pellegrini, A.F.A. Widespread and systematic effects of fire on plant–soil water relations. Nat. Geosci. 2024, 17, 1115–1120. [Google Scholar] [CrossRef] [Scilit]
- Orozco, J.; Guzmán-Delgado, P.; Zwieniecki, M.A. Megafire smoke exposure jeopardizes tree carbohydrate reserves and yield. Nat. Plants 2024, 10, 1635–1642. [Google Scholar] [CrossRef] [Scilit] [PubMed]
- Renard, D.; Tilman, D. National food production stabilized by crop diversity. Nature 2019, 571, 257–260. [Google Scholar] [CrossRef] [Scilit] [PubMed]
- Egli, L.; Schröter, M.; Scherber, C.; Tscharntke, T.; Seppelt, R. Crop diversity effects on temporal agricultural production stability across European regions. Reg. Environ. Change 2021, 21, 96. [Google Scholar] [CrossRef] [Scilit]
- Beillouin, D.; Ben-Ari, T.; Malézieux, E.; Seufert, V.; Makowski, D. Positive but variable effects of crop diversification on biodiversity and ecosystem services. Glob. Change Biol. 2021, 27, 4697–4710. [Google Scholar] [CrossRef] [Scilit] [PubMed]
- Costa, A.; Bommarco, R.; Smith, M.E.; Bowles, T.; Gaudin, A.C.M.; Watson, C.A.; Alarcón, R.; Berti, A.; Blecharczyk, A.; Calderon, F.J.; et al. Crop rotational diversity can mitigate climate-induced grain yield losses. Glob. Change Biol. 2024, 30, e17298. [Google Scholar] [CrossRef] [Scilit] [PubMed]
- Eder, A.; Salhofer, K.; Quddoos, A. The impact of cereal crop diversification on farm labor productivity under changing climatic conditions. Ecol. Econ. 2024, 223, 108241. [Google Scholar] [CrossRef] [Scilit]
- Tobajas, E.; Bartomeus, I.; Magrach, A. Landscape and crop diversity contributes to greater yield stability. J. Appl. Ecol. 2025, 62, 3092–3104. [Google Scholar] [CrossRef] [Scilit]
- Bareille, F.; Largier, B. A meta-analysis on the productive value of crop biodiversity. Am. J. Agric. Econ. 2026, 1–33. [Google Scholar] [CrossRef] [Scilit]
- Raveloaritiana, E.; Wanger, T.C. Long-term agricultural diversification increases financial profitability, biodiversity, and ecosystem services: A second-order meta-analysis. Nat. Commun. 2026, 17, 1016. [Google Scholar] [CrossRef] [Scilit] [PubMed]
- Arndt, M.; Helming, K. Agricultural diversification across spatial levels—A contribution to resilience and sustainability? Agric. Ecosyst. Environ. 2025, 385, 109547. [Google Scholar] [CrossRef] [Scilit]
- Li, C.-Z.; Engström, G. Crop diversity, organic farming, and agricultural productivity: Evidence from European regions. J. Geogr. Syst. 2026. [Google Scholar] [CrossRef] [Scilit]
- Antoneli, V.; Thomaz, E.L. Effect of fire severity on hydro-erosive processes and black bean (Phaseolus vulgaris L.) productivity under slash-and-burn agriculture. Agric. Ecosyst. Environ. 2025, 381, 109454. [Google Scholar] [CrossRef] [Scilit]
- Sil, Â.; Azevedo, J.C.; Fernandes, P.M.; Honrado, J.P. Will fire-smart landscape management buffer the effects of climate and land-use changes on fire regimes? Ecol. Process. 2024, 13, 57. [Google Scholar] [CrossRef] [Scilit]
- Koengkan, M. Diverging Agricultural Greenhouse Gas Emissions and Partial Convergence of Source Structures Across the EU-27 and Mercosur-4. Gases 2026, 6, 51. [Google Scholar] [CrossRef] [Scilit]
- Koengkan, M.; Fuinhas, J.A.; Georgescu, I.; Domingos, H.; Khan, F. Mediterranean Dietary Transition and a Weighted Food-Related Carbon-Pressure Proxy in Portugal: Evidence from Dynamic Time-Series Analysis. Sustainability 2026, 18, 8711. [Google Scholar] [CrossRef] [Scilit]
- Instituto Nacional de Estatística (INE). Surface of Crop Groups by Agricultural Region, Crop and Year [Data Set; Indicator 0000019]. INE Database. 2026. Available online: https://www.ine.pt/xportal/xmain?xpid=INE&xpgid=ine_indicadores&indOcorrCod=0000019&contexto=bd&selTab=tab2 (accessed on 25 August 2026).
- Instituto Nacional de Estatística (INE). Agricultural Productivity by Agricultural Region, Crop and Year [Data Set; Indicator 0000023]. INE Database. 2026. Available online: https://www.ine.pt/xportal/xmain?xpid=INE&xpgid=ine_indicadores&indOcorrCod=0000023&contexto=bd&selTab=tab2 (accessed on 25 August 2026).
- Instituto Nacional de Estatística (INE). Number of Rural Fires by Municipality and Year [Data Set; Indicator 0013509]. INE Database. 2026. Available online: https://www.ine.pt/xportal/xmain?xpid=INE&xpgid=ine_indicadores&indOcorrCod=0013509&contexto=bd&selTab=tab2 (accessed on 25 August 2026).
- Instituto Nacional de Estatística (INE). Rural-Fire Burned Area by Municipality, Land-Cover Class and Year [Data Set; Indicator 0013510]. INE Database. 2026. Available online: https://www.ine.pt/xurl/indx/0013510/PT (accessed on 25 August 2026).
- Portugal. Decreto-Lei N.º 46/89, de 15 de Fevereiro: Estabelece as Matrizes de Delimitação Geográfica da Nomenclatura de Unidades Territoriais para Fins Estatísticos (NUTS). Diário da República, N.º 38/1989, Série I. Available online: https://diariodarepublica.pt/dr/legislacao-consolidada/decreto-lei/1989-162168229 (accessed on 9 October 2026).
- Chen, J.; Roth, J. Logs with zeros? Some problems and solutions. Q. J. Econ. 2024, 139, 891–936. [Google Scholar] [CrossRef] [Scilit]
- Shannon, C.E. A mathematical theory of communication. Bell Syst. Tech. J. 1948, 27, 379–423, 623–656. [Google Scholar] [CrossRef] [Scilit]
- Rosenbaum, P.R. The consequences of adjustment for a concomitant variable that has been affected by the treatment. J. R. Stat. Soc. Ser. A 1984, 147, 656–666. [Google Scholar] [CrossRef] [Scilit]
- Schisterman, E.F.; Cole, S.R.; Platt, R.W. Overadjustment bias and unnecessary adjustment in epidemiologic studies. Epidemiology 2009, 20, 488–495. [Google Scholar] [CrossRef] [Scilit] [PubMed]
- VanderWeele, T.J. Principles of confounder selection. Eur. J. Epidemiol. 2019, 34, 211–219. [Google Scholar] [CrossRef] [Scilit] [PubMed]
- Berry, W.D.; Golder, M.; Milton, D. Improving tests of theories positing interaction. J. Politics 2012, 74, 653–671. [Google Scholar] [CrossRef] [Scilit]
- Brambor, T.; Clark, W.R.; Golder, M. Understanding interaction models: Improving empirical analyses. Political Anal. 2006, 14, 63–82. [Google Scholar] [CrossRef] [Scilit]
- Baltagi, B.H. Econometric Analysis of Panel Data, 6th ed.; Springer: Cham, Switzerland, 2021. [Google Scholar] [CrossRef] [Scilit]
- Wooldridge, J.M. Two-way fixed effects, the two-way Mundlak regression, and difference-in-differences estimators. Empir. Econ. 2025, 69, 2545–2587. [Google Scholar] [CrossRef] [Scilit]
- Roodman, D. A note on the theme of too many instruments. Oxf. Bull. Econ. Stat. 2009, 71, 135–158. [Google Scholar] [CrossRef] [Scilit]
- Moulton, B.R. An illustration of a pitfall in estimating the effects of aggregate variables on micro units. Rev. Econ. Stat. 1990, 72, 334–338. [Google Scholar] [CrossRef] [Scilit]
- Cameron, A.C.; Gelbach, J.B.; Miller, D.L. Bootstrap-based improvements for inference with clustered errors. Rev. Econ. Stat. 2008, 90, 414–427. [Google Scholar] [CrossRef] [Scilit]
- Webb, M.D. Reworking wild bootstrap-based inference for clustered errors. Can. J. Econ./Rev. Can. d’Economique 2023, 56, 839–858. [Google Scholar] [CrossRef] [Scilit]
- MacKinnon, J.G.; Nielsen, M.Ø.; Webb, M.D. Cluster-robust inference: A guide to empirical practice. J. Econom. 2023, 232, 272–299. [Google Scholar] [CrossRef] [Scilit]
- Roodman, D.; MacKinnon, J.G.; Nielsen, M.Ø.; Webb, M.D. Fast and wild: Bootstrap inference in Stata using boottest. Stata J. 2019, 19, 4–60. [Google Scholar] [CrossRef] [Scilit]
- Cameron, A.C.; Miller, D.L. A practitioner’s guide to cluster-robust inference. J. Hum. Resour. 2015, 50, 317–372. [Google Scholar] [CrossRef] [Scilit]
- Imbens, G.W.; Kolesár, M. Robust standard errors in small samples: Some practical advice. Rev. Econ. Stat. 2016, 98, 701–712. [Google Scholar] [CrossRef] [Scilit]
- Driscoll, J.C.; Kraay, A.C. Consistent covariance matrix estimation with spatially dependent panel data. Rev. Econ. Stat. 1998, 80, 549–560. [Google Scholar] [CrossRef] [Scilit]
- Instituto Nacional de Estatística (INE). Proportion of Burned Surface by Geographic Location and Year [Data Set; Indicator 0013538]. INE Database. 2026. Available online: https://www.ine.pt/xportal/xmain?xpid=INE&xpgid=ine_indicadores&indOcorrCod=0013538&contexto=bd&selTab=tab2 (accessed on 25 August 2026).
- Instituto Nacional de Estatística (INE). Gross Fixed Capital Formation of Enterprises by Geographic Location and Year [Data Set; Indicator 0008486]. INE Database. 2026. Available online: https://www.ine.pt/xportal/xmain?xpid=INE&xpgid=ine_indicadores&indOcorrCod=0008486&contexto=bd&selTab=tab2 (accessed on 25 August 2026).
- Instituto Nacional de Estatística (INE). Gross Value Added at Current Prices by A21 Branch and Geographic Location [Data Set; Indicator 0014115]. INE Database. 2026. Available online: https://www.ine.pt/xportal/xmain?xpid=INE&xpgid=ine_indicadores&indOcorrCod=0014115&contexto=bd&selTab=tab2 (accessed on 25 August 2026).
- Instituto Nacional de Estatística (INE). Population Density (Census) by Geographic Location [Data Set; Indicator 0014356]. INE Database. 2026. Available online: https://www.ine.pt/xportal/xmain?xpid=INE&xpgid=ine_indicadores&indOcorrCod=0014356&contexto=bd&selTab=tab2 (accessed on 25 August 2026).
- Instituto Nacional de Estatística (INE). Ageing Index by Geographic Location and Year [Data Set; Indicator 0004165]. INE Database. 2026. Available online: https://www.ine.pt/xportal/xmain?xpid=INE&xpgid=ine_indicadores&indOcorrCod=0004165&contexto=bd&selTab=tab2 (accessed on 25 August 2026).

Disclaimer/Publisher’s Note: The statements, opinions and data contained in all publications are solely those of the individual author(s) and contributor(s) and not of MDPI and/or the editor(s). MDPI and/or the editor(s) disclaim responsibility for any injury to people or property resulting from any ideas, methods, instructions or products referred to in the content. |
© 2026 by the authors. Licensee MDPI, Basel, Switzerland. This article is an open access article distributed under the terms and conditions of the Creative Commons Attribution (CC BY) license.