


Abstract
External wind can increase greenhouse heat loss by enhancing airflow over the covering surface. This study investigated the local thermal response of a greenhouse envelope and the airflow around an adjacent field-installed, rigid, non-porous vertical photovoltaic (PV) windbreak using winter heat-flux measurements and three-dimensional computational fluid dynamics (CFD). Field measurements showed a strongly position-dependent thermal response: during the selected nighttime intervals on 13 February, mean heat flux was −7.9 W/m2 at the reference location and ranged from −0.6 to −9.9 W/m2 at windbreak-influenced locations. CFD was used as an exploratory tool to identify airflow structures around the greenhouse–windbreak configuration under prescribed conditions. The simulations showed coexisting sheltered flow, recirculation, edge bypass, and upper-level acceleration. Under side inflow, the line-averaged velocity along the windbreak-facing sidewall decreased by 67.5%, while increasing wall height reduced upper-level velocity by approximately 95%. Additional simulations indicated that wall closure mainly limited bypass flow, whereas increased height displaced the upper high-velocity shear layer. These results show that wall continuity and height act as complementary design parameters. The findings identify wall continuity and height as factors to consider when assessing vertical PV structures for combined wind shielding and electricity generation beside greenhouses.
1. Introduction
Greenhouse cultivation enables year-round crop production by providing a controlled environment for plant growth; however, maintaining suitable indoor conditions during winter can require substantial heating energy, particularly in cold climates. Reviews of greenhouse energy systems have consistently emphasized the importance of energy-efficient design, thermal management, environmental control, and renewable-energy integration for reducing greenhouse energy demand and improving sustainability [1,2,3,4]. The thermal performance of the greenhouse envelope is particularly important because commonly used transparent or translucent covering systems must simultaneously satisfy thermal-insulation and solar-transmission requirements, and their thermal and optical properties vary considerably with material type and covering configuration [5]. Consequently, reducing heat loss through the greenhouse envelope remains an important requirement for improving the energy efficiency of protected cultivation.
External wind is a major environmental factor affecting heat transfer through greenhouse coverings. Rasheed et al. [6] showed that the overall heat-transfer coefficient (U-value) increased with wind speed and reported that polycarbonate, polyvinyl chloride, and horticultural glass exhibited U-values approximately 9%, 4%, and 15% lower than that of single-layer polyethylene, respectively; double glazing reduced calculated heat loss by approximately 34%. Geoola et al. [7] likewise demonstrated experimentally that greenhouse-cladding U-values vary with wind velocity and indoor–outdoor temperature difference. More recently, Mao and Su [8] combined CFD analysis with measured greenhouse data and examined the dependence of greenhouse-cover heat-transfer characteristics on external wind speed and indoor–outdoor temperature difference. Conventional energy-saving measures have therefore generally focused on improving the thermal performance of the greenhouse envelope itself. For example, Rabiu et al. [9] evaluated 15 greenhouse screen configurations and reported that the best-performing multilayer screen saved 34.09 kWh/m2 annually, corresponding to approximately 60% of the simulated heating-energy demand. Boyacı et al. [10] reported average U-values of 2.87 and 3.63 W/m2·K with and without a thermal curtain, respectively, corresponding to approximately 21% nighttime heat-energy savings under the investigated conditions. These studies demonstrate the substantial potential of envelope-based measures, but such approaches do not directly modify the external wind environment surrounding the greenhouse.
An external windbreak provides a complementary approach by modifying the airflow before it reaches the greenhouse envelope. Wang et al. [11] investigated the effects of shelterbelt geometry and arrangement using CFD and showed that barrier width, length, opening size, and arrangement substantially influence the resulting sheltered airflow field. In particular, openings within the shelterbelt increased both mean wind speed and turbulence kinetic energy in the downstream region by permitting airflow to penetrate the protected zone. A related concept has recently been extended to photovoltaic structures. Williams et al. [12] evaluated agrivoltaic PV arrays as aerodynamic windbreaks and identified characteristic acceleration, shelter, and recovery regions around the panels, demonstrating that PV-panel configuration can either reduce or locally accelerate the approaching airflow. These studies indicate that external structures can substantially modify the aerodynamic environment surrounding agricultural systems and that their effectiveness depends strongly on barrier geometry and spatial airflow redistribution. However, the corresponding influence on local greenhouse-envelope thermal response remains comparatively less characterized.
The airflow around windbreak systems is strongly governed by barrier geometry and by interactions between the barrier and nearby structures. Deng et al. [13], in a wind-engineering application involving transitions between solid windbreak walls and porous wind barriers, showed through wind-tunnel experiments and CFD that changes in barrier configuration can substantially alter local turbulence and vortex structures under crosswind conditions. Raffaele and Coste [14] investigated the aerodynamic interaction between an upstream porous fence and a downstream ground-mounted solid obstacle using validated three-dimensional RANS simulations, demonstrating the importance of barrier–obstacle interaction in determining the downstream flow field. Classic windbreak studies also show that sheltering effects can extend over substantial downstream distances. Heisler and DeWalle [15] reported measurable wind-speed reductions as far as approximately 50 windbreak heights (H) downstream and reductions of 20% or more extending to approximately 25H, although the magnitude and extent of protection depend strongly on windbreak structure. Subsequent numerical studies and reviews have further demonstrated that wind direction, barrier dimensions, structural characteristics, and three-dimensional effects strongly influence wake development and shelter effectiveness [16,17]. These findings are particularly relevant to field-installed rigid walls, where finite wall length, corners, discontinuities, and limited wall height can generate bypass flow, edge acceleration, and spatially non-uniform shielding. Nevertheless, previous studies have primarily focused on aerodynamic windbreak performance, porous shelterbelts, or barrier–obstacle interactions; the relationship between local greenhouse heat-flux responses and the three-dimensional airflow structures generated by a rigid, non-porous PV wall under actual field-installation constraints remains insufficiently documented.
Photovoltaic technologies are increasingly being incorporated into greenhouse systems as part of efforts to improve the energy sustainability of protected cultivation. Recent reviews have emphasized that greenhouse-integrated PV systems influence not only electricity generation but also the greenhouse microenvironment through changes in solar radiation, temperature, shading, and other environmental factors [18]. Beyond their primary role in renewable electricity generation, vertically installed PV modules can also function as rigid external structural elements. When positioned adjacent to a greenhouse, the same PV surface may therefore provide a passive wind-shielding function without requiring a separate dedicated windbreak structure. This multifunctional use is potentially attractive for greenhouse applications because a single vertical PV structure can contribute to both renewable-energy production and modification of the external aerodynamic environment. In the present study, however, PV electrical performance was not evaluated; the analysis focused specifically on airflow modification by the installed PV wall and the local thermal response of the adjacent greenhouse envelope.
The distinguishing feature of this study is the combined evaluation of local greenhouse-cover heat-flux responses and the three-dimensional airflow structures generated by an actual field-installed, rigid, non-porous PV windbreak. Whereas previous studies have primarily addressed windbreak aerodynamics, agrivoltaic wind shelter, or barrier–obstacle interactions, the present work examines the spatially non-uniform thermal response of a greenhouse surface influenced by a PV windbreak and uses CFD to interpret the associated sheltered, recirculating, accelerated, and bypass-flow structures. The study further extends beyond the as-installed configuration by examining two practical geometric design factors—wall continuity and wall height—that directly influence the extent and distribution of aerodynamic shielding. Accordingly, this study aimed to (1) characterize the diurnal and nighttime heat-flux responses at multiple heights within a windbreak-influenced greenhouse-covering region and at a reference position, (2) identify sheltered, recirculating, accelerated, and bypass-flow regions under different inflow directions, and (3) evaluate how closing wall discontinuities and increasing windbreak height alter aerodynamic protection of the greenhouse envelope. The results provide a basis for considering vertically installed PV modules not only as electricity-generating components but also as multifunctional greenhouse infrastructure capable of providing passive aerodynamic protection.
2. Materials and Methods
2.1. Experimental Site and Greenhouse Configuration
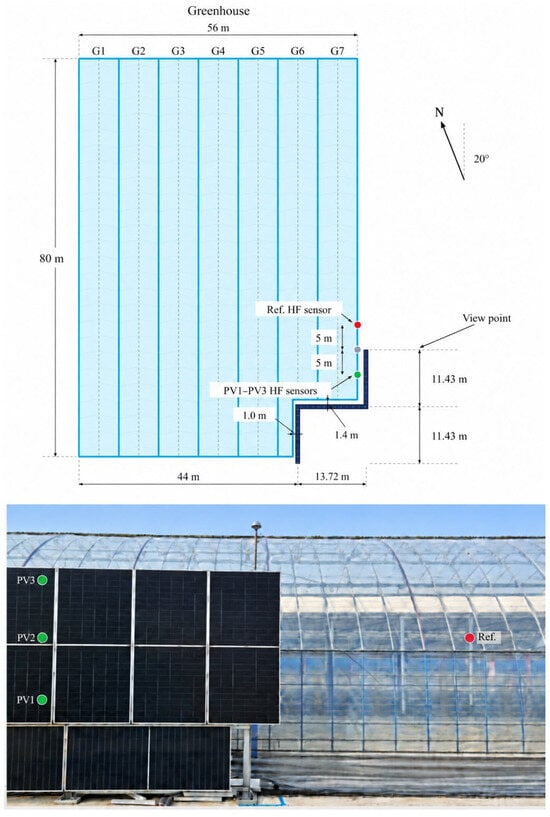
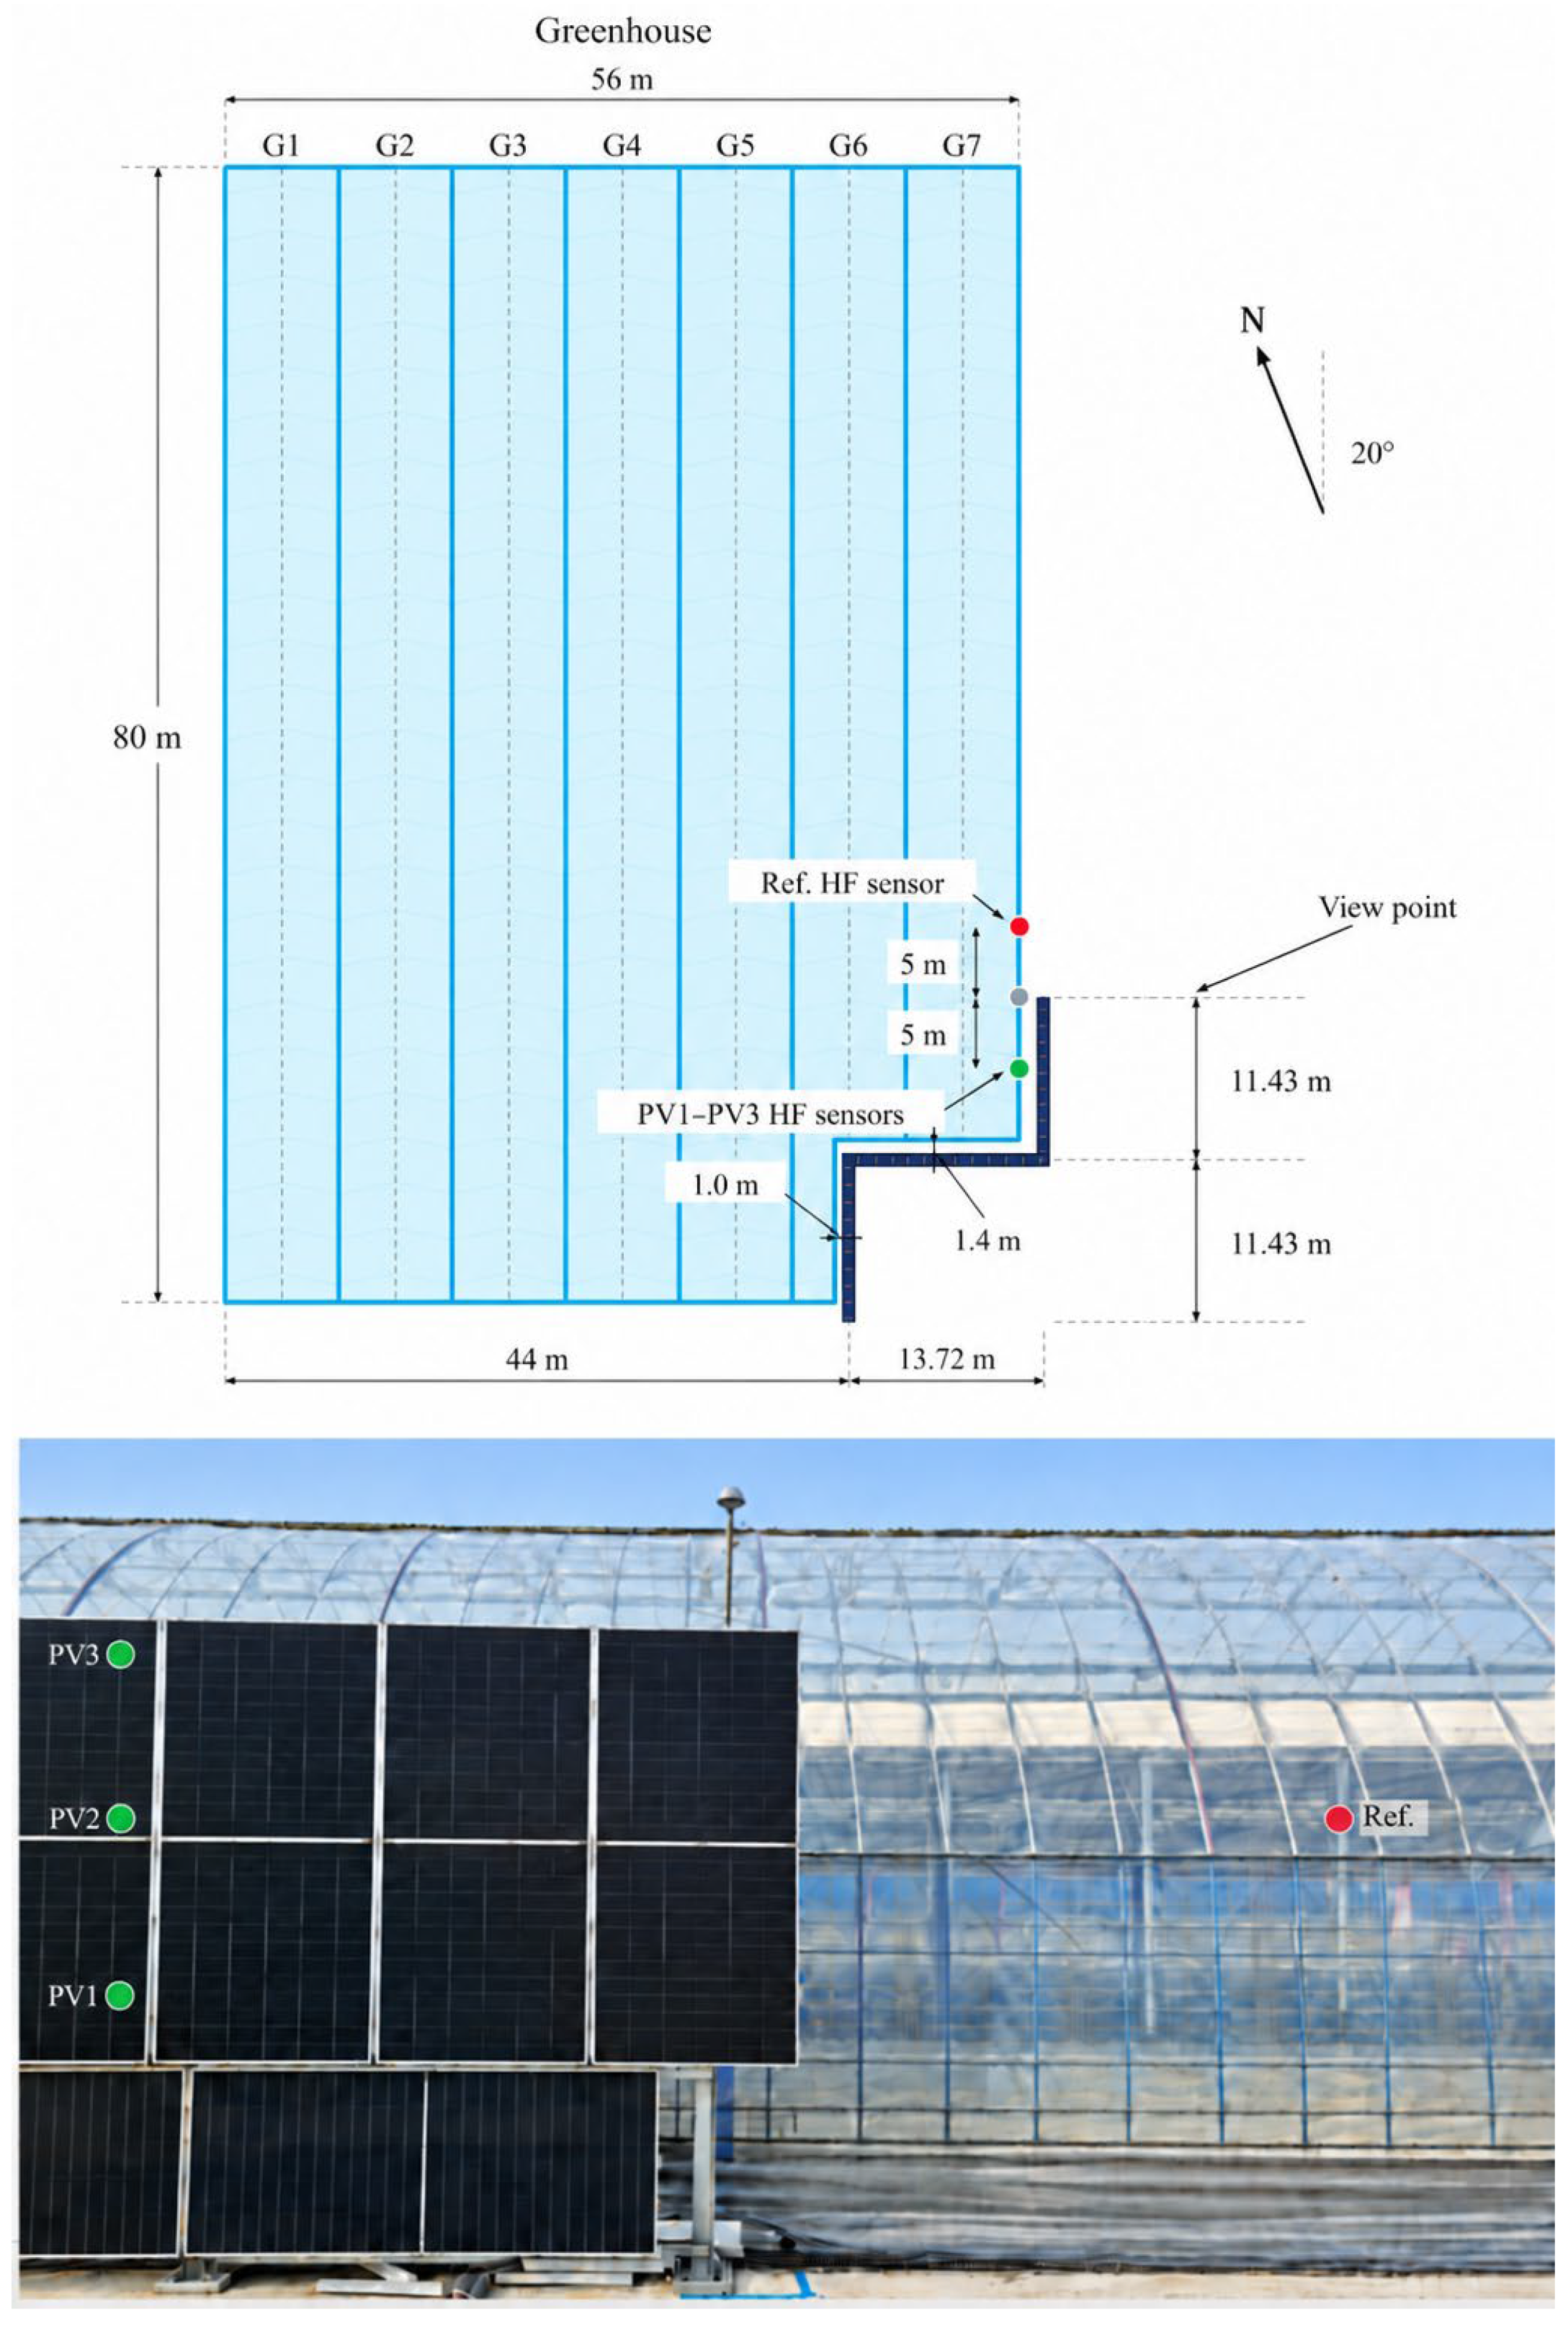
The field experiment was conducted at a flat agricultural site in Nonsan, Republic of Korea. The greenhouse complex consisted of seven adjacent arch-type greenhouse bays, designated G1–G7. Each greenhouse was approximately 80 m long, 8 m wide, and 6.2 m high at the ridge and was covered with polyolefin (PO) film. A vertical, non-porous windbreak composed of photovoltaic (PV) panels was installed adjacent to the G7 side of the greenhouse complex, as shown in Figure 1.
Figure 1.
Plan-view configuration and field installation of the vertical PV windbreak wall adjacent to the greenhouse complex.
The PV windbreak consisted of three interconnected straight sections arranged around the G7 side of the greenhouse. According to the as-built design drawings, the two principal wall sections were each approximately 11.43 m long, while the connecting section was approximately 13.72 m long, resulting in a total installed windbreak length of approximately 36.58 m. The wall incorporated two approximately 90° changes in direction to accommodate the greenhouse corner and surrounding site conditions. The clearance between the PV windbreak and the greenhouse covering was approximately 1.0 m along the longitudinal section and approximately 1.4 m at the stepped connecting region. The windbreak structure had an overall height of approximately 3.4 m, while the solid PV-panel portion was approximately 3.3 m high.
The orientation of the PV windbreak was 200° relative to geographic north. The PV modules were installed vertically at a tilt angle of 90°. Although the modules operated as photovoltaic generators under field conditions, the present study treated them as rigid, non-porous windbreak elements, and their electrical-generation performance was outside the scope of the analysis.
The clearance between the PV windbreak and the greenhouse covering formed a sheltered intermediate zone adjacent to the greenhouse envelope. The as-installed windbreak geometry included a stepped corner and two local discontinuities near the measurement section. In particular, on the wall segment oriented approximately perpendicular to the main windbreak section near the heat-flux measurement location, a lower opening of approximately 1.1 m × 1.1 m was present. In addition, an approximately 0.5 m local gap was present immediately adjacent to the windbreak corner. These openings were created by site-specific installation constraints and provided potential pathways for local airflow penetration into the nominally sheltered region. The actual corner and opening geometries were therefore retained in the CFD model because they could influence flow separation, recirculation, edge acceleration, and local bypass flow around the greenhouse.
Heat-flux measurements were conducted at a windbreak-adjacent position and a reference position on the G7 greenhouse covering. PV1, PV2, and PV3 were vertically aligned at the same plan-view location within the windbreak-adjacent region and were installed at heights of approximately 2.0, 3.0, and 4.0 m above ground level, respectively. The protected measurement position was located near the windbreak corner and approximately 5 m along the greenhouse wall from the adjacent PV-wall edge. The reference heat-flux sensor (Ref.) was installed at approximately 3.0 m above ground level at a reference location approximately 5 m beyond the same windbreak edge. Thus, the protected and reference measurement positions were separated by approximately 10 m along the greenhouse side, with the windbreak edge located between them. Importantly, the protected sensor location was also positioned close to the corner-side discontinuities described above, including the approximately 1.1 m lower opening and the local gap adjacent to the corner. The plan-view relationship of the sensors to the windbreak edge, corner, and openings, together with their vertical installation positions, is illustrated in Figure 1 and summarized in Table 1.
Table 1.
Principal experimental configuration used for the windbreak assessment.
2.2. Measurement and Monitoring
Measurements were conducted to compare the local thermal response of greenhouse-covering sections influenced by the PV windbreak with that at a reference location. The principal variables used in the present analysis were heat flux through the greenhouse covering, greenhouse-cover surface temperature, and adjacent air temperature. The overall field-monitoring campaign was conducted from November 2025 to February 2026, whereas the heat-flux dataset analyzed in the present study was collected during February 2026. The locations and installation heights of the heat-flux sensors are summarized in Table 1 and illustrated in Figure 1, while the specifications of the measurement instruments are provided in Table 2.
Table 2.
Specifications of measurement instruments.
K-type thermocouples were used to measure the greenhouse-cover surface and adjacent air temperatures, and the signals were recorded using a GL-840 data logger (Graphtec corporation, Yokohama, Japan). Heat-flux sensors, including Ref., were mounted on the inner surface of the greenhouse covering without direct contact with the metal frame. The sensors were positioned approximately midway between adjacent vertical frame members. Only the vertical frame members were in direct contact with the covering film. The vertical distance from the center of each heat-flux sensor to the centerline of the adjacent horizontal metal frame member was approximately 20 cm, with slight variations among sensor locations. The sensors were fixed using transparent adhesive tape (Scotch™, 3M, St. Paul, MN, USA). To minimize disturbance of the local heat-transfer path, the tape was applied only along the peripheral region of each sensor, corresponding to approximately one-eighth of the sensor area. This area fraction describes the tape coverage and does not quantify its effect on the measured heat flux. The sensor cables were routed upward and supported at the adjacent horizontal frame member, following the same cable-routing arrangement used during the pre-installation intercomparison. The sensors were oriented such that heat transfer from the outdoor environment toward the greenhouse interior was recorded as positive.
Raw measurement signals were sampled at 10-s intervals. For subsequent analysis, the corrected heat-flux records were processed and reported at 10-min intervals using a centered 10-min average, calculated from the data acquired during the ±5-min period around each reporting time. This averaging procedure was applied to reduce the influence of short-duration fluctuations and isolated transient spikes. The analysis included heat-flux records from from seven selected dates in February 2026 (2, 7, 10, 13, 14, 17, and 22 February), with 13 February examined in detail as a descriptive case. The 10-min averages describe temporal variation and were not treated as independent experimental replicates for statistical testing.
Meteorological context for the seven dates was obtained from the Korea Meteorological Administration (KMA) Nonsan Automated Weather Station (AWS; station 615). On 13 February 2026, the outdoor air temperature and 1.04 ± 0.37 m/s for wind speed was 5.3 m/s. During the nighttime and early-morning period from 00:00 to 06:00, which was of particular interest for evaluating outward greenhouse heat loss, the mean wind speed was approximately 0.90 m/s, and the wind direction specifies where the wind originates, whereas CFD inflow angles are defined relative to the modeled geometry.
Absolute solar irradiance was not available for quantitative correction of the thermal measurements. Because absorbed solar radiation can influence both the greenhouse-cover surface temperature and measured heat flux, daytime results were interpreted cautiously. Greater emphasis was therefore placed on nighttime and early-morning periods when evaluating outward heat transfer from the greenhouse.
A consistent sign convention was applied throughout the analysis. Positive heat-flux values indicate heat transfer from the outdoor environment toward the greenhouse interior, whereas negative values indicate heat transfer from the greenhouse interior toward the outdoor environment. Accordingly, negative heat flux during nighttime and early-morning periods was interpreted as local greenhouse heat loss. Because the measured heat flux represents the combined effects of conduction through the covering, convection, radiation, and absorbed solar energy, the measured signal was interpreted as the local net thermal response of the greenhouse envelope rather than as a pure external convective heat flux.
2.3. CFD Model and Numerical Conditions
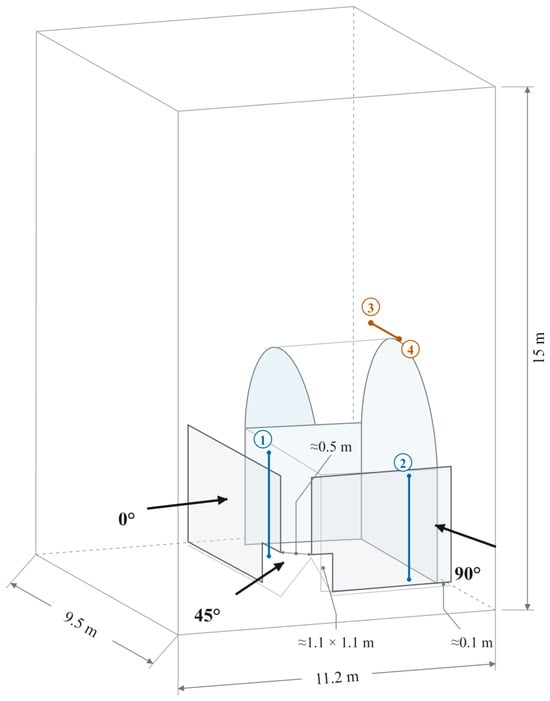
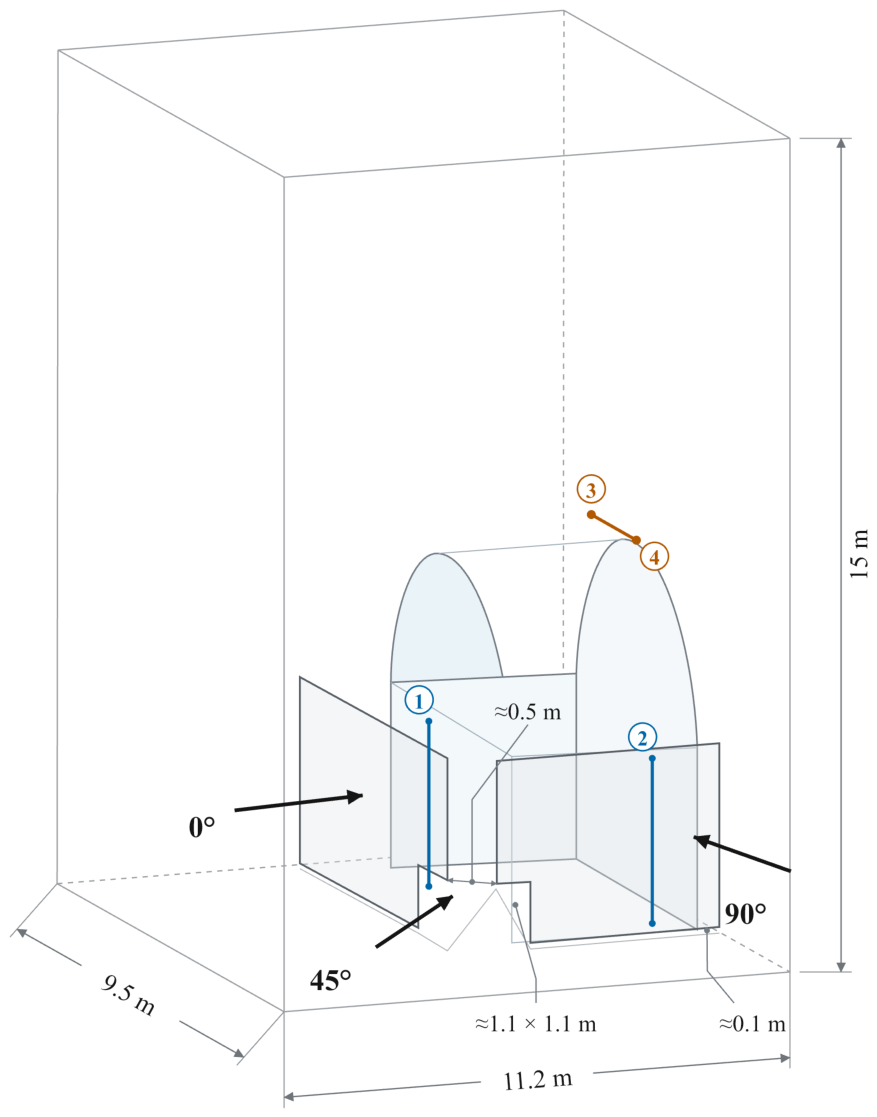
The numerical simulations were performed using ANSYS Fluent 2020 R2 (ANSYS Inc., Canonsburg, PA, USA). A three-dimensional CFD model was developed to represent the local airflow around the field-installed PV windbreak and the adjacent corner of the G7 greenhouse. The computational geometry represented the as-installed configuration, including the stepped greenhouse corner, wall-to-greenhouse clearance, windbreak edge, and local discontinuities, rather than assuming an idealized continuous wall, as shown in Figure 2.
Figure 2.
Computational geometry of the field-installed PV windbreak and adjacent greenhouse corner, showing the windbreak edge, local openings, and wall-to-greenhouse clearance.
A computational domain of approximately 11.2 m × 9.5 m × 15 m (length × width × height) was constructed around the greenhouse–windbreak configuration. The dimensions of the PV wall and greenhouse were defined according to the field geometry. The original windbreak had an overall height of approximately 3.4 m, consisting of a 3.3-m-high solid PV-panel section with an approximately 0.1 m lower clearance from the ground. The as-installed geometry also included an approximately 1.1 m × 1.1 m lower opening near the measurement section and an approximately 0.5 m gap immediately adjacent to the windbreak corner. These local discontinuities were explicitly reproduced in the CFD geometry. A reference configuration was generated by removing the PV windbreak while maintaining the same greenhouse geometry, computational domain, and boundary conditions, thereby allowing the aerodynamic effects of the windbreak to be isolated.
An inlet velocity of 5 m/s was used as the common reference velocity for all comparative simulations. This value was selected as a rounded near-maximum wind condition based on the maximum wind speed of 5.3 m/s recorded at the Nonsan AWS on the representative analysis day. The selected value therefore remained slightly below the observed maximum while providing a sufficiently strong and consistent inflow condition for comparison among the different windbreak geometries. The CFD conditions were not intended to reproduce the daily or nighttime mean field wind speed directly, but rather to provide a common reference condition for evaluating the relative aerodynamic effects of the windbreak configurations. Accordingly, the CFD simulations were designed as controlled comparative cases for evaluating changes in airflow caused by windbreak height, wall discontinuities, and inflow direction under common boundary conditions, rather than as direct reproductions of the transient field thermal measurements.
Three inflow directions, 0°, 45°, and 90°, were considered. The 0° and 90° cases represented inflow normal to the two principal wall sections, while 45° represents oblique inflow toward the greenhouse–windbreak corner, and +y directions follow the 0° and 90° inflow.
The three inflow directions are indicated by arrows in Figure 2. Previous CFD and wind-tunnel studies have demonstrated the strong dependence of greenhouse aerodynamic response on wind direction, supporting the use of multiple inflow angles in the present analysis [19].
The inlet-air temperature was prescribed as 15 °C and the wall temperature as 25 °C, corresponding to a controlled temperature difference of 10 K. These values were not intended to reproduce the measured temperature conditions of the selected winter day. Instead, the temperature difference was prescribed to incorporate thermal buoyancy while maintaining identical thermal boundary conditions for all comparative CFD cases. Accordingly, the numerical temperature field was used to support interpretation of airflow–buoyancy interactions rather than as a direct quantitative reproduction of the measured field temperature distribution.
A velocity-inlet condition was applied at the upstream boundary and a pressure-outlet condition at the downstream boundary. The upper boundary was treated as a slip boundary, whereas the ground, greenhouse surfaces, and PV windbreak were treated as no-slip walls. Air was modeled as an incompressible Newtonian fluid, and the steady Reynolds-averaged Navier–Stokes (RANS) equations were solved together with the energy equation. Thermal buoyancy was represented using the Boussinesq approximation. Turbulence was modeled using the shear-stress-transport (SST) k–ω model. The SST k–ω model has been applied to RANS simulations of airflow and sheltering around wind-fence structures [20] and has also been evaluated in field-validated greenhouse CFD simulations [21]. The near-wall mesh was designed to achieve a y+ value of approximately 0.23 at an inlet velocity of 5 m/s.
For the steady-state calculations, the prescribed scaled-residual targets were 10−3 for continuity, the three momentum equations, k, and ω, and 10−6 for the energy equation. The maximum iteration limit was set to 100,000. Visual inspection of the flow fields obtained after approximately 1000, 10,000, and 100,000 solver iterations showed similar overall airflow patterns, although residual fluctuations persisted and not all prescribed residual targets were attained. The reported velocity metrics and flow visualizations were extracted from the final saved iterative solution.
An unstructured mesh with local refinement was generated near the PV-wall edges, greenhouse surfaces, wall-to-greenhouse clearance, openings, and wake regions. Mesh convergence was assessed using coarse, medium, and fine meshes containing approximately 2.22, 5.30, and 17.2 million elements, respectively. The temperature difference between the medium and fine meshes was less than 0.1 K, while the corresponding velocity difference was approximately 0.10 m/s. The velocity difference between the coarse and medium meshes was approximately 0.23 m/s. Based on these results, the medium mesh containing approximately 5.30 million elements was selected for the subsequent simulations because it produced results close to those obtained using the fine mesh while requiring substantially fewer computational elements.
In addition to the as-installed configuration, three modified geometries were evaluated. First, the top elevation of the windbreak was increased from approximately 3.4 m to 6.0 m above ground level, while maintaining the approximately 0.1 m lower clearance.
Thus, the solid wall height in the increased-height configuration was approximately 5.9 m. Second, the approximately 1.1 m × 1.1 m lower opening and the approximately 0.5 m corner-side gap were closed simultaneously while retaining the original windbreak height. Third, wall closure was combined with the increased windbreak height. In this study, wall continuity denotes the open or closed status of these two local discontinuities and is specified by their dimensions and presence or absence as a categorical geometric condition. The wall-closure comparison therefore addresses the combined effect of closing both openings. The approximately 0.1 m ground clearance was retained in the closed-opening configurations and was treated separately from these local discontinuities. The height-modification cases were evaluated under the three inflow directions, whereas the wall-closure cases were evaluated under the 45° oblique inflow condition to examine the effects of wall continuity under a condition in which the corner, edge, and opening geometries were simultaneously exposed to the approaching flow.
For quantitative comparison of aerodynamic shielding, the velocity magnitude was evaluated using the locations indicated in Figure 2. Two vertical evaluation lines (① and ②) were positioned approximately 0.1 m outward from the corresponding greenhouse side surfaces. Both evaluation lines extended from approximately 0.1 to 3.2 m above ground level. Line ① was located at the midpoint of the modeled straight greenhouse section, approximately 3 m from the greenhouse corner, whereas line ② was positioned approximately 3 m from the corner along the adjacent sidewall. These locations were selected to characterize near-surface airflow exposure away from the immediate corner region. The line-averaged velocity magnitude along each evaluation line was calculated to characterize the airflow exposure of the corresponding greenhouse sidewall. For the 0° and 90° inflow conditions, the reported line-averaged velocity was obtained from line ① and line ②, respectively. For the 45° oblique-inflow condition, the arithmetic mean of the two individual line-averaged velocity magnitudes was reported. For the upper greenhouse region, two fixed evaluation points (③ and ④), located at the same elevation approximately 0.1 m above the greenhouse ridge, corresponding to approximately 6.3 m above ground level, were connected by a straight evaluation segment. The maximum velocity magnitude along this segment was extracted to characterize localized upper-level airflow exposure and is referred to as the upper-segment maximum velocity. The same evaluation lines and upper segment were applied consistently to all corresponding CFD configurations. The resulting velocity metrics were used solely for aerodynamic comparison among the CFD configurations and were not interpreted as direct reductions in heat flux or greenhouse heat loss at the field measurement locations. The principal boundary conditions, geometry modifications, and numerical settings used in the CFD simulations are summarized in Table 3.
Table 3.
Principal boundary conditions, geometry modifications, and numerical settings used in the CFD simulations.
3. Results and Discussion
3.1. Measured Heat-Flux Response of Windbreak-Influenced and Reference Surfaces
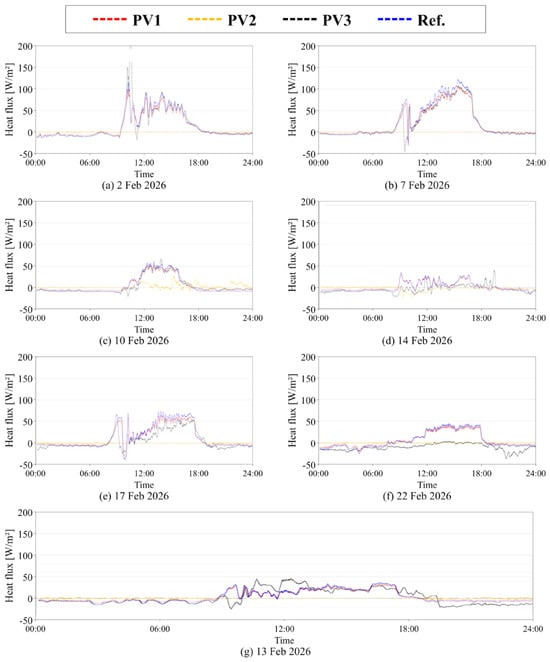
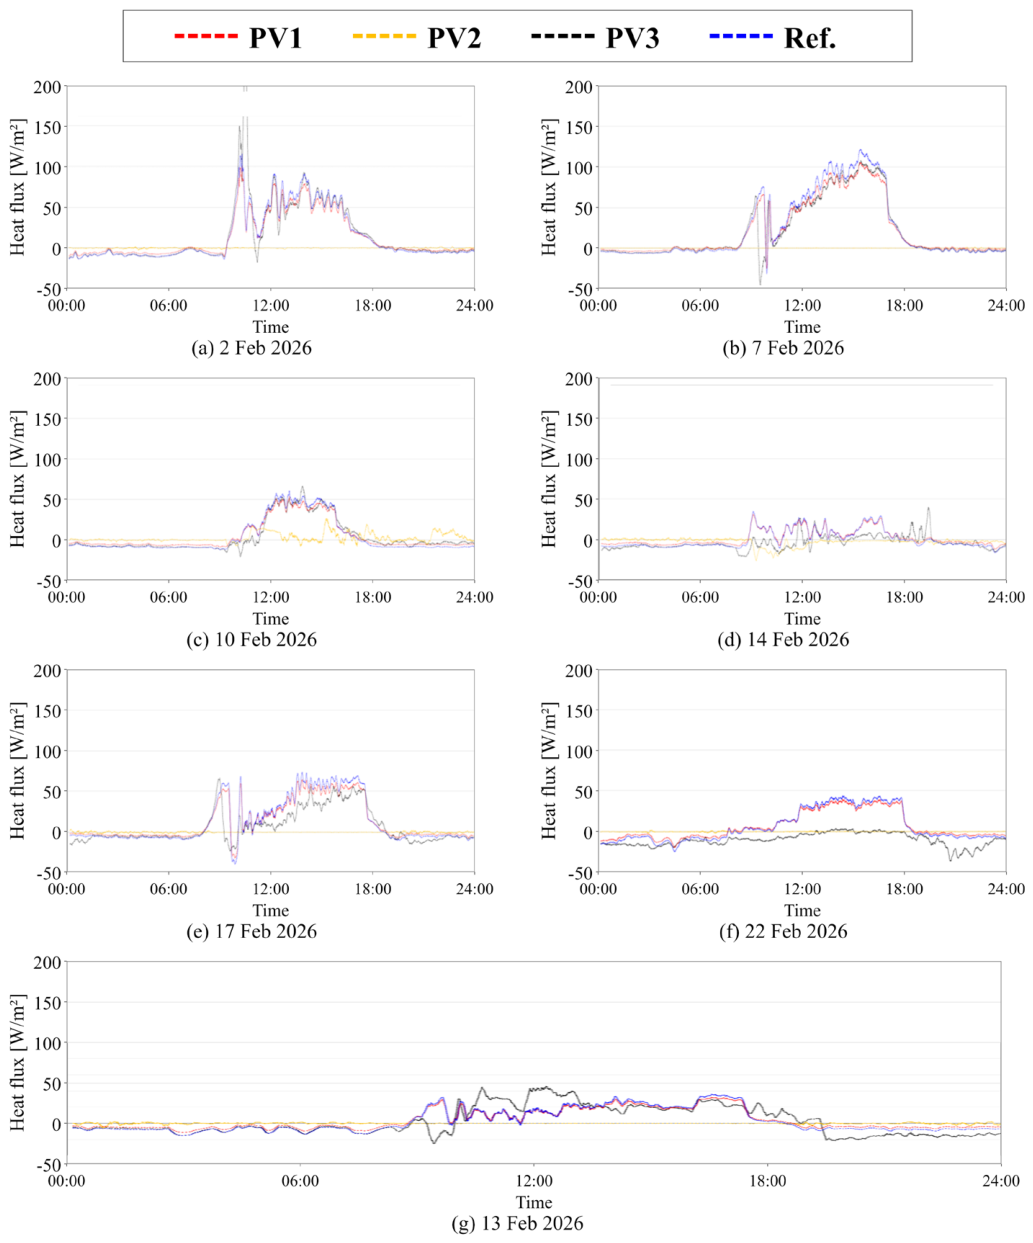
Figure 3 presents the diurnal heat-flux responses measured on the selected dates. During the nighttime and early morning, the reference position and PV1 generally exhibited negative heat flux, corresponding to outward heat transfer from the greenhouse. PV3 also frequently showed negative nighttime heat flux and, on several occasions, larger short-term fluctuations than the other measurement positions. In contrast, PV2 remained relatively close to 0 W/m2 during much of the nighttime period and exhibited a substantially attenuated variation compared with the other positions. The plotted records provide descriptive context for examining local thermal heterogeneity across the selected dates.
Figure 3.
Diurnal heat-flux responses measured on selected days during February 2026.
The records on 10 and 14 February showed weaker or more irregular daytime responses than the days with pronounced daytime heating. PV2 also exhibited departures from its typical near-zero response on these dates. This response documents variation in the recorded signal but does not independently establish measurement accuracy or exclude sensor-specific and installation-related effects. The plotted records therefore provide a descriptive comparison of local heat-flux responses across the measurement positions.
After sunrise, heat flux increased and generally became positive at most locations, although the magnitude and temporal pattern differed substantially among the measurement days. Some days showed pronounced daytime peaks, whereas other days exhibited considerably weaker or more irregular responses.
Among the measurement days presented in Fig. Fig. During the winter measurement period, shading at the PV-side measurement location was observed from approximately 07:30 to 11:30 on clear days, with slight variation among dates. Such shading may affect adjacent soil and crop-growing areas, but its thermal and agronomic consequences depend on greenhouse operation and crop conditions. On clear winter days, solar gains may exceed the instantaneous thermal requirement, with surplus heat dissipated through ventilation [22]. Shading that reduces such surplus gains need not increase heating demand during that period, whereas shading that reduces useful gains during heating periods may do so. The net effect also depends on shading timing and thermal storage. Likewise, photosynthetic light responses are nonlinear, may approach saturation, and depend on environmental conditions, including leaf temperature and CO2 availability [23]. Morning shading alone therefore does not establish the magnitude of a growth or yield response. These considerations do not demonstrate negligible shading effects at this site. The present study focuses on local thermal responses and airflow characteristics relevant to the multifunctional use of greenhouse-adjacent space for a PV windbreak; shading effects on whole-greenhouse heating energy and crop productivity were not quantified.
On 13 February, the reference position and PV1 exhibited broadly similar temporal variations. Both positions showed negative heat flux during the nighttime period, followed by a transition toward positive values after approximately 09:00. During the daytime, the heat flux at these positions increased to approximately 20–35 W/m2 before decreasing rapidly in the late afternoon. In contrast, PV2 remained close to 0 W/m2 throughout most of the day and night and showed only small fluctuations compared with the other measurement positions. PV2 and Ref. were installed at the same height of approximately 3 m, allowing their temporal responses to be compared at a matched height. Around 07:30, Ref. remained negative while PV2 stayed close to zero; the more pronounced rise in the reference signal occurred around 09:00. PV2 also showed no obvious step-like change around the reported end of morning shading at approximately 11:30, and the contrast with the reference response continued during the subsequent daytime period. Thus, within this same-height pair, smaller recorded outward heat flux at PV2 during nighttime coexisted with lower inward heat flux during daytime. PV3 exhibited a distinctly different local response. Its heat flux increased more strongly than those at the reference position and PV1 during parts of the late morning, whereas after approximately 19:00 it decreased to substantially more negative values and remained below the reference measurement during much of the subsequent nighttime period.
For quantitative comparison, the mean nighttime heat flux was calculated using the combined nocturnal periods of 00:00–07:00 and 20:00–24:00 on 13 February. The resulting mean heat flux was approximately −7.9 W/m2 at the reference position and −5.1, −0.6, and −9.9 W/m2 at PV1, PV2, and PV3, respectively. At the common installation height of approximately 3.0 m, PV2 exhibited smaller outward heat flux than Ref. over the same nighttime intervals. Within the vertically aligned PV1–PV3 measurements, PV2 showed the smallest and PV3 the largest magnitude of outward heat flux, with PV1 intermediate. These results describe both the difference between two locations at a common height and the vertical variation at the windbreak-influenced measurement location. Together, the measurements reveal local heterogeneity in the thermal response of the greenhouse envelope.
The observed spatial heterogeneity is important when interpreting the thermal influence of the PV windbreak. PV1, PV2, and PV3 were vertically distributed at different heights at the same plan-view location relative to the windbreak geometry. The differences among PV1–PV3 therefore describe vertical heterogeneity in the local thermal response, including variations associated with height and local exposure. The simultaneous PV2–Ref. comparison matches installation height and observation period, while local differences in indoor conditions, radiation, covering condition, and installation may also contribute to the measured responses. With one matched-height pair and no corresponding reference sensors at the PV1 or PV3 heights, the measurements characterize local heat-flux differences without isolating the contribution of the windbreak. In particular, the weak heat-flux response at PV2 and the comparatively large nighttime outward heat flux at PV3 demonstrate that measurements obtained at a single location cannot be considered representative of the entire greenhouse surface influenced by the PV windbreak.
Furthermore, local air velocity was not measured simultaneously at each heat-flux sensor position. Therefore, the observed heat-flux variations cannot be directly attributed to a specific velocity reduction, recirculation region, or vortex structure predicted by the CFD simulations. The subsequent CFD analysis is instead used to identify representative three-dimensional airflow structures that could provide a physically plausible explanation for the measured spatial heterogeneity, rather than to establish a direct point-by-point quantitative relationship between the simulated airflow and measured heat flux. Taken together, the field measurements and CFD results are consistent with a spatially heterogeneous thermal response occurring within the non-uniform aerodynamic environment around the PV windbreak.
3.2. Airflow Modification by the Installed PV Windbreak
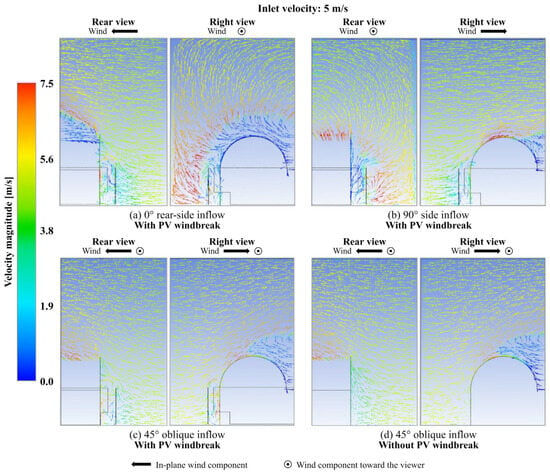
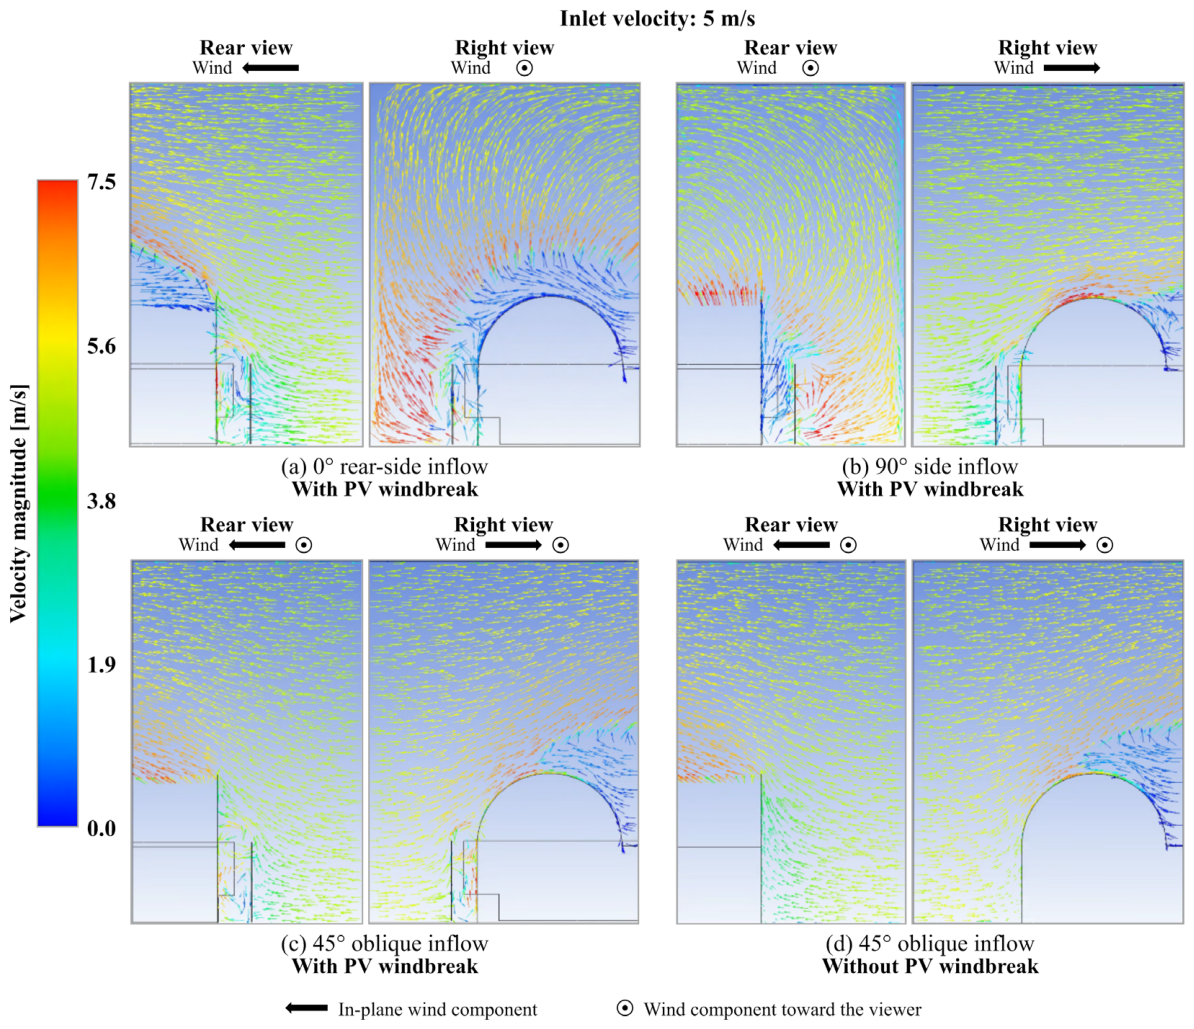
Figure 4 compares the three-dimensional airflow fields around the greenhouse with and without the as-installed PV windbreak at an inlet velocity of 5 m/s. The CFD analysis was used primarily to resolve representative airflow structures generated by the actual wall geometry and inflow direction and to provide a physical basis for interpreting the spatially non-uniform thermal response observed in the field. It was not intended as a point-by-point reconstruction or validation of the measured heat flux.
Figure 4.
CFD-predicted velocity-vector fields at 5 m/s for three inflow directions with the PV windbreak and the reference case without the PV windbreak.
In the reference configuration without the windbreak, the approaching airflow reached the greenhouse surface more directly and was subsequently deflected along the sidewall and curved roof. In contrast, installation of the PV wall caused the approaching flow to separate and turn around the windbreak, producing a sheltered low-velocity region within the clearance between the windbreak and greenhouse. Recirculating flow developed within parts of this sheltered region, while a higher-velocity shear layer formed above the upper edge of the windbreak.
For the side-inflow condition, in which the approaching flow was approximately normal to the principal windbreak section, the line-averaged velocity along the windbreak-facing greenhouse sidewall decreased from 4.22 m/s in the no-windbreak configuration to 1.37 m/s with the as-installed PV wall, corresponding to a reduction of approximately 67.5%. This result indicates substantial shielding along the evaluated sidewall under the simulated condition. However, the line-averaged value represents overall exposure along the evaluation line and does not describe local variations with height.
The reduction in line-averaged velocity was accompanied by localized acceleration near the upper boundary of the sheltered region. The maximum velocity magnitude along the upper evaluation segment, located approximately 0.1 m above the greenhouse ridge, increased from 6.85 to 7.40 m/s. This evaluation segment represents the region where the approaching flow was redirected over the wall and accelerated along the upper flow path. Thus, the as-installed wall did not produce uniform protection: lower and intermediate portions of the greenhouse were sheltered, while locally increased exposure remained near the upper surface. This contrast shows why a line-averaged velocity alone is insufficient for evaluating a rigid, non-porous windbreak.
The airflow pattern also varied with inflow direction. Rear-side inflow produced a pronounced recirculation region immediately downstream of the wall, whereas side inflow produced asymmetric turning around the wall edge. Under 45° oblique inflow, upward deflection, roof-level acceleration, recirculation, and localized bypass near the discontinuous wall section occurred simultaneously. These results illustrate the inherently three-dimensional airflow around the finite, non-uniform wall configuration: both the vertical deflection over the wall and lateral redistribution around wall ends, corners, and discontinuities depend on wind approach direction.
Taken together, the simulations indicate that the installed PV wall redistributed the approaching airflow rather than creating a uniformly low-velocity zone. Sheltered flow coexisted with recirculation, upper-edge acceleration, and localized bypass. These flow tendencies are physically consistent with the spatially heterogeneous heat-flux responses measured in the full-scale field configuration, although individual sensor responses cannot be assigned directly to specific CFD flow structures because local wind vectors were not measured simultaneously at each heat-flux sensor.
These findings are consistent with previous windbreak studies showing that barrier porosity, finite length, geometry, and wind direction can strongly affect wake formation and shelter distribution [11,15,16,17,20,24], as well as greenhouse studies demonstrating marked sensitivity of airflow and surface pressure to wind direction and structure [19,25,26,27]. The present case extends this context to a rigid, non-porous PV wall installed close to an actual greenhouse with finite wall sections, corners, discontinuities, and non-uniform clearances. The principal design implication is that windbreak performance should be assessed not only by mean velocity reduction but also by where the intercepted airflow is redirected.
The three inflow directions examined here should be interpreted as representative aerodynamic cases rather than as a reconstruction of annual wind conditions. Quantification of annual shielding performance would require a broader set of three-dimensional CFD cases weighted by the site-specific distributions of wind speed and wind direction.
3.3. Mechanistic Interpretation of Field Heat-Flux Heterogeneity Using CFD
The field measurements and CFD simulations were used to examine the local thermal response of the greenhouse envelope and possible airflow mechanisms around the as-built windbreak–greenhouse geometry, respectively. The CFD model was not quantitatively validated against the field measurements and was used as an exploratory tool for identifying three-dimensional airflow structures. The field measurements were obtained from the full-scale installation and therefore inherently reflect the combined influence of the actual three-dimensional aerodynamic environment, including changes in wind direction, wall-end and corner effects, geometric discontinuities, and airflow over the curved greenhouse envelope.
The primary purpose of comparing the field measurements with the CFD results was not to validate the numerical model against the measured heat flux, but to determine whether the airflow structures predicted for the as-built windbreak-greenhouse geometry were physically consistent with the spatially non-uniform thermal response observed in the field. This complementary use of full-scale measurements and CFD is consistent with previous greenhouse studies in which field experiments, numerical simulations, and wind-tunnel tests were combined to interpret wind-direction-dependent airflow rather than to establish exact point-by-point correspondence [27].
The CFD cases, in contrast, were based on prescribed inlet conditions and selected wind directions and were not intended to reproduce the complete time history of the meteorological conditions during the selected 24-h field record. Instead, the three-dimensional simulations were used to resolve representative airflow mechanisms—such as sheltered flow, recirculation, upper-edge acceleration, and lateral bypass—that could plausibly contribute to the measured thermal heterogeneity. This distinction is important because the field measurements provide evidence of the resulting local thermal response, whereas the CFD analysis provides a mechanistic interpretation of the airflow environment.
The two datasets share the same qualitative feature: strong spatial non-uniformity. PV1, PV2, and PV3 exhibited markedly different heat-flux responses, while the CFD predicted coexisting low-velocity sheltered regions, recirculation, localized upper-level acceleration, and bypass flow around the installed geometry. The attenuated response at PV2 and the comparatively large nighttime outward heat flux at PV3 describe spatial heterogeneity in the net local thermal response, to which airflow redistribution and differences in radiative exchange may both contribute. However, because PV1–PV3 were installed at different heights and local wind vectors and long-wave radiative exchange were not measured simultaneously at each sensor position, individual heat-flux responses cannot be assigned uniquely to specific CFD flow structures.
From a physical perspective, greenhouse-covering locations exposed mainly to sheltered low-velocity airflow would be expected to experience weaker wind-driven convective disturbance, whereas locations influenced by upper-edge acceleration, recirculation, or bypass flow could experience greater or more variable local heat transfer. This interpretation remains qualitative because the measured heat flux represents the combined local thermal response of the greenhouse envelope, including conduction, convection, radiation, and solar effects, rather than external convective heat transfer alone. At night, the PV wall may reduce the sky view factor of the adjacent covering, changing its long-wave exchange with the sky and the PV surface. Where the PV surface is warmer than the effective sky temperature, this change may reduce local radiative cooling, depending on wall–cover geometry and surface radiative properties. Accordingly, the CFD results should be interpreted as indicating possible aerodynamic contributions to the observed spatial trend, not as a direct quantitative prediction of the measured heat-flux values.
Several limitations should therefore be considered when interpreting the field-CFD comparison. First, absolute incident solar irradiance was not available for quantitative correction, which limits interpretation of the daytime heat-flux response. Second, the CFD model was used primarily to characterize three-dimensional airflow redistribution and did not directly solve the coupled heat transfer through the greenhouse covering. Third, the selected CFD inflow directions represent characteristic aerodynamic cases rather than the full annual distribution of wind speed and direction at the site. The present analysis therefore does not establish a quantitative relationship between aerodynamic shielding and whole-greenhouse heating-energy savings.
Within these limitations, the combined field and CFD analysis identifies two dominant aerodynamic mechanisms that may contribute to the non-uniform thermal response of the greenhouse envelope adjacent to the as-installed windbreak: localized acceleration near the upper greenhouse surface and bypass flow associated with wall discontinuities and three-dimensional flow redistribution. These mechanisms provide the basis for the geometry-modification analyses in Section 3.4, where wall height and wall continuity are evaluated separately and in combination as CFD-based design variables.
3.4. CFD-Based Design Exploration Through Windbreak Geometry Modification
The analysis of the as-installed windbreak identified two distinct aerodynamic limitations: the upper shear layer remained close to the greenhouse surface because of the limited wall height, while geometric discontinuities allowed localized bypass flow. Additional CFD simulations were therefore performed to examine how these two mechanisms responded to controlled changes in windbreak geometry. All modified cases were evaluated using the same greenhouse geometry, inlet velocity, and numerical settings as the as-installed configuration.
Because the modified configurations were not evaluated in the field and only a limited set of geometries was examined, the following analysis is intended as a CFD-based design exploration rather than as an optimization or direct prediction of field performance. Two modifications were considered: (1) increasing the windbreak height from the as-installed value of 3.4 m to 6.0 m while retaining the general wall layout, and (2) closing the discontinuous wall section. Relative to the greenhouse ridge height of 6.2 m, the overall windbreak-to-greenhouse height ratio increased from approximately 0.55 to 0.97. A third case combined wall closure with the increased-height configuration. The purpose was to determine whether wall height and wall continuity influence the same aerodynamic response or control different flow mechanisms.
3.4.1. Effect of Increased Windbreak Height
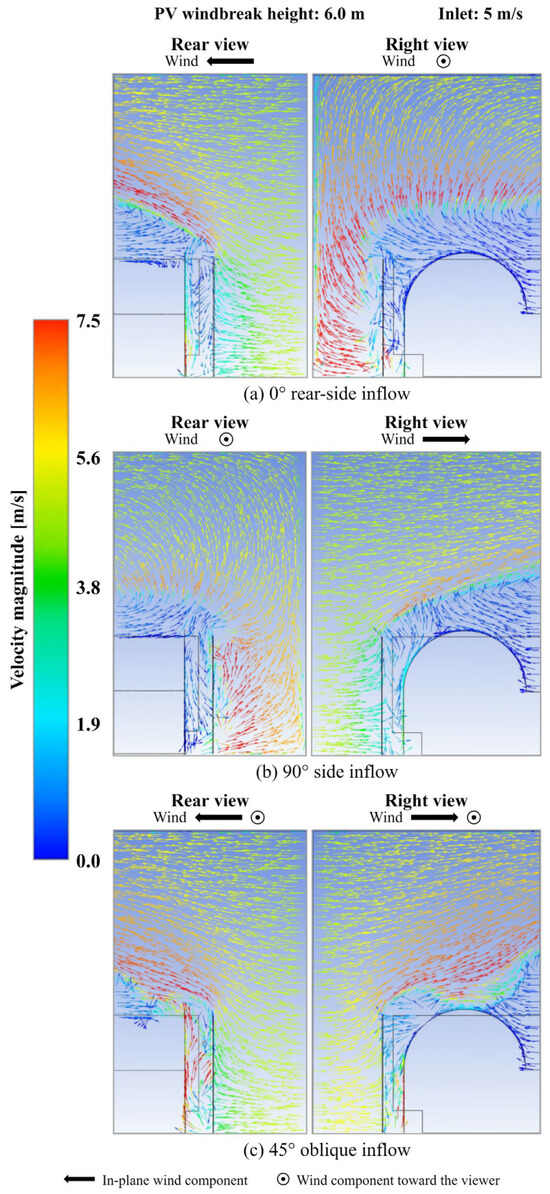
Figure 5 shows the predicted airflow fields for the increased-height configuration under rear-side, side, and 45° oblique inflow conditions. Increasing the wall height intercepted the approaching airflow at a higher elevation and displaced the high-velocity shear layer upward and away from the greenhouse surface. As a result, the sheltered low-velocity region extended farther toward the roof-sidewall transition.
Figure 5.
CFD-predicted velocity-vector fields for the increased-height PV windbreak at 5 m/s under (a) rear-side, (b) side, and (c) 45° oblique inflow conditions.
Under side inflow, the line-averaged velocity along the windbreak-facing greenhouse sidewall decreased from 1.37 m/s for the as-installed wall to 1.15 m/s for the increased-height case, corresponding to an additional reduction of approximately 16.1%. In contrast, the velocity decreased from 7.40 to 0.33 m/s, a reduction of approximately 95.5%. This difference indicates that, within the tested geometry, increasing wall height mainly affected the vertical position of the accelerated shear layer rather than substantially reducing airflow in the already sheltered lower region. Thus, the principal aerodynamic benefit of the taller wall was the extension of shielding toward the upper greenhouse surface.
A similar qualitative tendency was observed under the other inflow directions. Rear-side inflow produced a vertically larger sheltered region behind the taller wall, while side inflow shifted the accelerated flow farther above the greenhouse surface. Under 45° oblique inflow, however, localized bypass near the discontinuous wall section remained even after the wall height was increased. Therefore, increasing height primarily addressed the upper-level acceleration mechanism but did not eliminate bypass associated with wall discontinuity.
Only one increased-height configuration was examined in the present CFD analysis. The results should therefore be interpreted as evidence of the aerodynamic mechanism associated with increased wall height rather than as an optimum height or a general height-performance relationship. Establishing transferable design criteria would require a broader parametric analysis based on variables such as the wall-to-greenhouse height ratio, wall-greenhouse clearance, inflow direction, and wind speed, followed by field validation of selected configurations.
From a practical greenhouse-design perspective, wall height should not be determined from aerodynamic performance alone. A taller wall can extend the sheltered region and may reduce wind-induced thermal exposure, but excessive height can also increase shading and reduce the solar radiation available to crops. Unlike a conventional windbreak, however, increasing the height of a PV-based windbreak may also increase the available PV module area and therefore the potential for on-site renewable electricity generation, provided that the added module area receives sufficient solar irradiation. Practical height selection should therefore balance three competing factors: aerodynamic shielding and potential thermal benefit, crop-light and productivity effects caused by shading, and the additional electricity-generation potential associated with increased PV area. Quantitative optimization of this trade-off will require integrated analysis of airflow, solar access, crop light response, and PV generation and is beyond the scope of the present study [18,28,29].
3.4.2. Effect of Wall Closure and Combined Height Increase Under Oblique Inflow
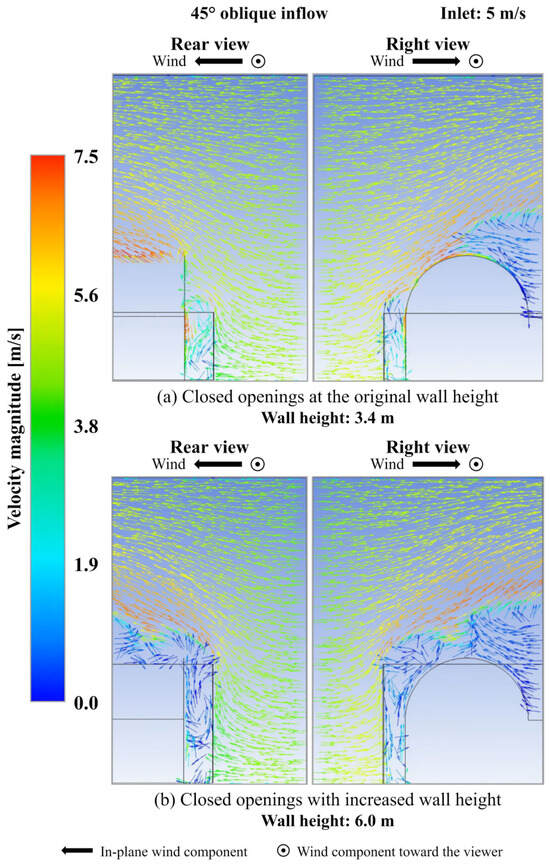
The 45° oblique inflow condition was selected as a design-challenge case because the as-installed configuration exhibited simultaneous lateral bypass through the discontinuous wall section, flow turning, recirculation, and upper-level acceleration. The wall-closure analysis was therefore performed under this representative oblique condition to examine how continuity and height affect different three-dimensional flow mechanisms. The conclusions regarding wall closure should be interpreted for the tested 45° condition rather than generalized to all wind directions. Figure 6 compares the predicted airflow fields for the closed-opening configurations at the original and increased wall heights.
Figure 6.
CFD-predicted velocity-vector fields under 45° oblique inflow at 5 m/s for closed openings at (a) the original height and (b) increased wall height.
Closing the discontinuous wall section substantially altered the airflow within the windbreak-greenhouse gap. The configuration with closed openings restricted direct penetration through the previously open section and produced a more continuous low-velocity region adjacent to the greenhouse. This result indicates that wall continuity primarily acts on the lateral and gap-related bypass component of the flow. However, because the wall height remained unchanged, the deflected airflow still passed close to the upper greenhouse surface, and the upper high-velocity region was not eliminated.
The quantitative results summarized in Table 4 demonstrate this trade-off. Under 45° oblique inflow, the arithmetic mean of the line-averaged velocity magnitudes from lines ① and ② decreased from 6.03 m/s for the as-installed configuration to 2.92 m/s after wall closure, corresponding to a reduction of approximately 51.6%. In contrast, the upper-segment maximum velocity increased from 7.12 to 7.78 m/s, or by approximately 9.3%. Thus, reducing lower-level bypass did not reduce wind exposure uniformly; part of the intercepted airflow was redirected toward the upper flow path. The local velocity exceeding the 5 m/s inlet value represents flow acceleration caused by turning and geometric contraction around the wall edge and curved greenhouse surface, rather than an inconsistency with the prescribed inlet condition.
Table 4.
Summary of key aerodynamic metrics for the evaluated windbreak configurations.
When wall closure was combined with increased height, the line-averaged velocity decreased further to 1.94 m/s and the upper-segment maximum velocity fell to 0.67 m/s. Relative to the as-installed configuration, these values correspond to reductions of approximately 67.8% and 90.6%, respectively. Within the tested 45° condition, the combined configuration therefore reduced both the bypass-dominated sidewall exposure and the upper-level acceleration that remained after wall closure alone.
These results indicate that wall continuity and wall height control complementary, rather than interchangeable, aerodynamic mechanisms. Wall closure mainly limits three-dimensional flow penetration through geometric discontinuities, whereas increased wall height displaces the upper high-velocity shear layer away from the greenhouse surface. The combined configuration provided the lowest simultaneous line-averaged and upper-segment maximum velocities among the cases evaluated here. However, because only a limited set of geometries and one oblique wind direction were examined for the wall-closure cases, this result should be interpreted as mechanism-based design guidance rather than as a globally optimized configuration.
The selection of windbreak height should account for local edge-flow effects on the greenhouse envelope, including pressure fluctuations that may induce vibration of the flexible plastic covering. During more than one year of field operation with the current configuration, no greenhouse damage associated with edge-flow effects has been observed. This observation is limited to the conditions encountered at the site and does not establish safety under extreme wind events or for taller windbreaks. Detailed evaluation of covering vibration and the structural response of the greenhouse frame is beyond the scope of the present study, which focuses on local thermal responses and airflow characteristics.
Table 4 summarizes the two aerodynamic metrics used to compare the evaluated windbreak configurations. The results show that the line-averaged and upper-segment maximum velocities should be interpreted together. Under 45° oblique inflow, wall closure substantially reduced the line-averaged velocity but increased the upper-segment maximum velocity, indicating redistribution of the intercepted airflow toward the upper flow path. Only when wall closure was combined with increased height were both metrics substantially reduced. The normalized velocities (U/Uin) further show that local velocities can exceed the inlet velocity because of flow acceleration around the wall edge and curved greenhouse surface.
3.4.3. Design Implications and Scope of the CFD Analysis
The CFD-based geometry analysis indicates that the aerodynamic performance of a rigid, non-porous PV windbreak should be evaluated using multiple flow characteristics rather than a single average-velocity metric. Wall continuity and wall height affected different three-dimensional flow mechanisms: improving continuity reduced lateral and gap-related bypass, whereas increasing height shifted the upper high-velocity shear layer away from the greenhouse surface. Because an improvement in one metric can coexist with deterioration in another, both distributed sidewall exposure and localized high-velocity regions should be considered simultaneously when evaluating candidate configurations.
These findings should be interpreted as mechanism-based design guidance derived from the tested CFD cases, not as universal geometric criteria. Only a limited number of wall geometries and inflow directions were examined, and the wall-closure cases were evaluated specifically under the 45° oblique condition. Transferable design rules will therefore require broader parametric analysis of wall-to-greenhouse height ratio, wall-greenhouse clearance, opening or discontinuity size, inflow velocity, and wind direction. Expressing key geometric variables in non-dimensional form would also facilitate comparison among greenhouse sizes and site configurations.
The actual site is exposed to continuously varying wind speed and direction, whereas the present CFD simulations considered a limited set of representative inflow conditions. Accordingly, the simulated cases characterize representative three-dimensional airflow mechanisms rather than annual shielding performance. Quantification of annual aerodynamic benefit would require a broader set of CFD cases weighted by the site-specific wind-speed and wind-direction distribution, for example, using a wind-rose-based approach.
Practical design of a PV windbreak also requires consideration of constraints beyond aerodynamic shielding. Increasing wall height and continuity can improve sheltering but may increase structural wind loads on the rigid PV wall and its supporting frame. Greater height may also increase available PV module area and electricity-generation potential while increasing shading of the greenhouse and reducing crop-light availability. The final design should therefore be treated as a multi-objective problem involving aerodynamic protection, structural safety, crop-light requirements, and PV generation rather than as a purely aerodynamic optimization [18,28,29].
Localized insulation could potentially complement aerodynamic shielding in regions with elevated outward heat flux. Its application, however, must accommodate light-transmission requirements and practical attachment constraints on the curved greenhouse covering. An alternative direction for future design refinement is modification of the windbreak upper-edge geometry, with the aim of redirecting the accelerated upper flow away from the greenhouse surface while limiting the need for increased wall height and additional shading.
Finally, the present geometry-modification cases quantify aerodynamic shielding only. They do not directly determine changes in greenhouse heat loss, heating-energy consumption, crop productivity, or PV electricity yield. Field validation of selected geometries, together with coupled thermal analysis and synchronized measurements of local wind, solar irradiance, heat flux, greenhouse climate, and PV output, will be required to determine how the identified airflow mechanisms translate into integrated annual energy and production performance.
4. Conclusions
This study investigated the local thermal response of a greenhouse envelope and the three-dimensional airflow around a rigid, non-porous vertical PV windbreak installed adjacent to the greenhouse using field heat-flux measurements and CFD simulations. The field measurements revealed a strongly position-dependent thermal response: some windbreak-influenced locations exhibited reduced nighttime outward heat flux, whereas others did not. These observations characterize spatially non-uniform local heat-flux responses rather than a uniform thermal benefit across the greenhouse envelope.
The three-dimensional CFD analysis was used to identify representative airflow structures that could provide a physical interpretation of this field-observed heterogeneity, rather than as a point-by-point validation of the measured heat flux. Under the simulated side-inflow condition, the as-installed wall reduced the line-averaged velocity along the windbreak-facing sidewall by 67.5%, while localized acceleration remained near the upper greenhouse surface. The predicted flow field therefore consisted of coexisting sheltered, recirculating, accelerated, and bypass-flow regions, supporting the interpretation that the rigid wall redistributed incoming airflow rather than uniformly suppressing it.
The geometry-modification simulations further identified two complementary aerodynamic mechanisms. Closing wall discontinuities primarily reduced lateral and gap-related bypass, whereas increasing wall height displaced the upper high-velocity shear layer away from the greenhouse surface. In the tested increased-height case, the upper-segment maximum velocity decreased by approximately 95% under side inflow. Under the tested 45° oblique condition, combining wall closure with increased height reduced both line-averaged and upper-segment maximum velocities. These results provide mechanism-based design guidance, but should not be interpreted as a globally optimized or universally applicable windbreak configuration because only a limited set of geometries and representative inflow conditions was examined.
From a practical design perspective, the PV windbreak should be treated as a multi-objective system. Increasing height and continuity can improve aerodynamic shielding, but may also increase structural wind loads. A taller PV wall can provide additional module area and renewable-electricity-generation potential, while excessive height may increase shading and reduce crop-light availability. Practical design should therefore balance aerodynamic protection, structural safety, crop-light requirements, and PV generation rather than optimizing aerodynamic performance alone.
The present CFD cases represent characteristic three-dimensional flow conditions and do not reconstruct the continuously varying annual wind climate at the site. Likewise, photovoltaic output, crop response, whole-greenhouse heat-loss reduction, and whole-greenhouse heating-energy savings were not quantified. The principal contribution of this study is therefore the site-specific characterization of local heat-flux responses and CFD-predicted airflow redistribution for selected windbreak configurations. Future work should combine multi-season field measurements with site-specific wind-rose-weighted CFD, coupled thermal analysis, structural-load assessment, solar-access analysis, crop-light response, and PV electricity measurements to establish transferable design criteria and quantify integrated annual performance.
Author Contributions
Conceptualization, J.-S.Y., J.Y.L., S.Y., Y.J.Y. and Y.H.I.; methodology, S.K., C.K.L., J.-S.Y., J.Y.L., S.Y., Y.J.Y. and Y.H.I.; software, S.K. and C.K.L.; validation, S.K., C.K.L. and Y.H.I.; formal analysis, S.K. and Y.H.I.; investigation, S.K., C.K.L., J.-S.Y., J.Y.L., S.Y., Y.J.Y. and Y.H.I.; resources, Y.H.I.; data curation, S.K. and C.K.L.; writing—original draft preparation, S.K.; writing—review and editing, C.K.L. and Y.H.I.; visualization, S.K. and Y.H.I.; supervision, Y.H.I.; project administration, C.K.L., J.-S.Y., J.Y.L., S.Y., Y.J.Y. and Y.H.I.; funding acquisition, Y.H.I. All authors have read and agreed to the published version of the manuscript.
Funding
This work was carried out with the support of “Development of small scale photovoltaic power generation and storage technology for agricultural application (Project No. RS-2024-00399318)”, Rural Development Administration, Republic of Korea.
Data Availability Statement
The data supporting the findings of this study are available from the corresponding author upon reasonable request.
Acknowledgments
This work was supported by the Rural Development Administration through the projects listed in the Funding Section. During manuscript preparation, OpenAI ChatGPT (GPT-5.6 Pro, accessed 15 July 2026) was used only to improve organization, readability, and formatting. The authors reviewed, edited, and verified the scientific content. The authors take full responsibility for the manuscript.
Conflicts of Interest
Authors Sunuk Kim and Chan Kyu Lee were employed by Power2farms Co., Ltd. The remaining authors declare that the research was conducted in the absence of any commercial or financial relationships that could be construed as potential conflicts of interest.
References
- Maraveas, C.; Karavas, C.S.; Loukatos, D.; Bartzanas, T.; Arvanitis, K.G.; Symeonaki, E. Agricultural Greenhouses: Resource Management Technologies and Perspectives for Zero Greenhouse Gas Emissions. Agriculture 2023, 13, 1464. [Google Scholar] [CrossRef] [Scilit]
- Kaur, A.; Sonawane, V.; Rosha, P. Energy efficiency optimization strategies for greenhouse-based crop cultivation: A review. Can. J. Chem. Eng. 2024, 102, 1051–1065. [Google Scholar] [CrossRef] [Scilit]
- Lu, J.; Li, H.; Zong, C.; Wang, C.; Song, W.; Yang, D. Recent developments of thermal energy storage applications in the greenhouse environment: A comprehensive review. Energy Build. 2025, 347, 116342. [Google Scholar] [CrossRef] [Scilit]
- Dong, Y.; Ye, X.; Lin, D.; Zhang, L.; Xia, X. Climate-adaptive energy strategies for sustainable greenhouse systems: A Köppen-based systematic review. Energy Strateg. Rev. 2026, 64, 102073. [Google Scholar] [CrossRef] [Scilit]
- Zhang, E.; Elmi, M.; Jahid, A.; Duan, Q.; Wang, J. Assessing greenhouse covering systems for energy efficiency and solar irradiance modulation: A technical review. Green Technol. Sustain. 2026, 4, 100281. [Google Scholar] [CrossRef] [Scilit]
- Rasheed, A.; Lee, J.W.; Lee, H.W. Development of a model to calculate the overall heat transfer coefficient of greenhouse covers. Span. J. Agric. Res. 2017, 15, e0208. [Google Scholar] [CrossRef] [Scilit]
- Geoola, F.; Kashti, Y.; Levi, A.; Brickman, R. A study of the overall heat transfer coefficient of greenhouse cladding materials with thermal screens using the hot box method. Polym. Test. 2009, 28, 470–474. [Google Scholar] [CrossRef] [Scilit]
- Mao, C.; Su, Y. CFD based heat transfer parameter identification of greenhouse and greenhouse climate prediction method. Therm. Sci. Eng. Prog. 2024, 49, 102462. [Google Scholar] [CrossRef] [Scilit]
- Rabiu, A.; Adesanya, M.A.; Na, W.H.; Ogunlowo, Q.O.; Akpenpuun, T.D.; Kim, H.T.; Lee, H.W. Thermal performance and energy cost of Korean multispan greenhouse energy-saving screens. Energy 2023, 285, 129514. [Google Scholar] [CrossRef] [Scilit]
- Boyacı, S.; Atilgan, A.; Kocięcka, J.; Liberacki, D.; Rolbiecki, R.; Jagosz, B. Determination of the Effect of a Thermal Curtain Used in a Greenhouse on the Indoor Climate and Energy Savings. Energies 2023, 16, 7744. [Google Scholar] [CrossRef] [Scilit]
- Wang, J.; Patruno, L.; Zhao, G.; Tamura, Y. Windbreak effectiveness of shelterbelts with different characteristic parameters and arrangements by means of CFD simulation. Agric. For. Meteorol. 2024, 344, 109813. [Google Scholar] [CrossRef] [Scilit]
- Williams, H.J.; Hashad, K.; Zhang, K.M. Agrivoltaics wind shelter benefits with single-axis tracking solar panels. Agric. For. Meteorol. 2026, 380, 111091. [Google Scholar] [CrossRef] [Scilit]
- Deng, E.; Diao, L.Y.; Yue, H.; Dong, Y. Aerodynamic characteristics of windbreak wall–wind barrier transition section along high-speed railways during strong crosswinds. J. Wind Eng. Ind. Aerodyn. 2025, 258, 106038. [Google Scholar] [CrossRef] [Scilit]
- Raffaele, L.; Coste, N. CWE study of the aerodynamic interaction between a porous fence and a ground-mounted solid obstacle via pressure jump approach. J. Wind Eng. Ind. Aerodyn. 2025, 266, 106198. [Google Scholar] [CrossRef] [Scilit]
- Heisler, G.M.; DeWalle, D.R. 2. Effects of windbreak structure on wind flow. Agric. Ecosyst. Environ. 1988, 22–23, 41–69. [Google Scholar] [CrossRef] [Scilit]
- Wang, H.; Takle, E.S.; Shen, J. Shelterbelts and windbreaks: Mathematical modeling and computer simulations of turbulent flows. Annu. Rev. Fluid Mech. 2001, 33, 549–586. [Google Scholar] [CrossRef] [Scilit]
- Wang, J.; Patruno, L.; Chen, Z.; Yang, Q.; Tamura, Y. Windbreak Effectiveness of Single and Double-Arranged Shelterbelts: A Parametric Study Using Large Eddy Simulation. Forests 2024, 15, 1760. [Google Scholar] [CrossRef] [Scilit]
- Yao, H.; Liang, J.; Wang, Y.; Li, M.; Fan, F.; Ma, X.; Xiao, X. The influence of photovoltaic modules on the greenhouse micro-environment—A review. Renew. Sustain. Energy Rev. 2025, 210, 115214. [Google Scholar] [CrossRef] [Scilit]
- Xie, S.; Zheng, J.; Xiao, B.; Hu, H.; Cao, X.; Wang, X.; Zhang, L. Numerical Simulation and Wind Tunnel Test on the Wind-Induced Response of Three Typical Types of Greenhouse Main Structures. Agriculture 2022, 12, 1294. [Google Scholar] [CrossRef] [Scilit]
- Wu, X.; Guo, Z.; Wang, R.; Fan, P.; Xiang, H.; Zou, X.; Yin, J.; Fang, H. Optimal design for wind fence based on 3D numerical simulation. Agric. For. Meteorol. 2022, 323, 109072. [Google Scholar] [CrossRef] [Scilit]
- Baek, M.; Choi, S.; Kim, H.; Jang, H.; Kim, J.; Hong, T.; Hong, J. CFD numerical setting combinations for greenhouse natural ventilation across diurnal time points using multi-criteria analysis. Comput. Electron. Agric. 2026, 247, 111689. [Google Scholar] [CrossRef] [Scilit]
- Yang, S.-H.; Rhee, J.Y. Utilization and performance evaluation of a surplus air heat pump system for greenhouse cooling and heating. Appl. Energy 2013, 105, 244–251. [Google Scholar] [CrossRef] [Scilit]
- Choi, E.-Y.; Jeong, Y.-A.; An, S.-H.; Jang, D.-C.; Kim, D.-H.; Lee, D.-S.; Kwon, J.-K.; Woo, Y.-H. Comparison of Measured and Calculated Carboxylation Rate, Electron Transfer Rate and Photosynthesis Rate Response to Different Light Intensity and Leaf Temperature in Semi-closed Greenhouse with Carbon Dioxide Fertilization for Tomato Cultivation. J. Bio-Environ. Control 2021, 30, 401–409. [Google Scholar] [CrossRef] [Scilit]
- Cleugh, H.A.; Hughes, D.E. Impact of shelter on crop microclimates: A synthesis of results from wind tunnel and field experiments. Aust. J. Exp. Agric. 2002, 42, 679–701. [Google Scholar] [CrossRef] [Scilit]
- Kibwika, A.K.; Seo, H.-J.; Seo, I.-H. CFD Model Verification and Aerodynamic Analysis in Large-Scaled Venlo Greenhouse for Tomato Cultivation. AgriEngineering 2023, 5, 1395–1414. [Google Scholar] [CrossRef] [Scilit]
- Fernández-García, M.S.; Vidal-López, P.; Rodríguez-Robles, D.; Villar-García, J.R.; Agujetas, R. Numerical Simulation of Multi-Span Greenhouse Structures. Agriculture 2020, 10, 499. [Google Scholar] [CrossRef] [Scilit]
- Teitel, M.; Ziskind, G.; Liran, O.; Dubovsky, V.; Letan, R. Effect of wind direction on greenhouse ventilation rate, airflow patterns and temperature distributions. Biosyst. Eng. 2008, 101, 351–369. [Google Scholar] [CrossRef] [Scilit]
- Chopdar, R.K.; Sengar, N.; Giri, N.C.; Halliday, D. Comprehensive review on agrivoltaics with technical, environmental and societal insights. Renew. Sustain. Energy Rev. 2024, 197, 114416. [Google Scholar] [CrossRef] [Scilit]
- Widmer, J.; Christ, B.; Grenz, J.; Norgrove, L. Agrivoltaics, a promising new tool for electricity and food production: A systematic review. Renew. Sustain. Energy Rev. 2024, 192, 114277. [Google Scholar] [CrossRef] [Scilit]

Disclaimer/Publisher’s Note: The statements, opinions and data contained in all publications are solely those of the individual author(s) and contributor(s) and not of MDPI and/or the editor(s). MDPI and/or the editor(s) disclaim responsibility for any injury to people or property resulting from any ideas, methods, instructions or products referred to in the content. |
© 2026 by the authors. Licensee MDPI, Basel, Switzerland. This article is an open access article distributed under the terms and conditions of the Creative Commons Attribution (CC BY) license.