


Abstract
Efficient irrigation is pivotal for viticulture in arid regions; however, solutions that simultaneously stabilize vine water status, sustain yield, and preserve fruit quality remain limited. We evaluated a microfiber-based wicking infiltration irrigation system—applied at the surface (W1) and shallow-buried at 10 cm (W2)—against drip (DI) and furrow (FI) irrigation in a two-year field trial with table grapes in northwest China. Additional wicking infiltration irrigation quota treatments (W1-2/3, W1-1/3) were also tested. The experiment combined continuous root-zone moisture and predawn leaf water potential (Ψpd) measurements with assessments of growth, berry traits, anthocyanins, and expression of related genes, synthesizing outcomes using an AHP–entropy multi-criteria framework. Wicking infiltration irrigation reduced wet–dry fluctuations, increased minimum soil moisture, and mitigated excursions to low Ψpd relative to DI and FI, indicating a more stable hydraulic environment for vines. W2 and W1-2/3 delivered the highest or near-highest yields (up to 16.5 kg per vine). Relative to DI, W2 increased IWUE by 57.9% in 2018 and 9.3% in 2019, whereas W1-2/3 increased IWUE by 155.1% and 66.0%, respectively. The AHP–EW evaluation identified W2 as the best overall integrated treatment, with the highest cumulative score across the two years (1.22), while W1-2/3 provided the strongest yield–IWUE balance under reduced irrigation. Anthocyanin accumulation and the expression of related biosynthetic genes showed year- and treatment-dependent responses; moderate water deficit was associated with enhanced anthocyanin-related responses at some developmental stages, but this effect was not consistent across seasons. These results indicate that wicking infiltration irrigation can improve grape production and irrigation efficiency under arid conditions, although its effects on berry secondary metabolism depend on seasonal and irrigation conditions.
1. Introduction
Irrigation is a critical factor influencing grape yield and quality, particularly in arid and semi-arid regions [1]. With rising temperatures and increasing drought frequency, grape-growing regions are facing a growing mismatch between seasonal rainfall and atmospheric evaporative demand [1,2]. These changes intensify seasonal water shortages, increase the risk of soil salinization, and ultimately constrain both yield formation and berry quality development. In Northwest China, particularly in Ningxia, drought and limited irrigation water availability have become major constraints on sustainable viticulture and broader agricultural development. Therefore, improving irrigation design and developing water-saving irrigation strategies are essential for maintaining grape productivity and fruit quality under increasingly limited water resources.
Conventional surface irrigation methods, such as furrow and sprinkler systems, are widely adopted but can experience soil surface evaporation, weed growth along wetted strips, and transient wet–dry cycles in the upper root zone. These issues are particularly critical in arid regions [3,4]. Micro-irrigation technology has been widely proven as an effective vineyard water management strategy, enabling highly uniform and precise water delivery while typically reducing non-productive water losses compared to surface irrigation methods (furrow and sprinkler irrigation) [5,6]. Micro-irrigation can be implemented through both above-ground and subsurface irrigation techniques. With advancements in irrigation equipment and scheduling tools, precision drip systems capable of applying lower water volumes at reduced pressure and flow rates are increasingly adopted [7]. Subsurface drip irrigation has proven to be a more efficient system, offering potential advantages over surface drip irrigation [8], including higher crop water productivity, minimized root-zone leaching, greater water distribution uniformity, and reduced soil evaporation, surface runoff, and deep percolation [5]. However, once buried drip lines are installed, monitoring, adjusting, or maintaining them becomes challenging. Issues such as poor irrigation uniformity and weak clog resistance of emitters persist during operation [9,10,11].
A novel capillary irrigation technique—capillary wicking irrigation—is currently being utilized [12,13]. This technology involves the use of microfibers to passively draw water from small reservoirs and transport it to the root zone [14]. Water delivery is controlled through capillary action rather than pressure-driven drippers. Unlike traditional methods, capillary wicking irrigation prevents water from migrating to the surface and causing evaporation, even in the presence of soil capillary action. This method also reduces deep percolation, minimizes disruption to soil mechanical structure, maintains good soil permeability, and creates favorable conditions for plant growth [15].
The active root absorption layer of table grapevines is heavily localized within the 10–30 cm soil profile. As a pressureless, passive irrigation method, wicking infiltration irrigation perfectly aligns with grape root configuration by establishing a steady, unsaturated capillary wetting zone precisely within this active horizon. In typical arid and semi-arid regions characterized by coarse, gravelly sand or light podzolic soils with high saturated hydraulic conductivity, traditional systems experience severe vertical bypass drainage and rapid moisture dissipation. Wicking infiltration irrigation counteracts these limitations by leveraging steady matrix potential driven by capillary wicking, presenting an exceptional water-retention potential that mitigates root-zone drought shocks in vulnerable sandy vineyards.
Despite these advantages, there is limited field-scale evidence for the use of capillary wicking irrigation in grape cultivation, and its physiological and molecular impacts have not been fully understood. Further research is necessary to compare the effects of surface and subsurface drip irrigation in grape vineyards [16].
Building on this, we conducted a two-year field trial with table grape (Vitis vinifera L. ‘Moldova’) in arid Northwest China to evaluate two wicking infiltration irrigation configurations—surface placement and shallow burial at 10 cm—against conventional drip and furrow irrigation. We monitored root-zone moisture dynamics and plant water status, quantified vegetative growth and berry development, assessed fruit composition, and measured anthocyanin content alongside gene expression during ripening. The fundamental scientific novelty of this study lies in bridging the gap between isolated engineering hydrology and plant molecular biology. While the previous literature has tended to discuss irrigation water-saving technology or abiotic stress-induced fruit quality manipulation as separate entities, we establish a comprehensive, uninterrupted mechanistic cascade for the first time. This integrated multi-scale framework forms the scholarly core of our research.
Our objectives were threefold: (i) to test whether wicking infiltration irrigation can stabilize vine water status and improve yield and irrigation water use efficiency under arid field conditions; (ii) to identify an operating configuration and quota that safeguard fruit quality while enhancing irrigation performance; and (iii) to establish a mechanistic link from irrigation-driven soil–plant water relations to berry secondary metabolism and gene expression.
2. Materials and Methods
2.1. Description of the Study Area
Field trials were conducted during the 2018 and 2019 grape-growing seasons in a 100-acre commercial vineyard at Yuquanying Farm (38°28′ N, 106°24′ E; 1143 m) located on the eastern foothills of the Helan Mountains near Yinchuan, Ningxia Hui Autonomous Region, northwestern China. This region has a temperate arid climate, with a mean annual temperature of 8.7 °C. The soil is light podzolic with a sandy texture. Annual sunshine duration ranges from 2800 to 3000 h. Mean annual precipitation is 201.4 mm and is unevenly distributed, with approximately 62% occurring between July and September. Mean annual evaporation is approximately 1470 mm. During the growing seasons (May–September), total rainfall in 2018 and 2019 was 137 mm and 142 mm, respectively, while mean monthly temperatures were 21.9 °C and 22.3 °C. Veraison began around 30 July, and harvest occurred around 27 September. Vines were oriented east–west with row and plant spacings of 2.5 m and 0.75 m, respectively. Root systems were primarily distributed within the 0.10–0.30 m soil layer. Crop management adhered to local field standards. Each spring, 4.5 t/ha of fermented bio-organic fertilizer was applied, supplying nitrogen, phosphorus, and potassium at 11, 4.5, and 13.5 kg/ha, respectively. No additional fertilizer was applied thereafter.
2.2. Experimental Design
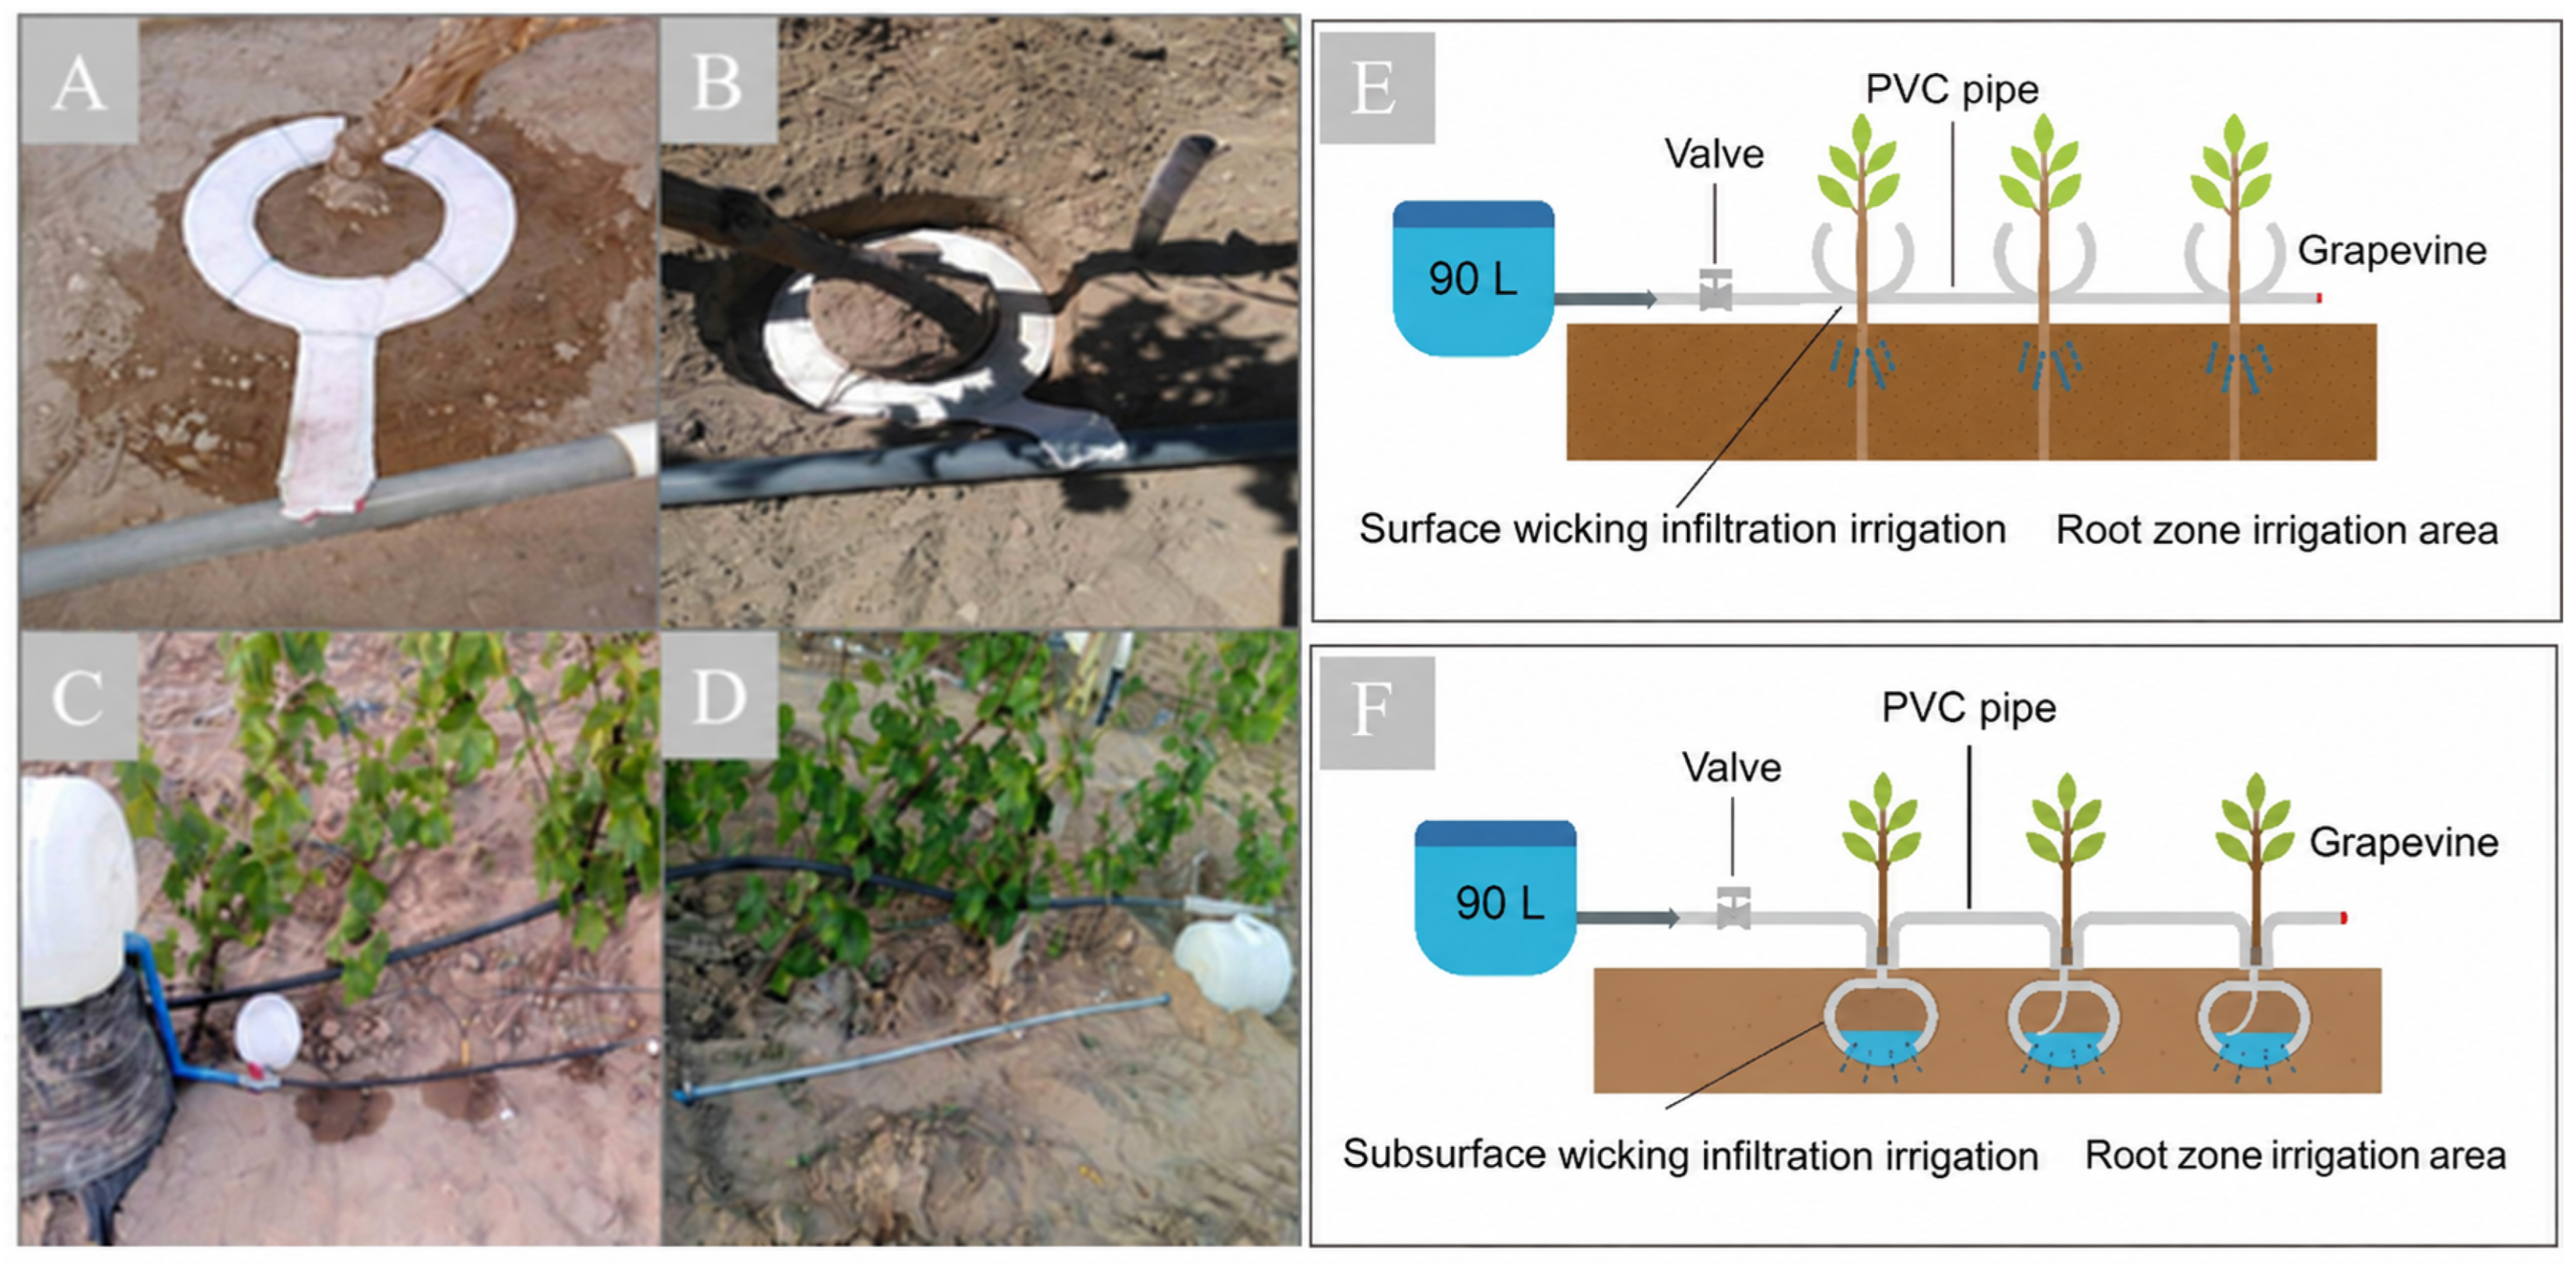
Experimental studies used nine-year-old ‘Moldova’ table grapevines (Vitis vinifera L. cv. Moldova). Capillary-wick emitters—fabricated from microfiber into annular rings (inner diameter: 15 cm; width: 3 cm; thickness: 2 mm)—exhibited a water-uptake rate of 0.17 L h−1 under clear skies (Figure S1). These rings were wrapped in nonwoven fabric, securely stitched, and deployed for wick infiltration irrigation. Trials utilized uniformly vigorous vines in the central vineyard block. Along each row, 90 L water buckets—elevated 50 cm on earthen mounds to provide head pressure—supplied three adjacent vines each. Buckets were connected to slotted PVC manifolds via valves. One end of each wrapped microfiber ring was inserted into PVC slots without leakage; the opposite end was positioned at vine root zones (Figure 1).
Figure 1.
Different irrigation methods. (A,E) and (B,F) represent surface capillary-permeation irrigation and buried (10 cm) capillary-permeation irrigation, respectively, along with their schematic designs; (C) shows drip irrigation, and (D) shows furrow irrigation.
Six treatments were established:
Two capillary-wick configurations were used: surface placement (ground level; Figure 1A,E) and subsurface placement (10 cm depth; Figure 1B,F, W2).
Conventional drip irrigation (DI) (Figure 1C) and furrow irrigation (FI) were employed (Figure 1D). These four treatments received equal water volumes per irrigation event.
Two reduced-volume variants were used: W1-2/3 (60 L per bucket refill) and W1-1/3 (30 L per bucket refill).
A total of 54 uniform grapevines were used in the experiment. Six irrigation treatments were established, with three independent replicates per treatment and three vines within each replicate, resulting in nine vines per treatment. For the wicking-infiltration treatments, each replicate consisted of one independently supplied 90-L bucket–PVC manifold system serving three adjacent vines, with one wick connected to each vine (Figure 1). For the DI and FI treatments, each replicate consisted of an independent three-vine irrigation unit receiving the corresponding treatment. Thus, the three-vine irrigation replicate, rather than an individual vine, was considered the independent experimental unit (n = 3 per treatment). Measurements obtained from individual vines, berries, or sensors within the same replicate were treated as subsamples and summarized at the replicate level before inferential statistical analysis. Irrigation intervals were nominally 25 days but were adjusted for environmental factors and intermittent microfiber clogging (Table 1).
Table 1.
Overview of irrigation treatments and configurations.
2.3. Measurement Indicators
2.3.1. Water Status and Plant Growth
Volumetric soil water content (VWC, %) in the core infiltration layer was monitored hourly using time-domain reflectometry sensors (RS-WS-N01-TR, Campbell Scientific, Logan, UT, USA) installed 10 cm beneath the superfine fiber. For DI and FI, VWC was monitored at 10 cm below the ground surface. Daily analysis used the mean value at 06:00 from two sensors per replicate. In addition, the minimum volumetric soil water content (VWCmin) during each irrigation cycle was calculated to represent the lowest soil moisture condition experienced by the vines. For W1, the VWC sensor was installed 10 cm below the soil surface, whereas for W2, in which the wick was buried at a depth of 10 cm, the sensor was positioned 20 cm below the surface. These depths were selected to monitor soil-moisture dynamics immediately beneath the core wetting zone of each wick configuration and within the main active root zone of the grapevines.
Predawn leaf water potential (Ψpd, MPa) was determined using a pressure chamber (Model 1000, PMS Instrument Co., Yinchuan, Ningxia, China). On each sampling date, mature leaves from the shaded mid-canopy of grapevine were collected at 05:00, sealed in plastic bags, and measured immediately for Ψpd. The minimum predawn leaf water potential (Ψpdmin) was further identified from all measurement dates to characterize the most severe plant water stress condition.
2.3.2. Fruit Growth and Physicochemical Traits
Lateral shoot growth (LSG, cm) was calculated from tagged shoot length measurements. For each treatment, vine-level measurements were first averaged within each bucket replicate. Nine marked berries per treatment were measured with vernier calipers at 10-day intervals to determine the following parameters: transverse diameter (TD, mm), longitudinal diameter (LD, mm), and berry shape index (BSI, dimensionless), calculated as the LD/TD ratio. Berry weight (BW, g) was assessed by randomly selecting 45 berries per replicate in 2018 and 27 berries per replicate in 2019 for weighing. Total soluble solids content (TSSs, %) was measured with a digital refractometer on berries with consistent coloration across treatments, and mean values were calculated. Titratable acidity (TA, %) was determined through acid–base titration using NaOH, with results expressed as tartaric acid equivalents [17]. The sugar–acid ratio (SAR, dimensionless) was calculated as TSS/TA.
2.3.3. Anthocyanin Concentration and Gene Expression
Anthocyanin content (AC, mg/100 g) was measured by spectrophotometer absorbance at the maximum absorption wavelength. The skins of ten grape berries were rapidly peeled and flash-frozen in liquid nitrogen. The frozen skins were ground into a fine powder, with 0.1 g used for anthocyanin extraction and 0.3 g for RNA extraction. Total RNA was extracted from 0.3 g of berry skins following the method described in [18]. Reverse transcription was performed using the PrimeScript RT reagent kit with gDNA Eraser (Takara Bio, Shiga, Japan) as per the manufacturer’s instructions. RT-qPCR was carried out on an ABI PRISM 7700 Sequence Detection System (Thermo Fisher Scientific, Waltham, MA, USA). Each 20-μL reaction included forward and reverse primers (0.4 μM each), 5 μL of 1:400-diluted cDNA (final input 200 ng), and 10 μL of Power SYBR Green Master Mix (Applied Biosystems, Foster City, CA, USA). The thermal cycling conditions were 95 °C for 10 min, followed by 40 cycles of 95 °C for 30 s, 58 °C for 30 s, and 65 °C for 60 s, with a melt curve analysis from 65 °C to 95 °C. KyActin1 (Accession No. AB073011) was used as the internal control. The primers used for RT-qPCR are listed in Table 2, and relative expression was calculated using the 2−ΔΔCt method. Three biological replicates per sample and three technical replicates per biological replicate were analyzed. The cumulative expressions of the core flavonoid-pathway genes F3′5′H, UFGT, GST, and VvMYBA1 were calculated from 50% veraison to three days before harvest (Table 2).
Table 2.
Specific primers for the reverse-transcription quantitative polymerase chain reaction of genes in the anthocyanin biosynthetic pathway.
2.3.4. Yield and Irrigation Water Use Efficiency
Fresh yield was determined by weighing all harvested berries from each biological replicate (bucket unit) and expressing yield as kg vine−1. Irrigation water use efficiency (IWUE, g vine−1 mm−1) was calculated as follows:
where Y represents fresh yield per vine (g vine−1; values are reported as kg vine−1 and converted to g for the IWUE calculation), and I represents the seasonal irrigation amount (mm). Seasonal rainfall is reported for climatic context but was not included in the IWUE denominator.
2.4. Integrated Benefits Assessment
An integrated Analytic Hierarchy Process–Entropy Weighting (AHP–EW) approach was used to combine expert-based agronomic priorities with objective information derived from the variability of the measured indicators. AHP was used to determine subjective indicator weights, whereas EW was used to determine data-driven objective weights. The combined weights were then used for comprehensive treatment scoring and ranking.
Indicator weights were determined as follows. Five experts with experience in irrigation engineering, grape cultivation, plant physiology/fruit quality, and statistical analysis independently completed pairwise-comparison matrices using Saaty’s 1–9 scale. The individual matrices were aggregated using the geometric mean to obtain the group AHP matrix. AHP weights (WA) were derived from the normalized principal eigenvector. Matrix consistency was evaluated using the consistency ratio (CR), with CR < 0.10 considered acceptable; the aggregated group matrix yielded a CR of 0.06. For EW, all indicators were first classified as positive or negative according to agronomic desirability and normalized to a range of 0–1. Entropy values and objective weights (WE) were then calculated from the normalized matrix. The final combined weight was calculated as Wi = (0.5WA + 0.5WE) and normalized so that the weights summed to 1. These weights supported the composite scoring and ranking analyses. Full formulas, matrices, normalization rules, and reproducibility details are provided in the Supplementary Equations (S1)–(S10).
2.5. Statistical Analysis
Statistical analyses were conducted using SPSS 21.0 software for Windows (SPSS Inc., Chicago, IL, USA). The independent irrigation replicate was considered the experimental unit (n = 3 per treatment), and subsamples within each replicate were averaged before analysis. Because the same experimental units were monitored in both 2018 and 2019, linear mixed-effects models were used. For final-harvest variables, treatment, year, and treatment × year were included as fixed effects, with the replicate irrigation unit as the subject/random effect and year as a repeated factor. For variables measured repeatedly during the growing season, sampling date was additionally included as a within-year repeated factor. Tukey-adjusted pairwise comparisons were used, with significance set at p < 0.05.
3. Results
3.1. Soil Moisture and Plant Water Potential
Across both years, VWC in the core infiltration layer showed clear treatment-related numerical differences among irrigation methods (Figure 2). In 2018, the average VWC over the entire growing season ranked as follows: W2 (14.2%) > W1 (13.7%) > DI (12.6%) > FI (11.7%). Compared to W1, W2 was 3.6% higher, exceeding DI and FI by 12.6% and 21.3%, respectively. In 2019, the ranking was W1 (10.2%) > DI (10.0%) > W2 (8.8%) > FI (8.2%). On this basis, W1 exceeded DI by 2.0% and FI by 24.3%. Under wicking infiltration irrigation, VWC increased gradually following irrigation and decreased slowly during drying, resulting in smaller fluctuations and greater root-zone stability. In contrast, DI and FI resulted in sharp peaks and rapid declines, highlighting the ability of wicking infiltration irrigation to sustain soil moisture and mitigate drought stress. In addition, mean VWC and VWCmin decreased progressively with irrigation quotas (W1 > W1-2/3 > W1-1/3). While VWC was generally higher in 2018 than in 2019, likely due to differences in rainfall, the consistent advantage of wicking infiltration irrigation in soil moisture persisted across years and treatments.
Interestingly, we observed treatment-related differences across irrigation treatments during the 2018 and 2019 growing seasons. The W1 treatment consistently exhibited the highest values (8.0% and 6.91%, respectively), indicating less stressed soil moisture conditions. The FI consistently maintained the lowest levels (5.8% in 2018 and 5.56% in 2019), indicating its root zone experienced the most severe drought stress. This suggests that wicking infiltration irrigation gave higher VWCmin than FI.
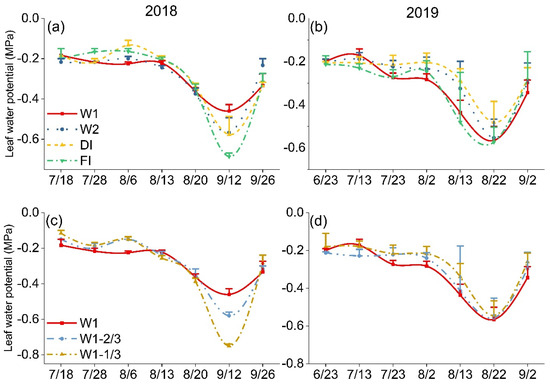
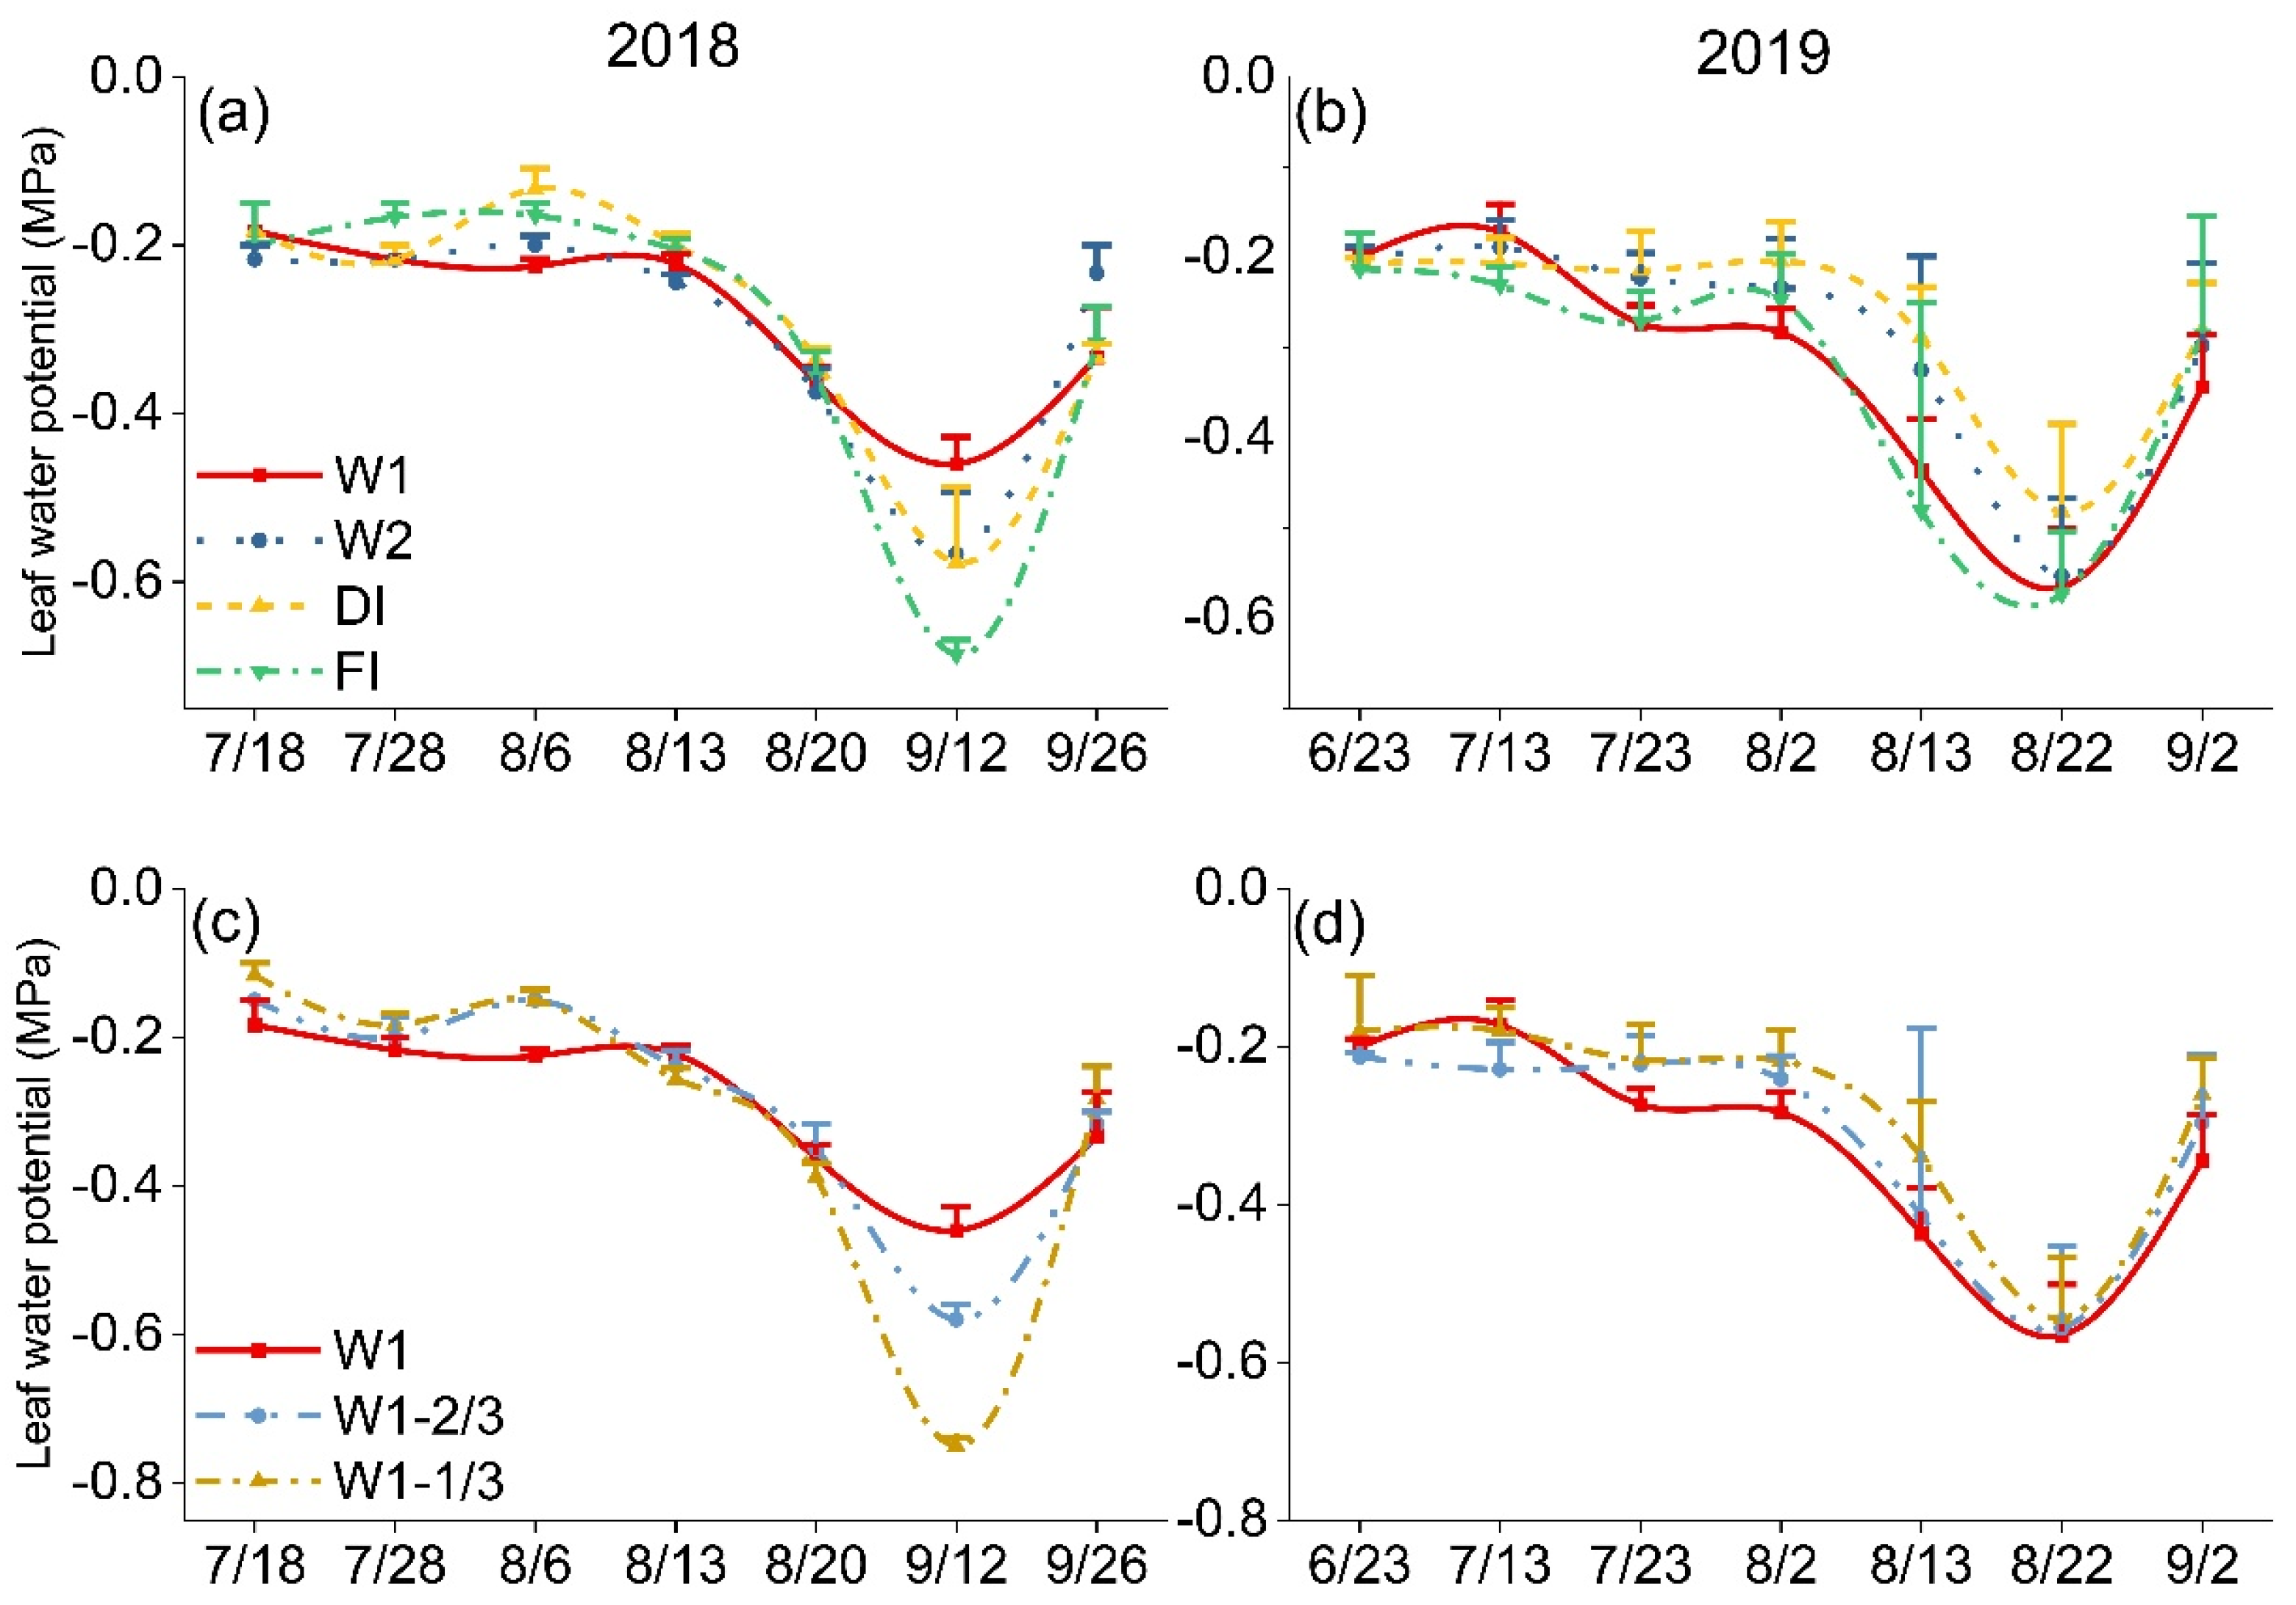
Figure 3 shows the temporal dynamics of Ψpd under different irrigation methods. Across both years, Ψpd in all irrigation treatments showed a seasonal decline from early-to-late summer, reaching a minimum around veraison, followed by partial recovery after rainfall events. Overall, wicking infiltration irrigation, especially W1, maintained higher Ψpd and dampened intra-seasonal variability compared with DI and FI, whereas reducing water supply drove more negative Ψpd, indicating stronger stress. In 2018, Ψpd generally remained above −0.25 MPa from 18 July to 13 August, and then declined to a minimum on 12 September, followed by a rainfall-induced rebound on 26 September. A similar seasonal pattern was observed in 2019. Under the wicking infiltration irrigation gradient, reducing the supply from W1 to W1-1/3 produced progressively more negative minima, −0.46, −0.58, and −0.75 MPa in 2018, with a similar trend observed in 2019.
Figure 2.
Temporal dynamics of VWC under different irrigation methods during the growing seasons of 2018 and 2019. (a,b) Comparison among W1, W2, DI, and FI; (c,d) gradient trial of wick infiltration with W1, W1-2/3, and W1-1/3.
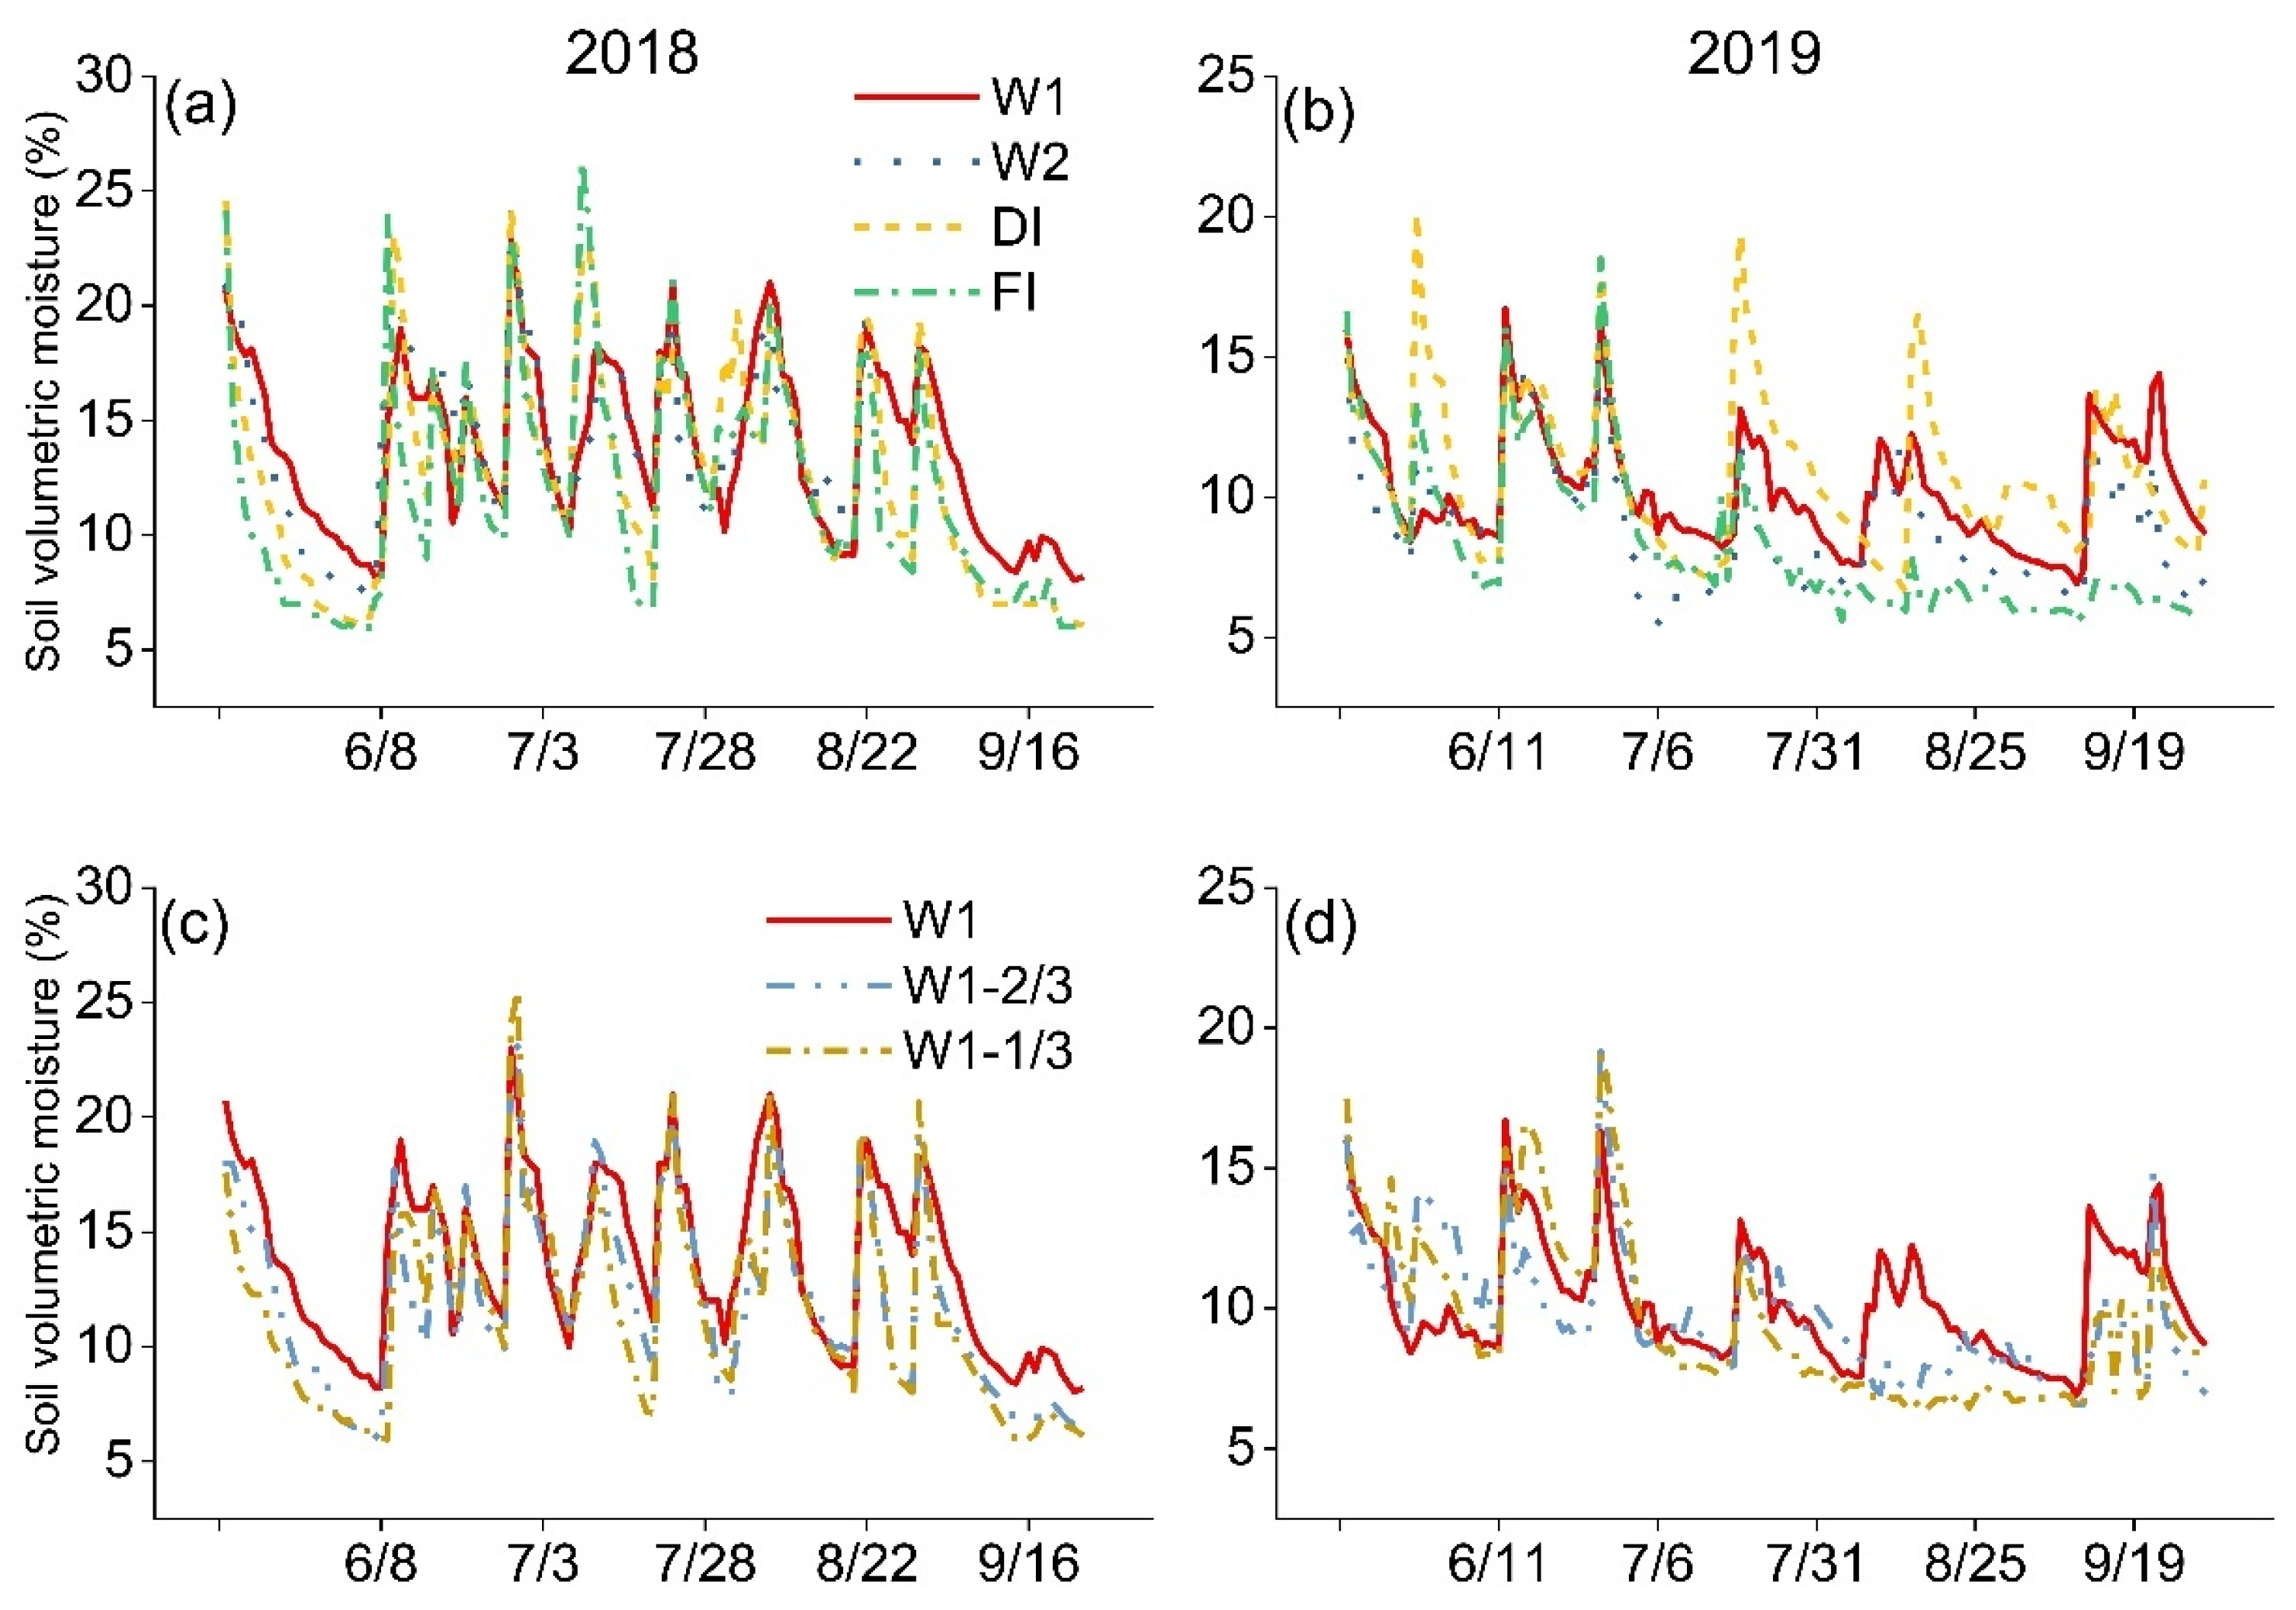
Figure 3.
Temporal dynamics of Ψpd under different irrigation methods during the 2018 and 2019 growing seasons. (a,b) Comparison among W1, W2, DI, and FI; (c,d) gradient trial of wick infiltration with W1, W1-2/3, and W1-1/3.
Notably, different irrigation methods exerted regulatory effects on Ψpdmin. In 2018, W1 exhibited the strongest mitigation capacity for Ψpdmin, while in 2019, DI and W2 demonstrated strong mitigation capacity for Ψpdmin. Similarly, FI showed the weakest mitigation capacity for Ψpdmin (−0.69 in 2018 and −0.57 in 2019).
3.2. Vegetative Growth and Berry Development
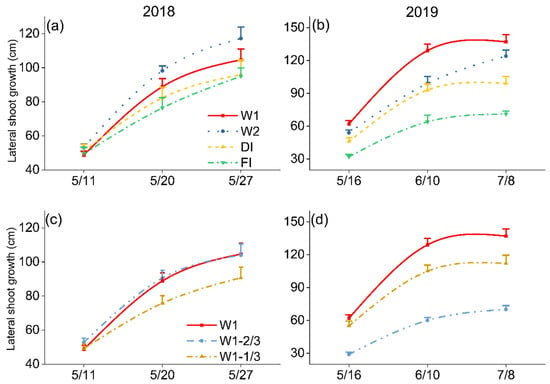
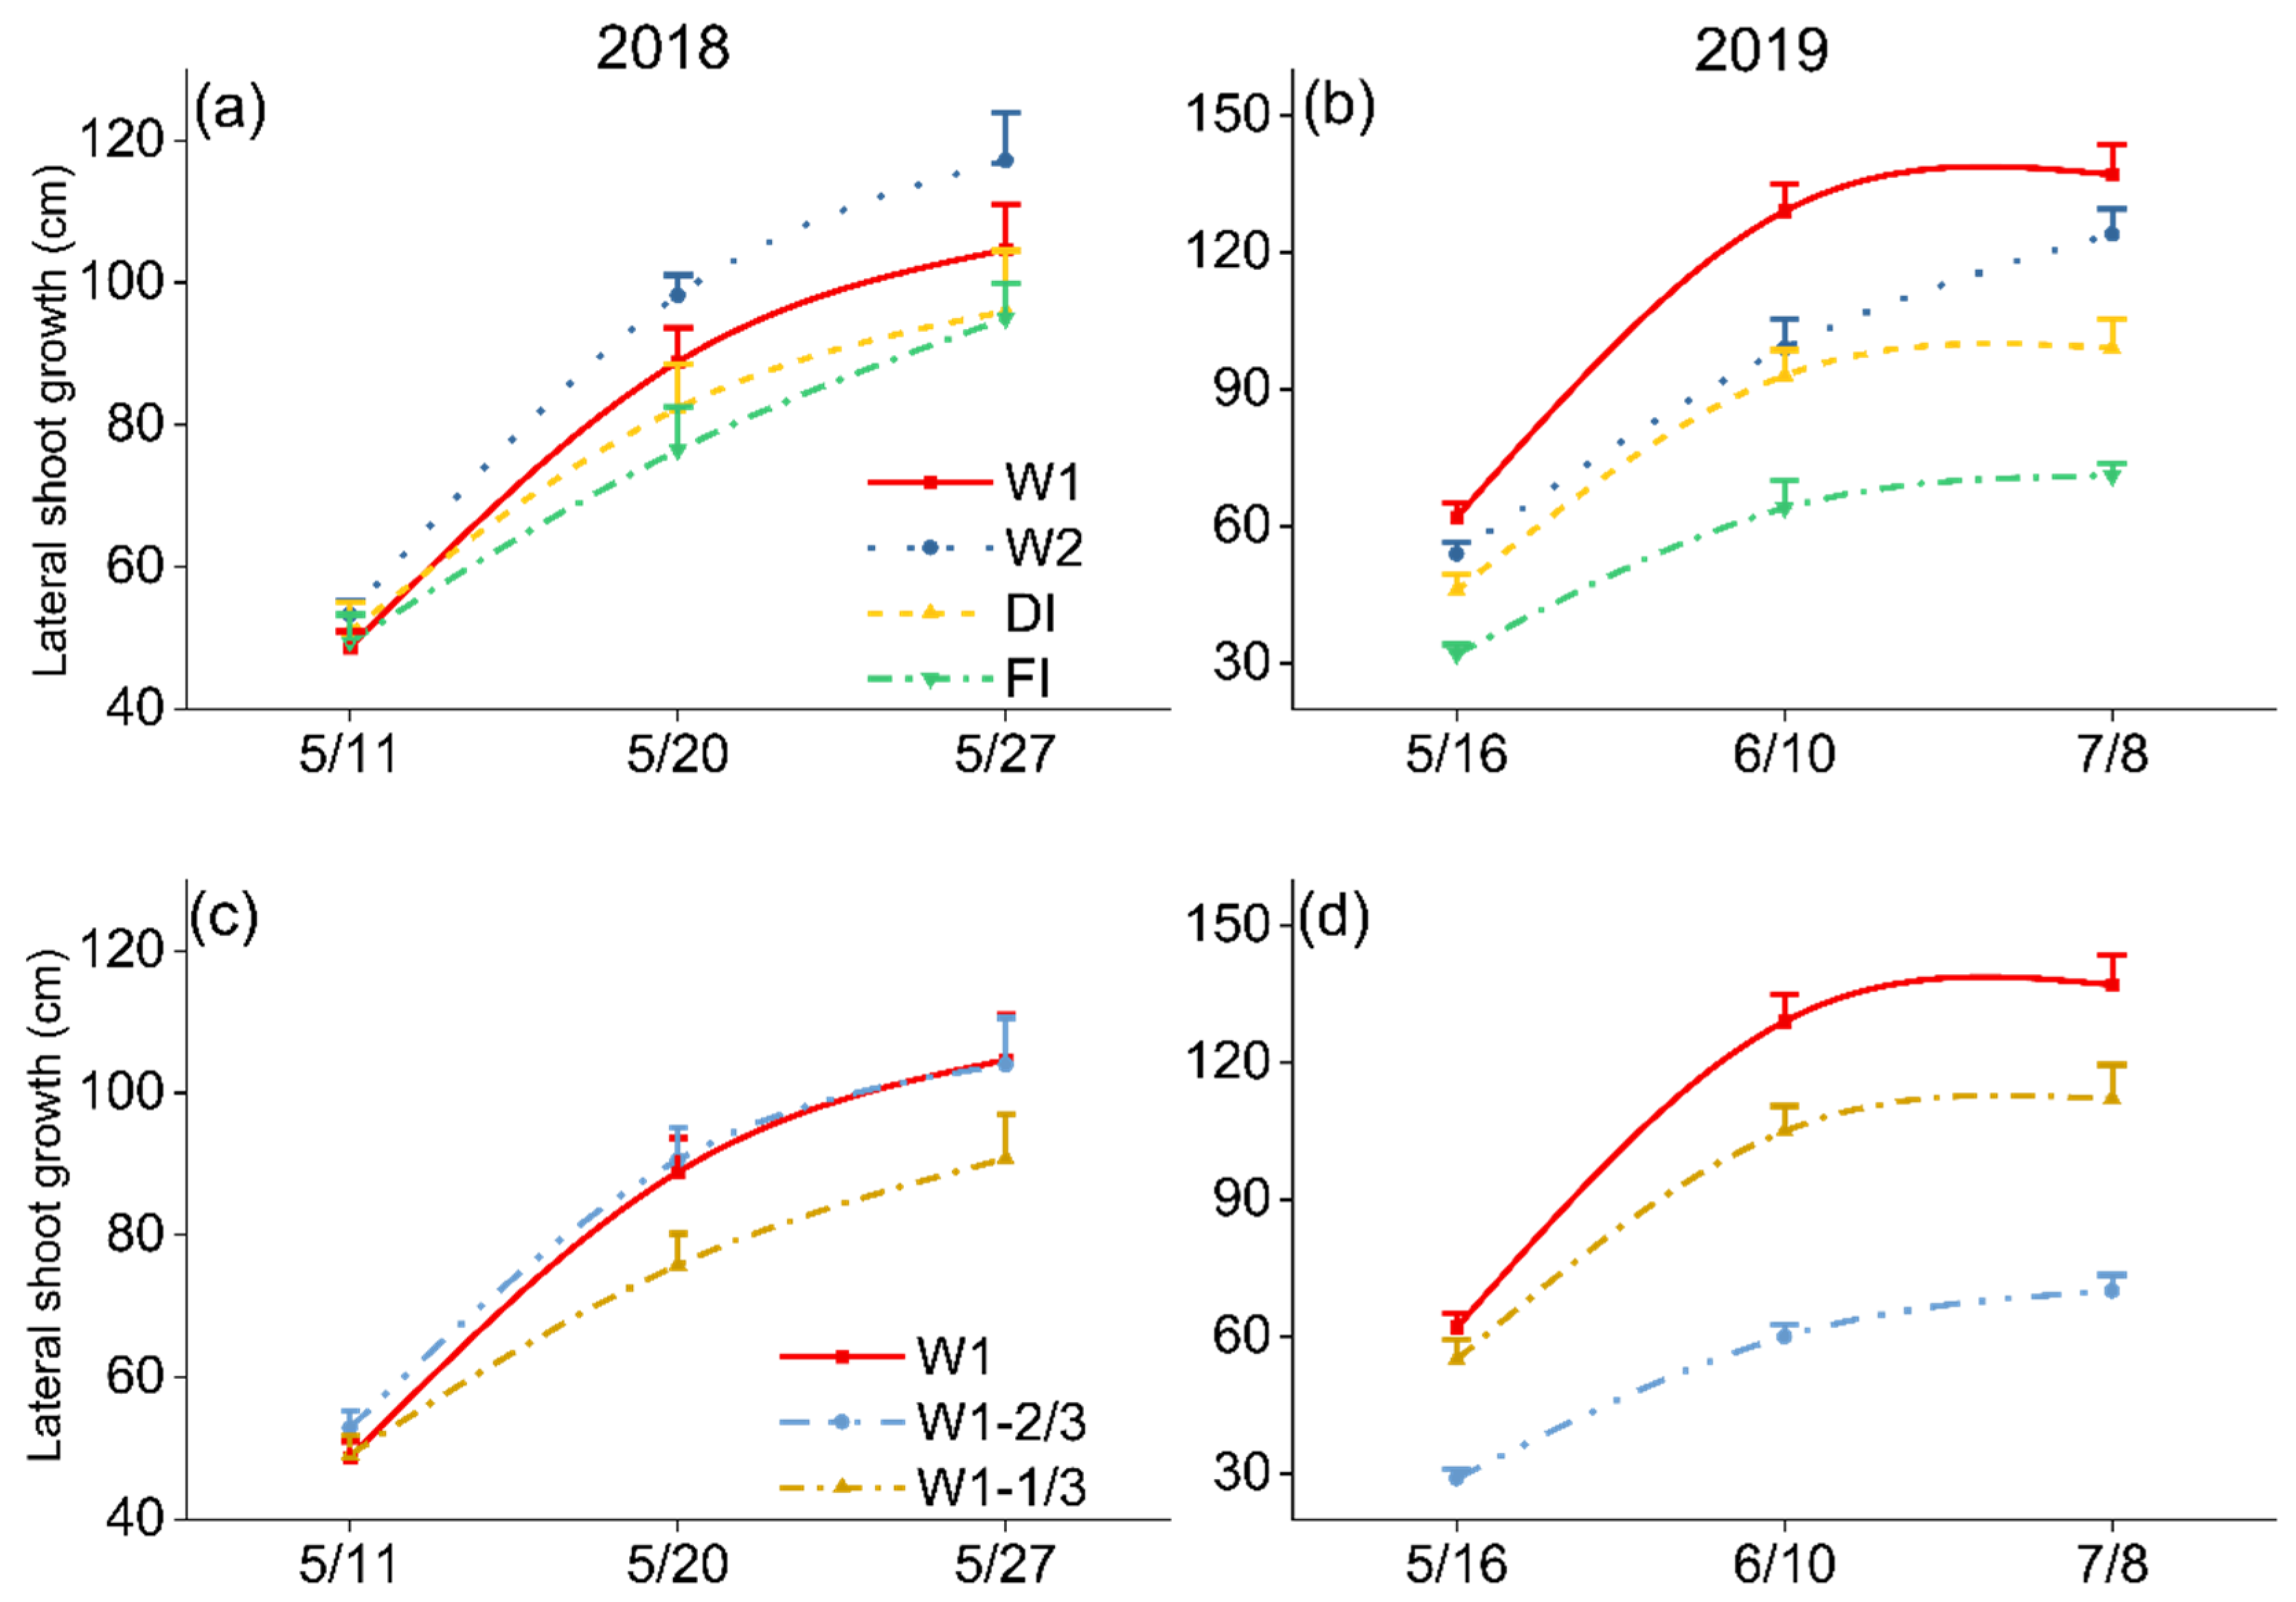
Lateral shoot growth increased rapidly during the early growing season and differed among irrigation treatments (Figure 4). Across the two years, W1 and W2 generally showed numerically greater LSG than DI and FI, although the relative ranking of W1 and W2 varied between years. Under the reduced-irrigation treatments, decreasing water supply generally reduced vegetative growth, with some year-to-year variation.
Figure 4.
Temporal dynamics of LSG under different irrigation methods during the 2018 and 2019 growing seasons. (a,b) Comparison among W1, W2, DI, and FI; (c,d) gradient trial of surface wick infiltration with W1, W1-2/3, W1-1/3.
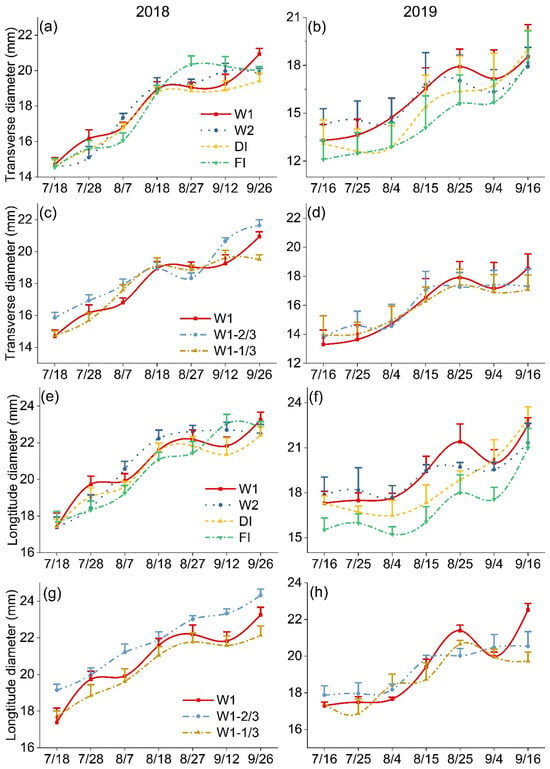
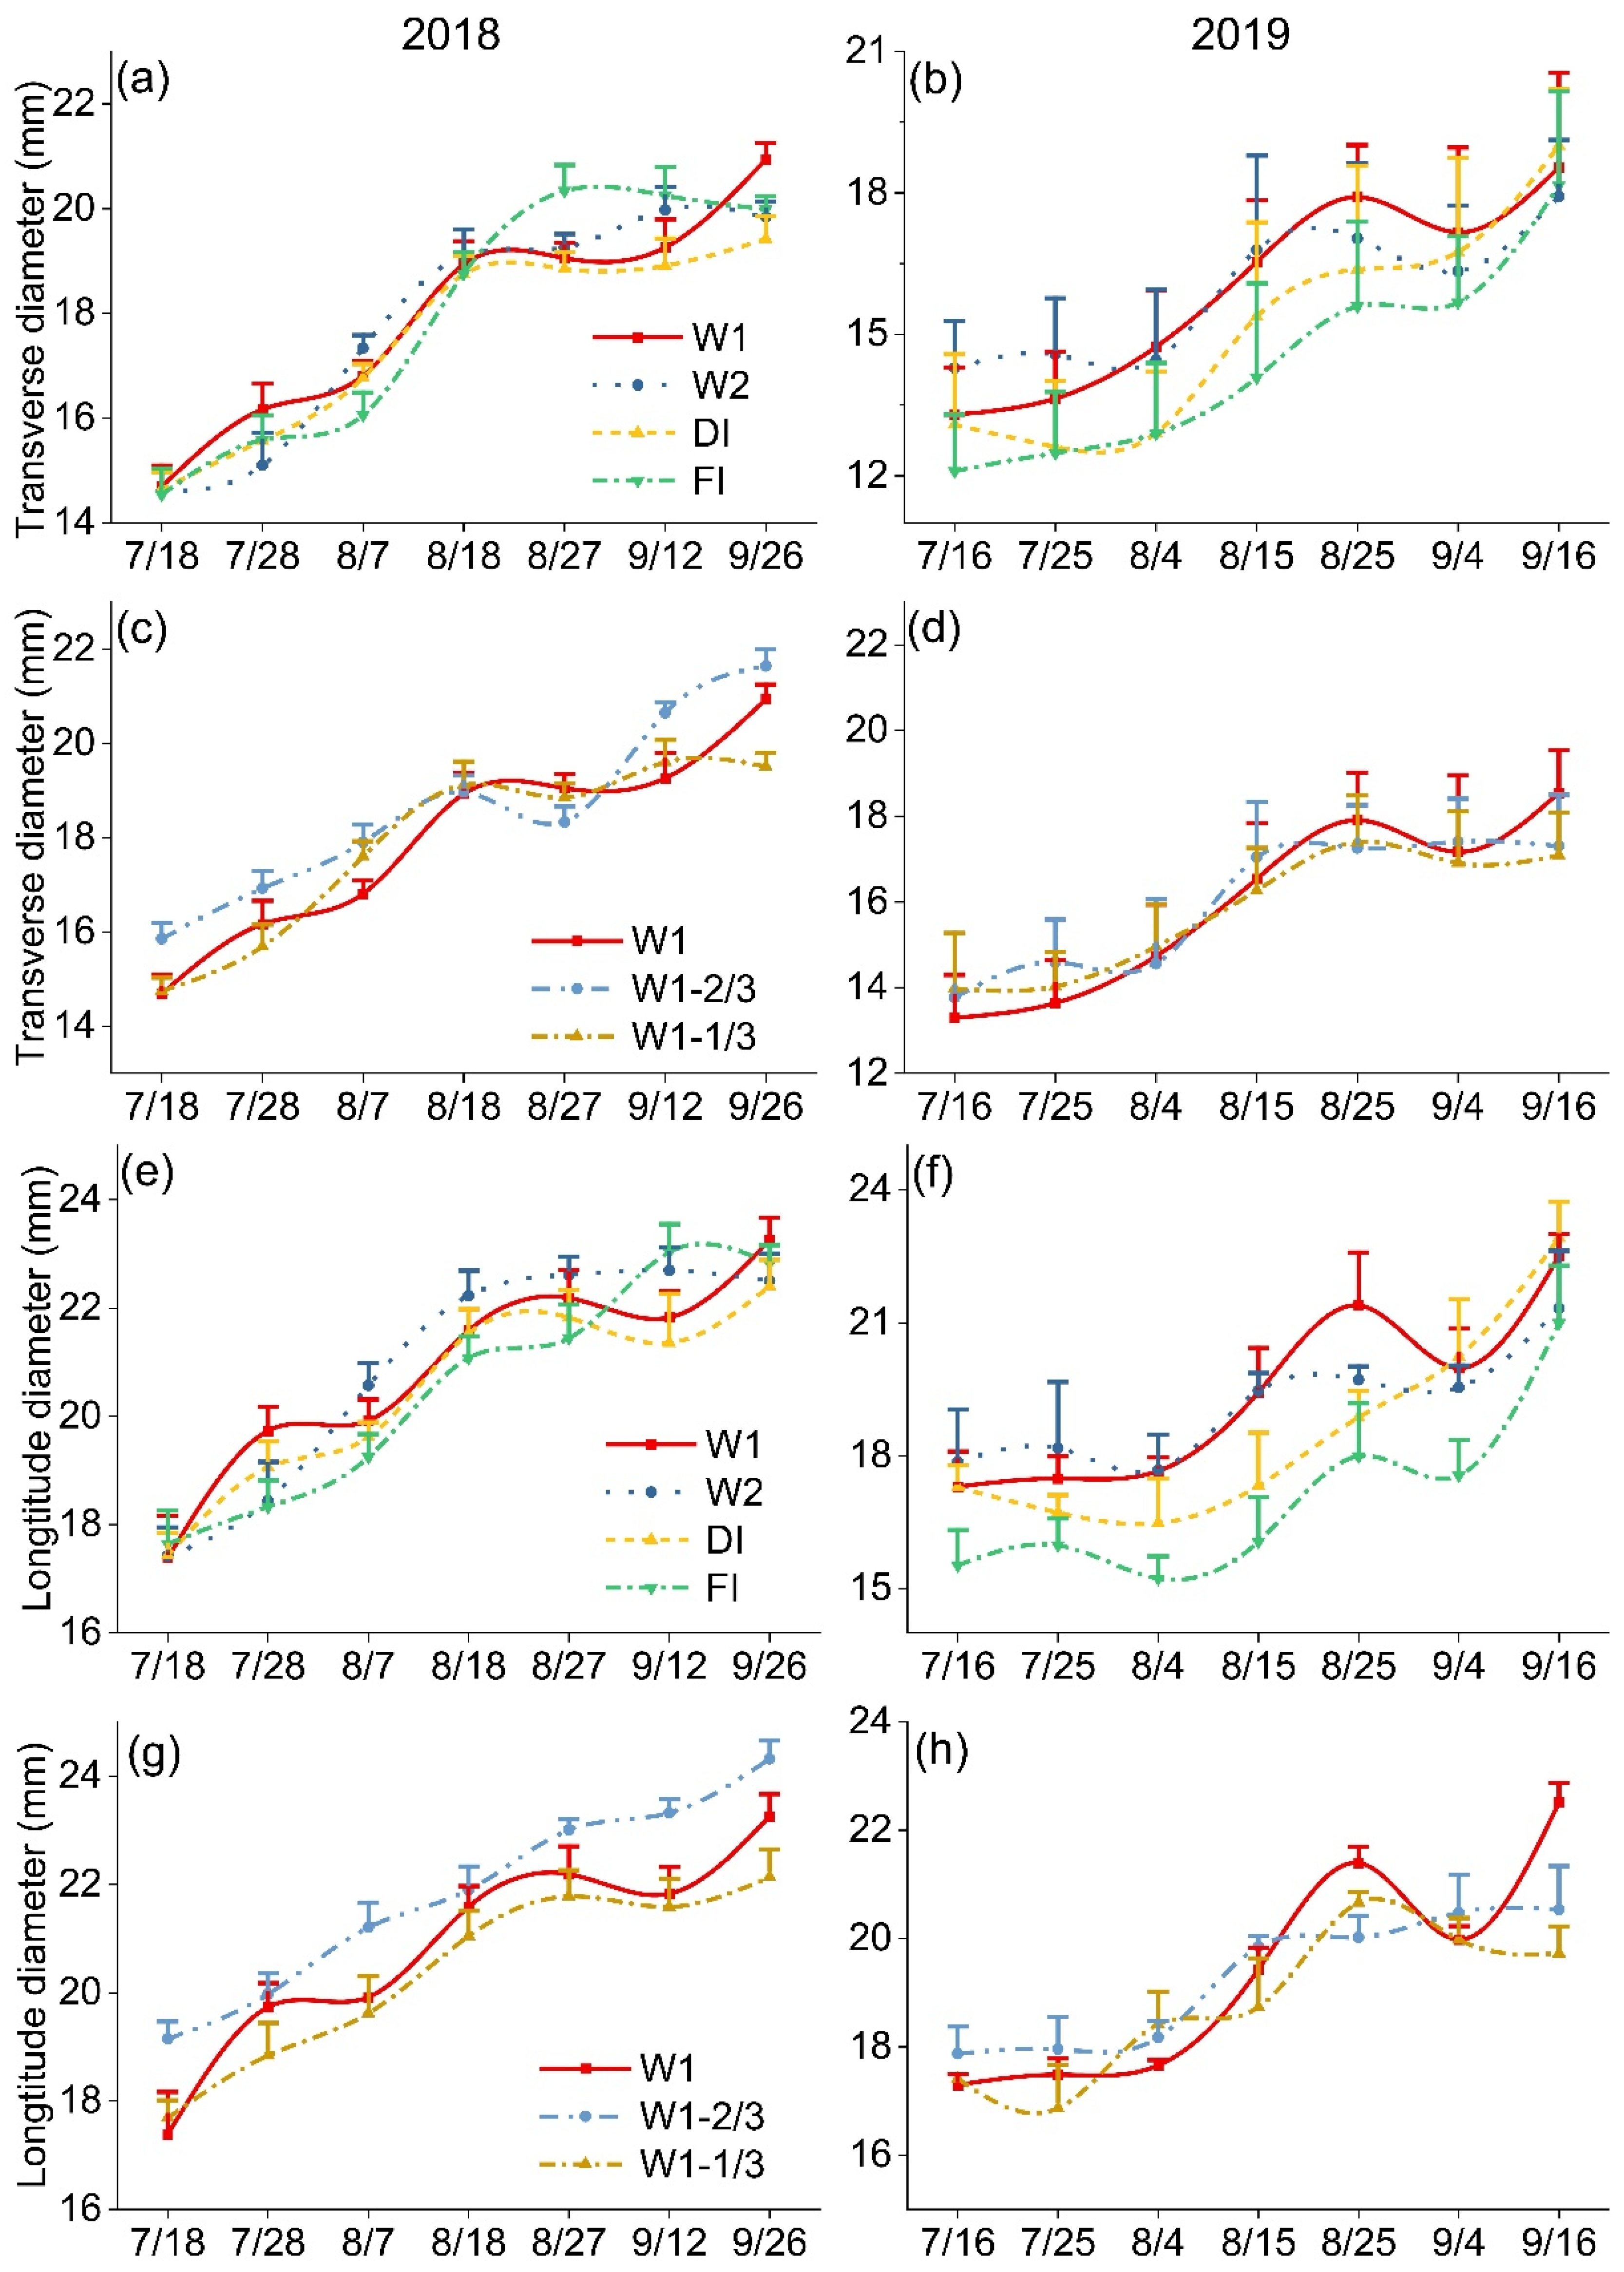
Figure 5 shows berry growth parameters under different irrigation methods. Overall, berry size increased as harvest approached across all treatments. When the system operated normally, wicking infiltration irrigation maintained larger and more stable berry dimensions compared to DI and FI. In both years, TD increased steadily toward harvest. In 2018, TD reached about 21 mm under W1, and was slightly larger than 20 mm under W2 and FI; however, FI declined to 19 mm by harvest, indicating greater sensitivity to water deficit. In late August 2019, the temporary decline in W1 and W2 coincided with capillary blockage but recovered after cleaning. Across both seasons, W2 and W1-2/3 supply maintained widths above 20 mm, whereas W1-1/3 supply often fell below 19 mm and exhibited late-season shriveling. LD followed a similar trajectory.
Figure 5.
Effects of different irrigation methods on berry growth in 2018 and 2019. (a,b) and (e,f) show TD and LD among different irrigation treatments, respectively; (c,d) and (g,h) show TD and LD from surface capillary permeation gradient tests, respectively.
At maturity, berries exhibit a more rounded shape with small differences across treatments and limited sensitivity to reduced irrigation (Table 3). In 2019, there was slightly higher BSI than in 2018, likely due to wick aging/clogging and seasonal water management, but this did not change the relative advantage (higher BSI) of wicking infiltration irrigation over DI or FI. Throughout the 2018 season, the BSI ranged from 1.10 to 1.21. By pre-harvest on September 26, wicking infiltration irrigation had BSI values ranging from 1.11 to 1.13, slightly lower or comparable to DI/FI (1.14–1.15), with most differences being non-significant. The gradient effect indicates that under conditions without severe stress, moderate water deficiency has a relatively low impact on fruit shape. In 2019, at matched phenological stages, BSI was generally higher (mostly ≥1.15), and treatment separation was narrower. At pre-harvest on September 16, W1, W2, and DI clustered at 1.19–1.21 (group a), while FI, W1-1/3, and W1-2/3 were clustered at 1.15–1.18 (group b).
Table 3.
Effects of different irrigation methods on grape average berry shape index.
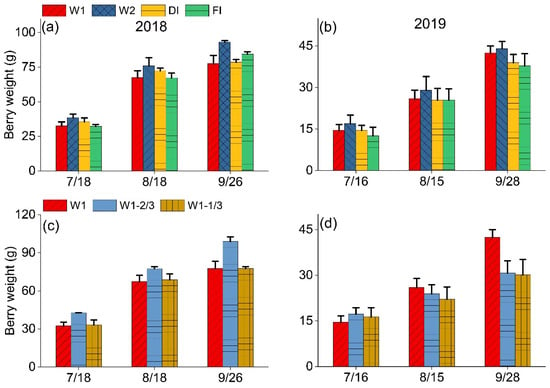
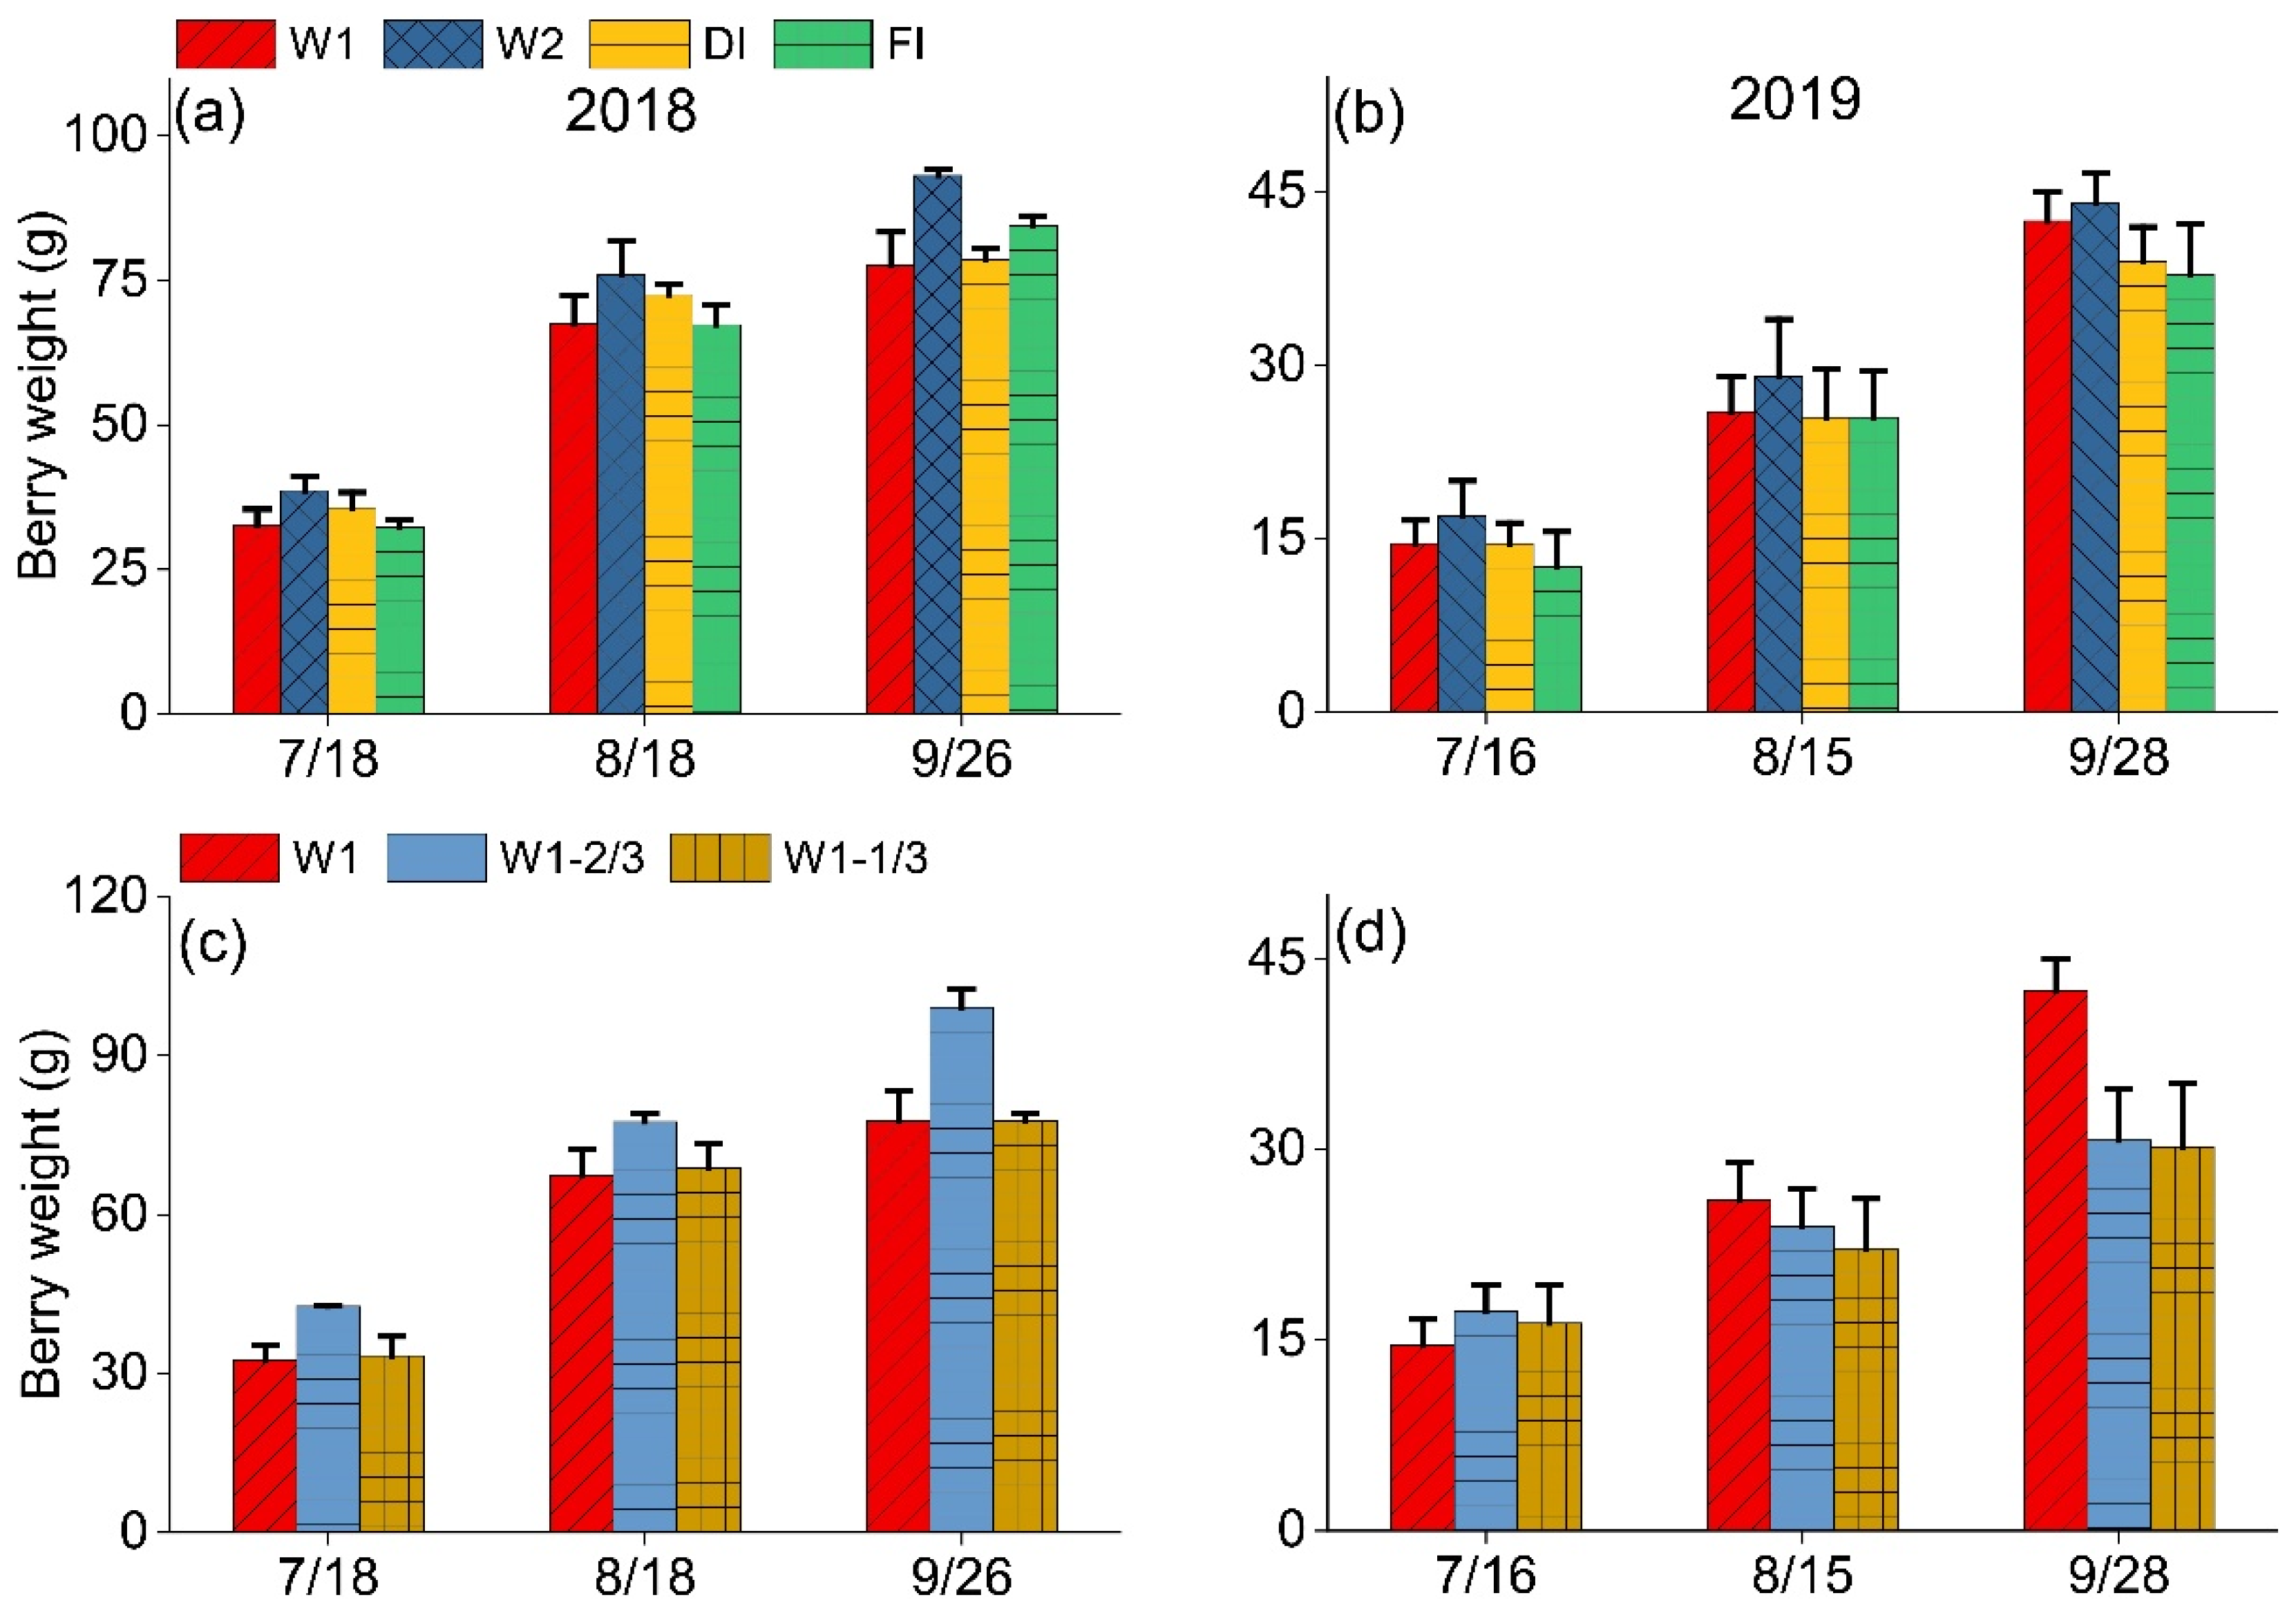
Wicking infiltration irrigation achieved BW comparable to or greater than DI and FI, with outcomes influenced by water-supply level (Figure 6). The results indicate that both absolute weight gain and seasonal weight gain in 2019 were lower than in 2018. However, compared to the DI and FI, the relative advantage of wicking infiltration irrigation persists. By pre-harvest in 2018, W2 reached 93.1 g, exceeding FI (84.4 g), DI (78.6 g), and W1 (77.5 g); seasonal gains (mid-July to late September) were W2 (54.5 g), FI (52.1 g), W1 (45.1 g), and DI (42.9 g). In the wicking infiltration irrigation gradient, BW for W1-2/3 was highest at 99.1 g, indicating a yield benefit without excessive water use. In 2019, gains were W1 > W2 > FI > DI.
Figure 6.
Effects of different irrigation methods on BW during the 2018 and 2019 growing seasons. (a,b) Comparison of BW among W1, W2, DI, and FI; (c,d) gradient trial of wicking infiltration irrigation with W1, W1-2/3, and W1-1/3.
3.3. Anthocyanin and Related Gene Expression
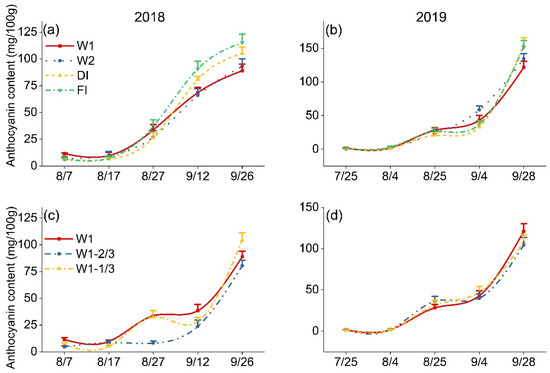
Figure 7 shows AC in grape berries under different irrigation methods during the growing season. Across both years, anthocyanin content increased rapidly after veraison and peaked at pre-harvest. Moderate water stress tended to enhance accumulation, although the magnitude of this effect varied by year and irrigation treatment. In 2018, by pre-harvest on 26 September, FI produced the highest content (115.0 mg·100 g−1), followed by DI (105.1 mg·100 g−1), whereas values under wicking infiltration irrigation were lower (W2: 93.0 and W1:88.9 mg·100 g−1, respectively). Most accumulation occurred between mid-August and late September; the higher values under FI coincided with a stronger water deficit. In contrast, in 2019, absolute levels were higher than in 2018, with DI and FI exceeding wicking infiltration irrigation (134.2 mg·100 g−1 in W2; 121.5 mg·100 g−1 in W1). In the wicking infiltration irrigation gradient trial, a moderate deficit promoted accumulation in 2018, as the W1-1/3 (104.2 mg·100 g−1) exceeded the W1 (88.9 mg·100 g−1); in 2019 the pattern reversed, with W1 supply being the highest (121.1 mg·100 g−1).
Figure 7.
Effects of different irrigation methods on AC in grape berries during the 2018 and 2019 growing seasons. (a,b) Comparison among W1, W2, DI, and FI; (c,d) gradient trial of surface wick infiltration with W1, W1-2/3, and W1-1/3.
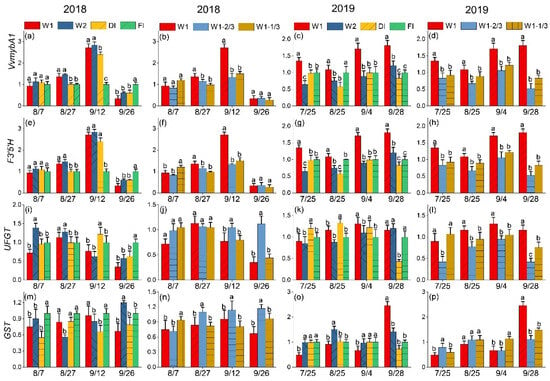
During the study period, transcript abundance of anthocyanin-pathway genes (the regulator VvMYBA1 and the structural genes F3′5′H, UFGT, and GST) increased from early veraison to peaks in September, broadly tracking the rapid post-veraison rise in berry anthocyanins (Figure 8). Irrigation regime and water-supply level consistently modulated expression levels, with the direction and magnitude of responses depending on the seasonal context and wick-system performance.
Figure 8.
Relative expression of key flavonoid pathway genes in grape berry skins under different irrigation methods during the 2018 and 2019 growing seasons. (a–d) VvMYBA1 expression under different irrigation regimes; (e–h) F3′5′H expression under different irrigation regimes. (i–l) UFGT expression under different irrigation regimes; (m–p) GST expression under different irrigation regimes. Different letters indicate significant differences at p < 0.05 according to Tukey’s test.
In 2018, at early veraison (7 and 27 August), VvMYBA1 and F3′5′H showed no significant differences among treatments. From 12 to 26 September, UFGT displayed the separation among treatments and largely followed the ranking of VvMYBA1, indicating transcriptional propagation from the regulator to the structural gene. GST tended to follow the pattern FI > W2 > W1 > DI. In W1, expression increased gradually through the season but declined before harvest.
Within the wicking infiltration irrigation water-level trial, pre-harvest expression generally ranked W1-2/3 ≥ W1 ≥ W1-1/3, with the strong dose effect for UFGT, suggesting that a moderate deficit (W1-2/3) promoted structural-gene activation under the 2018 conditions. In 2019, expression again increased toward harvest, but treatment separation shifted: on 28 September, VvMYBA1, F3′5′H, and GST were highest in W1, followed by W2 and FI, and were lowest in DI. UFGT was similar among W1, W2, and FI but remained lowest in DI.
3.4. Yield, Irrigation Water Use Efficiency, and Fruit Quality
In both years, W2 achieved higher IWUE values than DI and FI (Table 4). In 2018, W1-2/3 produced the highest yield (13.0 kg vine−1), exceeding that of DI by 71.1%, while maintaining high IWUE (162.5 g vine−1 mm−1). In 2019, W1-2/3 again achieved the top yield (16.5 kg vine−1) and high IWUE (206.2 g vine−1 mm−1), with W2 close behind in yield (16.3 kg vine−1; 135.8 g vine−1 mm−1). By contrast, reducing irrigation supply to one-third maximized IWUE (200.0 and 315.0 g vine−1 mm−1 in 2018 and 2019, respectively) but reduced yield relative to W1-2/3.
Table 4.
Effects of different irrigation methods on fresh yield and irrigation water use efficiency.
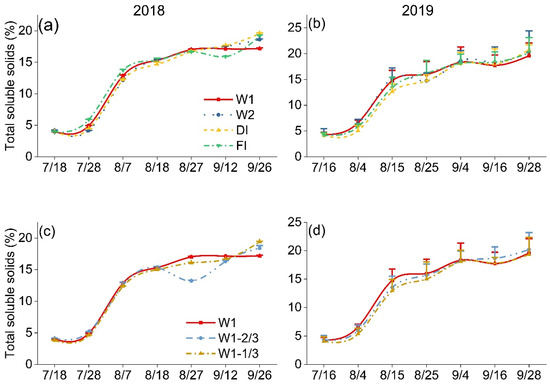
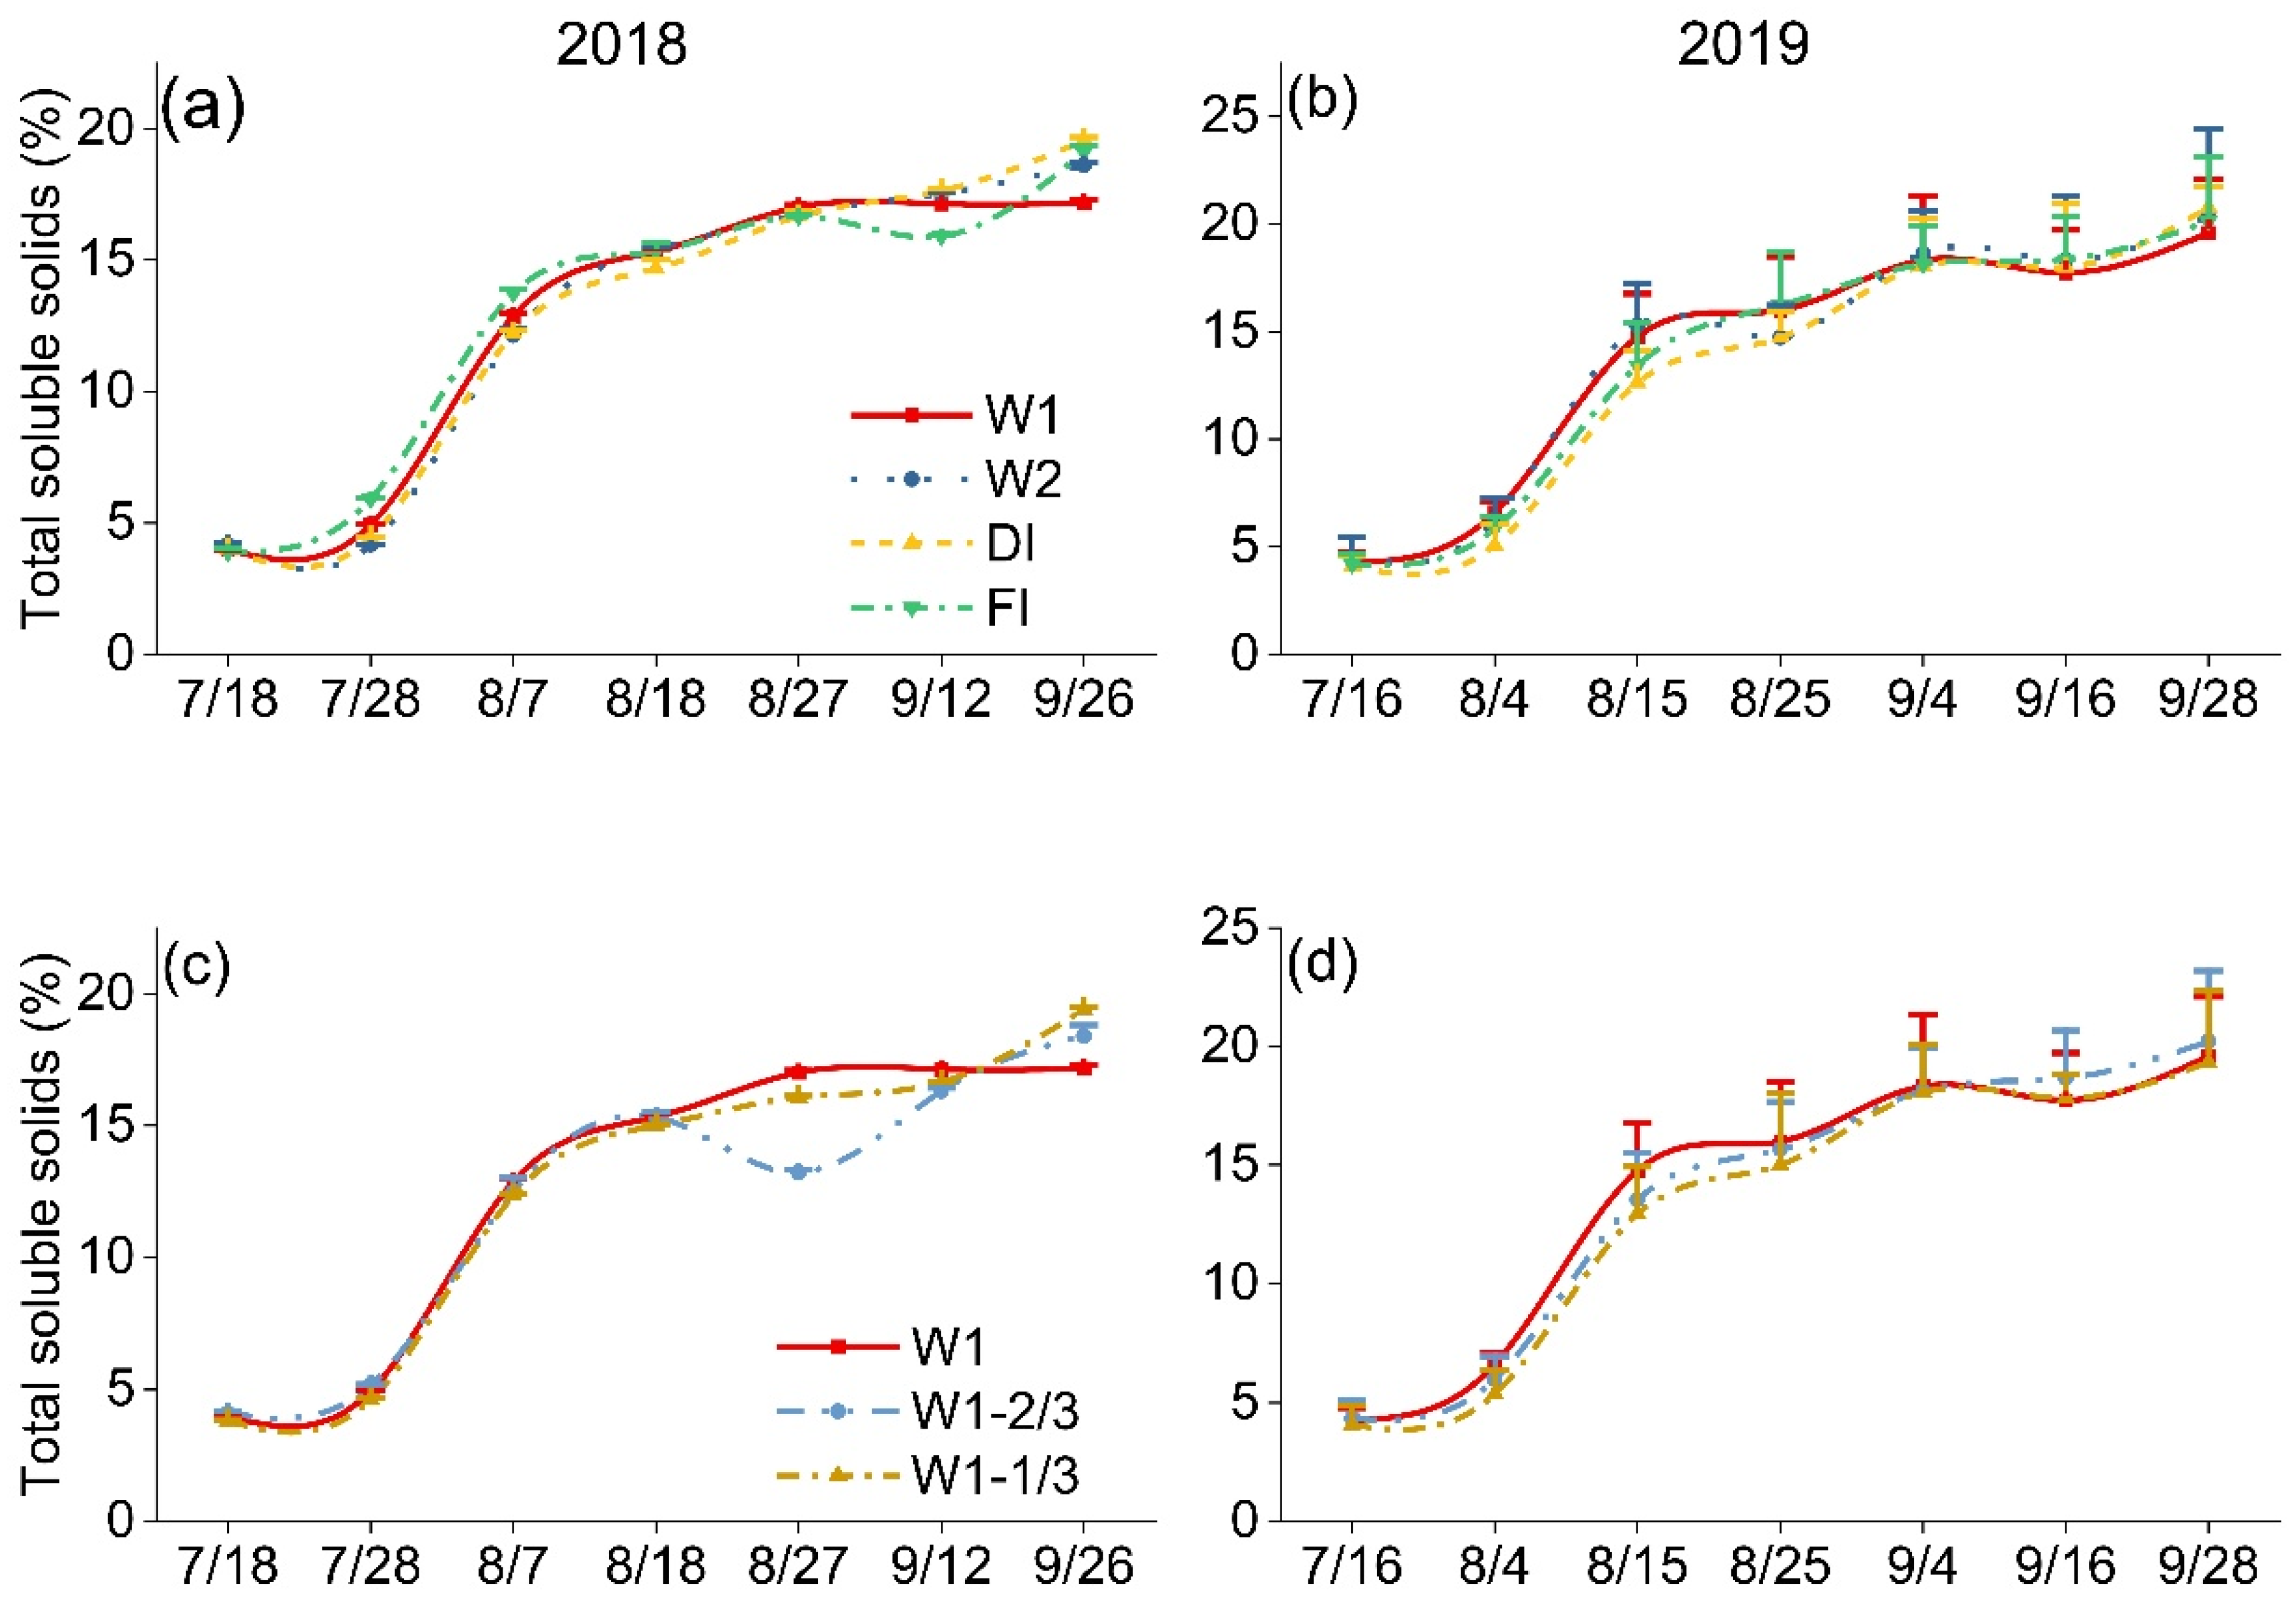
TSSs increased rapidly after veraison and then approached a plateau in both years (Figure 9). Treatment differences were more evident in 2018, when DI and FI showed higher late-season TSSs than the full-supply wicking treatments, whereas reduced irrigation tended to increase TSSs within the surface-wick treatments. In 2019, treatment differences were smaller and the ranking among irrigation levels differed from that in 2018, indicating a year-dependent response of TSSs to irrigation regime.
Figure 9.
Effects of different irrigation methods on TSSs during the 2018 and 2019 growing seasons. (a,b) Comparison among W1, W2, DI, and FI; (c,d) gradient trial of surface wick infiltration with W1, W1-2/3, and W1-1/3.
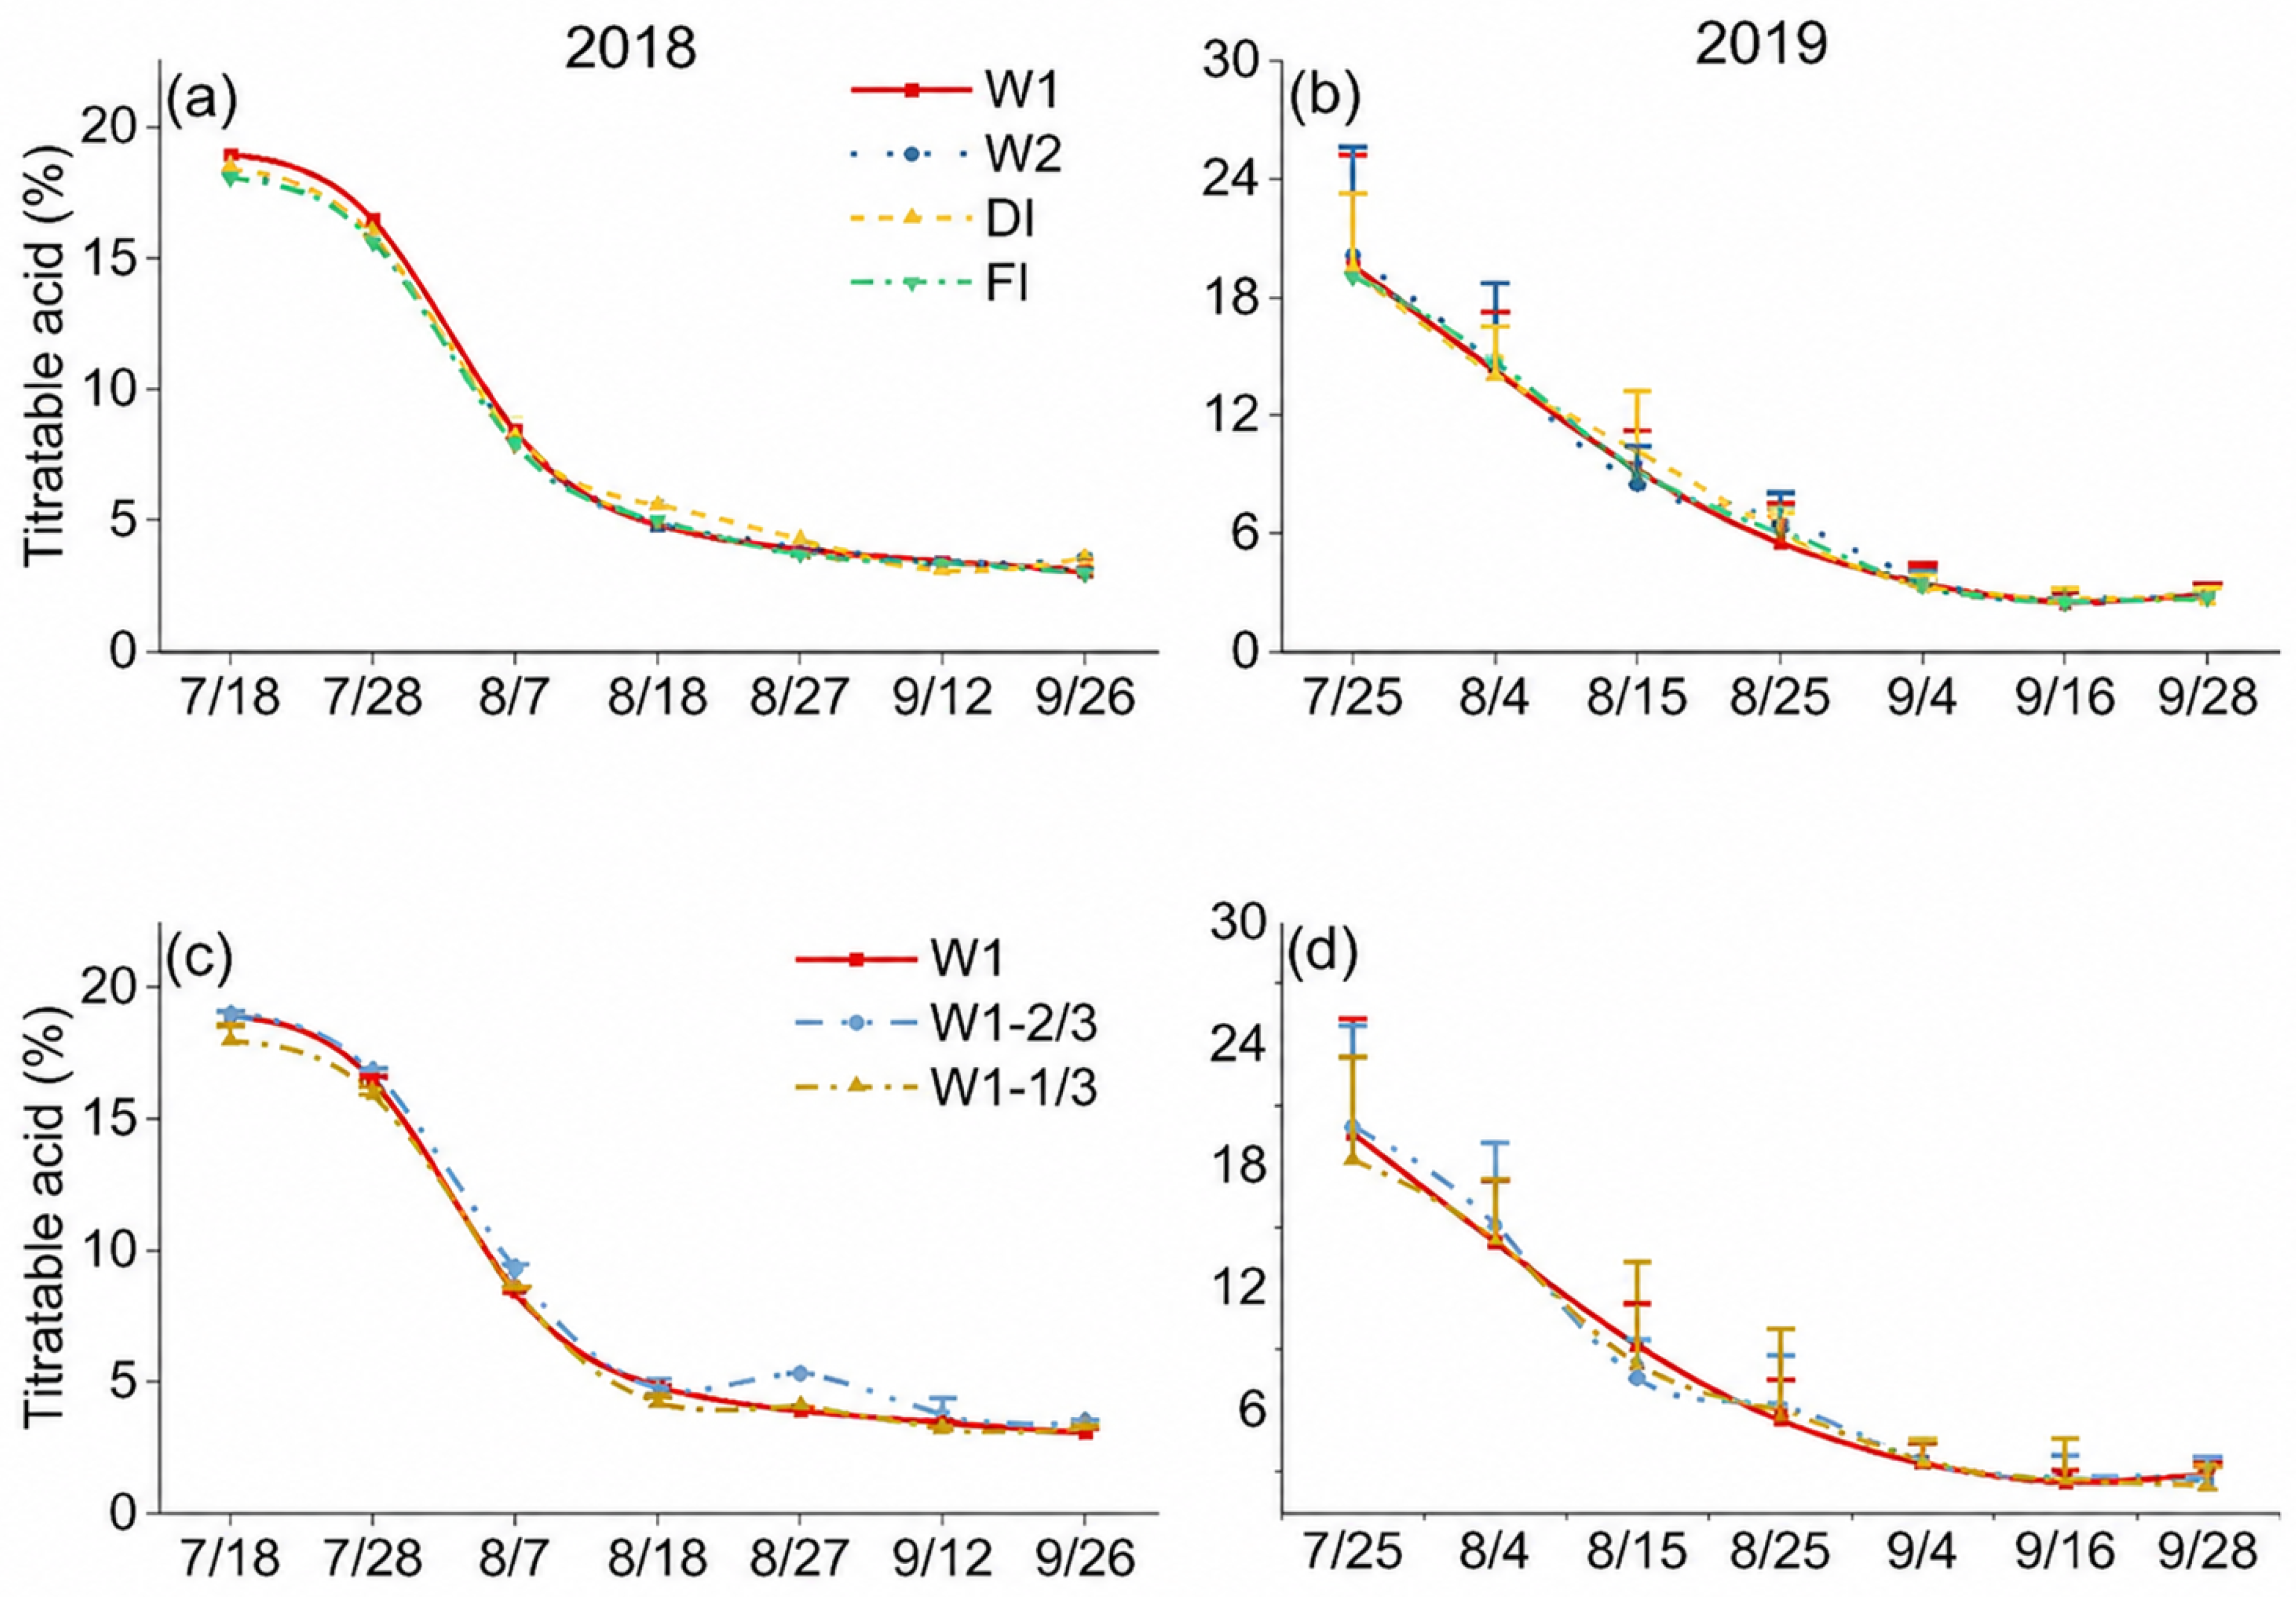
In both years, TA peaked around early veraison and then declined steadily toward harvest (Figure 10). Adequate water supply was associated with higher TA values at veraison, whereas water deficit accelerated the decline; however, late-season differences diminished under the prevailing annual conditions.
On 18 July 2018 (early veraison), TA approached 19% under W1 and was slightly higher under W2 and DI than under FI. By pre-harvest on 26 September 2018, TA had fallen to approximately 3–4%, with FI being the lowest, consistent with the stronger deficit. Within the wicking infiltration irrigation gradient, the W1-2/3 supply (3.4%) exceeded both the full supply (3.0%) and the W1-1/3 supply (3.2%), indicating that a moderate reduction maintained TA. In 2019, maximum TA occurred on 25 July, with W2 (20.1%) marginally higher than other treatments (approximately 19%). By pre-harvest on 28 September, values converged to 2.6–2.9% with minimal differences among wicking infiltration irrigation, DI, and FI.
Figure 10.
Effects of different irrigation methods on TA during the 2018 and 2019 growing seasons. (a,b) Comparison among W1, W2, DI, and FI; (c,d) gradient trial of W1, W1-2/3, and W1-1/3.
The SAR varied among irrigation treatments and years (Table 5). In 2018, FI showed the highest ratio (6.45), which was significantly higher than those of the other treatments, which ranged from 5.27 to 6.06. In 2019, the ratios were generally higher than those in 2018, ranging from 7.13 to 8.05, with W1-1/3 showing the highest numerical value (8.05). However, no significant differences were detected among treatments in 2019.
Table 5.
Effects of different irrigation methods on the ratio of soluble solids and acids.
3.5. Comprehensive Evaluation Based on Combined Weight
The AHP-EW analysis was employed to determine subjective and objective weights, respectively, and the comprehensive weight was derived using Formula (S10) (Table 6). The results indicate that yield and IWUE-related indicators exerted the strongest influence in both years of evaluation. In 2018, yield (0.126) and IWUE (0.0844) were the top two contributing factors, followed by BW (0.06) and VWCmin (0.054). Berry morphological traits made moderate contributions, whereas genetic traits and TA had relatively low weights. The overall weighting pattern remained largely stable in 2019, with yield (0.119) and IWUE (0.086) retaining the highest weights, while Ψpdmin (0.066) and SAR (0.062) also showed substantial importance.
Table 6.
Weight of indicators generated by AHP and EW.
A comprehensive evaluation of six irrigation treatments was conducted using a combined AHP–EW weighting approach. Overall, wicking infiltration irrigation regimes achieved higher integrated scores by simultaneously maintaining fruit quality, water-use efficiency, and stable physiological conditions. Based on the cumulative comprehensive scores over two years, W2 achieved the highest score (1.22) and was identified as the optimal treatment. It was followed by W1-2/3 (1.13), W1 (0.96), DI (0.81), FI (0.73) and W1-1/3 (0.48). The W2 regime scored approximately 67.1% higher than FI, indicating superior integrated performance according to the AHP–EW assessment. In 2018, W1-2/3 obtained the highest overall score, mainly because of its yield and IWUE. In contrast, W2 balanced yield and quality, whereas W1-1/3 maximized IWUE at the expense of yield and fruit composition. FI and DI displayed some quality or physiological advantages but weaker overall efficiency. In 2019, W2 achieved the highest annual composite score, not because it excelled in any single trait, but due to its consistent performance across multiple indicators, including soil moisture, physiological water status, berry quality, and water-use efficiency. In addition, W1-2/3 remained a competitive water-saving alternative, driven primarily by high water-use efficiency and yields.
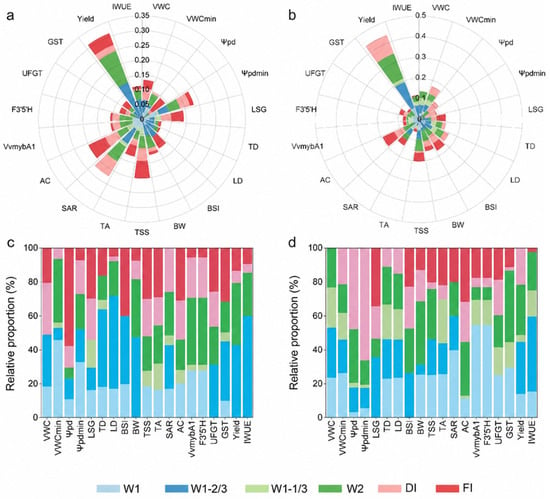
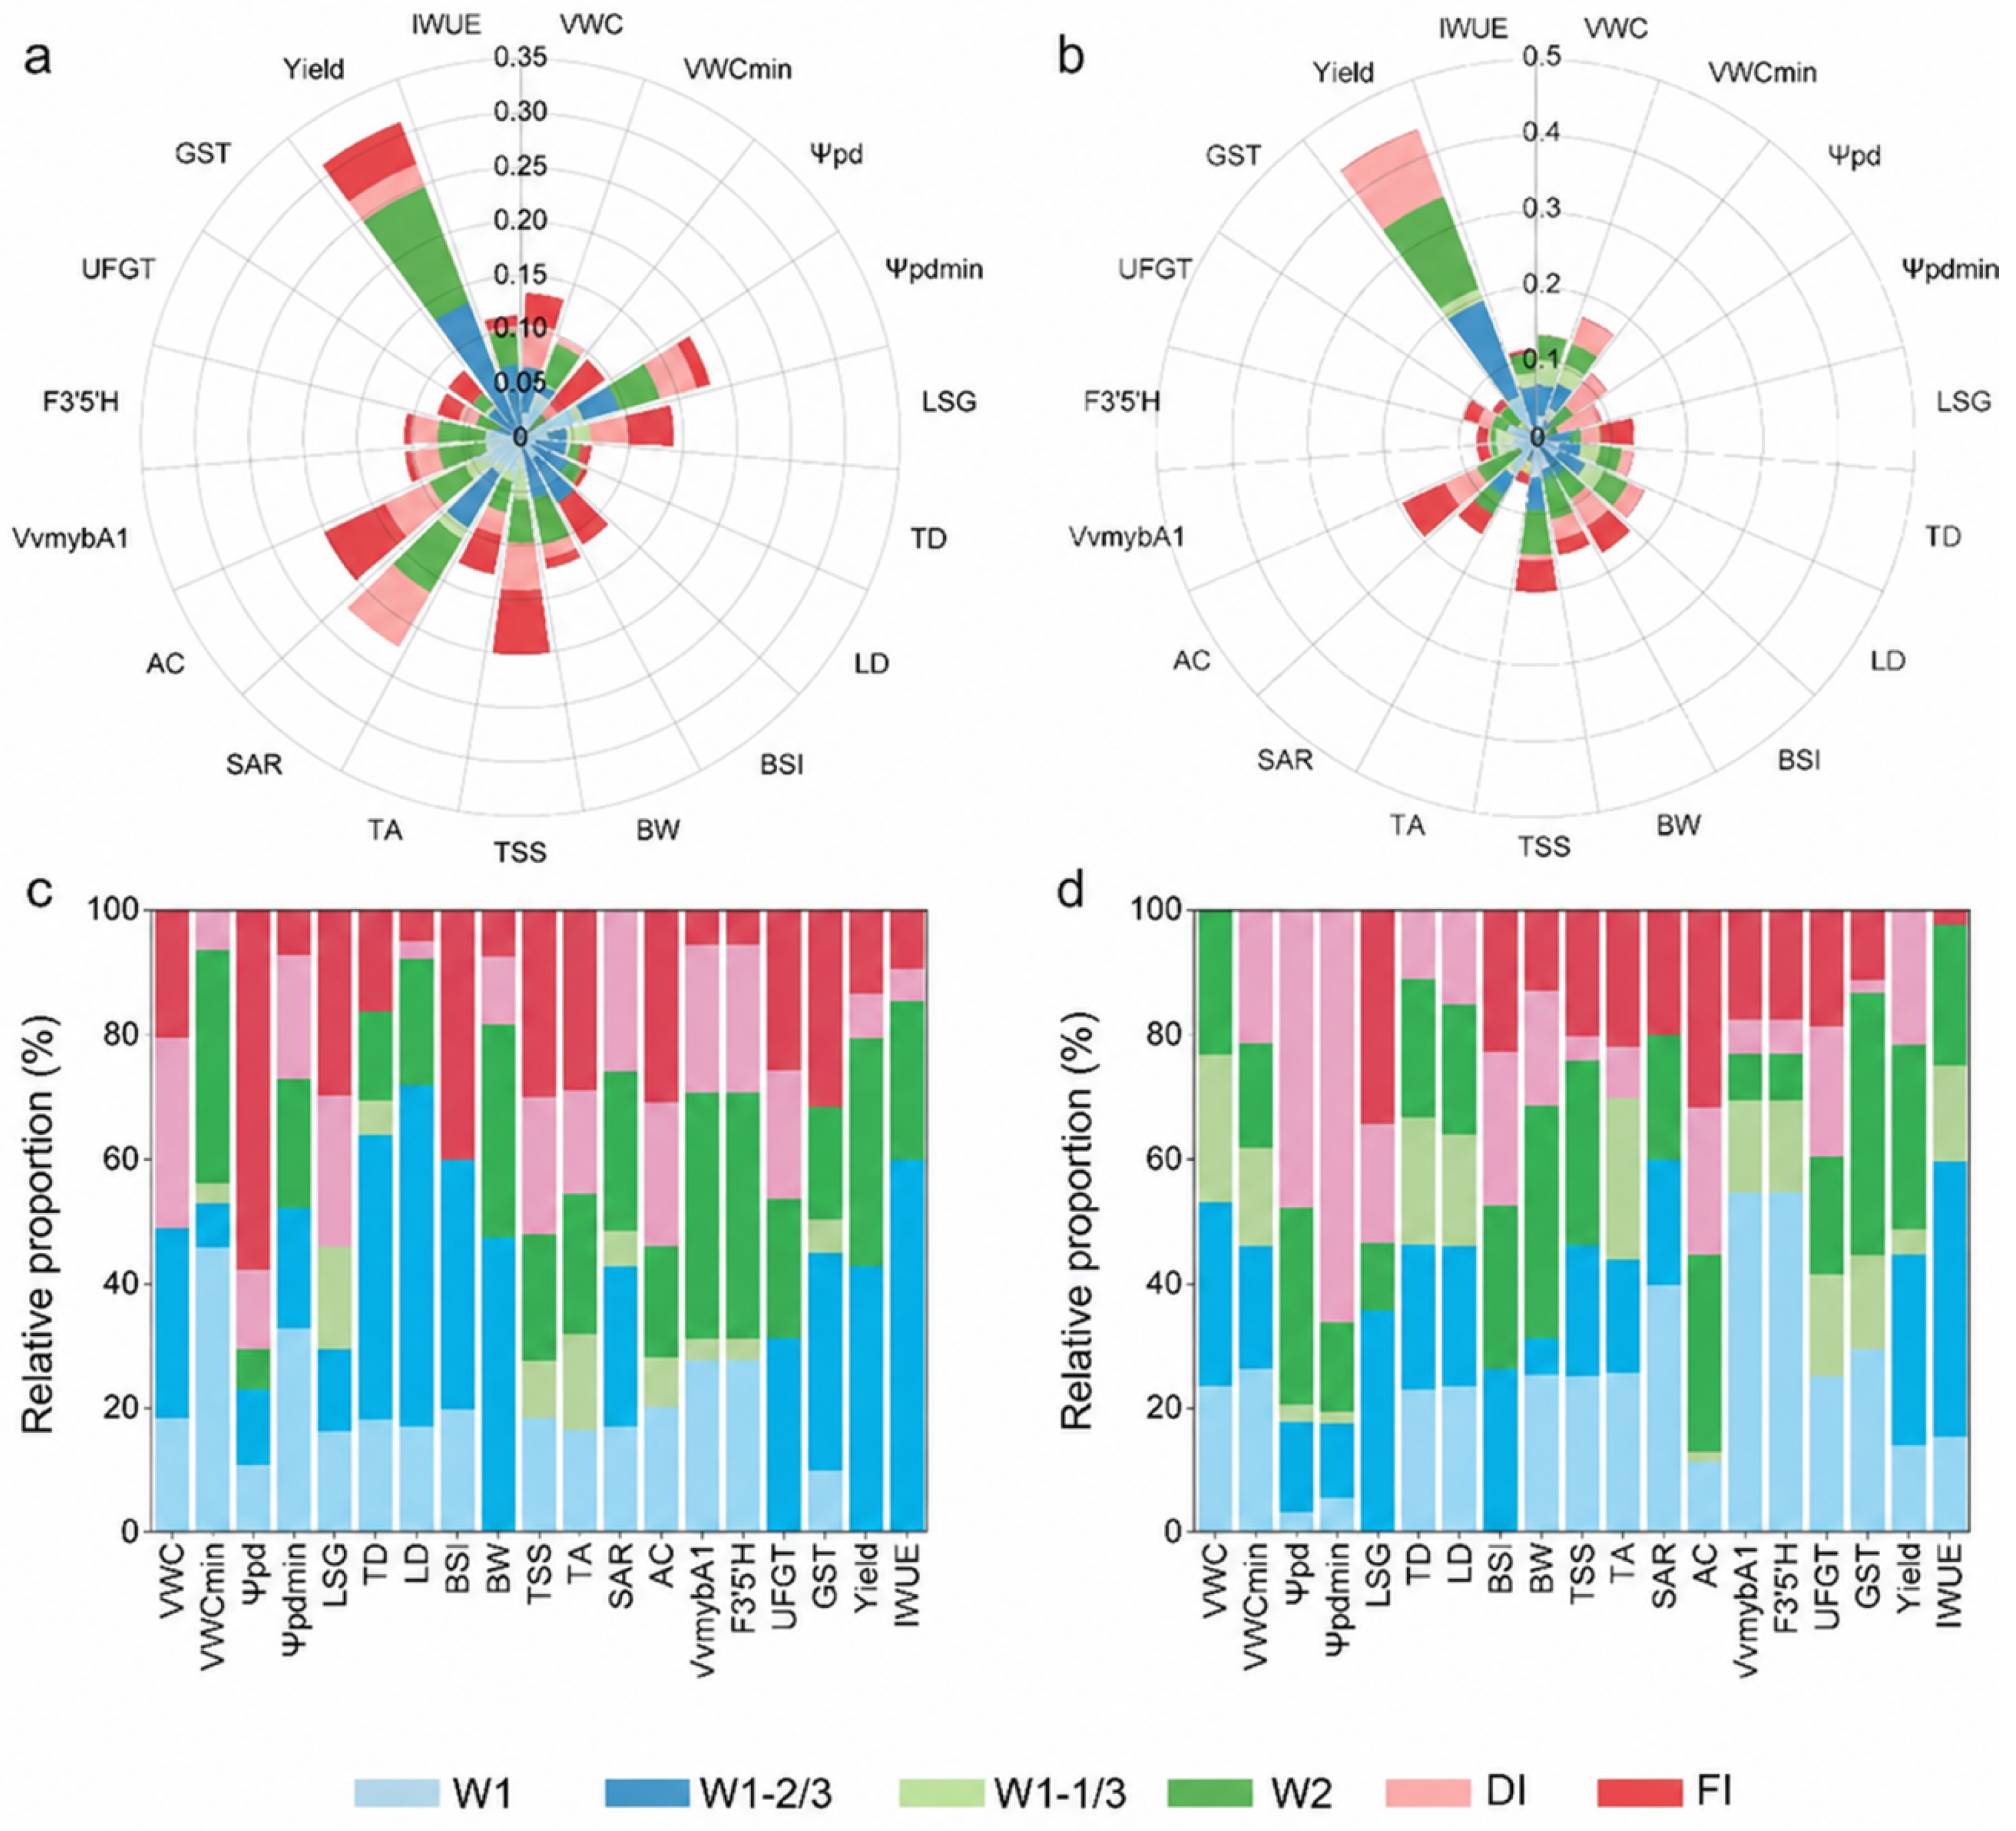
The relative proportion diagrams (Figure 11) illustrate the contribution structure of different indicators across irrigation regimes and years. In 2018 (Figure 11c), W1-2/3 and W2 dominated contributions to yield (30%) and IWUE (28%). FI and DI showed greater shares in quality-related traits, accounting for approximately 20% of TSSs and AC, but had lower contributions to yield and efficiency. In 2019 (Figure 11d), W2 and W1-2/3 continued to dominate yield (25–30%), IWUE (28%), and BW (26%), whereas quality-related indicators increased in relative weight.
Figure 11.
Comprehensive evaluation of different irrigation treatments using the AHP–entropy-weighted combined method. (a,b) Comprehensive performance of indicators under different irrigation regimes in 2018 and 2019. (c,d) Relative proportion of indicators across treatments in 2018 and 2019.
4. Discussion
4.1. Effects of Irrigation Treatments on Soil and Plant Water Status
Soil moisture status is essential for crop growth and development [25,26]. The spatiotemporal distribution pattern of VWC reflects environmental controls, including precipitation, evapotranspiration demand, soil texture, and field management practices such as irrigation regimes and tillage methods [27]. Variations in the design and operation of drip irrigation systems can result in differences in crop growth [28,29]. This two-year study revealed that, under the arid climate of northwest China, wicking infiltration irrigation enhances grape yield, quality, and irrigation water use efficiency compared to traditional drip irrigation. The SWC for FI and DI exhibited sharp, steep peaks shortly after irrigation, followed by an abrupt drop 24 h later, indicating a strong unsaturated hydraulic head drop (such as deep seepage loss); in contrast, for W1 and W2, soil moisture content rose gradually in a logarithmic plateau over 3–5 days following irrigation, with a more gradual subsequent decline. Although previous studies indicated no significant differences in delivery depth at 30, 60, or 90 cm for direct root irrigation [30,31,32], our results demonstrate that both the irrigation method and water application rate are critical factors in regulating crop yield and water use, thereby supporting earlier findings [33,34].
Under varying seasons and irrigation regimes, wicking infiltration irrigation reshapes soil–plant water dynamics by dampening intraseasonal fluctuations and elevating the lower bound of water availability [32,35,36]. At the soil level, wicking infiltration irrigation produced gradual increases in VWC after irrigation and slower subsequent drying, yielding smaller intraseasonal VWC variations than DI or FI [37,38]. This buffering effect persisted across both study years despite interannual differences in rainfall and irrigation-quota treatments [39]. A notable exception occurred in 2019, when localized clogging under the W2 treatment reduced average VWC in the core infiltration layer, underscoring the importance of system maintenance for realizing advantages of wicking infiltration irrigation [40,41]. Relative to FI, wicking infiltration irrigation consistently raised the VWCmin. These patterns indicate that wicking infiltration irrigation is more effective than FI in preventing episodes of extreme root-zone dryness. Capillary forces within the microfiber bundles restrict the rate of water delivery (approximately 0.17 L h−1), producing relatively slow and continuous wetting of the core infiltration layer. This mode of water supply may contribute to the smaller soil-moisture fluctuations and higher minimum VWC observed under wicking infiltration irrigation. Such patterns are consistent with a buffering effect of capillary water delivery on root-zone moisture conditions. However, root water uptake, soil evaporation, and deep percolation were not measured directly in this study; therefore, reduced non-productive water losses and source–sink regulation should be regarded as plausible mechanisms rather than directly demonstrated processes. Ψpd declined during the color change period and partially recovered after rainfall, consistent with previous studies [42]. However, wicking infiltration irrigation maintained higher Ψpdmin values and reduced intraseasonal variability compared to DI and FI. Within the wicking infiltration irrigation allocation gradient, progressively tighter water supply from W1 to W1-1/3 resulted in progressively more negative Ψpdmin (−0.46, −0.58, and −0.75 MPa in 2018, respectively), confirming a dose–response relationship between allocation and Ψpd stress [42,43]. The application of wicking capillary irrigation technology in actual field conditions faces a key bottleneck: intermittent clogging of the capillary rings and material degradation. Fine silt particles, algae, and microscopic suspended solids in the irrigation water found in Ningxia’s sandy loam, combined with the compression and encasement of the porous capillary material by underground root systems, cause intermittent clogging of the W2 underground capillary rings in the second year, resulting in reduced passive water uptake efficiency. Cleaning the capillary material monthly helps prevent clogging.
4.2. Effects of Irrigation Treatments on Yield and Quality
The higher IWUE observed under wicking infiltration irrigation is generally consistent with previous evidence that subsurface or localized water delivery can improve the targeting of water to the active root zone and reduce rapid post-irrigation moisture depletion [38]. In the present study, the gradual increases and slower subsequent decreases in VWC, together with the less pronounced declines in Ψpd, suggest that the improvement in irrigation efficiency was associated with a more buffered soil–plant water environment rather than simply with reduced water application. However, the response was not uniform across irrigation levels [44]. A moderate reduction in the irrigation quota maintained relatively high yield while improving IWUE, whereas the more severe W1-1/3 treatment further increased IWUE at the expense of yield. This trade-off indicates that maximizing IWUE alone does not necessarily identify the agronomically preferable treatment. Moreover, the reduced performance of W2 under partial clogging in the second year suggests that the benefits of capillary-wick irrigation depend not only on irrigation depth and quota but also on system reliability and seasonal conditions.
Soluble sugars and organic acids are central to grape flavor and commercial quality and also exhibit antioxidant and antibacterial activities; they are key nutritional constituents [45,46]. During ripening, carbohydrate–acid metabolism shifts as TSSs rise steadily, TA declines, and SAR increases [47,48]. Once berries enter the enlargement phase, sugar synthesis and phloem transport accelerate, making the berries particularly sensitive to water fluctuations [49]. Moderate water stress can suppress vegetative growth, reduce competition for assimilates, and, through a slight reduction in berry volume, create a concentration effect that favors sugar accumulation. However, severe stress can impair photosynthesis and assimilate transport, leading to reduced sugar accumulation and overall quality [50,51].
4.3. Effects on Anthocyanin and Related Genes
Anthocyanin accumulation accelerates at the onset of veraison. Evidence from various studies suggests that moderate post-veraison water deficit can enhance anthocyanin biosynthesis, while maintaining moderate irrigation under field conditions can also increase total anthocyanin content by preserving leaf function and berry size [1,52]. In this study, the W1 treatment showed elevated VWC in the core infiltration layer during certain periods, which coincided with suboptimal AC, indicating that excessively wet conditions may suppress secondary metabolism [53,54]. At the genetic level, VvMYBA1 is regulated by post-veraison water stress, and F3′5′H, UFGT, and GST are crucial for anthocyanin biosynthesis. Peak UFGT expression was observed from mid-to-late September, closely aligned with the phase of rapid anthocyanin accumulation. At multiple time points under W2, the expression of UFGT—as well as VvMYBA1, F3′5′H, and GST—was higher than in the FI [55,56]. While the FI showed reduced yield under severe stress, its berries may have higher AC per unit mass due to a concentration effect [57]. Temperature and light also impact AC production: excessive irradiance and high temperatures can suppress UFGT expression and accelerate anthocyanin degradation [58,59]. In this study, the W2 treatment resulted in vigorous apical-shoot growth and a denser canopy, reducing overexposure of fruit surfaces and promoting a balance between AC and BW.
4.4. The Optimal Irrigation Application Strategy
Drawing on the two-year field trial and the multi-criteria evaluation, W2 showed the strongest overall integrated performance under the conditions tested, whereas W1-2/3 provided the most favorable yield–IWUE balance under reduced irrigation. These results suggest that shallow subsurface wicking infiltration may be a promising configuration for table-grape production in arid environments, particularly when stable multi-trait performance is prioritized. However, this recommendation should be regarded as site-specific and provisional because the experiment was conducted at a single location over two growing seasons and with one grape cultivar. Further validation across contrasting soil textures, climatic conditions, vineyard ages, and cultivars is required before a general irrigation configuration can be recommended. Where irrigation water is limited, W1-2/3 may represent a useful reduced-irrigation option, whereas the stronger deficit imposed by W1-1/3 increased IWUE at the expense of yield.
4.5. Limitations
We fully acknowledge that relying on single-depth VWC sensors within each treatment presents inherent constraints. Specifically, this localized monitoring setup prevents the precise mathematical integration required to calculate changes in total soil water storage across the entire root-zone profile (e.g., 0–60 cm). In addition, the present conclusions are based on a two-year experiment conducted at a single vineyard with one table-grape cultivar. The transferability of the observed treatment responses therefore requires validation across different soil types, climatic conditions, cultivars, and longer-term irrigation cycles.
5. Conclusions
This study systematically evaluated the effects of different irrigation methods on the growth, development, yield, soil moisture, physiological characteristics, and gene expression of grapes in arid regions, based on two growing seasons of field trials. The optimal irrigation strategy was determined using an AHP-EW comprehensive weight assessment. Results indicate that, under identical seasonal irrigation quotas, wicking infiltration irrigation increased VWC in the core infiltration layer and improved minimum root-zone water availability relative to FI. Compared with DI, W2 increased IWUE by 57.9% in 2018 and 9.3% in 2019, while W1-2/3 increased IWUE by 155.1% and 66.0%, respectively. During critical growth stages, wicking infiltration irrigation sustained the expression of genes in the VvMYBA1–UFGT pathway and supported AC accumulation within the appropriate moisture range. W1-2/3 provided the strongest reduced-irrigation yield–efficiency balance, whereas W2 achieved the highest overall AHP–EW score and was therefore identified as the optimal integrated strategy for arid vineyards. It effectively regulates soil moisture and growth conditions, thereby enhancing grape yield and IWUE. This research provides a practical approach for water-efficient grape cultivation in arid agroecosystems, provided that emitter clogging is monitored and managed.
Supplementary Materials
The following supporting information can be downloaded at https://www.mdpi.com/article/10.3390/agriculture16202221/s1.
Author Contributions
Conceptualization, Y.W., Z.Z. and Q.Z.; methodology, Y.W. and Q.Z.; validation, Y.W., Z.Z. and Q.Z.; formal analysis, X.Y.; investigation, X.Y. and Q.Z.; resources, X.Y. and Q.Z.; data curation, Y.W., J.Z. and Q.Z.; writing—original draft preparation, Y.W., Z.Z. and Q.Z.; writing—review and editing, Z.Z., J.Z. and Q.Z.; visualization, X.Y., J.Z. and Q.Z.; supervision, Q.Z.; project administration, Q.Z. All authors have read and agreed to the published version of the manuscript.
Funding
This research was funded by China Meteorological Administration Climate Change Special Project (QBZJ202607), and the National Natural Science Foundation of China (31270748 and U25A20356).
Data Availability Statement
The raw data supporting the conclusions of this article will be made available by the authors on request.
Conflicts of Interest
The authors declare no conflicts of interest.
References
- Rienth, M.; Vigneron, N.; Darriet, P.; Sweetman, C.; Burbidge, C.; Bonghi, C.; Walker, R.P.; Famiani, F.; Castellarin, S.D. Grape Berry Secondary Metabolites and Their Modulation by Abiotic Factors in a Climate Change Scenario—A Review. Front. Plant Sci. 2021, 12, 643258. [Google Scholar] [CrossRef] [Scilit]
- van Leeuwen, C.; Destrac-Irvine, A. Modified grape composition under climate change conditions requires adaptations in the vineyard. OENO One 2017, 51, 147–154. [Google Scholar] [CrossRef] [Scilit]
- Li, T.; Zhang, J. Effect of pit irrigation on soil water content, vigor, and water use efficiency within vineyards in extremely arid regions. Sci. Hortic. 2017, 218, 30–37. [Google Scholar] [CrossRef] [Scilit]
- Sun, R.; Ma, J.; Sun, X.; Zheng, L.; Bai, S. Responses of soil water–root coupling and coupling effects on grapevines to irrigation methods in extremely arid region. Agric. Water Manag. 2024, 302, 108984. [Google Scholar] [CrossRef] [Scilit]
- Meshram, D.T.; Gorantiwar, S.D.; Singh, N.V.; Babu, K.D. Response of micro-irrigation systems on growth, yield and WUE of Pomegranate (Punica granatum L.) in semi-arid regions of India. Sci. Hortic. 2019, 246, 686–692. [Google Scholar] [CrossRef] [Scilit]
- Liu, X.; Zhang, Y.; Jiang, Z.; Yue, X.; Liang, J.; Yang, Q.; Li, J.; Li, N. Micro-moistening irrigation combined with bio-organic fertilizer: An adaptive irrigation and fertilization strategy to improve soil environment, edible Rose yield, and nutritional quality. Ind. Crops Prod. 2023, 196, 116487. [Google Scholar] [CrossRef] [Scilit]
- Ma, X.; Han, F.; Wu, J.; Ma, Y.; Jacoby, P.W. Optimizing crop water productivity and altering root distribution of Chardonnay grapevine (Vitis vinifera L.) in a silt loam soil through direct root-zone deficit irrigation. Agric. Water Manag. 2023, 277, 108072. [Google Scholar] [CrossRef] [Scilit]
- Ayars, J.E.; Fulton, A.; Taylor, B. Subsurface drip irrigation in California—Here to stay? Agric. Water Manag. 2015, 157, 39–47. [Google Scholar] [CrossRef] [Scilit]
- Karizi, A.; Honar, T.; Ahmadi, S.H.; Sepaskhah, A.R.; Heidari, B.; Kamgar-Haghighi, A.A. Water use, yield, and root growth characteristics of safflower in surface and subsurface drip irrigation systems under water-saving irrigation strategies. Agric. Water Manag. 2025, 319, 109829. [Google Scholar] [CrossRef] [Scilit]
- Muhammad, T.; Zhou, B.; Puig-Bargués, J.; Ding, C.; Li, S.; Manan, I.; Zhou, Y.; Liu, Z.; Li, Y. Assessment of emitter clogging with multiple fouling and root intrusion in sub-surface drip irrigation during 5-year sugarcane growth. Agric. Water Manag. 2022, 274, 107981. [Google Scholar] [CrossRef] [Scilit]
- Liu, X.; He, X.; Zhang, L. Simplified method for estimating discharge of microporous ceramic emitters for drip irrigation. Biosyst. Eng. 2022, 219, 38–55. [Google Scholar] [CrossRef] [Scilit]
- Cheng, D.; Zhang, Q.; Huang, S. Effects of capillary wicking irrigation on soil moisture, plant growth and surface temperature of green roof with rain storage. Water Supply 2020, 20, 1617–1628. [Google Scholar] [CrossRef] [Scilit]
- Zhang, Q.; Chen, Y.; Xiong, Y.; Moritani, S.; Wu, X.; Yan, C.; Chen, X. Which Is More Sensitive to Water Stress for Irrigation Scheduling during the Maturation Stage: Grapevine Photosynthesis or Berry Size? Atmosphere 2021, 12, 845. [Google Scholar] [CrossRef] [Scilit]
- Roonjho, S.J.; Kamal, R.M.; Roonjho, A.R. Modeling capillary wick irrigation system for greenhouse crop production. Agric. Water Manag. 2022, 274, 107927. [Google Scholar] [CrossRef] [Scilit]
- Wang, Y.; Li, S.; Qin, S.; Guo, H.; Yang, D.; Lam, H.-M. How can drip irrigation save water and reduce evapotranspiration compared to border irrigation in arid regions in northwest China. Agric. Water Manag. 2020, 239, 106256. [Google Scholar] [CrossRef] [Scilit]
- Pisciotta, A.; Di Lorenzo, R.; Santalucia, G.; Barbagallo, M.G. Response of grapevine (Cabernet Sauvignon cv) to above ground and subsurface drip irrigation under arid conditions. Agric. Water Manag. 2018, 197, 122–131. [Google Scholar] [CrossRef] [Scilit]
- Wang, Y.; Janz, B.; Engedal, T.; de Neergaard, A. Effect of irrigation regimes and nitrogen rates on water use efficiency and nitrogen uptake in maize. Agric. Water Manag. 2017, 179, 271–276. [Google Scholar] [CrossRef] [Scilit]
- Iandolino, A.B.; Goes da Silva, F.; Lim, H.; Choi, H.; Williams, L.E.; Cook, D.R. High-quality RNA, cDNA, and derived EST libraries from grapevine (Vitis vinifera L.). Plant Mol. Biol. Rep. 2004, 22, 269–278. [Google Scholar] [CrossRef] [Scilit]
- Kobayashi, S.; Ishimaru, M.; Hiraoka, K.; Honda, C. Myb-related genes of the Kyoho grape (Vitis labruscana) regulate anthocyanin biosynthesis. Planta 2002, 215, 924–933. [Google Scholar] [CrossRef] [Scilit]
- Ageorges, A.; Fernandez, L.; Vialet, S.; Merdinoglu, D.; Terrier, N.; Romieu, C. Four specific isogenes of the anthocyanin metabolic pathway are systematically co-expressed with the red colour of grape berries. Plant Sci. 2006, 170, 372–383. [Google Scholar] [CrossRef] [Scilit]
- Bogs, J.; Ebadi, A.; McDavid, D.; Robinson, S.P. Identification of the Flavonoid Hydroxylases from Grapevine and Their Regulation during Fruit Development. Plant Physiol. 2006, 140, 279–291. [Google Scholar] [CrossRef] [Scilit]
- Castellarin, S.D.; di Gaspero, G.; Marconi, R.; Nonis, A.; Peterlunger, E.; Paillard, S.; Adam-Blondon, A.-F.; Testolin, R. Colour variation in red grapevines (Vitis vinifera L.): Genomic organisation, expression of flavonoid 3′-hydroxylase, flavonoid 3′,5′-hydroxylase genes and related metabolite profiling of red cyanidin-/blue delphinidin-based anthocyanins in berry skin. BMC Genom. 2006, 7, 12. [Google Scholar] [CrossRef] [Scilit]
- Jeong, S.T.; Goto-Yamamoto, N.; Hashizume, K.; Esaka, M. Expression of the flavonoid 3′-hydroxylase and flavonoid 3′,5′-hydroxylase genes and flavonoid composition in grape (Vitis vinifera). Plant Sci. 2006, 170, 61–69. [Google Scholar] [CrossRef] [Scilit]
- This, P.; Lacombe, T.; Cadle-Davidson, M.; Owens, C.L. Wine grape (Vitis vinifera L.) color associates with allelic variation in the domestication gene VvmybA1. Theor. Appl. Genet. 2007, 114, 723–730. [Google Scholar] [CrossRef] [Scilit]
- Peng, X.; Chen, D.; Zhou, Z.; Zhen, J.; Xu, C.; Hu, X.; Wang, Y. Optimizing drip fertigation management to simultaneously improve the yield, water productivity and fertilizer agronomic utilization efficiency of grapes in different precipitation year patterns. Agric. Water Manag. 2024, 295, 108749. [Google Scholar] [CrossRef] [Scilit]
- Scholz, H.; Lischeid, G.; Ribbe, L.; Hernandez Ochoa, I.; Grahmann, K. Differentiating between crop and soil effects on soil moisture dynamics. Hydrol. Earth Syst. Sci. 2024, 28, 2401–2419. [Google Scholar] [CrossRef] [Scilit]
- Chernykh, D.; Biryukov, R.; Bondarovich, A.; Lubenets, L.; Pavlenko, A.; Rakhymbek, K.; Revenko, D.; Zhantassova, Z. Spatiotemporal Analysis of Soil Moisture Variability and Precipitation Response Across Soil Texture Classes in East Kazakhstan. Land 2025, 14, 1136. [Google Scholar] [CrossRef] [Scilit]
- Skaggs, T.H.; Trout, T.J.; Rothfuss, Y. Drip Irrigation Water Distribution Patterns: Effects of Emitter Rate, Pulsing, and Antecedent Water. Soil Sci. Soc. Am. J. 2010, 74, 1886–1896. [Google Scholar] [CrossRef] [Scilit]
- Ali Talpur, M.M.; Shaghaleh, H.; Ali Adam Hamad, A.; Chang, T.; Zia-ur-Rehman, M.; Usman, M.; Alhaj Hamoud, Y. Effect of Planting Geometry on Growth, Water Productivity, and Fruit Quality of Tomatoes under Different Soil Moisture Regimes. Sustainability 2023, 15, 9526. [Google Scholar] [CrossRef] [Scilit]
- Zúñiga Espinoza, C.; Khot, L.R.; Sankaran, S.; Jacoby, P.W. High Resolution Multispectral and Thermal Remote Sensing-Based Water Stress Assessment in Subsurface Irrigated Grapevines. Remote Sens. 2017, 9, 961. [Google Scholar] [CrossRef] [Scilit]
- Ma, X.; Sanguinet, K.A.; Jacoby, P.W. Performance of direct root-zone deficit irrigation on Vitis vinifera L. cv. Cabernet Sauvignon production and water use efficiency in semi-arid southcentral Washington. Agric. Water Manag. 2019, 221, 47–57. [Google Scholar] [CrossRef] [Scilit]
- Ma, X.; Sanguinet, K.A.; Jacoby, P.W. Direct root-zone irrigation outperforms surface drip irrigation for grape yield and crop water use efficiency while restricting root growth. Agric. Water Manag. 2020, 231, 105993. [Google Scholar] [CrossRef] [Scilit]
- Dhillon, R.; Das, S.; Shedekar, V.S.; Sharma, V. Assessing the impact of soil water deficit and supplemental irrigation scenarios on Ohio’s maize and soybean yields using machine learning models. Agric. Water Manag. 2025, 320, 109834. [Google Scholar] [CrossRef] [Scilit]
- Sun, Y.; Liu, X.; Li, W.; Wang, C.; Feng, Z. The synergistic effect of magnetoelectric water drip irrigation and foliar zinc application on the yield, quality and water use efficiency of spinach. Sci. Hortic. 2025, 353, 114468. [Google Scholar] [CrossRef] [Scilit]
- Ma, X.; Jacoby, P.; Thompson, J. Assessing Impacts of Direct Root-Zone Irrigation on Grapevine Physiology. In Proceedings of the ASA, CSSA and SSSA International Annual Meetings, Phoenix, AZ, USA, 7 November 2016; Poster 153-1204, Abstract 100398. Available online: https://scisoc.confex.com/crops/2016am/webprogram/Paper100398.html (accessed on 5 October 2026).
- Raij-Hoffman, I.; Vanella, D.; Ramírez-Cuesta, J.M.; Peddinti, S.R.; Kisekka, I. Detecting soil water redistribution in subsurface drip irrigated processing tomatoes using electrical resistivity tomography, proximal sensing and hydrological modelling. Sci. Total Environ. 2024, 912, 169620. [Google Scholar] [CrossRef] [Scilit]
- Li, N.-N.; Li, J.-H.; Shi, X.-J.; Shi, F.; Tian, Y.; Wang, J.; Hao, X.-Z.; Luo, H.-H.; Wang, Z.-B. Increasing cotton lint yield and water use efficiency for subsurface drip irrigation without mulching. Front. Plant Sci. 2024, 15, 1433719. [Google Scholar] [CrossRef] [Scilit]
- Farag, A.A.; El-Aziz, M.A.A.; El-Husseiny, A.M. Effects of irrigation systems and water management strategies on soil chemical properties and citrus tree productivity in clayey soils. Sci. Rep. 2025, 15, 33324. [Google Scholar] [CrossRef] [Scilit]
- Liu, J.; Gao, X.; Song, J.; Wen, M.; Wang, J.; Cai, Y.; Zhao, X. Subsurface drip irrigation mitigated greenhouse gas emission and improved root growth and yield in apple in semi-arid region. Agric. Water Manag. 2025, 308, 109290. [Google Scholar] [CrossRef] [Scilit]
- Dehghanisanij, H.; Mirlatifi, S.M.; Emami, S.; Rajabzadeh, T. Reducing the clogging of emitters in drip irrigation systems using acid washing and ultrasonic technology. Sci. Rep. 2025, 15, 12499. [Google Scholar] [CrossRef] [Scilit]
- Kong, N.; Qiu, X.; Wang, Q.; Wu, Z.; Wang, J.; Tan, Z.; Wang, H.; He, Q. Enhancing the anti-clogging performance of emitters in drip irrigation systems based on Bacillus subtilis strain DSM 10 and controlled replacement cycles. Biosyst. Eng. 2025, 252, 159–168. [Google Scholar] [CrossRef] [Scilit]
- Zhang, Y.; Pichon, L.; Pellegrino, A.; Roux, S.; Péruzzaro, C.; Tisseyre, B. Predicting predawn leaf water potential while accounting for uncertainty using vine shoot growth and weather data in Mediterranean rainfed vineyards. Agric. Water Manag. 2024, 302, 108998. [Google Scholar] [CrossRef] [Scilit]
- Delval, L.; Bates, J.; Jonard, F.; Javaux, M. Field heterogeneity of soil texture controls leaf water potential spatial distribution predicted from UAS-based vegetation indices in non-irrigated vineyards. Biogeosciences 2025, 22, 513–534. [Google Scholar] [CrossRef] [Scilit]
- Delić, M.; Anđušić, A.; Topčić, F.; Blesić, M.; Behmen, F.; Smajić Murtić, M.; Murtić, S. Optimizing harvest timing: Impacts on physical characteristics and quality parameters of grapes. Not. Bot. Horti Agrobot. Cluj-Napoca 2025, 53, 14607. [Google Scholar] [CrossRef] [Scilit]
- Goulão, L.F.; Fernandes, J.C.; Lopes, P.; Amâncio, S. Tackling the Cell Wall of the Grape Berry. In The Biochemistry of the Grape Berry; Gerós, H., Chaves, M.M., Delrot, S., Eds.; Bentham Science Publishers: Sharjah, United Arab Emirates, 2012; pp. 172–193. [Google Scholar] [CrossRef] [Scilit][Green Version]
- Blancquaert, E.H.; Oberholster, A.; Ricardo-da-Silva, J.M.; Deloire, A.J. Grape Flavonoid Evolution and Composition Under Altered Light and Temperature Conditions in Cabernet Sauvignon (Vitis vinifera L.). Front. Plant Sci. 2019, 10, 1062. [Google Scholar] [CrossRef] [Scilit]
- Plantevin, M.; Merpault, Y.; Lecourt, J.; Destrac-Irvine, A.; Dijsktra, L.; van Leeuwen, C. Characterization of varietal effects on the acidity and pH of grape berries for selection of varieties better adapted to climate change. Front. Plant Sci. 2024, 15, 1439114. [Google Scholar] [CrossRef] [Scilit]
- Wang, S.-L.; Yan, H.-B.; Wang, L.; Chen, X.-C.; Wang, J.; He, F. Focus on flavors: Physico-chemical, primary metabolite, volatile, and sensory analysis of seven white table grape cultivars in China. Food Chem. X 2025, 31, 103157. [Google Scholar] [CrossRef] [Scilit]
- Kar, S.; Copp, C.R.; DeShields, J.B.; Clark, R.W.; Levin, A.D. Severe Preveraison and Moderate Postveraison Deficit Irrigation Improves Berry Phenolics in Warm-Climate Pinot noir. Am. J. Enol. Vitic. 2025, 76, 0760024. [Google Scholar] [CrossRef] [Scilit]
- Levin, A.D.; KC, A.N. Water Deficits Do Not Improve Fruit Quality in Grapevine Red Blotch Virus-Infected Grapevines (Vitis vinifera L.). Front. Plant Sci. 2020, 11, 1292. [Google Scholar] [CrossRef] [Scilit]
- Alatzas, A.; Theocharis, S.; Miliordos, D.-E.; Leontaridou, K.; Kanellis, A.K.; Kotseridis, Y.; Hatzopoulos, P.; Koundouras, S. The Effect of Water Deficit on Two Greek Vitis vinifera L. Cultivars: Physiology, Grape Composition and Gene Expression during Berry Development. Plants 2021, 10, 1947. [Google Scholar] [CrossRef] [Scilit]
- Giordano, D.; Provenzano, S.; Ferrandino, A.; Vitali, M.; Pagliarani, C.; Roman, F.; Cardinale, F.; Castellarin, S.D.; Schubert, A. Characterization of a multifunctional caffeoyl-CoA O-methyltransferase activated in grape berries upon drought stress. Plant Physiol. Biochem. 2016, 101, 23–32. [Google Scholar] [CrossRef] [Scilit]
- Castellarin, S.D.; Pfeiffer, A.; Sivilotti, P.; Degan, M.; Peterlunger, E.; di Gaspero, G. Transcriptional regulation of anthocyanin biosynthesis in ripening fruits of grapevine under seasonal water deficit. Plant Cell Environ. 2007, 30, 1381–1399. [Google Scholar] [CrossRef] [Scilit]
- Gao, J.; Chen, Y.; Gao, M.; Zhao, Y.; Wang, Y. WRKY14-DPB Module Enhances Drought Tolerance by Activating the Expression of UGT84B1 Involved in Hydrolyzable Tannin Biosynthesis. Plant Cell Environ. 2026, 49, 7539–7557. [Google Scholar] [CrossRef] [Scilit]
- Afifi, M.; Obenland, D.; El-kereamy, A. The Complexity of Modulating Anthocyanin Biosynthesis Pathway by Deficit Irrigation in Table Grapes. Front. Plant Sci. 2021, 12, 713277. [Google Scholar] [CrossRef] [Scilit]
- Gao, L.; Wang, W.; Li, H.; Li, H.; Yang, Y.; Zheng, H.; Tao, J. Anthocyanin accumulation in grape berry flesh is associated with an alternative splicing variant of VvMYBA1. Plant Physiol. Biochem. 2023, 195, 1–13. [Google Scholar] [CrossRef] [Scilit]
- Jiu, S.; Guan, L.; Leng, X.; Zhang, K.; Haider, M.S.; Yu, X.; Zhu, X.; Zheng, T.; Ge, M.; Wang, C.; et al. The role of VvMYBA2r and VvMYBA2w alleles of the MYBA2 locus in the regulation of anthocyanin biosynthesis for molecular breeding of grape (Vitis spp.) skin coloration. Plant Biotechnol. J. 2021, 19, 1216–1239. [Google Scholar] [CrossRef] [Scilit]
- Tarara, J.M.; Lee, J.; Spayd, S.E.; Scagel, C.F. Berry Temperature and Solar Radiation Alter Acylation, Proportion, and Concentration of Anthocyanin in Merlot Grapes. Am. J. Enol. Vitic. 2008, 59, 235–247. [Google Scholar] [CrossRef] [Scilit]
- Ryu, S.; Han, J.H.; Cho, J.G.; Jeong, J.H.; Lee, S.K.; Lee, H.J. High temperature at veraison inhibits anthocyanin biosynthesis in berry skins during ripening in ‘Kyoho’ grapevines. Plant Physiol. Biochem. 2020, 157, 219–228. [Google Scholar] [CrossRef] [Scilit]

Disclaimer/Publisher’s Note: The statements, opinions and data contained in all publications are solely those of the individual author(s) and contributor(s) and not of MDPI and/or the editor(s). MDPI and/or the editor(s) disclaim responsibility for any injury to people or property resulting from any ideas, methods, instructions or products referred to in the content. |
© 2026 by the authors. Licensee MDPI, Basel, Switzerland. This article is an open access article distributed under the terms and conditions of the Creative Commons Attribution (CC BY) license.