


Abstract
This study investigates the dairy sector in the Republic of Croatia, which is characterized by pronounced structural heterogeneity. On the one hand, there are highly productive farms comparable to the leading milk producers in the European Union, and numerous small and medium-sized farms that face the challenges of maintaining competitiveness and further development. In order to design effective development and sectoral policies, it is necessary to identify and distinguish the dominant types of dairy farms and their specific development needs. The aim of the study was to develop a representative typology of Croatian dairy farms as a basis for adapting and upgrading the SiTFarm (Slovenian Typical Farm Model) model into CroTFarm (Croatian Typical Farm Model), which will enable a more comprehensive assessment of the production, economic and structural characteristics of the sector. The analysis was conducted on empirical data from the Croatian Agency for Agriculture and Food, covering 3331 dairy farms. To identify groups of farms with similar structural and production characteristics, hierarchical and non-hierarchical cluster analysis methods were applied. The analysis identified 17 clusters, ranging from smaller farms characterized by relatively extensive and diversified production to larger, more specialized farms with higher milk yields and more intensive production. A significant share of mixed farm types combining characteristics of both production systems were also identified. The resulting farm types will be used as input categorical variables in the subsequent empirical farm model, which also represents the primary purpose of their construction within this study.
1. Introduction
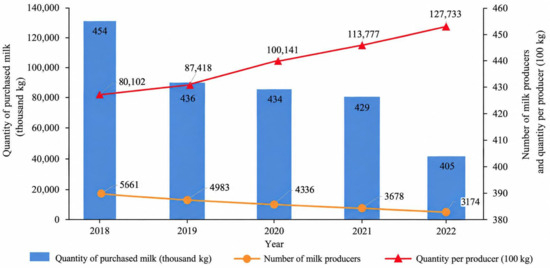
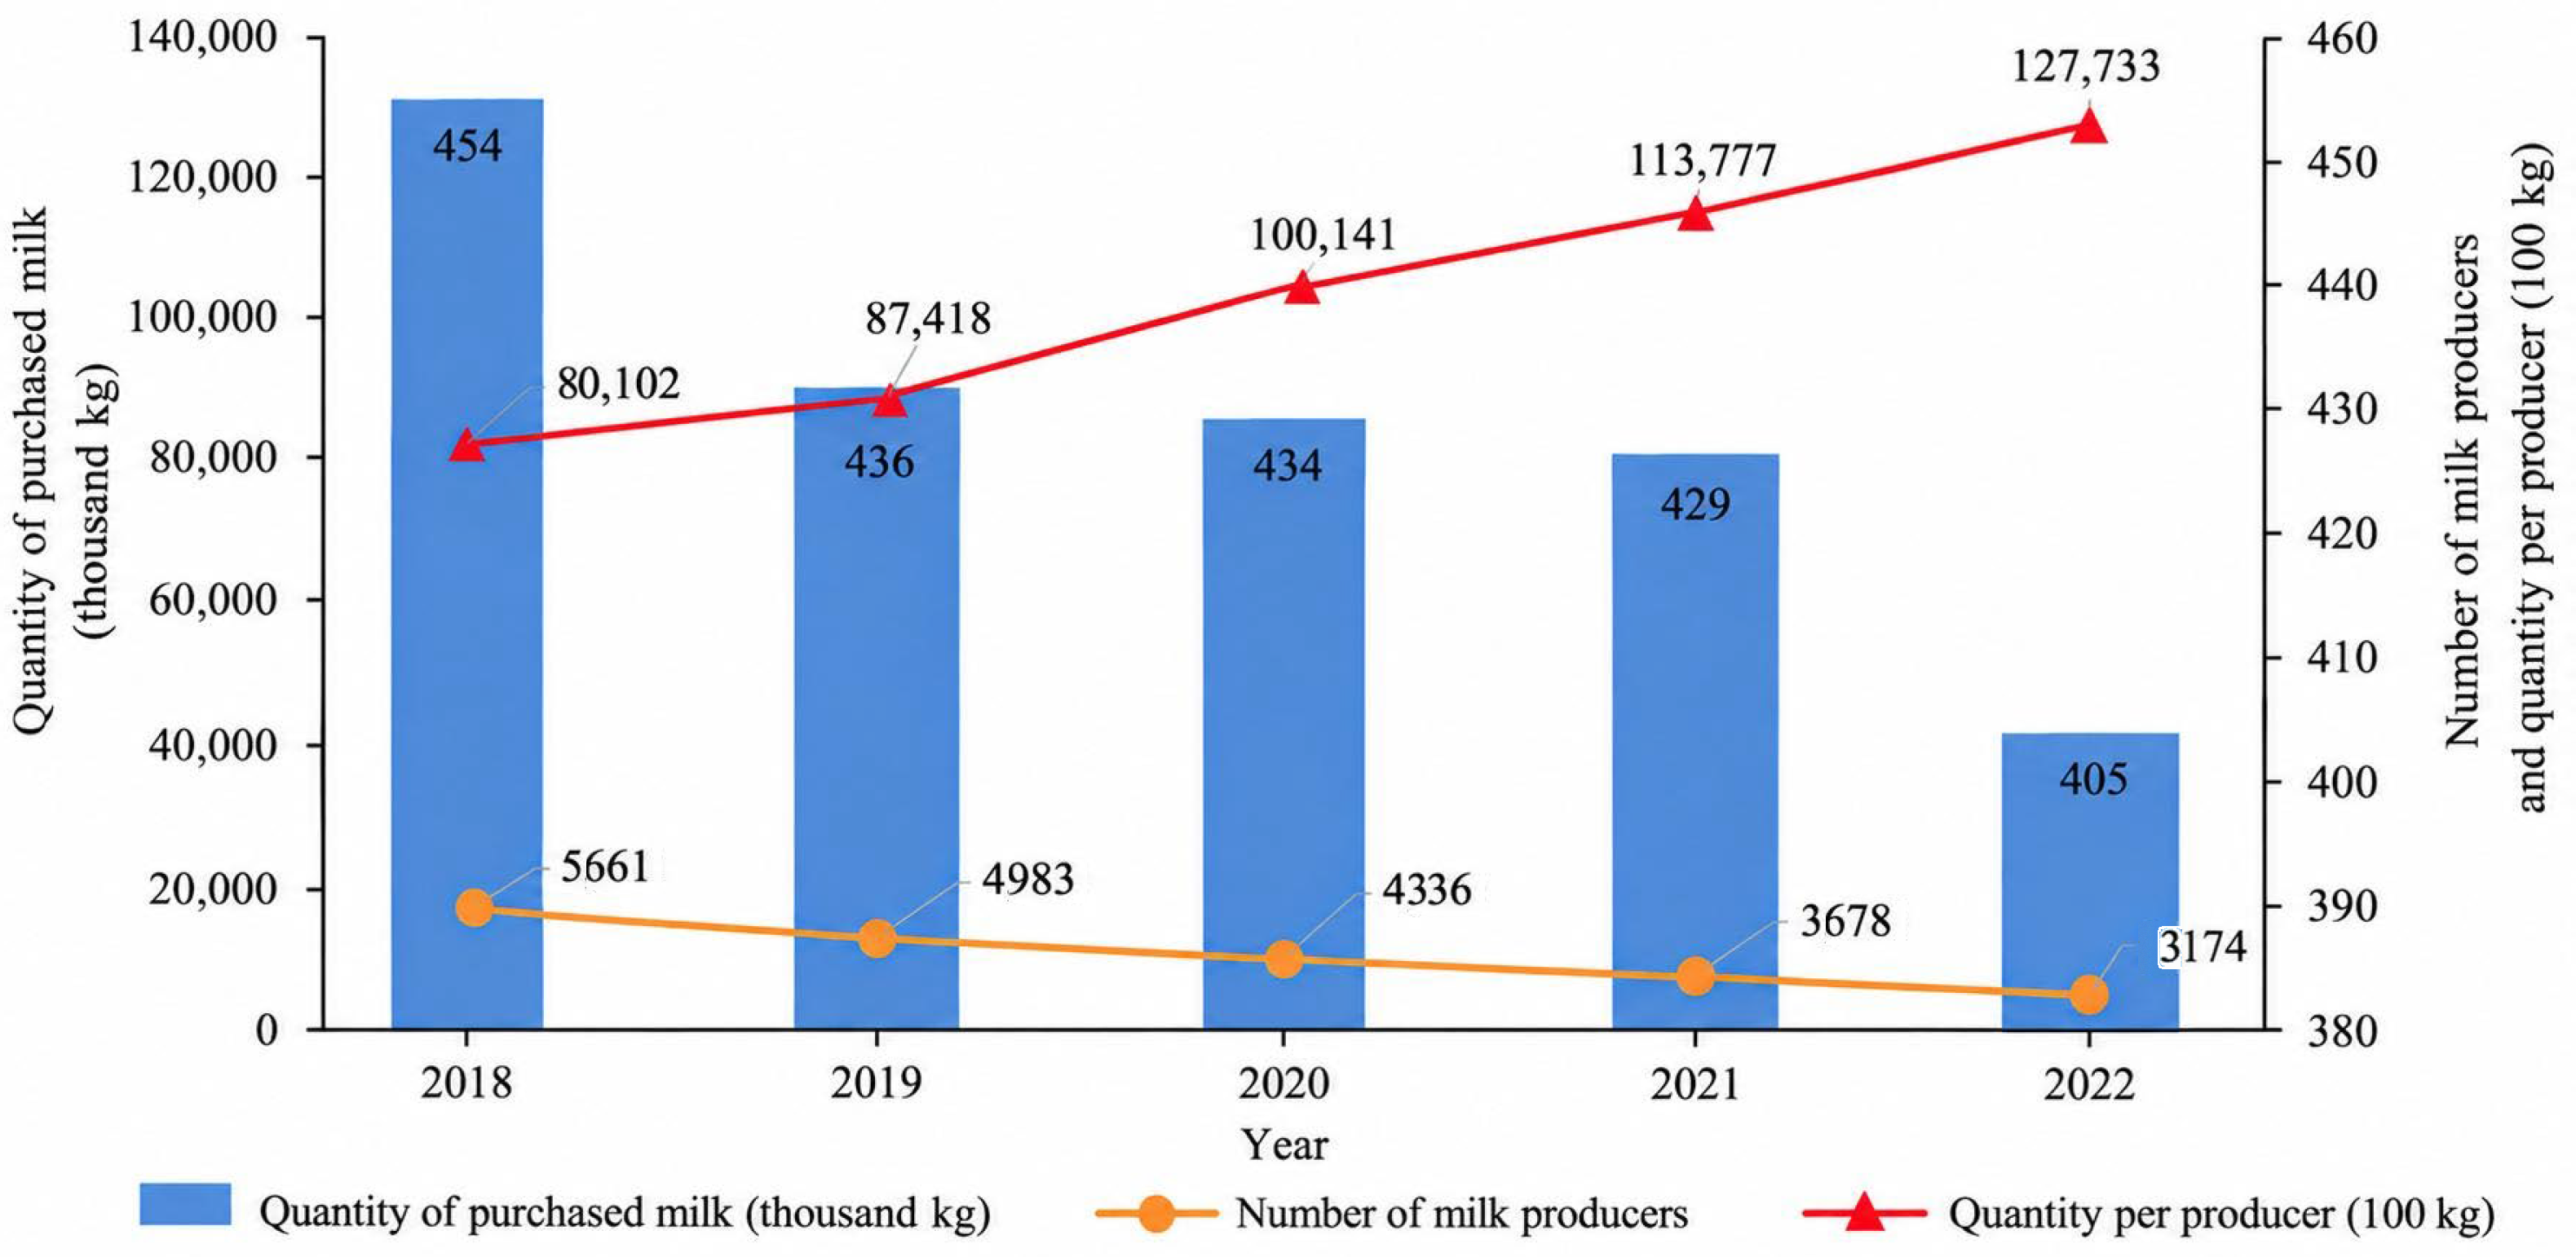
In recent years, the dairy sector in the Republic of Croatia has undergone significant structural changes. The number of farms supplying milk has been decreasing, which in turn has been accompanied by a decrease in the number of cows and total milk production [1], Figure 1. Such developments are usually associated with processes of structural consolidation in agriculture, where smaller farms with only a few livestock units either abandon production or switch to arable farming [2]. At the same time, the sector has been recording an increase in milk deliveries per supplier [3].
Figure 1.
Quantity of milk delivered, number of suppliers and quantity per supplier to the Republic of Croatia from 2018 to 2022.
Despite structural adjustments, the performance of the Croatian dairy sector remains relatively weak. Previous agricultural policy measures have not brought significant improvements, suggesting that a deeper understanding of the sector’s structure and economic dynamics is needed. In particular, the limited number of competitive farms represent a key constraint for further development [4]. Addressing this challenge requires targeted rural and agricultural policy measures aimed at strengthening farm competitiveness and improving the long-term sustainability of the sector. To support decision-makers and to have a better insight into what is happening, certain types of agricultural holdings models are needed [5]. That is why the Strategic Plans of the EU member states place increasing emphasis on the use of models that enable simulation at the farm level or at the level of a selected aggregate [6], and suggest that each member state should choose the priorities of its agricultural policy and, in accordance with common principles, determine the type, allocated funds and scope of individual measures. Since the effects of agricultural policies might significantly differ by farm type, the farm-level modeling becomes an important tool to support planning of policies in order to increase sustainable development of the sector. It aims to generate scenarios or “what if” analyses, and simulate how a certain scenario, for example a change in prices of agricultural resources, agricultural or environmental policy, can affect a set of performance indicators [7]. So far, economic analyses of Croatian agriculture have mainly relied on macroeconomic models based on partial and general equilibrium approaches [8], applied at the aggregate level, such as regions and countries. These models cannot fully capture the effect of new agricultural policies at the level of the agricultural holdings [9] so the use of farm models (with focus at the level of the agricultural holdings) has become an important activity of agrarian economists [10].
In this context, an important question is how to adequately classify and represent the diversity of dairy farms within the sector. To date, the typification of Croatian dairy farms has predominantly been based on a single structural criterion, namely the number of cows. Although herd size is an important indicator of production capacity, it provides only a limited insight into the overall characteristics of a farm. Farms with a similar number of cows may differ substantially in terms of land availability, production intensity, milk production, labor efficiency, breeding technology, production organization, economic performance and all three aspects of sustainability. Therefore, classification based solely on herd size may group farms with substantially different production systems and economic characteristics while overlooking important dimensions of farm heterogeneity.
This limitation is particularly relevant when farm types are used as a basis for farm-level modeling. A representative farm defined primarily by herd size may not adequately reflect the production and economic conditions of the farms it represents, potentially limiting the assessment of their differentiated responses to agricultural policy measures and market changes. Therefore, a more comprehensive and empirically based typology is needed, one that simultaneously considers multiple relevant characteristics and identifies groups of farms that are relatively homogeneous across several dimensions.
In Croatia, this room for maneuver has been used through the CAP Strategic Plan 2023–2027, in which the selection of interventions was based on a needs assessment conducted with stakeholders and experts and on a subsequent prioritization of the identified needs [11]. Quantitative ex-ante support for such choices has so far been provided mainly by sector level partial equilibrium models, which reproduce market and trade adjustments well but remain aggregate and do not capture the heterogeneity of responses across individual holdings [12]. Since the Commission’s post 2027 proposal integrates the CAP into National and Regional Partnership Plans and further widens the discretion of Member States in designing interventions [13], the need for complementary farm-level tools capable of translating policy options into expected effects at holding level is likely to grow.
For the purpose of different analyses, it is neither feasible nor meaningful to conduct the analysis at the level of every individual farm. Instead, analysis are typically performed using typical representatives known as typical farms [14]. In this approach farms are classified into groups with common production characteristics, forming categories referred to as typical agricultural holdings [15]. These may represent either real or hypothetical holdings that best represent the situation in a certain segment of a particular sector (representative agricultural holdings) and allow generalization at the aggregate level.
The economic analysis at the level of typical agricultural holding’s approach has a long history. It originates from the concept of the “representative firm” devised by Alfred Marshall and was further developed for microeconomic theory by Frank Taussig at the beginning of the 20th century. However, the idea of a “typical farm” has gained renewed attention only in recent decade, particularly in the field of agricultural economic analysis [16], where it serves as an important tool for assessing the economic performance and development prospects of agricultural production systems.
The results of the analysis will enable a comprehensive assessment of the sector through three key dimensions of sustainability—economic, environmental and social. At the same time, regional specificities and differences between farms with regard to their size, production orientation and technological level will be taken into account. Such an approach provides a high-quality analytical basis for designing more effective development strategies and targeted support measures aimed at increasing the competitiveness, resilience and long-term sustainability of the Croatian dairy sector.
The main objective of this study is to identify typical family dairy farms in the Republic of Croatia by applying cluster analysis to the full population of dairy farms. From a scientific perspective, the study contributes to a better understanding of the structural heterogeneity of Croatian family dairy farms by identifying relatively homogeneous farm groups based primarily on their structural and production characteristics. The technological and economic dimensions of the identified farm groups will be examined in greater detail in subsequent stages of the research, providing a basis for their further characterization and the development of typical farm models within the CroTFarm framework. The identification of such representative farm types provides a basis for a more detailed structural and economic analysis of the sector and, more importantly, represents an empirical basis for the further development of a farm-level modeling tool. Based on these results, further development of the SiTFarm tool (Slovenian Typical Farm Model) into CroTFarm (Croatian Typical Farm Model) is planned, which will enable a comprehensive assessment of the current state of milk production in Croatia. The practical relevance of the research lies both in the developed typology and in its subsequent implementation in the CroTFarm model. The identified types of typical dairy farms provide a structured representation of the diversity of dairy farming systems in Croatia and can already be used as a basis for research on the structure, economic performance, and development of the Croatian dairy sector. They may also facilitate comparisons with dairy farming systems in other EU Member States and support analyses of differences in farm characteristics and production systems. In addition, the typology forms the basis for adapting and further developing the SiTFarm model to the Croatian context. The resulting CroTFarm model is intended to provide researchers, agricultural policy makers, public institutions, and advisory services with a tool for farm-level analyses and for assessing the effects of agricultural policies, market changes, and other relevant scenarios on different types of dairy farms. Similar approaches have recently been applied in farm typology research, with [17] using Farm Accountancy Data Network (FADN) data and clustering methods to classify farms according to their structural, operational, and socio-economic characteristics.
SiTFarm is a micro-simulation tool based on mathematical programming and represents an example of a bio-economic farm model (BEFM). It enables analyzes at the level of production plans of individual farms, while its results can also be aggregated to the sector level [18]. The primary purpose of SiTFarm is to analyze economic sustainability of typical agricultural holdings that represent a broader group of real farms. An important advantage of the model is that it does not require data from the FADN system, which allows the inclusion also of smaller farms that would otherwise remain outside the scope of such analyses.
The model generates a wide range of economic indicators and enables the simulation and evaluation of various interventions within the Common Agricultural Policy (CAP), tailored to specific production conditions and different types of farms. This takes into account not only production and economic aspects, but also the broader socio-economic context in which farms operate. In order to ensure a high level of representativeness and reliability of the results, the adapted farm model will be developed and calibrated in cooperation with experts, producers and other relevant stakeholders in the sector. Technological and production parameters will be adapted to Croatian production conditions, thus enabling a realistic presentation of the state and development opportunities of the dairy sector in the Republic of Croatia.
Dairy farms represent the basis of entire dairy sector, and their structure, productivity and development directly determine the competitiveness and sustainability of the entire sector. According to [19], dairy farms within the European Union show significant differences in size, production intensity, technological equipment and organizational characteristics, with similar heterogeneity present in Croatia. It is precisely because of such diversity that it is necessary to identify representative farm types that can serve as a basis for modeling and assessing the effects of various development and policy measures.
The remainder of the paper is organized as follows. First, the dataset used in the analysis is presented, as well as the variables used to shape the structure of typical dairy farms. In addition, key descriptive statistics are presented to provide an initial overview of the data and highlight the main characteristics and variability within the sample. This is followed by the methodological framework and a description of the applied cluster analysis. The paper concludes with a summary of the main findings and the final classification of dairy farms, which will serve as the starting point for the development of a SiTFarm model for dairy farms in the Republic of Croatia (CroTFarm).
2. Materials and Methods
2.1. Data
The empirical analysis was conducted using data provided by the Croatian Agency for Agriculture and Food (Agency). The dataset includes information collected from all agricultural holdings in the Republic of Croatia that deliver milk to dairies. Farmers are required to report data in a standardized format that includes key production and structural characteristics of the holdings. All data are recorded at the level of individual agricultural holdings. The initial database contained records for 4198 dairy farms that deliver milk in Croatia. Since there was no single comprehensive dataset that would include all the necessary information (such as the number of dairy cows, the amount of milk delivered, the land-use structure, crop rotation, labor force characteristics, farm location), the final analytical dataset was constructed by integrating several databases provided by the Agency for the year 2022.
Statistical processing and data analysis were performed using IBM SPSS Statistics for Windows, Version 22.0 (IBM Corp., Armonk, NY, USA).
Several issues had to be resolved during the data preparation process, including multiple identifiers referring to the same farm, duplicate records, and inconsistencies such as farms not reporting zero dairy cows. After linking data from different sources, removing duplicates and inactive farms, and correcting inconsistencies, the final dataset used for analysis consisted of 3393 farms. Among them, 3331 farms are family farms, while 62 farms operate as legal entities. Farms classified as legal entities represent a separate category of large and highly specialized dairy farms that play an important role in national milk production and will be the subject of further study. In this paper, we analyze only family farms, among which there are also several relatively large milk producers.
2.2. Classification of Variables
In order to capture the most important structural dimensions of milk production, the observed variables were grouped into five categories. They reflect the key structural characteristics of dairy farms: farm production size, land resources and structure, farm structure and regional characteristics. The variables used in the analysis are described in Table 1. In addition to the original variables, two additional variables were defined to better describe the structure of milk production. The first additional variable is the land area per cow (ha/cow), which was used as a proxy for the land resources available per dairy cow and, indirectly, for the extensiveness of the production system. It is calculated as the ratio between the total utilized agricultural area and the number of dairy cows on the farm. Lower values indicate a higher degree of production intensification, while higher values indicate a more extensive production system. The second variable, milk production per cow, was calculated to provide us with an indication of production efficiency. The number of crops (NOCR) represents the total number of different crops grown on the farm, including both crops used for feeding dairy cows and other crops produced for different purposes, such as cash and industrial crops (e.g., oilseeds and root crops). Therefore, NOCR was used as an indicator of overall crop production diversity at the farm level. Lower values in general indicate a higher degree of specialization, while higher values suggest a more diversified production structure.
Table 1.
Overview of variables included in the analysis.
Quantitative variables and their descriptive statistics are presented in Table 2. For each quantitative variable the following descriptive measures were calculated: mean value (Mean), standard deviation (SD), minimum (Min), maximum (Max), and quartiles (Q1 and Q3).
Table 2.
Descriptive statistics of variables.
As can be seen from Table 2, the first category includes farms that raise an average of 14.78 dairy cows, with the median (Q2) being 10 cows. On 75% of these farms, the number of dairy cows (NOC) is less than 18, while only 25% of the farms have more than 18 cows. However, the extremely high maximum value (Max = 456) indicates the presence of extreme values (outliers), which further confirms the right asymmetry of the distribution. The standard deviation (SD = 20.47) is significantly higher than the arithmetic mean (Mean = 14.78), which indicates high variability of the data and further confirms the heterogeneity of the set. Such a value of the standard deviation is a consequence of the presence of extreme deviation in the data which significantly increase the dispersion of the data. Due to the above distribution characteristics, the arithmetic mean and standard deviation are not optimal measures of central tendency and dispersion, since they are sensitive to extreme values. In this case, the median is a more representative indicator of the typical value. The same applies to annual milk production (AMP). Here the differences are even greater because, in addition to herd size, lactation milk yield, which reflects production intensity, also plays an important role. Here, the right-hand skewness of the distribution is even greater, with extreme values that significantly increase variability and affect the arithmetic mean and standard deviation. Here too, the median is a more reliable measure of central tendency than the arithmetic mean. This indicator further highlights the high variability of family dairy farms. The median is 34,840 kg of milk per year, with 75% of farms producing less than 76,882 kg of milk per year. Some variables have extremely low medians and quartiles (often Q1 = Q2 = Q3 = 0), indicating so-called zero-inflated distributions, where most observations have a value of zero or close to zero, while a small number of extreme values significantly increase the overall range. These variables describe land-use characteristics, such as the area of arable land (AL) and pasture (PL), where many units report no activity (zero values), while a smaller number of observations represent large agricultural areas, leading to a very asymmetric distribution. We can observe that on family farms engaged in milk production, the number of agricultural activities (NOCR) averages 6.3. The variability here is significantly lower, indicating that, in most cases, it involves home-produced fodder. However, in 25% of cases, we can also find examples of more diversified production plans where the number of plant cultures exceeds 5. The area under cultivation (AUC), again shows greater variability. On average, dairy farms cultivate 23.68 ha, with a median of 14.1 ha, and the largest 25% of farms more than 27.4 ha. Only the variable NHM has a relatively stable and homogeneous distribution with low variability. This is a variable that describes the number of employees on the farm, and the results indicate that most of the observed units employ a similar, small number of workers. Such a distribution indicates a relatively uniform structure of labor on farms, without major differences between most farms, which suggests that production in the observed sample mainly relies on small and medium-sized labor capacities.
Three qualitative variables are described by their frequencies. The first variable refers to the type of farm, i.e., the administrative and organizational form of the agricultural holding within the Croatian agricultural system: FF (Family Farm), IF (Independent Farm) and TC (Craft). In total, 3331 agricultural holdings were included in the analysis, of which 3220 were classified as Family Farms (FFs), 15 as Independent Farms (IFs), and 96 as Crafts (TC).
The most common type is FF (3220 holdings), which refers to agricultural holdings organized as family farms (OPGs) and operated by natural persons. IF (15 holdings) refers to agricultural holdings operated by an individual registered for agricultural activity. TC (96 holdings) refers to crafts registered for agricultural activity and operated by natural persons.
These three categories represent different administrative and organizational forms of agricultural holdings rather than different types of agricultural production or production orientation. In the Croatian administrative system, all three categories are operated by natural persons and can broadly be considered family-operated agricultural holdings.
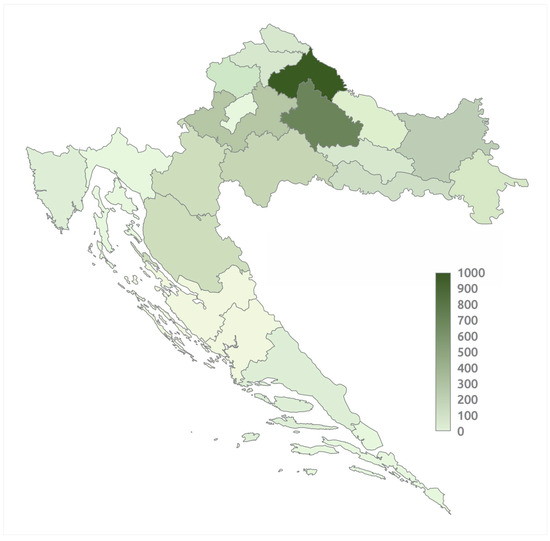
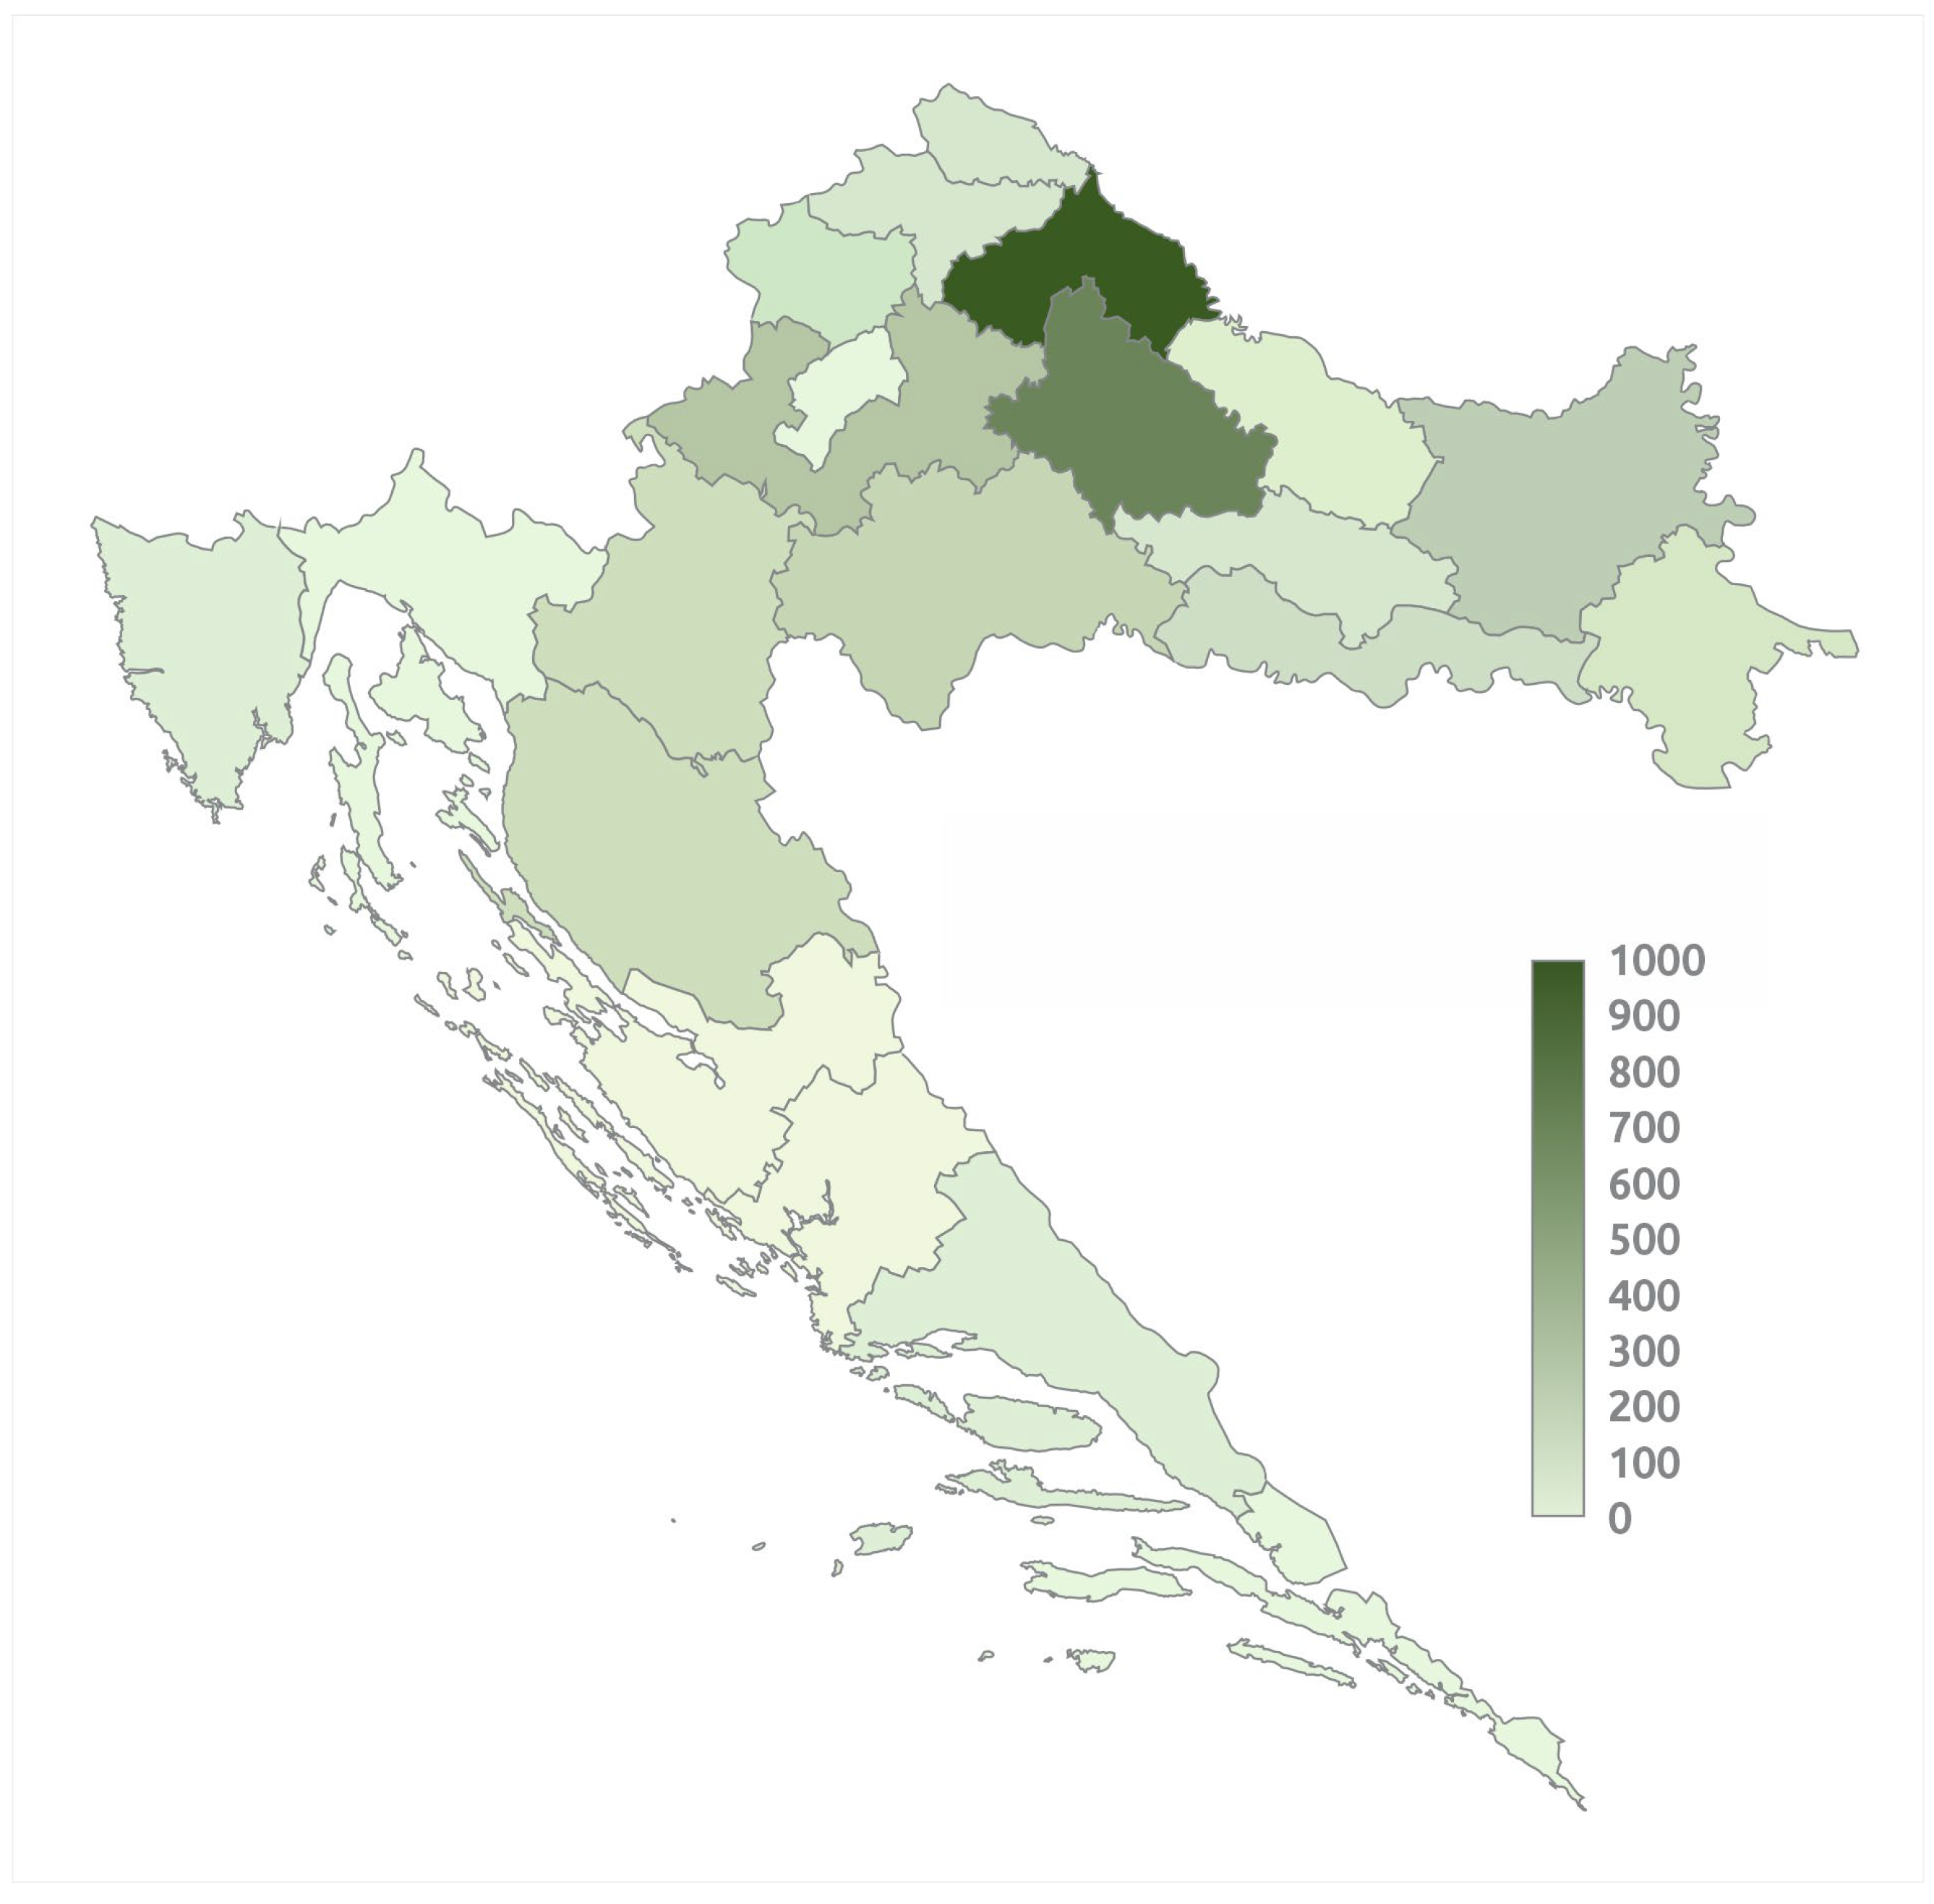
The remaining two qualitative variables refer to regional characteristics, i.e., the location of the agricultural holding (county and wider statistical region). The regional classification follows the national statistical regional division (NUTS 2 level) defined in 2021, according to which Croatia is divided into four statistical regions [20]: Pannonian Croatia, Adriatic Croatia, City of Zagreb and Northern Croatia. The majority of dairy farms are located in the Pannonian region (47%) and Northern Croatia (45%). Both regions are located in the continental part of the country and together cover eight and five Croatian counties, respectively. The Adriatic region (7%) covers the coastal part of Croatia and consists of seven counties. As expected, the smallest share of farms is located in the City of Zagreb (around 1%). The regional distribution of dairy farms in all 21 counties is shown on the map (Figure 2).
Figure 2.
Geographical distribution of dairy farms across all 21 counties (NUTS3).
2.3. Selection of Variables for Cluster Analysis
As part of the preparatory phase of the cluster analysis, a correlation analysis was performed among the quantitative variables using Pearson’s correlation coefficient to assess the degree of their linear association and identify potentially redundant variables. Variables that showed a high correlation with each other (r > 0.8) were excluded from further analysis to reduce information redundancy and ensure that the retained variables provide sufficiently distinct information relevant to the objectives of the cluster analysis. A low Pearson’s correlation coefficient was not interpreted as evidence of statistical independence among the variables. The analysis was performed using IBM SPSS Statistics V22.0.
The results showed that several quantitative variables describing the overall level of production were strongly linearly associated with each other (Table 3). To avoid information redundancy and ensure the stability of the clustering procedure, variables providing sufficiently distinct and relevant information on the structural and production characteristics of dairy farms were retained in the final set. Based on the correlation analysis, the following four quantitative variables were selected for the cluster analysis: number of dairy cows per farm (NOC), number of crops (NOCR), agricultural land area per cow (APC), and milk production per cow (MPPC). Their descriptive statistics are presented in Table 2.
Table 3.
Pearson correlation coefficients among farm, land-use, and production variables.
The variable “number of employees” was not included in the cluster analysis because it did not demonstrate sufficient discriminatory ability to clearly distinguish between farms. Its inclusion would not have substantially contributed to the formation of homogeneous and clearly separated clusters and was therefore excluded from the final set of variables used for the cluster analysis.
The variables “farm type,” county, and region were not included in the Pearson correlation analysis because they represent nominal categorical variables, and their coding using numerical values does not allow Pearson’s correlation coefficient to be applied appropriately.
The two variables related to the NUTS regional classification were not included in the clustering procedure but were subsequently used to analyze the spatial distribution of the resulting farm types.
2.4. Cluster Analysis
Cluster analysis was applied in order to identify groups of dairy farms with similar structural characteristics. The analysis was performed using the software package IBM SPSS Statistics V22.0. The clustering procedure was conducted using the variables previously selected through correlation analysis.
In order to ensure comparability of variables measured in different units, all variables were standardized prior to clustering using the z-score transformation. For each variable x the standardized value z was computed as z = (x − μ)/σ, where μ denotes the arithmetic mean and σ the standard deviation of the variable x.
Ward’s method merges clusters in a way that minimizes the increase in the within-cluster sum of squares. If denotes a cluster with centroid , the within-cluster variability is defined as
At each step the algorithm merges the pair of clusters that produces the smallest increase in the total within-cluster variance.
The results of hierarchical clustering are commonly visualized using a dendrogram, which illustrates the hierarchical structure of cluster partitions and provides guidance in selecting the appropriate number of clusters.
In the second stage, a non-hierarchical clustering method, namely the k-means algorithm [21], was applied in order to refine the cluster partition. The k-means algorithm assigns observations to a predefined number of clusters k and iteratively updates cluster centroids so as to minimize the objective function
The objective of the clustering procedure is therefore to obtain clusters that are internally homogeneous while being clearly separated from each other, that is, to minimize within-cluster distances and maximize between-cluster distances.
Since the variables used in the clustering procedure were previously selected through correlation analysis and represent independent structural characteristics of farms, the clustering procedure leads to a well-defined solution.
2.5. Radar Chart
To illustrate the multidimensional structure of the variables used in the clustering procedure, the standardized values of the selected variables are displayed using a radar diagram. Each axis of the radar diagram corresponds to one of the variables included in the clustering procedure: number of dairy cows on the farm (NOC), number of crops (NOCR), land area per cow (APC) and milk production per cow (MPPC).
The radar diagram provides a graphical representation of the relative position of farms in the multidimensional feature space defined by these variables. Such visualization facilitates the interpretation of structural differences between farm types (clusters) and supports the identification of characteristic cluster profiles.
The radar diagram presented in the analysis was generated using Python (version 3.14.6) with the libraries pandas (version 3.0.3) and Matplotlib (version 3.11.0).
Finally, the resulting cluster structure and identified farm types will be assessed and validated by sector experts and practitioners. Their assessment will ensure that the resulting clusters correspond to economically significant and practically relevant farm typologies, which will then serve as the basis for building representative farms used in further modeling with the SiTFarm and developing CroTFarm model.
3. Results
3.1. The Hierarchical Cluster Analysis
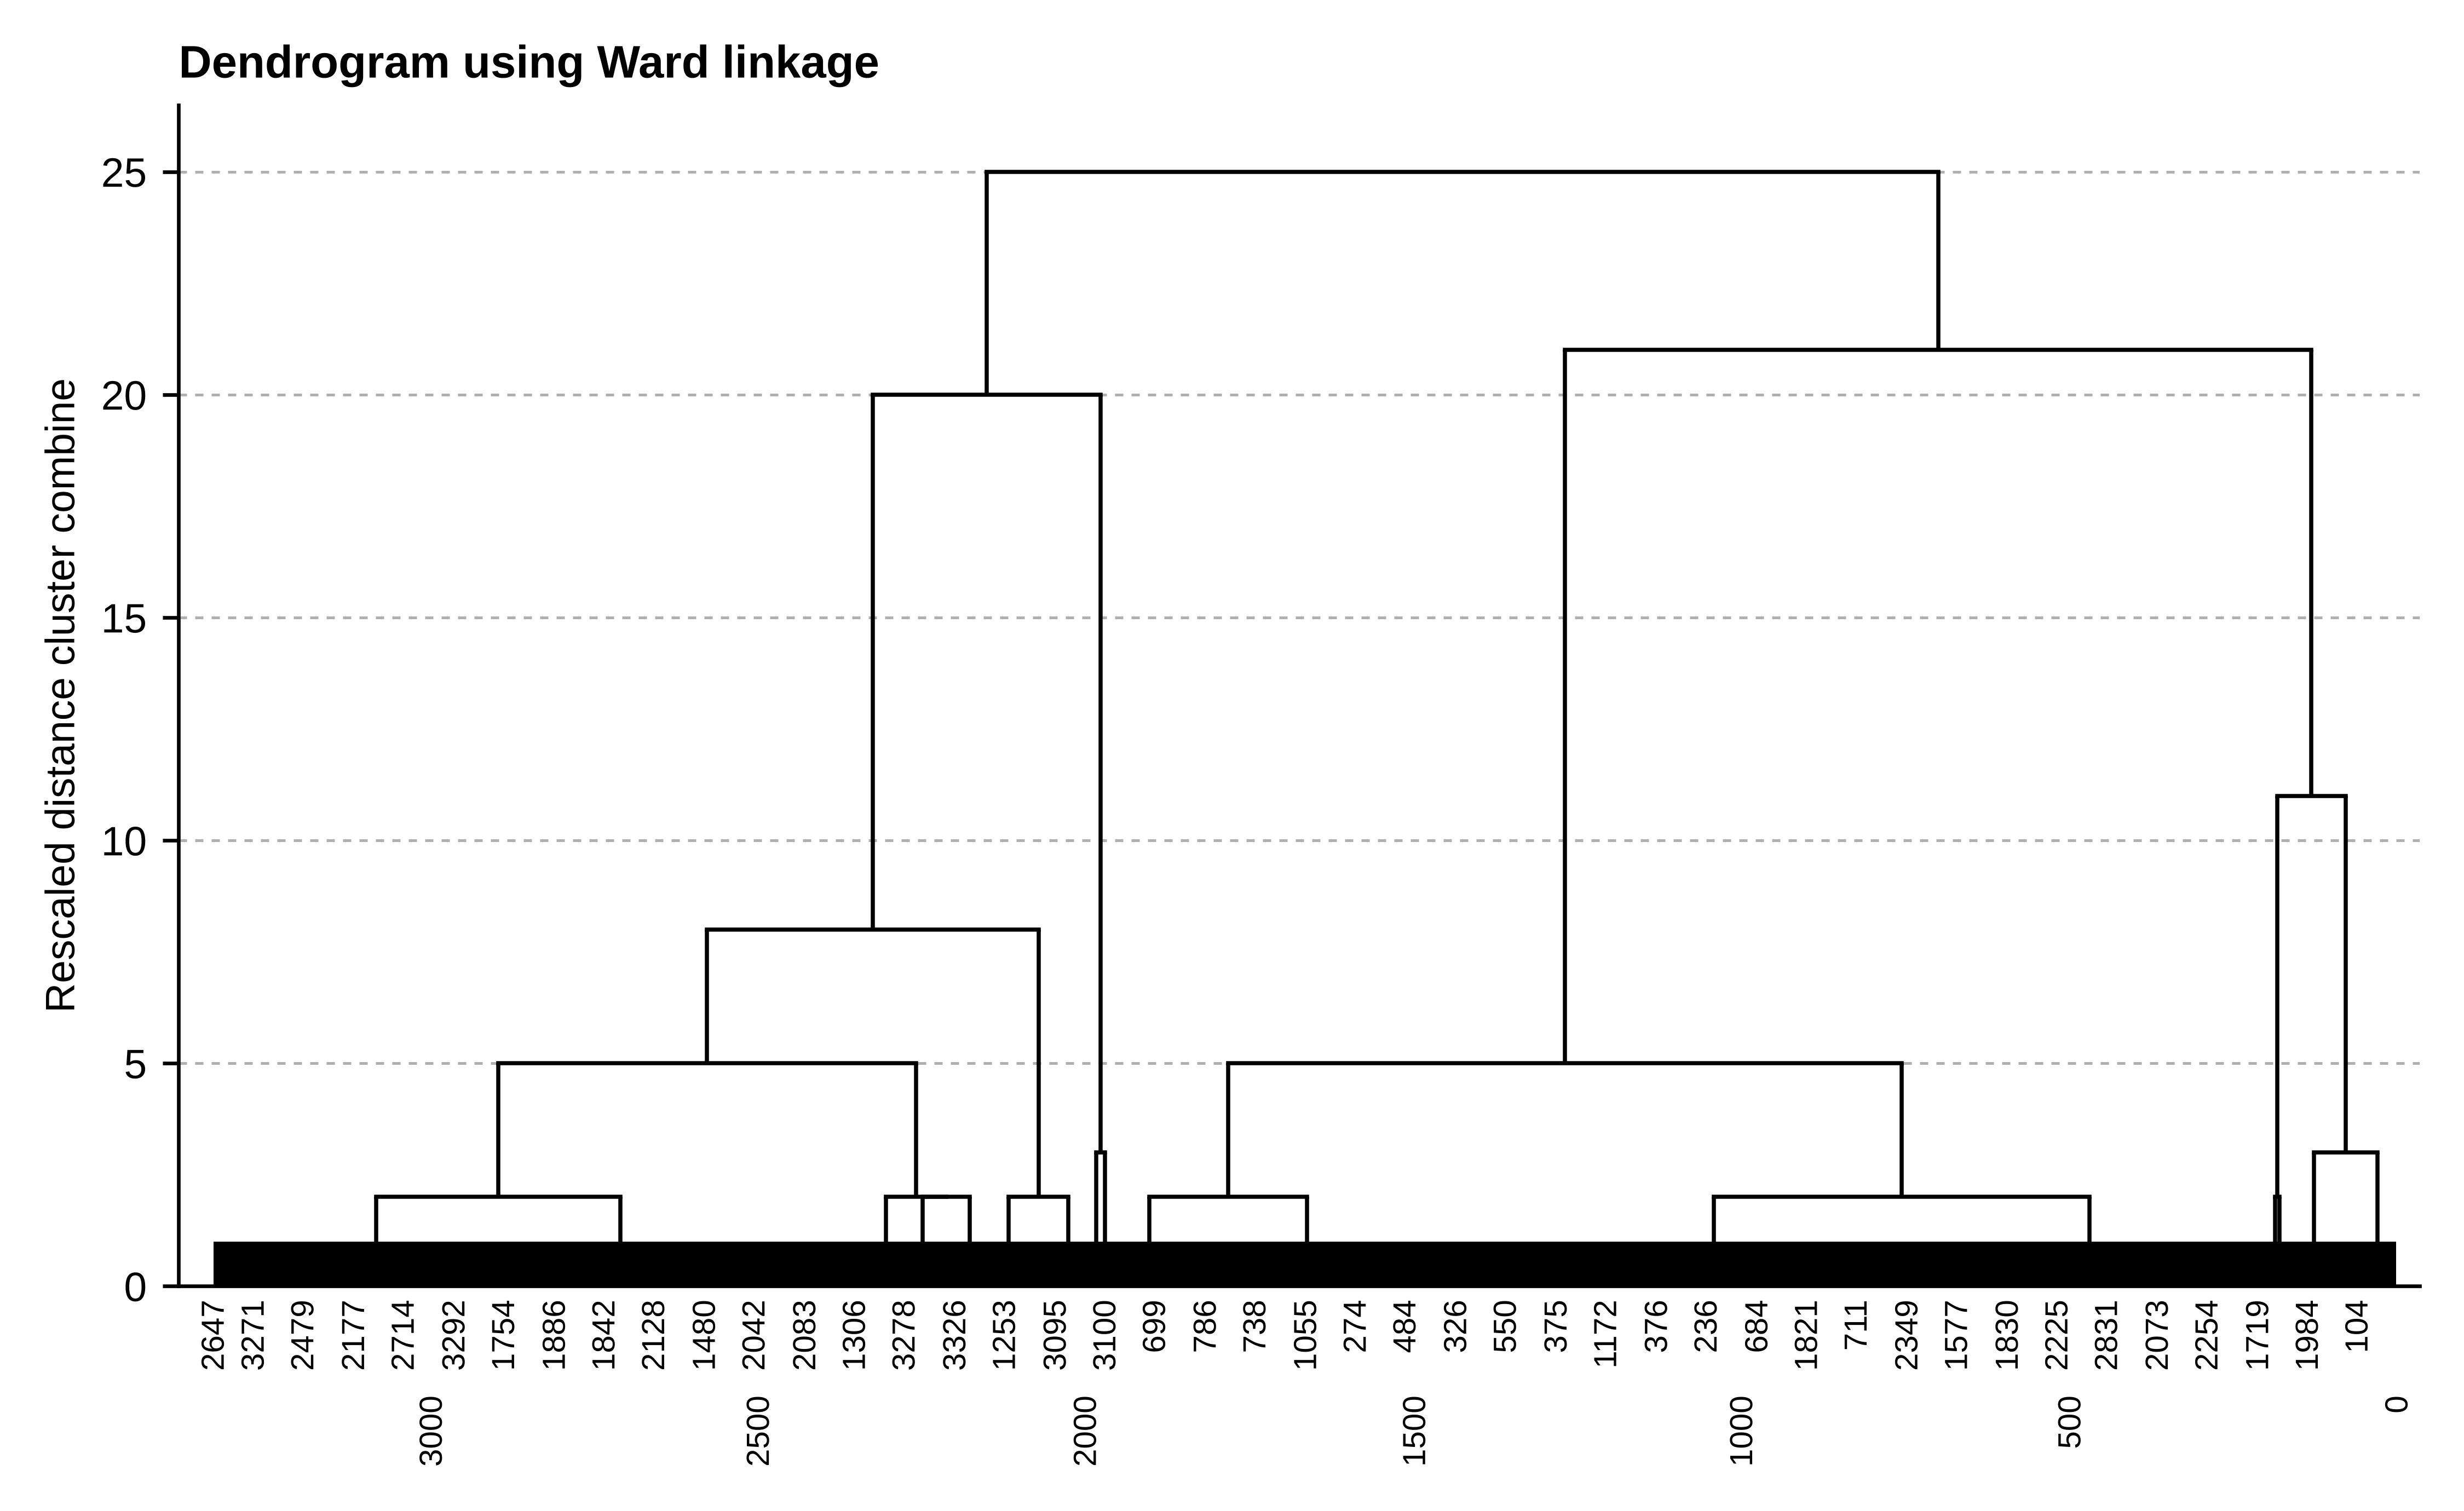
The hierarchical cluster analysis of dairy farms is shown in Figure 3. The dendrogram illustrates how farms are grouped based on similarities among selected variables, which allows for the identification of natural structures within the dataset. When interpreting the dendrogram obtained by hierarchical cluster analysis, the maximum number of clusters (n = 17) was chosen to preserve the maximum level of information in the early phase of segmentation. This approach allows for finer differentiation among the observed units and reduces the risk of over-aggregation of the data. The solution of 17 clusters was found to be appropriate because it reflects good heterogeneity among family dairy farms.
Figure 3.
Dendrogram using Ward’s linkage method. Legend: The dendrogram contains all individual farms along the x-axis. Due to the large number of observations (n = 3331), individual farms cannot be distinguished visually at the scale presented. The y-axis represents the rescaled distance cluster combine, indicating the level of dissimilarity at which clusters are merged.
The dendrogram contains all individual farms along the x-axis. Due to the large number of observations, individual farms cannot be distinguished visually at the scale presented in Figure 3. Therefore, the resulting clusters were subsequently assigned to individual farms to determine cluster membership and to enable further analysis of the characteristics of each cluster.
In addition, the selection of a larger number of clusters is driven by the requirements of future modeling, since this classification is the first step in the development of a farm model (SiTFarm). Such a model requires a more detailed segmentation of production units. A larger number of clusters allows for a more precise identification of farm types and provides an adequate basis for modeling different production structures and scenarios.
This approach is consistent with the methodological considerations of [22] and [23], who emphasize that the determination of the appropriate number of clusters is not governed by a single universal criterion, but should consider the characteristics of the data, the clustering procedure, and the interpretability and practical relevance of the resulting cluster solution. In the present study, the choice of 17 clusters was therefore based not only on the structure of the dendrogram, but also on the need to retain sufficient detail for the subsequent development of the SiTFarm model.
Inspection of the dendrogram revealed that three cases with extreme values formed singleton clusters (clusters 15, 16, and 17), characterized by exceptionally high values on the Average NOC variable (317, 456, and 207, respectively). These values deviate substantially from the rest of the sample. This behavior confirms that the algorithm correctly identified and isolated genuinely atypical cases, as merging them with any existing cluster would have disproportionately increased the within-cluster variance—the criterion Ward’s method seeks to minimize. The substantive interpretation of the cluster solution is therefore based on the remaining 3328 observations.
To verify the robustness of the cluster solution, a discriminant analysis was conducted using the four clustering variables as predictors and cluster membership as the grouping variable. The analysis correctly classified 98.9% of the original cases, while cross-validation (leave-one-out classification) yielded a correct classification rate of 98.7%, confirming that the results are not an artifact of overfitting and that the cluster solution is stable and robust.
The number of 17 clusters was determined based on the agglomeration schedule, which showed a substantial increase in coefficients at the final merging stages, indicating that further reduction in the number of clusters would result in combining meaningfully distinct groups.
3.2. A Non-Hierarchical Approach (k-Means)
After hierarchical analysis (dendrogram), a non-hierarchical algorithm (k-means) was applied to the data, with a maximum of 17 clusters. Table 4 shows the composition of all clusters after the implementation of k-means, illustrating the distribution of farms into the 17 clusters. It shows the main characteristics of each cluster: the number of farms within each cluster (NOF), the average number of cows per cluster (NOC), the average number of crops (NOCR), the average area per cow (APC) and the average yield per cow (MPPC) for each cluster.
Table 4.
Cluster structure of family dairy farms sorted by the number of farms.
The assignment of farms to individual clusters was determined by the clustering procedure based on the combined values of the four variables included in the analysis. Therefore, cluster membership reflects the overall similarity of farms according to the selected characteristics, rather than their position according to any single variable. For presentation purposes, the clusters in Table 4 are sorted according to the value of one of the four variables included in the cluster analysis, with the selected variable used solely to determine the order in which the clusters are presented, and not as a criterion for cluster formation or farm assignment. Cluster 1 contains 29% of the family farms. The average number of cows in this cluster (10.69) is lower than the average number of cows in the Republic of Croatia (14.78), the average number of crops (6.92) is little bigger than the national average of 6.29, the average land area per cow (1.61 ha) is lower than the national average (2.34 ha). This implies that Cluster 1 consists of very small dairy farms. Cluster 1 represents a group of extensive, small-scale and less intensive family dairy farms that rely on diversification of agricultural production. These farms are characterized by a balanced but more extensive management style, with an emphasis on combining livestock and crop production. Due to its size, this cluster can be considered representative of a large proportion of family dairy farms that operate with a more modest resource base and achieve more moderate production results.
Cluster 2 includes a significant share of the observed farms (25%) and represents a group of farms that are similar in their characteristics to those in Cluster 1. However, unlike them, farms in this cluster show a higher degree of production specialization, with a lower diversity of crop production (3.85) and a more limited land base (1.18 ha per cow). Such a structure indicates farms that are more focused on basic dairy production, with a lower proportion of additional agricultural activities. Cluster 2 can therefore be described as a group of more specialized family dairy farms operating on relatively limited land resources.
Cluster 3 represents a group of extremely small dairy farms (5.16 cows), but with a higher level of production efficiency per livestock unit (4765.66). Despite the limited herd size and less developed crop production structure (5.14), these farms are characterized by above-average milk production per cow, which indicates a more intensive approach to production management and a better-quality organization of livestock activities. At the same time, the greater availability of land resources per head indicates more favorable land and livestock ratios, which can contribute to better food supply and more stable production conditions. Overall, Cluster 3 can be described as a group of small but relatively efficient dairy farms that, despite their modest structure, achieve above-average production levels per cow.
Cluster 4 (11%) is characterized by a pronounced diversity of crop production compared to other groups of small farms. This cluster stands out for its larger number of cultivated crops, which indicates a high level of production diversification and a broader orientation towards cash crops production.
Cluster 7 includes very small dairy farms with a very limited number of heads, but a favorable ratio of resources to livestock. Despite the modest size of the herd, these farms are characterized by a relatively high level of production efficiency and above-average values of most of the observed indicators. Of particular note is the significantly higher availability of land per cow, which is many times higher than the national average, indicating an extensive production system with favorable conditions for food supply and low livestock pressure on land resources. Overall, Cluster 7 can be described as a group of small farms that, despite their limited size, demonstrate relatively high milk production per cow and production stability.
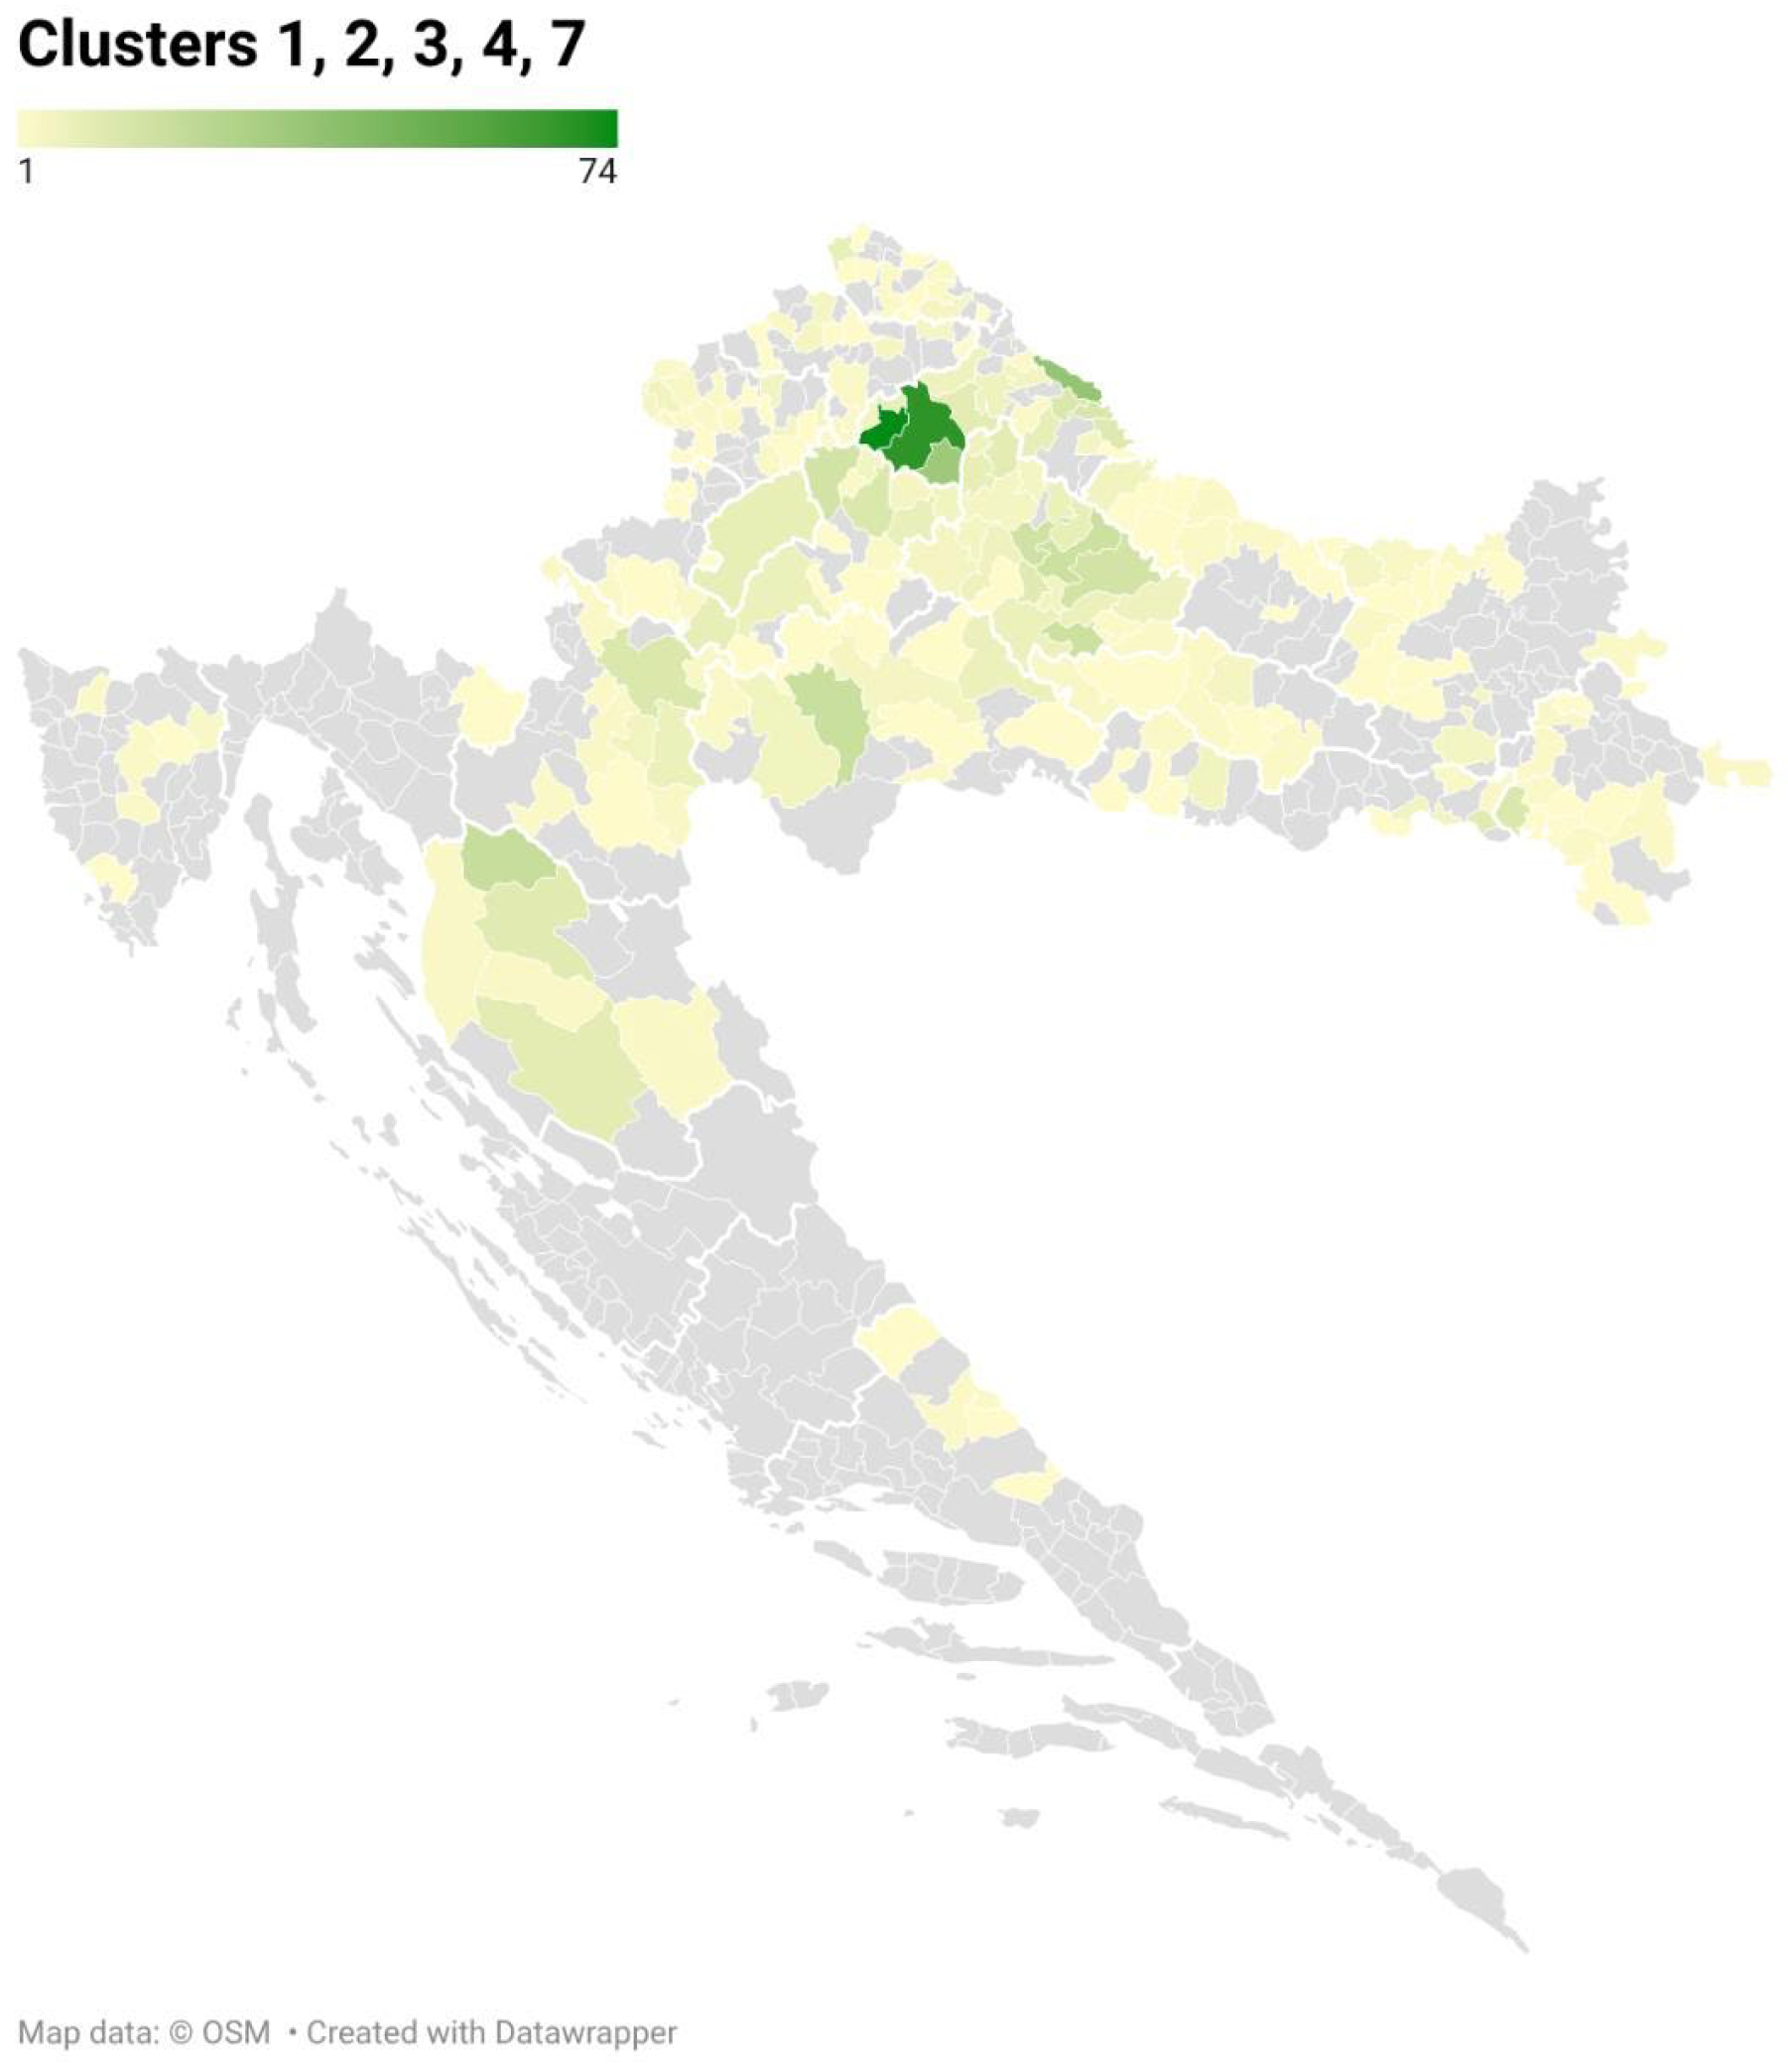
The aforementioned clusters (1, 2, 3, 4, 7) form the dominant part of the observed sample and together account for 79% of all existing farms. What they have in common is that they are very small dairy farms, with an average number of cows ranging from approximately 5 to 11 heads per farm. This structure indicates a distinct predominance of small family farms in the total population, although within this group certain differences can still be observed in the level of production efficiency, resource-use intensity and production organization. Despite the heterogeneity of individual characteristics, these clusters together define the basic structural pattern of the dairy sector, characterized by small livestock and varying degrees of adaptation to limited production resources.
In order to further complement the cluster analysis and provide a regional perspective, maps of Croatia have been created, each of which illustrates the geographical distribution of farms belonging to the most significant clusters. These maps provide a clearer understanding of how the dominant types of farms are regionally distributed across the country. The first figure, Figure 4, shows a map of the Republic of Croatia with the spatial distribution of the aforementioned clusters and clearly illustrates their wide and dispersed presence across different regions.
Figure 4.
Geographical distribution of Clusters 1, 2, 3, 4, and 7 across Croatian municipalities. Values range from 1 (yellow) to 74 (dark green). Grey areas indicate municipalities with no dairy farms belonging to the clusters shown.
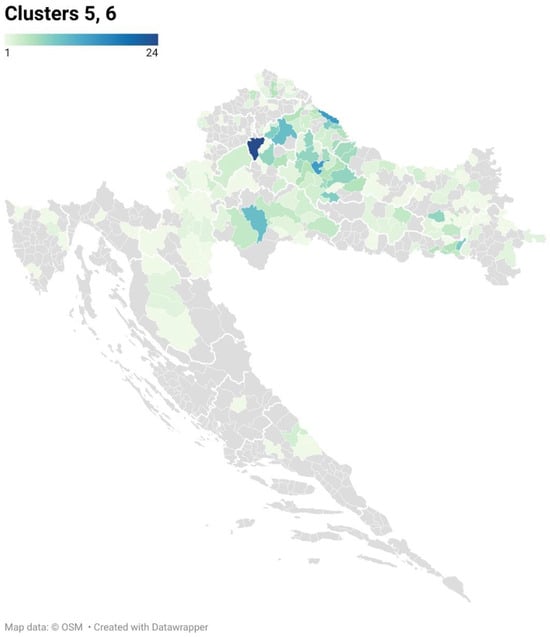
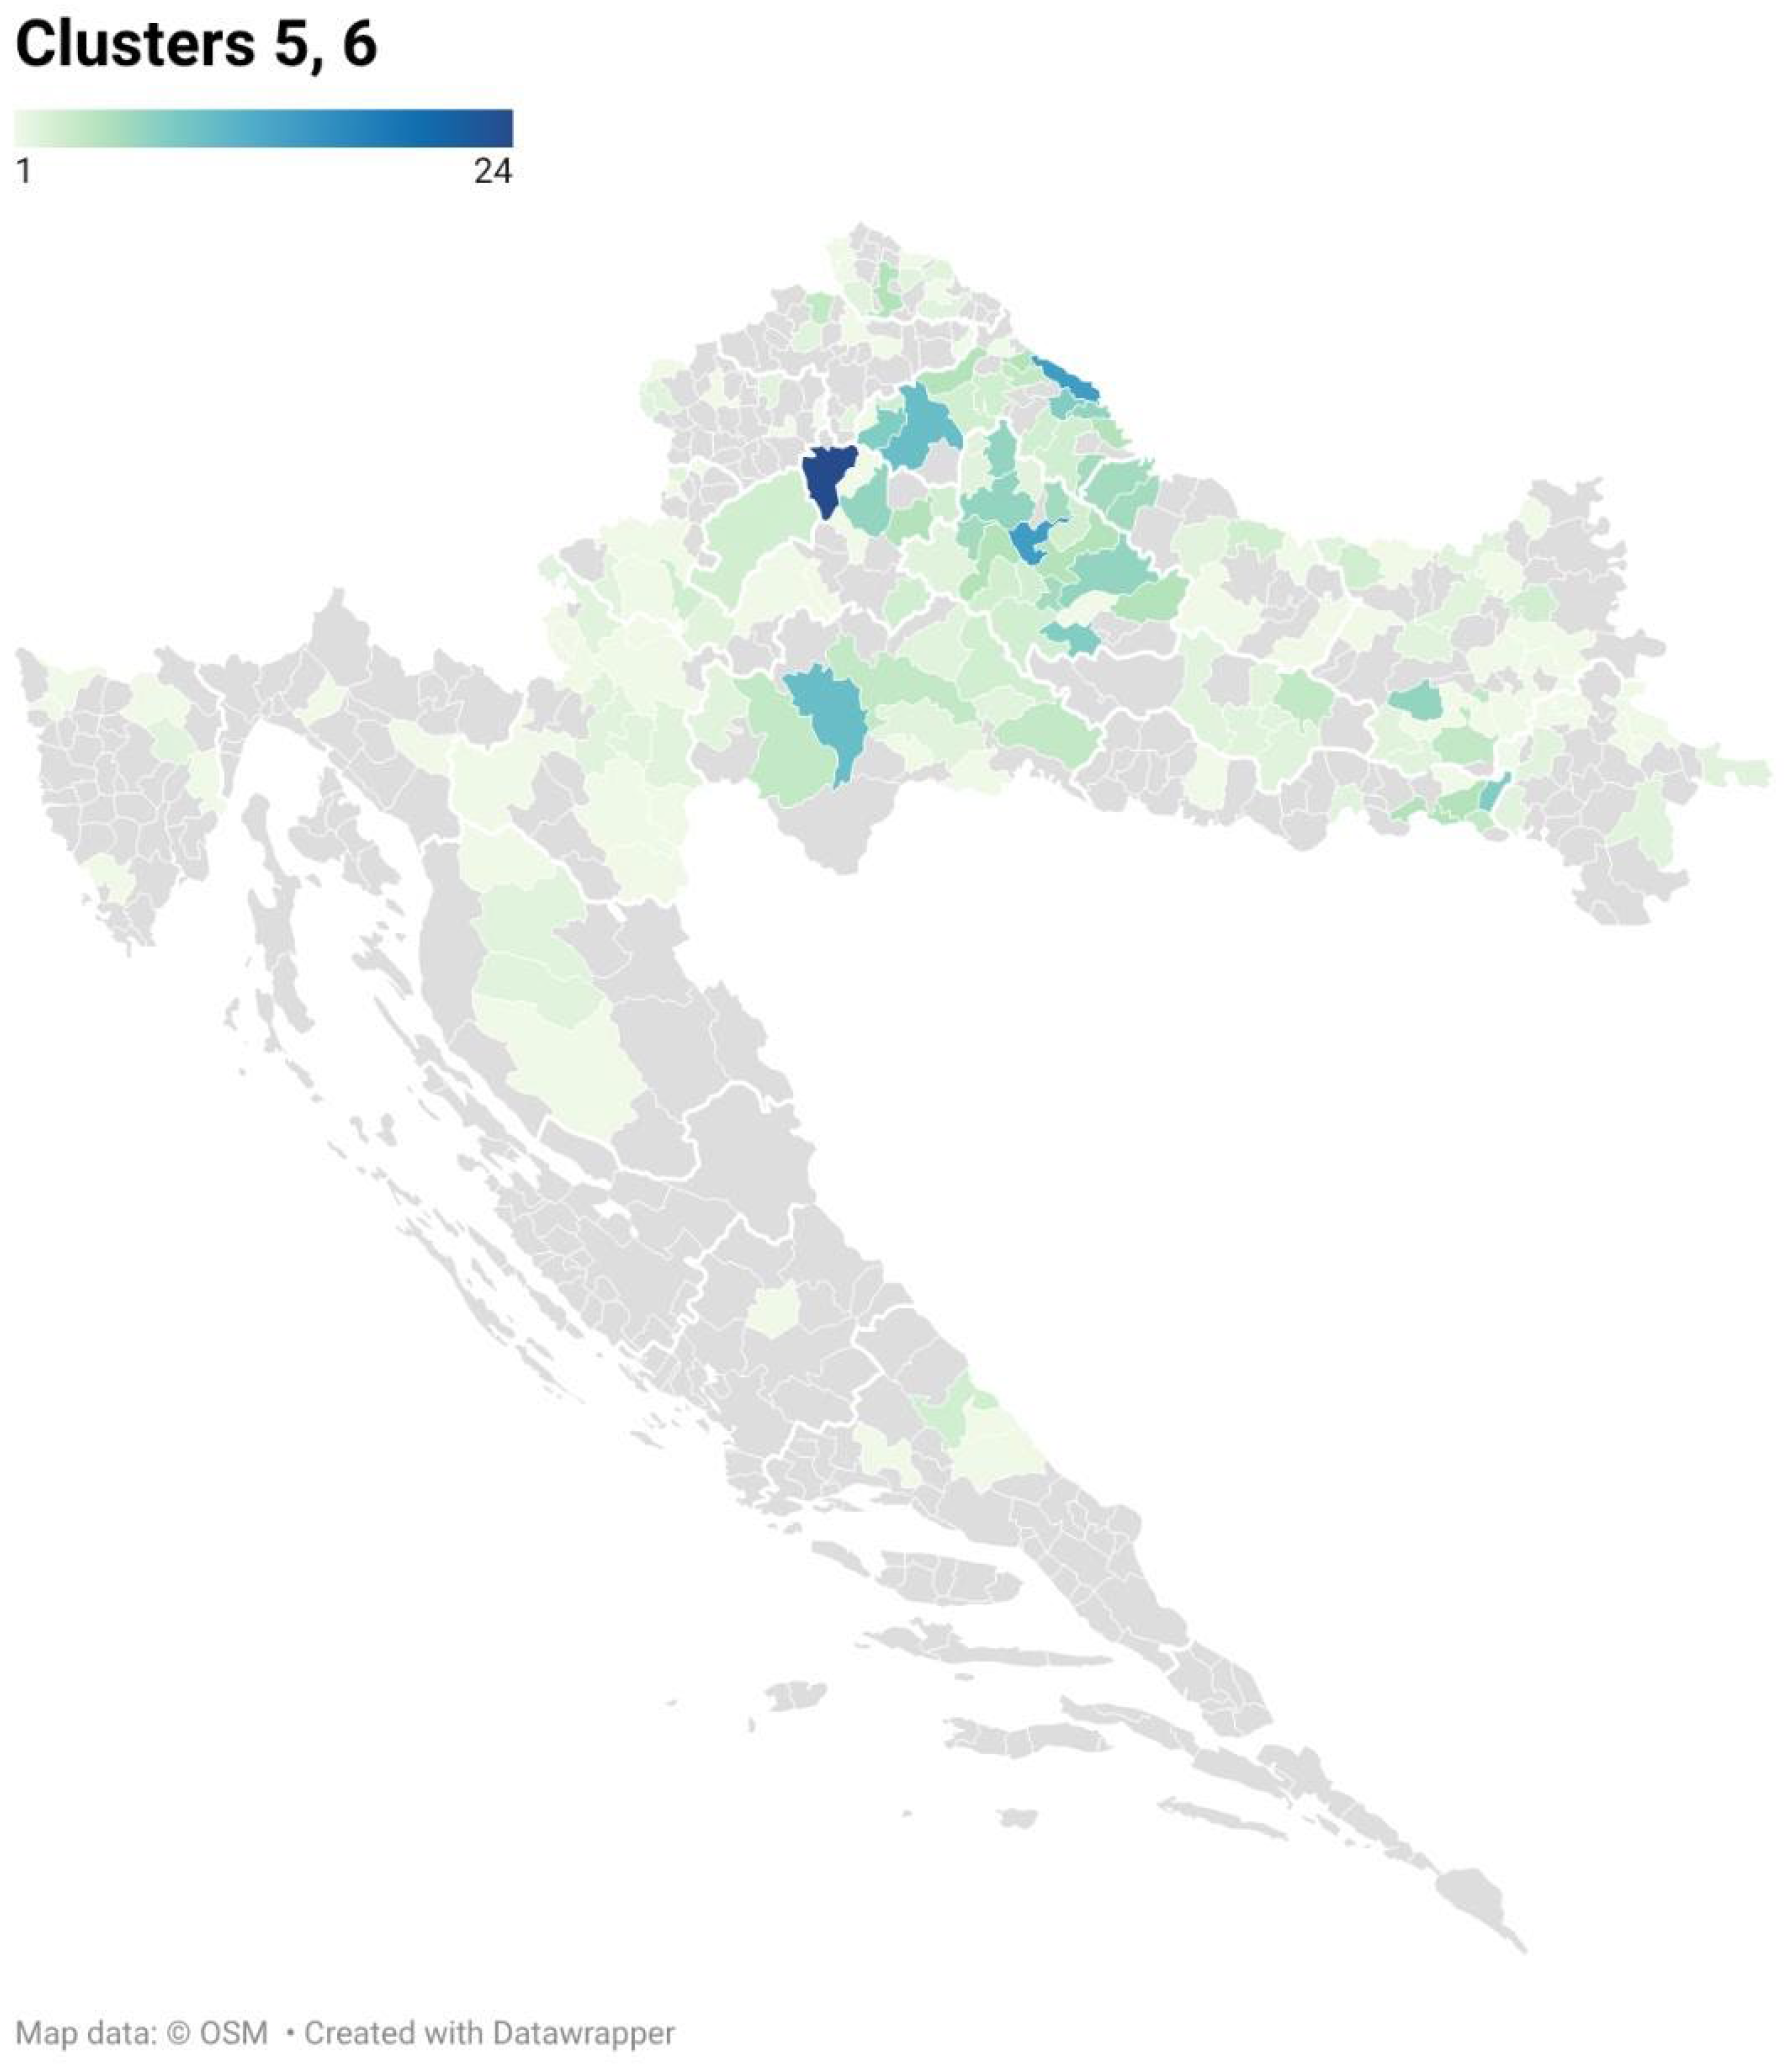
Clusters 5 and 6 comprise 14% of the observed farms and represent a group of medium-sized dairy farms characterized by higher production intensity compared to the national average (5130 kg and 4988 kg). The relatively large number of cows (30) combined with higher milk production per head indicates farms that are more strongly focused on specialized dairy production and use available production resources more efficiently.
At the same time, the smaller land area per cow in both clusters (1.11 ha and 1.54 ha) suggests a more intensive management method, in which higher production is achieved on a relatively limited land base. Although both clusters share similar production and structural characteristics, they differ in the degree of diversification of crop production (5.16 and 9.23). Cluster 5 is characterized by greater specialization and a narrower production focus, while Cluster 6 shows greater crop diversity, which indicates a more balanced combination of livestock and crop production.
Overall, both clusters represent productive farms achieving above-average milk production per cow with intensive use of available resources, but differ in the organization of crop production and the degree of production specialization. The geographical distribution of both clusters and the number of farms in each region is shown in Figure 5.
Figure 5.
Geographical distribution of Clusters 5 and 6 across Croatian municipalities. Values range from 1 (yellow) to 24 (dark blue). Grey areas indicate municipalities with no dairy farms belonging to the clusters shown.
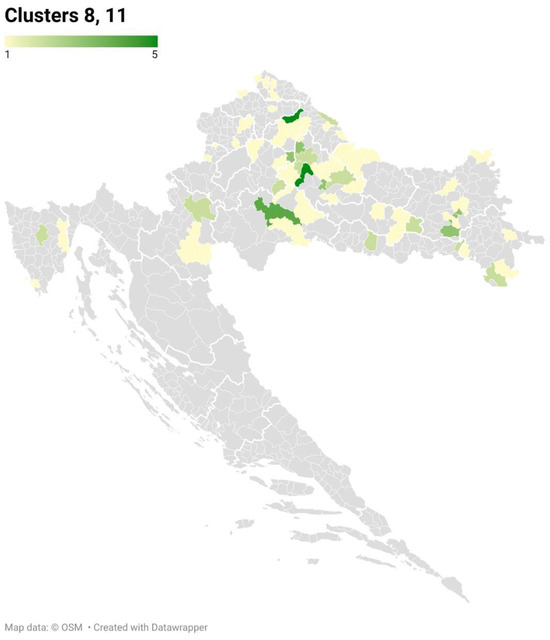
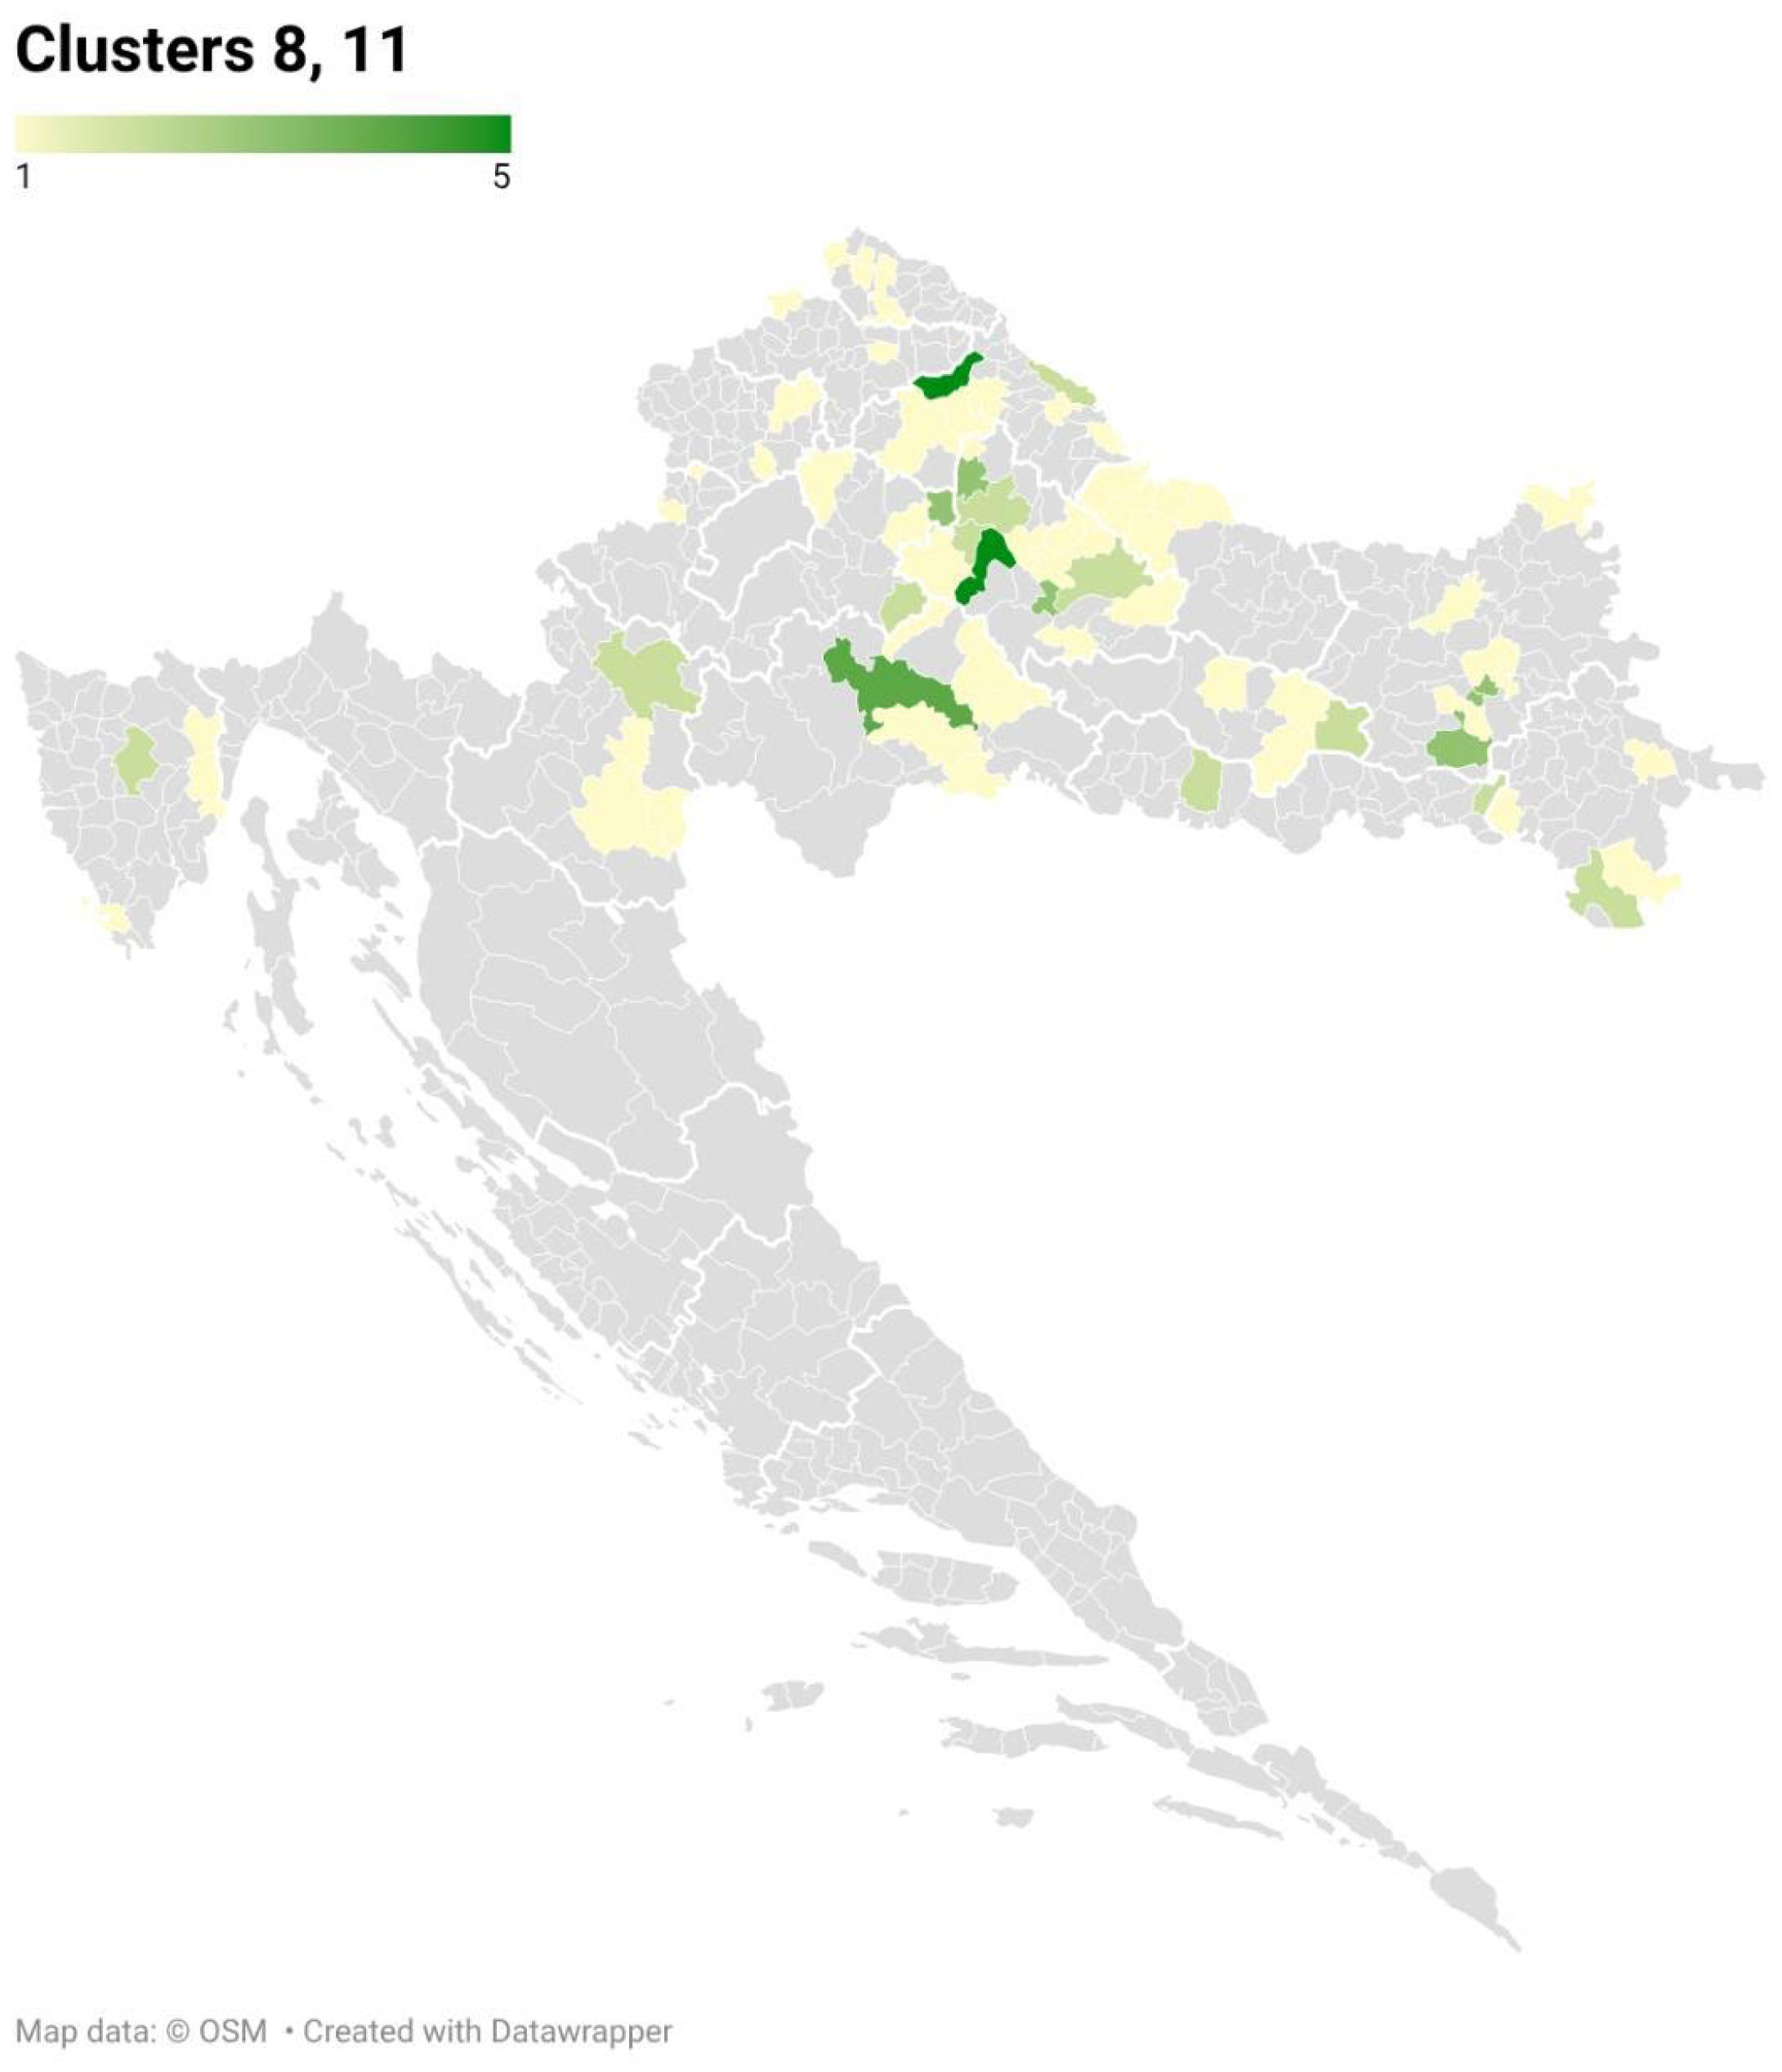
Despite the differences in herd size, cluster 8 (64 cows) and cluster 11 (115 cows) show a very similar production system. They are characterized by a high level of specialization in dairy production, significantly above-average milk production per cow (6610 and 6069 kg) and intensive use of available resources. In both clusters, production is realized on a relatively limited land base per head (1.29 ha and 1.33 ha), while the number of cultivated crops remains at the level of the national average for dairy farms (7). The difference between these two clusters is primarily manifested in the scope of production. While the first represents a group of large commercial farms, the second includes the largest and most intensive farms in the sample, which achieve very high production results and represent the carriers of highly productive dairy production with above-average milk yields. The geographical distribution of both clusters is shown in Figure 6.
Figure 6.
Geographical distribution of Clusters 8 and 11 across Croatian municipalities. Values range from 1 (yellow) to 5 (dark green). Grey areas indicate municipalities with no dairy farms belonging to the clusters shown.
Cluster 13 represents a group of 9 extremely large and highly specialized dairy farms characterized by an intensive production system. The large herd size (206.89 cows), combined with high average milk production per cow (7418 kg), indicates farms that achieve a very high level of production efficiency and a strong focus on maximizing milk output per cow. At the same time, the very limited land area per head (0.96 ha) indicates a high degree of production intensification, with a significant part of the nutritional needs probably being met by intensive food production and also by off-farm food procurement. The relatively large number of crops grown suggests a well-developed organization of crop production that is primarily focused on supporting a large livestock system. Overall, this cluster represents the most intensive and largest type of family dairy farm, characterized by large production capacities, high productivity and efficient use of available resources.
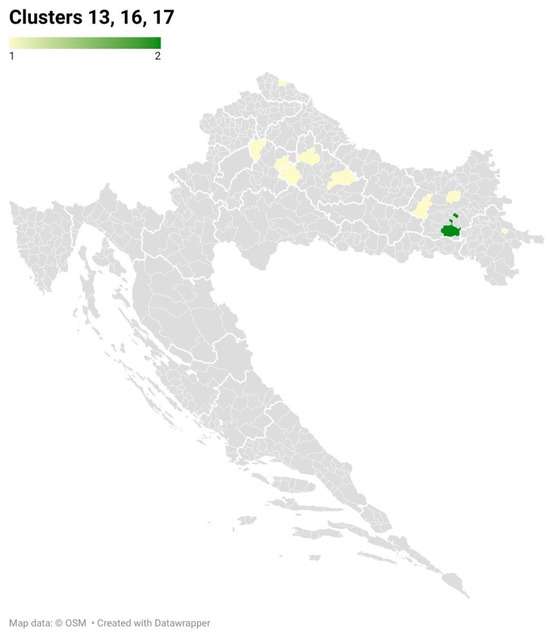
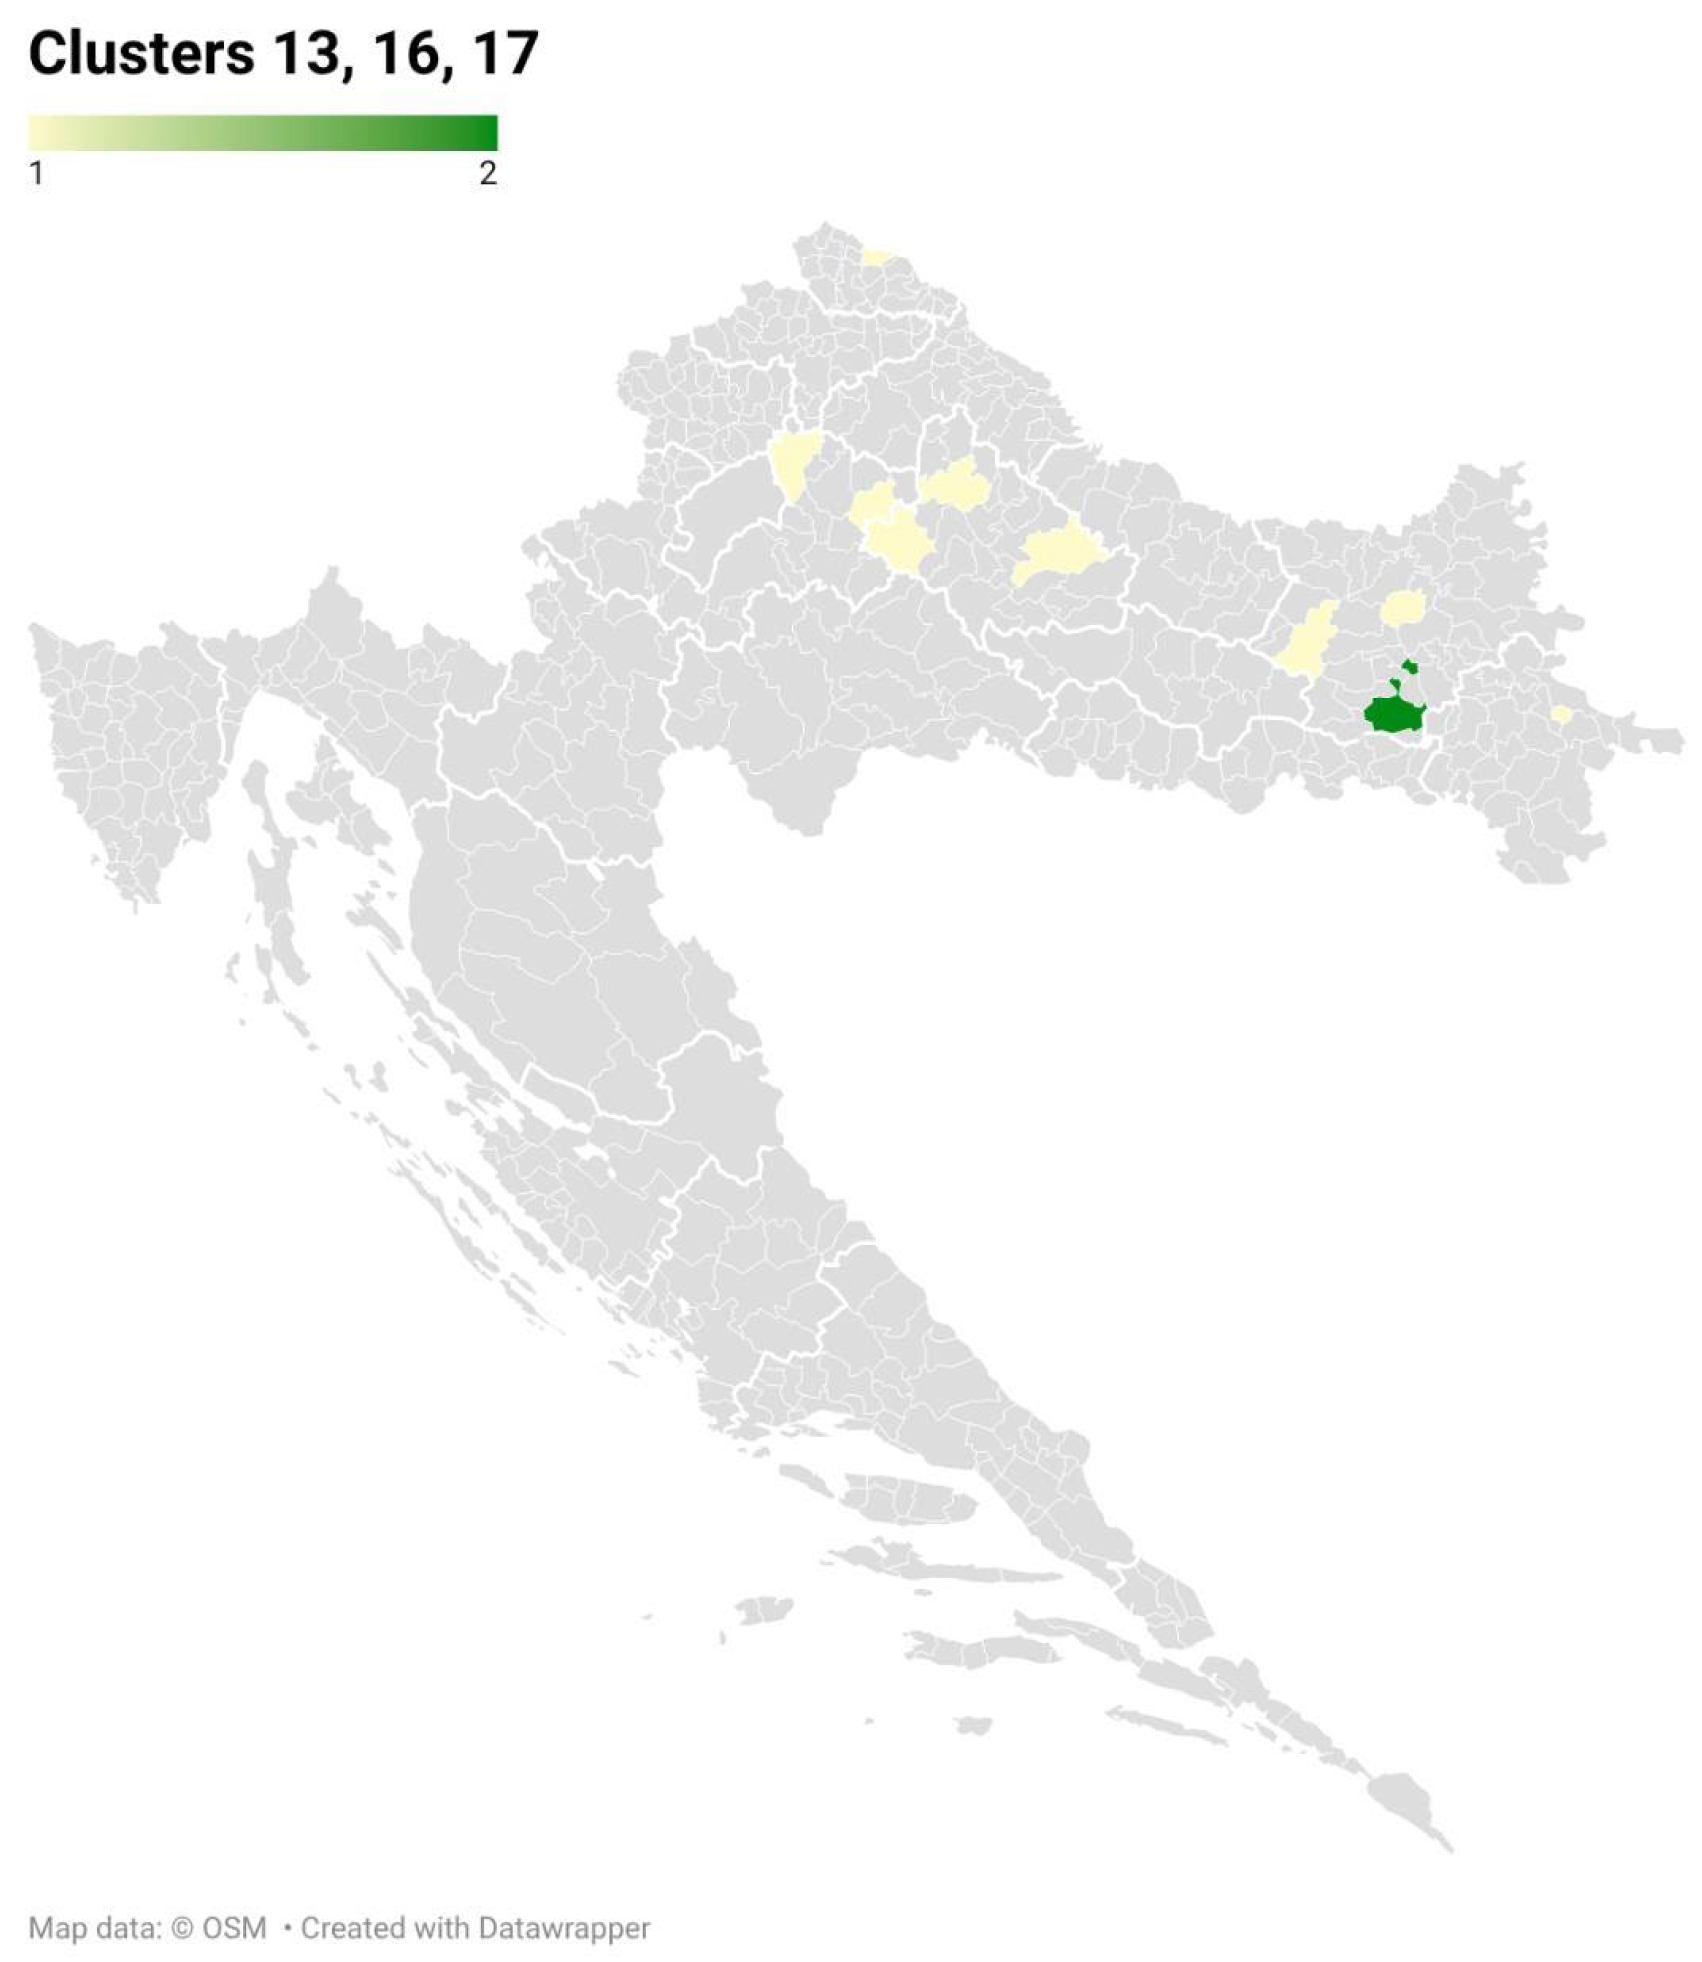
The two largest farms have separated into separate clusters (Cluster 16 and Cluster 17), which confirms their specific production structure and significant deviation from other farms. Both clusters are characterized by very large and highly specialized dairy farms (317 and 456 cows), but there are significant differences between them in production results and available resources. One cluster (16) achieves significantly higher milk production per cow with a larger land base per head, while the other (Cluster 17) has a smaller land area and achieves lower production results. These differences point to different models of production organization and resource use within large dairy farms, where the size of the herd does not in itself determine the level of production success. According to [19], both models can be economically sustainable because profitability does not depend solely on the level of production, but also on the efficiency of using available resources and adapting the production system to local conditions. The fourth map (Figure 7) illustrates Clusters 13,16 and 17 which includes the most large-scale and highly productive farms.
Figure 7.
Geographical distribution of Clusters 13, 16 and 17 across Croatian municipalities. Values range from 1 (yellow) to 2 (dark green). Grey areas indicate municipalities with no dairy farms belonging to the clusters shown.
The regional distribution of dairy farms is the result of the interaction of natural and geographical conditions, the historical development of agriculture and contemporary economic factors. The analysis shows that dairy farms of all clusters are mostly concentrated in northern and eastern Croatia, especially in counties with developed agricultural production, large arable areas and a long tradition of cattle breeding. The overall distribution of all categories of farms is significantly influenced by the terrain. The lowland and slightly hilly areas of northern Croatia and Slavonia enable the development of larger production systems, while the karst and mountainous areas have limitations due to the lack of arable land, larger share of permanent grassland, limitations in water resources and difficult production of fodder. The fertility of the soil also plays an important role, because quality soil enables the production of the high-quality fodder necessary for dairy production.
In addition to natural conditions, socio-economic factors are also important. Areas with a long tradition of cattle breeding have developed the knowledge, infrastructure and organizational capacities necessary to maintain farms of various sizes. The proximity of the dairy, transport connections and the availability of the market further encourage the concentration of farms in northern and eastern Croatia.
The regional distribution of dairy farms in Croatia shows a clear connection between the size of the economy and geographical conditions. Small farms depend more on local resources and traditions, while medium and large farms require larger areas, more developed infrastructure and more intensive agricultural production. For this reason, the highest concentration of all categories of dairy farms is located in northern and eastern Croatia, where the most favorable conditions exist for the development of modern dairy cattle breeding.
Together, these maps provide an important spatial dimension to the cluster analysis, highlighting regional patterns in farm structure and confirming that different types of dairy farms are not evenly distributed across Croatia. Instead, they are spatially grouped according to regional agricultural characteristics and resource availability.
3.3. A Comparative Overview of the Key Structural and Production Characteristics Across the Identified Clusters (Radar)
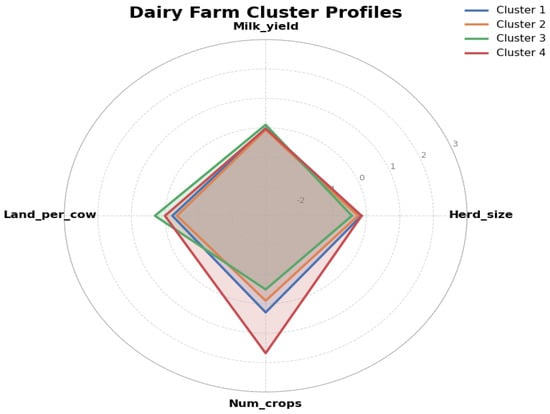
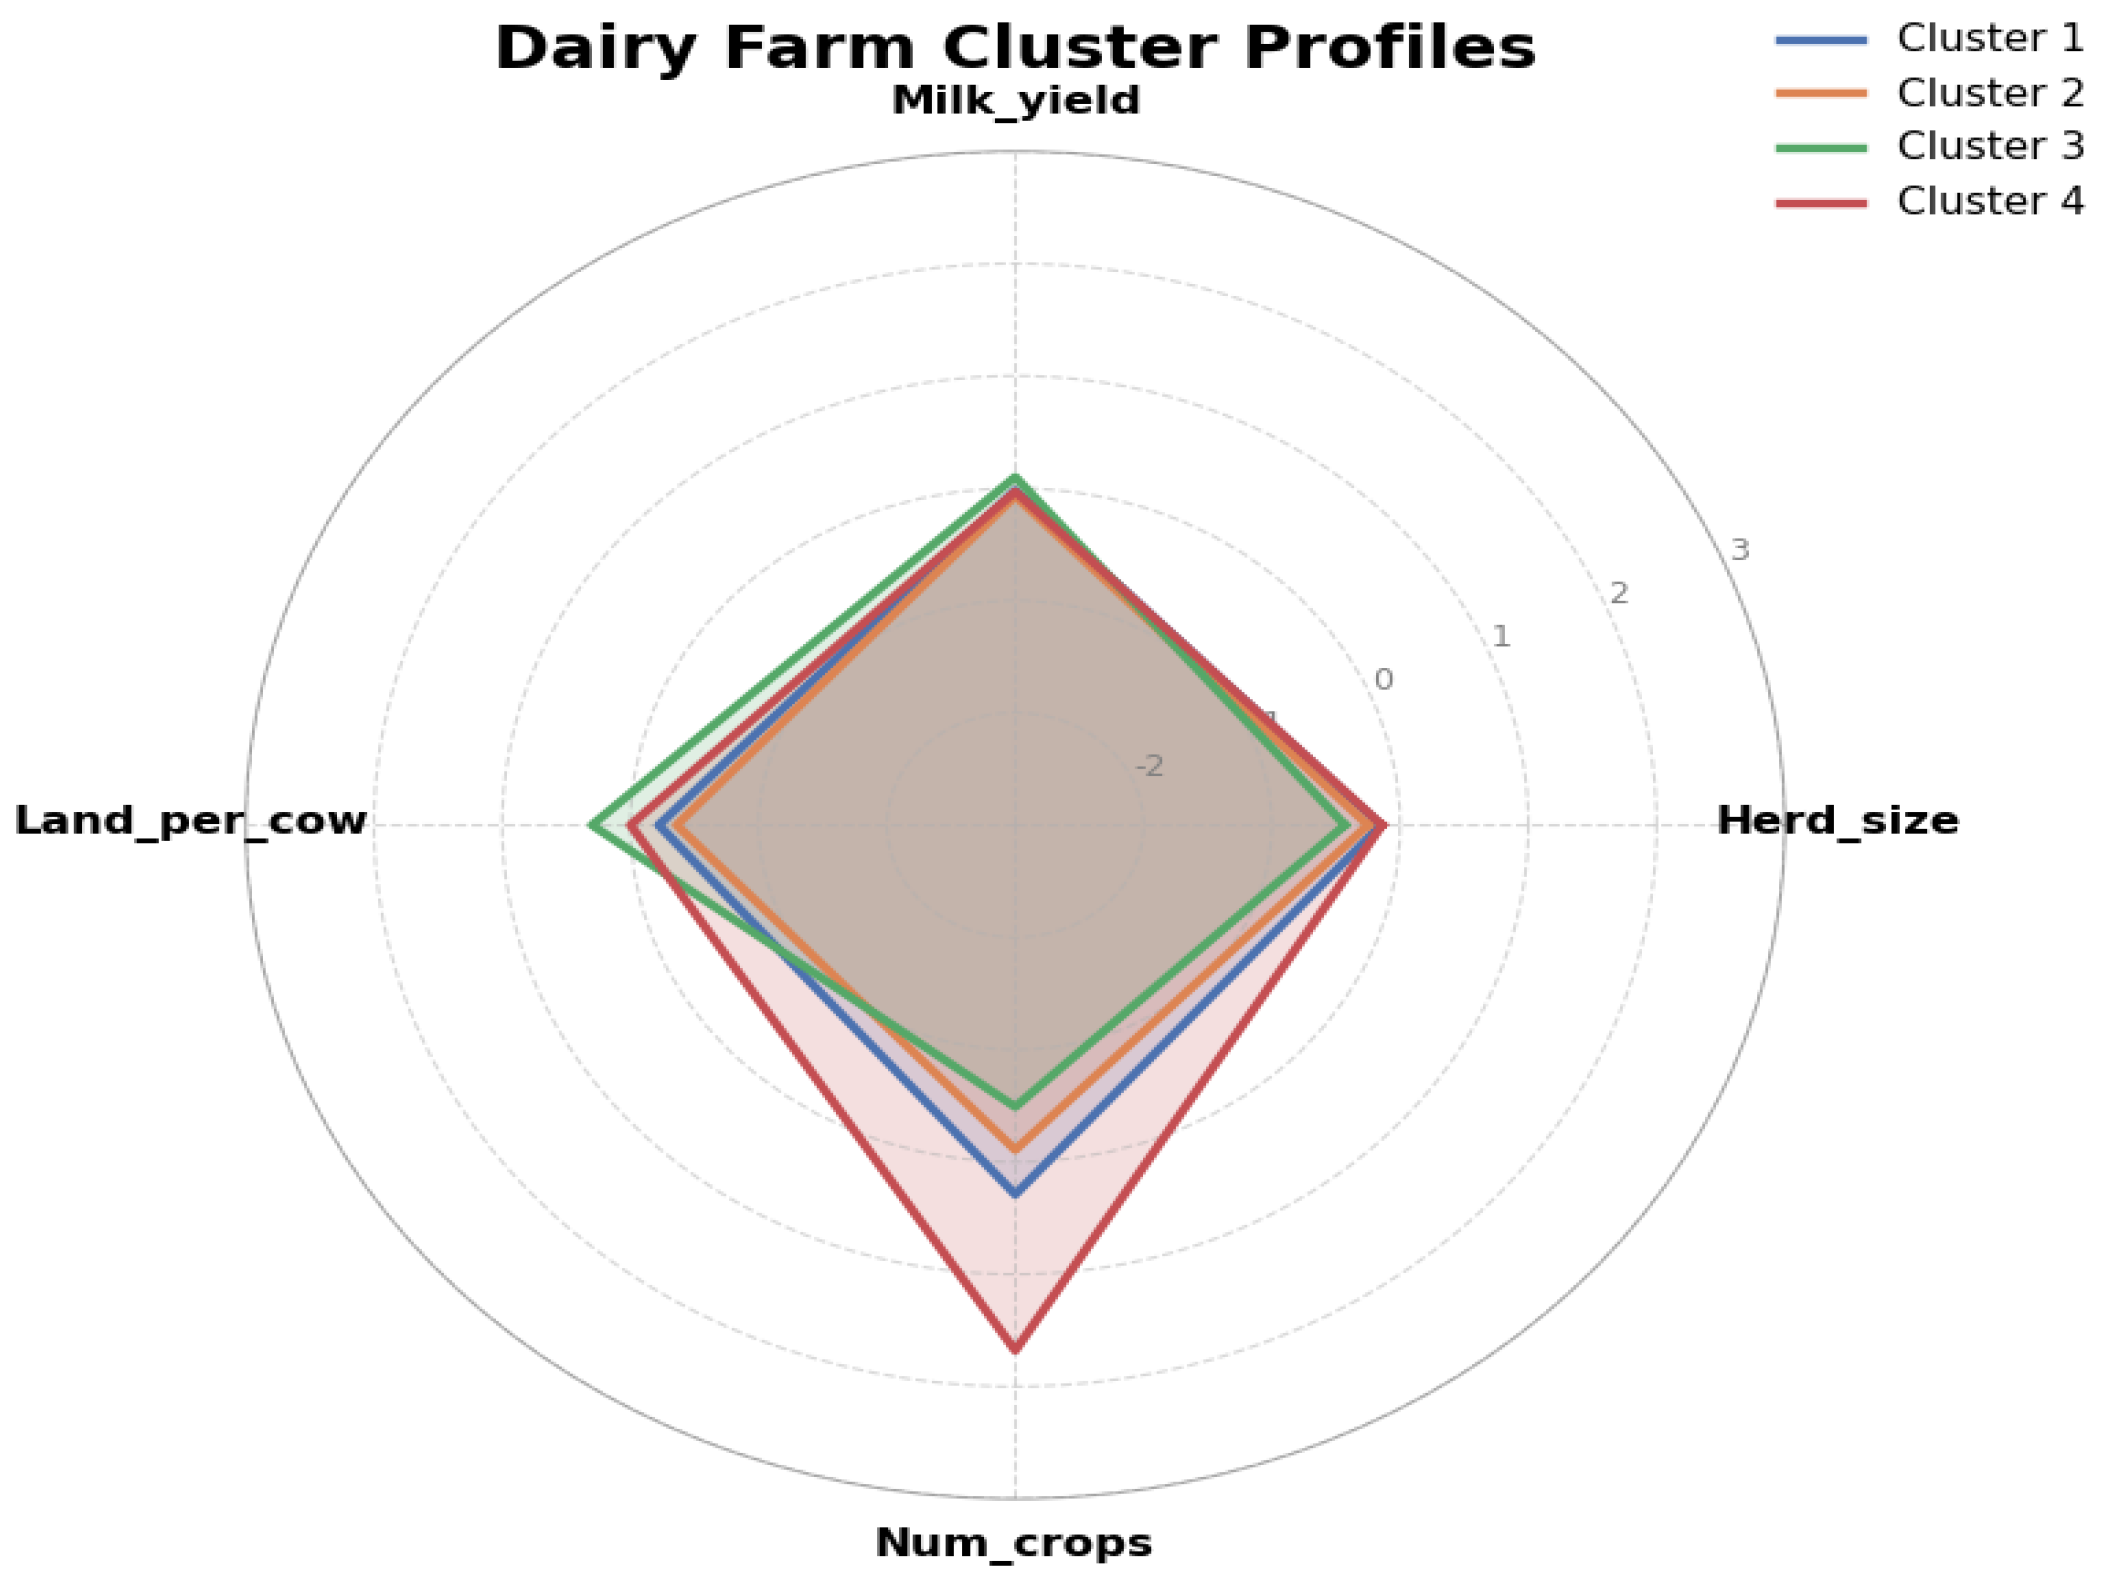
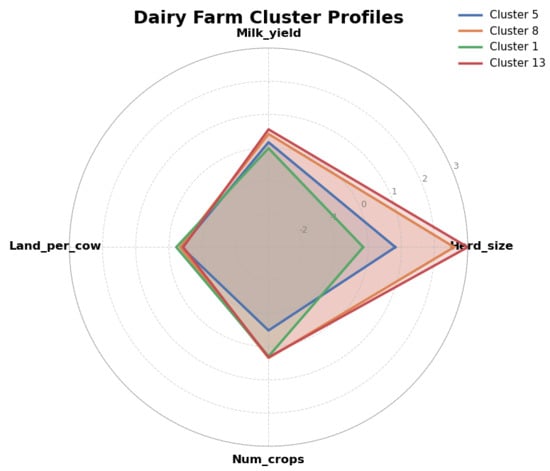
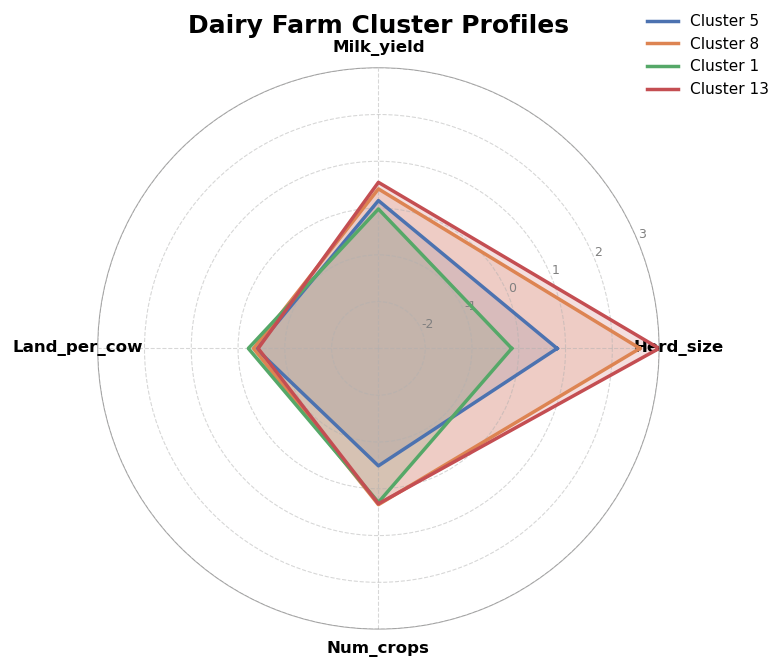
The radar charts illustrate the profiles of the identified clusters based on the standardized values (z-scores) of the four variables. The radial axis represents the number of standard deviations by which each variable differs from its overall mean, with positive and negative values indicating values above and below the mean, respectively. This representation allows a visual comparison of the clusters and highlights differences in their characteristics across the four variables. The radar chart compares the four dairy farm clusters across milk yield, herd size, number of crops, and land per cow. Clusters with higher values on particular axes indicate relatively higher levels of the corresponding production or resource-use characteristic, while lower values indicate relatively lower levels. The largest differences between clusters are observed for the number of crops and land per cow, whereas milk yield and herd size show more similar profiles. The radar diagram (Figure 8) provides a graphical summary of the previously described clusters and allows for their direct comparison across the observed variables. The diagram clearly shows a high level of similarity between Clusters 1, 2, 3 and 4 in terms of herd size and milk production per cow, while the differences are more pronounced in the structure of crop production, especially in the number of crops and land availability per cow. The radar visualization thus further confirms the previously interpreted patterns (clusters), emphasizing that the clusters primarily differ in the organizational and resource characteristics of crop production, and not in the intensity of the dairy part of the production system.
Figure 8.
Radar chart showing Cluster 1, Cluster 2, Cluster 3 and Cluster 4. The radial axis represents standardized values (z-scores), indicating the number of standard deviations each variable deviates from the overall mean. Positive values indicate above-average, negative values below-average performance on that variable. Abbreviations: Milk_yield—MPPC, milk production per cow (annual); Herd_size—NOC, number of dairy cows on the farm; Num_crops—NOCR, number of crops; Land_per_cow—APC, area per cow.
The radar view (Figure 9) shows the profiles of Clusters 5, 8, 1 and 13 and allows a clear visual interpretation of their mutual differences and similarities through the observed variables. Here, we have selected 4 clusters so that the clusters differ, by the number of cows. It is observed that the values of milk production per cow are relatively uniform across these clusters, which indicates limited differences in the intensity of milk production. On the other hand, more pronounced variations are present in the herd size and in the structure of crop production. Cluster 13 stands out with the largest herd size (as expected), while Cluster 8 also shows increased values, with a simultaneous greater crop diversity. Cluster 1 records lower values of herd size and a smaller number of crops, while cluster 5 is located between the observed groups. The amount of land per cow is relatively stable, with smaller deviations between the clusters. Overall, the radar visualization clearly shows that the differences between the clusters are primarily manifested in the organization and scope of crop production and in the size of livestock systems, while in the intensity of milk production the difference is relatively low.
Figure 9.
Radar chart showing Cluster 5, Cluster 8, Cluster 1 and Cluster 13. The radial axis represents standardized values (z-scores), indicating the number of standard deviations each variable deviates from the overall mean. Positive values indicate above-average, negative values below-average performance on that variable. Abbreviations: Milk_yield—MPPC, milk production per cow (annual); Herd_size—NOC, number of dairy cows on the farm; Num_crops—NOCR, number of crops; Land_per_cow—APC, area per cow.
In particular, differences in milk production per cow and herd size emerge as the most distinguishing features between clusters, while land-use variables further differentiate production systems according to their intensity and structural orientation. For the radar chart, specific clusters were selected that best illustrate the key differences between the production systems, as it was not possible to include all identified clusters due to considerations of readability and visualization limitations. Overall, the radar chart complements the clustering results by providing an intuitive visual summary of multivariate differences and highlighting the distinct production profiles of dairy farms.
4. Discussion
This study identifies different types of dairy farms in Croatia based on structural characteristics, land-use intensity and production results. The results reveal a pronounced heterogeneity of the dairy sector, reflecting the existence of small, and diversified farms alongside large, specialized and highly intensive production systems. The structural heterogeneity identified among Croatian dairy farms is consistent with findings from other European studies. Poczta et al. (2020) [24], using hierarchical cluster analysis, identified five types of dairy farms across European Union countries, differing in production scale, resource availability, and production intensity. Similarly, a study of 285 dairy farms in southern Italy [25] identified three distinct groups based on farm size, mechanization, and other structural characteristics, demonstrating substantial differences in farm organization and production systems. Furthermore, research on dairy cattle and fodder crop production systems at the European regional level [26] revealed considerable variation in production specialization, agricultural land use, and regional distribution. These findings are consistent with the differences observed among Croatian dairy farms, particularly regarding herd size, land availability, and production intensity. However, differences in the variables, methodologies, and levels of data aggregation used in these studies should be considered when comparing the resulting farm typologies. The 17 identified farm types differ primarily in terms of herd size, production intensity and diversity of activities. The majority of family dairy farms (79%) are characterized by smaller herd sizes, greater land availability per cow and a greater number of crops grown, representing a more extensive and diversified production model. Although these farms typically exhibit lower milk yields per cow, their production strategy may potentially contribute to resilience through diversification and reduced dependence on external inputs. Given their location, it can also be concluded that there is a significant challenge in terms of land quality and thus the possibility of producing high-quality fodder. The share of permanent grassland is generally higher on instead the type of farms from these clusters. In contrast, larger farms with higher milk yields per cow and lower UAA (utilized agricultural area) per cow reflect a specialized and more intensive production model aimed at increasing productivity, economies of scale and market orientation. The presence of intermediate farm types suggests a continuing structural transformation within the Croatian dairy sector. These farms combine moderate herd sizes with land-use patterns that are neither fully extensive nor fully intensive, indicating adaptive strategies in response to market pressures, political incentives and resource constraints. From a development perspective, such farms may play a role in the future restructuring of the sector, as they possess both growth potential and relative flexibility.
Although regional classification was not included in the clustering procedure, an ex post analysis of the distribution of clusters by NUTS regions shows a clear spatial pattern. More intensive and specialized farm types are disproportionately concentrated in regions with favorable agro-ecological conditions, larger average farm sizes and better access to infrastructure, while extensive and diversified systems prevail in less favorable areas. This spatial differentiation highlights the importance of regional context in shaping production and development strategies, even when farm types are defined independently of location. These findings have important policy implications. The considerable heterogeneity of farm types calls into question the effectiveness of single policy measures targeting the dairy sector. Instead, policy design should acknowledge differentiated development paths, supporting productivity and innovation in intensive systems while recognizing the multifunctional role of extensive and diversified farms in potentially supporting rural vitality and land use in marginal areas. Targeted support for transitional farm types may play a role in facilitating balanced structural adjustment.
Despite its advantages, the study has certain limitations. Cluster analysis is inherently an exploratory method and is sensitive to the selection of variables and the applied methodological procedures. The use of cross-sectional data further limits the ability to capture the temporal dynamics of farm typologies. The resulting farm types will be used as input categorical variables in the subsequent empirical farm model (SiTFarm), which also represents the primary purpose of their construction within this study.
Additionally, although Ward’s method and k-means are sensitive to outliers and the selection of the number of clusters involves a degree of subjectivity, the robustness of the cluster solution was confirmed by discriminant analysis, which correctly classified 98.9% of the original cases (98.7% in cross-validation). Finally, the cluster solution was not subject to external validation using an independent dataset.
5. Conclusions
The results of this study confirm that Croatian dairy farming cannot be adequately represented by a single production model. The considerable differences in farm size, production intensity, land availability and production plan diversification indicate that dairy farms operate under substantially different conditions and face different development challenges. Consequently, development strategies and agricultural policy measures should take these differences into account, rather than treating the dairy sector as a homogeneous group. The observed regional differences further emphasize the importance of considering local production conditions and resource availability when assessing the development potential of individual farm types.
The identification of 17 relatively homogeneous clusters provides a systematic basis for distinguishing the main structural and production characteristics of Croatian dairy farms. The resulting classification can therefore be used as an analytical framework for further research on the diversity and economic characteristics of dairy farming in Croatia, as well as for comparative analyses at the European level. At the same time, the identified clusters provide an important methodological basis for the subsequent construction of typical farm types and for adapting and extending the Slovenian Typical Farm Model (SiTFarm) to the Croatian context through the development of CroTFarm.
The present analysis is limited by the available data and the cross-sectional nature of the study. In particular, information on production technologies, expected yields, breeding practices, machinery, land quality and fragmentation, and other factors influencing farm economic performance is not available at this moment. These characteristics will be specified for the identified farm types through dedicated workshops with experts in the relevant fields. Their integration into the subsequent modeling process will enable the construction of typical farm models and provide a more comprehensive basis for assessing the economic sustainability and development prospects of Croatian dairy farming.
Author Contributions
Conceptualization, M.P., D.K., K.Z. and J.Ž.; methodology, M.P. and J.Ž.; software, M.P. and J.Ž.; validation, M.P., D.K., K.Z. and J.Ž.; formal analysis, M.P. and J.Ž.; investigation, M.P., K.Z. and J.Ž.; resources, D.K. and K.Z.; data curation, M.P. and J.Ž.; writing—original draft preparation, M.P. and J.Ž.; writing—review and editing, M.P., D.K. and J.Ž.; visualization, M.P. and J.Ž.; supervision, M.P., D.K., K.Z. and J.Ž.; project administration, K.Z.; funding acquisition, D.K. All authors have read and agreed to the published version of the manuscript.
Funding
The work of M.P., K.Z. and D.K. was funded by the European Union – NextGenerationEU through the National Recovery and Resilience Plan 2021–2026 (NPOO), source 581–Recovery and Resilience Facility, within the institutional research project “Sustainable and Circular Development of Beef Cattle Production within the Agrarian Sector of the Republic of Croatia – BEEFLOOP”, grant number 581-UNIOS-27. The work of J.Ž. was co-funded by the Slovenian Research and Innovation Agency (ARIS), Research Programme P4-0022 (B), “Agro-food and natural resources economics”.
Data Availability Statement
The data obtained in the experiment can be retrieved from the corresponding authors upon reasonable request.
Conflicts of Interest
The authors declare no conflicts of interest.
References
- Croatian Agency for Agriculture and Food. Annual Report for 2022. Centre for Livestock Breeding, Cattle Breeding; Croatian Agency for Agriculture and Food: Osijek, Croatia, 2023. [Google Scholar]
- Gonzalez-Mejia, A.; Styles, D.; Wilson, P.; Gibbons, J. Metrics and methods for characterizing dairy farm intensification using farm survey data. PLoS ONE 2018, 13, e0195286. [Google Scholar] [CrossRef] [Scilit]
- Mijić, P.; Bobić, T. Milk production and challenges in transition from conventional to robotic milking in Croatia. Acta Sci. Pol. Zootech. 2021, 20, 59–64. [Google Scholar] [CrossRef] [Scilit]
- Očić, V.; Šakić Bobić, B.; Grgić, Z. Economic analysis of specialized dairy farms in Croatia according to FADN. Mljekarstvo 2023, 73, 50–58. [Google Scholar] [CrossRef] [Scilit]
- Langrell, S.; Ciaian, P.; Espinosa, M.; Gomez Paloma, S.; Heckelei, T.; Louhichi, K.; Sckokai, P.; Thomas, A.; Vard, T. Farm Level Modelling of CAP: A Methodological Overview; Joint Research Centre: Scientific and Policy Reports; European Union: Luxembourg, 2013. [Google Scholar]
- Lovec, M.; Šumrada, T.; Erjavec, E. New CAP Delivery Model, Old Issues. Intereconomics 2020, 55, 112–119. [Google Scholar] [CrossRef] [Scilit]
- Ciaian, P.; Espinosa, M.; Louhichi, K.; Perni, A. Farm Level Impacts of Trade Liberalisation and CAP Removal Across EU: An Assessment Using the IFM-CAP Model. Ger. J. Agric. Econ. 2020, 69, 108–126. [Google Scholar] [CrossRef]
- Kranjac, D.; Zmaić, K.; Štefanić, I.; Jelić Milković, S.; Raguž, N.; Erjavec, E. Simulation of Main Agrarian Policy Indicators within Beef Meat Market in the Republic of Croatia by AGMEMOD Partial Equilibrium Model. Poljoprivreda 2019, 25, 45–51. (In Croatian) [Google Scholar] [CrossRef] [Scilit]
- Louhichi, K.; Ciaian, P.; Espinosa Goded, M.; Colen, L.; Perni Llorente, A.; Gomez y Paloma, S. An EU-Wide Individual Farm Model for Common Agricultural Policy Analysis (IFM-CAP): First Application to Crop Diversification Policy; EUR 26910 EN; JRC Scientific and Policy Reports; Publications Office of the European Union: Luxembourg, 2015. [Google Scholar] [CrossRef]
- Louhichi, K.; Ciaian, P.; Espinosa, M.; Perni, A.; Gomez y Paloma, S. Economic impacts of CAP greening: Application of an EU-wide individual farm model for CAP analysis (IFM-CAP). Eur. Rev. Agric. Econ. 2018, 45, 205–238. [Google Scholar] [CrossRef] [Scilit]
- OECD. Policies for the Future of Farming and Food in Croatia; OECD Agriculture and Food Policy Reviews; OECD Publishing: Paris, France, 2025. [Google Scholar] [CrossRef] [Scilit]
- Kranjac, D.; Zmaić, K.; Sudarić, T.; Ravlić, M.; Zrakić Sušac, M.; Grgić, I.; Rac, I.; Erjavec, E. Production and Trade Impacts of CAP Post 2022 Reform on Main Croatian Crop and Livestock Markets—Partial Equilibrium Modelling Approach. Agronomy 2021, 11, 2518. [Google Scholar] [CrossRef] [Scilit]
- European Commission. Proposal for a Regulation on the Common Agricultural Policy for the Period 2028–2034; Procedure 2025/0241(COD); European Commission: Brussels, Belgium, 2025. [Google Scholar]
- Alvarez, S.; Timler, C.J.; Michalscheck, M.; Paas, W.; Descheemaeker, K.; Tittonel, P.; Andersson, J.A.; Groot, J.C.J. Capturing farm diversity with hypothesis-based typologies: An innovative methodological framework for farming system typology development. PLoS ONE 2018, 13, e0194757. [Google Scholar] [CrossRef] [Scilit]
- Reidsma, P.; Janssen, S.; Jansen, J.; van Ittersum, M.K. On the development and use of farm models for policy impact assessment in the European Union—A review. Agric. Syst. 2018, 159, 111–125. [Google Scholar] [CrossRef] [Scilit]
- Chibanda, C.; Agethen, K.; Deblitz, C.; Zimmer, Y.; Almadani, M.I.; Garming, H.; Rohlmann, C.; Schütte, J.; Thobe, P.; Verhaagh, M.; et al. The Typical Farm Approach and Its Application by the Agri Benchmark Network. Agriculture 2020, 10, 646. [Google Scholar] [CrossRef] [Scilit]
- Siogkas, T.; Melfou, K.; Koutouzidou, G.; Loizou, E.; Ragkos, A. Structural analysis of farming systems in Western Macedonia: A cluster-based approach. Agriculture 2025, 15, 1650. [Google Scholar] [CrossRef] [Scilit]
- Žgajnar, J.; Kavčič, S. Understanding the Dairy Sector in Slovenia: A Modeling Approach for Policy Evaluation and Decision Support. Sustainability 2024, 16, 6009. [Google Scholar] [CrossRef] [Scilit]
- Parzonko, A.; Parzonko, A.J.; Bórawski, P. Economic Competitiveness of Dairy Farms from the Top Milk-Producing Countries in the EU: Assessment in 2014–2021. Agriculture 2024, 14, 123. [Google Scholar] [CrossRef] [Scilit]
- Croatian Bureau of Statistics. National Classification of Statistical Regions 2021 (HR_NUTS 2021); National Gazette: Zagreb, Croatia, 2019; Volume 125. (In Croatian) [Google Scholar]
- Scitovski, R.; Sabo, K. Klaster Analiza i Prepoznavanje Geometrijskih Objekata; Sveučilište Josipa Jurja Strossmayera u Osijeku, Odjel za matematiku: Osijek, Croatia, 2020. (In Croatian) [Google Scholar]
- Hair, J.F., Jr.; Black, W.C.; Babin, B.J.; Anderson, R.E. Multivariate Data Analysis, 7th ed.; Pearson Prentice Hall: Upper Saddle River, NJ, USA, 2010. [Google Scholar]
- Everitt, B.S.; Landau, S.; Leese, M.; Stahl, D. Cluster Analysis, 5th ed.; John Wiley & Sons: Chichester, UK, 2011. [Google Scholar]
- Poczta, W.; Średzińska, J.; Chenczke, M. Economic Situation of Dairy Farms in Identified Clusters of European Union Countries. Agriculture 2020, 10, 92. [Google Scholar] [CrossRef] [Scilit]
- Todde, G.; Murgia, L.; Caria, M.; Pazzona, A. A multivariate statistical analysis approach to characterize mechanization, structural and energy profile in Italian dairy farms. Energy Rep. 2016, 2, 129–134. [Google Scholar] [CrossRef] [Scilit]
- Díaz de Otálora, X.; Dragoni, F.; Del Prado, A.; Estellés, F.; Wilfart, A.; Krol, D.; Balaine, L.; Anestis, V.; Amon, B. Identification of representative dairy cattle and fodder crop production typologies at regional scale in Europe. Agron. Sustain. Dev. 2022, 42, 94. [Google Scholar] [CrossRef] [Scilit]

Disclaimer/Publisher’s Note: The statements, opinions and data contained in all publications are solely those of the individual author(s) and contributor(s) and not of MDPI and/or the editor(s). MDPI and/or the editor(s) disclaim responsibility for any injury to people or property resulting from any ideas, methods, instructions or products referred to in the content. |
© 2026 by the authors. Licensee MDPI, Basel, Switzerland. This article is an open access article distributed under the terms and conditions of the Creative Commons Attribution (CC BY) license.