


Abstract
Angelica sinensis (Oliv.) Diels is an important medicinal plant widely cultivated in China. Under climate change, its growth dynamics and yield formation face considerable uncertainty, yet dynamic simulation studies remain limited and quantitative assessments still rely largely on empirical statistical methods. To address this gap, we developed a growth-process simulation model for A. sinensis using WOFOST-sugarbeet as the initial framework. Field observations were used to localize key parameters governing phenological development and dry-matter partitioning. Model performance was evaluated through within-season calibration, independent-year validation of growth processes, and interannual analysis of yield trends. Sensitivity analysis identified the thermal units required from greening to fleshy-root expansion (TSUM1) and the conversion efficiencies of assimilates into leaves (CVL), roots (CVR), and storage organs (CVO) as the key parameters affecting model outputs. After calibration with 2019 field data, the model satisfactorily simulated storage-organ total dry weight, aboveground total dry weight, and root length, with R2 values of 0.92, 0.98, and 0.88, respectively. Independent validation using 2020 data showed similarly strong agreement, with corresponding R2 values of 0.98, 0.97, and 0.92. The calibrated model also captured the interannual trend in A. sinensis yield from 2010 to 2024 (R2 = 0.79). Overall, the localized model provides technical support and a methodological reference for cultivation management optimization, accurate yield assessment, and climate-response mechanism analysis.
1. Introduction
Against the backdrop of global climate change, rising temperatures, altered precipitation patterns, and intensifying extreme events are increasing agricultural uncertainty [1]. Available evidence indicates that climate variability and persistent warming exert markedly different effects across regions, crop species, and production systems [2,3]. Relative to rice, wheat, and maize, medicinal plants remain understudied in the context of climate-response research [4]. As medicinal plants are both agricultural products and raw materials for traditional medicine, environmental change influences output stability and industrial resilience [5]. Accordingly, examining growth dynamics and yield formation in representative medicinal plants has clear scientific relevance and practical importance [6].
Angelica sinensis (Oliv.) Diels is an important geo-authentic medicinal crop in China and has supported a strongly region-specific industry in the cool, humid mountains of northwestern China [7,8]. In major producing regions such as Gansu Province, its cultivation has become a key driver of agricultural development and rural income growth [9]. Available studies indicate that Chinese angelica is highly sensitive to climate change because variation in temperature and rainfall can markedly alter developmental timing, fleshy-root formation, and overall yield accumulation [10,11]. Rainfall deficiency may trigger premature bolting and yield loss, whereas excessive rainfall raises the risks of waterlogging, root rot, and disease incidence [12,13]. Evidence from 1990 to 2020 further shows a clear upslope shift in suitable cultivation areas, suggesting that production distribution has already responded to regional climatic change [14,15,16]. Nevertheless, current research still emphasizes suitability distribution or single-factor effects, whereas field-scale quantitative simulation of growth and yield formation remains limited; in this respect, crop growth models offer a more mechanistic pathway by describing phenology, photosynthesis, respiration, dry-matter accumulation, and organ partitioning [17,18].
Widely applied crop growth models include WOFOST, DSSAT, APSIM, and AquaCrop, yet these models differ clearly in process representation, parameter demand, and application range [19]. DSSAT and APSIM have been extensively used in crop–soil-management studies, but their structures are relatively complex and require considerable effort for localization to new crops [20,21]. AquaCrop is a useful choice when the main concern is crop water consumption and yield estimation, but it does not describe crop development processes or organ-level biomass allocation in much detail [22]. WOFOST is different in this respect. It pays more attention to phenological progression, photosynthesis, respiration, and the formation and distribution of dry matter, while its parameter system is relatively clear and easy to interpret. For A. sinensis, yield is not determined by underground root enlargement alone. It is closely related to the growth of aboveground parts, the accumulation of assimilates, and their subsequent allocation to the storage organ. From this perspective, WOFOST is more suitable as the basic framework for simulating the yield formation process of A. sinensis [19,23,24]. However, A. sinensis is cultivated not only for storage-root biomass but also for pharmacologically active secondary metabolites, which are important determinants of medicinal quality. The present adaptation of WOFOST-sugarbeet is therefore restricted to structural growth and yield formation, including phenological development, dry-matter accumulation, assimilate partitioning, and storage-organ biomass, and does not explicitly simulate the formation or accumulation of quality-related compounds. Although direct application still encounters stage mismatch and incomplete parameter systems, localized parameterization can improve quantitative simulation of growth and yield. In future studies, WOFOST-simulated phenological stages, biomass allocation, and environmental responses could serve as process drivers for coupling with a quality-formation submodel. Thus, the current framework should be regarded as a structural-yield foundation for future integrated modeling of both yield and medicinal quality, while also providing methodological guidance for other storage-organ medicinal crops [25,26].
Based on the above understanding, this study aims to explore the feasibility of extending the WOFOST model to the medicinal plant A. sinensis and to construct a localized parameter system suitable for simulating its growth and yield formation. Specifically, this study has carried out the following tasks: (i) the model was locally parameterized and calibrated using field observation data to improve its ability to represent the key growth processes of A. sinensis; (ii) model performance was evaluated from the perspectives of within-season process fitting, independent-year process validation, and consistency in multi-year yield variation trends; and (iii) sensitivity analysis was conducted to identify the key parameters affecting model outputs, on the basis of which the applicability and limitations of the framework were discussed. It should be noted that the purpose of this study is not to demonstrate that WOFOST can fully characterize the entire life-cycle processes of A. sinensis, but rather to provide a testable basic framework for process-model construction and related localization studies of A. sinensis under clearly defined applicability boundaries.
2. Materials and Methods
2.1. Overview of the WOFOST Model
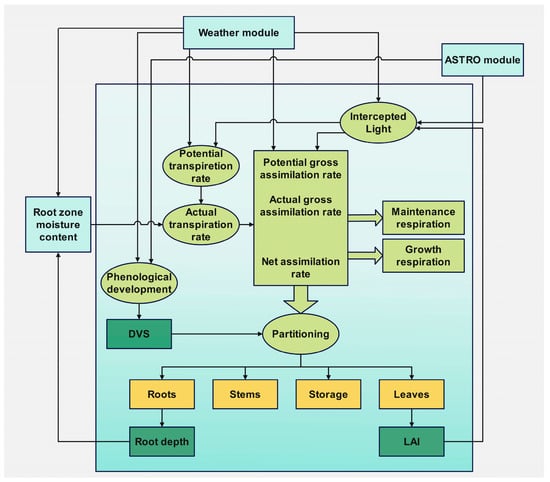
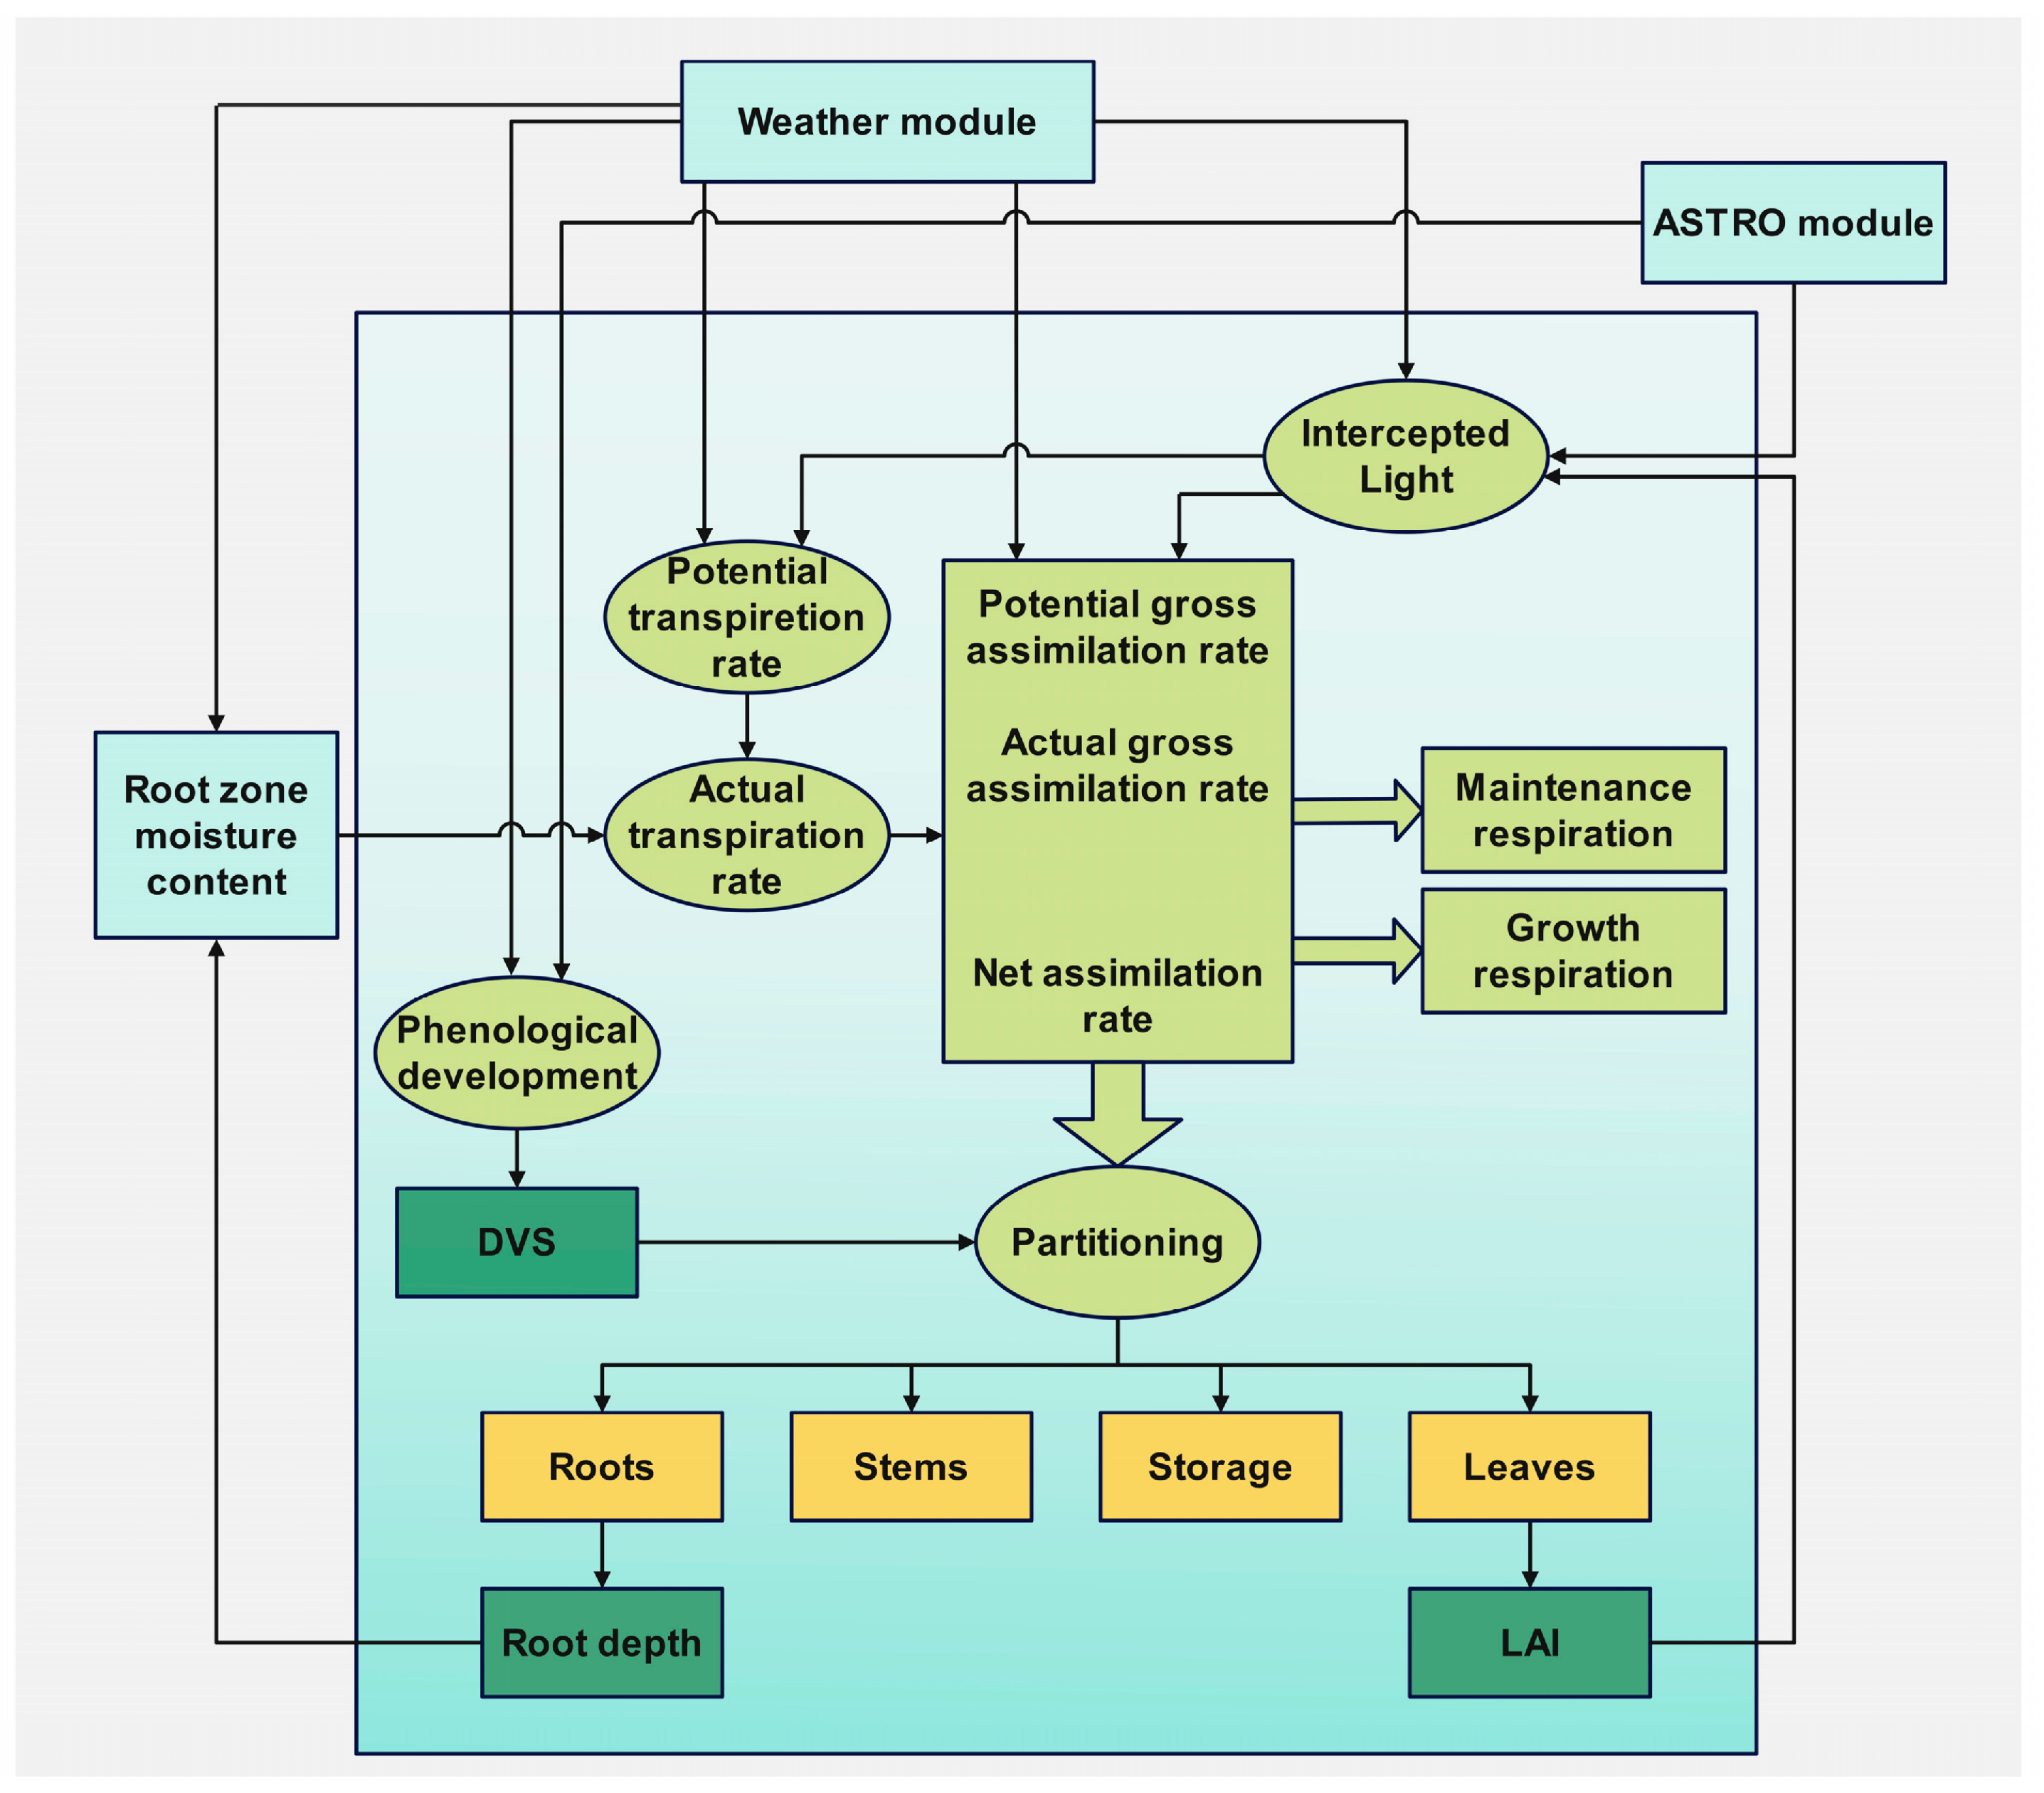
WOFOST (WOrld FOod STudies) is a process-based crop model developed from physiological and ecological mechanisms governing crop growth [27]. It has been widely used for growth simulation under different crop types, environmental conditions, and management contexts. In this study, simulations were conducted using PCSE (Python Crop Simulation Environment), the Python-based implementation platform of WOFOST. Figure 1 illustrates the relationships among the principal WOFOST modules and their roles in crop process simulation. For the present study, these modules mainly involve phenology, canopy interception, photosynthetic assimilation, respiration, dry-matter formation, and assimilate partitioning. The model operates at a daily scale and combines weather, soil, crop, and management inputs throughout the growing period. Thus, from a modeling perspective, growth simulation for other vegetation can be achieved once suitable input parameters are established [28,29,30].
Figure 1.
The major processes implemented in WOFOST. DVS, development stage; LAI, leaf area index; ASTRO, astronomical day-length and radiation calculation module.
Taking the harvested part, growth purpose, and assimilate allocation pattern into account, this study used WOFOST-sugarbeet as the initial framework for model construction [23]. The reason for choosing this module is not that sugar beet and A. sinensis are biologically identical, but that they share some key functional features in the process of yield formation. For example, both crops form yield mainly through enlarged underground storage organs, so belowground dry-matter accumulation is directly related to final economic output [25]. In cultivation, the main objective of both is also to maintain vegetative growth and support the development of the underground economic organ, rather than to promote reproductive growth. Once bolting or reproductive transition occurs too early, the commercial quality of sugar beet and the medicinal value of A. sinensis may both be seriously affected [12,31]. In addition, their assimilate allocation processes show a broadly similar tendency: more assimilates are used for aboveground establishment in the early growth stage, while allocation gradually shifts toward underground storage organs later [23]. Therefore, WOFOST-sugarbeet was adopted only as a modifiable and calibratable modeling basis, rather than as direct evidence that the two crops are completely equivalent in biological mechanisms.
It should be noted that the WOFOST model was originally developed mainly for annual field crops, whereas A. sinensis is a perennial medicinal plant. Its natural life cycle generally includes seedling cultivation in the first year, vegetative growth in the second year, and bolting and flowering in the third year [11,32]. Therefore, the default phenological development framework of WOFOST cannot fully match the complete life cycle of A. sinensis. Accordingly, this study focuses on simulating the second-year vegetative growth stage of A. sinensis. Using the WOFOST-sugarbeet module as the basic framework, key physiological parameters related to phenological development, growth rate, and dry-matter partitioning were localized and calibrated using the 2019 field observations, and the resulting parameter set was independently evaluated using the 2020 field data. This procedure aimed to improve the model’s simulation accuracy for growth dynamics and yield formation during this growth stage, while reducing the mismatch between the original model parameters and the actual growth characteristics of A. sinensis. On this basis, the following sections focus on analyzing the model’s performance in simulating growth dynamics and yield-related indicators of A. sinensis and systematically evaluating the applicability and inherent limitations of WOFOST in simulating its growth process.
2.2. Field Experiment
2.2.1. Description of the Experimental Site
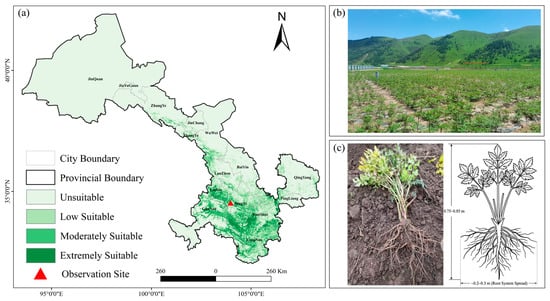
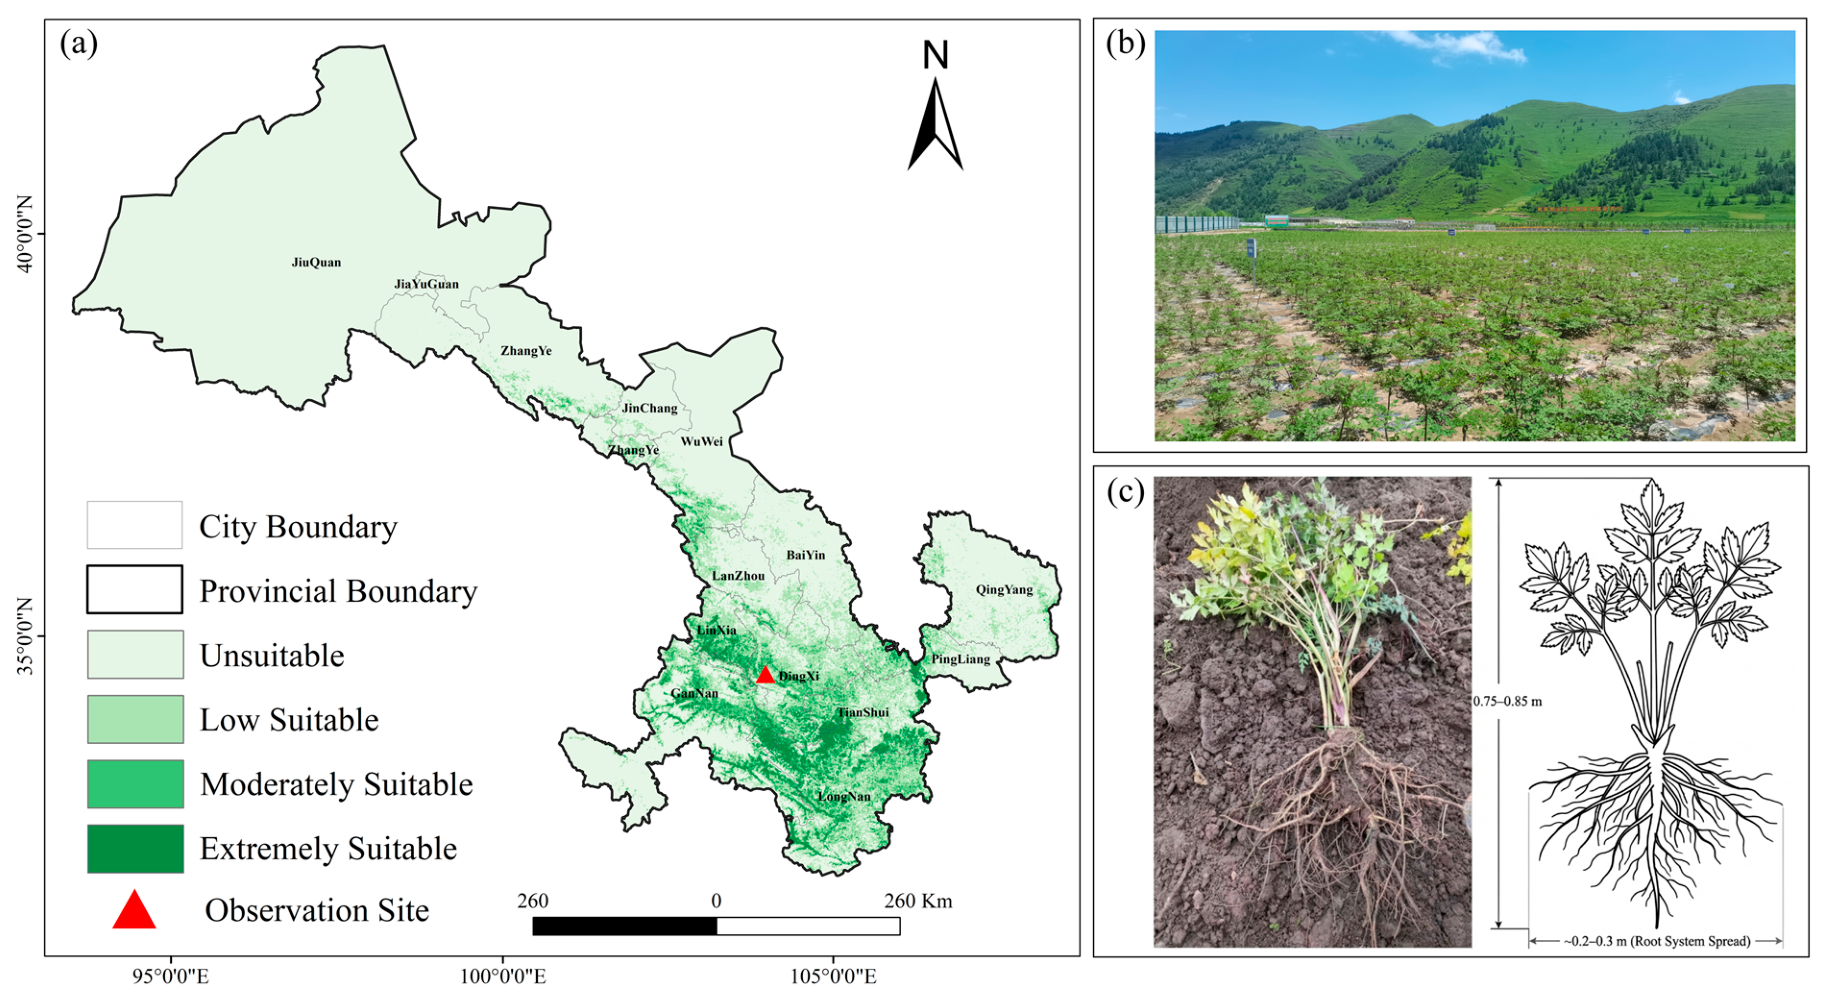
The field experiment was conducted in Lizhu Village, Sigou Town, Min County, Dingxi City, Gansu Province, China (Figure 2). This area is one of the important production regions for A. sinensis and is located in the mountainous part of the Loess Plateau. The site has an elevation of about 2490 m, with a cold and humid climate and obvious temperature differences between day and night. The annual mean temperature is around 6 °C, the frost-free period is approximately 130 days, and the average annual precipitation is about 650 mm. The soil at the experimental site belongs to Heilu soil, which is widely distributed in the local A. sinensis production area. Before transplanting, the soil organic matter content was 37.1 g·kg−1, and the measured soil pH was 7.77. Available potassium, available phosphorus, and alkali-hydrolyzable nitrogen were 215.0, 59.6, and 250.0 mg·kg−1, respectively. These environmental data mainly described the experimental background and supplied basic site information for the following WOFOST simulations.
Figure 2.
Distribution and experimental setup of A. sinensis in Gansu, China. (a) Habitat suitability map of A. sinensis in Gansu, with color gradients representing suitability levels (unsuitable, low, moderate, and extremely suitable) [14]. The red triangle denotes the experimental site location. (b) Photograph of the experimental field. (c) Morphology of A. sinensis and its root system structure.
2.2.2. Experimental Design
Field observations were conducted during 2019–2020 using a single-site and single-plot design. The main purpose was to obtain growth-monitoring data and parameter information needed for model development and localization. Plant spacing and row spacing were 7.5 cm and 40.0 cm, respectively, and each plot measured 11.5 m × 4.0 m. A compound fertilizer formulated for Chinese medicinal plants (N–P2O5–K2O = 17–17–17) was applied at 750 kg·ha−1, together with oilseed cake at 300 kg·ha−1. No irrigation was provided, so the crop grew under rainfed conditions. The cultivar used was Mingui No. 1. Seedlings were obtained from Lujing Town, Min County, Dingxi, in 2018 and 2019, and were stored in cellars during winter. Before transplanting, the selected seedlings had an average root length of 6.00 ± 1.50 cm, root diameter of 4.50 ± 0.50 mm, and fresh single-root weight of 0.50 ± 0.10 g.
2.2.3. Field Data Collection
Field measurements focused on the main indicators related to the growth process and yield formation of A. sinensis. From 30 May to 10 November in both 2019 and 2020, the crop was monitored continuously during the growing season. Samples were taken at 20-day intervals, giving nine observations each year and covering the major developmental stages. The measured variables included storage-organ traits, aboveground biomass, and root-development indicators, which were later used for model evaluation and result interpretation. In this study, total dry weight of storage organs (TWSO) was used as the key variable for describing yield formation. Aboveground measurements reflected biomass accumulation during vegetative growth, while root-related variables helped explain changes in belowground growth.
On each sampling date, ten normally growing A. sinensis plants without visible disease symptoms were selected. These samples were mainly used to record morphological traits related to root development and aboveground growth. After the plants were dug out, shoots and roots were separated, and the soil remaining on the roots was gently removed. Root length per plant was measured immediately, while shoot fresh weight and root fresh weight were determined using an analytical balance (EX224ZH, OHAUS Instruments (Changzhou) Co., Ltd., Changzhou, China). Senescent or dried leaves were excluded from the shoot part, and all fresh weights were recorded on the sampling day. For dry-matter measurement, the shoots of the ten plants were mixed into one aboveground sample for each sampling date. After fine roots were removed, the root parts were also pooled as the corresponding belowground storage-organ sample. The pooled shoot sample was used to represent leaf and stem dry matter, while the pooled root sample represented storage-organ dry matter. Samples were heat-treated at 105 °C for 1 h and subsequently oven-dried at 75 °C to constant mass using a forced-air drying oven (101-1AB, Tianjin Taisite Instrument Co., Ltd., Tianjin, China). The resulting dry weights provided observed biomass variables for calibration, validation, and comparison with WOFOST state variables and outputs. For the physiological measurements required for model parameterization, another ten healthy plants were selected from the experimental field on each sampling date. Fully expanded functional leaves from the upper canopy were collected, and the net photosynthetic rate, stomatal conductance, and intercellular CO2 concentration were measured using a portable photosynthesis system (LI-6400XT, LI-COR, Inc., Lincoln, NE, USA). Light-response curves under saturated irradiance were then fitted to derive the maximum net photosynthetic rate and light-use efficiency after quality control [33].The 2019 and 2020 field observations were collected by the research team during two separate growing seasons at the same experimental site. Yield records for 2010–2024 were obtained from the Gansu Statistical Yearbook and were handled separately from the field measurements. The specific roles of these datasets in model calibration, independent-year validation, and interannual trend-consistency assessment are described in Section 2.5.2.
2.3. Model Input Data
WOFOST simulation depends on four groups of inputs: weather data, soil properties, crop parameters, and management information [27]. In this study, the weather variables included daily radiation, maximum and minimum temperature, precipitation, wind speed, and vapor pressure. These variables drive the modeled processes of crop development, photosynthesis, and evapotranspiration. Soil-related inputs mainly described water retention, soil texture, and root-zone conditions at the experimental site, thereby defining the physical environment for crop growth and soil water movement. Management information, such as planting date, field practices, and harvest timing, was used to set the simulation period and key operational events. These data were collected from field records, public databases, and published studies, and were further adjusted according to local production conditions.
The weather data used in this study were obtained from NASA’s Prediction of Worldwide Energy Resources (POWER) database [34], which can provide daily meteorological records based on specified coordinates and time periods. The selected variables included daily global horizontal irradiance, 2 m mean wind speed, daily maximum air temperature (), daily minimum air temperature (), and precipitation. Irradiance was expressed in kJ·m−2·d−1, and precipitation was expressed in mm·d−1. Mean daily saturation vapor pressure () was calculated from and following the FAO-56 procedure [35].
where is the saturation vapor pressure at air temperature (kPa); is the mean daily saturation vapor pressure (kPa); , , and denote air temperature, daily maximum air temperature, and daily minimum air temperature (°C), respectively; and exp denotes the exponential function. The calculated was subsequently used as an additional meteorological input in WOFOST.
Soil-related inputs for WOFOST were prepared using both field measurements and data from the China Soil Database. The plot-level measurements reflected the actual soil conditions at the experimental site, while the database supplied additional regional soil information to supplement the field records. For model operation, priority was given to parameters controlling soil water retention and hydraulic behavior in simulations. These parameters included field capacity, saturated water content, soil bulk density, and saturated hydraulic conductivity for the site. Soil pH and related indicators were used mainly as background descriptors rather than primary dynamic drivers in simulations. Collectively, the soil dataset characterized the local growth medium and constrained simulated water processes in WOFOST for A. sinensis.
In WOFOST, crop parameters are divided into two main types according to the crop file organization [36]. Scalar parameters constitute the first type, taking single numerical values that remain invariant throughout the simulation across all developmental stages. These include TSUMEM, TSUM1, TSUM2, TDWI, LAIEM, RGRLAI, RDI, RRI, RDMCR, CVL, CVO, CVR, and CVS (Table 1). The second type consists of tabular parameters, defined as paired values to describe process-specific responses to the development stage (DVS). Key tabular parameters include SLATB, AMAXTB, FRTB, FLTB, FSTB, and FOTB (Table 2).
Table 1.
Original WOFOST-sugarbeet scalar parameters and localized values for A. sinensis.
Table 2.
DVS-dependent tabular crop parameters in the localized WOFOST crop file.
The original scalar parameter values were obtained from the WOFOST-sugarbeet crop-parameter file and were used only as initial reference values. For the localized A. sinensis parameter set, TSUMEM, TSUM1, and TSUM2 were calculated from observed phenological dates and thermal accumulation; TDWI was estimated from initial seedling biomass and planting density; LAIEM was determined from field observations and initial leaf-area-index estimation; RGRLAI and RRI were fitted to the observed LAI and root-length dynamics, respectively; RDI and RDMCR were determined from observations of initial root length and maximum effective root depth; CVL, CVO, CVR, and CVS were fitted or adjusted using organ-level dry-matter accumulation; and SPAN was determined from published information and observed leaf senescence. The DVS-dependent tabular parameters were derived or calibrated using the 2019 field and physiological observations of A. sinensis at the transplanting, greening, medicinal formation (root enlargement), and digging stages (Table 3). The DVS nodes 0.0, 0.5, 1.0–1.5, and 2.0 correspond to these four developmental phases, respectively.
Table 3.
Phenological phases of A. sinensis at various developmental stages.
Because the present study focused on the second-year vegetative growth of A. sinensis, the simulation was initialized at transplanting rather than at seed emergence. The first-year nursery-growth and overwintering cellar-storage processes were not simulated explicitly; instead, their cumulative effects were represented by the measured initial state of the overwintered seedlings at transplanting. At model initialization, DVS was set to 0.0. The initial root depth (RDI) was set to 6.0 cm according to the measured pre-transplant root length, while the initial total crop dry weight (TDWI) and initial leaf area index (LAIEM) were set to 55.0 kg·ha−1 and 0.3 ha·ha−1, respectively, based on the initial seedling observations and planting density. These localized initial conditions provided the structural baseline for simulating subsequent second-year vegetative growth.
Field management settings were specified mainly on the basis of traditional farming practices in the Dingxi production region. In the model, these settings included transplanting time, fertilization, and irrigation management during the growing season. A special-purpose compound fertilizer for Chinese medicinal plants (N–P2O5–K2O = 17–17–17) was applied at a rate of 750 kg·ha−1. Oilseed cake was additionally applied at 300 kg ha−1, and no irrigation was supplied throughout the growing season. These management inputs were consistent with the field trial and were used to construct the management scenario. This scenario provided the operational conditions required for WOFOST-based simulation of A. sinensis growth.
2.4. Parameter Sensitivity Analysis
Process-based crop models generally operate as nonlinear dynamic systems with many parameters, state variables, and structural components. These features are also major sources of uncertainty because direct measurement of every parameter is rarely feasible [39]. Sensitivity analysis provides a way to allocate simulation uncertainty to individual parameters and assess their effects [40]. It can therefore reduce calibration workload and improve confidence in model outputs during parameter optimization. In this study, Sobol global sensitivity analysis was performed using SALib, an open-source sensitivity-analysis package implemented in Python 3.3.2 [41]. This variance-based method is suitable for quantifying parameter main effects and interactions in nonlinear models. The first-order Sobol index denotes the independent contribution of one parameter, whereas the total-order index includes interaction contributions, as shown in Equations (3)–(5).
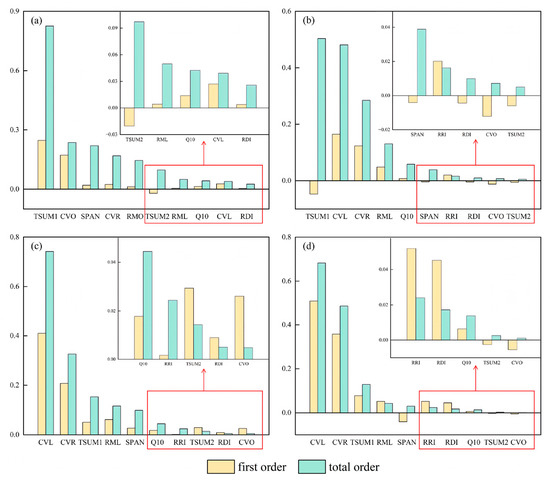
The Saltelli sampler implemented in SALib was used to generate parameter sets for Sobol sensitivity analysis. First-order and total-order Sobol indices were then estimated from the corresponding WOFOST simulation results. The base sample size N was fixed at 128, which resulted in 4864 individual model simulations. Since the field experiment was rainfed, the analysis was performed under a water-limited scenario matching the observed cultivation conditions. Total dry weight of storage organs (TWSO) served as the principal response variable for assessing model sensitivity. Aboveground biomass and root-related variables were used as supporting outputs to compare parameter effects across growth processes. Parameter ranges were defined using the 2019 field observations, the initial WOFOST settings, and published references [42]. Table 4 summarizes the lower and upper bounds used for Sobol sampling rather than the resulting sensitivity rankings. The sensitivity results and corresponding calibration priorities are presented in Section 3.1 and Figure 3.
Table 4.
Parameter ranges used in the Sobol global sensitivity analysis.
Figure 3.
Sobol global sensitivity indices of key crop parameters for different model outputs. (a) TWSO; (b) TWLV; (c) TWST; and (d) LAI.
Sensitivity analysis should be understood as an assessment of model-output responses to parameter variation within the defined parameter space. It can support identification of key uncertainty sources and help establish priorities for subsequent parameter calibration. However, these indices do not directly represent causal dominance in the real biological system of A. sinensis. Therefore, the interpretation of sensitivity results in this study is restricted to two main purposes. First, they identify parameters with relatively strong effects on storage-organ yield formation under the simulation setting. Second, they explain differences in parameter-response patterns among output variables and support discussion of model limitations.
2.5. Model Simulation, Calibration, and Evaluation
2.5.1. Model Simulation and Calibration
To adapt WOFOST-sugarbeet for local A. sinensis simulation, the original sugarbeet parameter values were used only as initial reference values. Phenological parameters were recalculated from observed developmental dates and thermal accumulation; initial-state and root-depth parameters were estimated from seedling and root observations; leaf-area and root-growth parameters were fitted to the 2019 dynamic observations; and conversion and partitioning parameters were calibrated against organ-level dry-matter accumulation. Detailed parameter-specific sources and determination methods are provided in Table 1 and Table 2. Calibration was carried out step by step rather than adjusting all parameters at once. Following the staged idea suggested by Ceglar et al. [43], phenology was handled first, and biomass accumulation and yield-related processes were then refined. The main phenological parameters, including TSUMEM, TSUM1, and TSUM2, were adjusted according to four observed stages: Transplanting, Greening, Medicinal formation, and Digging [44]. These stages describe the major developmental course of second-year vegetative growth. After the model could reasonably reproduce this process, parameters linked to leaf expansion and aboveground biomass formation were further modified. Storage-organ formation and assimilate partitioning were adjusted in the final step, with only small auxiliary changes allowed within biologically acceptable ranges.
The 2019 field dynamic data were used only for local calibration and were not mixed with the later independent-year evaluation. During calibration, the aim was not simply to obtain the best value for one specific metric. Instead, the process was stopped when errors in the main growth variables no longer showed obvious improvement across key developmental stages. At the same time, parameter values had to remain physiologically reasonable, and model performance needed to stay balanced among different variables. This strategy reduced the risk of overfitting one variable and helped produce a more interpretable localized parameter set, providing a more reliable basis for the subsequent evaluation of the adapted WOFOST model.
2.5.2. Model Performance Evaluation
Model evaluation was organized into three non-overlapping stages. First, the 2019 field observations were used exclusively for parameter localization and calibration. Second, after calibration, the localized parameter set was held unchanged and evaluated against the 2020 field observations, which were not used in parameter estimation or calibration. This provided an independent-year temporal validation of storage-organ dry weight (TWSO), harmonized aboveground dry weight (TWLV + TWST), and root length (RD). Because the 2019 and 2020 field datasets were obtained from the same experimental site, this validation assesses temporal robustness beyond the calibration year rather than spatial transferability. Third, the 2010–2024 statistical yield series was used only to assess consistency in approximate yield magnitude and interannual trends; it was not treated as an independent experimental validation dataset or as a year-by-year reconstruction of regional yield.
Consistency between simulated and measured values was evaluated using scatter plots together with several complementary statistical metrics. The coefficient of determination described how well simulated values fitted their corresponding observations across evaluated variables. Root mean square error was used to represent absolute error between simulations and measurements in original units. Mean absolute error reflected the average deviation level, while relative root mean square error normalized error against observed means. In general, R2 approaching one indicates a higher degree of agreement between model outputs and observations. Smaller root mean square error, mean absolute error, and relative root mean square error indicate better simulation accuracy [45]. Since these metrics emphasize different aspects of model performance, interpretation was based on both statistics and variable dynamics.
The statistical indicators used for model evaluation were calculated using the following formulas:
denotes the observed value, denotes the simulated value, is the mean of observed values, and is the sample size. These indicators were calculated separately for each output variable and were used for process-variable evaluation and statistical yield-trend consistency assessment.
3. Results
3.1. Sensitivity Analysis of Key Crop Parameters
Figure 3 illustrates the Sobol first-order () and total-effect () indices for TWSO, TWLV, TWST, and LAI as outputs. The results show clear differences in the most sensitive parameters among the four output variables examined here. Nevertheless, sensitivity was mainly associated with parameters regulating accumulated temperature and dry-matter conversion or partitioning within WOFOST. This indicates that phenological development and biomass allocation jointly influenced simulated structural and growth-related outputs in the model. Therefore, the following analysis emphasizes parameters with consistently large direct or total sensitivity contributions across output variables.
For TWSO, TSUM1 had the highest sensitivity, with and reaching 0.826 and 0.247, respectively, overall. CVO, SPAN, CVR, and RMO also showed values of 0.236, 0.220, 0.169, and 0.146, while CVO had . This pattern suggests a notable direct effect of CVO on simulated storage-organ dry weight within the model. For TWLV, TSUM1, CVL, and CVR were most sensitive, with values of 0.503, 0.481, and 0.285. CVL and CVR had values of 0.165 and 0.123, respectively, indicating clear direct contributions to TWLV. For TWST, CVL dominated with and , whereas CVR followed with 0.326 and 0.208, respectively. For LAI, CVL and CVR were again dominant, with of 0.683 and 0.487 and of 0.509 and 0.358.
Taken together, TSUM1, CVL, CVR, and CVO were the parameters requiring the greatest calibration attention across the evaluated model outputs. TSUM1 exerted the strongest total-order effects on TWSO and TWLV, with values of 0.826 and 0.503, respectively. CVL dominated the responses of TWST and LAI, with values of 0.742 and 0.683, while CVR also showed substantial effects on these two outputs, with corresponding values of 0.326 and 0.487. CVO was particularly important for TWSO, with and . From the perspective of storage-organ yield simulation, TSUM1 should therefore receive the highest calibration priority, followed by CVO and SPAN, whereas CVR and RMO should be considered secondary priorities under the tested parameter space. Overall, future calibration should focus primarily on parameters governing phenological development and dry-matter conversion or allocation.
3.2. Parameter Calibration of the WOFOST Model Based on 2019 Field Observations
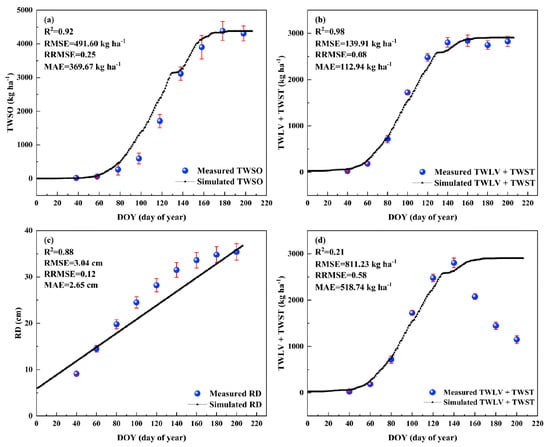
The fitting performance of the calibrated model was assessed using 2019 field dynamic observations, with results presented in Figure 4a–d. For total dry weight of storage organs (TWSO), the simulated and observed values were generally close (Figure 4a). The model produced R2 = 0.92, RMSE = 491.60 kg·ha−1, RRMSE = 0.255, and MAE = 369.67 kg·ha−1. For aboveground total dry weight defined consistently as TWLV + TWST, the best-fitting performance was obtained (Figure 4b). The corresponding R2, RMSE, RRMSE, and MAE were 0.98, 139.91 kg·ha−1, 0.077, and 112.94 kg·ha−1. For root length (RD), the model also showed high accuracy, with R2, RMSE = 3.04 cm, RRMSE = 0.118, and MAE = 2.65 cm.
Figure 4.
Fitting results of key process variables based on the 2019 field observations. (a) Total weight of storage organs (TWSO); (b) harmonized total aboveground dry weight (TWLV + TWST); (c) root length (RD); and (d) original-observation total aboveground dry weight (TWLV + TWST).
In comparison, the agreement between simulated values and aboveground total dry weight under the original observation definition was markedly reduced (Figure 4d). The R2 was only 0.21, while RMSE, RRMSE, and MAE were 811.23 kg·ha−1, 0.581, and 518.74 kg·ha−1, respectively. This indicates that differences in observation definitions can significantly influence the resulting assessment of model performance. When the statistical definition of observations was aligned with the model state variables, model fitting improved substantially. Therefore, consistent variable definitions are essential for evaluating simulated aboveground biomass dynamics in a comparable and reliable manner.
3.3. Evaluation of Process Variables Based on 2020 Field Observations
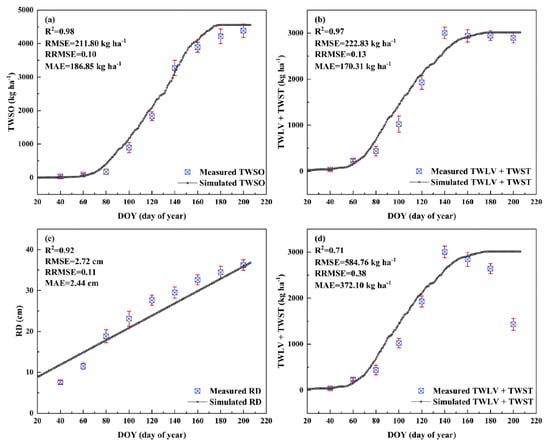
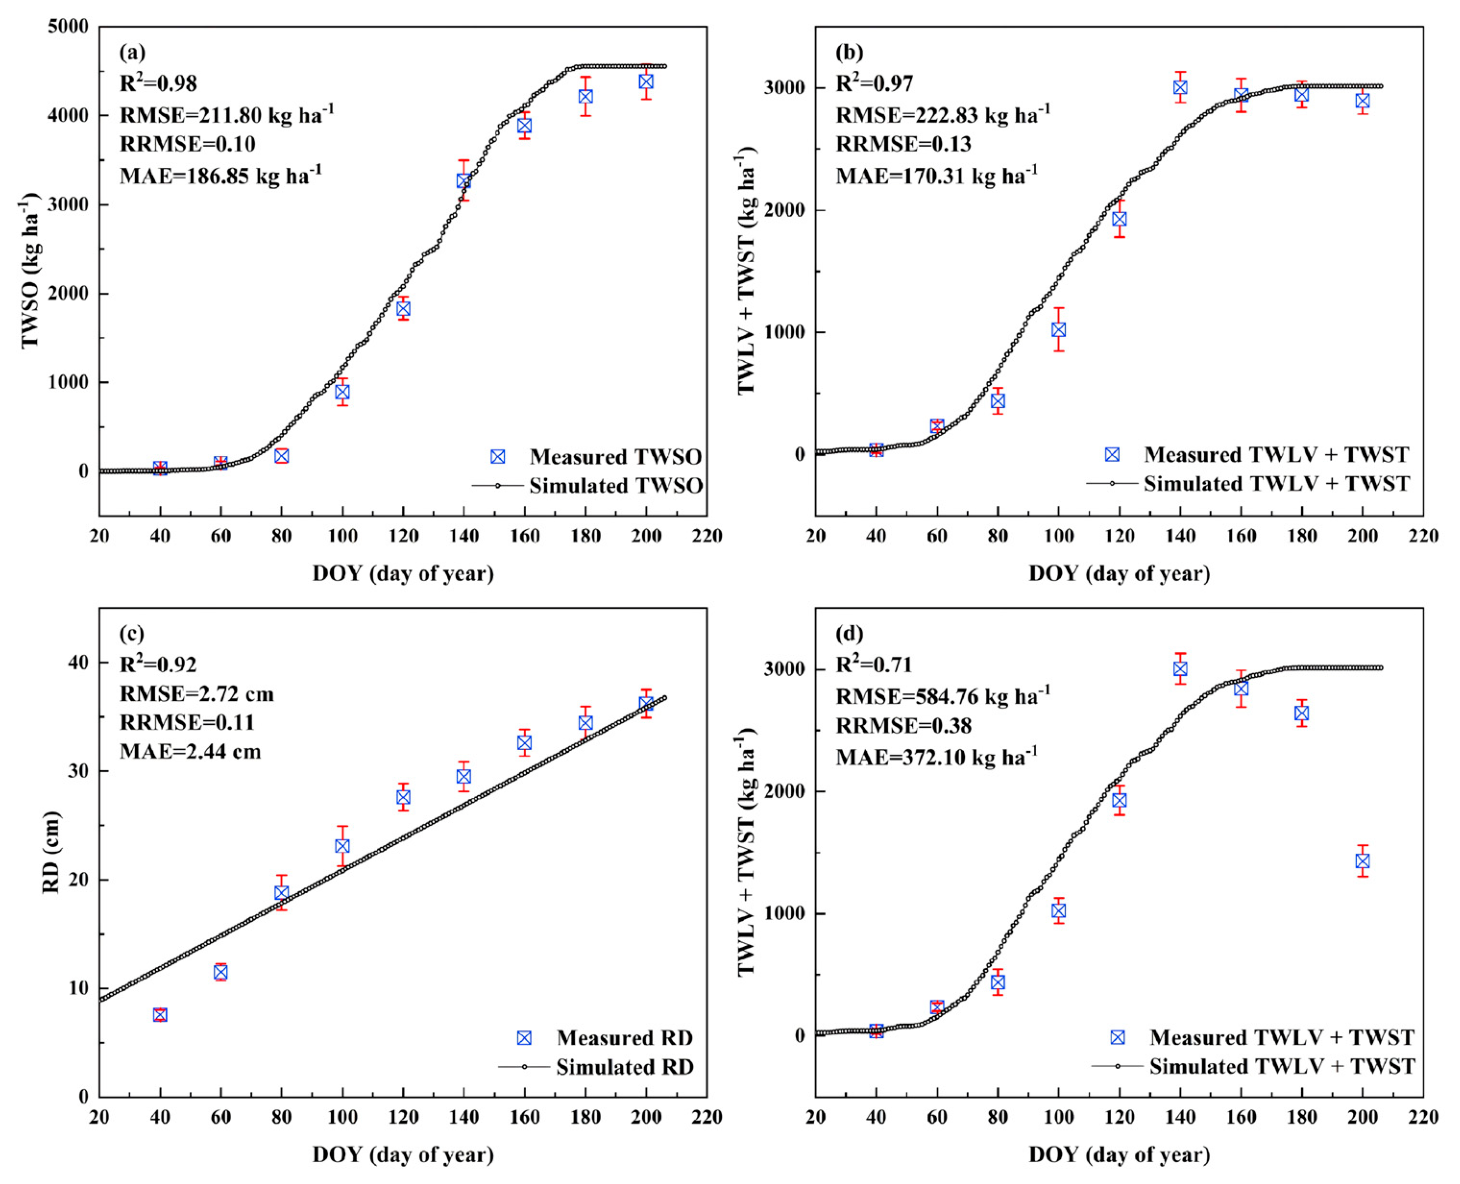
Using the localized parameter set calibrated exclusively with the 2019 data and held unchanged thereafter, the model was evaluated against the independent 2020 field observations. The model maintained satisfactory performance for TWSO, harmonized TWLV + TWST, and RD, indicating that the localized parameter set retained useful temporal robustness beyond the calibration year. The corresponding comparisons are presented in Figure 5a–d.
Figure 5.
Evaluation results of key process variables based on the 2020 field observations. (a) Total weight of storage organs (TWSO); (b) harmonized total aboveground dry weight (TWLV + TWST); (c) root length (RD); and (d) original-observation total aboveground dry weight (TWLV + TWST).
For TWSO (Figure 5a), the simulated values were highly consistent with the 2020 field observations. The model yielded R2 = 0.98, RMSE = 211.80 kg·ha−1, RRMSE = 0.10, and MAE = 186.85 kg·ha−1. For consistently defined TWLV + TWST, the model also showed strong fitting performance, as shown in Figure 5b. The corresponding R2, RMSE, RRMSE, and MAE were 0.97, 222.83 kg·ha−1, 0.13, and 170.31 kg·ha−1. For RD (Figure 5c), good agreement was also maintained between simulated and observed values. Its R2, RMSE, RRMSE, and MAE were 0.92, 2.72 cm, 0.11, and 2.44 cm, respectively.
Under the original observation definition, TWLV + TWST fitting was weaker than that obtained under the unified definition (Figure 5d). However, the R2 value still reached 0.71, with RMSE = 584.76 kg·ha−1, RRMSE = 0.38, and MAE = 372.10 kg·ha−1. This was substantially higher than the 2019 result under the original definition, where R2 was 0.21. Overall, the 2020 validation results further indicate that the localized parameter system had satisfactory simulation capacity. It captured storage-organ accumulation, aboveground biomass variation, and root development dynamics of A. sinensis with good performance.
3.4. Consistency Assessment of Simulated and Statistical Yield Trends from 2010 to 2024
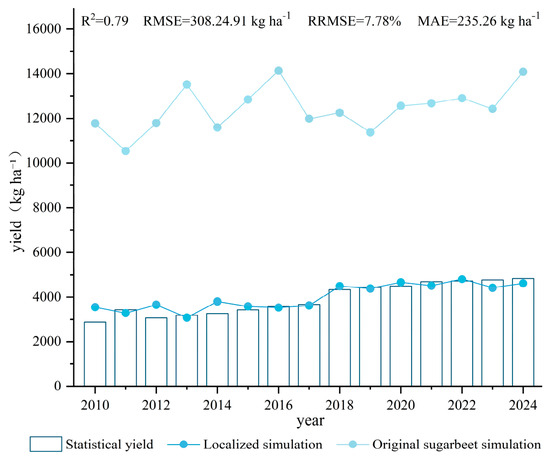
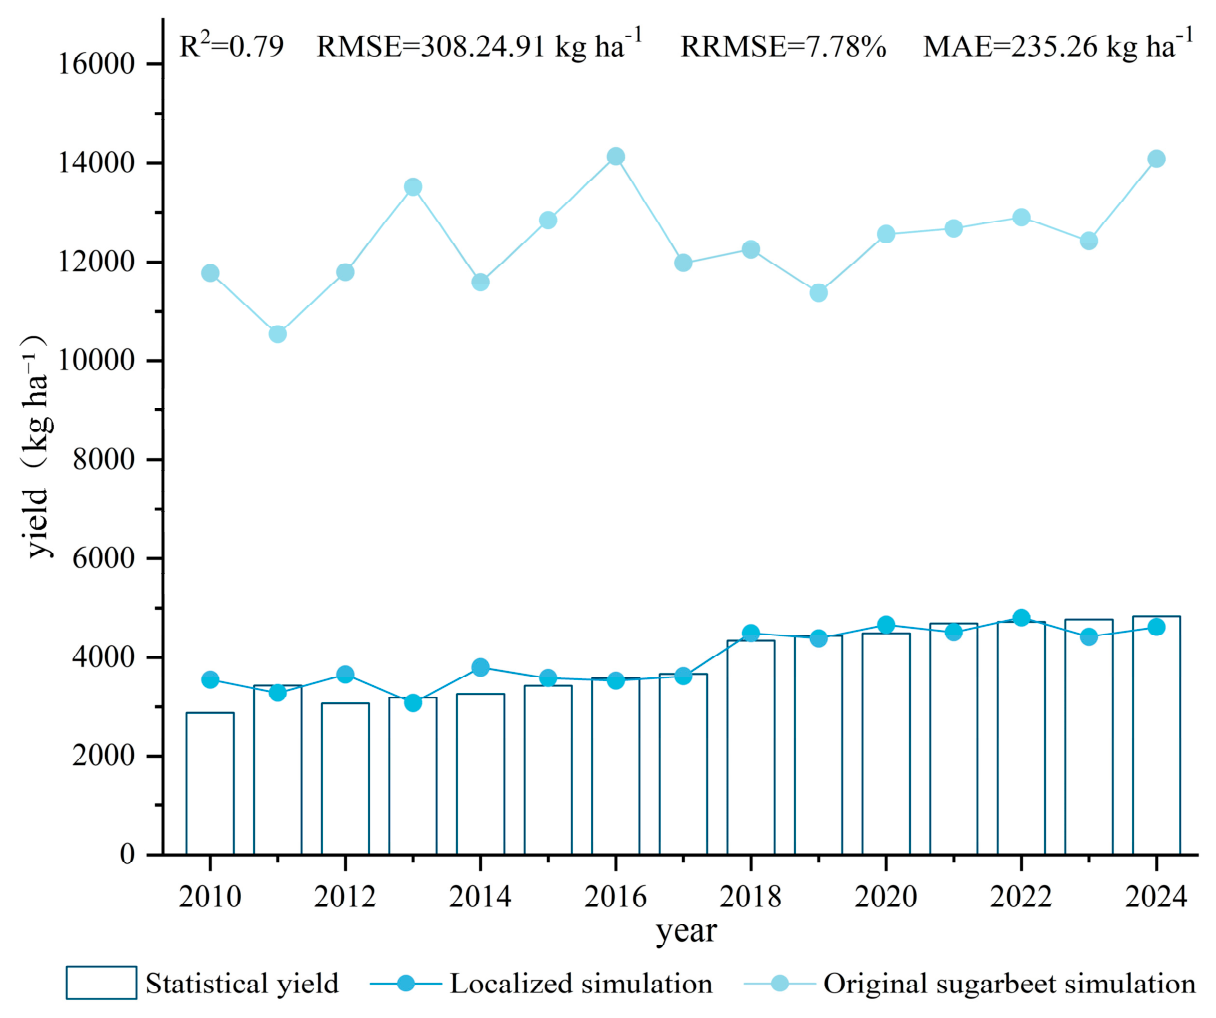
Figure 6 compares the statistical yield records with the simulated yields generated using the localized A. sinensis parameter set and the original sugarbeet parameter set for 2010–2024. This comparison was intended only to assess consistency in approximate yield magnitude and broad interannual trends, rather than to serve as an independent experimental validation or a year-by-year reconstruction of regional production. Localized parameterization clearly improved the agreement between simulated and statistical yields over the multi-year period. The localized simulations achieved R2 = 0.79, RMSE = 308.24 kg·ha−1, MAE = 235.26 kg·ha−1, and RRMSE = 7.78%. From an interannual perspective, the localized simulations reflected the main temporal pattern in the statistical records, including the broad transition from relatively low yield levels in the earlier years to higher levels in the later period. In contrast, simulations based on the original sugarbeet parameter set were substantially higher than the statistical yields, indicating that the original sugarbeet parameters were not directly transferable to A. sinensis.
Figure 6.
Comparison of measured yield, uncalibrated simulated yield, and calibrated simulated yield of A. sinensis from 2010 to 2024.
4. Discussion
4.1. Suitability of the Localized WOFOST Framework for A. sinensis Simulation
The results suggest that the localized WOFOST framework was able to capture the main growth pattern and yield formation process of second-year vegetative A. sinensis. During the growing season, the calibrated model performed well in simulating TWSO, consistently defined TWLV + TWST, and RD. At the multi-year scale, the calibrated yield series also showed a trend broadly in line with the statistical yields from 2010 to 2024. Overall, these results indicate that the adapted WOFOST-sugarbeet framework has practical value for describing key growth dynamics and yield formation in A. sinensis. Therefore, the localized framework appears suitable for process-based simulation of A. sinensis under the current experimental conditions [28].
This suitability mainly arises from the functional similarity between sugar beet and A. sinensis. In both crops, the underground storage organ is an important economic organ, and yield formation depends on coordinated aboveground biomass accumulation and assimilate allocation to belowground storage organs [46]. Accordingly, WOFOST-sugarbeet provides a reasonable structural basis for simulating growth processes dominated by storage-organ formation. However, the higher yields generated by the uncalibrated simulation should not be interpreted as an inherent systematic bias of WOFOST. Rather, the discrepancy reflects species-specific differences between sugar beet and A. sinensis in plant architecture, phenological development, storage-organ formation, and assimilate allocation. Therefore, the sugarbeet module should be regarded as an adaptable process framework, and its original parameters require species- and stage-specific localization before application to A. sinensis [24].
Localized parameterization made the WOFOST framework more consistent with the growth characteristics of A. sinensis [29]. Based on field observations, parameters related to phenological development, dry-matter conversion, and assimilate allocation were adjusted. After calibration, the model could better describe the transition from aboveground vegetative growth to underground storage-organ formation. For this reason, the model should be regarded as a localized process-simulation framework for the second-year vegetative stage, rather than a complete model of the whole perennial life cycle of A. sinensis [32].
4.2. Process Interpretation of the Key Sensitive Parameters
The sensitivity analysis indicated that only a limited number of parameters dominated model responses, especially TSUM1, CVL, CVR, and CVO. This finding suggests that uncertainty in the adapted framework was mainly associated with phenology and dry-matter conversion or partitioning. Among these parameters, TSUM1 was highly sensitive, with particularly clear effects on TWSO and TWLV. This implies that accumulated temperature required for development substantially regulates the temporal pattern of biomass accumulation [47]. In A. sinensis, yield formation relies on coordinated development between canopy growth and storage-root enlargement. Thus, variation in developmental progress may further affect assimilate accumulation, assimilate supply, and dry matter stored in underground organs.
The strong sensitivity of CVL, CVR, and CVO highlights the importance of dry-matter conversion and organ partitioning in model outputs [36]. CVL mainly affected TWST and LAI, while CVR and CVO were closely linked to biomass accumulation. Their effects were associated with simulated changes in both aboveground growth and belowground storage-organ development. This is generally consistent with the biological growth pattern of A. sinensis. In the early stage, assimilates are mainly used to build the canopy, while in later growth, they gradually shift toward medicinal storage organs [48,49]. Therefore, model accuracy depends strongly on how well conversion efficiency and organ-level assimilate partitioning are represented.
These sensitivity results are better viewed as the model’s response to parameter changes, rather than direct proof of biological causality in the field. When a parameter shows high sensitivity, it means that the simulated outputs vary greatly within the preset parameter range. However, this does not necessarily prove that the corresponding physiological process plays the same causal role under actual field conditions. Even so, the results are still useful for model improvement and parameter calibration [50]. Future optimization should give priority to phenological development and assimilate partitioning, instead of adjusting all parameters equally without considering their influence on output uncertainty.
4.3. Explanation of Calibration Results and Independent-Year Validation
The calibration results from 2019 and the independent evaluation from 2020 demonstrate stable performance of the localized parameter set [28]. In 2019, the model reproduced growth-season dynamics of TWSO, consistently defined TWLV + TWST, and RD with good accuracy. In 2020, similarly high accuracy was retained for these same process variables. The TWSO simulations were especially consistent with the corresponding observations. This indicates that the calibrated model was not merely overfitted to the calibration year. Instead, it retained useful robustness under independent-year application [29].
Among the evaluated variables, TWSO maintained consistently strong simulation performance. This is important because TWSO directly describes dry-matter accumulation in the medicinal storage organs of A. sinensis [48]. It is also the process variable most closely connected with yield formation. The model’s good TWSO performance suggests that localized parameters captured the main accumulation process of underground medicinal parts. RD simulations further indicate that the model represented belowground growth dynamics to some extent. Nevertheless, root morphology and storage-organ development are still simplified within the present WOFOST structure.
The contrasting TWLV + TWST results under unified and original definitions reveal a key issue in evaluating process-based models. Agreement between field observation variables and model state variables can strongly affect the resulting performance assessment. When the aboveground dry-weight definition matched the model output, both 2019 and 2020 produced high fitting accuracy. In contrast, the original observation definition led to weaker performance, particularly in 2019. This difference should not simply be treated as a model error. Part of it may come from uncertainty caused by the imperfect correspondence between measured variables and model state variables [51]. Therefore, a reliable evaluation depends not only on reasonable parameterization but also on field indicators that can be clearly matched with the variables simulated by the model.
4.4. Consistency of Interannual Yield Trends and the Need for Localized Parameterization
The yield comparison from 2010 to 2024 further demonstrates the necessity of localized parameterization [52]. After calibration, the model described the general yield level and main interannual changes of A. sinensis more accurately. In contrast, simulations using the original sugarbeet parameter set remained substantially higher than the statistical yields, indicating that these default parameters did not quantitatively match A. sinensis. Thus, localization improved not only the simulation of growing-season process variables but also the model’s ability to characterize interannual yield dynamics.
The calibrated improvement suggests that the original sugarbeet parameters provided a useful structural reference, but not suitable quantitative values [25]. Without localization, the model generated continuous growth and yield trajectories, yet these trajectories deviated from observed yield levels. After localized parameterization, simulated yields were closer to statistical records. They also captured the broad transition from lower early yields to relatively higher later yields. This indicates that generic crop models cannot be directly extended to medicinal plants without adaptation. Crop-specific and region-specific parameterization is required for meaningful simulation performance [53].
However, interannual yield comparisons require careful interpretation [54]. Statistical yield represents regional production, so it is not controlled only by climate or crop physiological processes [55]. It may also be affected by cultivar replacement, improved management, changes in planting area, pests and diseases, and market-related planting decisions. The model simulations, however, were based on fixed parameters and a specific experimental-site setting. For this reason, the comparison should not be understood as a year-by-year reconstruction of regional yield. It is mainly used to judge whether the localized model can describe the approximate yield level and the general temporal trend.
4.5. Limitations and Future Directions
Although the localized WOFOST-sugarbeet framework performed reasonably well in simulating the second-year vegetative growth and yield formation of A. sinensis, several limitations should be acknowledged. First, the 2020 field dataset was temporally independent of the 2019 calibration dataset, but both datasets were collected at the same experimental site. Therefore, the 2020 evaluation assessed model robustness beyond the calibration year but did not constitute spatially external validation. In addition, the comparison with the 2010–2024 statistical yield records provided complementary evidence of interannual trend consistency rather than independent experimental validation. Consequently, the transferability of the localized parameter set to other production regions, cultivation practices, and ecological conditions remains uncertain [56]. Future studies should incorporate multi-site and multi-year field observations to evaluate parameter stability and model transferability more rigorously [57]. Second, the present study focused only on the second-year vegetative stage rather than the complete life cycle of A. sinensis. Processes such as seedling establishment, overwintering, vernalization, and bolting or flowering may substantially affect final yield and medicinal quality but are not explicitly represented in the current framework [12,58]. Third, some field observation variables did not correspond exactly to the state variables represented in WOFOST. Future experiments should therefore improve measurement design and ensure clearer correspondence between observed indicators and model variables.
In general, this study offers a workable route for applying WOFOST to perennial medicinal plants with root-based economic organs [29]. A structurally similar crop module was first selected to provide the initial modeling framework. Key parameters were then identified through sensitivity analysis and adjusted through localized calibration [28]. This allowed the model to better represent phenological development and dry-matter partitioning in A. sinensis. Consequently, the framework captured major growth processes and yield formation characteristics reasonably well. This strategy retains the mechanistic advantages of process-based crop modeling while avoiding the complexity of building a completely new model.
5. Conclusions
This study adapted WOFOST-sugarbeet as a starting framework for modeling second-year vegetative growth in A. sinensis. Stage adaptation and localized parameterization were performed according to key process characteristics of this medicinal crop. Model performance was examined through field observations and statistical yield records at multiple evaluation levels. The localized model reproduced important variables associated with growth dynamics and yield formation with relatively high consistency. These variables included total storage-organ dry weight, harmonized total aboveground dry weight, and root length. Sensitivity results showed that major uncertainty arose from developmental timing and assimilate allocation processes. Therefore, TSUM1, CVL, CVR, and CVO provide clear priorities for future calibration and improvement.
The adapted model showed generally stable performance across the different evaluation levels. Based on the 2019 observations, it reproduced the seasonal changes in storage-organ accumulation, aboveground biomass, and root development. When tested with the 2020 data, the calibrated parameters still maintained good agreement with field measurements, suggesting that the model was not simply fitted to the calibration year. The comparison for 2010–2024 also showed that the simulated yields were broadly consistent with the overall trend and phased changes in statistical yields. By contrast, simulations using the original sugarbeet parameter set produced yields substantially higher than the statistical records. This discrepancy confirms that the default sugarbeet parameters cannot be transferred directly to A. sinensis and that species- and stage-specific localization is essential for practical application.
Even with these results, the current framework still needs further improvement. Since WOFOST was developed mainly for annual crops, it cannot fully represent the growth processes of perennial medicinal plants. Processes such as overwintering, vernalization, bolting, and perennial root physiology are still simplified or absent. Some field measurements also correspond only approximately to model state variables, rather than matching them exactly. Therefore, several results should be interpreted within clearly defined variable-mapping and model-structure boundaries. Future work should use multi-site and multi-year datasets for more rigorous external validation. It should also add vernalization effects, bolting risk, and quality-formation processes to the current framework. Overall, localized WOFOST-sugarbeet adaptation supports growth and yield simulation and provides methodological guidance for A. sinensis studies.
Author Contributions
Conceptualization, H.Y. and L.J.; methodology, L.X.; software, L.X.; validation, Y.Z.; formal analysis, R.Y. and E.W.; investigation, H.L.; data curation, Y.Z.; writing—original draft preparation, R.Y.; writing—review and editing, H.Y. and L.J.; visualization, R.Y.; supervision, X.M. and H.Y.; funding acquisition, L.J. All authors have read and agreed to the published version of the manuscript.
Funding
This work was supported by the China Agriculture Research System of the Ministry of Finance and the Ministry of Agriculture and Rural Affairs [grant number CARS-21], the earmarked fund for Gansu Agriculture Research System [grant number GSRAS-06], the Major Program of the Joint Research Fund for the Study on the Variation Patterns and Key Control Technologies of Early Bolting in Angelica sinensis under Extreme Weather Conditions [grant number 25JRRA1171], the Chinese Academy of Engineering–Local Government Cooperation Project on Whole-Chain Quality Control and Industrialization of Geo-authentic Long Medicinal Materials [grant number GS2021ZDA06], and the Graduate Student Innovation and Entrepreneurship Fund Project of Gansu University of Chinese Medicine, [grant number 2026CXCY-340].
Data Availability Statement
The raw data supporting the conclusions of this article will be made available by the authors on request.
Conflicts of Interest
The authors declare no conflicts of interest.
References
- Lee, H.; Calvin, K.; Dasgupta, D.; Krinner, G.; Mukherji, A.; Thorne, P.; Trisos, C.; Romero, J.; Aldunce, P.; Ruane, A.C. Climate change 2023 synthesis report summary for policymakers. In CLIMATE CHANGE 2023 Synthesis Report: Summary for Policymakers; Intergovernmental Panel on Climate Change: Geneva, Switzerland, 2024. [Google Scholar] [CrossRef] [Scilit]
- Hu, T.; Zhang, X.; Khanal, S.; Wilson, R.; Leng, G.; Toman, E.M.; Wang, X.; Li, Y.; Zhao, K. Climate change impacts on crop yields: A review of empirical findings, statistical crop models, and machine learning methods. Environ. Model. Softw. 2024, 179, 106119. [Google Scholar] [CrossRef] [Scilit]
- Tran, B.L.; Tseng, W.C.; Chen, C.C. Climate change impacts on crop yields across temperature rise thresholds and climate zones. Sci. Rep. 2025, 15, 23424. [Google Scholar] [CrossRef] [Scilit] [PubMed]
- Zhou, R.; Jiang, F.; Liu, Y.; Yu, X.; Song, X.; Wu, Z.; Cammarano, D. Environmental changes impact on vegetables physiology and nutrition–Gaps between vegetable and cereal crops. Sci. Total Environ. 2024, 933, 173180. [Google Scholar] [CrossRef] [Scilit] [PubMed]
- Takubessi, M.I.; Jalil, B.; Heinrich, M. The impact of climate change on medicinal plants and natural products: A scoping review. Front. Pharmacol. 2025, 16, 1697581. [Google Scholar] [CrossRef] [Scilit] [PubMed]
- Mykhailenko, O.; Jalil, B.; McGaw, L.J.; Echeverría, J.; Takubessi, M.; Heinrich, M. Climate change and the sustainable use of medicinal plants: A call for “new” research strategies. Front. Pharmacol. 2025, 15, 1496792. [Google Scholar] [CrossRef] [Scilit] [PubMed]
- An, Z.-G.; Guo, F.-X.; Chen, Y.; Bai, G.; Guo, A.-F. Astragalus-cultivated soil was a suitable bed soil for nurturing Angelica sinensis seedlings from the rhizosphere microbiome perspective. Sci. Rep. 2023, 13, 3388. [Google Scholar] [CrossRef] [Scilit] [PubMed]
- Han, X.; Li, M.; Yuan, Q.; Lee, S.; Li, C.; Ren, Y.; Garth, M.; Wang, L. Advances in molecular biological research of Angelica sinensis. Med. Plant Biol. 2023, 2, 16. [Google Scholar] [CrossRef] [Scilit]
- Yang, B.; Zhu, T.; Jin, L.; Zhang, S.; Liu, T.; Zhang, J.; Xu, L.; Kang, S. Research progress on comprehensive utilization and industrialization of Angelica sinensis. China J. Chin. Mater. Medica 2024, 55, 8235–8244. [Google Scholar]
- Li, Z.; Li, D.; Peng, H.; Xu, R.; Zhu, Z. Altitudinal Shifts as a Climate Resilience Strategy for Angelica sinensis Production in Its Primary Cultivation Region. Remote Sens. 2025, 17, 2085. [Google Scholar] [CrossRef] [Scilit]
- Liu, X.; Luo, M.; Li, M.; Wei, J. Depicting Precise Temperature and Duration of Vernalization and Inhibiting Early Bolting and Flowering of Angelica sinensis by Freezing Storage. Front. Plant Sci. 2022, 13, 853444. [Google Scholar] [CrossRef] [Scilit] [PubMed]
- Li, M.; Cui, X.; Jin, L.; Li, M.; Wei, J. Bolting reduces ferulic acid and flavonoid biosynthesis and induces root lignification in Angelica sinensis. Plant Physiol. Biochem. 2022, 170, 171–179. [Google Scholar] [CrossRef] [Scilit] [PubMed]
- Liu, Q.; Ahmed, W.; Li, G.; He, Y.; Mohany, M.; Li, Z.; Shen, T. A Novel Plant-Derived Biopesticide Mitigates Fusarium Root Rot of Angelica sinensis by Modulating the Rhizosphere Microbiome and Root Metabolome. Plants 2024, 13, 2180. [Google Scholar] [CrossRef] [Scilit] [PubMed]
- Xi, S.; Guo, X.; Ma, X.; Jin, L. Impacts of climate change on the suitable habitat of Angelica sinensis and analysis of its drivers in China. Sci. Rep. 2025, 15, 3508. [Google Scholar] [CrossRef] [Scilit] [PubMed]
- Li, M.-F. Selection of high altitude planting area of Angelica sinensis based on biomass, bioactive compounds accumulation and antioxidant capacity. Zhongcaoyao 2020, 474–481. [Google Scholar] [CrossRef]
- Zhang, D.; Zhang, Q.; Guo, J.; Sun, C.; Wu, J.; Nie, X.; Xie, C. Research on the global ecological suitability and characteristics of regions with Angelica sinensis based on the MaxEnt model. Acta Ecol. Sin. 2017, 37, 5111–5120. [Google Scholar]
- Xie, J.; Zhang, D.; Jin, N.; Cheng, T.; Zhao, G.; Han, D.; Niu, Z.; Li, W. Coupling crop growth models and machine learning for scalable winter wheat yield estimation across major wheat regions in China. Agric. For. Meteorol. 2025, 372, 110687. [Google Scholar] [CrossRef] [Scilit]
- Yan, H.; Duan, J.-A.; Wang, R.-Q.; Guo, Z.-X.; Qian, D.-W.; Song, B.-S.; He, Z.-Q.; Gao, H.-Y. Study on prediction model of Angelicae sinensis yield per unit in Min County. J. Chin. Med. Mater. 2012, 35, 511–514. [Google Scholar]
- Luo, L.; Sun, S.; Xue, J.; Gao, Z.; Zhao, J.; Yin, Y.; Gao, F.; Luan, X. Crop yield estimation based on assimilation of crop models and remote sensing data: A systematic evaluation. Agric. Syst. 2023, 210, 103711. [Google Scholar] [CrossRef] [Scilit]
- Jones, J.W.; Hoogenboom, G.; Porter, C.H.; Boote, K.J.; Batchelor, W.D.; Hunt, L.A.; Wilkens, P.W.; Singh, U.; Gijsman, A.J.; Ritchie, J.T. The DSSAT cropping system model. Eur. J. Agron. 2003, 18, 235–265. [Google Scholar] [CrossRef] [Scilit]
- Holzworth, D.P.; Huth, N.I.; deVoil, P.G.; Zurcher, E.J.; Herrmann, N.I.; McLean, G.; Chenu, K.; van Oosterom, E.J.; Snow, V.; Murphy, C.; et al. APSIM—Evolution towards a new generation of agricultural systems simulation. Environ. Model. Softw. 2014, 62, 327–350. [Google Scholar] [CrossRef] [Scilit]
- Garofalo, P.; Riccardi, M.; Di Tommasi, P.; Tedeschi, A.; Rinaldi, M.; De Lorenzi, F. AquaCrop model to optimize water supply for a sustainable processing tomato cultivation in the Mediterranean area: A multi-objective approach. Agric. Syst. 2025, 223, 104198. [Google Scholar] [CrossRef] [Scilit]
- Chen, X.; Yang, S.; Wen, X. Simulation of sugar beet growth in saline-alkali land: Controlling the synergistic effect of aluminum sulfate irrigation on photosynthesis. Eur. J. Agron. 2026, 172, 127851. [Google Scholar] [CrossRef] [Scilit]
- ten Den, T.; van de Wiel, I.; De Wit, A.; van Evert, F.K.; van Ittersum, M.K.; Reidsma, P. Modelling potential potato yields: Accounting for experimental differences in modern cultivars. Eur. J. Agron. 2022, 137, 126510. [Google Scholar] [CrossRef] [Scilit]
- Cao, H.; Ruan, S.; Wu, S.; Li, W.; Zhu, Y.; Guo, Y.; Chen, Z.; Wu, W.; Yang, P. A study on parameter calibration of a general crop growth model considering non-foliar green organs. Comput. Electron. Agric. 2024, 226, 109362. [Google Scholar] [CrossRef] [Scilit]
- Ntakos, G.; Prikaziuk, E.; ten Den, T.; Reidsma, P.; Vilfan, N.; van der Wal, T.; van der Tol, C. Coupled WOFOST and SCOPE model for remote sensing-based crop growth simulations. Comput. Electron. Agric. 2024, 225, 109238. [Google Scholar] [CrossRef] [Scilit]
- de Wit, A.; Boogaard, H.; Fumagalli, D.; Janssen, S.; Knapen, R.; van Kraalingen, D.; Supit, I.; van der Wijngaart, R.; van Diepen, K. 25 years of the WOFOST cropping systems model. Agric. Syst. 2019, 168, 154–167. [Google Scholar] [CrossRef] [Scilit]
- Tang, R.; Supit, I.; Hutjes, R.; Zhang, F.; Wang, X.; Chen, X.; Zhang, F.; Chen, X. Modelling growth of chili pepper (Capsicum annuum L.) with the WOFOST model. Agric. Syst. 2023, 209, 103688. [Google Scholar] [CrossRef] [Scilit]
- Tang, R.; Supit, I.; Zhang, F.; Wang, X.; Zhang, F.; Chen, X.; Chen, X.; Hutjes, R. Rethinking the WOFOST model to simulate growth and development of Chinese cabbage (Brassica rapa L. ssp. Pekinensis). Agric. Syst. 2025, 230, 104468. [Google Scholar] [CrossRef] [Scilit]
- Xu, L.; Liu, H.; Jiang, L.; Zhang, F.; Li, X.; Feng, X.; Huang, J.; Bai, T. WOFOST-N: An improved WOFOST model with nitrogen module for simulation of Korla Fragrant pear tree growth and nitrogen dynamics. Comput. Electron. Agric. 2024, 220, 108860. [Google Scholar] [CrossRef] [Scilit]
- Yang, L.; Li, J.; Xiao, Y.; Zhou, G. Early Bolting, Yield, and Quality of Angelica sinensis (Oliv.) Diels Responses to Intercropping Patterns. Plants 2022, 11, 2950. [Google Scholar] [CrossRef] [Scilit] [PubMed]
- Li, S.; Chiu, T.Y.; Jin, X.; Cao, D.; Xu, M.; Zhu, M.; Zhou, Q.; Liu, C.; Zong, Y.; Wang, S.; et al. Integrating genomic and multiomic data for Angelica sinensis provides insights into the evolution and biosynthesis of pharmaceutically bioactive compounds. Commun. Biol. 2023, 6, 1198. [Google Scholar] [CrossRef] [Scilit] [PubMed]
- Prioul, J.L.; Chartier, P. Partitioning of Transfer and Carboxylation Components of Intracellular Resistance to Photosynthetic CO2 Fixation: A Critical Analysis of the Methods Used. Ann. Bot. 1977, 41, 789–800. [Google Scholar] [CrossRef] [Scilit]
- NASA POWER Project. Prediction Of Worldwide Energy Resources (POWER) API: Daily Service. Available online: https://power.larc.nasa.gov/ (accessed on 30 March 2026).
- Allen, R.G.; Pereira, L.S.; Raes, D.; Smith, M. Crop Evapotranspiration: Guidelines for Computing Crop Water Requirements; FAO Irrigation and Drainage Paper No. 56; Food and Agriculture Organization of the United Nations: Rome, Italy, 1998.
- de Wit, A.J.W.; Boogaard, H.L.; Supit, I.; van den Berg, M. System Description of the WOFOST 7.2, Cropping Systems Model; Wageningen Environmental Research: Wageningen, The Netherlands, 2020. [Google Scholar]
- de Wit, A.; Boogaard, H.; Berghuijs, H.; van Ittersum, M.K. The WOFOST (WOrld FOod STudies) cropping system model. In Current Crop Models: State-of-the-Art and Future Developments; Burleigh Dodds Science Publishing: Sawston, UK, 2025. [Google Scholar] [CrossRef] [Scilit]
- Dong, H.; Li, M.; Jin, L.; Xie, X.; Li, M.; Wei, J. Cool temperature enhances growth, ferulic acid and flavonoid biosynthesis while inhibiting polysaccharide biosynthesis in Angelica sinensis. Molecules 2022, 27, 320. [Google Scholar] [CrossRef] [Scilit] [PubMed]
- Ran, H.; Kang, S.; Hu, X.; Yao, N.; Li, S.; Wang, W.; Galdos, M.V.; Challinor, A.J. A framework to quantify uncertainty of crop model parameters and its application in arid Northwest China. Agric. For. Meteorol. 2022, 316, 108844. [Google Scholar] [CrossRef] [Scilit]
- Pianosi, F.; Beven, K.; Freer, J.; Hall, J.W.; Rougier, J.; Stephenson, D.B.; Wagener, T. Sensitivity analysis of environmental models: A systematic review with practical workflow. Environ. Model. Softw. 2016, 79, 214–232. [Google Scholar] [CrossRef] [Scilit]
- Herman, J.; Usher, W. SALib: An open-source Python library for Sensitivity Analysis. J. Open Source Softw. 2017, 2, 97. [Google Scholar] [CrossRef] [Scilit]
- Wang, J.; Li, X.; Lu, L.; Fang, F. Parameter sensitivity analysis of crop growth models based on the extended Fourier Amplitude Sensitivity Test method. Environ. Model. Softw. 2013, 48, 171–182. [Google Scholar] [CrossRef] [Scilit]
- Ceglar, A.; van der Wijngaart, R.; de Wit, A.; Lecerf, R.; Boogaard, H.; Seguini, L.; van den Berg, M.; Toreti, A.; Zampieri, M.; Fumagalli, D.; et al. Improving WOFOST model to simulate winter wheat phenology in Europe: Evaluation and effects on yield. Agric. Syst. 2019, 168, 168–180. [Google Scholar] [CrossRef] [Scilit]
- Bassu, S.; Fumagalli, D.; Toreti, A.; Ceglar, A.; Giunta, F.; Motzo, R.; Zajac, Z.; Niemeyer, S. Modelling potential maize yield with climate and crop conditions around flowering. Field Crops Res. 2021, 271, 108226. [Google Scholar] [CrossRef] [Scilit]
- Saldaña-Villota, T.M.; Cotes-Torres, J.M. Comparison of statistical indices for the evaluation of crop models performance. Rev. Fac. Nac. Agron. Medellín 2021, 74, 9675–9684. [Google Scholar] [CrossRef] [Scilit]
- Großmann, F.; Kage, H.; Hackenberg, D.; Rose, T. What drives yield formation in sugar beet? Quantifying functional components across genotypes and irrigation managements. Field Crops Res. 2026, 338, 110292. [Google Scholar] [CrossRef] [Scilit]
- de Wit, A. Technical Description of Crop Model (WOFOST) Calibration Implemented in BioMA-CropML; Wageningen Environmental Research: Wageningen, The Netherlands, 2017. [Google Scholar]
- Guo, X.L.; Guo, J.; You, J.M. Study on Dry Matter Accumulation and Nutrient Uptake of Shiyao Angelica sinensis. Zhong Yao Cai 2015, 38, 1343–1348. [Google Scholar] [PubMed]
- Ma, F.; Jiang, Y.; Li, B.; Zeng, Y.; Shang, H.; Wang, F.; Sun, Z. The Dynamic Accumulation Rules of Chemical Components during the Medicine Formation Period of Angelica sinensis and Chemometric Classifying Analysis for Different Bolting Times Using ATR-FTIR. Molecules 2023, 28, 7292. [Google Scholar] [CrossRef] [Scilit] [PubMed]
- Li, X.; Tan, J.; Li, H.; Wang, L.; Niu, G.; Wang, X. Sensitivity Analysis of the WOFOST Crop Model Parameters Using the EFAST Method and Verification of Its Adaptability in the Yellow River Irrigation Area, Northwest China. Agronomy 2023, 13, 2294. [Google Scholar] [CrossRef] [Scilit]
- Harmel, R.D.; Smith, P.K.; Migliaccio, K.W.; Chaubey, I.; Douglas-Mankin, K.R.; Benham, B.; Shukla, S.; Muñoz-Carpena, R.; Robson, B.J. Evaluating, interpreting, and communicating performance of hydrologic/water quality models considering intended use: A review and recommendations. Environ. Model. Softw. 2014, 57, 40–51. [Google Scholar] [CrossRef] [Scilit]
- Djaby, B.; Wit, A.D.; Kouadio, L.; Jarroudi, M.E.; Tychon, B. Spatial Distribution of Calibrated WOFOST Parameters and Their Influence on the Performances of a Regional Yield orecasting System. Sustain. Agric. Res. 2013, 2, 12–29. [Google Scholar] [CrossRef] [Scilit]
- Wallach, D.; Palosuo, T.; Thorburn, P.; Hochman, Z.; Gourdain, E.; Andrianasolo, F.; Asseng, S.; Basso, B.; Buis, S.; Crout, N.; et al. The chaos in calibrating crop models: Lessons learned from a multi-model calibration exercise. Environ. Model. Softw. 2021, 145, 105206. [Google Scholar] [CrossRef] [Scilit]
- Balkovič, J.; van der Velde, M.; Schmid, E.; Skalský, R.; Khabarov, N.; Obersteiner, M.; Stürmer, B.; Xiong, W. Pan-European crop modelling with EPIC: Implementation, up-scaling and regional crop yield validation. Agric. Syst. 2013, 120, 61–75. [Google Scholar] [CrossRef] [Scilit]
- Rosenzweig, C.; Jones, J.W.; Hatfield, J.L.; Ruane, A.C.; Boote, K.J.; Thorburn, P.; Antle, J.M.; Nelson, G.C.; Porter, C.; Janssen, S.; et al. The Agricultural Model Intercomparison and Improvement Project (AgMIP): Protocols and pilot studies. Agric. For. Meteorol. 2013, 170, 166–182. [Google Scholar] [CrossRef] [Scilit]
- Pasquel, D.; Roux, S.; Richetti, J.; Cammarano, D.; Tisseyre, B.; Taylor, J.A. A review of methods to evaluate crop model performance at multiple and changing spatial scales. Precis. Agric. 2022, 23, 1489–1513. [Google Scholar] [CrossRef] [Scilit]
- Coudron, W.; De Frenne, P.; Verheyen, K.; Gobin, A.; Boeckaert, C.; De Cuypere, T.; Lootens, P.; Pollet, S.; De Swaef, T. Usefulness of cultivar-level calibration of AquaCrop for vegetables depends on the crop and data availability. Front. Plant Sci. 2023, 14, 1094677. [Google Scholar] [CrossRef] [Scilit] [PubMed]
- Li, M.; Li, J.; Wei, J.; Paré, P.W. Transcriptional Controls for Early Bolting and Flowering in Angelica sinensis. Plants 2021, 10, 1931. [Google Scholar] [CrossRef] [Scilit] [PubMed]

Disclaimer/Publisher’s Note: The statements, opinions and data contained in all publications are solely those of the individual author(s) and contributor(s) and not of MDPI and/or the editor(s). MDPI and/or the editor(s) disclaim responsibility for any injury to people or property resulting from any ideas, methods, instructions or products referred to in the content. |
© 2026 by the authors. Licensee MDPI, Basel, Switzerland. This article is an open access article distributed under the terms and conditions of the Creative Commons Attribution (CC BY) license.