


Abstract
The year-round rising demand for fresh, high-quality vegetables has driven rapid growth in South Korea’s protected horticulture since the 1990s, resulting in widespread greenhouse installations across South Korea. However, maintaining optimal indoor environmental conditions in greenhouses remains challenging owing to extreme seasonal variations. During summer, indoor temperatures may exceed 35 °C despite active cooling systems; meanwhile, large temperature gradients between the indoor and outdoor environments require effective heating strategies in the winter. A key technology for stabilizing crop productivity and mitigating spatial environmental imbalances is the use of air circulation fans, which promote uniform distribution of temperature, humidity, and CO2. This study investigates the airflow dispersion characteristics of agricultural circulation fans using computational fluid dynamics (CFD) simulations to support improved airflow distribution within greenhouses. The target facility was a multi-span Venlo-type greenhouse. Six circulation fans were installed 5.8 m above the ground, and their airflow patterns were analyzed under different layout scenarios, including uniform spacing and zigzag arrangements. The results showed that a single fan generated an effective airflow area of up to 193.14 m2 and a dispersion distance of 60.34 m. When all fans were aligned in the same direction, airflow distribution was less efficient compared with configurations where central fans were reversed or installed in a zigzag pattern. Specifically, staggered arrangements improved the overall airflow distribution, with the volume-averaged air velocity increasing from 0.290 to 0.369 m/s. The study concludes that fan installation spacing and arrangement significantly influence airflow distribution and uniformity in greenhouses.
1. Introduction
The year-round rising demand for fresh, high-quality vegetables has driven continuous growth in the protected horticulture of South Korea since the 1990s. The production value of protected agriculture increased from 641 billion KRW (Korean won) in 1990 to approximately 5.3 trillion KRW by 2019. During the same period, the total greenhouse installation area in South Korea expanded from 23,698 hectares in 1990 to 52,094 hectares in 2019 [1].
In South Korea, indoor temperatures often exceed 35–40 °C in the summer even when all cooling systems in greenhouses are fully operated, thus making crops highly susceptible to heat damage. Lee et al. [2] reported that elevated temperatures increase the risk of growth disorders and raise respiration rates, thereby reducing photosynthetic efficiency. Therefore, excessively high greenhouse temperatures negatively affect crop productivity and the working environment, thus necessitating the adoption of cooling strategies [3]. Several cooling techniques are available, including shading, ventilation, evaporative cooling, localized cooling, heat pumps, and roof sprinkling, as described by Lee and Kim [4].
During winter, the large temperature difference between indoor and outdoor environments requires mechanical systems, such as kerosene boilers, heat pumps, and multi-layer thermal curtains, for heating and insulation. Heated greenhouses account for approximately 32% of the total greenhouse area in South Korea, with warm-air heating systems comprising 88% of these facilities. Yu et al. [5] reported that during winter warm-air heating, a temperature gradient of approximately 4–7 °C between the floor area near the heater and the duct end causes uneven temperature distribution.
Hong and Lee [6] reported that stable year-round production in greenhouses requires the rapid and precise control of the internal environment. Lee and Moon [7] emphasized that maintaining an appropriate thermal environment improves both productivity and quality. They further highlighted the need for insulation, ventilation, and the active use of heating and cooling systems. However, in climates with four distinct seasons, such as South Korea, greenhouses experience diverse environmental challenges throughout the year. When covering materials are damaged and air leakage occurs, heat loss reduces insulation efficiency, increases heating costs, and creates spatial nonuniformity in temperature, humidity, and wind speed, all of which directly influence crop growth.
Proper air circulation can create a uniform distribution of CO2 concentration, temperature, and microclimatic conditions, thereby promoting transpiration and photosynthesis while accelerating crop growth [5,8]. Andersson [9] reported such air circulation enhances airflow around crop leaves, reducing the boundary layer resistance and effectively enhancing the exchange of substances (such as water and CO2) between the leaves and surrounding air. This process plays a critical role in enhancing the overall health and productivity of greenhouse crops. For example, Bakker [10] demonstrated in tomato growth experiments that high humidity levels in greenhouses accelerate calcium deficiency, which leads to reductions in leaf area, yield, average fruit weight, and quality. Similarly, De Koning [11] found that crops are particularly sensitive to temperature during flowering and fruit set.
Research on greenhouse environmental control technologies, which strongly influence crop quality and yield, has steadily increased [12]. Circulation fans are among the most effective means of improving air uniformity in terms of humidity, temperature, and CO2 concentration [13]. By promoting air movement, fans minimize spatial variation, reduce risks of mold and pest outbreaks, and support stable growing conditions. Lee et al. [14] noted that airflow is the primary mechanism governing the dispersion of key environmental factors such as temperature, humidity, and gases within facilities, making it a critical component of greenhouse environmental control. Computational fluid dynamics (CFD) has also yielded reliable results in analyzing heat flow, ventilation, and related processes inside greenhouses [6,15,16,17].
The proper selection and placement of circulation fans affect both crop growth and economic factors, including energy and installation costs [18]. Thus, thorough preliminary design reviews are essential. Nam et al. [19] investigated changes in crop leaf temperature as well as indoor and outdoor air temperatures in naturally ventilated greenhouses where a fog cooling system and circulation fans were used simultaneously. Although fog cooling alone generally cannot maintain indoor air temperatures below outdoor levels, their study showed that combining fog cooling with circulation fans improved evaporation efficiency through ventilation, enhanced cooling, and reduced the gap between leaf and air temperatures. Specifically, efficient airflow maximizes the performance of cooling systems and significantly improves plant growth conditions, thereby underscoring the importance of airflow in greenhouse design. Yu et al. [5] conducted field experiments to analyze the effects of circulation fans on horizontal airflow and the resulting changes in the distribution of temperature, humidity, CO2 concentration, and wind speed. Before computer simulations became widely used in agricultural research, greenhouse airflow was mainly studied through field and laboratory experiments, along with mathematical models based on energy balance equations. However, these simple models, while grounded in basic mechanical theory, cannot accurately analyze the complex aerodynamic characteristics of real greenhouse environments. Moreover, the reliance on numerous experimental devices is time-consuming, costly, and prone to errors when results are applied under field conditions.
Advancements in computer simulation techniques have provided opportunities to overcome these limitations. Precise modeling of complex environmental variables enables the analysis of aerodynamic characteristics (such as airflow, temperature, and humidity) at real scales with greater accuracy [20]. Consequently, these methods have been widely applied in agricultural research over the past 30 years to improve greenhouse management and environmental control. Chang et al. [21] conducted a thermal flow analysis using CFD to evaluate the effects of centrally installed cooling fans, wall-mounted cooling fans, shading screens, and vinyl barriers in a glass greenhouse. Their study confirmed that the factors influencing internal temperature were, in order of magnitude, cooling fans, shading screens, and vinyl barriers. Similarly, Yoon et al. [22] numerically analyzed the thermal flow characteristics inside a single-span greenhouse according to solar radiation and the physical properties of vinyl. Their simulations revealed that heat accumulated in the central part of the greenhouse without the presence of circulation fans. By contrast, when fans were installed in cross-sections, heat was discharged outside, which resulted in a more uniform temperature distribution in the lower part of the greenhouse. Yu et al. [17] designed and developed a CFD simulation model capable of analyzing the distribution of environmental factors affecting crop growth according to the installation position and capacity of circulation fans and validated their model through experiments. Lim et al. [23] evaluated the cooling performance of a low-pressure fogging system combined with air circulation fans and presented it as a cost-effective alternative to high-pressure fogging systems in greenhouses where crops are actively cultivated.
In summary, analyzing the airflow of circulation fans within greenhouses is essential for optimizing environmental conditions and promoting crop growth. Such analyses also facilitate the design of efficient heat and air circulation, thereby reducing heating and cooling costs. However, while numerical studies have examined ventilation characteristics in naturally ventilated greenhouses and the effects of combined cooling technologies, detailed investigations of installation conditions for mechanical environmental control devices, such as agricultural circulation fans, remain insufficient.
Therefore, this study aimed to analyze the effects of installation direction and spacing of agricultural circulation fans on airflow dispersion characteristics using CFD simulations, thereby providing foundational data for the optimal design and operation of circulation fans in greenhouses.
2. Materials and Methods
2.1. Target Greenhouse and Agricultural Circulation Fans
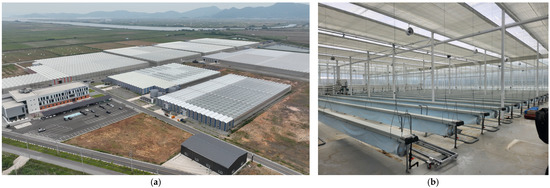
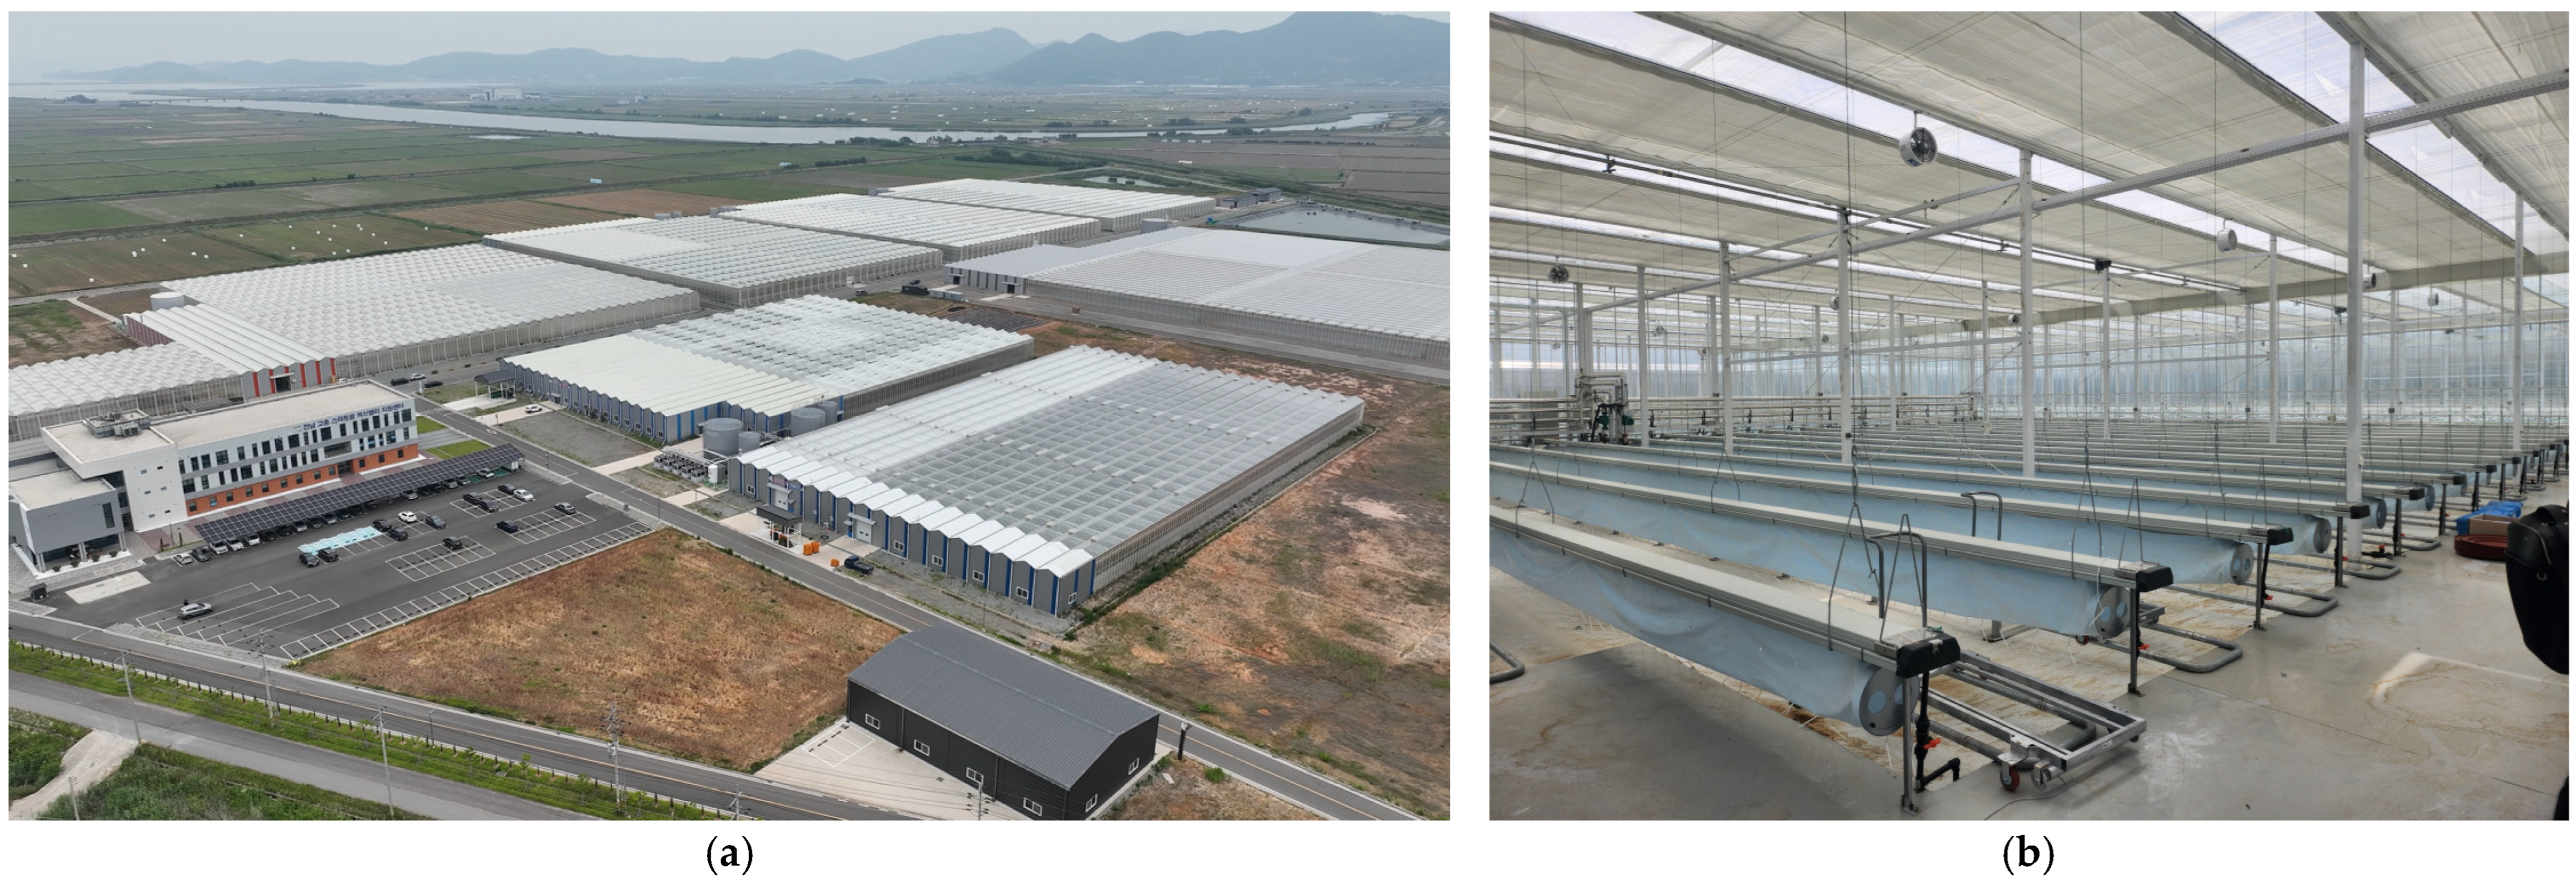
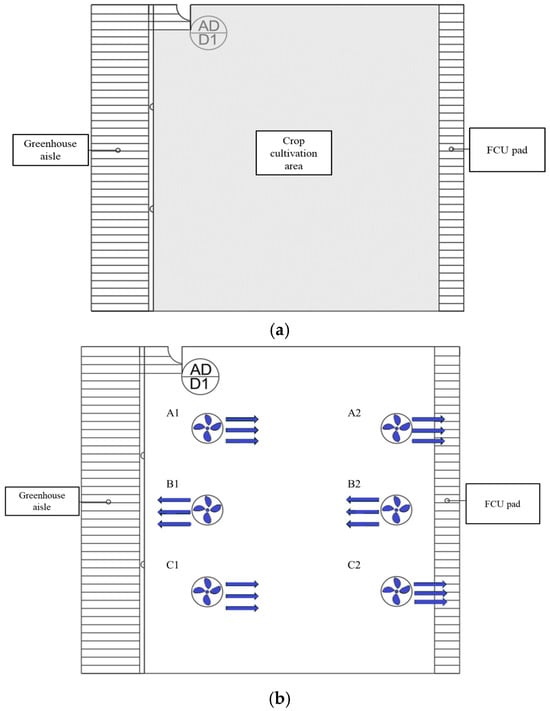
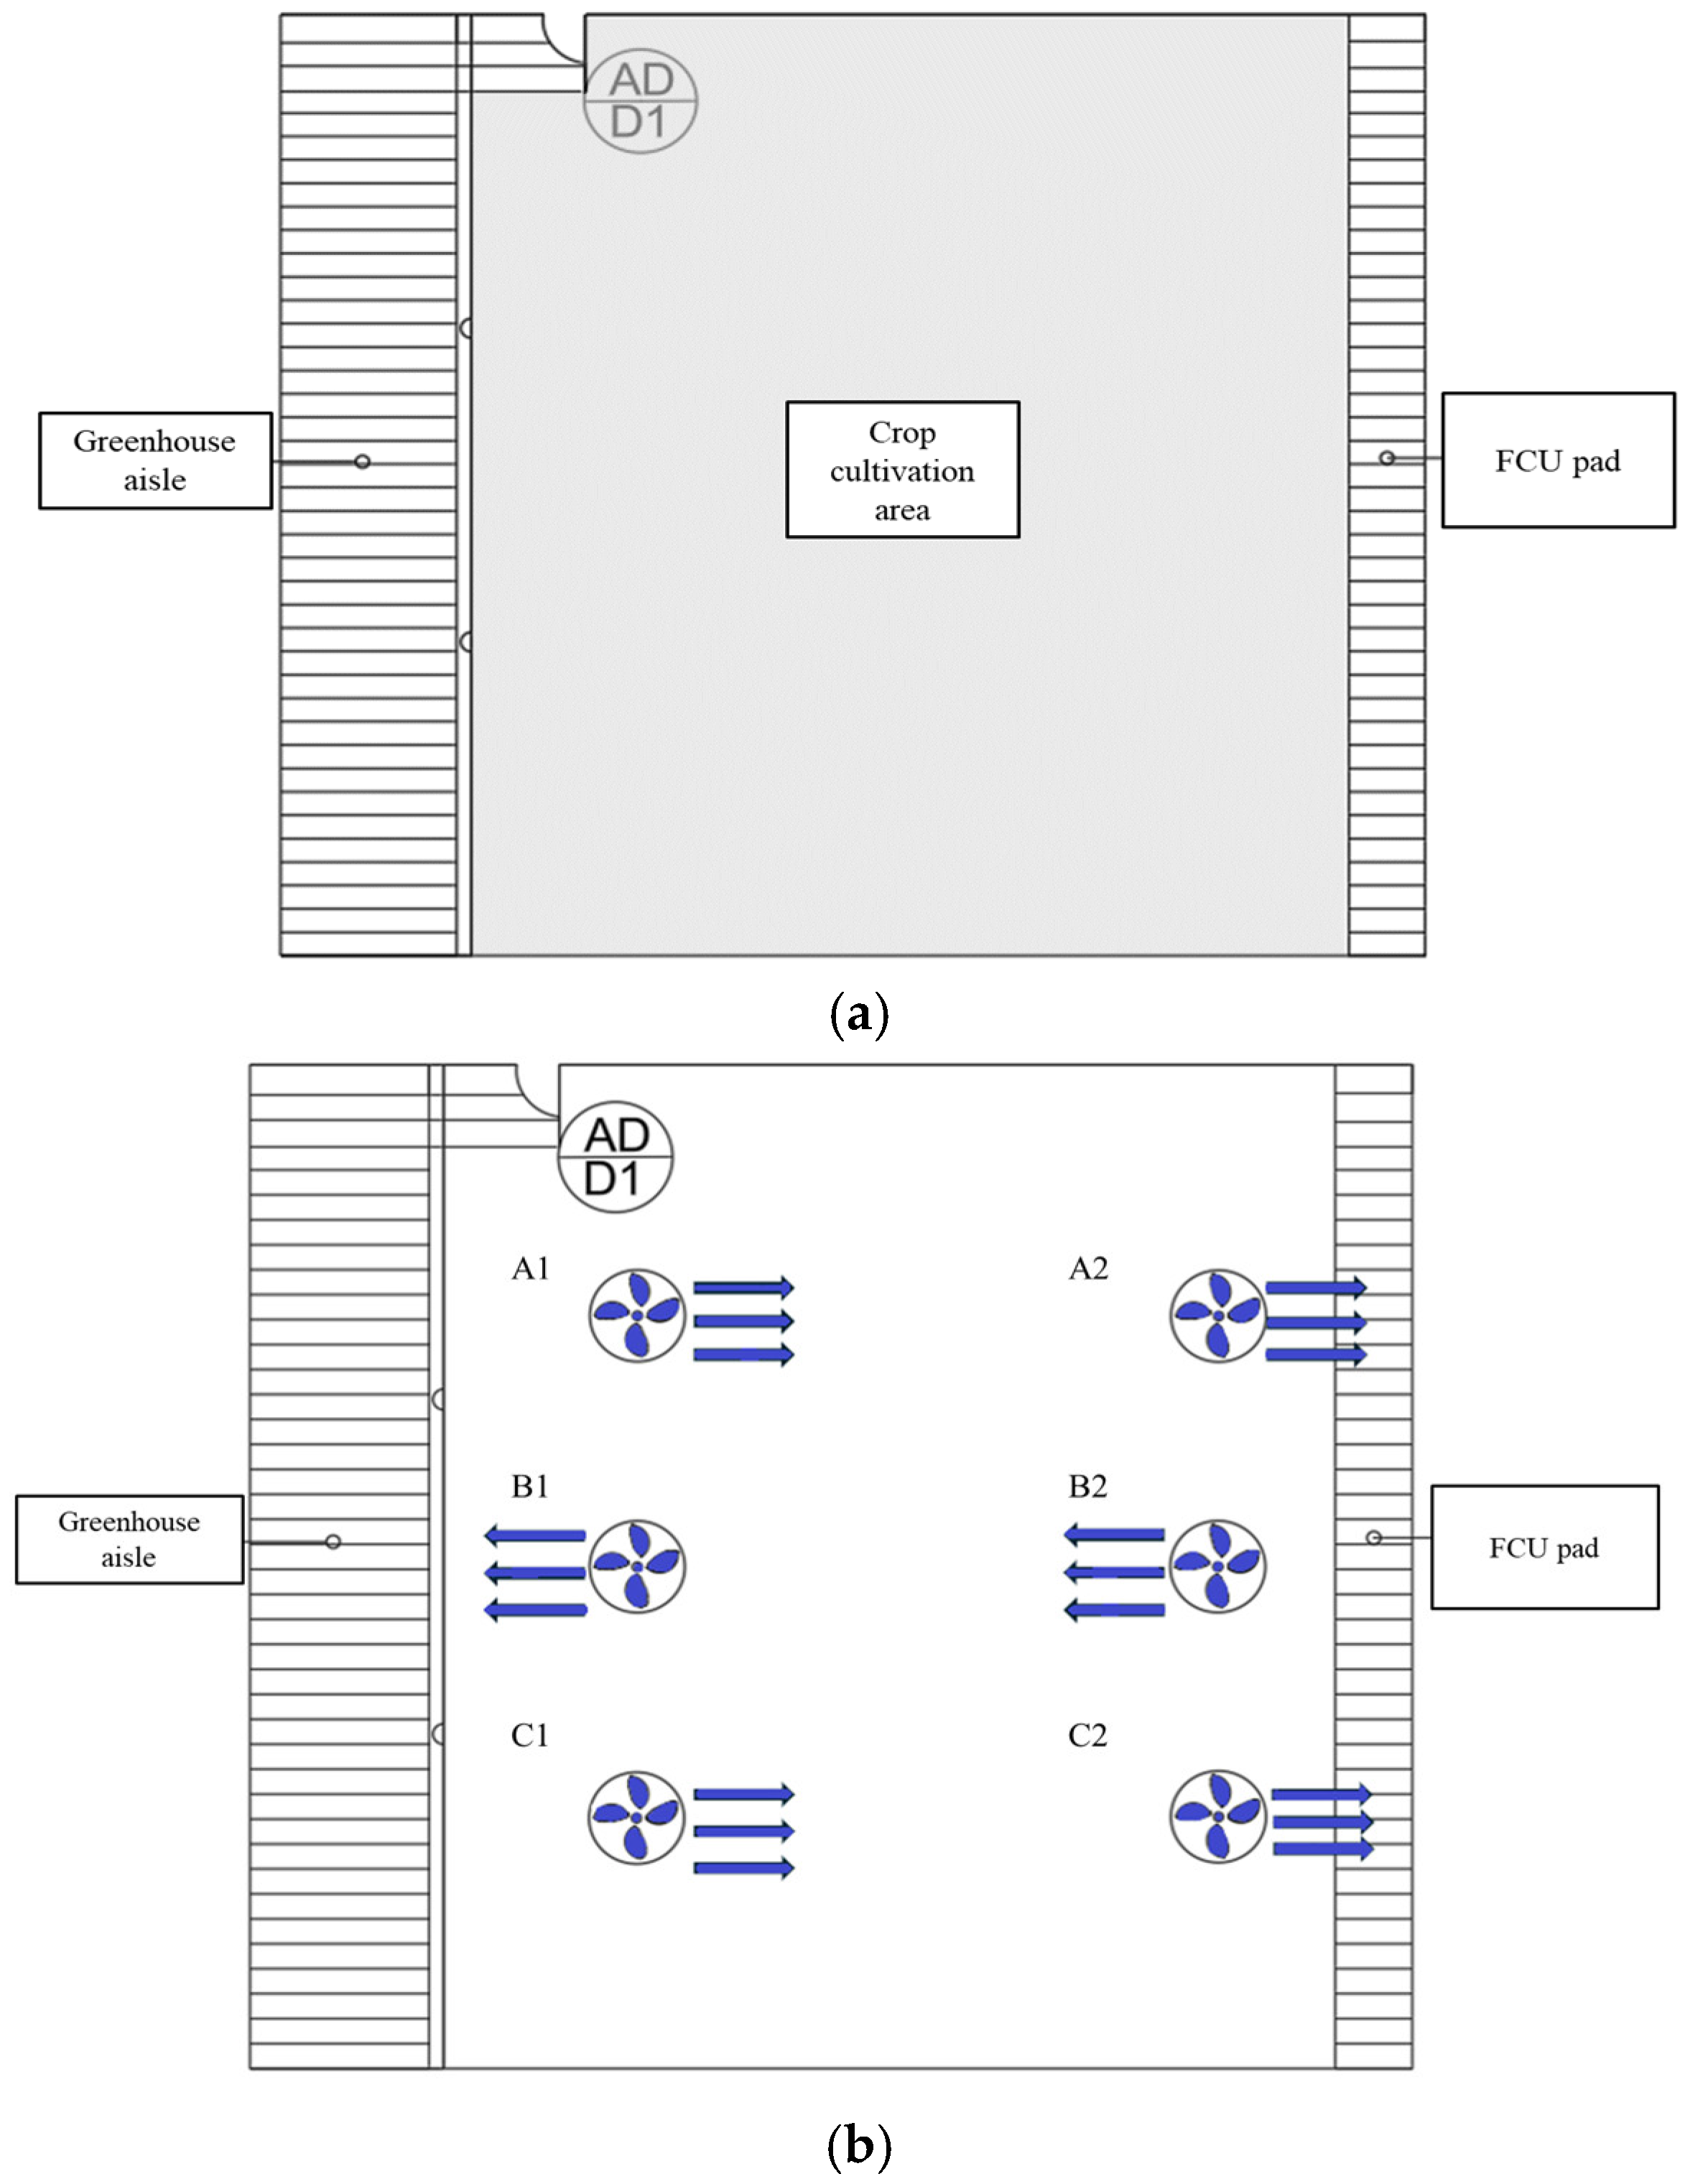
The experimental greenhouse was located in the Smart Farm Innovation Valley (Figure 1) in Goheung-gun, Jeollanam-do in South Korea (34.592460, 127.187577). The greenhouse was a Venlo-type structure with a ridge height of 7.3 m, sidewall height of 6.3 m, width of 24.0 m, and length of 27.0 m (Figure 1 and Figure 2a). Although the measured greenhouse length was 27.0 m, the actual length was insufficient to fully evaluate the downstream airflow dispersion distance of a single circulation fan. Therefore, an idealized 100 m-long computational domain was constructed by extending only the longitudinal direction while maintaining the same greenhouse cross-sectional geometry, fan installation height, fan specifications, and boundary-condition settings. In the extended domain, the longitudinal end surfaces were treated as wall boundaries, corresponding to the end walls of the greenhouse. The sidewall and roof surfaces were extended consistently with the original greenhouse geometry, and the roof vent openings were treated as pressure outlets. This extended domain was used to evaluate the maximum airflow dispersion range of a single fan and to establish baseline spacing conditions for the subsequent multi-fan arrangement analysis.
Figure 1.
(a) Panoramic view of the Smart Farm Innovation Valley in Goheung-gun, and (b) interior view of the experimental greenhouse.
Figure 2.
Schematic of the greenhouse interior: (a) target space, (b) discharge directions of circulation fans inside the greenhouse.
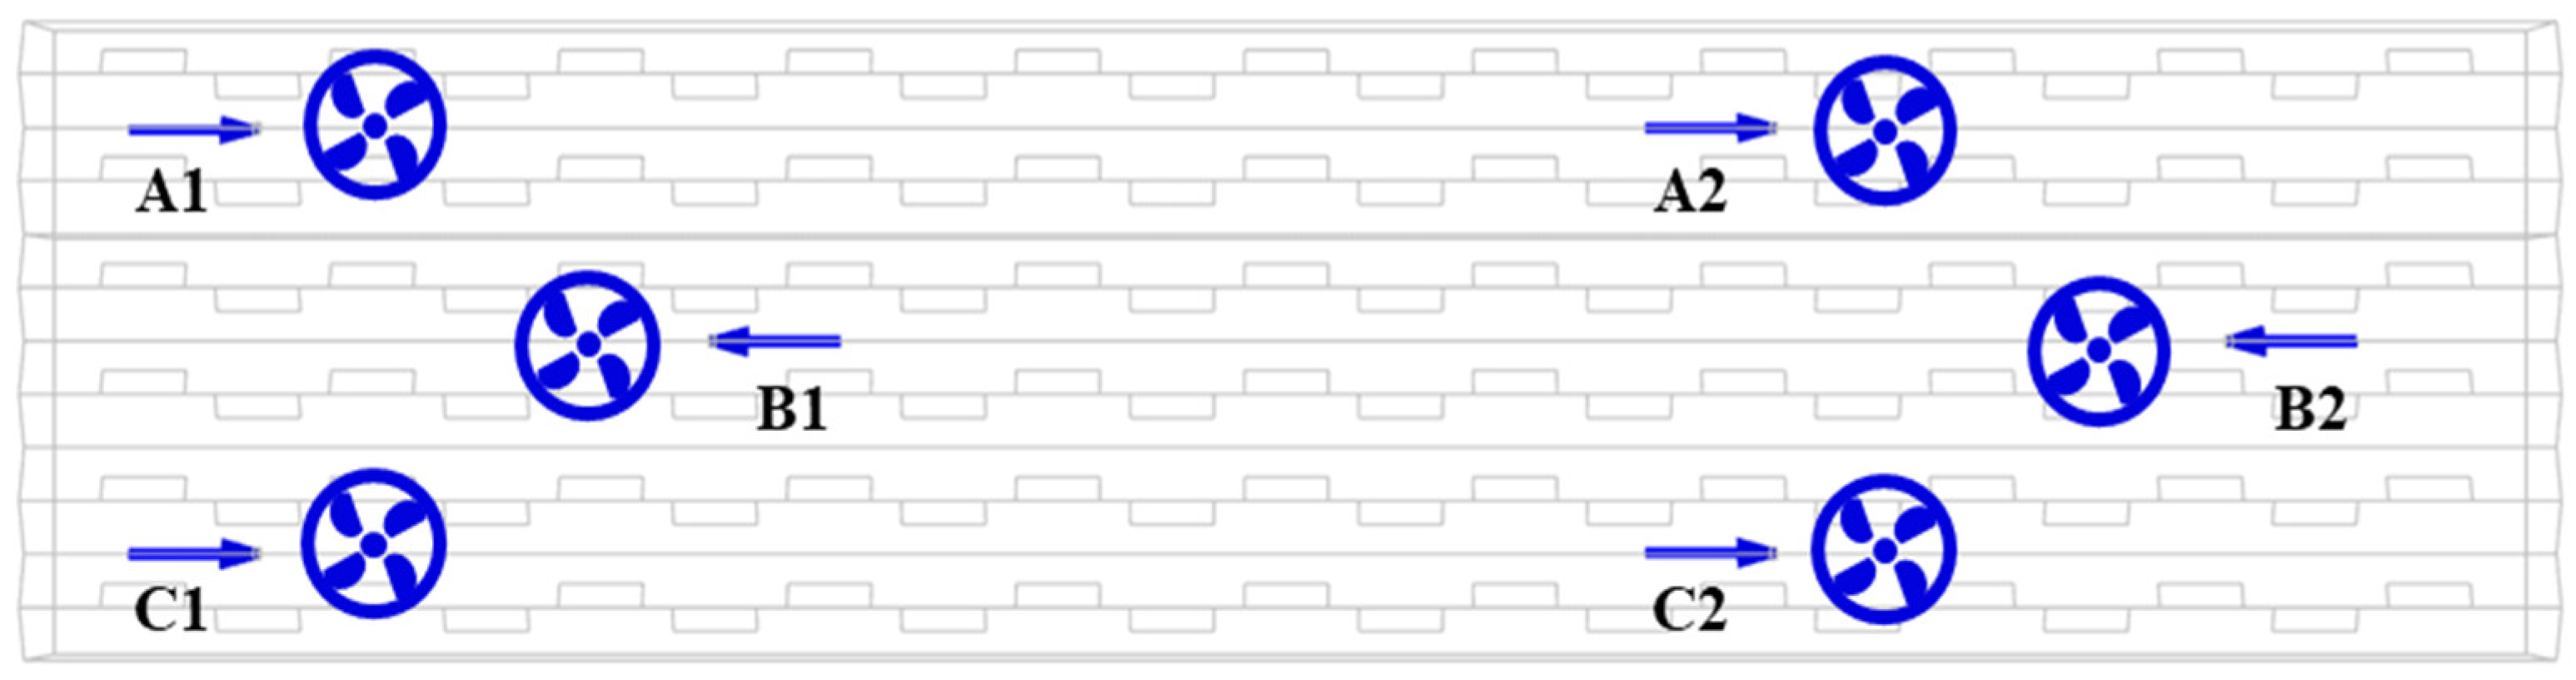
Six air circulation fans (diameter of 0.45 m) were installed at a height of 5.8 m above the ground to mix heat accumulated in the upper and lower sections and to distribute the air of the greenhouse uniformly. The discharge directions of the circulation fans were arranged as follows: Rows 1 (A row) and 3 (C row) discharged along the longitudinal direction, while Row 2 (B row) discharged in the reverse longitudinal direction, as shown in Figure 2b.
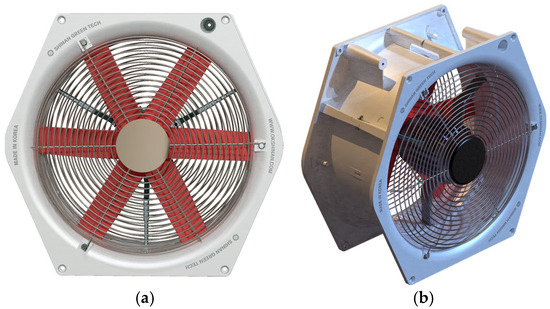
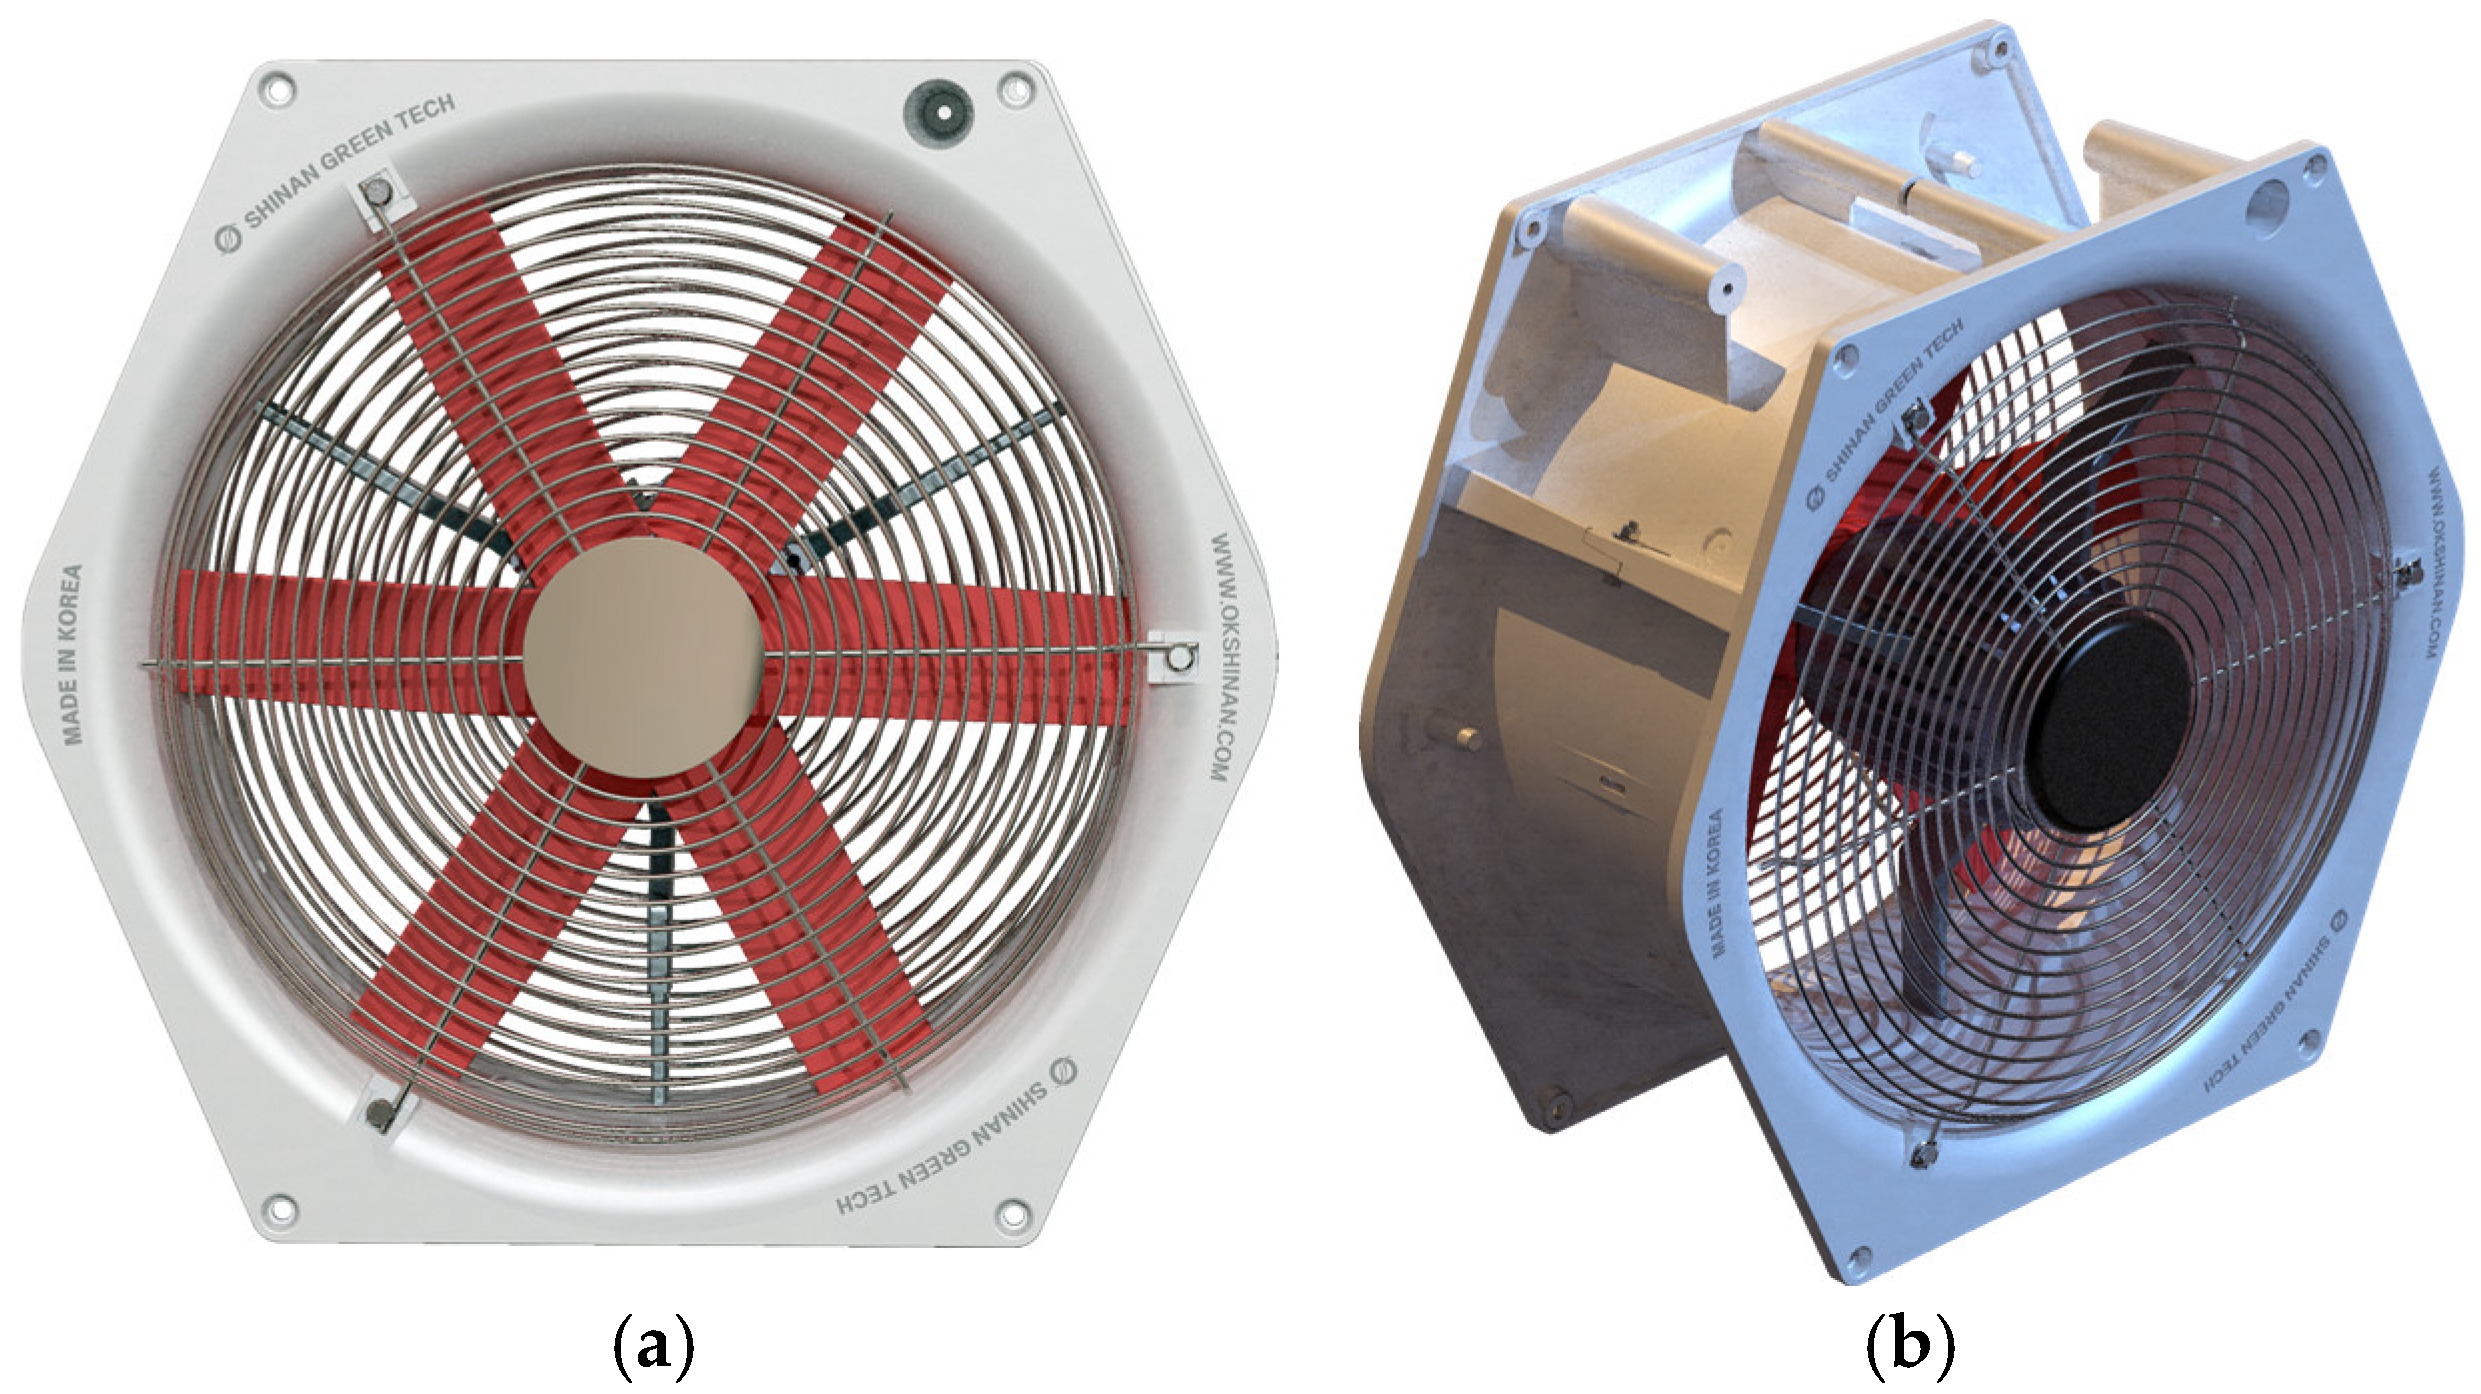
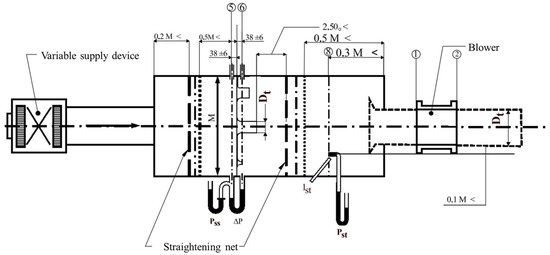
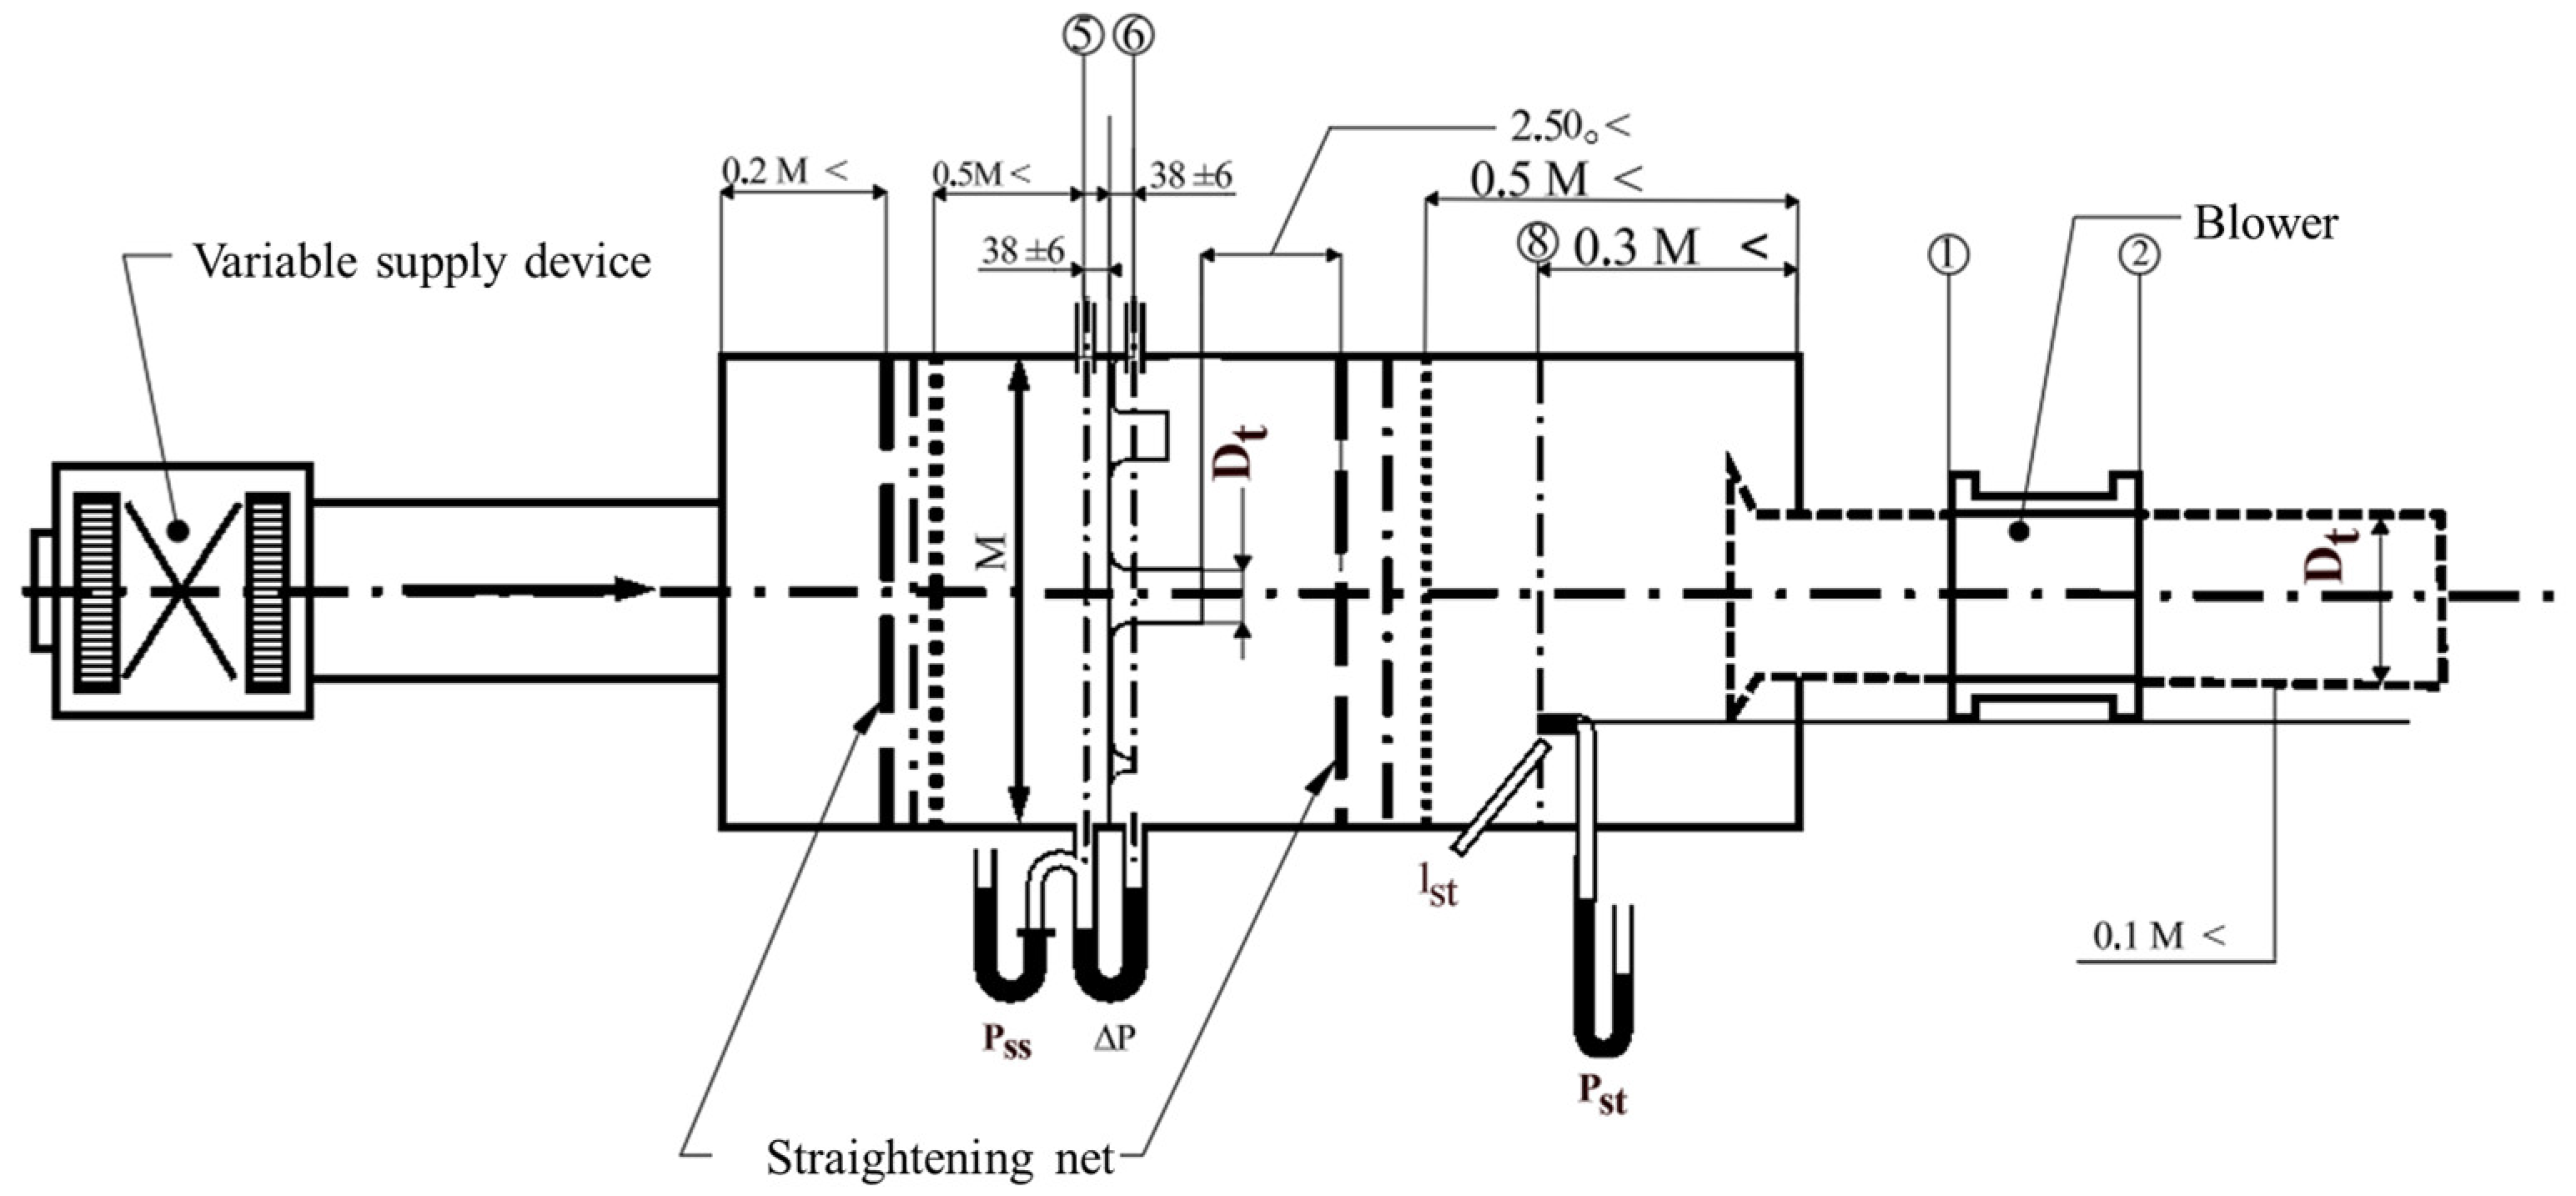
Commercial air circulation fans (SGJF-6000, Shinan Green Tech Co., Ltd., Suncheon, South Korea) designed specifically for agricultural applications were used in the experiment (Figure 3). The specifications were 583 (L) × 550 (H) × 250 (D) mm, with six blades of 450 mm diameter. The air circulation fan consumed 280 W of power, operated at 1400 rpm, and functioned within a frequency range of 5–60 Hz, at AC 220 V. The performance of the circulation fan was evaluated through airflow (volumetric flow rate) experiments, as shown in Figure 4 and Figure 5.
Figure 3.
Experimental agricultural circulation fan [SGJF-6000, Shinan Green Tech Co., Ltd., Suncheon, South Korea]: (a) front view and (b) side view.
Figure 4.
Schematic of the test environment for the performance experiment of greenhouse circulation fans.
Figure 5.
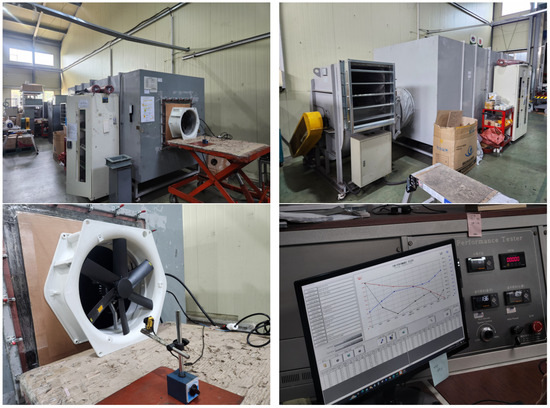
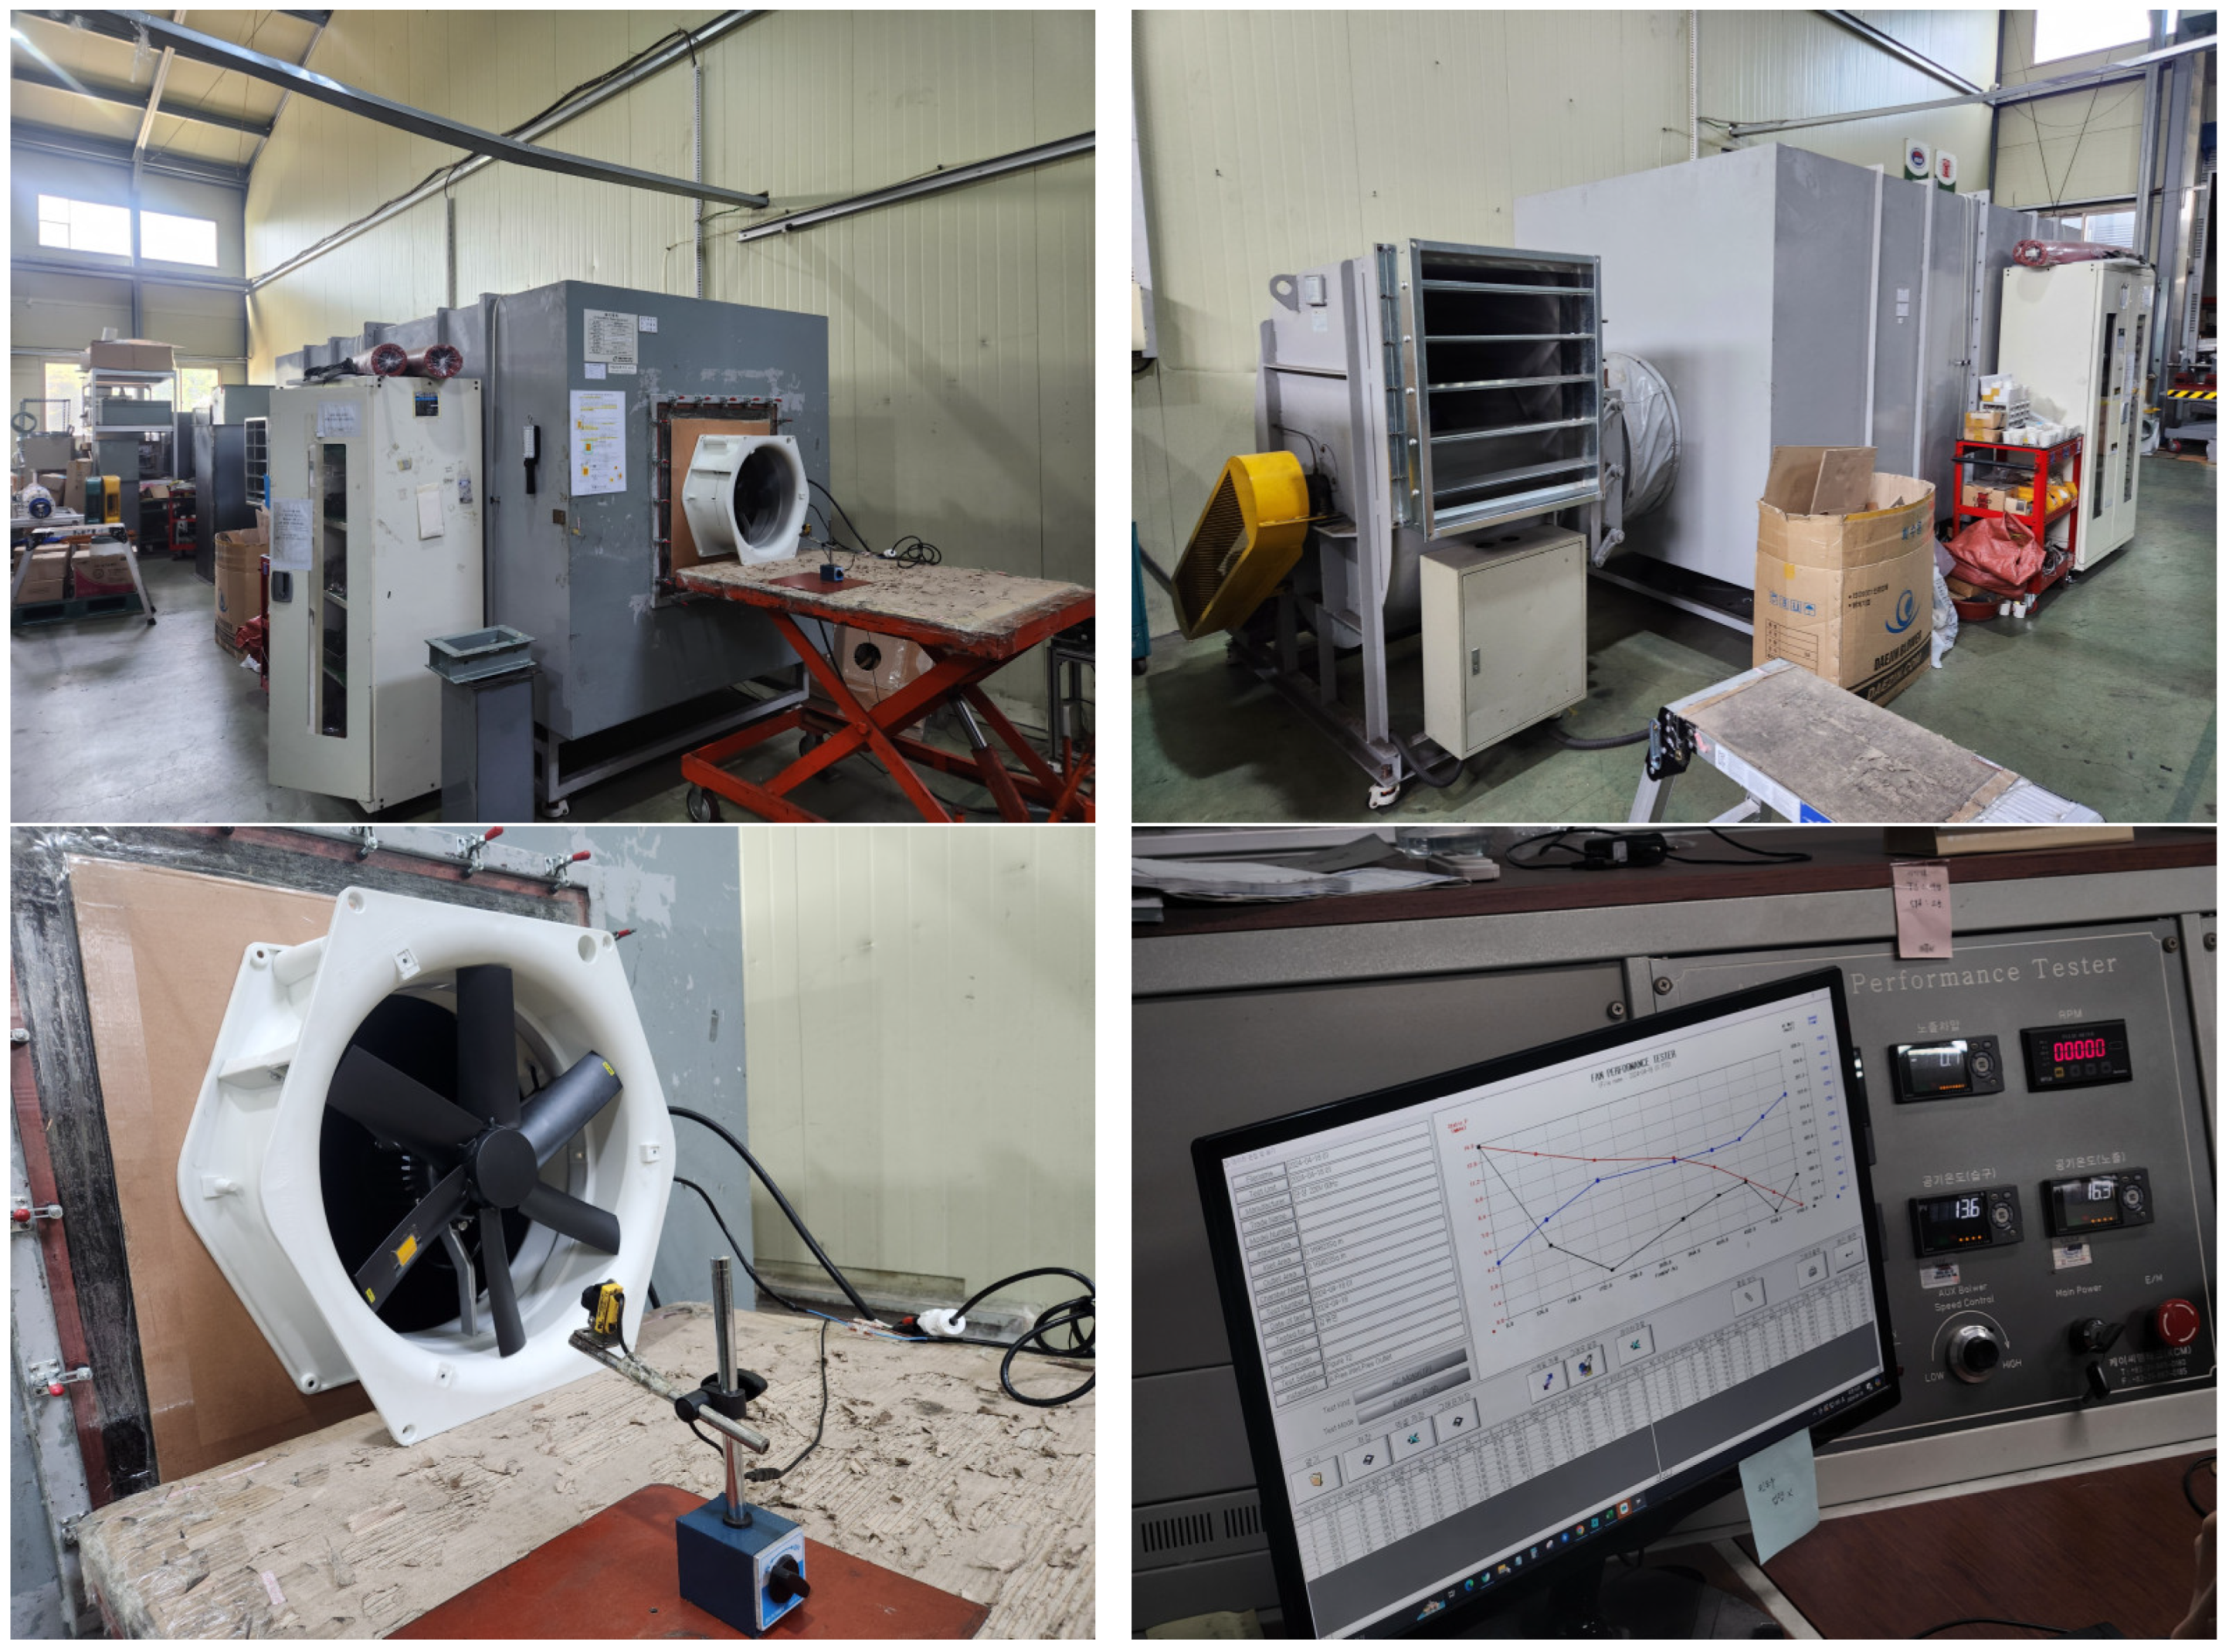
Greenhouse circulation fan performance testing laboratory (variable supply device, flow straightening grid, settling chamber).
2.2. Computational Fluid Dynamics (CFD)
CFD was used in this study to numerically analyze airflow dispersion generated by circulation fans inside the greenhouse. This approach enables spatial evaluation of air velocity fields that are difficult to obtain through point-based measurements alone [24,25,26,27]. Compared to field or laboratory-scale experiments (such as wind tunnel testing), CFD is more cost-efficient and enables flexible adjustments of variables. Recently, it has been adopted in the agricultural sector as both a qualitative and quantitative tool for analyzing greenhouse thermal environments and ventilation [27,28]. The present simulation focused on isothermal airflow fields, and thermal effects were not considered. Therefore, the governing equations used in the CFD analysis included the continuity and momentum conservation equations [29] and are expressed as Equations (1) and (2).
The continuity equation is expressed as
The momentum equation is expressed as
where denotes the fluid density (kg/m3), represents the fluid velocity (m/s), represents the static pressure (Pa), represents the mass source generated by chemical reactions (kg/m3), represents the stress tensor (Pa), represents the gravitational acceleration (m/s2).
2.3. Performance Test of Greenhouse Circulation Fans
The performance of the air circulation fan used in this study was evaluated on 18 April 2024, at a blower testing laboratory located in Bongdong-eup, Wanju-gun, Jeollabuk-do, which is certified by the Korea Laboratory Accreditation Scheme (KOLAS). As shown in Figure 5, the blower testing apparatus consisted of a variable supply device, flow straightening grid, and settling chamber. The airflow measurement device had a measurement range of 150–12,000 m3 h−1 with an accuracy of ±3.0%. The test was conducted in accordance with the KS B 6311 standard [30] (Test Methods for Fans), with the intake air set to standard conditions and the rotational speed maintained at the specified value. Environmental conditions, including dry-bulb temperature, relative humidity, and atmospheric pressure, were controlled to the values listed in Table 1. The test items for the fan included temperature, voltage, static pressure, airflow, rotational speed, and operating status. Measurements were taken using a differential pressure gauge (YOKOGAWA Inc., Tokyo, Japan), a pressure gauge (Sensys Inc., Ansan, Republic of Korea), a resistance thermometer (YOKOGAWA Inc., Tokyo, Japan), and an AC power meter (HIOKI Inc., Nagano, Japan).
Table 1.
Environmental conditions for the performance experiment of circulation fans for the greenhouse.
2.4. Design and Computation Scenarios of the CFD Model
The target object, which consisted of the greenhouse and circulation fans within the CFD simulation model, was designed using Workbench (Ver. 2024 R3, ANSYS Co., Canonsburg, PA, USA). First, the target object was geometrically designed, then constructed using points, lines, surfaces, and volumes, and lastly the mesh was generated. During the main processing stage, boundary conditions were defined within the CFD model, and the governing nonlinear partial differential equations of fluid (air) motion, namely the Navier–Stokes equations, were discretized into algebraic equations. Numerical algorithms were then applied to quantitatively compute and analyze the fluid flow. Fluent (Ver. 2024 R3, ANSYS Co., Canonsburg, PA, USA) was used as the main computation module, and the simulation results were used in the postprocessing stage for both qualitative and quantitative analysis.
A previous study [31] was carefully reviewed to determine the input conditions required for designing the CFD model of the greenhouse. The greenhouse geometry was developed based on field measurements and construction drawings. The crop canopy zone and external domain were excluded, as the analysis focused on the aerodynamic characteristics of the circulation fans as mechanical environmental control devices. This simplification was intended to isolate the airflow dispersion characteristics generated by the circulation fans themselves, without the additional aerodynamic resistance caused by crop canopy structure. Therefore, the results of this study should be interpreted as baseline airflow dispersion characteristics under controlled internal airflow conditions, rather than as direct design guidelines for greenhouses under crop-growing conditions.
After defining the greenhouse geometry, a mesh grid was generated to compute the fluid flow. A mesh consists of numerous small cells or elements, within which the fluid behavior is calculated. While a greater number of mesh elements allows for higher-resolution computations, it also increases the required time and computational resources. Therefore, the computational domain was designed with tetrahedral elements of appropriate size and shape. The final computational mesh consisted of 5,602,003 nodes and 31,542,792 elements. The generated mesh satisfied the recommended quality criteria, with a minimum orthogonal quality of 0.2, which was above the recommended threshold of 0.01, and a maximum skewness of 0.91, which was below the recommended limit of 0.95. Although a full mesh-independence analysis was not conducted in the present study, the final mesh resolution was considered sufficiently detailed for the comparative evaluation of airflow dispersion among fan-arrangement scenarios. In addition, the same mesh-generation strategy, boundary conditions, and solver settings were consistently applied to all simulation cases to ensure comparative consistency.
In Fluent, momentum conservation equations are computed in the u, v, and w directions. Velocity components are then iteratively solved until convergence is reached. As no single turbulence model is universally applicable, an appropriate model must be selected based on the physical characteristics of each model, nature of the problem, required level of accuracy, and computational time needed for the simulation.
Lee et al. [31] designed a CFD model to analyze greenhouse ventilation using a wind tunnel and particle image velocimetry (PIV) experiments. A comparison between the results of the CFD simulation and the wind tunnel experiment indicated that the Renormalization Group (RNG) k-ε model and the high-Reynolds-number models produced the most accurate results. Therefore, this study adopted the RNG k-ε turbulence model, an improved version of the standard k-ε model based on RNG theory, as expressed in Equations (3) and (4). The internal flow field was assumed to be incompressible and steady-state for the analysis. The boundary conditions used for the CFD simulation are listed in Table 2.
Table 2.
Definition of boundary conditions for CFD simulation analysis.
The transport equation of turbulent kinetic energy K is expressed as
where Pk is the production term and represents the amount of turbulent kinetic energy generated by the interactions between the velocity gradient tensor and turbulent stresses.
The transport equation of the dissipation rate ε is expressed as
where , , , and are model constants.
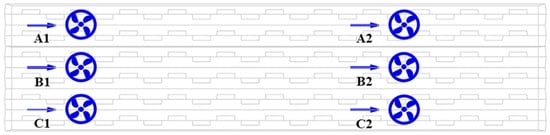
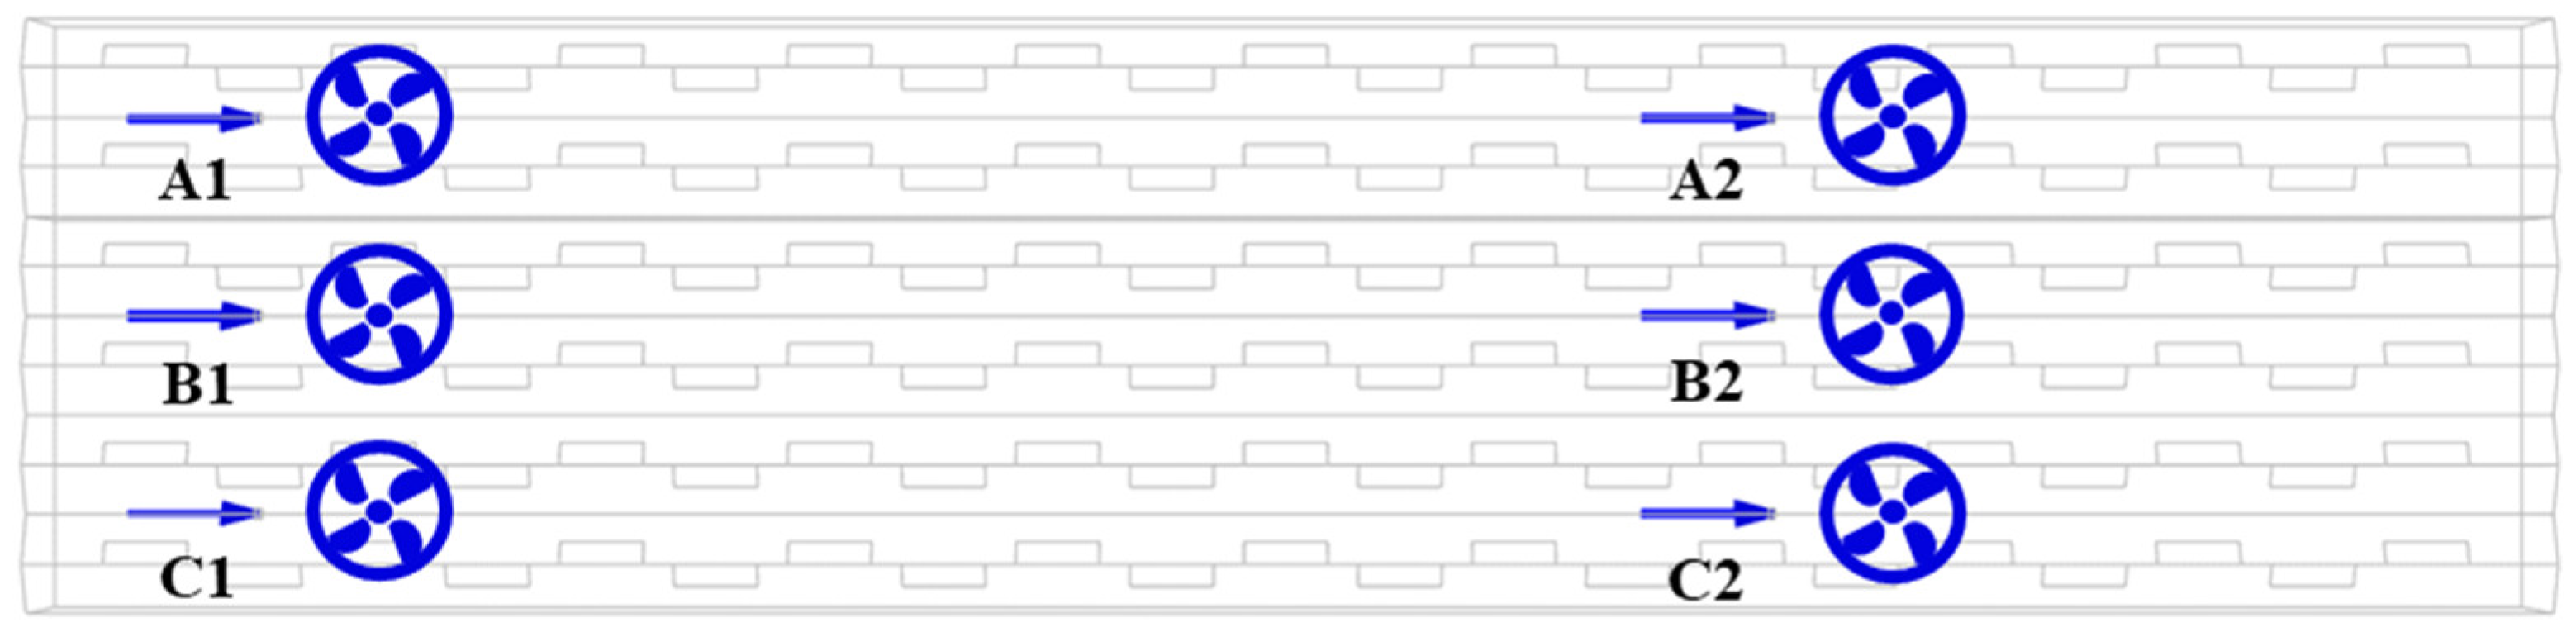
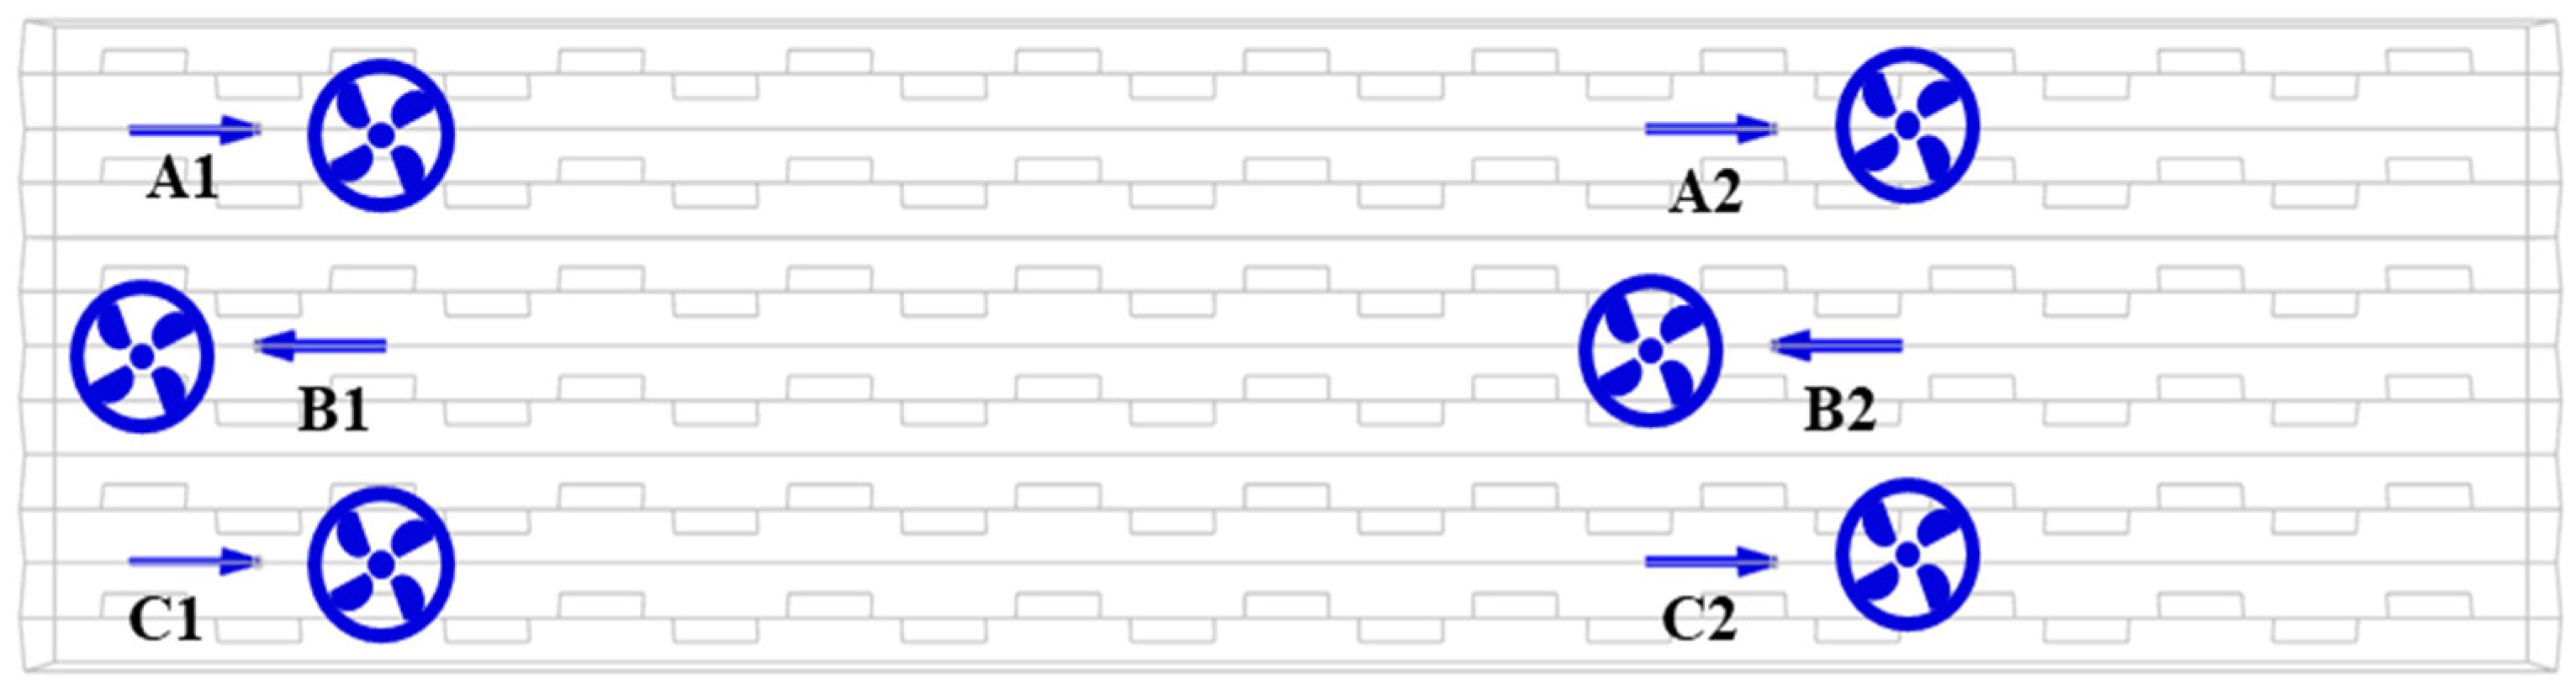
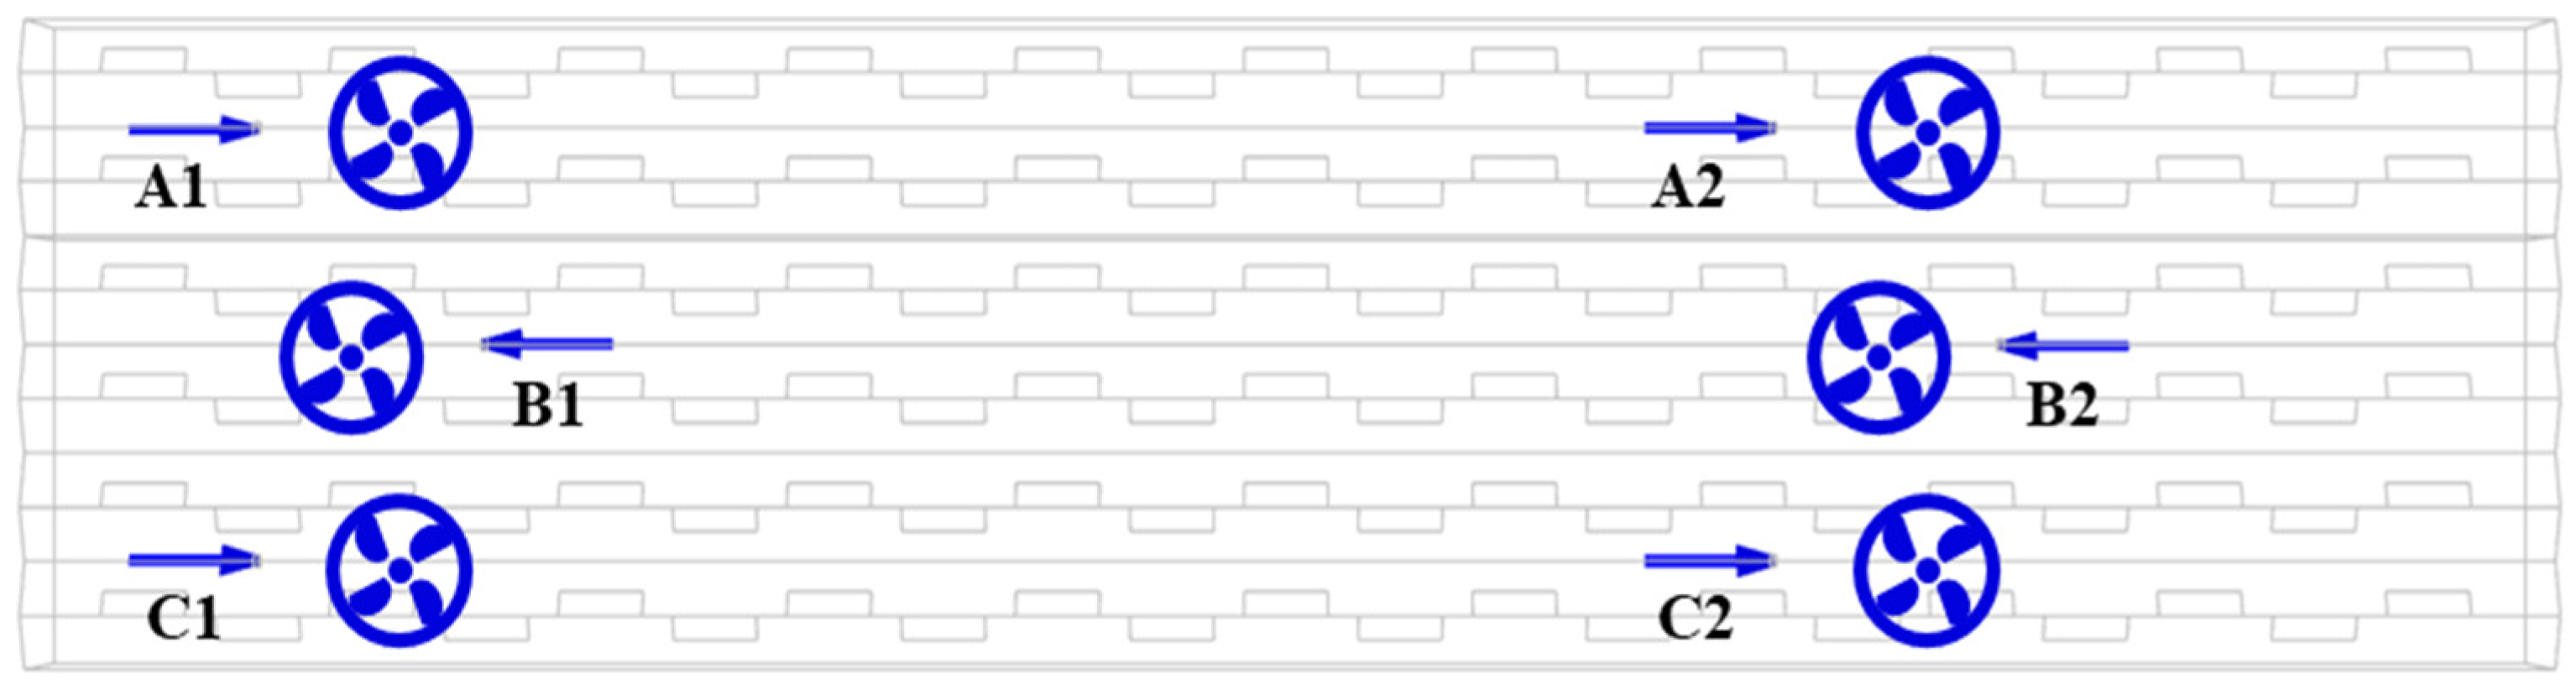
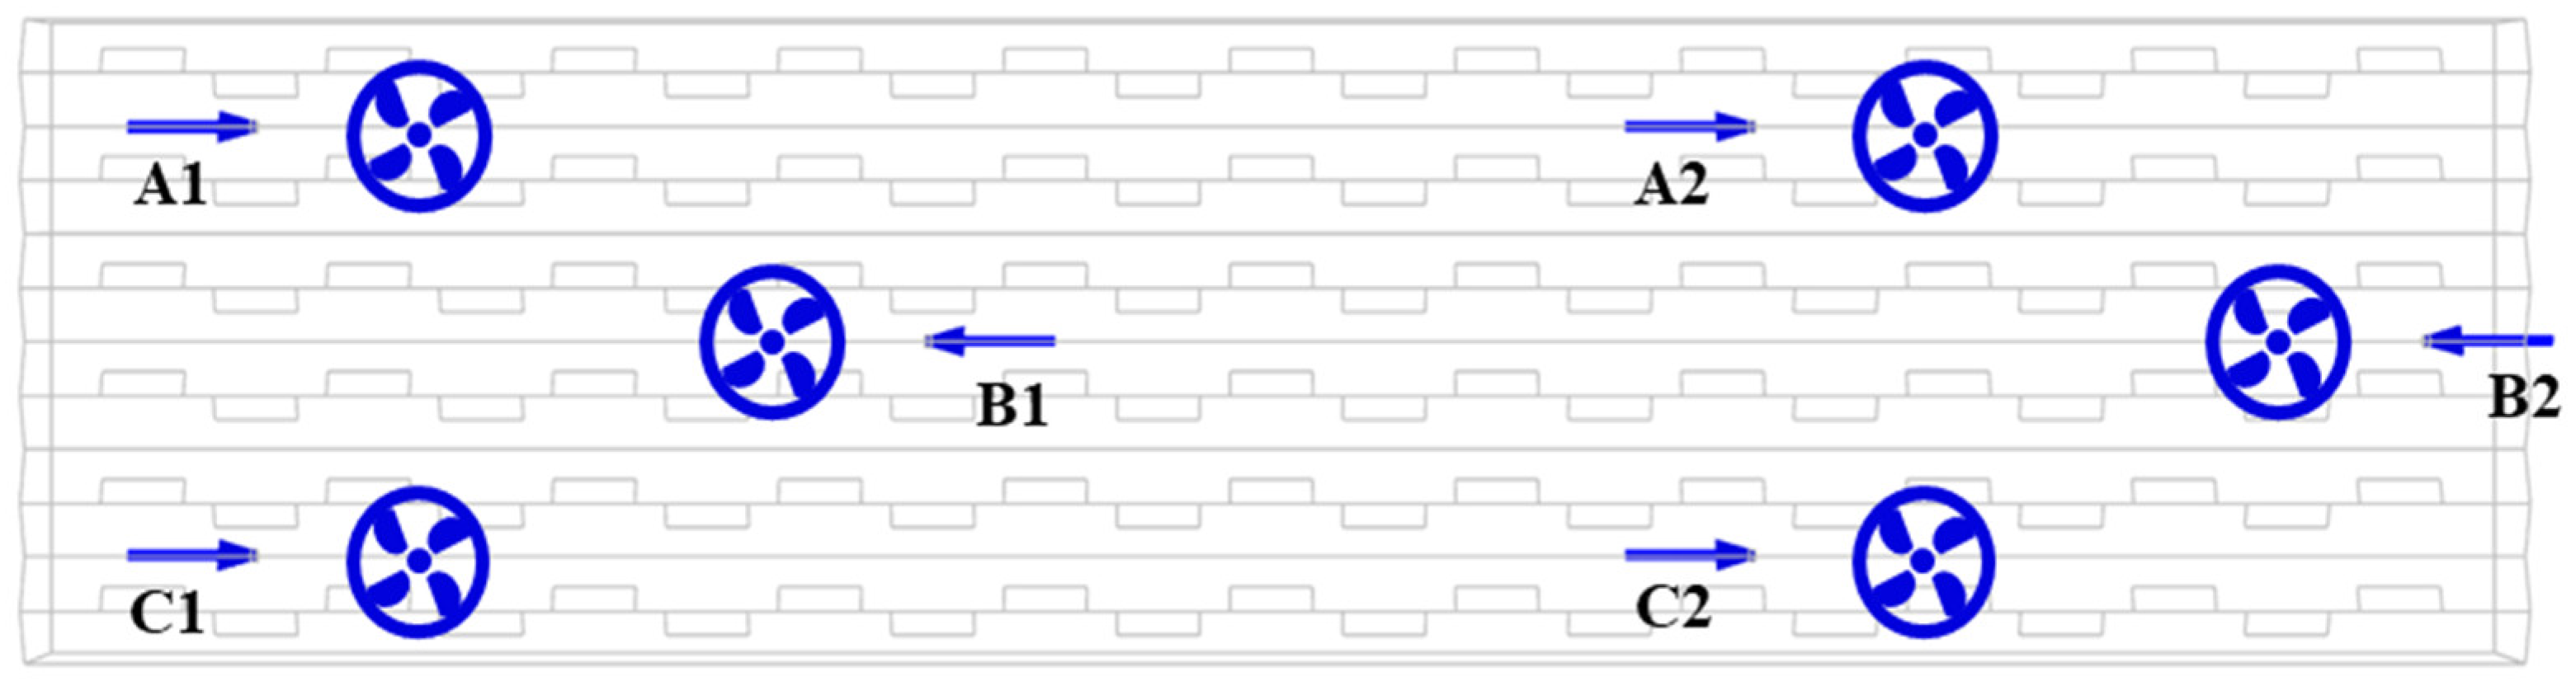
Using the designed CFD simulation models and boundary conditions, the effects of circulation fans inside the greenhouse were evaluated through scenario analysis, as illustrated in Figure 6, Figure 7, Figure 8, Figure 9 and Figure 10. In these figures, the small zigzag-shaped rectangular patterns indicate the roof vent openings of the greenhouse. Case 1 consisted of all circulation fans discharging airflow in the same longitudinal direction (Figure 6). Case 2, identical to Case 1, reversed the exhaust direction of the fans located along the central line (Figure 7). In Case 3, the central line fans were shifted by 9.0 m to create a zigzag arrangement (Figure 8). Case 4 displaced the central fans by an additional 9.0 m from Case 3 (Figure 9). Finally, in Case 5, the fan installation positions were shifted by another 9.0 m compared with Case 4 (Figure 10).
Figure 6.
Case 1 with circulation fan airflow discharged in the same direction (Arrows indicate the discharge direction of the circulation fans, and A1–C2 denote the names of the fans at each location).
Figure 7.
Case 2 with the exhaust direction of the central circulation fans reversed from the Case 1 configuration.
Figure 8.
Case 3 with central circulation fans displaced by 9 m from Case 2 and arranged in a zigzag pattern.
Figure 9.
Case 4 with the installation positions of the central circulation fans displaced by an additional 9 m from Case 3.
Figure 10.
Case 5 with the circulation fan installation positions displaced an additional 9 m compared to Case 4.
3. Results and Discussions
3.1. Fan Performance Analysis
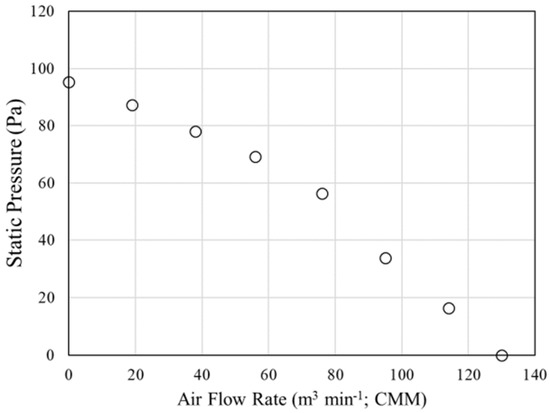
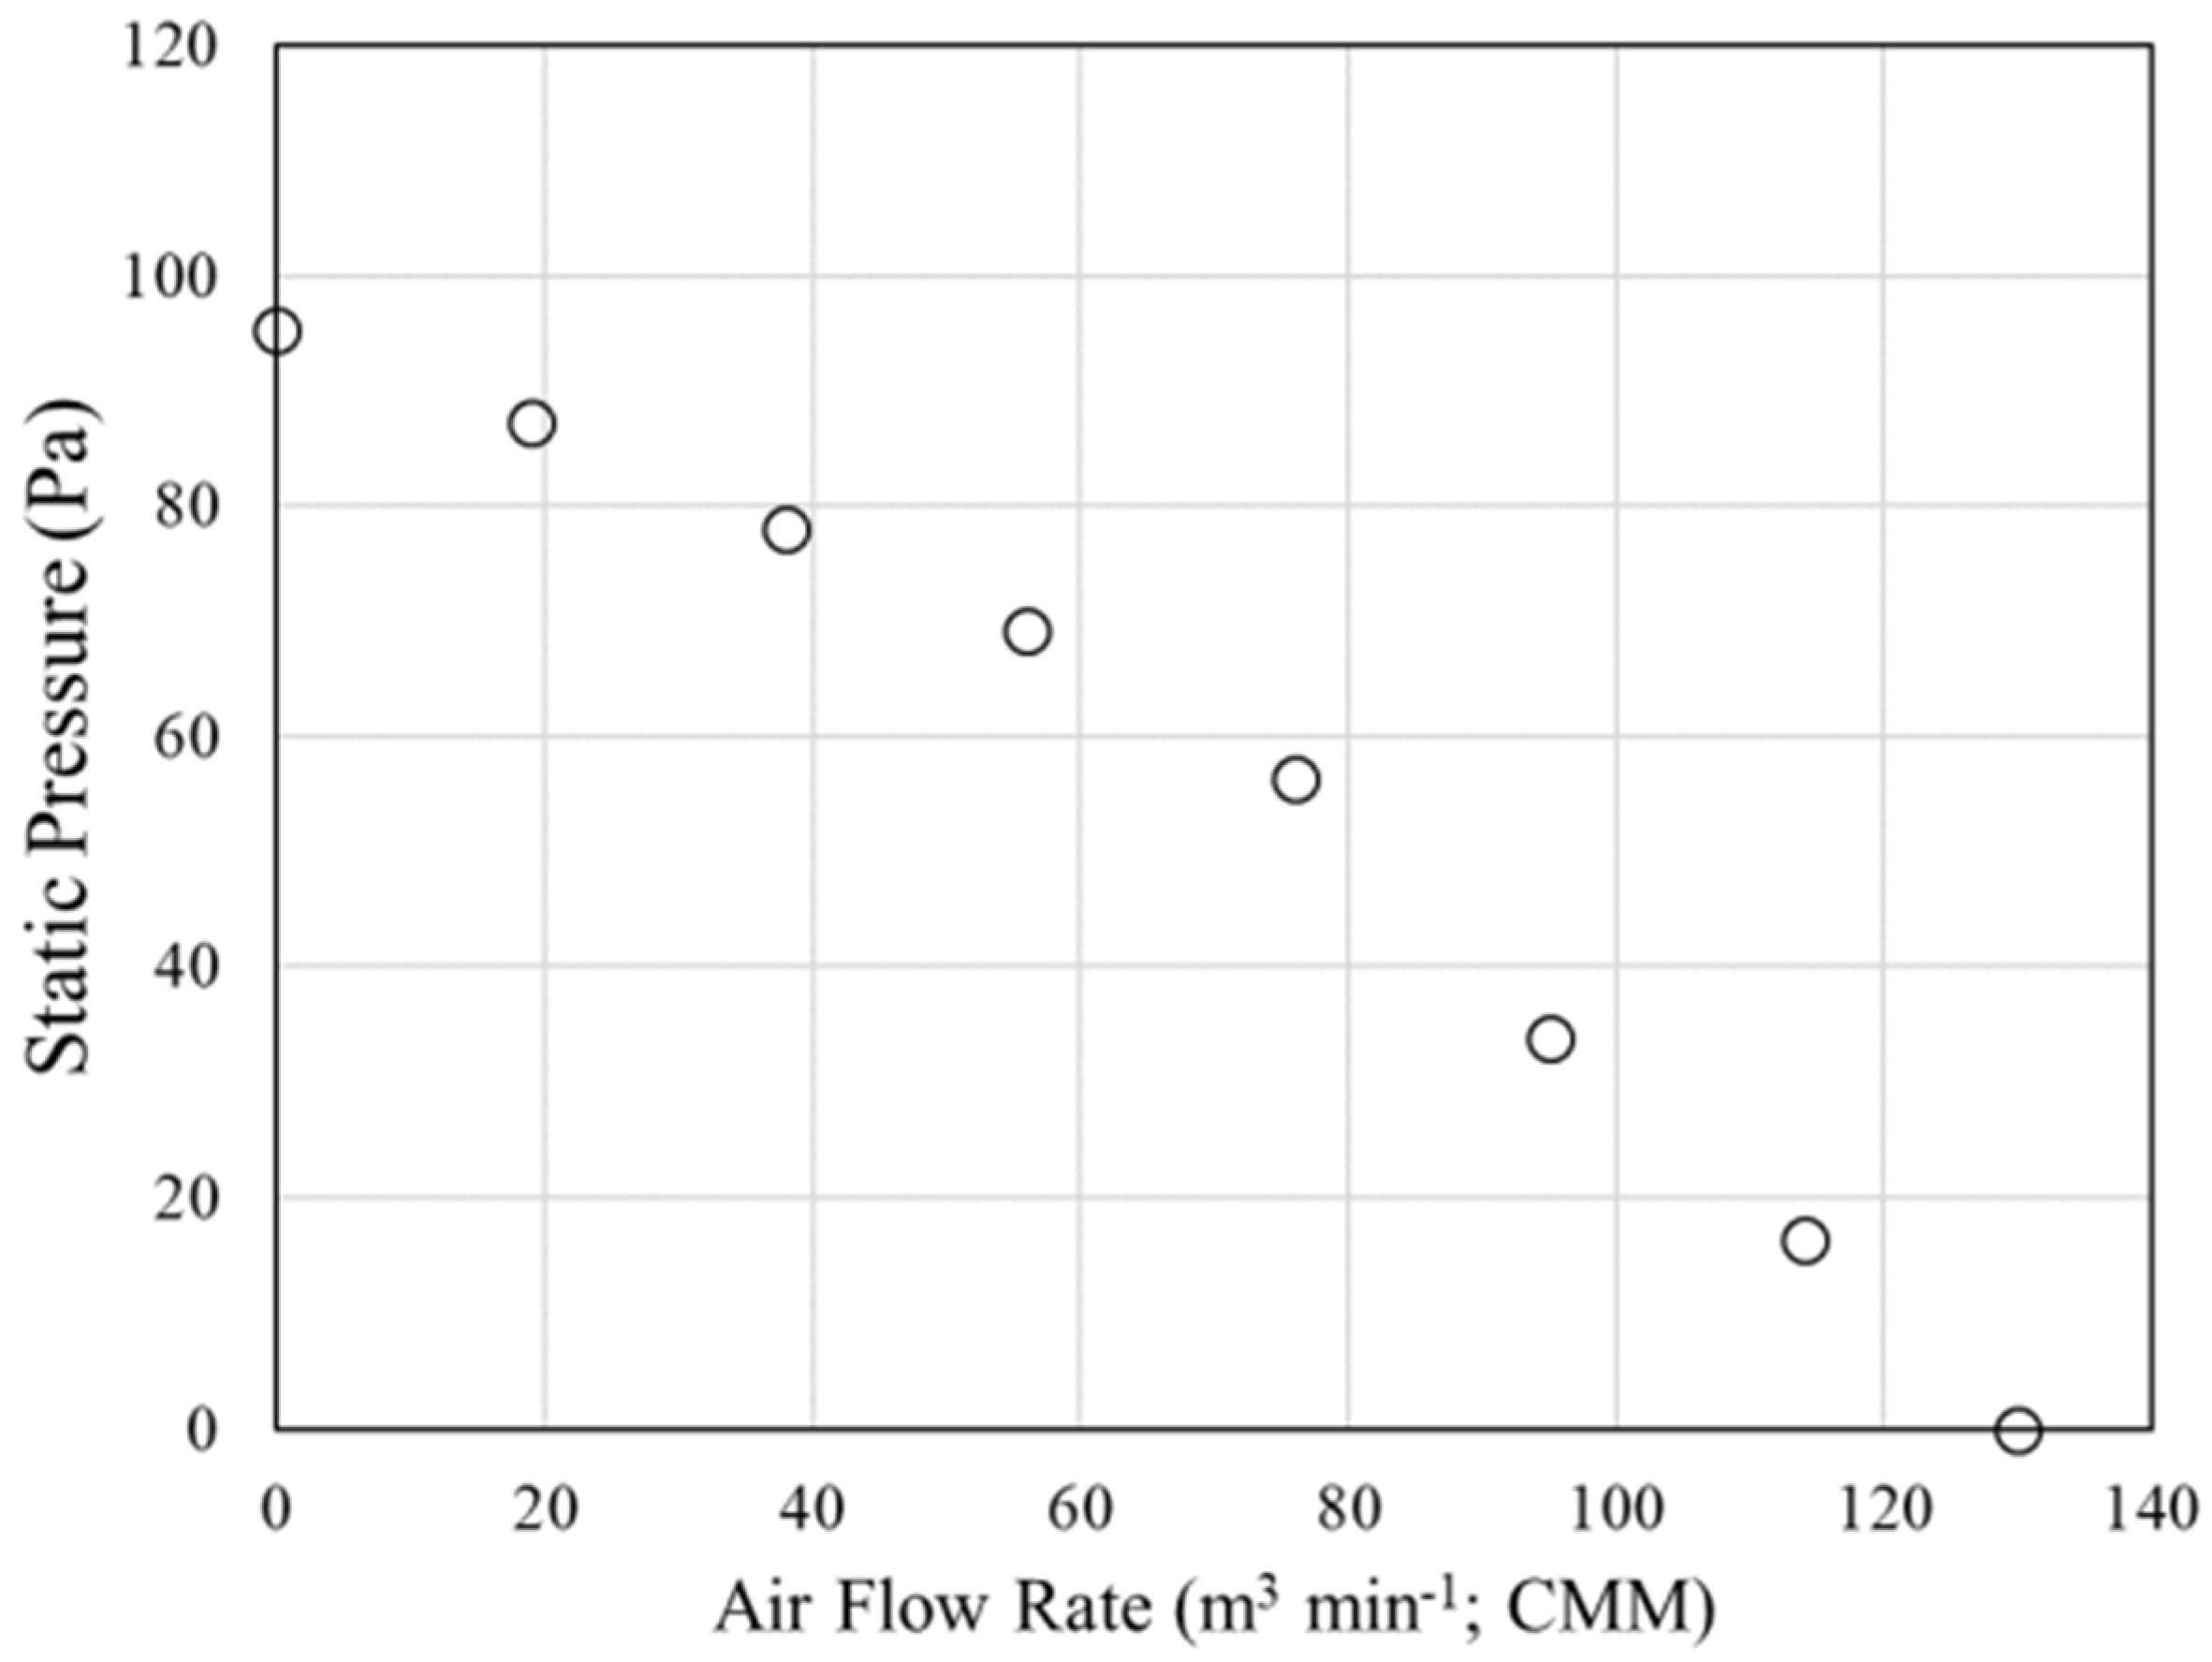
The performance characteristics of the circulation fan were evaluated by examining rotational speed, static pressure, airflow, and power (Table 3). The results were obtained from repeated measurements to minimize experimental errors and improve reliability. The rotational speed of the circulation fan and the airflow generally exhibited a proportional relationship in which airflow increased with increasing speed. Conversely, static pressure and airflow were negatively correlated, with a correlation coefficient (R) of −0.984, which indicates that airflow decreased as the pressure increased. The fan performance curve, which illustrates the interactions among the measured variables, is shown in Figure 11. The maximum airflow was measured at 95.3 cubic meters per minute (CMM).
Table 3.
Performance test results of the experimental agricultural circulation fan.
Figure 11.
Performance curve of the agricultural circulation fan under experimental pressure conditions.
3.2. Dispersion Characteristics of a Single Fan
An analysis of the discharge characteristics was conducted under the condition that a single circulation fan was installed inside the greenhouse. The discharge characteristics of the circulation fan were analyzed in terms of dispersion distance and dispersion area. In this study, 0.5 m s−1 was adopted as an operational threshold for defining the effective airflow dispersion region. This value was selected based on previous greenhouse CFD research in which airflow below 0.5 m s−1 was regarded as nearly calm or very weak airflow [32]. Therefore, the 0.5 m s−1 criterion was used as a practical reference to distinguish the effective airflow generated by the circulation fan from weak background airflow and to consistently compare dispersion distance and area among different fan installation scenarios. Simulation results showed that airflow discharged from a single fan diffused up to a maximum distance of 60.34 m, with a dispersion area of 193.14 m2. Given that the total area of the experimental greenhouse was 800 m2, the circulation fan was determined to influence up to 24.1% of the total area. Accordingly, an installation interval of approximately 60 m was selected as a baseline condition for subsequent multi-fan arrangement analysis. Based on this finding, an optimization analysis of installation positions was performed for larger greenhouses using the same circulation fans.
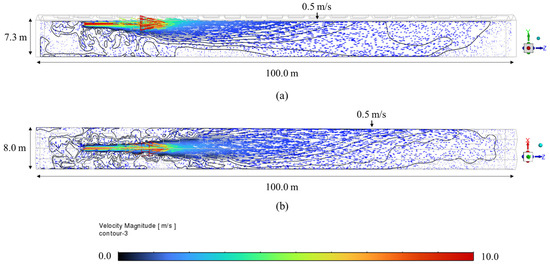
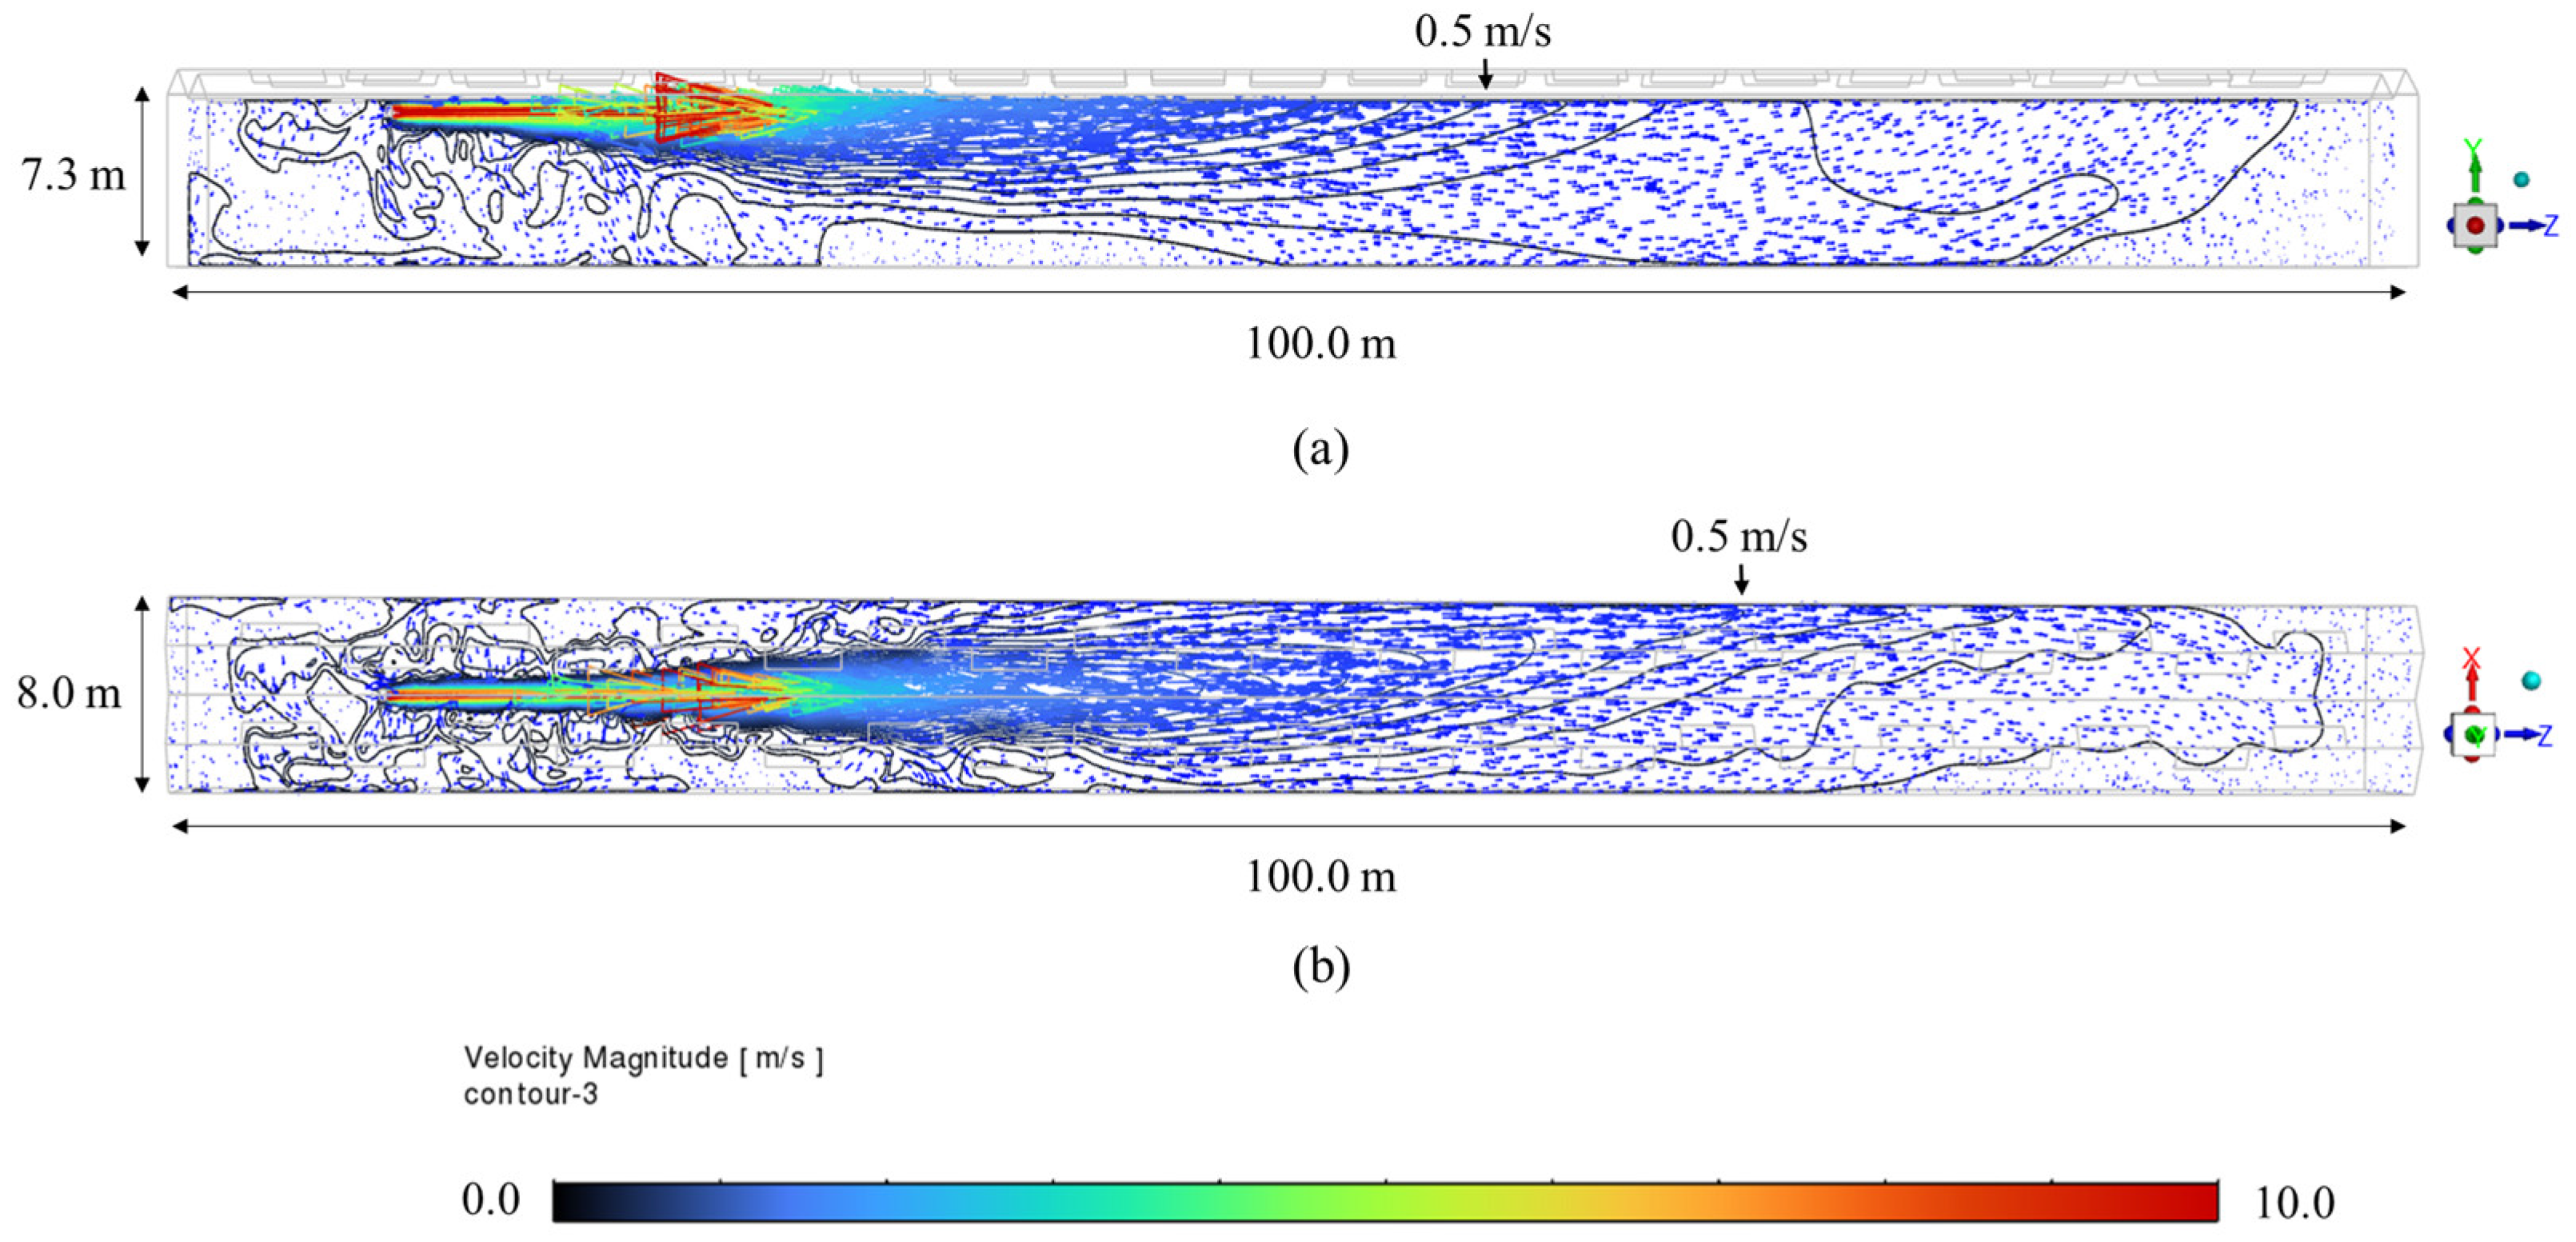
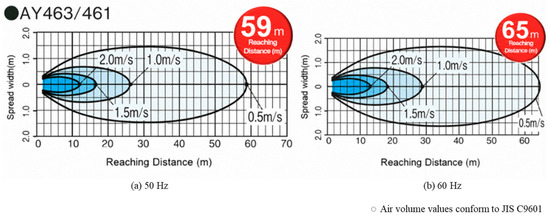
Figure 12 illustrates the aerodynamic characteristics of the greenhouse interior with a single circulation fan installed. Figure 12a shows the airflow in the Y-Z cross-section relative to the fan center. Initially, the discharged jet exhibited strong linearity; however, it gradually deflected downward as it propagated, resulting in a rapid decrease in velocity. Figure 12b, which depicts the X-Z cross-section centered on the fan, reveals that a symmetrical flow pattern did not form at the fan height of 5.8 m. Instead, the airflow skewed towards the left. This asymmetry was attributed to the asymmetric roof vent design of the Venlo-type greenhouse, which prevented the formation of symmetrical airflow patterns. The airflow velocity distribution further suggests that the circulation fan height of 5.8 m may not generate airflow that is effective for optimal crop growth, depending on crop type or growth stage. Therefore, adaptive strategies for fan installation, operation, and control are necessary to establish optimal growth conditions. Figure 13 presents the airflow range reported for a commercially available fan with a similar performance class. In this study, the airflow rate measured by a certified testing laboratory was used as the velocity-inlet boundary condition for the CFD simulation. Therefore, the comparison with the similar commercial fan was used as a qualitative plausibility check to assess whether the simulated dispersion distance was within a reasonable range.
Figure 12.
Discharge characteristics of a single circulation fan inside the greenhouse: (a) Y-Z cross-section, and (b) X-Z cross-section (black solid lines indicate velocity contours).
Figure 13.
Analysis results of a product with similar performance (lighter blue indicates lower air velocity).
3.3. Analysis of Flow Characteristics Under Uniform Fan Spacing and Different Discharge Directions
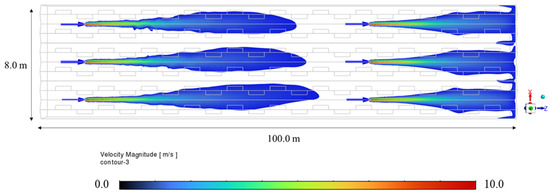
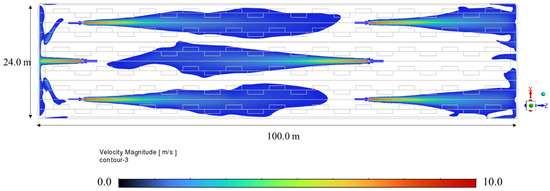
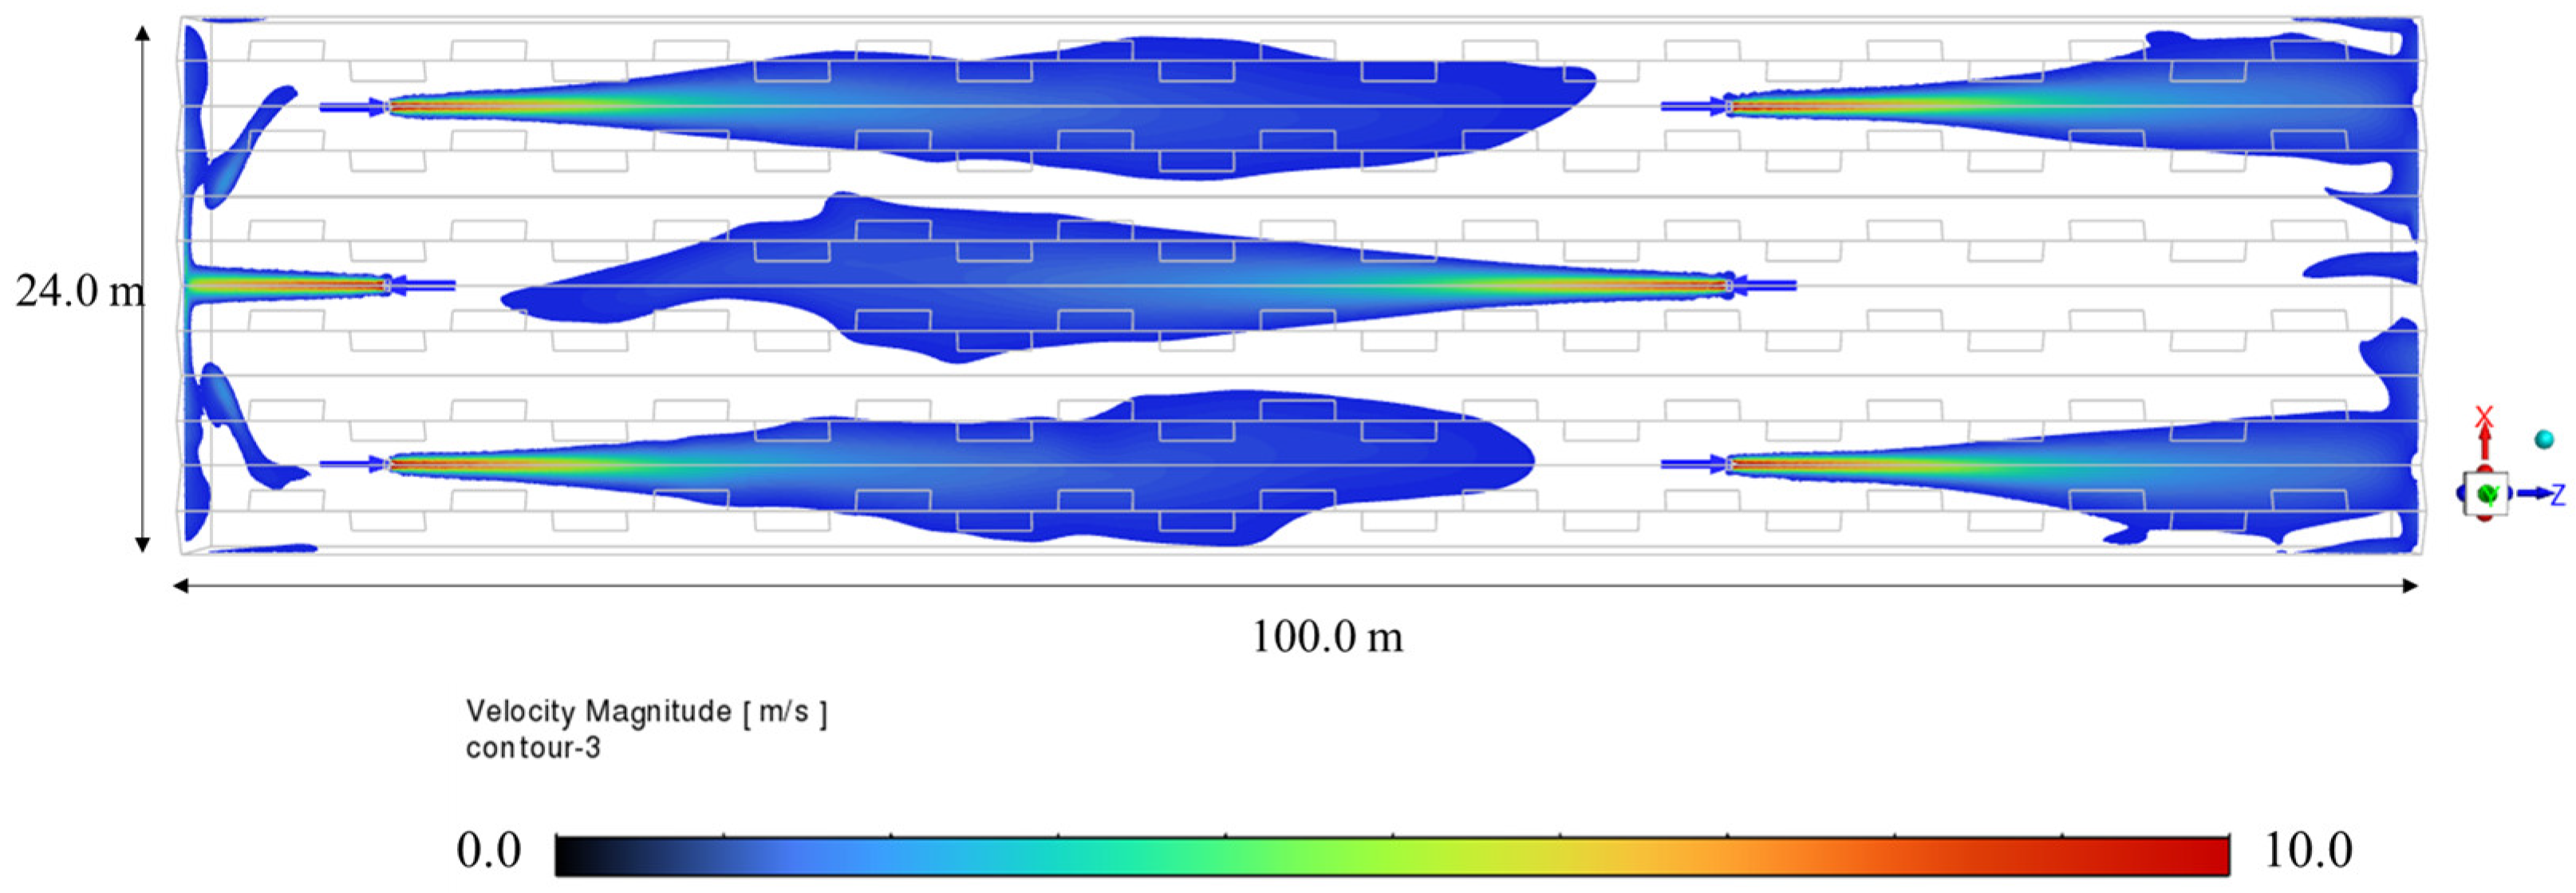
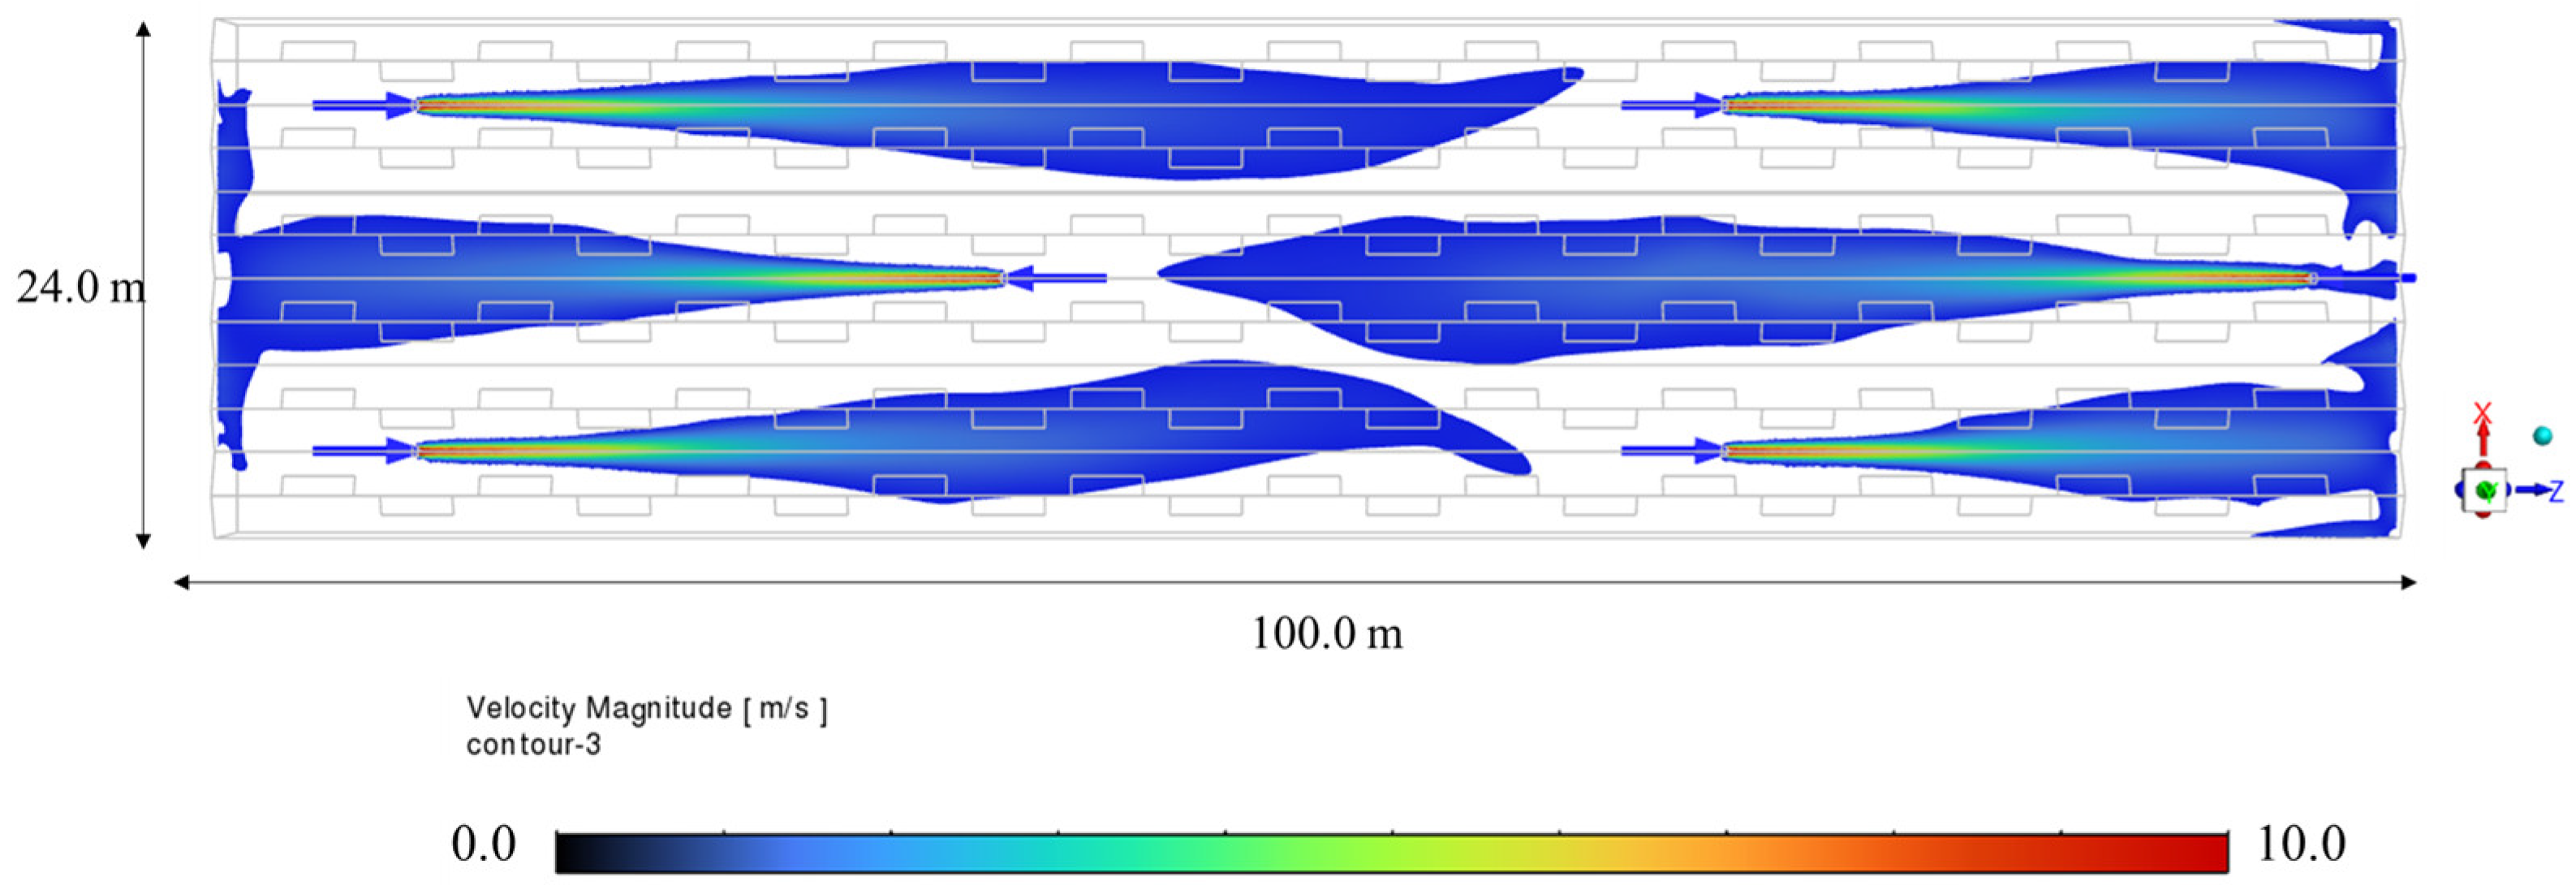
In Case 1, the circulation fans were arranged at uniform spacing, with all fans discharging airflow in the same longitudinal direction (Figure 14). The aerodynamic characteristics of airflow within the greenhouse (dispersion area) were analyzed. The total area of the greenhouse was 2400 m2, and the dispersion areas were calculated based on the installation height of six circulation fans. Clear differences in dispersion area were observed depending on the installation scenario. For fan A1, the dispersion distance of the discharged airflow was 49.57 m; for fan B1, 46.86 m; and for fan C1, 44.77 m. The average dispersion distance was 47.07 m, which represents a reduction of approximately 22% compared with the maximum value obtained in single-fan simulations. When all fans discharged air in the same direction (Case 1), the dispersion area at fan height was 766.89 m2 (Figure 14). However, when the discharge direction of the central row fans was reversed (Case 2), the dispersion area increased by 15.5% compared with Case 1. The volume-averaged airflow velocity also increased from 0.290 m s−1 in Case 1 to 0.361 m s−1 in Case 2, corresponding to an improvement of approximately 24.5%.
Figure 14.
Aerodynamic characteristics inside the greenhouse with six circulation fans installed at 60 m intervals (side and central fans oriented in the same direction).
When the fans in the central row were oriented opposite to those in the side rows (Case 2), the discharged airflow from the central-row fans collided with the nearby wall, rather than contributing effectively to airflow dispersion at fan height. Some of the flow exited through the roof vents, while the majority recirculated inside the greenhouse (Figure 15). This finding suggests that insufficient spacing between adjacent fan jets can increase aerodynamic interference and reduce effective airflow dispersion. Similar observations were reported by Kim [33], who confirmed that increasing the spacing between fans enhances airflow distribution within enclosed spaces, thus suggesting that reconfiguring the central fan arrangement can improve performance.
Figure 15.
Aerodynamic characteristics inside the greenhouse with six circulation fans installed at 60 m intervals (central fans oriented opposite to side fans).
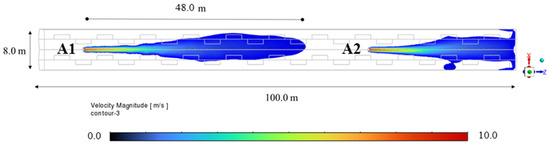
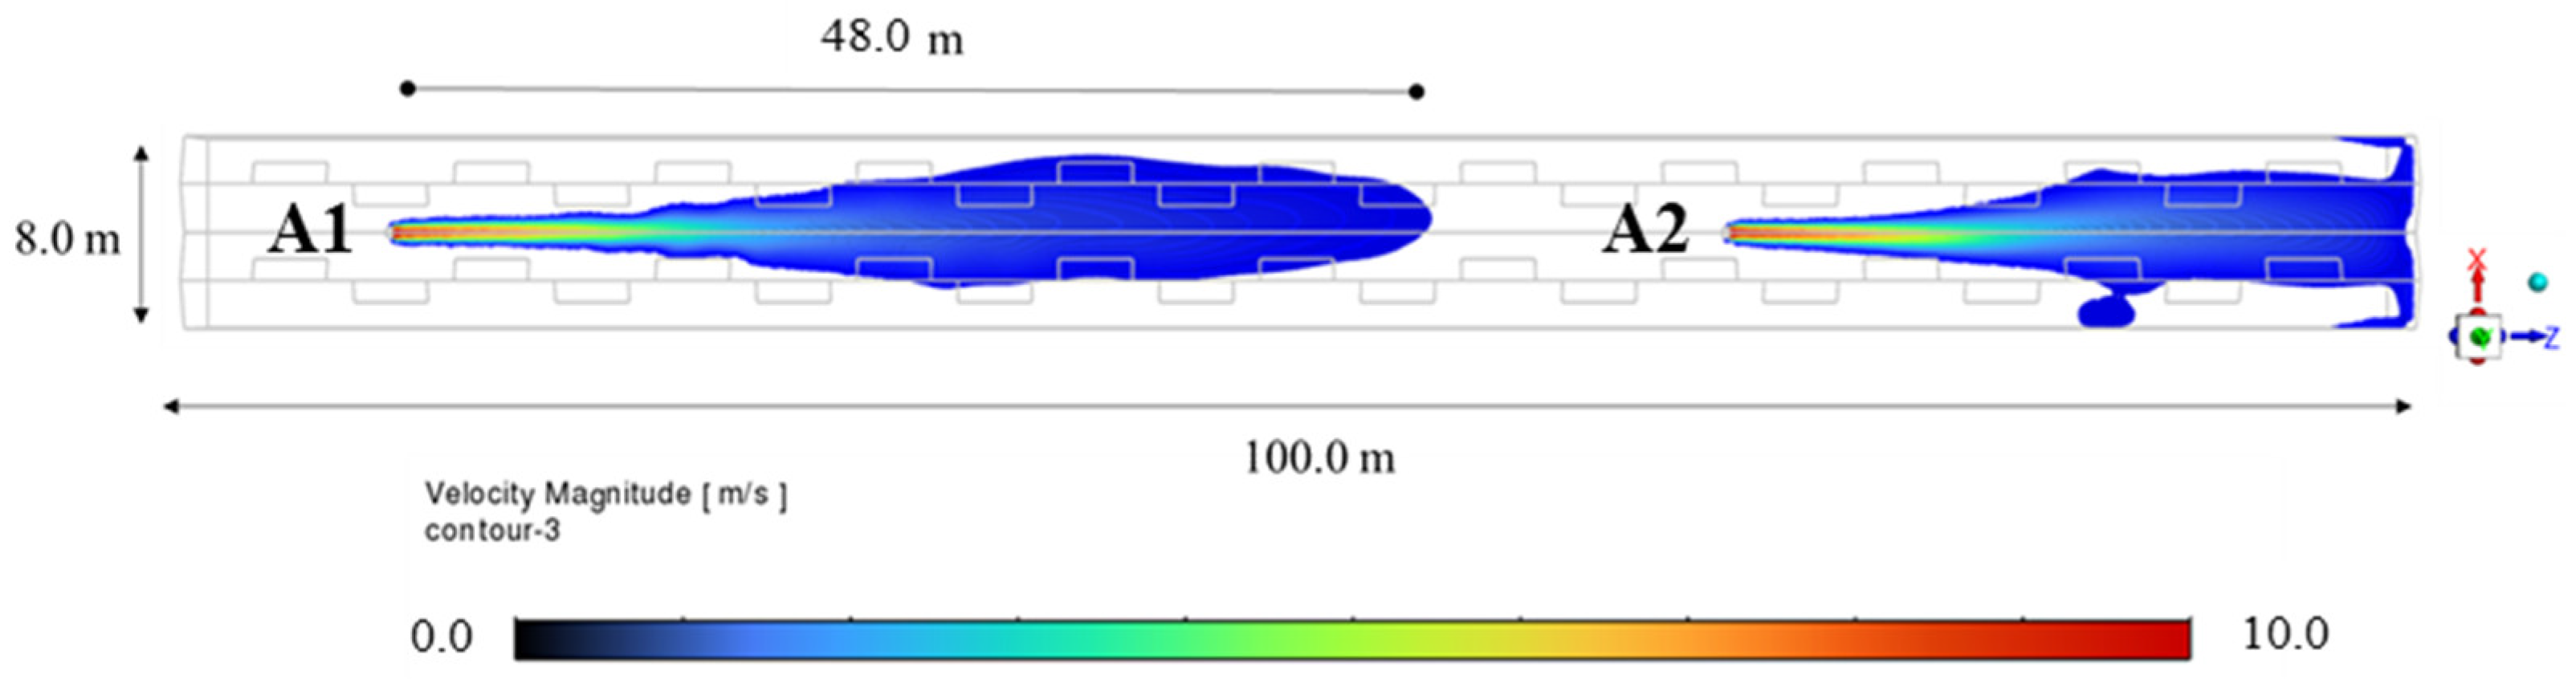
When the circulation fans were arranged in an alternating pattern at equal intervals (Case 2), the dispersion distances were 51.44 m at A1, 54.83 m at B1, and 54.20 m at C1, yielding an average of 53.50 m. Compared to the maximum single-fan dispersion distance of 60.34 m measured from the fan installation height, this configuration showed a reduction of approximately 10.3% in dispersion distance. As illustrated in Figure 16, the dispersion distance of the circulation fan installed at A1 reached a maximum of 48.0 m, which was insufficient to extend the effective airflow region to the adjacent circulation fan located at A2. These results suggest that further optimization of fan installation angle, height, spacing, and capacity may be required to improve airflow connectivity between adjacent circulation fans.
Figure 16.
Analysis of dispersion distance with two agricultural circulation fans installed along the 100 m longitudinal direction.
3.4. Analysis of Airflow Characteristics of Greenhouse Circulation Fans (Zigzag Arrangement Condition)
As shown in Figure 17, airflow distribution was analyzed under the condition of six circulation fans installed in a zigzag arrangement (Table 4). In Case 3, where the central row fans were displaced by +9 m, the dispersion area was 918.74 m2, representing a 3.7% increase compared with Case 2 (886 m2). When the circulation fans were arranged in an alternating pattern at equal intervals, the dispersion distance was 51.44 m at A1 and 54.83 m at B1. At C1, the dispersion distance was 54.20 m, giving an overall average of 53.50 m. Compared with Case 2, the +9 m zigzag arrangement in Case 3 improved the average dispersion distance to 56.26 m, with individual dispersion distances of 53.80 m at A1, 59.0 m at B1, and 56.0 m at C1. This result indicates that the +9 m zigzag arrangement increased the average dispersion distance by 5.16% compared with Case 2. Notably, the central fan reached a dispersion distance of 59.0 m, which is similar to the result from the single-fan performance simulation (60.34 m).
Figure 17.
Analysis of airflow distribution characteristics under the +9 m zigzag arrangement.
Table 4.
Airflow dispersion area and volume-averaged velocity according to circulation fan installation conditions in the greenhouse.
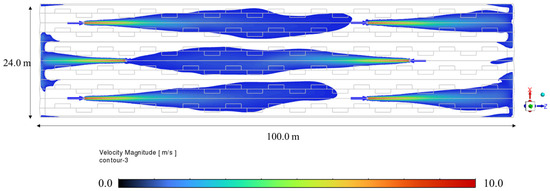
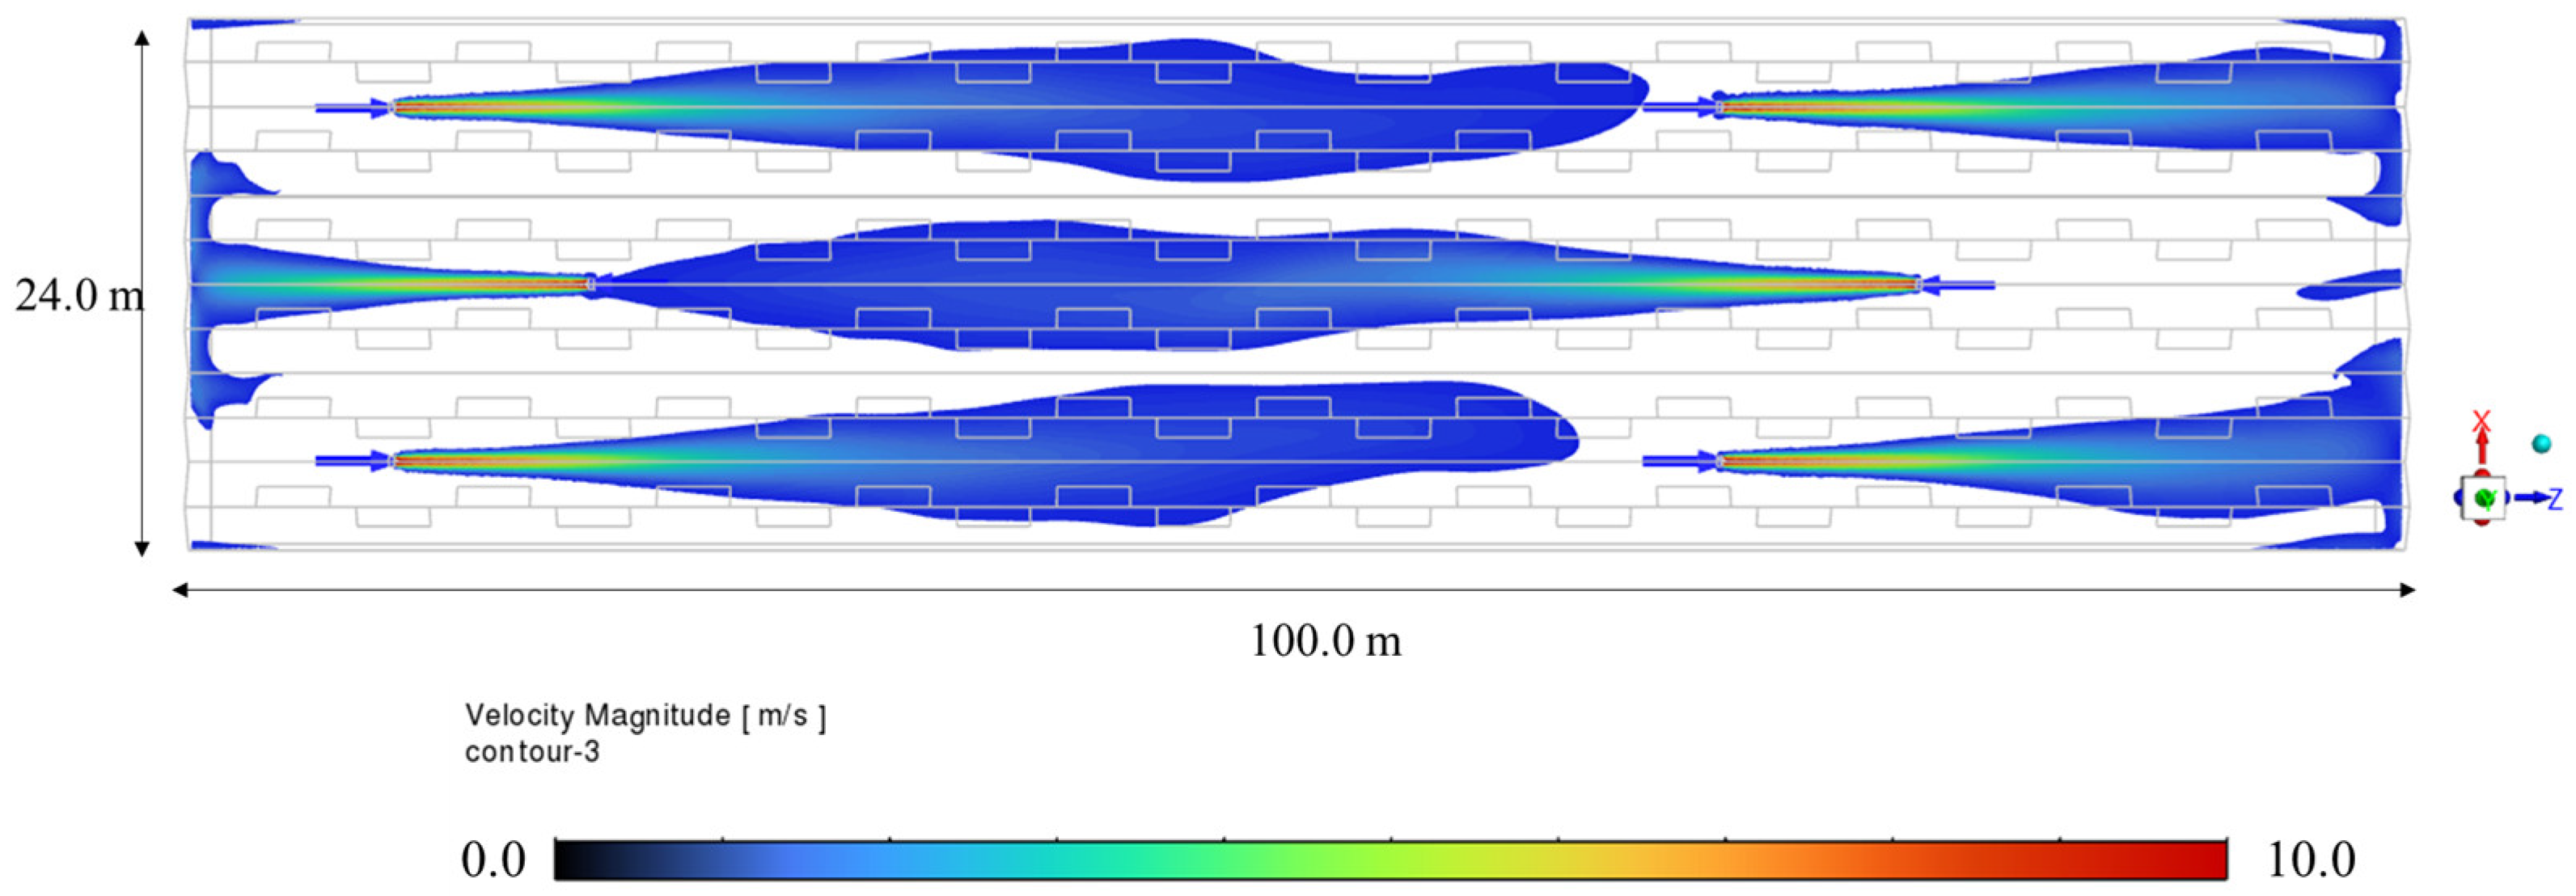
Figure 18 shows the airflow velocity distribution when the circulation fans were arranged in a +18 m zigzag pattern. At the installation height of 5.8 m, the dispersion area was 964.37 m2, representing a 4.97% increase compared to Case 3 (918.74 m2). The dispersion distances were 54.82 m at A1, 59.0 m at B1, and 56.0 m at C1, with an average dispersion distance of 56.60 m. Although the increase in average dispersion distance was modest, These results indicate that the +18 m zigzag arrangement provided the most favorable airflow distribution among the tested configurations.
Figure 18.
Analysis of airflow distribution characteristics under the +18 m zigzag arrangement.
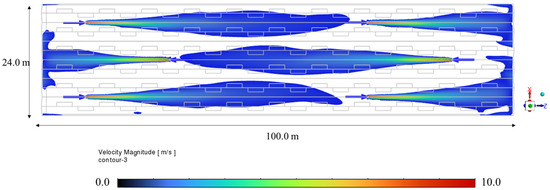
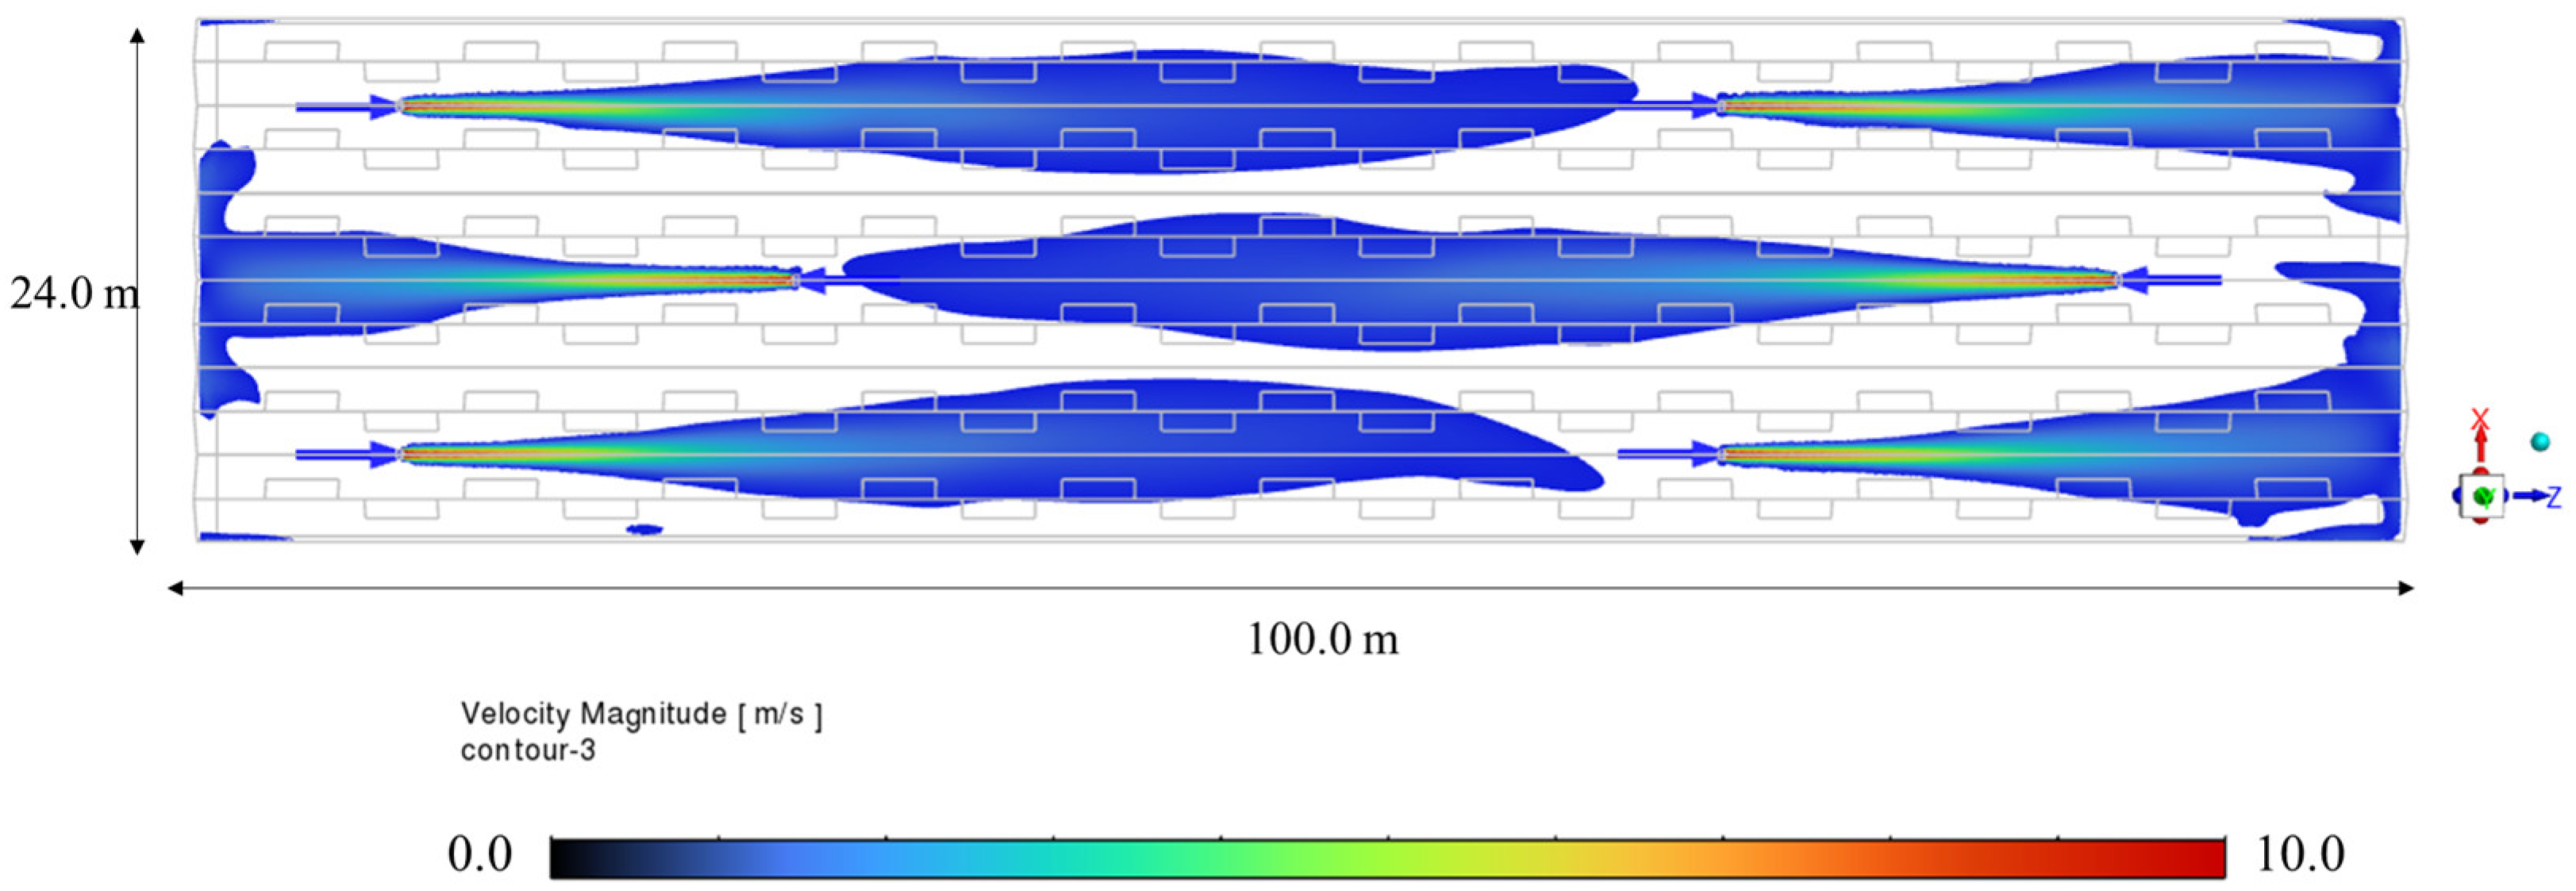
Figure 19 presents the simulated airflow velocity distribution when the circulation fans were arranged in a +27 m zigzag pattern. At the installation height of 5.8 m, the dispersion area was 951.31 m2, indicating that the maximum dispersion area was obtained under the +18 m zigzag arrangement, whereas further displacement to +27 m reduced the dispersion area. The dispersion distances were 53.43 m at A1, 59.0 m at B1, and 53.73 m at C1, with an average dispersion distance of 55.39 m. Compared with the maximum dispersion distance achieved with a single fan (60.34 m), this case exhibited an 8.2% reduction. These findings are consistent with previous studies emphasizing the importance of airflow control and fan arrangement in greenhouse environments. Lee and Short [34] reported that wind speed is the most significant factor in estimating ventilation rates. When wind blows in the designed direction of the greenhouse (west wind), the degree of side-vent opening has a significant impact on the ventilation rate. They also observed that plant canopies reduced ventilation rates by 2.6% to 12%. Similarly, Kacira et al. [35] used CFD simulations on a two-span greenhouse to assess the effects of ventilation structures and crops on the airflow of both the greenhouse and the crop growth zones. The results showed that airflow velocity decreased near crop canopies owing to the aerodynamic resistance of the plants, while the circulation fans increased airflow velocity above the canopy. When a larger number of circulation fans were installed, airflow velocity increased accordingly. Notably, bidirectional installation improved airflow uniformity; however, excessive fan operation could cause wind stress and unnecessary energy consumption. Therefore, installing an optimal number of circulation fans, particularly in bidirectional configurations, is recommended to enhance airflow uniformity while maintaining energy efficiency.
Figure 19.
Analysis of airflow distribution characteristics under the +27 m zigzag arrangement.
4. Conclusions
This study analyzed the effects of circulation fan discharge direction and installation spacing on airflow dispersion characteristics in a Venlo-type greenhouse using CFD simulations. The results showed that airflow discharged from a circulation fan could diffuse up to 60.34 m from the installation height; however, dispersion effectiveness decreased depending on the fan installation configuration. When the circulation fans were installed in the same direction, the dispersion area at installation height was 766.89 m2, whereas under the zigzag arrangements, it increased to between 886 and 964.37 m2. The zigzag arrangement improved airflow dispersion up to the +18 m displacement condition, whereas further displacement to +27 m reduced the dispersion area. Because this study focused on airflow velocity fields, the results do not directly quantify temperature, humidity, or CO2 distributions. However, the improved airflow dispersion identified in this study can provide a physical basis for future coupled analyses of thermal, moisture, and gas transport in greenhouses.
Future studies should consider crop conditions, detailed greenhouse geometry, and external wind environments to improve the applicability of the CFD model under practical greenhouse operation. In addition, because circulation fans can interact with external wind environments and thereby influence internal airflow characteristics, further research is necessary to comprehensively evaluate these interactions.
Author Contributions
Data curation, G.-H.J.; investigation, G.-H.J. and S.-H.K.; supervision, U.-H.Y.; validation, G.-H.J. and Y.-K.J.; visualization, S.-H.K.; writing—original draft, S.-H.K., G.-H.J., and U.-H.Y.; writing—review and editing, Y.-K.J. and U.-H.Y.; S.-H.K. and G.-H.J. contributed equally to this paper. All authors have read and agreed to the published version of the manuscript.
Funding
This work was supported by Korea Institute of Planning and Evaluation for Technology in Food, Agriculture and Forestry (IPET) and Korea Smart Farm R&D Foundation (KosFarm) through Smart Farm Innovation Technology Development Program, funded by Ministry of Agriculture, Food and Rural Affairs (MAFRA) and Ministry of Science and ICT (MSIT), Rural Development Administration (RDA) [RS-2025-02305220].
Data Availability Statement
The original contributions presented in this study are included in the article. Further inquiries can be directed to the corresponding author.
Conflicts of Interest
Author Young-Kyun Jang was employed by the company GreenCS Co., Ltd. The remaining authors declare that the research was conducted in the absence of any commercial or financial relationships that could be construed as a potential conflict of interest.
Abbreviations
| CFD | Computational fluid dynamics |
| SIMPLE | Semi-implicit method for pressure linked equations |
| KOLAS | Korea laboratory accreditation scheme |
| R | Correlation coefficient |
| RNG | Renormalization group |
| KRW | Korean won |
References
- Ministry of Agriculture, Food and Rural Affairs (MAFRA). 2020 Agriculture, Forestry and Food Major Statistics; Ministry of Agriculture, Food and Rural Affairs: Sejong, Republic of Korea, 2020. Available online: https://www.mafra.go.kr/home/5001/subview.do?enc=Zm5jdDF8QEB8JTJGYmJzJTJGaG9tZSUyRjc5OCUyRmFydGNsTGlzdC5kbyUzRnJnc0VuZGRlU3RyJTNEJTI2YmJzT3BlbldyZFNlcSUzRCUyNnJnc0JnbmRlU3RyJTNEJTI2cm93JTNEMTAlMjZiYnNDbFNlcSUzRCUyNnNyY2hDb2x1bW4lM0RzaiUyNmlzVmlld01pbmUlM0RmYWxzZSUyNnNyY2hXcmQlM0QlRUMlOEIlOUMlRUMlODQlQTQlRUMlQjElODQlRUMlODYlOEMrJUVDJTk4JUE4JUVDJThCJUE0JUVEJTk4JTg0JUVEJTk5JUE5KyVFQiVCMCU4RislRUMlQjElODQlRUMlODYlOEMlRUIlQTUlOTgrJUVDJTgzJTlEJUVDJTgyJUIwJUVDJThCJUE0JUVDJUEwJTgxKyVFRCU4NiVCNSVFQSVCMyU4NCUyNg%3D%3D (accessed on 14 February 2026).
- Lee, Y.B.; Jeon, H.J.; Son, J.E. Protected Horticulture, 2nd ed.; Hyangmoonsa: Seoul, Republic of Korea, 2010; pp. 122–130. (In Korean) [Google Scholar]
- Nam, S.W.; Seo, W.M.; Yoon, Y.C.; Lee, S.K.; Lee, I.B.; Lee, H.W.; Cho, B.K. Bio-Environment Control Engineering; Cheongsol: Daegu, Republic of Korea, 2008; pp. 219–229. (In Korean) [Google Scholar]
- Lee, H.W.; Kim, Y.S. Application of low pressure fogging system for commercial tomato greenhouse cooling. J. Bio-Environ. Control. 2011, 20, 1–7. [Google Scholar]
- Yu, I.H.; Cho, M.W.; Lee, S.Y.; Chun, H.; Lee, I.B. Effects of circulation fans on uniformity of meteorological factors in warm air heated greenhouse. J. Bio-Environ. Control. 2007, 16, 291–296. [Google Scholar]
- Hong, S.W.; Lee, I.B. Predictive model of micro-environment in a naturally ventilated greenhouse for a model-based control approach. Prot. Hortic. Plant Fact. 2014, 23, 181–191. [Google Scholar]
- Lee, B.I.; Moon, W. Protected Horticulture; Korea National Open University: Seoul, Republic of Korea, 1993; pp. 53–62. [Google Scholar]
- Tokairin, T.; Sumi, A.; Shimomura, N.; Kumazaki, T.; Suzuki, K.; Saigusa, M. Effect of air circulator on airflow distributions in greenhouse with a pad-fan evaporative cooling system. Shokubutsu Kankyo Kogaku 2017, 29, 17–25. [Google Scholar] [CrossRef] [Scilit]
- Andersson, N.E. The influence of constant and diurnally changing CO2 concentrations on plant growth and development. J. Hortic. Sci. 1991, 66, 569–574. [Google Scholar]
- Bakker, J.C. Effects of day and night humidity on yield and fruit quality of glasshouse tomatoes (Lycopersicon esculentum Mill.). J. Hortic. Sci. 1990, 65, 323–331. [Google Scholar] [CrossRef] [Scilit]
- de Koning, A.N. Development and Dry Matter Distribution in Glasshouse Tomato: A Quantitative Approach; Wageningen University and Research: Wageningen, The Netherlands, 1994. [Google Scholar]
- Noh, J.S.; Kwon, J.K.; Kim, Y.Y. Development of device measuring real-time air flow in greenhouse. Prot. Hortic. Plant Fact. 2018, 27, 20–26. [Google Scholar] [CrossRef] [Scilit]
- Kang, D.H.; An, S.; Kim, D.E.; Hong, S.; Han, C. The analysis of vertical and horizontal airflow reach distance according to the shape of air circulation fans. J. Ind. Technol. Res. 2025, 30, 155–162. [Google Scholar] [CrossRef] [Scilit]
- Lee, T.S.; Kang, G.C.; Paek, Y.; Moon, J.P.; Oh, S.S.; Kwon, J.K. Analysis of temperature and humidity distributions according to arrangements of air-circulation fans in a single-span tomato greenhouse. Prot. Hortic. Plant Fact. 2016, 25, 277–282. [Google Scholar] [CrossRef] [Scilit]
- Lee, I.B.; Yun, N.K.; Boulard, T.; Roy, J.C.; Lee, S.H.; Kim, G.W.; Hong, S.W.; Sung, S.H. Development of an aerodynamic simulation for studying microclimate of plant canopy in greenhouse—(2) Development of CFD model to study the effect of tomato plants on internal climate of greenhouse. J. Bio-Environ. Control. 2006, 15, 296–305. [Google Scholar]
- Yeo, U.H.; Lee, I.B.; Kim, R.W.; Lee, S.Y.; Kim, J.G. Computational fluid dynamics evaluation of pig house ventilation systems for improving the internal rearing environment. Biosyst. Eng. 2019, 186, 259–278. [Google Scholar] [CrossRef] [Scilit]
- Yu, I.H.; Kyu, Y.N.; Cho, M.; Ryu, H.; Moon, D. Development of CFD model for analyzing the air flow and temperature distribution in greenhouse with air-circulation fans. Korean J. Agric. Sci. 2014, 41, 461–472. [Google Scholar] [CrossRef] [Scilit]
- Moon, S.M.; Kwon, S.Y.; Lim, J.H. Improvement of energy efficiency of plants factory by arranging air circulation fan and air flow control based on CFD. J. Internet Comput. Serv. 2015, 16, 57–65. [Google Scholar] [CrossRef] [Scilit]
- Nam, S.W.; Kim, Y.S.; Seo, D.U. Change in the plant temperature of tomato by fogging and airflow in plastic greenhouse. Prot. Hortic. Plant Fact. 2014, 23, 11–18. [Google Scholar] [CrossRef] [Scilit]
- Mistriotis, A.; De Jong, T.; Wagemans, M.J.M.; Bot, G.P.A. Computational fluid dynamics (CFD) as a tool for the analysis of ventilation and indoor microclimate in agricultural buildings. Neth. J. Agric. Sci. 1997, 45, 81–96. [Google Scholar] [CrossRef] [Scilit]
- Chang, H.K.; Park, J.J.; Kim, C.W. Analysis of the cooling effect of a smart glass greenhouse using cooling fan, vinyl barrier, and shading net. Trans. Korean Soc. Mech. Eng. A 2021, 45, 945–951. [Google Scholar] [CrossRef] [Scilit]
- Yoon, J.H.; Kim, Y.B.; Yu, I.H.; Lee, J.W.; Song, H.W. Numerical study on thermal-flow characteristics by solar radiation for single-span greenhouse. J. Korean Soc. Environ. Technol. 2018, 19, 208–217. [Google Scholar] [CrossRef] [Scilit]
- Lim, R.G.; Son, J.K.; Park, M.J.; Yun, S.W. Evaluation study on the effect of greenhouse cooling and tomato cultivation by airflow fan and fog combined system. J. Korea Acad.-Ind. Coop. Soc. 2022, 23, 343–354. [Google Scholar] [CrossRef] [Scilit]
- Zheng, S.; Wang, Y.; Zhai, Z.; Xue, Y.; Duanmu, L. Characteristics of wind flow around a target building with different surrounding building layers predicted by CFD simulation. Build. Environ. 2021, 200, 107962. [Google Scholar] [CrossRef] [Scilit]
- Wijesooriya, K.; Mohotti, D.; Lee, C.-K.; Mendis, P. A technical review of computational fluid dynamics (CFD) applications on wind design of tall buildings and structures: Past, present and future. J. Build. Eng. 2023, 68, 106828. [Google Scholar] [CrossRef] [Scilit]
- Ramponi, R.; Blocken, B. CFD simulation of cross-ventilation for a generic isolated building: Impact of computational parameters. Build. Environ. 2012, 53, 34–48. [Google Scholar] [CrossRef] [Scilit]
- Norton, T.; Sun, D.-W.; Grant, J.; Fallon, R.; Dodd, V. Applications of computational fluid dynamics (CFD) in the modelling and design of ventilation systems in the agricultural industry: A review. Bioresour. Technol. 2007, 98, 2386–2414. [Google Scholar] [CrossRef] [Scilit] [PubMed]
- Boulard, T.; Wang, S. Experimental and numerical studies on the heterogeneity of crop transpiration in a plastic tunnel. Comput. Electron. Agric. 2002, 34, 173–190. [Google Scholar] [CrossRef] [Scilit]
- Ansys Inc. Ansys Fluent Theory Guide, Release 2024 R3; Ansys Inc.: Canonsburg, PA, USA, 2024. [Google Scholar]
- KS B 6311; Testing Methods for Industrial Fans. Korean Agency for Technology and Standards: Eumseong, Republic of Korea, 2022.
- Lee, I.B.; Lee, S.; Kim, G.; Sung, J.; Sung, S.; Yoon, Y. PIV verification of greenhouse ventilation air flows to evaluate CFD accuracy. Trans. ASAE 2005, 48, 2277–2288. [Google Scholar] [CrossRef] [Scilit]
- Woodruff, V.I. Analysis of Vent Designs for Naturally Ventilated Gutter-Connected Greenhouses Using FLUENT. Master’s Thesis, The Ohio State University, Columbus, OH, USA, 1997. [Google Scholar]
- Kim, J.Y. Effects of the Distance between Jet Fans on the Ventilation Performance in a Road Tunnel. KSFM J. Fluid Mach. 2011, 14, 25–30. [Google Scholar] [CrossRef] [Scilit]
- Lee, I.B.; Short, T.H. Two-dimensional numerical simulation of natural ventilation in a multi-span greenhouse. Trans. ASAE 2000, 43, 745–753. [Google Scholar] [CrossRef] [Scilit]
- Kacira, M.; Sase, S.; Okushima, L. Effects of side vents and span numbers on wind-induced natural ventilation of a gothic multi-span greenhouse. Jpn. Agric. Res. Q. 2004, 38, 227–233. [Google Scholar] [CrossRef] [Scilit]

Disclaimer/Publisher’s Note: The statements, opinions and data contained in all publications are solely those of the individual author(s) and contributor(s) and not of MDPI and/or the editor(s). MDPI and/or the editor(s) disclaim responsibility for any injury to people or property resulting from any ideas, methods, instructions or products referred to in the content. |
© 2026 by the authors. Licensee MDPI, Basel, Switzerland. This article is an open access article distributed under the terms and conditions of the Creative Commons Attribution (CC BY) license.