


Abstract
DC series arc faults (SAFs) are a significant safety hazard on the DC side of photovoltaic (PV) systems, with current signals characterized by strong randomness, obvious non-stationarity, and concealed fault features, posing challenges for rapid and accurate detection. With the development of application models such as agricultural PV integration, photovoltaic greenhouses, solar-powered irrigation, and livestock energy supply, the demand for the safe operation of photovoltaic systems in agricultural production scenarios is becoming increasingly prominent. To address the difficulty in fully characterizing the multi-scale dynamic features and local amplitude disturbances of DC SAF signals, this paper proposes a SAF detection method based on multi-scale generalized amplitude-aware permutation entropy (MS-GAAPE). The method extracts MS-GAAPE from arc current signals at various scales using sliding window-based generalized coarse-graining, which preserves temporal sequence information while improving the characterization of local amplitude variations. Particle swarm optimization (PSO) is applied to optimize these multi-scale features, strengthening fault-related information and reducing interference. The optimized features are then processed by a support vector machine (SVM) for SAF detection. The dataset used contains 50,000 samples covering transient conditions such as voltage fluctuations and is divided into a training set and an independent test set in a 70% to 30% ratio. The training set is utilized for feature parameter determination, feature weight optimization, and classification model construction, while the independent test set is reserved solely for final performance evaluation. Experimental results demonstrate that the proposed method achieves excellent detection performance under various operating conditions and load levels, with an accuracy of 99.32% and a total detection time of 103.62 ms, meeting the requirements of the UL1699B standard, thus showcasing strong real-time detection capability and potential for embedded implementation.
1. Introduction
With the development of application models such as agricultural PV integration, photovoltaic greenhouses, solar-powered irrigation, and aqua-photovoltaic systems, photovoltaic systems are gradually integrating into agricultural production systems and playing a significant role in scenarios including environmental control in facility agriculture, irrigation power supply, and electricity provision for aquaculture systems [1,2,3]. Relevant studies indicate that agricultural photovoltaic systems can enhance land use efficiency while enabling the synergistic optimization of agricultural production and the clean energy supply, thereby promoting the transition of agricultural systems toward low-carbon and intelligent development [4,5].
Compared to conventional ground-mounted photovoltaic power stations, agricultural PV systems typically operate in more complex environments involving coupled natural and engineering conditions. Greenhouses, farmlands, and livestock areas are subject to prolonged environmental stresses such as high temperature, high humidity, rain exposure, ultraviolet radiation, and dust accumulation, all of which accelerate the aging and degradation of PV modules and DC-side connection components [6,7]. Existing studies have shown that thermal stress can lead to reduced insulation performance in PV DC cables [8], moisture ingress may cause module corrosion and performance degradation [9], and connectors are prone to contact deterioration and increased resistance under humid and corrosive conditions [10]. These degradation processes gradually accumulate over long-term operation, potentially leading to poor contact and partial discharges, thereby increasing the likelihood of DC SAF.
Moreover, different loads in PV systems—such as inverters, DC-DC converters, and resistors—introduce varying degrees of current fluctuations, switching ripples, and transient disturbances, making the boundary between normal and fault conditions more complex.
This type of fault is characterized by strong and persistent arcing, insignificant changes in the fault current, and high concealment. It not only threatens the operational safety of PV systems themselves but may also pose fire risks to agricultural energy systems such as greenhouses, irrigation stations, and livestock facilities [11]. Therefore, accurately and rapidly detecting DC SAFs is crucial for ensuring the safe operation of agricultural photovoltaic systems.
Extensive research has been conducted on the representation of complex nonlinear time series. By introducing recurrence plots (RPs) and approximate entropy (ApEn) into signal analysis, the evolution patterns of time series in high-dimensional space are revealed through phase space reconstruction [12,13]. Some studies have proposed permutation entropy (PE) methods, characterizing the complexity of time series via the probability distribution of ordinal patterns, thus offering new insights for analyzing nonlinear and non-stationary signals [14]. Introducing multi-scale analysis into PE further demonstrates that dynamic changes at different time scales are crucial for fault identification [15]. Preprocessing and time–frequency decomposition of complex signals using techniques such as wavelet denoising (WD), wavelet packet decomposition (WPD), and discrete wavelet transform (DWT) indicate that noise suppression and local feature enhancement are essential prerequisites for improving arc detection performance [16,17,18]. In summary, existing methods still have certain limitations in terms of feature representation capability, adaptability to complex operating conditions, and robustness. Moreover, in agricultural PV application scenarios, these issues are further amplified, imposing higher demands on the robustness of fault detection methods.
The above agricultural photovoltaic application scenarios indicate that DC fault detection methods hold potential value for ensuring the safe operation of agricultural energy systems. However, from the perspective of detection method research itself, identifying DC SAF still primarily relies on the accurate characterization of the non-stationary features, local amplitude disturbances, and multi-scale dynamic changes in current signals. Therefore, this study is based on arc current signals collected from a laboratory PV test platform, focusing on feature extraction and intelligent recognition methods for DC SAF, and further discusses their applicability to agricultural PV applications. Nevertheless, systematic research on the signal characteristics and detection methods of DC SAF under agricultural PV operating conditions remains limited.
In research on DC SAF detection, previous studies have revealed through experimental analysis the voltage and current characteristics of DC arcs, as well as their random pulse patterns [19]. Researchers have conducted investigations from time-domain, frequency-domain, wavelet-domain, and pattern recognition perspectives, demonstrating that arc faults are distinguishable from normal conditions in terms of waveform abruptness and spectral distribution [20,21]. Further advancements have introduced permutation entropy, multi-feature fusion, and multi-input neural networks (MINNs) into arc identification [22,23]. In practical engineering applications, arc detection methods must not only accurately identify faults but also possess strong robustness against inverter noise, load fluctuations, and arc-like interference [24]. This indicates that although existing methods have evolved from simple threshold-based criteria to multi-feature fusion and intelligent recognition, they still face challenges in adequately expressing dynamic features and adapting to varying operating conditions for strongly random and weakly observable arc fault signals.
Multi-scale weighted permutation entropy (MWPE) and its improved methods can characterize signal complexity from the perspective of sequential patterns, but they mainly rely on ranking relationships and thus do not fully utilize local amplitude variations and short-term energy fluctuations in the arc current. Time–frequency analysis techniques such as wavelet packet decomposition (WPD) enable multiband signal decomposition; however, their feature stability is easily affected by the number of decomposition levels and threshold parameters. Under power electronic loads such as inverters and DC-DC converters, switching ripples, harmonics, and transient disturbances may further degrade their feature robustness. Intelligent models like the multi-input neural network (MINN) possess strong nonlinear modeling capabilities but typically require sufficiently abundant and consistently distributed training samples. Given the multiple loads, strong disturbances, and long-term outdoor operation conditions in agricultural photovoltaic systems, their generalization performance and embedded deployment complexity remain challenging. Therefore, for detecting SAF on the DC side of agricultural photovoltaic systems, it remains necessary to develop a method capable of simultaneously capturing changes in sequence patterns, amplitude disturbances, and multi-scale dynamic features, thereby enhancing detection robustness under complex operating conditions. Machine learning algorithms can model the complex nonlinear relationships between high-dimensional fault features and fault types [25], so using them as classifiers can positively enhance detection performance.
To address the limitation of traditional permutation entropy in capturing amplitude variations, researchers have proposed weighted permutation entropy (WPE) [26], which extends the unified representation method for complex signals from a fused entropy perspective [27]. Arc fault currents not only exhibit pattern disturbances but also involve significant amplitude fluctuations and local energy abrupt changes; thus, relying solely on traditional PE is insufficient to fully reflect their fault characteristics [28]. Based on this, this paper proposes MS-GAAPE for feature extraction of DC series arc currents, aiming to enhance the ability to characterize multi-scale dynamic changes and amplitude disturbances, thereby improving the accuracy and robustness of DC SAF detection under complex operating conditions.
The contributions of this paper can be divided into the following three aspects:
- An MS-GAAPE feature extraction method is proposed. To address the insufficient representation of complex arc current signals by amplitude-aware permutation entropy under single-scale analysis, a scale sequence is constructed within a multi-scale framework, and normalized amplitude-aware permutation entropy is calculated at each scale to form a multi-scale entropy feature vector. Considering that abrupt changes and fluctuation-enhanced characteristics in DC series arc currents are likely to weaken during scale transformation, this study employs a sliding-window-based generalized coarse-graining strategy during the scale sequence generation stage, enabling the scale representation to simultaneously capture local amplitude levels and local fluctuation intensity, thereby constructing an MS-GAAPE feature.
- A multi-scale feature weighting method based on particle swarm optimization is proposed. To address the inconsistent contributions of entropy features at different scales to arc fault identification, the particle swarm optimization algorithm is utilized to allocate weights to the MS-GAAPE features, thereby enhancing the scale features sensitive to the fault state and reducing the influence of redundant and interfering features on the identification results, thus improving the representation capability of multi-scale features.
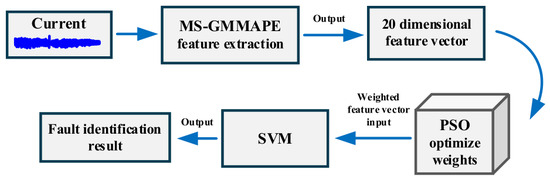
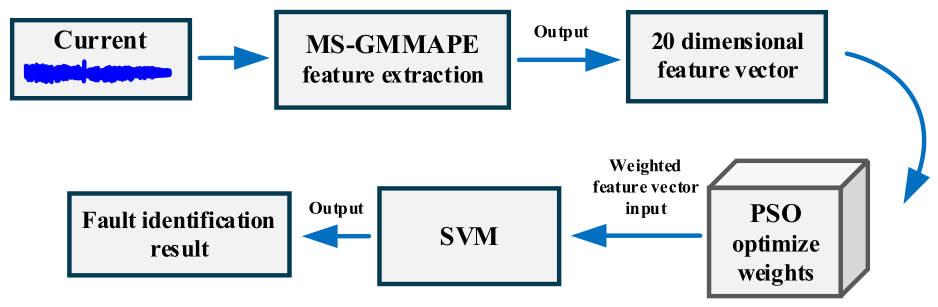
- A SAF detection framework based on MS-GAAPE, PSO and SVM is proposed, as shown in Figure 1. This method first extracts the MS-GAAPE features from the current signal, then uses the particle swarm optimization algorithm to optimize the feature weights, and finally inputs the optimized features into the SVM classifier to achieve arc fault recognition and output the detection results. The experimental results show that the detection accuracy of the proposed method can reach 99.32%, verifying its effectiveness in arc fault recognition and providing a foundation for subsequent validation in agricultural photovoltaic scenarios.Figure 1. Flowchart of the SAF detection process.
2. Methods
DC SAF currents typically exhibit random fluctuations, local abrupt changes, and multi-scale non-stationary variations. Extracting stable and discriminative features from such complex current signals is crucial for accurate fault identification. To address this need, this section first introduces the fundamental principles of PE and analyzes its limitations in characterizing amplitude disturbances. Subsequently, an MS-GAAPE feature is constructed to simultaneously capture sequence pattern variations, local amplitude fluctuations, and multi-scale dynamic information. Building upon this, PSO is introduced to weight the multi-scale features, followed by SVM for fault classification. The related theoretical framework lays the foundation for subsequent parameter settings and experimental analysis.
2.1. Permutation Entropy
Let the time series be denoted as , where N represents the length of the sequence. Given the embedding dimension m and time delay , the i-th embedded vector is constructed as follows:
Here, the number of valid embedded vectors is given by
Sort the elements of the embedded vector in ascending order. If the sorted sequence satisfies the following condition
then the corresponding sequence pattern is denoted as
This is essentially a permutation of . In the case of equal elements, the determination is made in accordance with the chronological order of the original time indices. For a given embedding dimension m, there are theoretically distinct m!-order patterns. Let the j-th order pattern be denoted as and its occurrence count as ; then, the corresponding occurrence probability is given by
and the PE is defined as
When , it is stipulated that .
To eliminate the influence of different embedding dimensions m on the scale of entropy values, the permutation entropy is usually normalized as follows:
The normalized PE satisfies
The larger the value, the more evenly distributed the sequence pattern, and the stronger the randomness of the time series; conversely, a lower value indicates that the time series has stronger regularity.
PE is based on statistical relationships to construct the complexity index, and it has strong adaptability to nonlinearity and noise. However, this method mainly relies on the order pattern distribution and does not explicitly utilize the amplitude information of the signal. When signals have similar order structures but significantly different amplitude fluctuation intensities, PE may have difficulty distinguishing them, thereby affecting its discriminative ability in the identification of amplitude mutation-type faults.
2.2. Multi-Scale Generalized Amplitude-Aware Permutation Entropy
PE mainly describes the complexity of a time series by statistically analyzing the occurrence probability of different order patterns. Its advantage lies in its ability to depict the changes in the local sorting structure of the sequence. However, in the calculation process, PE only utilizes the relative size relationship and does not consider the differences in the degree of amplitude fluctuation under the same order pattern. When there are phenomena such as amplitude jumps and enhanced local oscillations occurring in the arc fault current, relying solely on the frequency of order patterns may not be sufficient to fully reflect the impact of signal amplitude changes on the fault state. Therefore, in this paper, an amplitude dispersion weight is introduced into the order pattern statistical framework of PE and is further combined with the multi-scale generalized coarse-graining process to construct MS-GAAPE. This method is used to extract the multi-scale complexity features of arc current signals, specifically involving three steps: signal segmentation, multi-scale construction, and entropy calculation.
Based on the i-th embedded vector constructed in Equation (1), its local mean is defined as
The local amplitude dispersion is
where is used to describe the degree of dispersion of each element within the embedded vector relative to the local mean. Compared with merely counting the occurrence times of the sequence pattern, can reflect the differences in the fluctuation intensity of different amplitudes under the same sequence pattern. To adjust the influence of amplitude dispersion on the statistics of sequence patterns, the amplitude adjustment factor is introduced, and is used to weigh the count of sequence patterns. When , , and at this time, the weighted count degenerates into the standard frequency statistics in PE; when , the greater the amplitude dispersion of the embedded vector, the higher the weight it holds in the probability estimation. From a physical perspective, β reflects the strength with which local amplitude fluctuations modulate the probability distribution of the sequence pattern. For SAF currents, the arcing process is typically accompanied by local amplitude abrupt changes, enhanced random oscillations, and short-term energy fluctuations; therefore, appropriately increasing β helps improve the MS-GAAPE’s responsiveness to fault-sensitive amplitude disturbances.
Let the weighted count of the j-th order pattern be :
Construct the weighted sequential pattern probability distribution by :
The amplitude-aware permutation entropy is
To eliminate the differences in the maximum entropy values caused by different embedding dimensions m, the normalized form is adopted:
The probability distribution constructed by Equation (12) satisfies the normalization constraint:
Through the above amplitude weighting processing, the probability of sequence patterns is not only related to their occurrence frequency but also to the local amplitude dispersion of the corresponding embedded vectors, thereby enhancing the entropy value’s sensitivity to amplitude fluctuations. However, this process is still completed under a single time scale, while arc fault currents typically contain multi-scale dynamic components such as short-term impulses, local oscillations, and slow evolutions. If the entropy value is calculated only on the original scale, it is easy to overlook the differences in fault features at different time scales. Compared to traditional single-scale entropy methods, multi-scale analysis can characterize the dynamic variations in the arc current at different time scales. DC SAF currents typically contain instantaneous transients, local oscillations, and relatively slow amplitude fluctuations simultaneously; calculating entropy solely at the original scale is insufficient to fully capture these complex non-stationary features.
Therefore, this paper further introduces a multi-scale generalized coarse-graining process to construct scale sequences that characterize the local amplitude level and fluctuation intensity at different scales.
Given the scale factor s, take a sliding segment of length s at position i, denoted as . The local mean is defined as
Define the local standard deviation as
Construct the generalized coarse-graining sequence at scale s:
where reflects the local amplitude level within the scale window, and reflects the local fluctuation intensity. The generalized coarse-grained sequence formed by the fusion of the two can simultaneously preserve the amplitude variation trend and local fluctuation information of the current signal during the scale transformation process. Compared with the traditional non-overlapping coarse-graining method, this paper adopts a sliding window to construct the scale sequence, keeping the sequence length at scale s as . Thus, when the scale increases, it can still retain a relatively sufficient number of sequence pattern samples, providing a more stable statistical basis for subsequent entropy estimation.
Under scale s, the generalized coarse-grained sequence is subjected to normalized amplitude-aware permutation entropy, and the scale entropy is defined as
For each scale in the scale set , calculate it step by step to obtain the multi-scale generalized amplitude-aware permutation entropy feature vector:
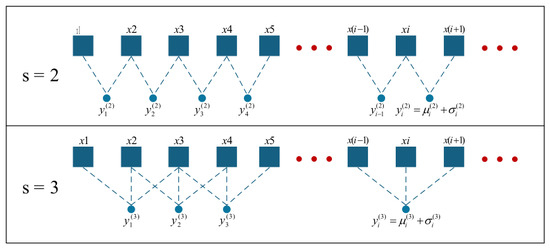
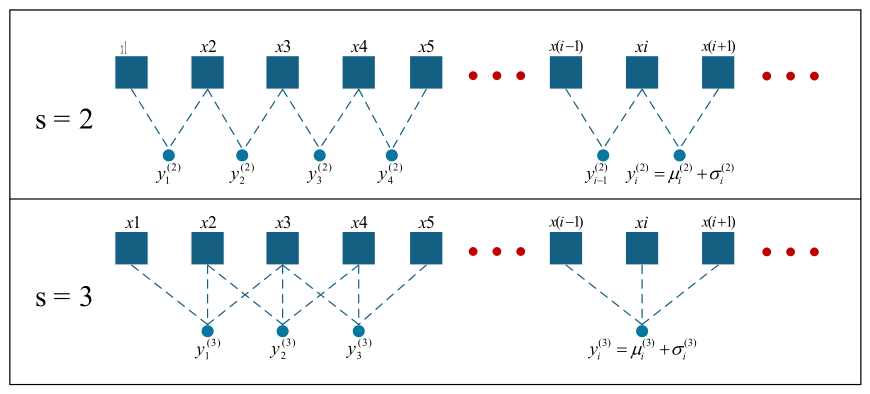
Unlike averaging or empirically concatenating the multi-scale entropy values, this paper retains each scale entropy value as an independent feature component, as shown in Figure 2, to enable the differentiated utilization of scale information in subsequent discriminative learning and to provide a structural basis for the weighted optimization of the scale contribution.
Figure 2.
Construction mode of MS-GAAPE.
Figure 2 further illustrates the construction process of the generalized coarse-grained scale sequences proposed in this paper. Unlike traditional multi-scale coarse-graining methods that typically use non-overlapping segment averaging, this study employs a sliding window approach to generate local sequences at different scales, while simultaneously incorporating both the local mean and the local standard deviation to construct scale representations. This method effectively preserves the local amplitude levels and fluctuation characteristics of the original current signal during scale expansion, thereby reducing the loss of fault-sensitive information during the scaling transformation. Based on this, the generalized coarse-grained sequences obtained at different scales are used for amplitude-aware permutation entropy calculations, ultimately forming the MS-GAAPE multi-scale feature vector.
In summary, MS-GAAPE enhances the representation capability for direct current SAF currents in feature construction through three main aspects. First, by introducing a local amplitude dispersion weight into the symbolic pattern probability estimation, the entropy value is extended from a simple frequency count of symbolic patterns to a joint representation that considers both the sequence structure and the intensity of amplitude fluctuations. Second, a sliding window-based generalized coarse-graining method is adopted in scale sequence generation, incorporating both the local mean and the local standard deviation into the scale representation, thereby reducing the loss of local amplitude disturbances and fluctuation information during the scaling process. Third, entropy values at each scale are preserved as independent feature components, providing a structured multi-scale feature input for subsequent scale contribution weighting and classification discrimination. Consequently, MS-GAAPE can more effectively capture the characteristics of symbolic pattern disturbances, local amplitude abrupt changes, and multi-scale non-stationary fluctuations in direct current SAF currents. The features extracted by this method will serve as input for the subsequent classification model.
2.3. Particle Swarm Optimization
The contribution levels of multi-dimensional features in fault discrimination often vary significantly. If equal weights are assigned to each feature component, it is easy to weaken the features with stronger discrimination capabilities, thereby affecting the overall classification performance. To address this issue, introducing a feature weighting mechanism to construct different components differently can help highlight key information and suppress redundancy, thereby enhancing the overall discriminative power of the feature space.
2.3.1. The Principle of the Particle Swarm Optimization Algorithm
PSO is a continuous parameter optimization method based on group collaborative search, which is suitable for optimizing objective functions without gradient information. Since the multi-scale entropy feature weights are continuous variables and the mapping relationship between them and the classification performance is difficult to construct explicitly, this paper adopts PSO to optimize the weights of the features, thereby enhancing the discriminative ability of the feature space, improving the generalization performance of the classifier, and avoiding overfitting.
PSO achieves global optimization through the iterative update of particles in the search space. Let the position vector and velocity vector of the i-th particle in the t-th iteration be represented by and respectively. The iterative update relationship of their positions and velocities can be expressed as
where represents the historical optimal position of the i-th particle, and represents the historical optimal position of the group; is the inertia weight, which is used to balance the global search and local search capabilities; and are acceleration factors; and is an independent random number.
2.3.2. Multi-Scale Feature Weight Optimization Based on PSO
Let the MS-GAAPE feature vector of the n-th sample be , where S represents the number of scales. Stacking all the feature vectors of the samples row by row forms the feature matrix:
Let be the sample size. The scale weight vector is defined as
Weight each column of the feature matrix to obtain the weighted feature representation:
Based on the weighted feature representation, the fitness function of the weight vector is defined as
where represents the classification accuracy function. PSO can optimize the search for the optimal weight vector , assigning higher weights to scale features that contribute significantly to SAF identification while reducing the weights of those with weaker classification contributions or greater susceptibility to disturbances, thereby enhancing the discriminability of the weighted feature space.
In this study, the parameter settings of the PSO affect the convergence speed and search stability during feature weight optimization. The particle swarm size is set to 30, the maximum number of iterations to 50, the inertia weight to 0.7, and both the individual and social learning factors to 1.5. This configuration ensures a strong search capability within a limited-dimensional, multi-scale feature weight space while avoiding excessive computational overhead caused by overly large swarm sizes or iteration counts. The weight vector optimization process is performed solely based on the training set. For a given weight vector, the MS-GAAPE features of training samples are first weighted at each scale, and the weighted features are then fed into an SVM classifier. The internal validation results on the training set serve as the fitness evaluation criterion for PSO. Through iterative searching, PSO identifies optimal scale weights that enhance fault-sensitive scales while reducing the impact of redundant scales on classification performance. The independent test set does not participate in the weight optimization process but is used only after the final model is determined for performance evaluation. The optimized feature weight parameters are used to enhance feature representation and are then fed into the classification model.
2.4. Support Vector Machine
SVM is a widely used classification algorithm in supervised learning, suitable for handling nonlinear classification problems. In the task of arc fault identification, due to the nonlinear distribution of multi-scale entropy features among different categories, traditional linear models may not be able to effectively distinguish between various categories. This paper adopts the SVM classification algorithm and selects the Radial Basis Function (RBF) kernel function to capture the nonlinear relationships in the feature space, thereby improving classification accuracy. This method is used to classify and identify arcs from normal conditions.
The feature weight vector obtained by PSO corresponds to the weighting of multi-scale features. The weighted feature vector of the n-th sample is given by the following formula:
where denotes the original feature vector of the n-th sample, and represents the element-wise product operation. The weighted features of all samples constitute the feature matrix :
where denotes the number of samples.
To handle the nonlinear relationships in the weighted features, this paper adopts the RBF of SVM. The expression of the RBF kernel function is
where γ denotes the parameter of the kernel function, which governs the range of influence between data points. By selecting an appropriate value for γ, the SVM can effectively capture the nonlinear relationships among the weighted features.
The classification task of SVM is to find an optimal hyperplane in the feature space to maximize the class interval and minimize the classification error. In model evaluation, cross-validation is used to calculate the classification accuracy. Let be the classification error rate; then, the classification accuracy is derived from the following formula:
During the optimization process, PSO continuously adjusts the weight vector to achieve the highest classification accuracy of the weighted feature matrix in the SVM classification model, thereby enhancing the performance of arc fault identification.
The classification performance of SVM is jointly influenced by the kernel function type, penalty factor C, and kernel parameter γ. Considering the potential nonlinear mapping relationship between MS-GAAPE weighted features and fault categories, this study employs an RBF kernel function to construct the SVM classifier. To avoid performance bias caused by subjective parameter settings, a cross-validation grid search is performed on C and γ based solely on the training set, where , . According to the cross-validation results on the training set, the final selected parameters are and . This parameter combination maintains high classification accuracy while preventing overfitting to training samples that could result from excessively large penalty factors or kernel parameters. The test set is used solely for final performance evaluation and does not participate in the SVM parameter selection process. The model output is used for the final fault identification result.
2.5. Experimental Data Collection
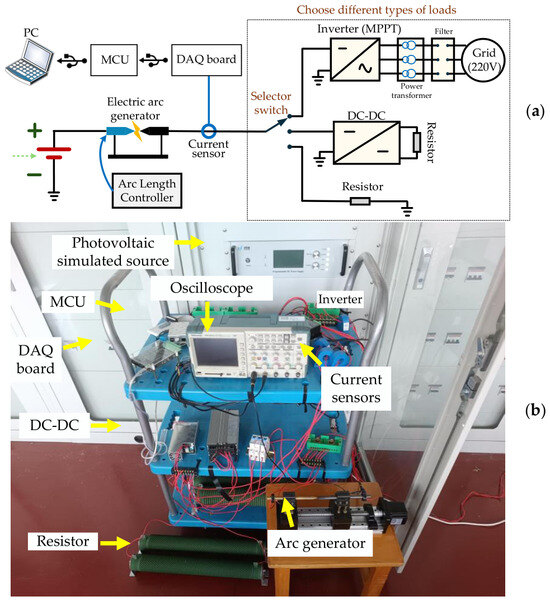
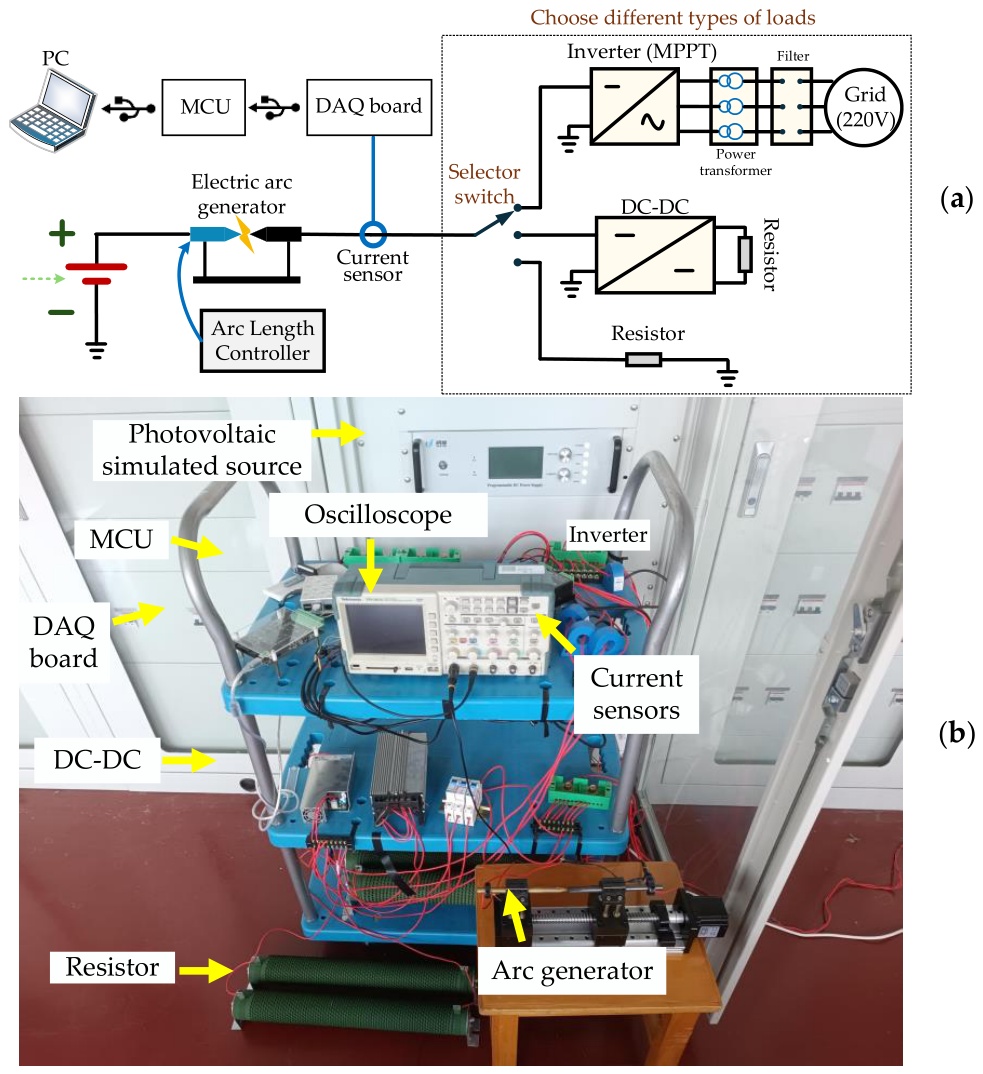
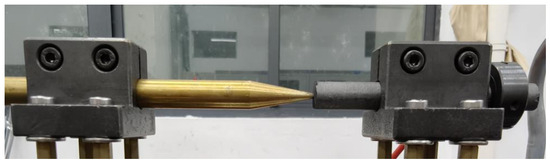
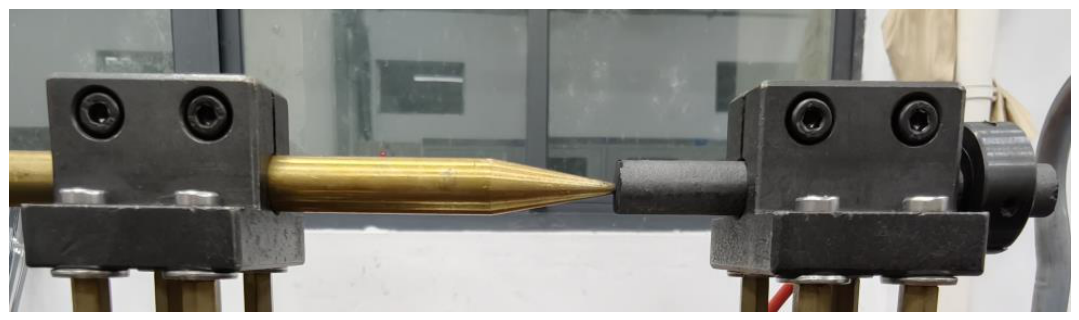
To verify the performance of the proposed SAF detection method, an experimental platform was built, as shown in the schematic diagram and actual platform in Figure 3. The experimental platform mainly consists of a photovoltaic simulation power supply, an arc generation device, a load unit, a current acquisition module, and a data acquisition and analysis system. As shown in Figure 3b, the PV simulation source can power three types of loads: an inverter (Yan Xu YXMG-SGA05), a DC-DC converter, and a resistor. In this study, a series arc is generated using an arc generation device with a two-electrode separation method. As illustrated in Figure 4, the two electrodes are made of a carbon rod and a copper rod, respectively, with the carbon rod having a flat end and the copper rod a pointed end. At the beginning of the experiment, the two electrodes are in direct contact to simulate the conductive state in a photovoltaic DC circuit when connectors loosen, contacts degrade, or conductors experience partial intermittent contact. When the fault is triggered, a motor controls the separation of the electrodes at a speed of 5 mm/s, with an arc gap set to approximately 1.1 mm, thereby creating a series arc within the DC circuit. The experimental voltage range is set between 50 and 400 V and the current range between 2 and 17 A to cover the DC-side output range of the laboratory PV testing platform under various electrical operating conditions. The current sensor transmits the acquired current signal to the microcontroller unit (MCU) via a data acquisition (DAQ) board for storage, and a PC can access the MCU to download the stored data. The algorithm in this paper was implemented using MATLAB R2023b, with the programming environment running on a Windows 11 operating system, an Intel Core i5 CPU, and 32 GB of RAM. The MCU is equipped with a Cortex-A72 CPU and 4 GB of RAM. The above hardware and software configuration provides a reliable experimental validation and implementation foundation for the DC SAF detection method proposed in this paper.
Figure 3.
Experimental platform: (a) Schematic diagram; (b) Actual platform.
Figure 4.
Arc generation device.
From the perspective of computational complexity, the method proposed in this paper mainly consists of two parts: feature extraction and classification. The MS-GAAPE feature extraction is primarily based on statistical calculations and entropy computation within sliding windows, making the process relatively simple. The SVM classifier is a typical lightweight machine learning model with low computational complexity in its decision-making process. Therefore, the overall algorithm incurs a low computational overhead.
This platform is primarily used to validate the detection performance of the proposed method in PV DC circuits, with its load configuration capable of reflecting current variation characteristics under different power electronic devices and resistive load conditions. However, factors such as outdoor environmental exposure, equipment aging, complex cable routing, and load fluctuations from agricultural electrical equipment in agricultural PV systems still require further verification through on-site testing combined with actual operational data.
Based on the constructed experimental platform, a total of 50,000 current signal samples were collected under three different load types for subsequent feature analysis and fault identification research. Each sample consists of 1024 consecutive sampling points, serving as the basic input unit. During the sample construction phase, a fixed-length truncation method was employed to avoid generating duplicate or highly similar samples, ensuring the independence of the training and testing sets. Table 1 presents the operating conditions corresponding to the dataset. The dataset was divided into a training set and an independent test set using stratified random sampling, with approximately 70% of the samples allocated for training and 30% reserved for final testing. PSO-based feature weight optimization and SVM training were performed exclusively on the training set, while the test set was used solely for final performance evaluation. The training and test sets were strictly independent, and no test data was used during the training process to prevent data leakage. The sliding window mentioned in the MS-GAAPE feature extraction process is applied only within a single 1024-point sample, used to compute local means and local standard deviations at multiple scales for constructing the scale sequence.
Table 1.
The experimental conditions corresponding to the dataset.
During the experiment, the data acquisition system operated at a sampling frequency of 100 kHz to effectively capture the rapid current fluctuations associated with arc faults. All experiments were repeated multiple times under the same parameter settings, and the average results were taken as the final performance metric to improve stability. To validate the method’s adaptability under actual operating conditions, the collected data included not only steady-state operation samples but also non-fault disturbances such as system transient fluctuations, thereby enhancing the dataset’s representativeness of real-world operating conditions.
3. Results
Current signals under different loads and operating conditions are collected using the established experimental platform, and parameter selection, analysis of detection results, and comparative experiments based on these data are conducted. By evaluating metrics such as detection accuracy, false alarm rate, missed detection rate, feature extraction time, and comparison results among different methods, the fault identification capability and real-time performance of the proposed method under complex operating conditions are comprehensively assessed.
3.1. Parameter Selection and Analysis
The calculation of MS-GAAPE involves five parameters: the length of the time series N, the embedding dimension m, the time delay τ, the scale factor s, and the amplitude adjustment factor β. The values of these parameters will directly affect the ability of the entropy feature to describe the dynamic characteristics of the signal, as well as the accuracy and computational complexity of SAF detection.
The time delay τ determines the sampling interval between adjacent elements in the embedding vector. The time-series length N, embedding dimension m, and time delay τ all affect the calculation of permutation entropy and its application performance [29]. Considering that direct current series arc currents exhibit characteristics of short-term abrupt changes and local oscillations, this study sets τ = 1 to preserve local dynamic variations between adjacent samples and avoid weakening the representation capability for short-term impulsive components due to larger delay intervals.
The scale factor s determines the range of time scales covered in the multi-scale analysis. A small scale limits the ability to capture slowly evolving information of fault currents, while an excessively large scale reduces the effective length of the coarse-grained sequence and decreases the stability of entropy estimation. Previous studies have indicated that the variance of multi-scale permutation entropy estimation is related to the scale factor, and uncertainty in entropy estimation may increase as the scale increases [30]. Therefore, this paper compares s = 10, s = 20, and s = 30, balancing multi-scale information representation with computational cost and entropy estimation reliability. Results show that when s = 10, feature extraction takes 51.81 ms, but the average detection accuracy is only 86.49%; when s = 30, accuracy improves to 99.59%, but feature extraction time increases to 163.88 ms, significantly increasing computational overhead. In contrast, at s = 20, the accuracy reaches 99.32% with a feature extraction time of 102.25 ms, achieving a good balance among detection precision, entropy estimation stability, and computational efficiency. Thus, the maximum scale factor is set to 20 in this study.
The time-series length N affects the effective sample size available for ordinal pattern statistics, thereby influencing the stability and computational cost of permutation entropy-based features [31]. To determine an appropriate window length, this study further compares feature extraction time and detection accuracy under three settings: N = 512, N = 1024, and N = 2048. Experimental results show that when N = 512, the data window per sample is too short, resulting in insufficient samples for ordinal pattern analysis, with an average detection accuracy of only 64.70%. Although the feature extraction time is low at 54.93 ms, it fails to meet fault identification requirements. When N = 2048, the average detection accuracy improves significantly to 99.56%, but the feature extraction time increases substantially to 464.76 ms, leading to high computational cost and making it unsuitable for online detection. In contrast, the proposed setting of N = 1024 achieves an average detection accuracy of 99.32% with a feature extraction time of 102.25 ms. This configuration provides sufficient sample support while capturing short-term fluctuations in arc fault currents, achieving a good balance between recognition accuracy and computational efficiency. Therefore, N = 1024 is ultimately adopted in this study.
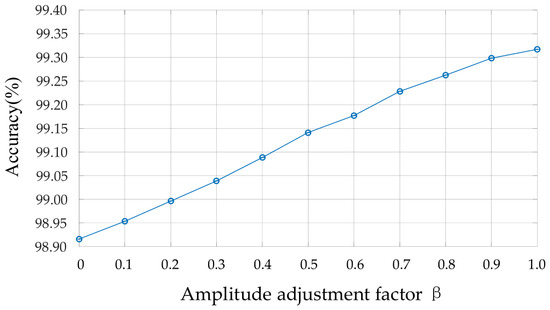
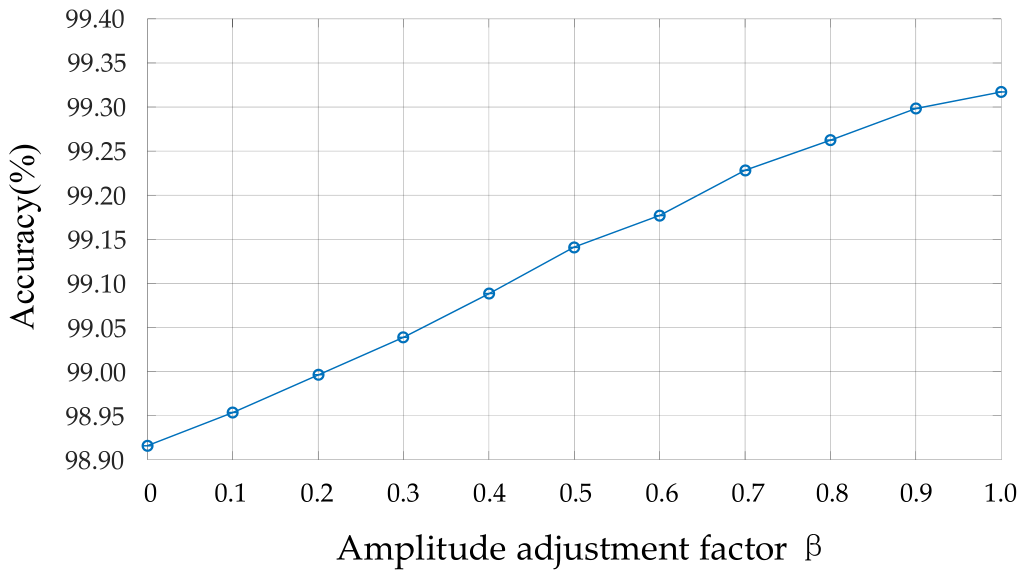
The amplitude adjustment factor β controls the influence of local amplitude dispersion on ordinal pattern probability estimation. When β = 0, amplitude dispersion has no regulatory effect on ordinal pattern probability estimation; as β increases, segments with stronger amplitude fluctuations contribute more significantly to entropy estimation. To further analyze the impact of β on the discriminative capability of MS-GAAPE features, this study evaluates β at intervals of 0.1 within the range [0, 1] and compares the SAF detection performance under different β values.
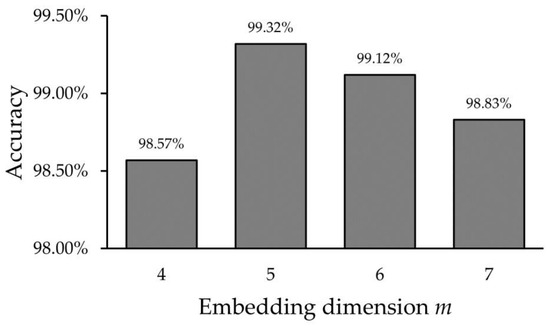
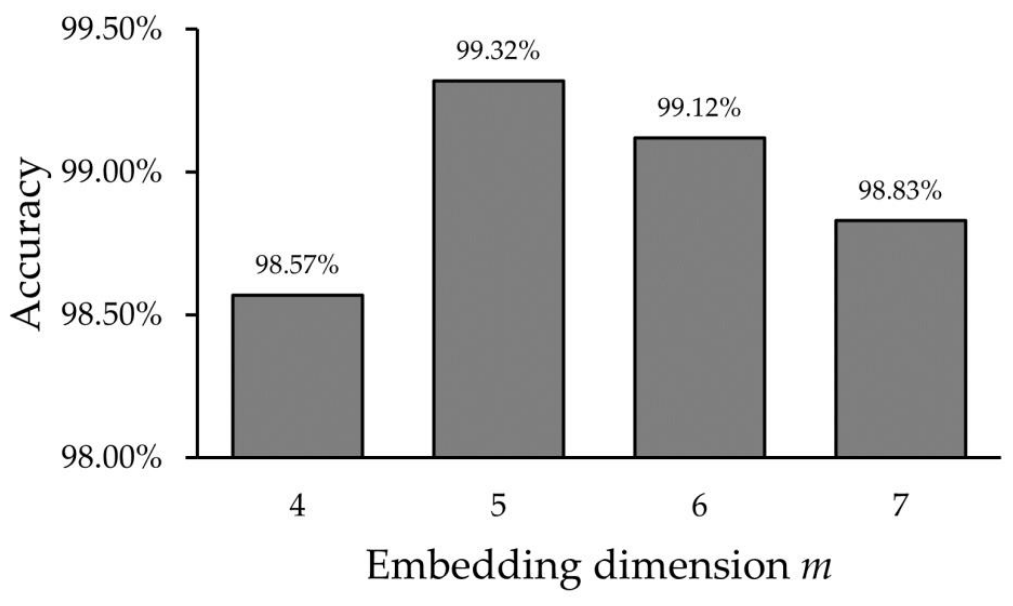
The embedding dimension m determines the size of the ordinal pattern space, which significantly affects the final MS-GAAPE. If m is too small, the number of ordinal patterns is limited, making it difficult to fully capture the dynamic structural characteristics of the signal, resulting in similar entropy distributions across different operating conditions at multiple scales and insufficient discrimination ability. Conversely, when m is too large, the ordinal pattern space expands rapidly, leading to statistical insufficiency under limited sample lengths, causing increased entropy fluctuations and reduced stability at certain scales. To investigate the impact of the embedding dimension m on the algorithm, arc current fault signals are used as the analysis signal. The value of m is set to 4, 5, 6, and 7, respectively, for computing the MS-GAAPE.
Figure 5 shows the detection accuracy under different amplitude adjustment factors β, with all other parameters kept constant in this experiment. The results indicate that as β increases, the overall detection accuracy rises and reaches its peak at β = 1. In the collected DC series arc current signals, amplitude dispersion serves as crucial information for distinguishing between normal operation and SAF conditions. Since SAF are often accompanied by local amplitude jumps, enhanced random oscillations, and short-term energy fluctuations, a larger β can increase the contribution of these amplitude disturbance segments in the sequence pattern probability estimation, enabling MS-GAAPE to better capture fault-sensitive features. Therefore, β = 1 is ultimately selected in this study.
Figure 5.
Detection accuracy corresponding to different amplitude adjustment factors.
Figure 6 shows the arc fault detection accuracy under different embedding dimensions m. As m increases, the detection accuracy exhibits slight fluctuations. When m = 4, the average detection accuracy reaches 98.57%, with a feature extraction time of 94.41 ms, indicating that a smaller symbolic pattern space struggles to fully capture the complex dynamic characteristics of fault signals. At m = 5, the average detection accuracy improves to 99.32%, and the feature extraction time is 102.25 ms. Further increasing the embedding dimension to m = 6 and m = 7 results in detection accuracies of 99.12% and 98.83%, respectively, while the feature extraction time significantly increases to 189.17 ms and 497.55 ms.
Figure 6.
Detection accuracy corresponding to different embedding dimensions.
A statistical analysis of the detection accuracy under different embedding dimensions was further conducted based on results from 30 repeated experiments. The results indicate that there is no statistically significant difference in detection performance between m = 5 and m = 6 (p > 0.05), suggesting that increasing the embedding dimension further does not lead to a notable improvement in performance, while the computational cost increases significantly. In contrast, m = 5 achieves lower computational overhead without sacrificing high detection accuracy. For the 1024-point sampling window used in this study, m = 5 corresponds to 5! = 120 sequence patterns, providing a good balance among feature discrimination capability, statistical stability, and real-time computational efficiency. Therefore, m = 5 is ultimately selected in this work.
3.2. Experimental Results of the Proposed Method
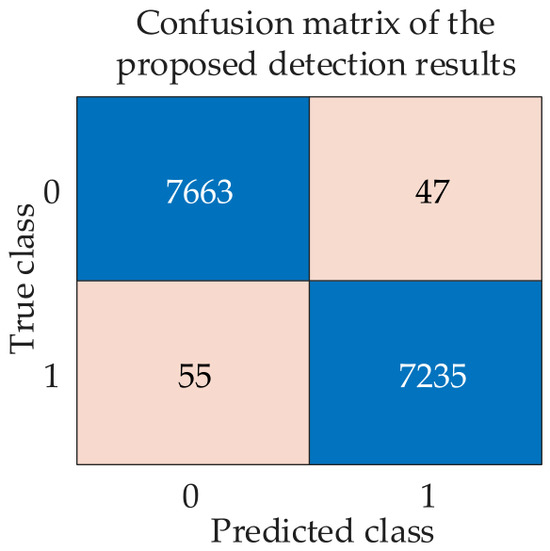
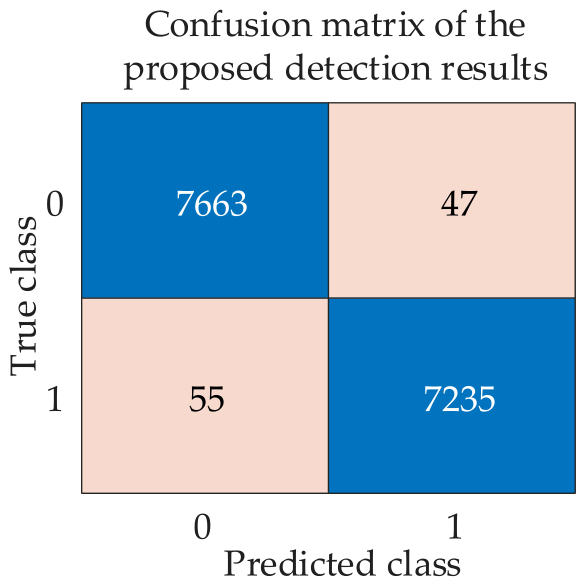
This paper collects data under different laboratory experimental conditions to evaluate the performance of the proposed method. The detection results are shown in Table 2. The overall detection accuracy reached 99.32% (14,898/15,000), with a normal condition detection accuracy of 99.39% (7663/7710) and an SAF condition detection accuracy of 99.25% (7235/7290). To further evaluate the reliability of the proposed method in practical arc fault detection, a confusion matrix was constructed based on the test results, as shown in Figure 7. In this matrix, label 0 represents the normal condition and label 1 represents the SAF condition. The results show that 7663 normal condition samples were correctly identified, and 7235 SAF condition samples were correctly detected, with a false positive rate of 0.61% and a missed detection rate of 0.75%. The low false positive and missed detection rates indicate that the proposed method not only achieves high overall detection accuracy but also performs well in suppressing false alarms and reducing missed fault detections. This method not only accurately detects SAF but also effectively suppresses false positives under normal operating conditions. Since SAF induces complex and random fluctuations in current signals, its detection accuracy is lower than that under normal conditions, indicating an increased difficulty in fault detection.
Table 2.
The detection results of this method under different detection conditions.
Figure 7.
Confusion matrix of the detection results using the proposed method.
The results show that the detection performance of the model varies under different load types. Under normal operating conditions, the detection accuracy for resistive loads is the highest, followed by inverter loads, and DC-DC converter loads have relatively lower accuracy. A similar trend is observed under SAF conditions. The possible reason for this is that resistive loads, being linear loads, have relatively stable current waveforms, and the feature differences between fault and non-fault states are more easily captured by the model. In contrast, inverters and DC-DC converters are switching power electronic loads, and the high-frequency switching process introduces harmonics, ripples, and electromagnetic interference, making the signal features more complex. Especially under SAF conditions, the random fluctuations caused by the arc couple with the switching noise and control dynamic processes of the converter itself, further increasing the difficulty of fault identification.
3.3. Performance Comparison of Different Feature Extraction Methods
The performance of the feature extraction method proposed in this paper was compared with that of five different feature extraction methods. The features obtained based on different feature extraction methods were input into the SVM to obtain the detection results. It should be noted that in order to compare the stability and robustness of various feature extraction methods, each method was executed 30 times. In each repeated experiment, the training and test sets were constructed according to the data partitioning method described in Section 2.5, with the training set containing 35,000 samples and the test set containing 15,000 samples. All methods were compared under identical data partitioning conditions. Subsequently, the average detection accuracy and the standard deviation of the detection accuracy of different feature extraction methods were calculated.
Feature extraction method PF1 [15]: PF1 employs the classic nonlinear feature extraction method PE, which extracts the complexity and regularity of the signal by sorting and statistically analyzing the time series. The parameters are set with an embedding dimension of 5, a delay time of 1, and a maximum scale factor of 20, thereby verifying the effectiveness of the proposed method.
Feature extraction method PF2 [28]: PF2 introduces weighted amplitude dispersion through AAPE, making this method more sensitive to signal amplitude changes and capable of handling signals with significant amplitude variations. The amplitude adjustment factor, with a value range of [0, 1], is set at 0.5.
Feature extraction method PF3 [32]: PF3 performs feature extraction based on MWPE. It introduces amplitude weighting on the basis of the traditional method, incorporating the amplitude information of the time series into the statistics of the sequence patterns.
Feature extraction method PF4 [33]: PF4 constructs a feature vector by extracting the variance (Var), pulse factor (PUF), and kurtosis factor (KF) of the current signal, which reflect the intensity of signal fluctuation, the instantaneous change in the signal, and the peak characteristics of the signal, respectively.
Feature extraction method PF5 [34]: PF5 constructs feature vectors based on peak frequency (PF), root mean square frequency (RMSF), and frequency standard deviation (FSD), which reflect the main frequency components of the signal, the overall frequency distribution of the signal, and the volatility of the signal’s frequency components, respectively.
Table 3 presents the performance of the proposed feature extraction method and five comparative feature extraction methods (PF1, PF2, PF3, PF4, and PF5), including average detection accuracy, precision, recall, F1-score, standard deviation of accuracy (Std), and significance level analysis (p-value vs. MS-GAAPE) between MS-GAAPE and each comparison method. To further verify whether the performance improvement of the proposed method over the comparison methods is statistically significant, we conducted a Wilcoxon rank-sum test using the sequences of detection accuracies obtained from 30 repeated experiments, with a significance level set at 0.05.
Table 3.
Performance under different feature extraction methods.
The table shows that MS-GAAPE outperforms other methods in terms of precision, recall, and F1-score, indicating that the proposed method has advantages in preventing false alarms and ensuring accurate identification of faulty samples. Compared to the traditional single-scale method, PF1, MS-GAAPE achieves an average detection accuracy improvement of 2.45%, with a standard deviation of only 0.08%, demonstrating superior performance in both accuracy and stability. PF3 has an average detection accuracy of 98.25%, the closest to MS-GAAPE, but its standard deviation is 0.18%, still higher than that of MS-GAAPE, suggesting slightly inferior stability. PF2 achieves an average detection accuracy of 97.83%, which is higher than PF1, PF4, and PF5, yet remains lower than MS-GAAPE. PF1 and PF5 have average detection accuracies of 96.87% and 96.38%, respectively, showing a certain detection capability but generally modest overall performance. PF4 has the lowest average detection accuracy at 95.06%, indicating relatively weak performance on the current task.
In terms of feature extraction time, MS-GAAPE takes 102.25 ms, which is higher than other methods, indicating it has no computational advantage. PF5 and PF4 have the shortest feature extraction times at 1.98 ms and 2.54 ms, respectively, but their average accuracies are relatively low (96.38% and 95.06%), suggesting they are fast yet underperforming. PF3 requires 79.37 ms for extraction, which is longer in duration, but achieves an accuracy of 98.25%, demonstrating a reasonable balance between performance and computational cost.
According to the Wilcoxon rank-sum test results in Table 3 (p-value vs. MS-GAAPE), the differences in detection accuracy between MS-GAAPE and each of the comparison methods are statistically significant (p < 0.02), indicating that the performance improvement of the proposed method is statistically supported.
It is evident that the PF method performs excellently in terms of accuracy, precision, recall, F1-score, and stability, indicating that MS-GAAPE effectively captures the multi-scale non-stationary characteristics of complex arc current signals. In terms of feature extraction time, PF is relatively slower but enhances feature representation capability. For subsequent engineering applications, PSO-based feature weight optimization and SVM model training can be completed offline, while the main computational load during actual detection lies in the MS-GAAPE feature extraction and SVM classification processes. The storage requirements mainly include the current signal window, multi-scale feature vectors, optimized feature weights, and SVM model parameters, resulting in relatively limited overall storage demand. If applied to practical arc fault detection devices in the future, further optimization and validation of algorithm efficiency, memory usage, and long-term stability will be required based on specific hardware platforms. Therefore, although the PF method demonstrates strong performance on the current experimental dataset, its practical implementation still requires further adaptation to hardware platforms and real-world operational testing.
3.4. Performance Comparison of Different Classification Methods
This paper compares the proposed SVM with seven classification methods, including logistic regression (LR), decision tree (DT), gradient boosting decision tree (GBDT), convolutional neural network (CNN), K-nearest neighbors (KNN), boosted trees, and long short-term memory network (LSTM). Among them, LR, DT, and KNN are classical machine learning methods used as baseline comparisons: LR makes predictions by calculating the probability of input data [35], DT performs nonlinear partitioning based on a tree structure [36], and KNN predicts using neighborhood information from training samples [37]. GBDT [38] and boosted trees [39], as ensemble learning methods, enhance overall performance by combining multiple weak classifiers, enabling more effective handling of high-dimensional features or complex nonlinear relationships. CNN extracts local pattern features through convolutional layers [40], while LSTM, as a sequential model, fully exploits the temporal dependencies in current signals to capture the dynamic evolution characteristics of fault signals [41].
The parameter settings for each classifier are as follows: For LR, the maximum number of iterations is 1000, and the regularization parameter C defaults to 1; for DT, the maximum tree depth is 8, the minimum samples required to split an internal node is 4, and the minimum samples per leaf node is 2 to prevent overfitting; both GBDT and boosted trees use 100 learners with a learning rate of 0.1 and a maximum tree depth of 3; CNN employs two one-dimensional convolutional layers, each with a kernel size of 3 and channel numbers of 32 and 64, respectively, and a learning rate of 0.001; KNN uses k = 5 neighbors and Euclidean distance as the metric; LSTM has 50 hidden units, 50 training epochs, and a batch size of 16. For LR, KNN, and SVM, input features are standardized before classification.
By selecting these methods with different principles and characteristics, this paper comprehensively evaluates the applicability and stability of the proposed features across various algorithms. It not only examines the baseline performance of classical approaches but also verifies the potential of ensemble and deep learning methods in capturing nonlinear and time-dependent features, providing valuable references for future algorithm optimization and engineering applications.
Table 4 presents the detection performance and classification discrimination time of different classifiers under the same PF feature input, including average detection accuracy, precision, recall, F1-score, and standard deviation of accuracy. SVM demonstrates high performance across all metrics, with an average detection accuracy of 99.32%; a precision, recall, and F1-score of 99.46%, 99.14%, and 99.30%, respectively; and a standard deviation of accuracy as low as 0.08%, indicating stable detection performance. It should be noted that the input to the classifier in this paper is the MS-GAAPE multi-scale entropy feature weighted by PSO, rather than the original current sequence. This type of feature has relatively low dimensionality and already incorporates information on pattern variations, amplitude fluctuations, and complexity across different scales. As a result, SVM can effectively construct a stable nonlinear discriminant boundary through kernel mapping and maximum margin classification mechanisms.
Table 4.
Detection accuracy under different classifiers.
In the integrated methods, GBDT and boosted trees achieved average accuracies of 99.13% and 99.07%, respectively, which are close to SVM. Although their recall is slightly higher, indicating stronger detection capability for faulty samples, their precision is somewhat lower with larger standard deviations, reflecting increased false positives and result fluctuations. CNN and LSTM demonstrated certain advantages in capturing nonlinear and temporal features, achieving F1-scores of 98.85% and 99.05%, respectively, but their overall accuracy and stability were slightly lower than those of SVM. In contrast, CNN and LSTM are better suited for directly capturing local structures and temporal dependencies in raw time-series data, whereas the PF features input in this study have been compressed into multi-scale statistical features. GBDT and boosted trees primarily rely on local threshold splits across multiple trees, making them relatively sensitive to perturbations in training samples; hence, their standard deviation is higher than that of SVM.
The average accuracies of the traditional methods, LR, DT, and KNN, were 97.51%, 98.32%, and 98.72%, respectively. Among them, DT and KNN showed sensitivity to faulty samples but had relatively low precision and slightly more false positives. LR exhibited overall lower performance, indicating that linear models have limited capability in capturing complex and non-stationary arc characteristics.
In summary, SVM achieves a good balance between accuracy, fault detection capability, and result stability, enabling it to fully utilize the multi-scale discriminative information in PF features. This indicates that in the low-dimensional weighted multi-scale entropy feature space constructed in this paper, SVM exhibits better model compatibility with PF features, thus demonstrating superior generalization stability. The total detection time of the proposed method is 103.62 ms. In comparison, the classification and discrimination process take less time, and the overall computational cost mainly stems from the multi-scale feature extraction in MS-GAAPE. Therefore, when deploying the algorithm on practical detection devices, further optimization of real-time performance can be focused on aspects such as scale computation, window updating, and embedded implementation.
4. Discussion
This paper addresses the need for detecting SAF on the DC side of PV systems and proposes an intelligent detection method for DC arc faults based on MS-GAAPE and SVM, taking into account potential safety monitoring applications in agricultural PV scenarios. Considering the characteristics of strong randomness, obvious non-stationarity, and susceptibility to disturbance of such fault signals, this paper takes the arc current signal as the research object, constructs a scale sequence under the multi-scale analysis framework, and combines the generalized coarse-graining strategy of the sliding window to extract the amplitude-aware permutation entropy features at different scales, thereby further characterizing the local amplitude and fluctuation changes of the current signal while retaining the temporal sequence information. Subsequently, PSO is utilized to adaptively optimize the feature weights to enhance the contribution of key fault features to the classification results. Finally, the weighted feature vectors are input into the SVM classifier to effectively identify normal operating conditions and SAF conditions.
The research results indicate that the proposed method can effectively extract multi-scale feature information from current signals and maintain good detection performance under various operating conditions and different load levels. Compared with traditional single-scale feature description methods, MS-GAAPE is more effective in reflecting the dynamic evolution patterns of fault currents at different scales. In this method, PSO is primarily used for multi-scale feature weight optimization, enhancing the influence of fault-sensitive scale features while suppressing redundant ones, thereby improving the class separability in the weighted feature space. Subsequently, an SVM classifier was employed to effectively distinguish between normal operating conditions and SAF conditions. Experimental results show that the method achieves a detection accuracy of 99.32%, effectively identifying SAFs and reducing false alarms under transient disturbance conditions to a certain extent. Its total detection time is 103.62 ms, significantly lower than the 2 s response time requirement for photovoltaic DC arc fault protection devices specified in UL1699B, indicating that this method has considerable potential for engineering applications.
From an agricultural application perspective, scenarios such as PV greenhouses, irrigation power supply, communication risk control, and livestock farming power supply have a high demand for safety monitoring on the DC side. The method proposed in this paper can extract multi-scale dynamic features and local amplitude disturbance information from current signals, thus offering an engineering-relevant approach for detecting DC faults in agricultural PV systems. Experimental results show that the method achieves good detection accuracy, response speed, and anti-interference capability under laboratory PV test platforms and predefined load conditions, laying a foundation for its future expansion into agricultural PV applications.
It should be further noted that real agricultural PV systems typically operate under more complex conditions, such as prolonged outdoor exposure, variations in temperature and humidity, dust accumulation, connector degradation, differences in cable routing, irradiance fluctuations, and changes in loads from greenhouses, irrigation, ventilation, and livestock equipment. These factors may affect the statistical characteristics of current signals under both normal and fault conditions, thereby influencing the generalization performance of detection models. Therefore, future research should incorporate long-term operational data from actual agricultural PV systems to further evaluate the stability and engineering applicability of the proposed method under various installation configurations, cable layouts, equipment conditions, and agricultural load scenarios.
Author Contributions
Conceptualization, Z.Y.; methodology, H.O. and Z.Y.; software, H.O. and Z.Y.; validation, H.O., Z.Y. and J.L.; formal analysis, H.O. and Z.Y.; investigation, H.O.; resources, Z.Y.; data curation, H.O. and Z.Y.; writing—original draft preparation, H.O., Z.Y. and J.L.; writing—review and editing, H.O., Z.Y. and J.L.; visualization, H.O.; supervision, Z.Y.; project administration; funding acquisition, Z.Y. and J.L. All authors have read and agreed to the published version of the manuscript.
Funding
This work was supported in part by the Jiangsu Natural Science Foundation under Grant BK20250932, in part by the Jiangsu Higher Education Institution Natural Science Foundation under Grant 25KJB470025, and in part by the City-University Cooperation Funding Project under Grant No. YZ2018136.
Data Availability Statement
The data presented in this study are available on request from the corresponding author.
Conflicts of Interest
The authors declare no conflicts of interest.
Abbreviations
The following abbreviations are used in this manuscript:
| PV | Photovoltaic |
| SAF | Series arc fault |
| MS-GAAPE | Multi-scale generalized amplitude-aware permutation entropy |
| RP | Recurrence plot |
| ApEn | Approximate entropy |
| PE | Permutation entropy |
| MPE | Multi-scale permutation entropy |
| MWPE | Multi-scale weighted permutation entropy |
| WPD | Wavelet packet decomposition |
| WD | Wavelet denoising |
| EMD | Empirical mode decomposition |
| MINN | Multi-input neural network |
| WPE | Weighted permutation entropy |
| FE | Fusion entropy |
| AAPE | Amplitude-aware permutation entropy |
| PSO | Particle swarm optimization |
| SVM | Support vector machine |
| RBF | Radial basis function |
| Var | Variance |
| PUF | Pulse factor |
| KF | Kurtosis factor |
| PF | Peak frequency |
| RMSF | Root mean square frequency |
| FSD | Frequency standard deviation |
| LR | Logistic regression |
| DT | Decision tree |
| GBDT | Gradient boosting decision tree |
| CNN | Convolutional neural network |
| KNN | K-nearest neighbor |
| LSTM | Long short-term memory network |
References
- Chopdar, R.K.; Sengar, N.; Giri, N.C.; Halliday, D. Comprehensive review on agrivoltaics with technical, environmental and societal insights. Renew. Sustain. Energy Rev. 2024, 197, 114416. [Google Scholar] [CrossRef] [Scilit]
- Kumar, M.; Haillot, D.; Gibout, S. Survey and evaluation of solar technologies for agricultural greenhouse application. Sol. Energy 2022, 232, 18–34. [Google Scholar] [CrossRef] [Scilit]
- Trommsdorff, M.; Kang, J.; Reise, C.; Schindele, S.; Bopp, G.; Ehmann, A.; Weselek, A.; Högy, P.; Obergfell, T. Combining food and energy production: Design of an agrivoltaic system applied in arable and vegetable farming in Germany. Renew. Sustain. Energy Rev. 2021, 140, 110694. [Google Scholar] [CrossRef] [Scilit]
- Espitia, J.J.; Velázquez, F.A.; Rodriguez, J.; Gomez, L.; Baeza, E.; Aguilar-Rodríguez, C.E.; Flores-Velazquez, J.; Villagran, E. Solar energy applications in protected agriculture: A technical and bibliometric review of greenhouse systems and solar technologies. Agronomy 2024, 14, 2791. [Google Scholar] [CrossRef] [Scilit]
- Nurmalitasari, N.; Nurchim, N.; Lestari, R.D. Artificial intelligence-driven solar smart irrigation for sustainable agriculture: Trends, challenges, and SDG implications—A systematic review. Smart Agric. Technol. 2025, 12, 101665. [Google Scholar] [CrossRef] [Scilit]
- Guo, H.; Wang, X.; Liu, B.; Chan, Z.; Pan, Z.; Chen, L.; Xi, Q.; Zhu, W.; Wu, J.; Cao, G.; et al. Global trends and evolution of aquavoltaics in sustainable aquaculture and energy generation. Renew. Energy 2025, 255, 123864. [Google Scholar] [CrossRef] [Scilit]
- Aghaei, M.; Fairbrother, A.; Gok, A.; Ahmad, S.; Kazim, S.; Lobato, K.; Oreski, G.; Reinders, A.; Schmitz, J.; Theelen, M.; et al. Review of degradation and failure phenomena in photovoltaic modules. Renew. Sustain. Energy Rev. 2022, 159, 112160. [Google Scholar] [CrossRef] [Scilit]
- Kim, S.-G.; Jung, B.-I.; Park, J.-H.; Lee, Y.-G.; Park, S.-Y. Analysis of photovoltaic cable degradation and fire precursor signals for optimizing integrated power grids. Energies 2025, 18, 5087. [Google Scholar] [CrossRef] [Scilit]
- Mustafa, E.; Afia, R.S.A.; Tamus, Z.Á. Condition assessment of low voltage photovoltaic DC cables under thermal stress using non-destructive electrical techniques. Trans. Electr. Electron. Mater. 2020, 21, 503–512. [Google Scholar] [CrossRef] [Scilit]
- Segbefia, O.K.; Imenes, A.G.; Sætre, T.O. Moisture ingress in photovoltaic modules: A review. Sol. Energy 2021, 224, 889–906. [Google Scholar] [CrossRef] [Scilit]
- Song, L.; Lu, C.; Li, C.; Xu, Y.; Liu, L.; Wang, X. Progress of photovoltaic DC fault arc detection based on VOSviewer bibliometric analysis. Energies 2024, 17, 2450. [Google Scholar] [CrossRef] [Scilit]
- Marwan, N.; Romano, M.C.; Thiel, M.; Kurths, J. Recurrence plots for the analysis of complex systems. Phys. Rep. 2007, 438, 237–329. [Google Scholar] [CrossRef] [Scilit]
- Pincus, S.M. Approximate entropy as a measure of system complexity. Proc. Natl. Acad. Sci. USA 1991, 88, 2297–2301. [Google Scholar] [CrossRef] [Scilit] [PubMed]
- Bandt, C.; Pompe, B. Permutation entropy: A natural complexity measure for time series. Phys. Rev. Lett. 2002, 88, 174102. [Google Scholar] [CrossRef] [Scilit] [PubMed]
- Zhao, L.-Y.; Wang, L.; Yan, R.-Q. Rolling bearing fault diagnosis based on wavelet packet decomposition and multi-scale permutation entropy. Entropy 2015, 17, 6447–6461. [Google Scholar] [CrossRef] [Scilit]
- Fu, S.; Wu, Y.; Wang, R.; Mao, M. A bearing fault diagnosis method based on wavelet denoising and machine learning. Appl. Sci. 2023, 13, 5936. [Google Scholar] [CrossRef] [Scilit]
- Bin, G.F.; Gao, J.J.; Li, X.J.; Dhillon, B.S. Early fault diagnosis of rotating machinery based on wavelet packets—Empirical mode decomposition feature extraction and neural network. Mech. Syst. Signal Process. 2012, 27, 696–711. [Google Scholar] [CrossRef] [Scilit]
- Xiong, Q.; Liu, X.; Feng, X.; Gattozzi, A.L.; Shi, Y.; Zhu, L.; Ji, S.; Hebner, R.E. Arc fault detection and localization in photovoltaic systems using feature distribution maps of parallel capacitor currents. IEEE J. Photovolt. 2018, 8, 1090–1097. [Google Scholar] [CrossRef] [Scilit]
- Artale, G.; Caravello, G.; Cataliotti, A.; Cosentino, V.; Di Cara, D.; Guaiana, S.; Panzavecchia, N.; Tinè, G. Characterization of DC series arc faults in PV systems based on current low frequency spectral analysis. Measurement 2021, 182, 109770. [Google Scholar] [CrossRef] [Scilit]
- Ahn, J.B.; Jo, H.-B.; Lee, J.-H.; Cho, C.-G.; Lee, K.-D.; Lee, J.; Lim, S.-B.; Ryoo, H.-J. Separation inverter noise and detection of DC series arc in PV system based on discrete wavelet transform and high frequency noise component analysis. Trans. Korean Inst. Power Electron. 2021, 26, 271–276. [Google Scholar] [CrossRef]
- Lu, S.; Phung, B.T.; Zhang, D. A comprehensive review on DC arc faults and their diagnosis methods in photovoltaic systems. Renew. Sustain. Energy Rev. 2018, 89, 88–98. [Google Scholar] [CrossRef] [Scilit]
- Han, B.; Zou, G.; Wang, W.; Li, J.; Zhang, X. Photovoltaic DC series arc fault detection method based on two-stage feature comprehensive decision. Sol. Energy 2025, 285, 113084. [Google Scholar] [CrossRef] [Scilit]
- Chen, X.; Gao, W.; Hong, C.; Tu, Y. A novel series arc fault detection method for photovoltaic system based on multi-input neural network. Int. J. Electr. Power Energy Syst. 2022, 140, 108018. [Google Scholar] [CrossRef] [Scilit]
- Kim, B.; Kim, T.; Kim, W.; Park, H.-P. DC series arc fault detection and extinguishing with modulation algorithm of non-inverting buck-boost converter for PV applications. IEEE Access 2025, 13, 49504–49513. [Google Scholar] [CrossRef] [Scilit]
- Jiang, C.; Xie, W.; Wang, M.; Zhou, T.; Song, W.; Yue, Y.; Hu, X. Machine learning in magnetism: Progress, challenges, and perspectives. Comput. Mater. Sci. 2026, 268, 114652. [Google Scholar] [CrossRef] [Scilit]
- Xia, J.; Shang, P.; Wang, J.; Shi, W. Permutation and weighted-permutation entropy analysis for the complexity of nonlinear time series. Commun. Nonlinear Sci. Numer. Simul. 2016, 31, 60–68. [Google Scholar] [CrossRef] [Scilit]
- Li, Y.; Ding, Q. Fusion entropy and its spatial post-multiscale version: Methodology and application. Chaos Solitons Fractals 2024, 186, 115345. [Google Scholar] [CrossRef] [Scilit]
- Azami, H.; Escudero, J. Amplitude-aware permutation entropy: Illustration in spike detection and signal segmentation. Comput. Methods Programs Biomed. 2016, 128, 40–51. [Google Scholar] [CrossRef] [Scilit] [PubMed]
- Cuesta-Frau, D.; Murillo-Escobar, J.P.; Orrego, D.A.; Delgado-Trejos, E. Embedded dimension and time series length. Practical influence on permutation entropy and its applications. Entropy 2019, 21, 385. [Google Scholar] [CrossRef] [Scilit] [PubMed]
- Dávalos, A.; Jabloun, M.; Ravier, P.; Buttelli, O. On the statistical properties of multiscale permutation entropy: Characterization of the estimator’s variance. Entropy 2019, 21, 450. [Google Scholar] [CrossRef] [Scilit] [PubMed]
- Li, Z.; Cui, Y.; Li, L.; Chen, R.; Dong, L.; Du, J. Hierarchical amplitude-aware permutation entropy-based fault feature extraction method for rolling bearings. Entropy 2022, 24, 310. [Google Scholar] [CrossRef] [Scilit] [PubMed]
- Zhang, L.; Zhang, X.; Xue, Q.; He, Y. Multiscale Weighted Permutation Entropy Analysis of MEG Signals in Schizophrenia. Entropy 2024, 24, 314. [Google Scholar] [CrossRef] [Scilit]
- Dong, Y.; Dai, X.; Cui, D.; Zhou, D. Fault diagnosis of rotating machinery based on ICEEMDAN and observer. Vibration 2026, 9, 14. [Google Scholar] [CrossRef] [Scilit]
- Zhang, T.; Zhang, W.; Meng, Z.; Li, J.; Wang, M. Research on high-frequency torsional oscillation identification using TSWOA-SVM based on downhole parameters. Processes 2024, 12, 2153. [Google Scholar] [CrossRef] [Scilit]
- Poręba, J.; Baranowski, J. Functional logistic regression for motor fault classification using acoustic data in frequency domain. Energies 2022, 15, 5535. [Google Scholar] [CrossRef] [Scilit]
- Dhakar, A.; Singh, B.; Gupta, P. Fault diagnosis of air compressor set-up using decision tree based J48 classification algorithm. J. Eng. Res. 2024, 12, 1011–1025. [Google Scholar] [CrossRef] [Scilit]
- Lu, J.; Qian, W.; Li, S.; Cui, R. Enhanced k-nearest neighbor for intelligent fault diagnosis of rotating machinery. Appl. Sci. 2021, 11, 919. [Google Scholar] [CrossRef] [Scilit]
- Ding, W.; Chen, Q.; Dong, Y.; Shao, N. Fault diagnosis method of intelligent substation protection system based on gradient boosting decision tree. Appl. Sci. 2022, 12, 8989. [Google Scholar] [CrossRef] [Scilit]
- Sapountzoglou, N.; Lago, J.; Raison, B. Fault diagnosis in low voltage smart distribution grids using gradient boosting trees. Electr. Power Syst. Res. 2020, 182, 106254. [Google Scholar] [CrossRef] [Scilit]
- He, J.; Wu, P.; Tong, Y.; Zhang, X.; Lei, M.; Gao, J. Bearing fault diagnosis via improved one-dimensional multi-scale dilated CNN. Sensors 2021, 21, 7319. [Google Scholar] [CrossRef] [Scilit] [PubMed]
- Liu, W.; Guo, P.; Ye, L. A Low-Delay Lightweight Recurrent Neural Network (LLRNN) for Rotating Machinery Fault Diagnosis. Sensors 2019, 19, 3109. [Google Scholar] [CrossRef] [Scilit] [PubMed]

Disclaimer/Publisher’s Note: The statements, opinions and data contained in all publications are solely those of the individual author(s) and contributor(s) and not of MDPI and/or the editor(s). MDPI and/or the editor(s) disclaim responsibility for any injury to people or property resulting from any ideas, methods, instructions or products referred to in the content. |
© 2026 by the authors. Licensee MDPI, Basel, Switzerland. This article is an open access article distributed under the terms and conditions of the Creative Commons Attribution (CC BY) license.