


Abstract
To fill the research gap in the mechanical and physical properties of different varieties of sweet potatoes at different points in the harvest period and to provide a theoretical basis for the design of key components of the sweet potato harvester, the physical properties of Su-Shu 16, Su-Shu 36, and Ning-Zi 4 during the harvest period were studied at three time points: 15 October, 25 October, and 4 November 2023. The moisture content of sweet potatoes was determined using the DGF30/7-IA electric hot air-drying oven. The results showed that the moisture content of sweet potatoes decreased with increasing growth time at three different time points during the harvest period. The moisture content of Su-Shu 16 was, on average, 12.74% higher than that of Su-Shu 36, while the moisture content of Ning-Zi 4 was, on average, 8.07% higher than that of Su-Shu 36. The density of Su-Shu 36 measured by the drainage method is greater than that of Su-Shu 16 and Ning-Zi 4, but the difference is relatively small, and the density tends to decrease slowly with the increase of growth time. Using an electronic universal testing machine, compression tests were conducted on Su-Shu 16, Su-Shu 36, and Ning-Zi 4 at loading speeds of 5 mm/min and 10 mm/min, respectively. The results showed that the compressive strength limit range of Su-Shu 36 was slightly higher than that of Su-Shu 16 and significantly higher than that of Ning-Zi 4. The Poisson’s ratio, elastic modulus, and shear modulus values of Su-Shu 16 and Su-Shu 36 were similar and much higher than those of Ning-Zi 4. Studying sweet potatoes’ growth and physical characteristics for different purposes can provide data references for the design of digging depth, working width, and conveyor chain gap of sweet potato harvesters, as well as data references for sweet potato simulation experiments.
1. Introduction
The sweet potato belongs to the Dioscoreae family, in the genus Dioscorea, and is an annual or perennial herbaceous plant. Originating from South America, sweet potatoes were introduced to China during the 16th century [1,2]. Sweet potatoes are a high-quality food crop that not only provides excellent anti-cancer health benefits but also has the potential to be used as a new source of energy [3,4,5,6]. The Food and Agriculture Organization (FAO) reports that in 2022, China accounted for approximately 29.76% of the total global sweet potato planting area, with a planting area of 2.158 million hectares. Additionally, China produced 46.8288 million tons of sweet potatoes, representing approximately 54.19% of the total global sweet potato production. These figures indicate that China holds the top position globally in both sweet potato planting area and production volume. Sweet potatoes play a crucial role in China as they are the fifth most important staple food crop, following corn, wheat, potatoes, and rice. They play a significant role in providing food, industrial raw materials, and animal feed [7].
Damage during the sweet potato harvesting process has always been one of the key concerns for researchers, and reducing skin breakage and the bruising rate is crucial for the advancement of sweet potato harvesting machinery. Researchers are continuously investigating the issue of sweet potato damage. Wang Bing et al. have examined the mechanism of sweet potato damage that occurs during the separation of soil and sweet potatoes using a chain-type elevator. They have identified that sweet potato damage primarily occurs during the conveying, soil and potato separation, and potato throwing processes [8]. By studying the conveyor chain used in sweet potato harvesters, Ma Po et al. conducted further research on the impact of spacing, material, and amplitude of the chain rods on the skinning of sweet potatoes during the conveying process [9]. Zheng Gang et al. conducted a study on the high epidermal damage rate of fresh sweet potatoes in sandy soil during mechanical harvesting. They developed a rubber-wrapped integrated conveying and separating device. Experimental validation demonstrated that by using appropriate parameter combinations, the epidermal damage rate was reduced to 0.86%, and the loss rate was only 0.69% [10]. Gao Guohua et al. conducted a study on the impact damage mechanism of sweet potatoes and identified the critical height for such damage [11]. Bao Guocheng et al. studied the impact characteristics and damage mechanism of sweet potatoes falling, revealing the safe falling height and damage mechanism of sweet potatoes under different conditions. They designed a highly adaptive potato harvesting device to address the high rate of potato damage and low level of automation in the potato harvesting process, greatly reducing the damage to sweet potatoes in the harvesting process [12,13]. Liu Chenglong et al. conducted physical property tests on Yan-Shu 25 and systematically studied various physical properties of Yan-Shu 25 [14]; Shen Haiyang et al. used Su-Shu 16 as the test object to study important characteristic parameters such as axial and radial Poisson’s ratio, elastic modulus, shear modulus, etc. of Su-Shu 16 and determined that sweet potato belongs to isotropic materials [15]. According to previous research, the damage to sweet potatoes during the harvesting process is mainly caused by compression and collision during transportation, leading to skin damage or internal flesh damage. Secondly, a vague understanding of the growth range of sweet potatoes during excavation can lead to collisions with the excavation shovel, causing damage. To reduce the damage to sweet potatoes during the harvesting process, it is necessary not only to conduct research from the machine level but also to consider the physical properties of sweet potatoes as an important influencing factor [16].
Previous studies on the physical properties of sweet potatoes during the harvest period have only used a single variety of sweet potato as the experimental subject without comparing the physical properties of different varieties of sweet potatoes. Moreover, the sampling time for sweet potato samples was only once, without comparing the physical properties of the same variety of sweet potato at different time periods. However, there are certain differences in the physical properties of sweet potatoes for different uses, and there are also certain differences in the physical properties of the same variety of sweet potato at different time points, which cannot be generalized.
This study expands the scope of research on the physical properties of sweet potatoes, building upon previous studies. It extends from research on a single variety to three varieties and from sampling at a single time point to three time points. The three varieties of sweet potatoes are fresh-eating type, starch processing type, and fresh-eating purple-fleshed sweet potatoes. This study takes the harvest period of Su-Shu 16, Su-Shu 36, and Ning-Zi 4 as the experimental subjects, sampling every ten days during the harvest period. The sampling times are 15 October 2023, 25 October 2023, and 4 November 2023, respectively. The growth condition, geometric dimensions, water content, and density of sweet potatoes were measured. Finally, compression experiments were conducted on sweet potatoes of the three varieties to determine the Poisson’s ratio, elastic modulus, and shear modulus of sweet potatoes. The aim is to provide data references for the design of digging depth, working width, and conveyor chain bar gap of sweet potato harvesters, as well as data references for sweet potato simulation experiments.
2. Materials and Methods
2.1. Materials
The experimental subjects for this study were Su-Shu 16, Su-Shu 36, and Ning-Zi 4, and the samples were collected from the Bai Ma Experimental Base of the Nanjing Research Institute for Agricultural Mechanization, which is under the Ministry of Agriculture and Rural Affairs. The planting time for sweet potatoes is in late May, and the harvest time is in mid- to late October. The planting mode of sweet potatoes is single ridge single row planting, with mechanical ridging. Where the ridge spacing is 900 mm, the ridge height is 250 mm, and the plant spacing is 200 mm. The primary apparatus utilized in the experiment is the SanSi-manufactured DWD electronic universal testing machine from Shenzhen. DGF30/7-IA electric hot air-drying oven (temperature 0~300 °C, voltage 220 V). Analytical balance (capacity 100 g, accuracy 0.0001 g). Graduated cylinder (capacity 100 mL, accuracy 1 mL). Beaker (capacity 1000 mL, accuracy 1 mL). Measuring tape (capacity 5 m, accuracy 1 mm). Steel ruler (capacity 200 mm, accuracy 1 mm). Digital caliper with high precision (capacity 150 mm, accuracy 0. 01 mm). Art knife and cylindrical sampler, etc.
2.2. Test Method
- (1)
- Determination of sweet potato growth conditions (growth depth, tuber width)
Use the 5-point sampling method to randomly select 10 sweet potato plants, remove the side soil and measure the depth of sweet potato growth downward from the point where the sweet potato stem connects to the vine using a steel ruler. Measure the range of sweet potato tuber formation using a steel ruler with the junction of the sweet potato vine as the center [17].
- (2)
- Measurement of geometric dimensions of sweet potatoes
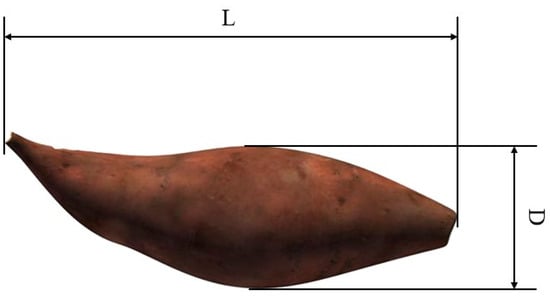
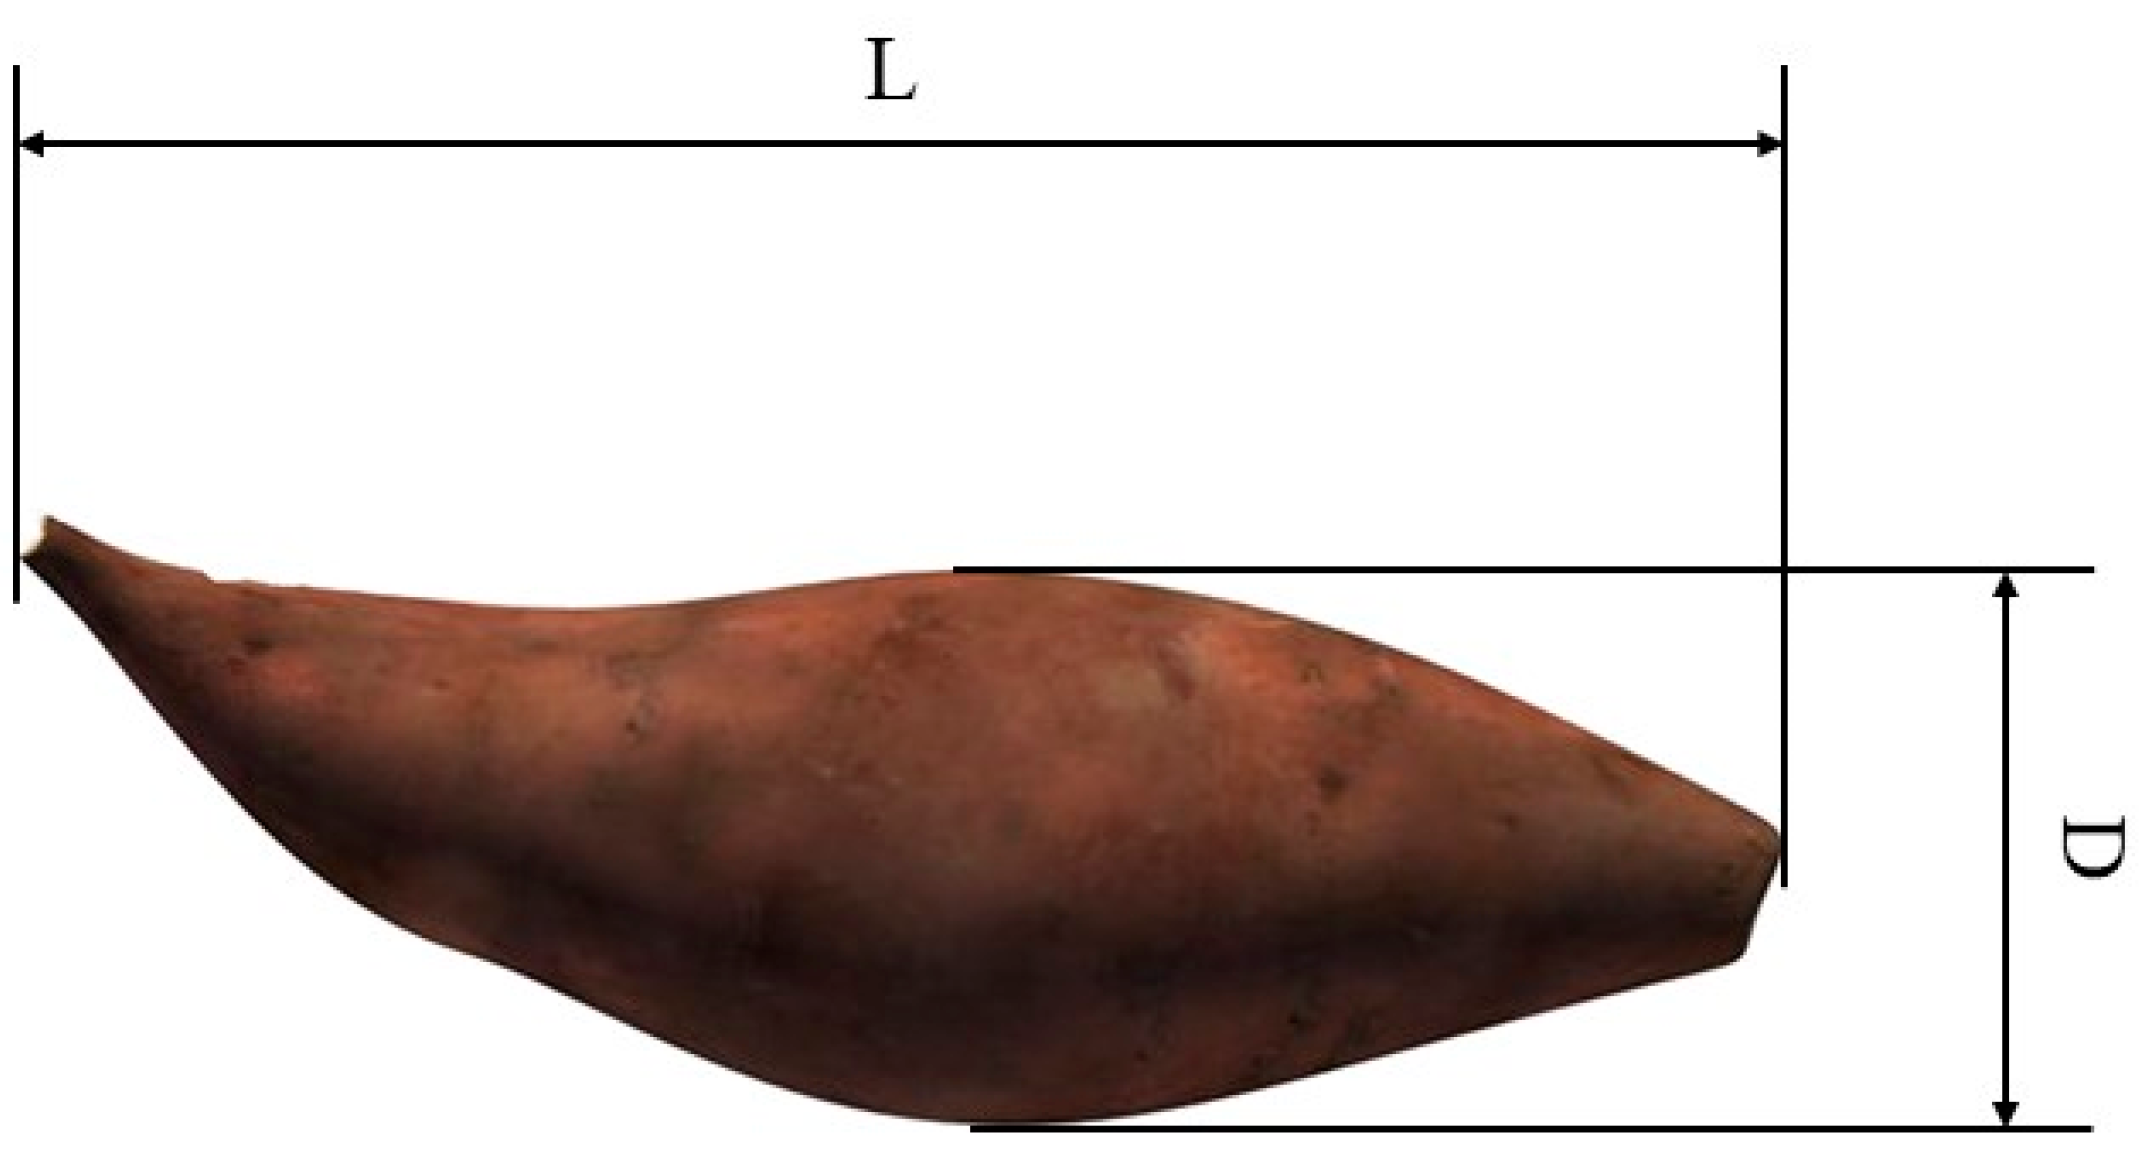
Starting from the connection point between the sweet potato chunks and the sweet potato twigs and ending at the swollen end of the sweet potato tuber, the length between the two points is taken as the length L of the sweet potato chunks (mm). Take the maximum diameter of the sweet potato chunk as the diameter of the sweet potato D (mm). Measure the length L and diameter D of the potato chunk using a vernier caliper [18], as illustrated in Figure 1.
Figure 1.
Diagram of sweet potato dimensions.
The formula for calculating the length-to-diameter ratio of sweet potatoes is
where Q represents the length-to-diameter ratio of sweet potatoes.
- (3)
- Determination of Moisture Content in Sweet Potatoes
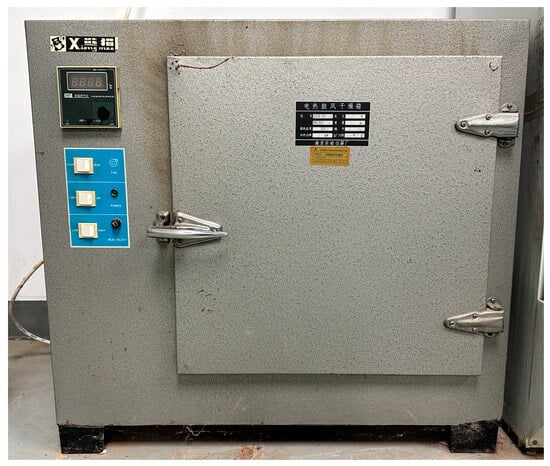
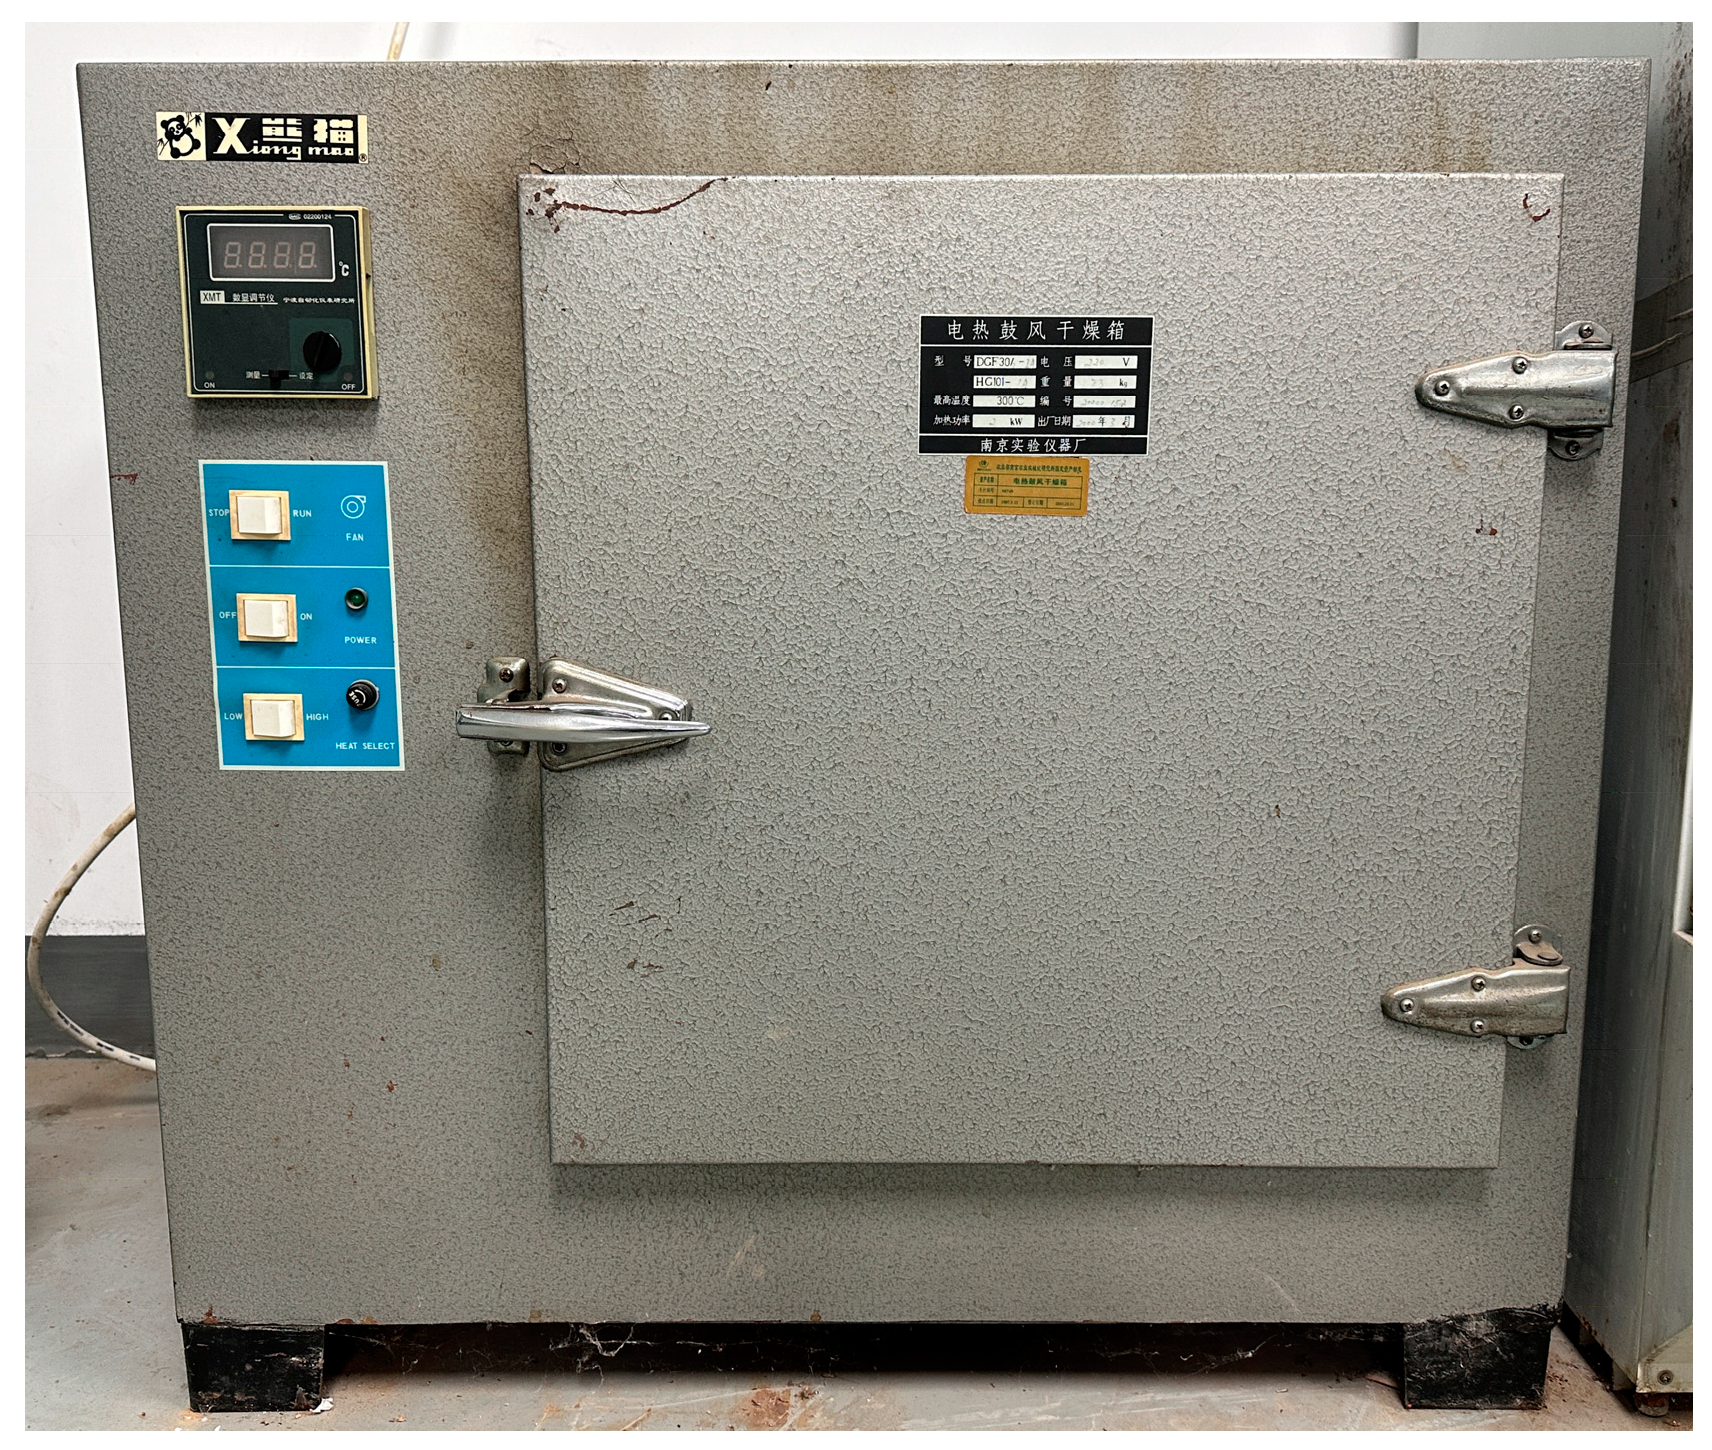
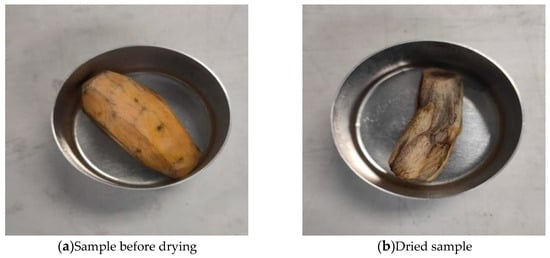
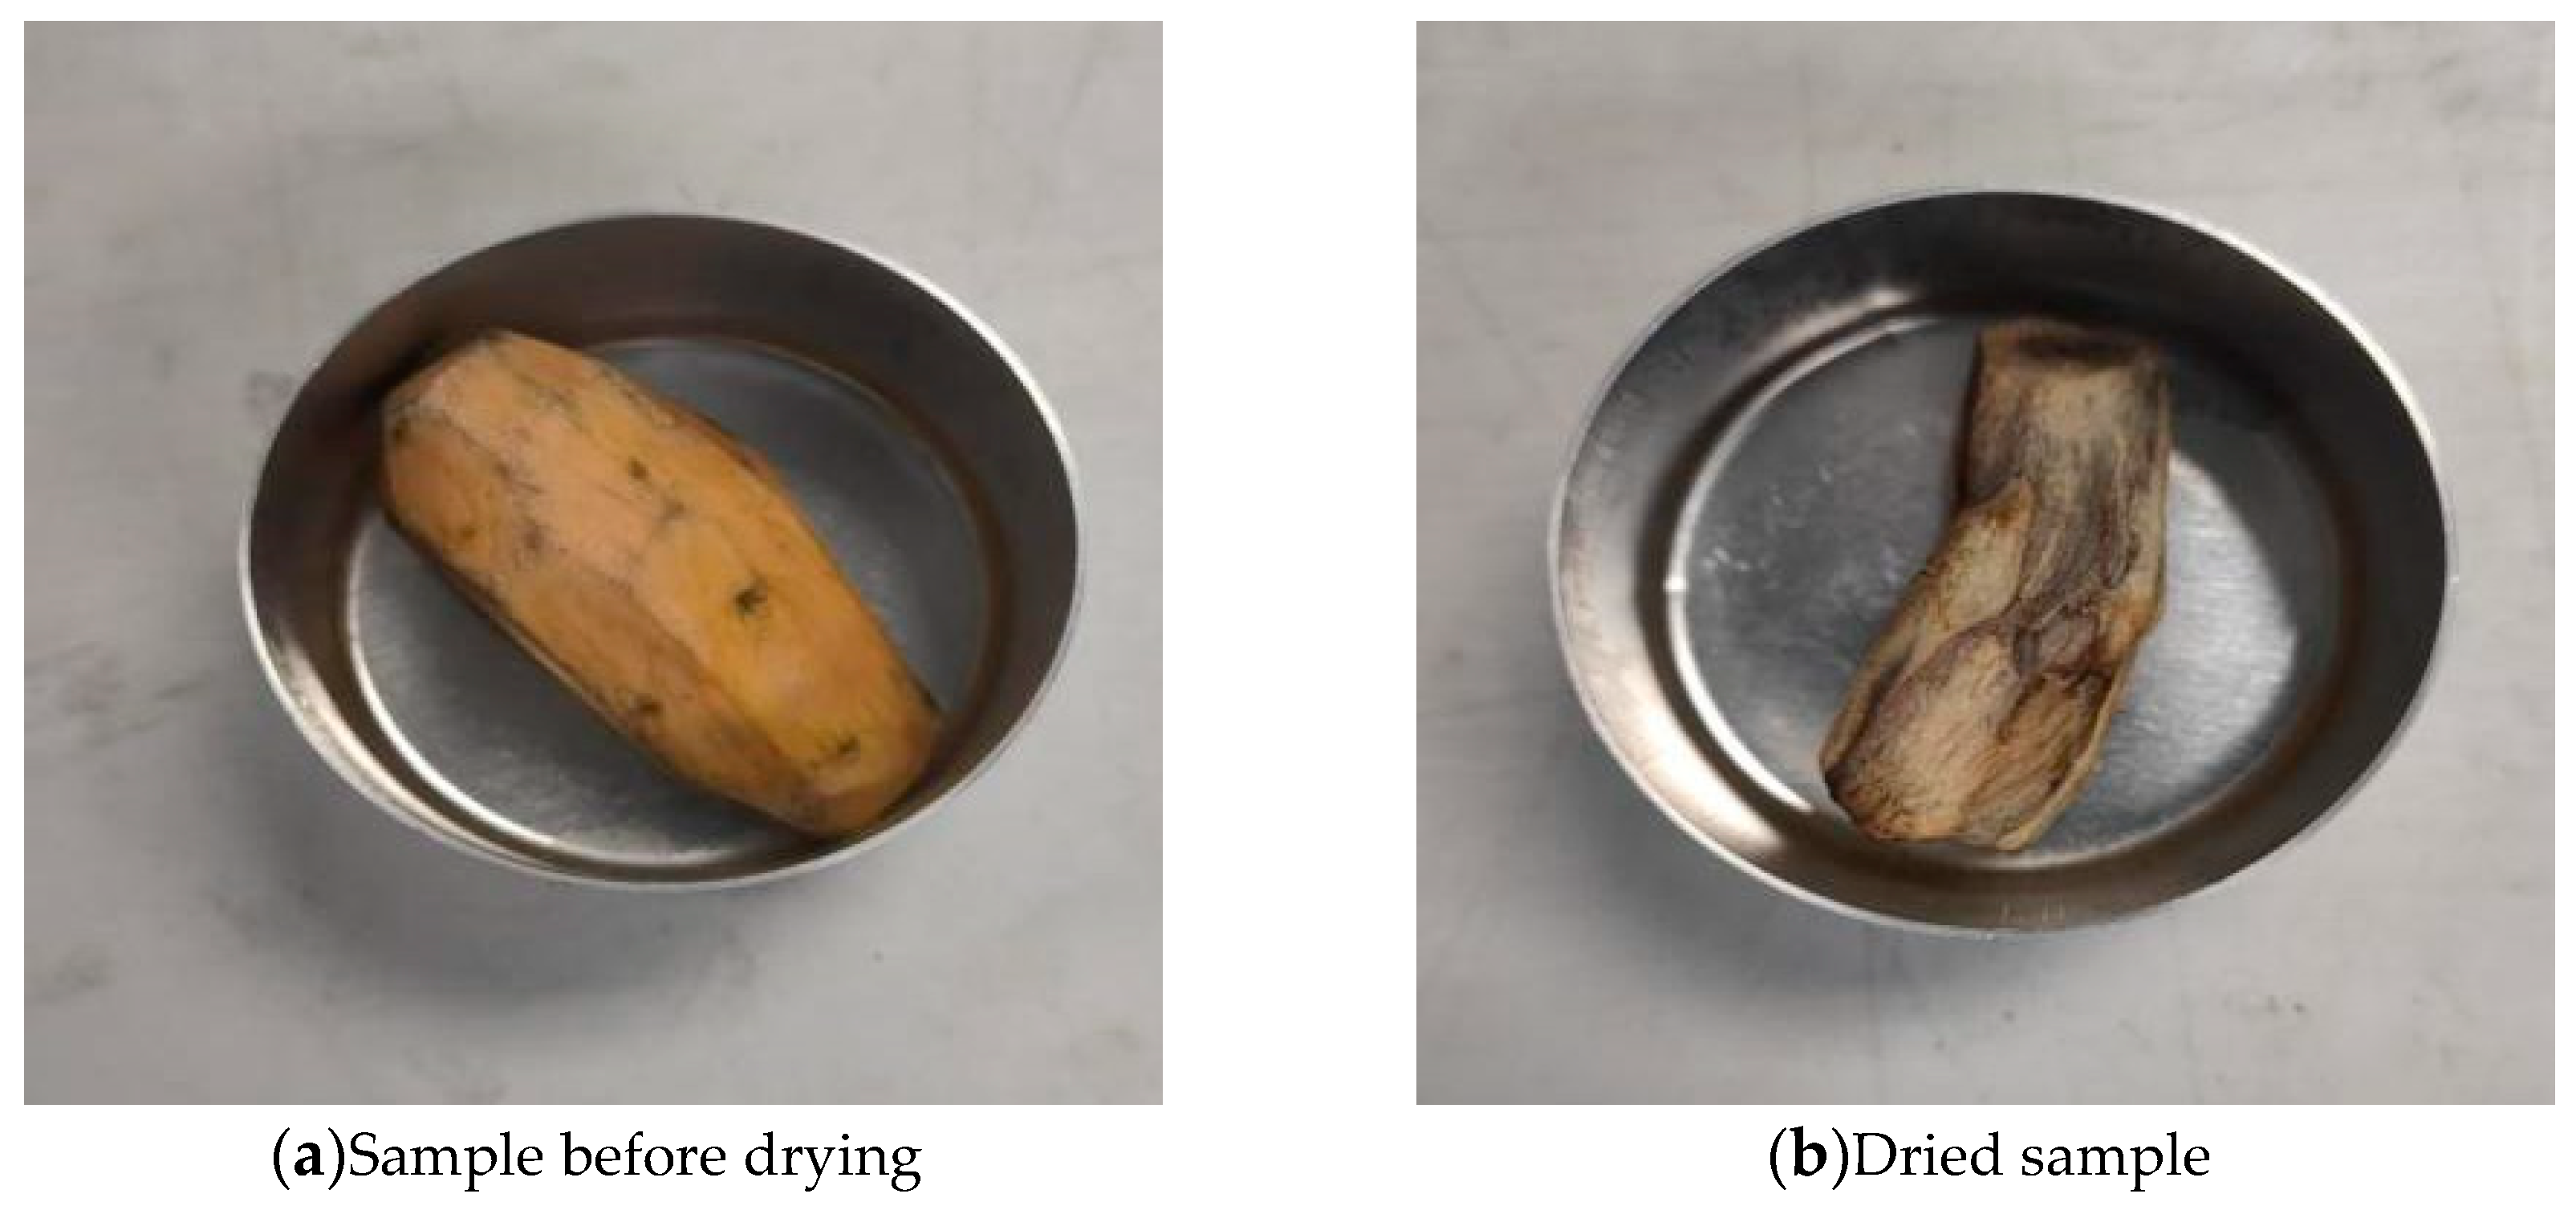
The moisture content of sweet potatoes was determined using a DGF30/7-IA electric hot air-drying oven, as shown in Figure 2. Ten sweet potato chunks were randomly selected and cut into small pieces using a utility knife, as illustrated in Figure 3a. The drying box is weighed with an electronic balance and recorded as MH (g). The chopped potato pieces are then put into the drying box, as illustrated in Figure 3a, weighed, and recorded as M1 (g). Then the weighed sweet potato chunks are put into the DGF30/7-IA electric hot air drying oven, and the temperature is set to 105 °C for drying. They are dried until a constant weight is achieved. After the temperature drops to room temperature, weigh the drying box and dried sweet potato cubes together, denoted as M2 (g), as illustrated in Figure 3b. Finally, the moisture content is determined and taken as the arithmetic mean value [19].
Figure 2.
DGF30/7-IA electric hot air-drying oven.
Figure 3.
Comparison before and after drying of sweet potato chunks.
The formula for calculating the moisture content of sweet potatoes is
where θ is the moisture content of sweet potatoes, %.
- (4)
- Determination of Sweet Potato Density
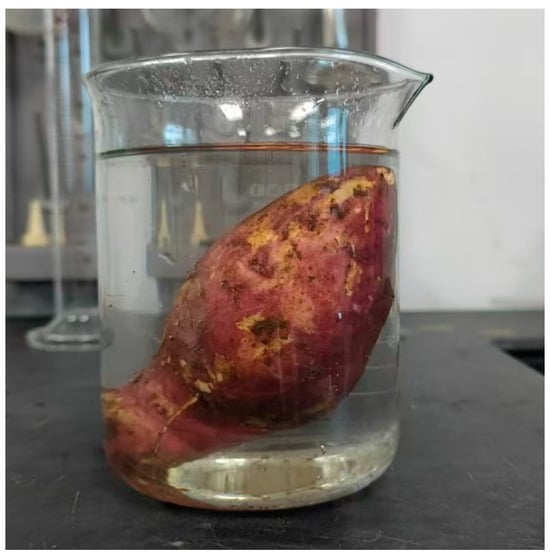
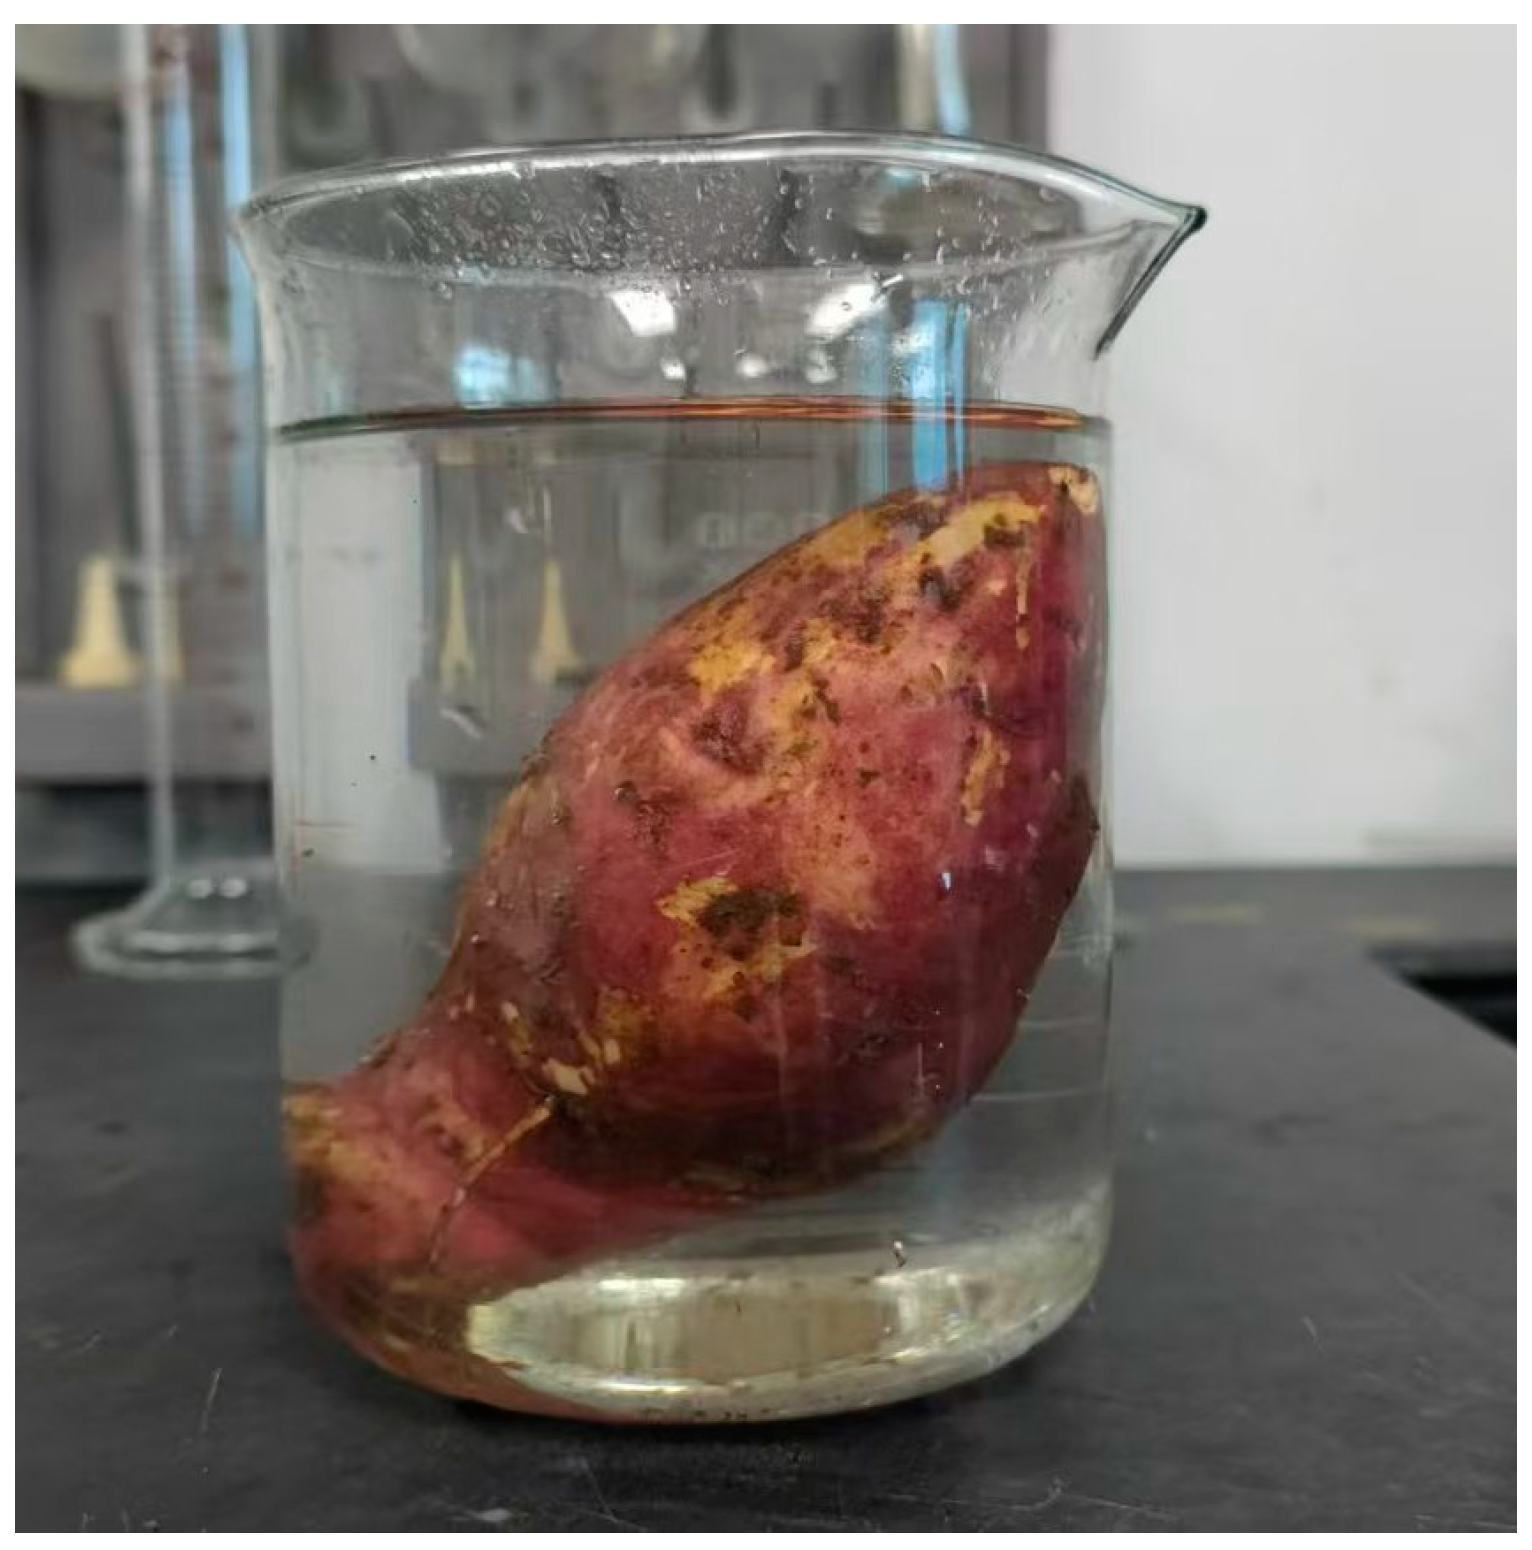
Using the drainage method, take a complete sweet potato block, weigh it, record the mass as M (g), and place it in a beaker, as illustrated in Figure 4. Utilize the immersion technique to determine the mass of all sweet potato pieces. Record the weight as M (g) and transfer them to a beaker. Using a measuring cylinder, pour a specified amount of water into the beaker until the sweet potato block is completely submerged, and mark the water level up to the graduation line on the beaker. Record the volume of water poured as V1 (cm3). Read the total volume of water and sweet potato chunks in the beaker and record it as V2 (cm3). Repeat to determine the density of the 10 samples [20].
Figure 4.
Density measurement by drainage method.
The formula for calculating sweet potato density is
where M represents the mass of the sweet potato tuber (g); V1 represents the volume of water injected (cm3); V2 represents the total volume of water and sweet potato tuber in the beaker (cm3); and represents the density of the potato tuber (g/cm3).
- (5)
- Sweet Potato Compression Test Method
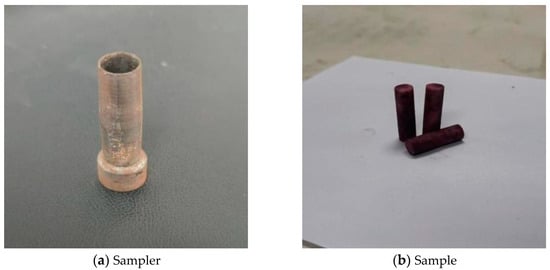
Sample sweet potatoes with a cylindrical sampler, as illustrated in Figure 5a. After sampling, use a utility knife to cut the end surface of the cylindrical sweet potato block neatly, ensuring there are no damaged spots or cracks. Make 10 cylindrical test samples with a diameter of 10 ± 1 mm and a length of 30 ± 2 mm, as illustrated in Figure 5b.
Figure 5.
Sampler and Sample Images.
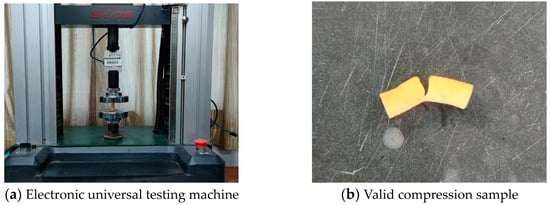
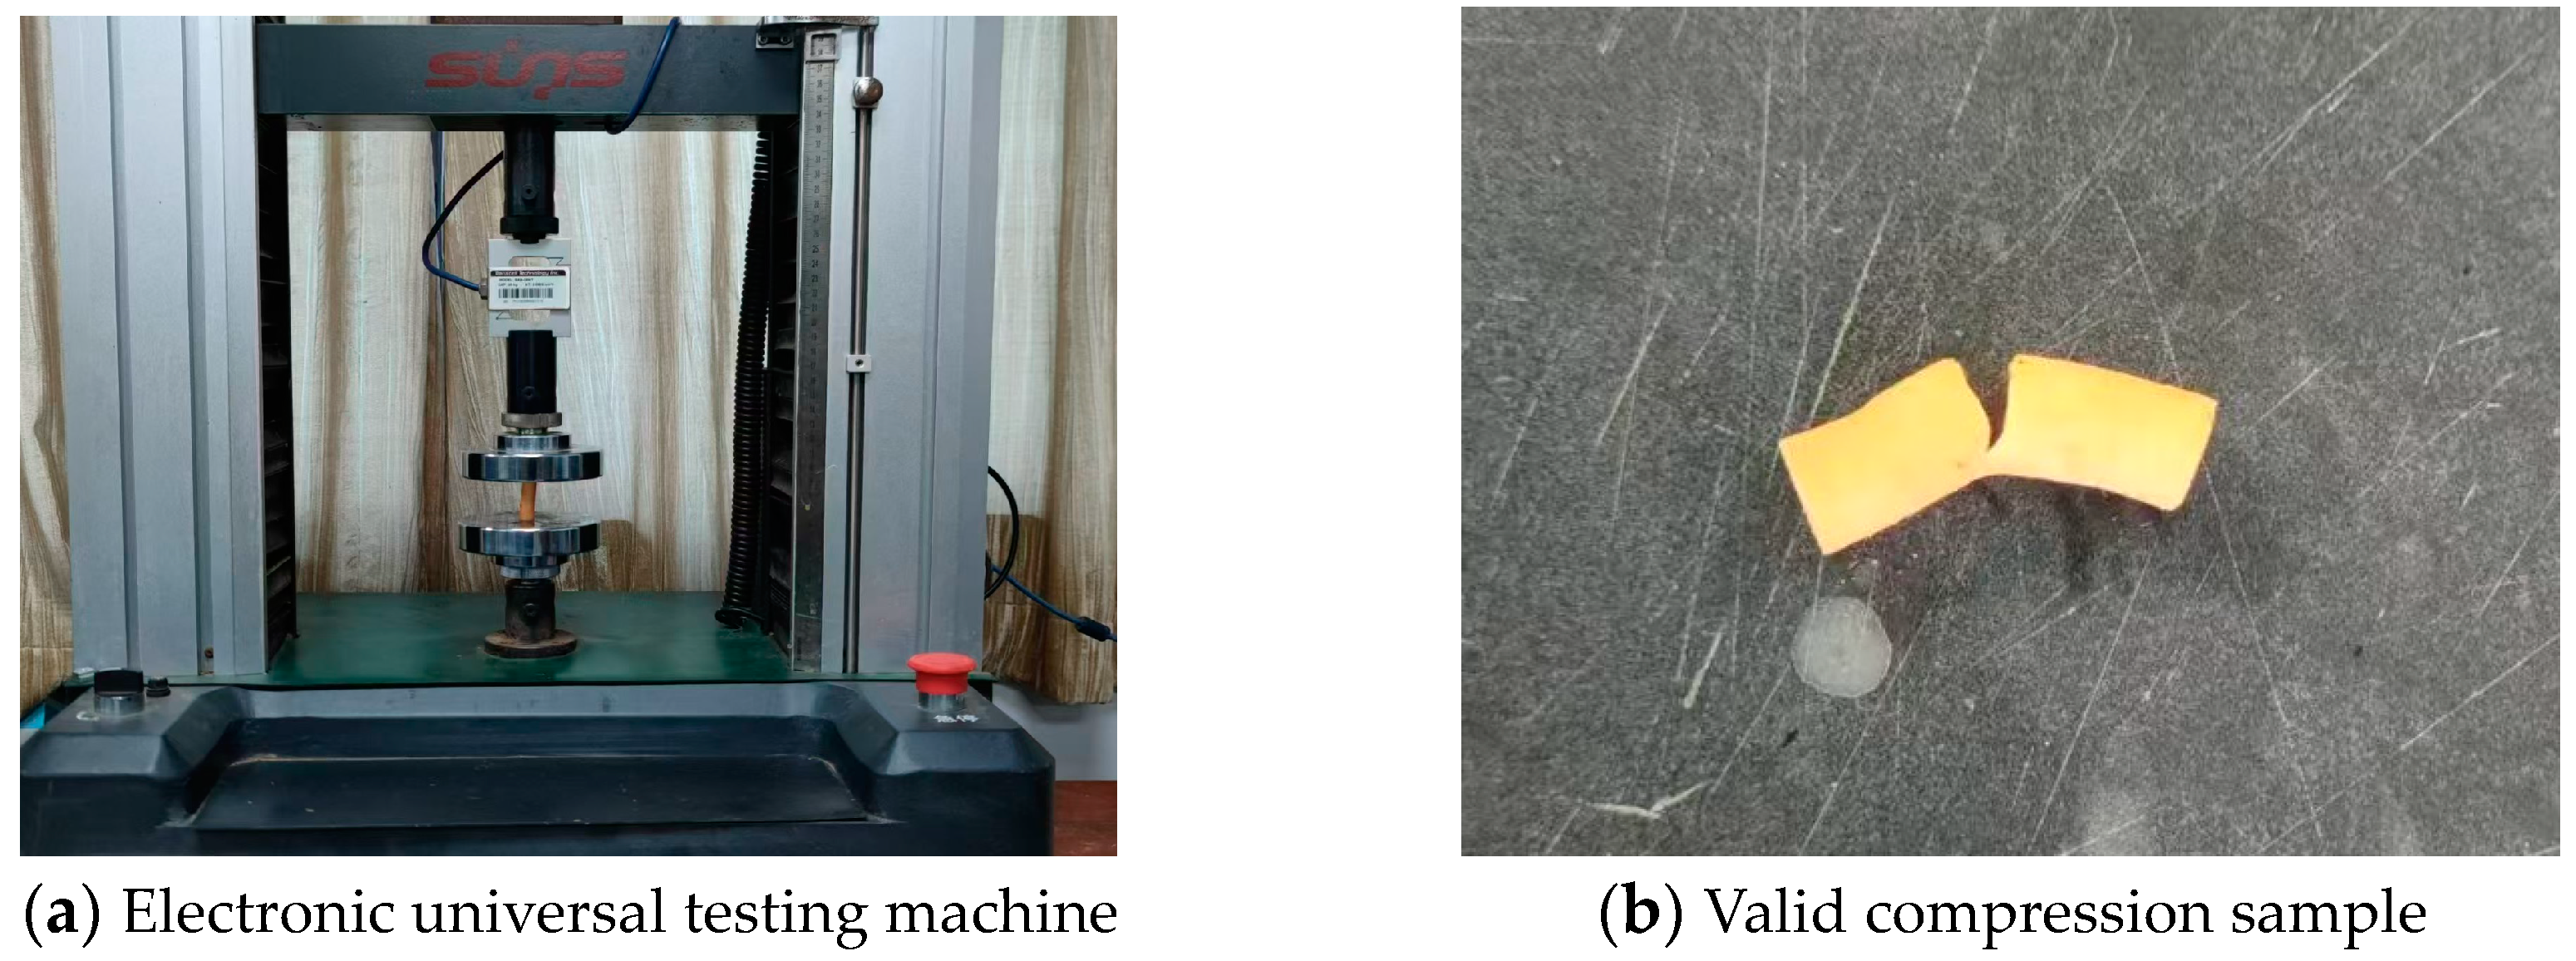
During the experiment, first use a digital caliper to measure the diameter and length of the sweet potato sample end face separately and then place the measured sample in the fixture of the electronic universal testing machine, as illustrated in Figure 6a. Compress at two different loading rates of 5 mm/min and 10 mm/min until fracture occurs. The sample of sweet potato block that fractures at the midpoint is considered a valid compression sample, as illustrated in Figure 6b. Select the effective compressed data from the experimental data for final analysis [21].
Figure 6.
Electronic universal testing machine and valid compression sample.
The stress calculation formula for sweet potatoes is
where represents the stress experienced by the potato tuber, N/mm2; F represents the pressure experienced by the sweet potato tuber, N; and A is the cross-sectional area of the sweet potato tuber in the direction of compression, mm2.
The formula for calculating the transverse strain in the compression direction of sweet potatoes is
where represents the transverse strain of the sweet potato block; ∆ represents the change in diameter of the sweet potato block after compression, mm; and d represents the original diameter of the sweet potato block sample, mm.
The formula for calculating the longitudinal strain in the direction of sweet potato compression is
where represents the longitudinal strain of the sweet potato block; ∆ represents the displacement in the length direction of the sweet potato block, mm; and l represents the length of the sweet potato block sample, mm.
where E represents the elastic modulus of sweet potato, MPa.
The calculation formula for the sweet potato Poisson’s ratio is
where represents the Poisson’s ratio of sweet potato.
The formula for calculating the shear modulus of sweet potatoes is
where G represents the shear modulus of sweet potato, MPa.
3. Results
3.1. Sweet Potato Growth Status
As indicated in Table 1, the growth depth of Su-Shu 16 ranges from 0 to 229 mm, and the tuber width ranges from 90 to 540 mm. The growth depth of Su-Shu 36 ranges from 0 to 208 mm, and the tuber width ranges from 100 to 600 mm. The growth depth of Ning-Zi 4 ranges from 0 to 261 mm, and the tuber width ranges from 110 to 600 mm.
Table 1.
Sweet Potato Growth Range Measurement Table.
3.2. Sweet Potato Geometric Dimensions
As indicated in Table 2, the average diameter of Su-Shu 16 is 59.59 mm, and the average length is 142.09 mm. The average diameter of Su-Shu 36 is 56.87 mm, and the average length is 152.17 mm. The average diameter of Ning-Zi 4 is 68.92 mm, and the average length is 109.34 mm. The fruit shape of sweet potato can be reflected by the length-to-diameter ratio of the cylindrical object. The larger the length-to-diameter ratio is, the more slender the fruit shape; the smaller the length-to-diameter ratio and the shorter and thicker the fruit shape. Experimental results show that the fruit shapes of Su-Shu 16 and Su-Shu 36 are similar but more slender compared to Ning-Zi 4.
Table 2.
Sweet Potato Geometric Size Measurement Table.
3.3. Moisture Content in Sweet Potatoes
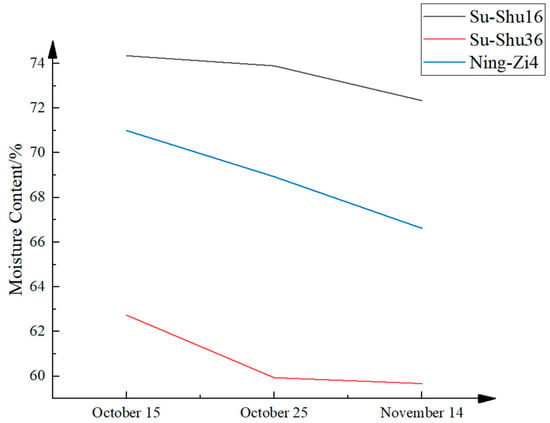
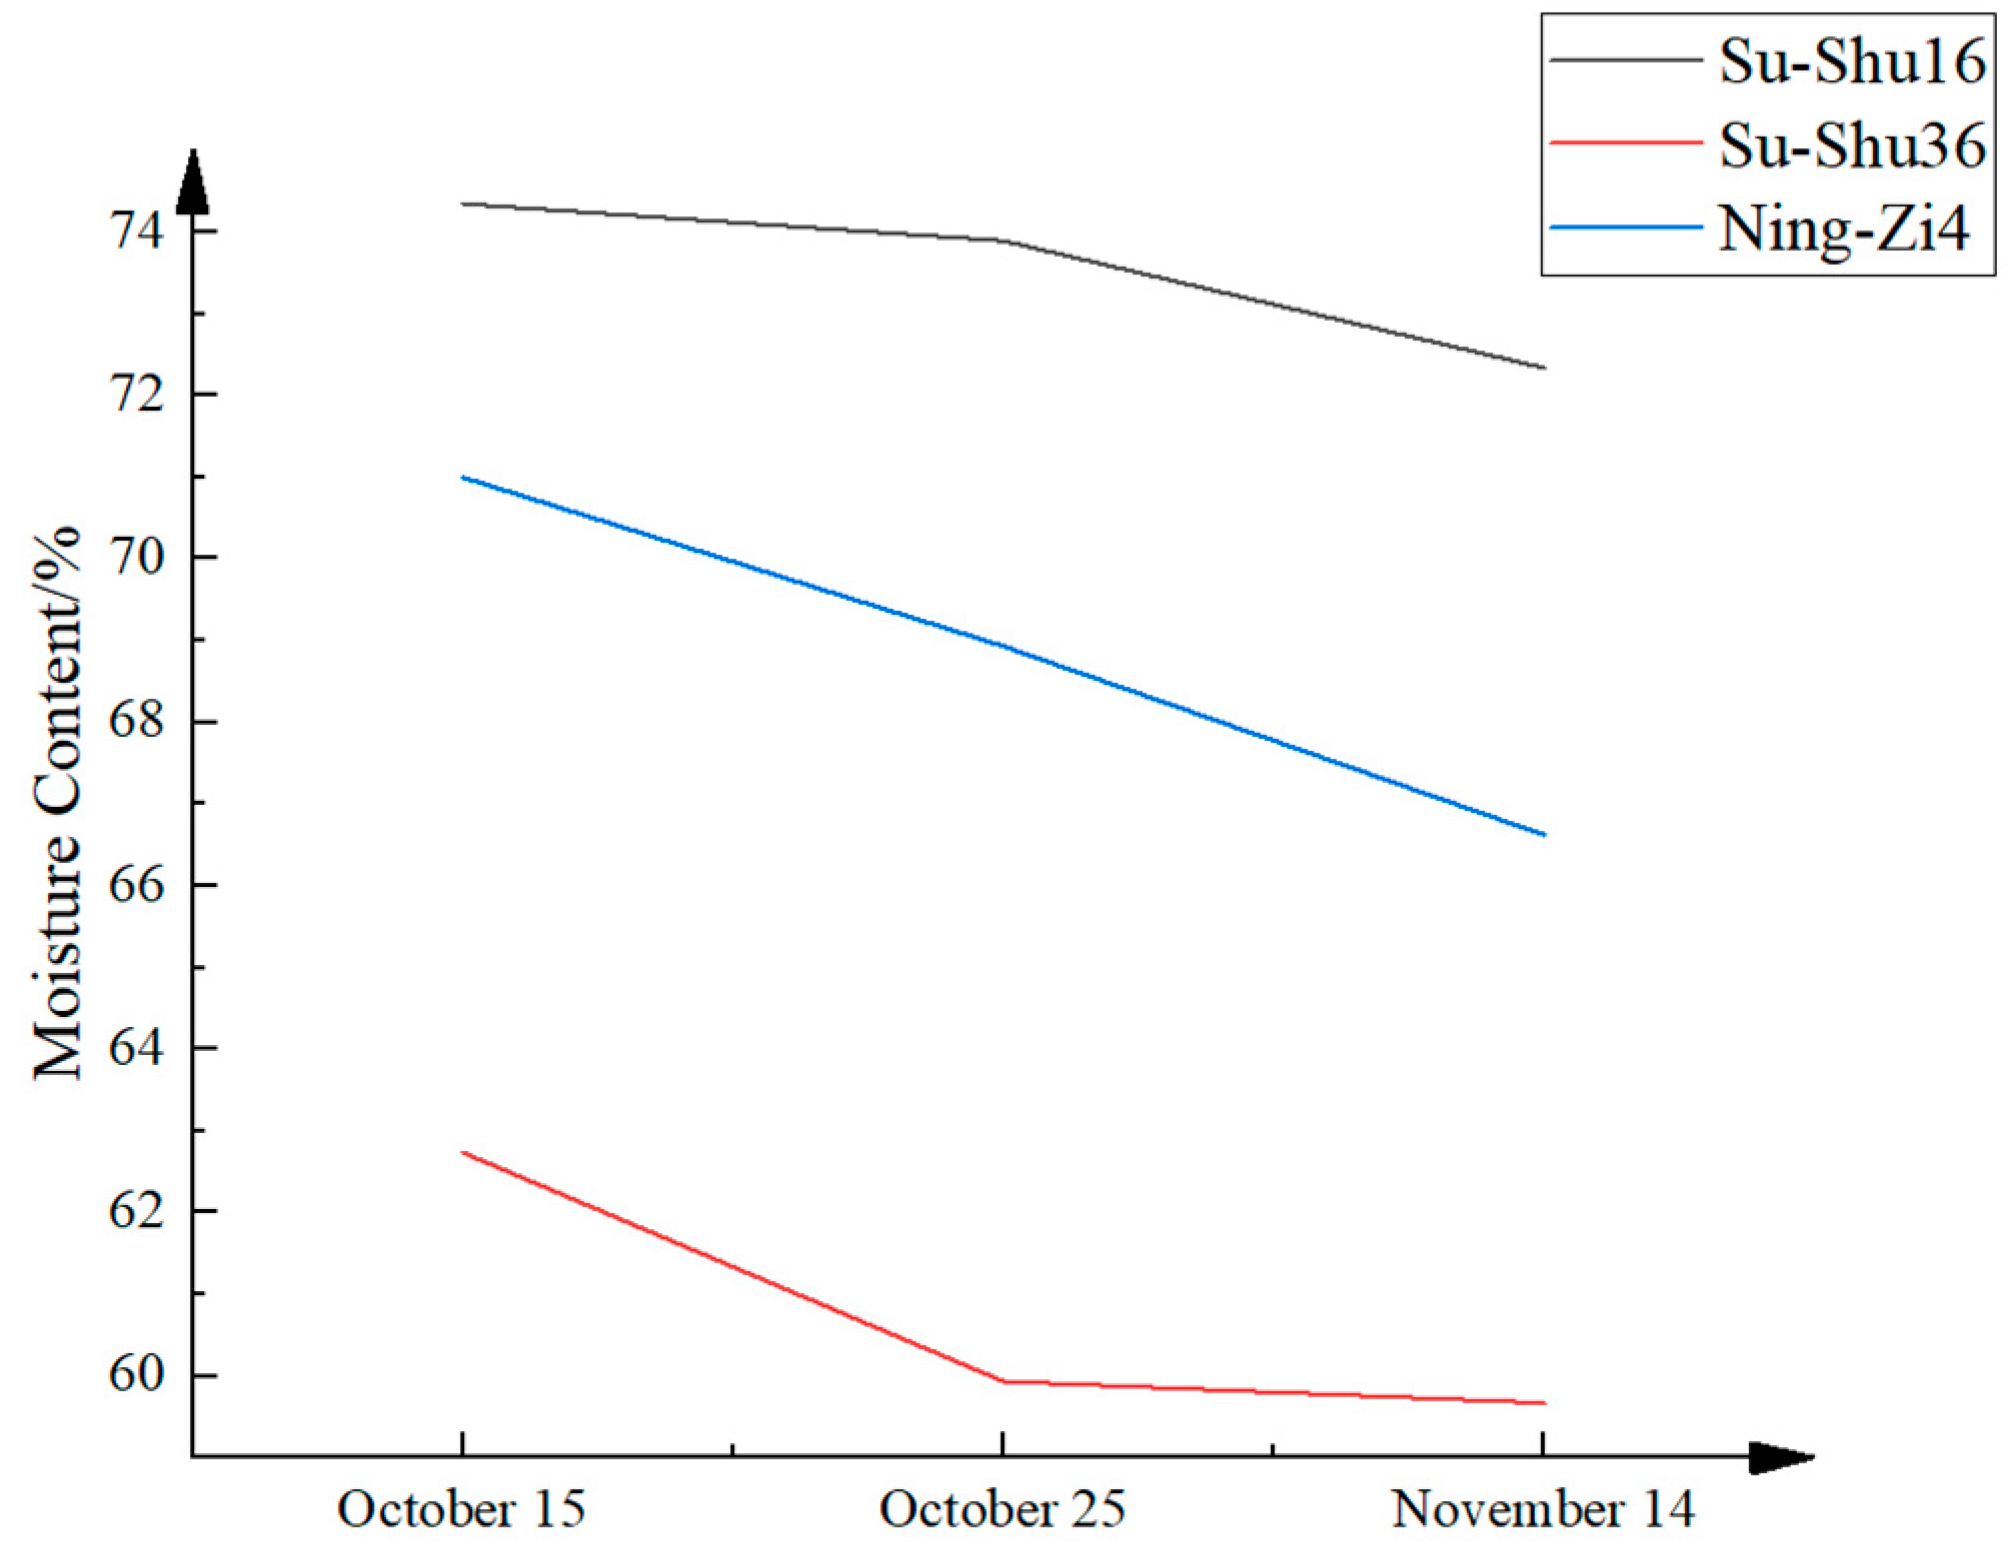
In the three tests conducted on 15 October, 25 October, and 4 November, the mass of Su-Shu 16, Su-Shu 36, and Ning-Zi 4 no longer changed after drying at 105 °C for 20 h. As indicated in Table 3, the moisture content of Su-Shu 16 obtained from three experiments is approximately 74.35%, 73.89%, and 72.34%; The moisture content of Su-Shu 36 obtained from three experiments is approximately 62.74%, 59.94%, and 59.67%. The moisture content of Ning-Zi 4 obtained from three experiments is approximately 71%, 68.93%, and 66.62%. As illustrated in Figure 7, comparing the water content of the three types of sweet potatoes reveals that the water content of Su Shu 16 and Ning Zi 4, which are fresh-food type sweet potatoes, is significantly higher than that of Su Shu 36, a starch-type sweet potato. The average water content of Su Shu 16 is 12.74% higher than that of Su Shu 36, and the average water content of Ning Zi 4 is 8.07% higher than that of Su Shu 36. Furthermore, by comparing the trend of water content changes in sweet potatoes at three time points, it can be known that the water content of sweet potatoes will decrease with the increase of growth time during the harvest period.
Table 3.
Determination of Moisture Content Test Data.
Figure 7.
Trend of Moisture Content in Sweet Potatoes.
3.4. Sweet Potato Density
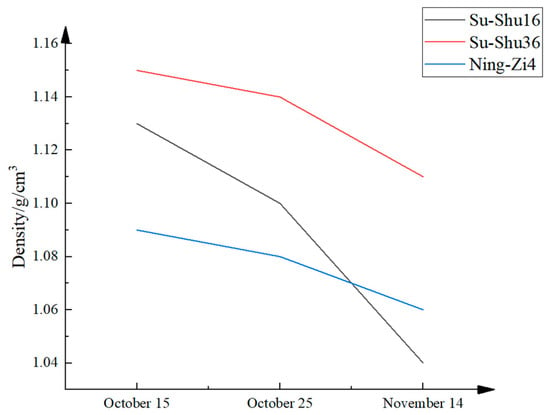
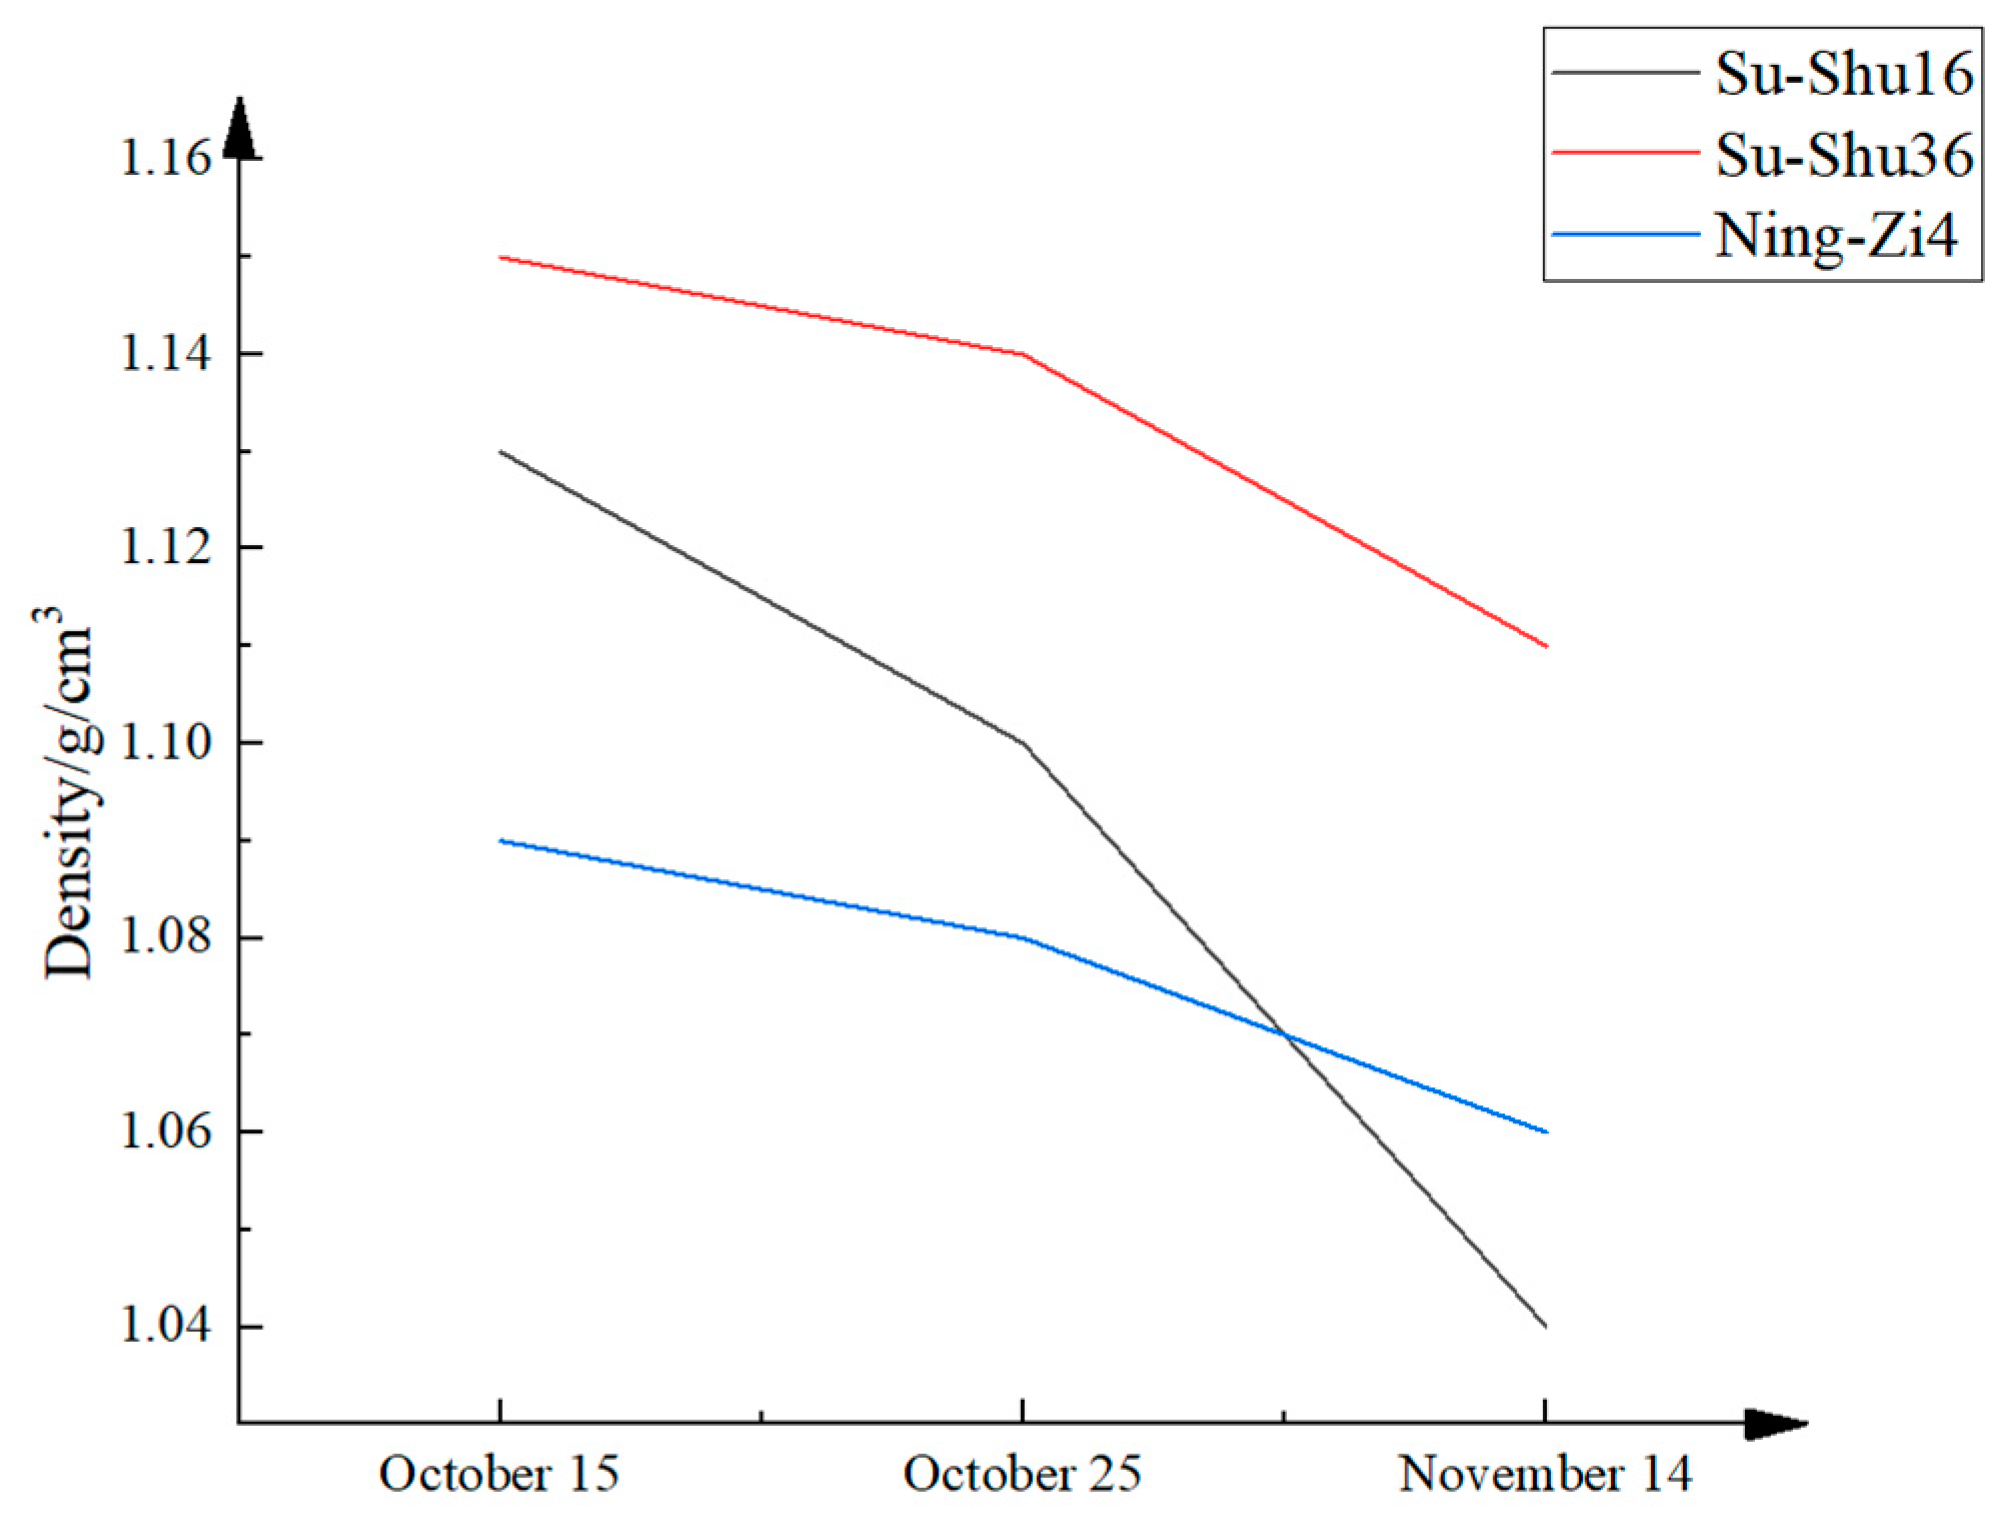
The sample densities of Su-Shu 16, Su-Shu 36, and Ning-Zi 4 on 15 October, 25 October, and 4 November are indicated in Table 4. The densities of Su-Shu 16 at three time points are 1.13 g/cm3, 1.10 g/cm3, and 1.04 g/cm3, respectively; The densities of Su-Shu 36 at three time points are 1.15 g/cm3, 1.14 g/cm3, and 1.11 g/cm3 respectively; The densities of Ning-Zi 4 at three time points are 1.09 g/cm3, 1.08 g/cm3, and 1.06 g/cm3 respectively. As illustrated in Figure 8, the density of Su-Shu 36 is greater than that of Su-Shu 16 and Ning-Zi 4, but the difference is small, and the density shows a trend of slowly decreasing with increasing growth time.
Table 4.
Sweet Potato Density Determination Test Data.
Figure 8.
Trend of Sweet Potato Density Variation.
3.5. Sweet Potato Compression Test
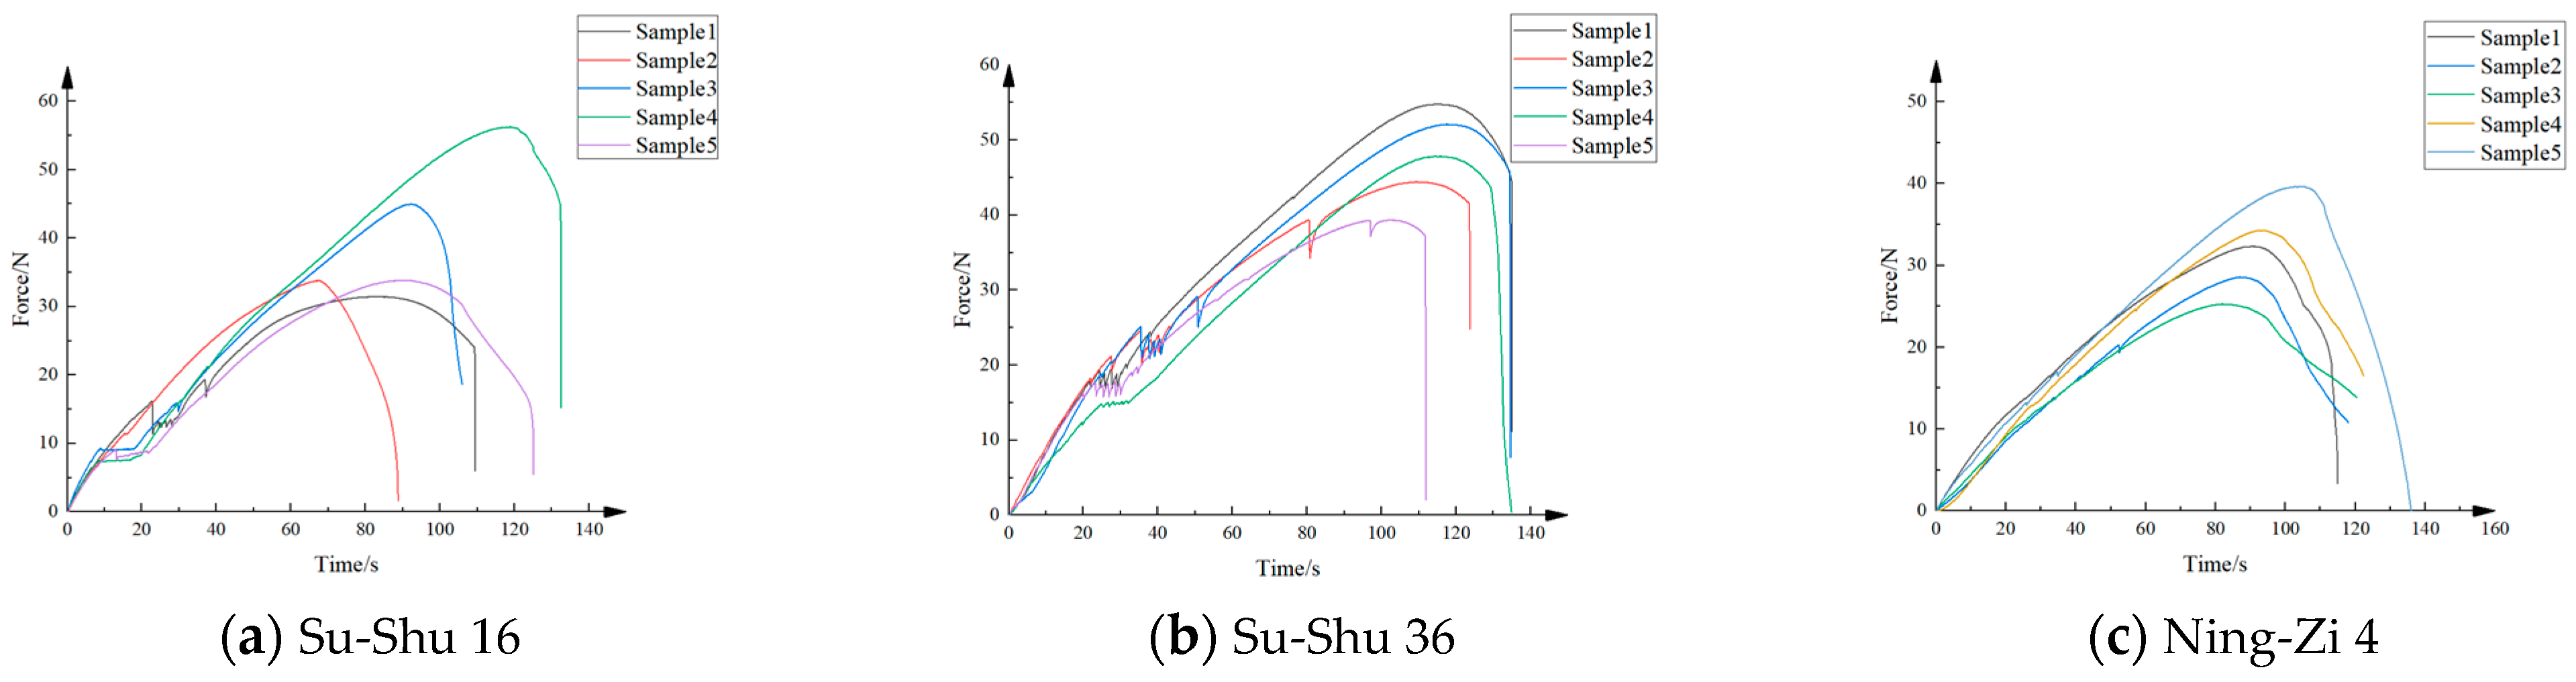
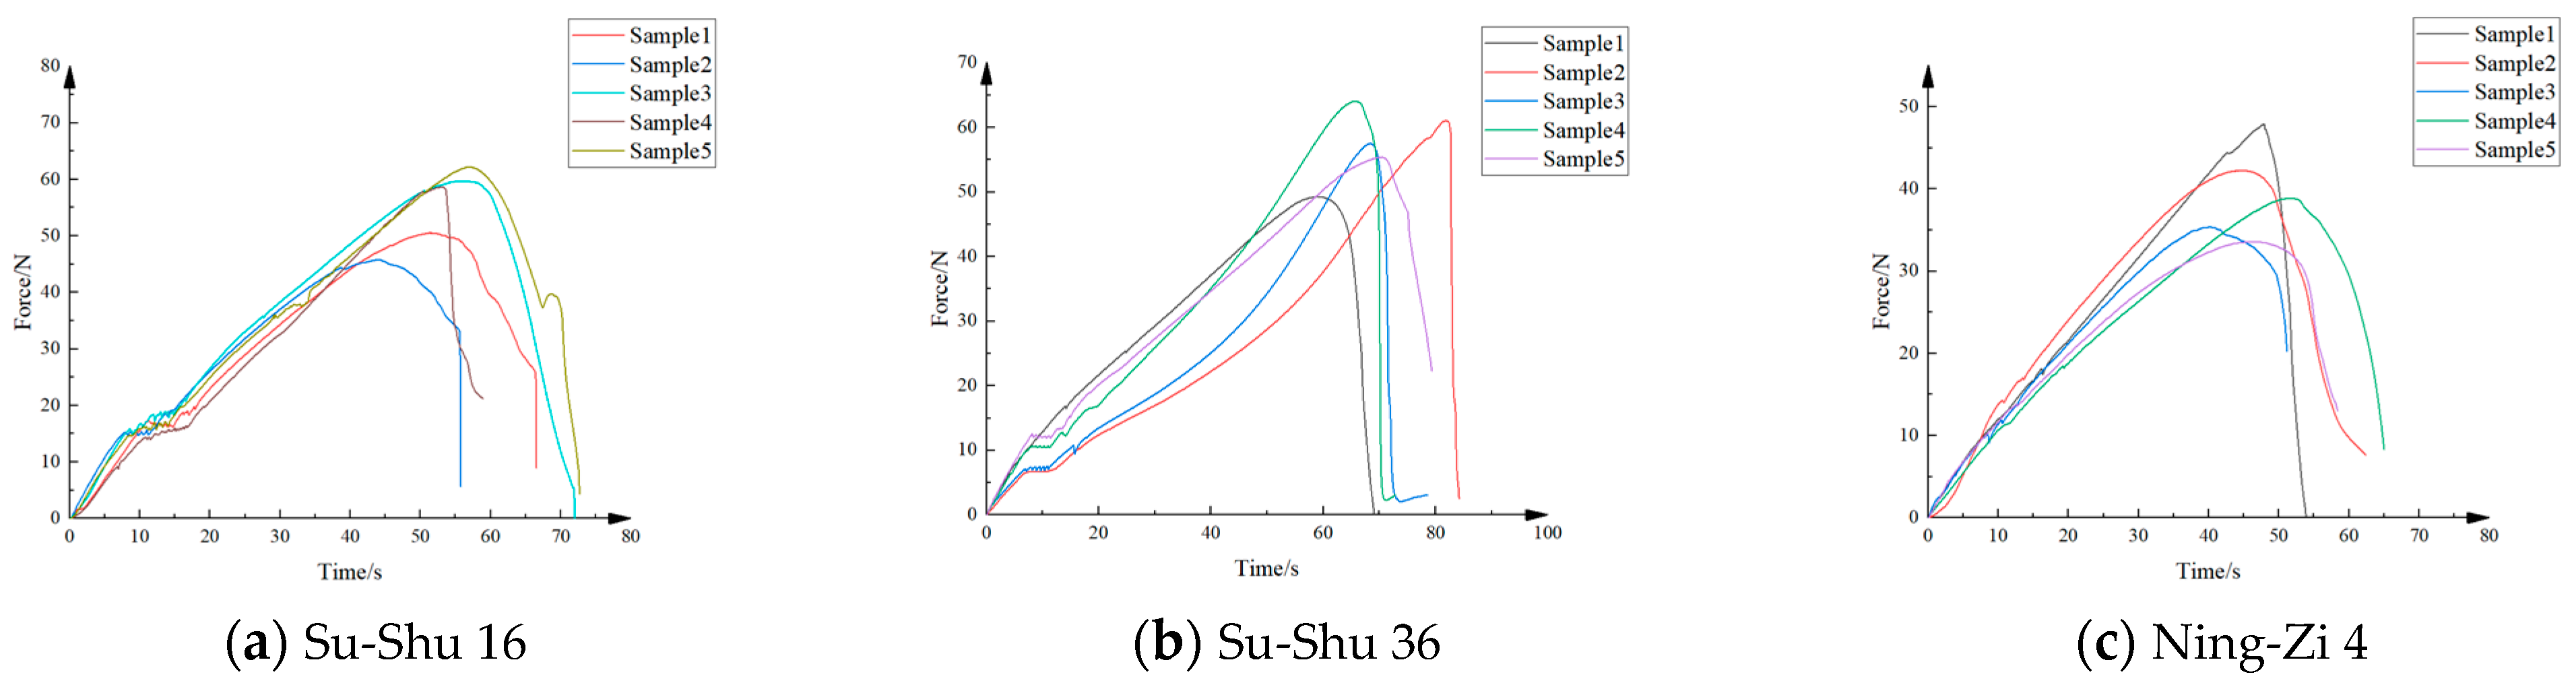
The experiment conducted compression tests on the samples of sweet potato tubers taken from Su-Shu 16, Su-Shu 36, and Ning-Zi 4 at loading rates of 5 mm/min and 10 mm/min, respectively. From the experiment, it can be seen that during the compression process of sweet potatoes, the force experienced by the sample increases linearly with time. When the compression strength limit of the sample is reached, it fractures, and the force experienced undergoes a cliff-like decrease. As indicated in Figure 9, when the loading speed is 5 mm/min, the compression strength limit of the Su-Shu 16 sample is between 33 N and 46 N. The compression strength limit of the Su-Shu 36 sample is between 39 N and 55 N. The compression strength limit of the Ning-Zi 4 sample is between 25 N and 40 N. As indicated in Figure 10, when the loading speed is 10 mm/min, the compression strength limit of the Su-Shu 16 sample is between 46 N and 63 N. The compression strength limit of the Su-Shu 36 sample is between 49 N and 65 N. The compression strength limit of the Ning-Zi 4 sample is between 33 N and 48 N. Under different loading speeds, the range of compressive strength limits of Su-Shu 36 is slightly higher than that of Su-Shu 16 and far exceeds that of Ning-Zi 4.
Figure 9.
Force-time graph of the specimen under a loading rate of 5 mm/min.
Figure 10.
Force-time graph of the specimen under a loading rate of 10 mm/min.
As indicated in Table 5, when the loading speed is 5 mm/min, the maximum, minimum, and average values of the Poisson’s ratio for the Su-Shu 16 sample are 0.83, 0.48, and 0.64, respectively; The maximum, minimum, and average values of the elastic modulus are 4.71 MPa, 3.14 MPa, and 3.81 MPa, respectively; The maximum, minimum, and average shear modulus are 1.35 MPa, 0.94 MPa, and 1.16 MPa, respectively; The standard deviations of the sample’s Poisson’s ratio, elastic modulus, and shear modulus are 0.09, 0.42, and 0.14, respectively. The experimental data is less dispersed and has a high reliability.
Table 5.
Calculation of Elastic Modulus, Shear Modulus, and Poisson’s Ratio for Su-Shu 16 (5 mm/min).
As indicated in Table 6, when the loading speed is 10 mm/min, the maximum, minimum, and average values of the Poisson’s ratio for the Su-Shu 16 sample are 0.73, 0.46, and 0.61, respectively; The maximum, minimum, and average values of the elastic modulus are 4.92 MPa, 4.07 MPa, and 4.57 MPa, respectively; The maximum, minimum, and average shear modulus are 1.54 MPa, 1.24 MPa, and 1.42 MPa, respectively; The standard deviations of the sample’s Poisson’s ratio, elastic modulus, and shear modulus are 0.08, 0.37, and 0.14, respectively. The experimental data is less dispersed and has a high reliability.
Table 6.
Calculation of Elastic Modulus, Shear Modulus, and Poisson’s Ratio for Su-Shu 16 (10 mm/min).
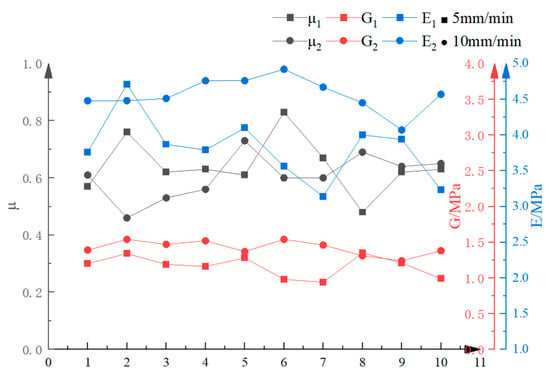
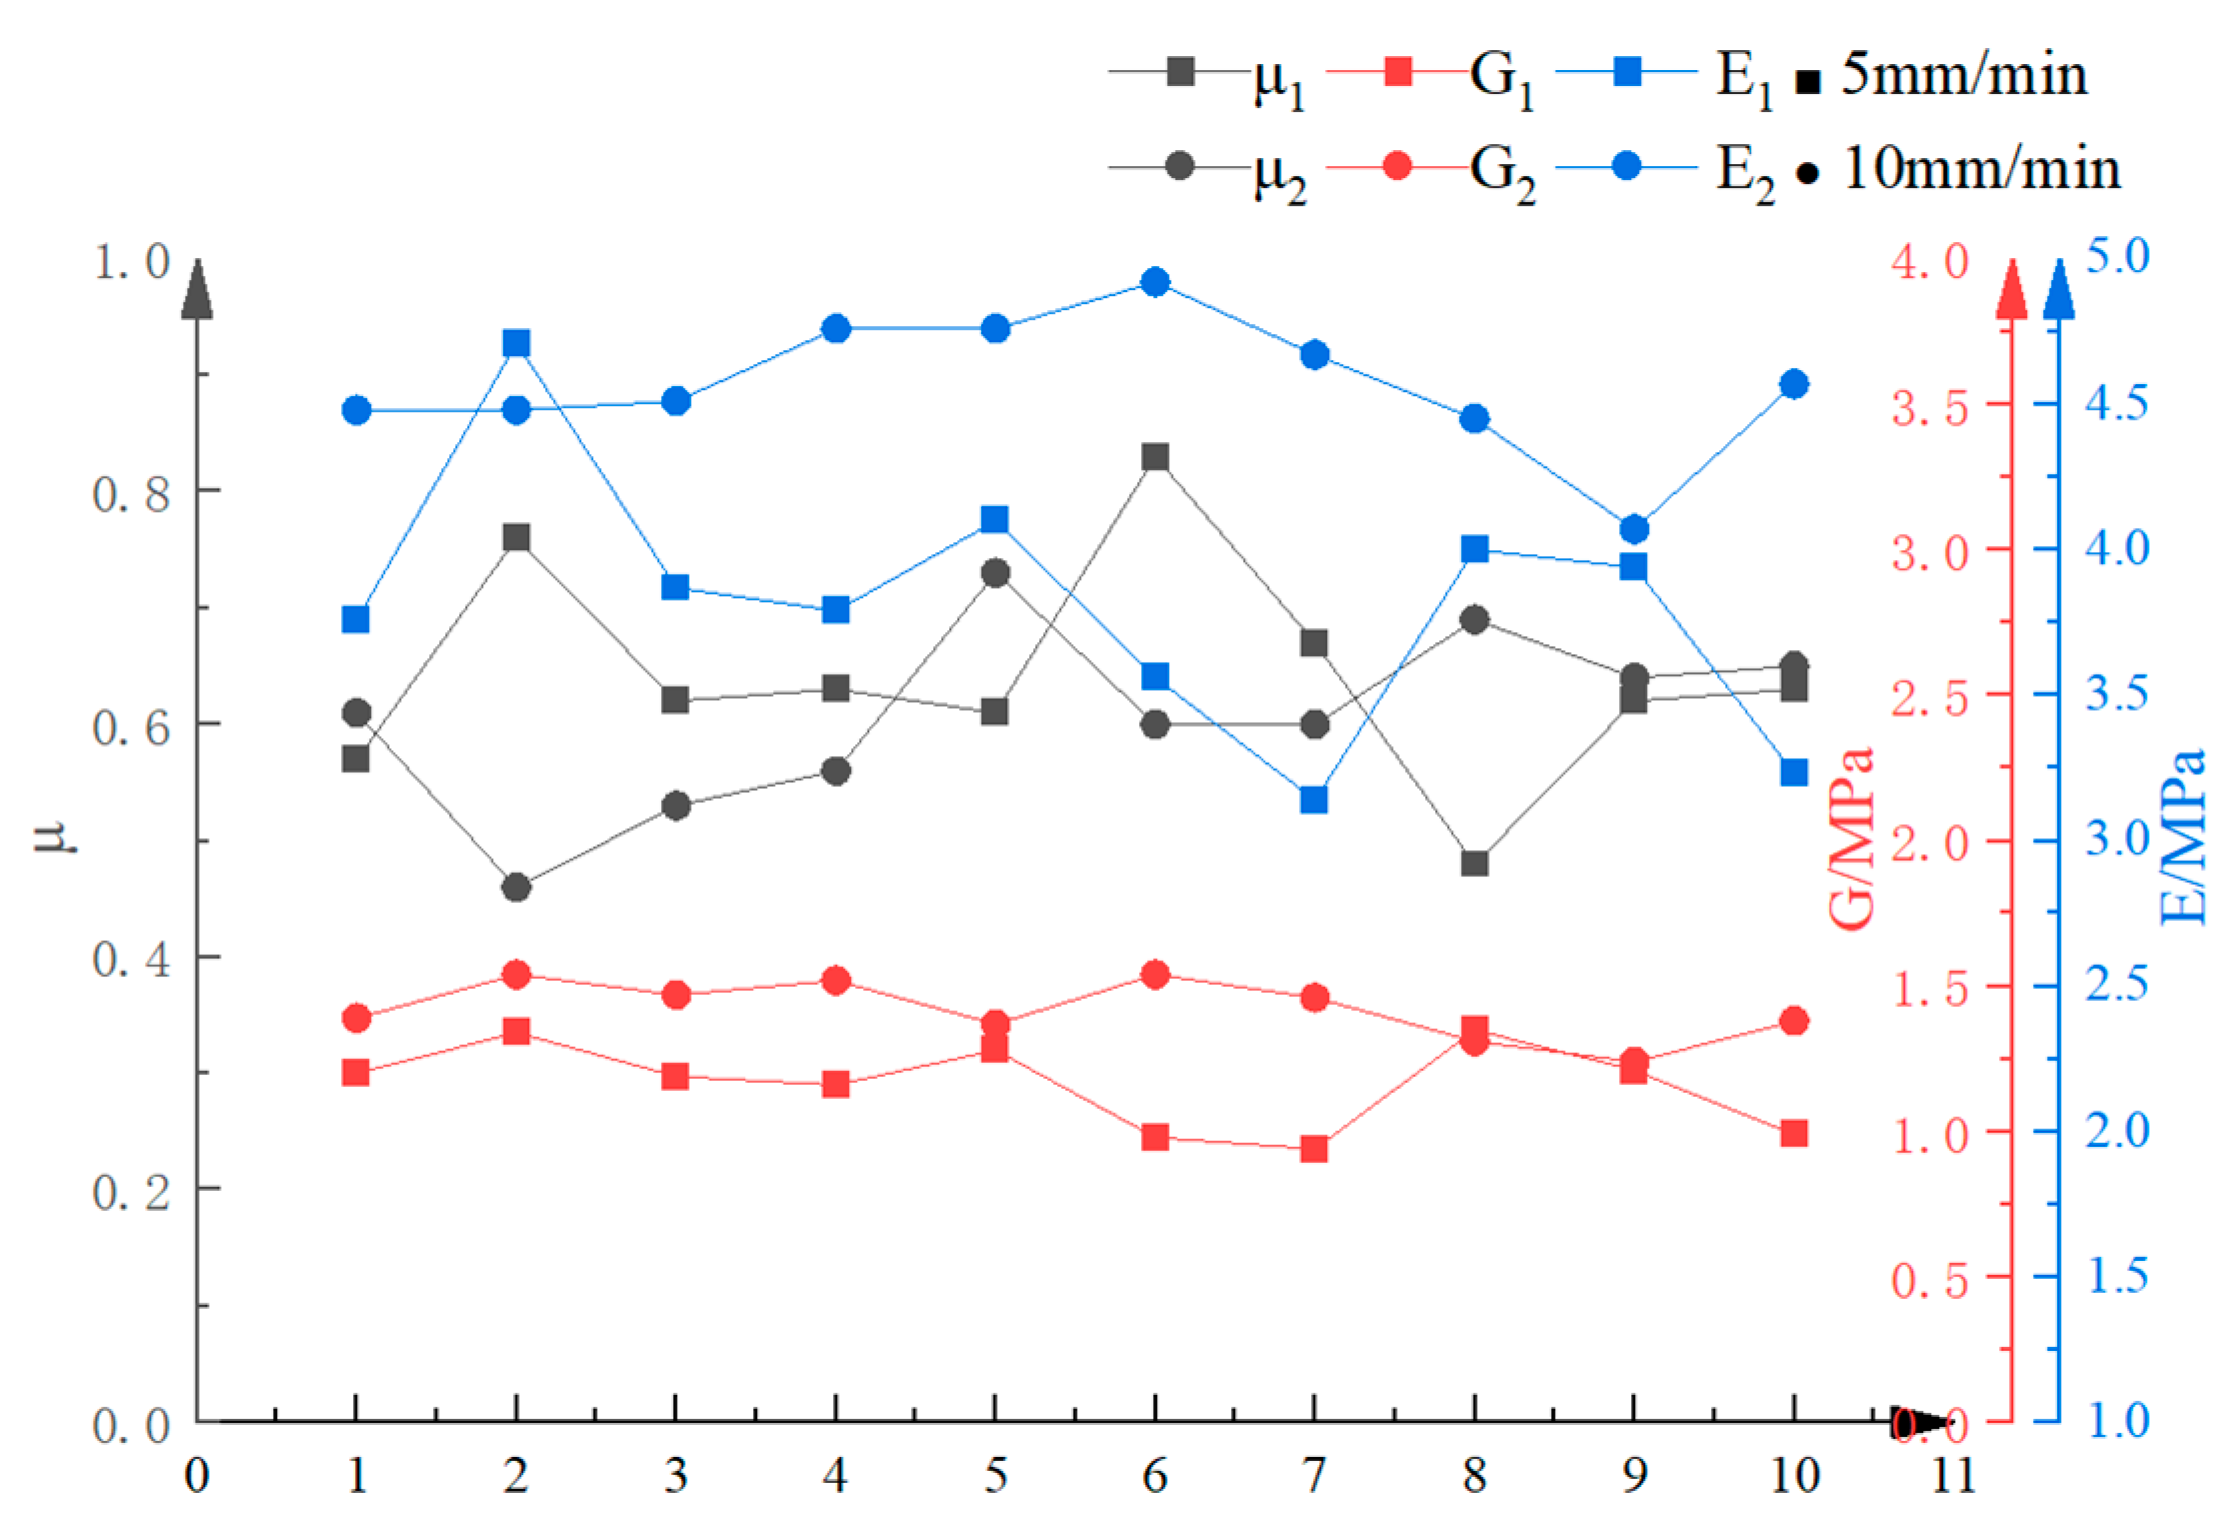
Under the loading rates of 5 mm/min and 10 mm/min, the Poisson’s ratio of Su-Shu 16 shows little variation, while the elastic modulus and shear modulus increase with the increase in loading speed, as indicated in Figure 11.
Figure 11.
Comparison chart of the Poisson’s ratio, elastic modulus, and shear modulus of Su-Shu 16 under different loading speeds.
As indicated in Table 7, when the loading speed is 5 mm/min, the maximum, minimum, and average values of the Poisson’s ratio for the Su-Shu 36 sample are 0.67, 0.52, and 0.58, respectively; The maximum, minimum, and average values of the elastic modulus are 4.7 MPa, 3.16 MPa, and 3.76 MPa, respectively; The maximum, minimum, and average shear modulus are 1.41 MPa, 1.04 MPa, and 1.19 MPa, respectively; The standard deviations of the sample’s Poisson’s ratio, elastic modulus, and shear modulus are 0.04, 0.47, and 0.12, respectively. The experimental data is less dispersed and has a high reliability.
Table 7.
Calculation of Elastic Modulus, Shear Modulus, and Poisson’s Ratio for Su-Shu 36 (5 mm/min).
As indicated in Table 8, when the loading speed is 10 mm/min, the maximum, minimum, and average values of the Poisson’s ratio for the Su-Shu 36 sample are 0.67, 0.52, and 0.58, respectively; The maximum, minimum, and average values of the elastic modulus are 5.17 MPa, 4.26 MPa, and 4.69 MPa, respectively; The maximum, minimum, and average shear modulus are 1.6 MPa, 1.3 MPa, and 1.46 MPa, respectively; The standard deviations of the sample’s Poisson’s ratio, elastic modulus, and shear modulus are 0.05, 0.54, and 0.15, respectively. The experimental data is less dispersed and has a high reliability.
Table 8.
Calculation of Elastic Modulus, Shear Modulus, and Poisson’s Ratio for Su-Shu 36 (10 mm/min).
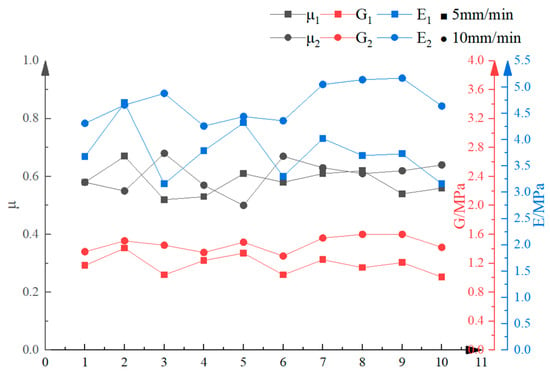
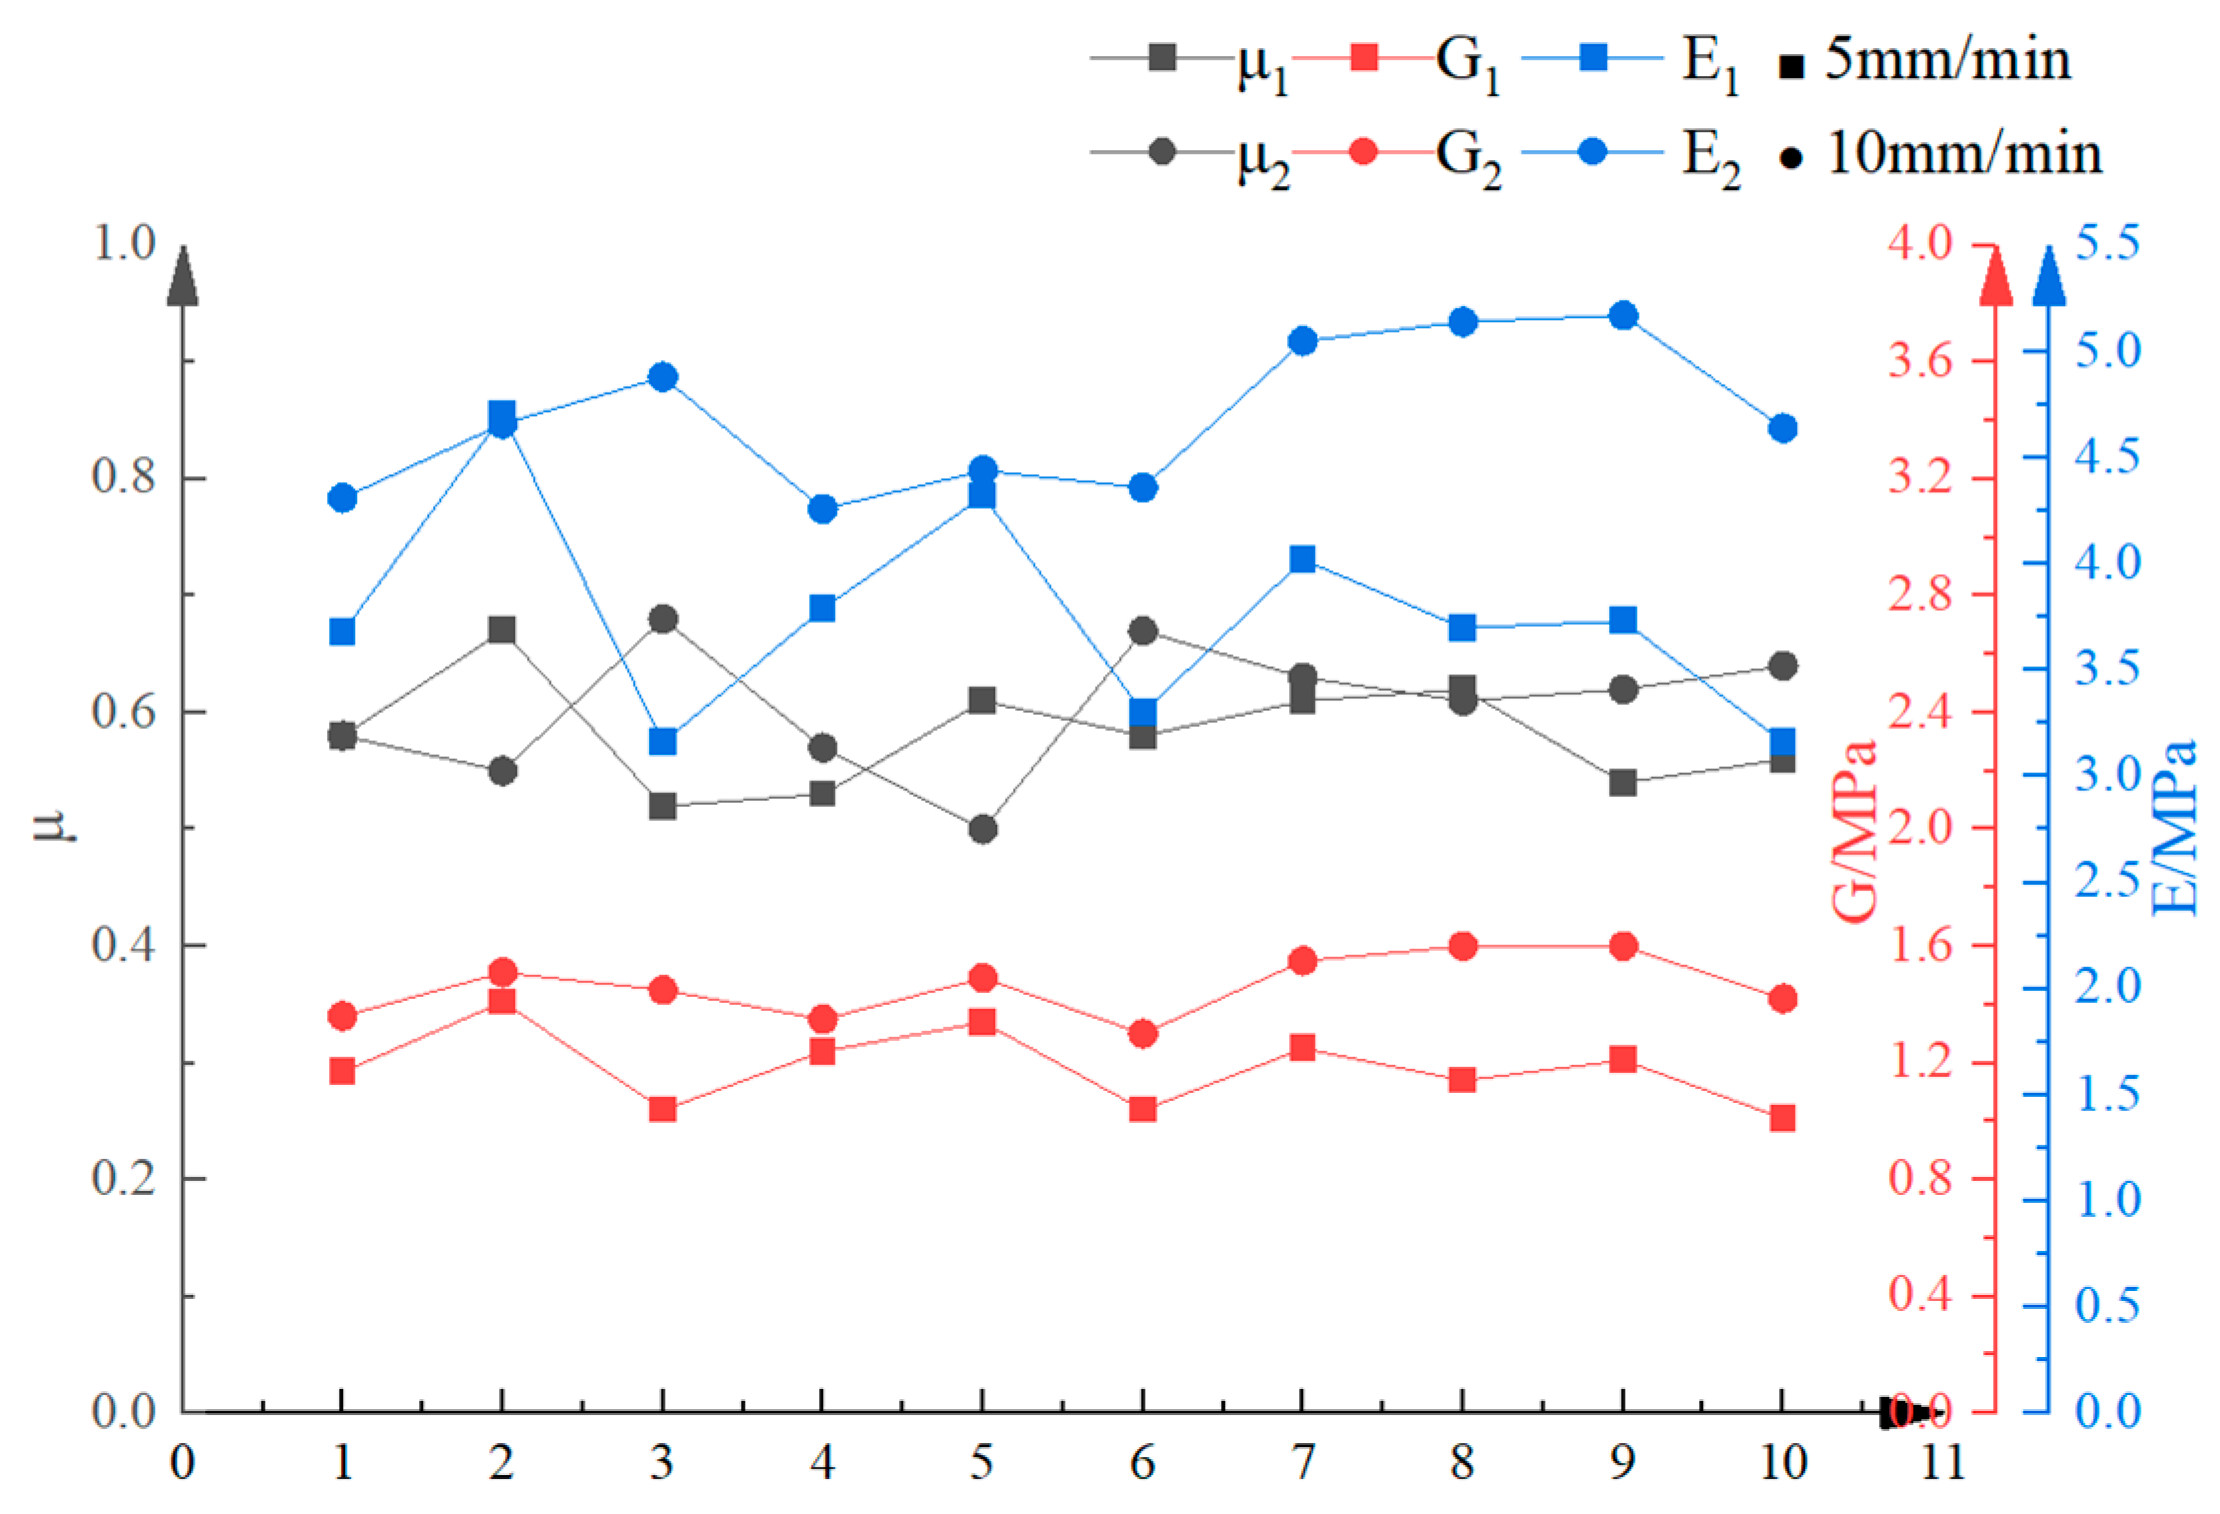
Under the loading rates of 5 mm/min and 10 mm/min, the Poisson’s ratio of Su-Shu 36 shows little variation, while the elastic modulus and shear modulus increase with the increase in loading speed, as indicated in Figure 12.
Figure 12.
Comparison chart of the Poisson’s ratio, elastic modulus, and shear modulus of Su-Shu 36 under different loading speeds.
As indicated in Table 9, when the loading speed is 5 mm/min, the maximum, minimum, and average values of the Poisson’s ratio for the Ning-Zi 4 sample are 0.73, 0.44, and 0.56, respectively; The maximum, minimum, and average values of the elastic modulus are 3.16 MPa, 2.36 MPa, and 2.79 MPa, respectively; The maximum, minimum, and average shear modulus are 1.04 MPa, 0.72 MPa, and 0.9 MPa, respectively; The standard deviations of the sample’s Poisson’s ratio, elastic modulus, and shear modulus are 0.1, 0.25, and 0.1, respectively. The experimental data are less dispersed and have a high reliability.
Table 9.
Calculation of Elastic Modulus, Shear Modulus, and Poisson’s Ratio for Ning-Zi 4 (5 mm/min).
As indicated in Table 10, when the loading speed is 10 mm/min, the maximum, minimum, and average values of the Poisson’s ratio for the Ning-Zi 4 sample are 0.67, 0.48, and 0.58, respectively; The maximum, minimum, and average values of the elastic modulus are 4.14 MPa, 3.01 MPa, and 3.44 MPa, respectively; The maximum, minimum, and average shear modulus are 1.29 MPa, 0.92 MPa, and 1.09 MPa, respectively; The standard deviations of the sample’s Poisson’s ratio, elastic modulus, and shear modulus are 0.07, 0.32, and 0.11, respectively. The experimental data is less dispersed and has a high reliability.
Table 10.
Calculation of Elastic Modulus, Shear Modulus, and Poisson’s Ratio for Ning-Zi 4 (10 mm/min).
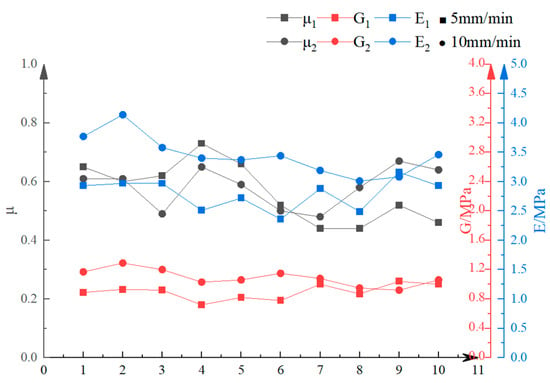
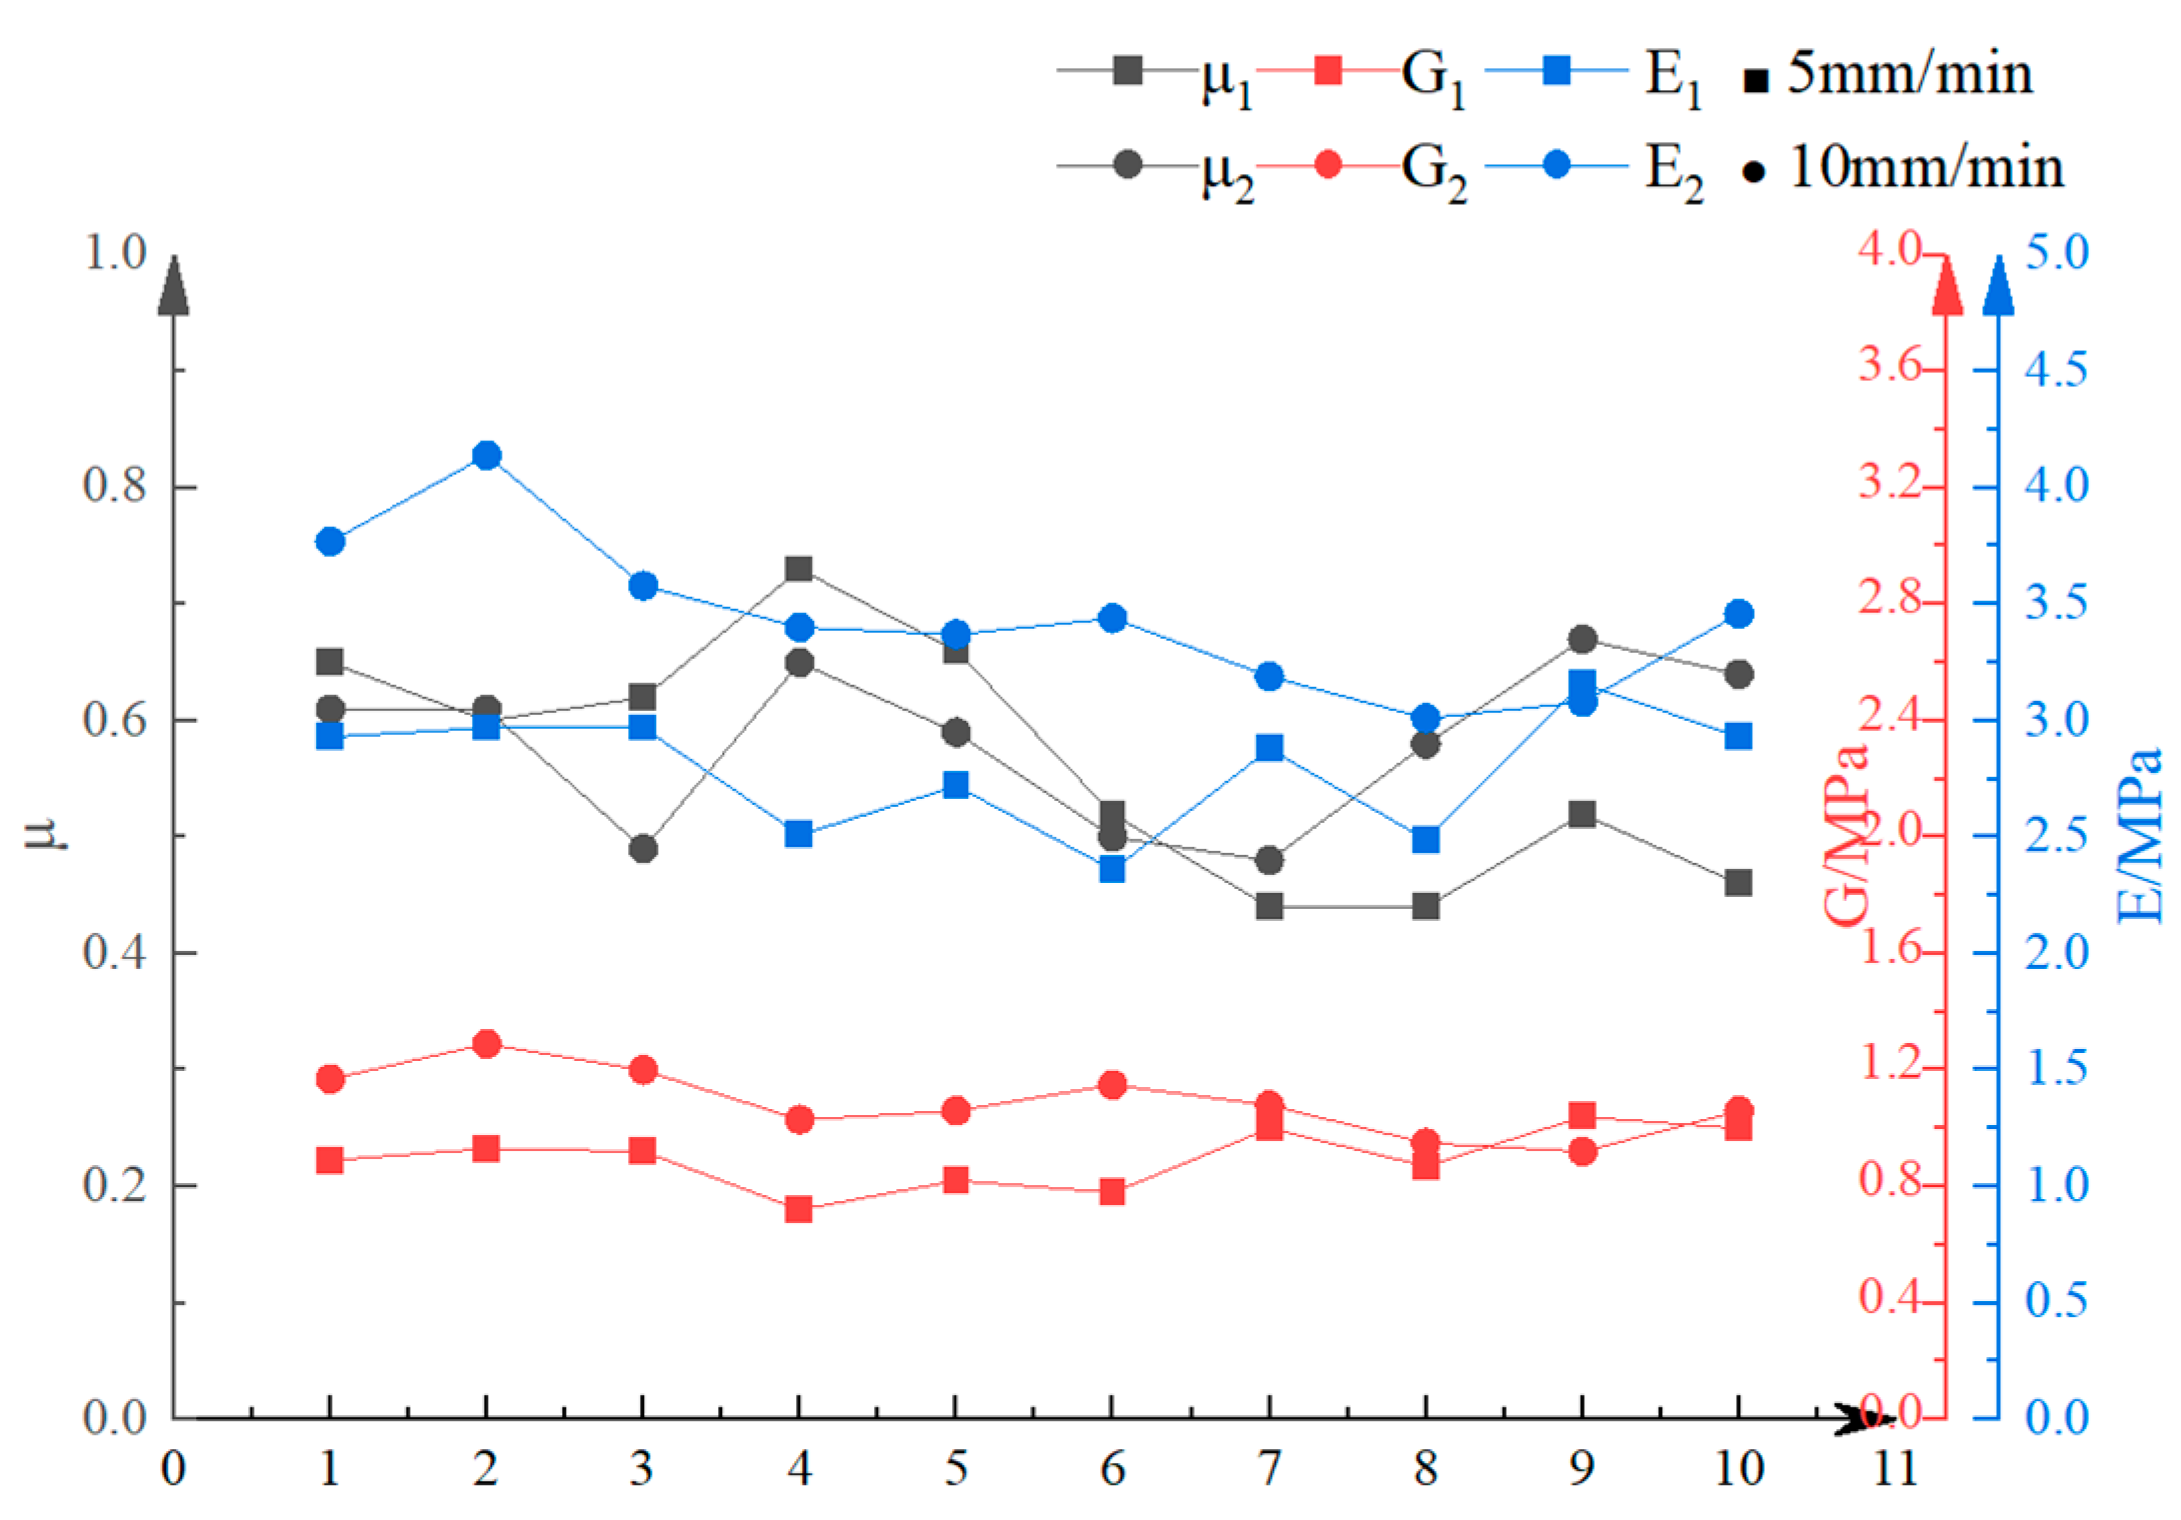
Under the loading rates of 5 mm/min and 10 mm/min, the Poisson’s ratio of Ning-Zi 4 shows little variation, while the elastic modulus and shear modulus increase with the increase of loading speed, as indicated in Figure 13.
Figure 13.
Comparison chart of Poisson’s ratio, elastic modulus, and shear modulus of Ning-Zi 4 under different loading speeds.
4. Discussion
Currently, sweet potatoes are mainly classified by use into fresh food type, starch processing type, fresh food and starch dual-purpose type, and purple sweet potatoes for fresh food [22,23]. The Su-Shu 16 selected for this experiment is a sweet potato for fresh consumption, Su-Shu 36 is a sweet potato for starch processing, and Ning-Zi 4 is a purple sweet potato for fresh consumption.
Previous studies have conducted simple research on the physical properties of sweet potatoes, but there are certain limitations and deficiencies. This study expands the research scope based on previous studies and investigates different varieties and uses of sweet potatoes. Su-Shu 16 and Ning-Zi 4, as fresh-eating sweet potatoes, have a certain impact on the sales volume of sweet potatoes due to their moisture content. A high moisture content can make sweet potatoes more prone to damage during harvest, while a low moisture content can reduce the palatability of fresh-eating sweet potatoes. Additionally, the density of sweet potatoes will have a certain impact on the yield. Experimental studies have shown that the density and moisture content of sweet potatoes during harvest will decrease as the harvest time extends, so it is necessary to choose the appropriate time to harvest fresh-eating sweet potatoes during the harvest period. According to experimental research, both the density and moisture content of sweet potatoes decrease as the harvest time is extended. In a span of twenty days, the moisture content of Su-Shu 16, Su-Shu 36, and Ning-Zi 4 decreased by 2.01%, 3.07%, and 4.38% respectively. Shen Haiyang et al. conducted experiments and obtained a moisture content of 75.31% and a density of 1.13 g/cm3 for Su-Shu 16 [15]. The water content of sweet potatoes varies from this experiment; considering the different meteorological conditions in different years and the different growth times of sweet potatoes when sampling, the difference in water content between the two is within a reasonable range. In this experiment, the water content of sweet potatoes of three varieties was measured at three time points, and all showed a trend of decreasing with the increase of growth time. Liu Chenglong et al. took Yan-Shu 25 as the experimental subject, with a sampling interval of three days each time. The measured water content of Yan-Shu 25 was 79.11%, 79.25%, and 79.14% [14]. The water content did not show a downward trend, which may be due to the variety of characteristics of Yan-Shu 25 and the short sampling interval, among other reasons.
According to experimental research, as the loading speed of the compression test increases, the ultimate compressive strength of sweet potatoes will improve, and the Poisson’s ratio, elastic modulus, and shear modulus will correspondingly increase, which is consistent with the results of previous studies. Shen Haiyang et al. measured the Poisson’s ratio, elastic modulus, and shear modulus of Su-Shu 16 to be 0.43, 4.01 MPa, and 1.4 MPa, respectively. Due to differences in the diameter, length, and moisture content of the samples taken, the experimental results varied, which is within a reasonable range.
The compressive strength limit of three varieties of sweet potatoes in the experiment is in the order of Su-Shu 36 > Su-Shu 16 > Ning-Zi 4, the order of elastic modulus is Su-Shu 36 > Su-Shu 16 > Ning-Zi 4, and the order of shear modulus is Su-Shu 36 > Su-Shu 16 > Ning-Zi 4. The compressive strength limit is the critical value of pressure that sweet potatoes can withstand without causing damage to the flesh. The larger the elastic modulus and shear modulus, the greater the force required to cause damage to sweet potatoes. From the compression test, it can be seen that among the three varieties, Su-Shu 36 has the strongest resistance to damage, followed by Su-Shu 16, and finally Ning-Zi 4.
Currently, the research on the physical properties of different varieties of sweet potatoes is essentially in a blank stage, with most studies focusing only on a specific parameter of a single variety, which may lead to a lack of data reference when designing key components of sweet potato harvesters. At the same time, the phenomenon of ‘one machine for multiple uses’ exists in most areas, where a single sweet potato harvester is used to harvest sweet potatoes of different varieties and purposes. The physical properties of sweet potatoes from different varieties vary, and their resistance to damage differs, thus requiring adjustments to the relevant operational parameters of the key components of the sweet potato harvester during harvesting. Studying the physical properties of sweet potatoes of different varieties during the harvest period can provide a reference for the design of key components of sweet potato harvesters and the setting of operational parameters, thereby reducing damage during sweet potato harvesting.
5. Conclusions
- (1)
- The experimental dates were 15 October 2023, 25 October 2023, and 4 November 2023. The moisture content of Su-Shu 16 was 74.35%, 73.89%, and 72.34%, respectively; the moisture content of Su-Shu 36 was 62.74%, 59.94%, and 59.67%, respectively; and the moisture content of Ning-Zi 4 was 71%, 68.93%, and 66.62%, respectively. It can be seen that the moisture content of sweet potatoes decreases with the increase of growth time during the harvest period. At these three sampling times, the density of Su-Shu 16 was 1.13 g/cm3, 1.10 g/cm3, and 1.04 g/cm3, respectively; the density of Su-Shu 36 was 1.15 g/cm3, 1.14 g/cm3, and 1.11 g/cm3, respectively; and the density of Ning-Zi 4 was 1.09 g/cm3, 1.08 g/cm3, and 1.06 g/cm3, respectively.
- (2)
- Through the compression test of sweet potatoes, it can be observed that when the loading speed is 5 mm/min, the compressive strength limits of Su-Shu 16, Su-Shu 36, and Ning-Zi 4 are 33~46 N, 39~55 N, and 25~40 N, respectively. The Poisson’s ratios are 0.64, 0.58, and 0.56, respectively. The elastic moduli are 3.81 MPa, 3.76 MPa, and 2.79 MPa, respectively. The shear moduli are 1.16 MPa, 1.19 MPa, and 0.9 MPa respectively. When the loading speed is 10 mm/min: The compressive strength limits of Su Shu 16, Su Shu 36, and Ning Zi 4 are 46 N~63 N, 49 N~65 N, and 33 N~48 N, respectively. The Poisson’s ratios are 0.61, 0.60, and 0.58, respectively. The elastic moduli are 4.57 MPa, 4.69 MPa, and 3.44 MPa respectively. The shear moduli are 1.42 MPa, 1.46 MPa, and 1.09 MPa, respectively.
Author Contributions
Conceptualization, J.P. and H.S.; methodology, J.P., B.P. and L.H.; software, J.P., S.H. and G.W.; validation, J.P., G.X. and Z.Z.; formal analysis, J.P., Z.Z. and W.Z.; investigation, H.S. and G.X.; resources, B.P., L.H. and G.W.; data curation, J.P., H.S. and Z.Z.; writing—original draft preparation, J.P.; writing—review and editing, L.H.; G.W. and H.S.; visualization, G.X., S.H. and W.Z.; supervision, B.P.; project administration, G.W.; funding acquisition, L.H. All authors have read and agreed to the published version of the manuscript.
Funding
This research was funded by Supported by the earmarked fund for CARS-10-Sweet potato.
Institutional Review Board Statement
Not applicable.
Data Availability Statement
The data presented in this study are available on request from the corresponding author. The data are not publicly available due to privacy.
Conflicts of Interest
The authors declare no conflict of interest.
References
- Li, Q.; Zhao, H. Analysis and perspectives of sweet potato industry contributing to national food security in China. Jiangsu J. Agric. Sci. 2022, 38, 1484–1491. [Google Scholar] [CrossRef]
- Fang, B.P.; Zhang, X.J. The history and status of sweet potato germplasm research in China. Guangdong Agric. Sci. 2004, S1, 3–5. [Google Scholar] [CrossRef]
- He, W.Z.; Mu, T.H. The Current status of Chinese sweet potato processing technologies. Food Res. Dev. 2006, 11, 176–180. [Google Scholar]
- Hu, L.L.; Tian, L.J. Analysis and discussion on the restriction causations for harvesting mechanization of sweet potato in China. J. Agric. Sci. Technol. 2011, 235, 16–18. [Google Scholar] [CrossRef]
- Vithu, P.; Dash, S.K.; Kalpana Rayaguru, K.R. Post-harvest processing and utilization of sweet potato: A review. Food Rev. Int. 2019, 35, 726–762. [Google Scholar] [CrossRef] [Scilit]
- Cartier, A.; Woods, J.; Sismour, E.; Allen, J.; Ford, E.; Githinji, L.; Xu, Y. Physiochemical, nutritional and antioxidant properties of fourteen Virginia-grown sweet potato varieties. J. Food Meas. Charact. 2017, 11, 1333–1341. [Google Scholar] [CrossRef] [Scilit]
- Wu, T.; Hu, L.L. Design and test of walking sweet potato (Ipomoea batatas) vines crushing and returning machine. Trans. Chin. Soc. Agric. Eng. 2017, 33, 8–17. [Google Scholar] [CrossRef]
- Wang, B.; Hu, L.L. Damage mechanism study of chain-lever elevator sweet potato harvester. J. China Agric. Univ. 2014, 19, 174–180. [Google Scholar] [CrossRef]
- Ma, P.; Liu, Y. Study on factors affecting the skin breakage rate of sweet potato harvesters. Mod. Agric. Sci. Technol. 2020, 6, 158+162. [Google Scholar]
- Zheng, G.; Xu, P. Design and experimentation of conveying and separating device for fresh-eating sweet potato harvester in sandy soil. J. Agric. Sci. Technol. 2024, 5, 1–9. [Google Scholar] [CrossRef]
- Gao, G.H.; Xie, H.F. Experimental study and analysis on collision damage of sweet potato in drop. Chin. Agric. Mech. 2019, 40, 85–90. [Google Scholar] [CrossRef]
- Bao, G.C.; Wang, G.P. Study on the drop impact characteristics and impact damage mechanism of sweet potato tubers during harvest. PLoS ONE 2021, 16, e0255856. [Google Scholar] [CrossRef] [Scilit] [PubMed]
- Bao, G.C.; Wang, G.P. Design and optimization of the height self-adjusting device for sweet potato combined harvesters. Trans. Chin. Soc. Agric. Eng. 2023, 39, 24–33. [Google Scholar] [CrossRef]
- Liu, C.L. Study on Design and Damage Law of Sweet Potato Combine Harvester. Master’s Thesis, Shandong Agricultural University, Tai’an, China, 2021. [Google Scholar] [CrossRef]
- Shen, H.Y.; Ji, L.L. Study on the mechanical and physical parameters of sweet potato tuber during harvest. J. Chin. Agric. Mech. 2020, 41, 55–61. [Google Scholar] [CrossRef]
- Cui, Z.K.; Zhang, H. Design and test of 4U-750 trailing type sweet potato harvester. J. Chin. Agric. Mech. 2020, 41, 1–5. [Google Scholar] [CrossRef]
- Fan, Y. Research on Potato Digging Mechanism Based on Discrete Element Method and Design of Bionic Shovel. Master’s Thesis, Shenyang Agricultural University, Shenyang, China, 2020. [Google Scholar] [CrossRef]
- Wang, L. Analysis and Research on the Mechanical Experiment of Potato Drop Impact. Master’s Thesis, Inner Mongolia University of Science & Technology, Inner Mongolia, China, 2023. [Google Scholar] [CrossRef]
- GB 5009.3-2016; National Food Safety Standard, Determination of Moisture in Food. Standards Press of China: Beijing, China, 2016.
- Liu, D.J. Comparison of cutting method and drainage method in density detection of emulsion explosive. Guangzhou Chem. Ind. 2020, 48, 91–92. [Google Scholar]
- Ouyang, A.G.; Hou, Z.G. Elastic modulus and poisson’s ratio of pear fruit flesh based on compression experiment. Sci. Technol. Eng. 2019, 19, 82–87. [Google Scholar]
- Yi, Z.Y.; Wang, X. Breeding innovation and development of sweet potato industry. Jiangsu J. Agric. Sci. 2018, 34, 1401–1409. [Google Scholar] [CrossRef]
- Xie, Y.Z.; Bian, X.F. Development status and prospect of fresh sweet potato industry in China. Jiangsu J. Agric. Sci. 2022, 38, 1694–1701. [Google Scholar] [CrossRef]

Disclaimer/Publisher’s Note: The statements, opinions and data contained in all publications are solely those of the individual author(s) and contributor(s) and not of MDPI and/or the editor(s). MDPI and/or the editor(s) disclaim responsibility for any injury to people or property resulting from any ideas, methods, instructions or products referred to in the content. |
© 2024 by the authors. Licensee MDPI, Basel, Switzerland. This article is an open access article distributed under the terms and conditions of the Creative Commons Attribution (CC BY) license (https://creativecommons.org/licenses/by/4.0/).