


Abstract
Background/Objectives: To assess, with ultrasound, changes in the thickness of the superficial and deep fascia and in pain after treatment with the Fascial Distortion Model (FDM) or deep tissue massage (DTM), and to compare the two therapies in an exploratory manner. Methods: In this prospective, non-randomized comparative study (September 2023–July 2024) registered retrospectively in ClinicalTrials.gov, 295 patients with musculoskeletal pain of the arm, forearm, or calf received three sessions of FDM or DTM, as prescribed by a physician, on alternate days. Fascia thickness (primary outcome) was measured with a 5–12 MHz linear probe and ImageJ software, and pain (secondary outcome) with a visual analog scale (VAS), before and 7 days after therapy. Within-group changes were tested with paired Student’s t or Wilcoxon tests, and post-treatment values were compared between groups with independent t or Mann–Whitney U tests, with Holm correction for multiple comparisons and effect sizes, and baseline-adjusted differences were estimated with analysis of covariance (ANCOVA). Results: Pain decreased in all subgroups; in the arm, mean VAS fell from 6.24 to 3.84 after DTM and from 5.86 to 1.28 after FDM. Fascia thickness decreased statistically in both groups, but the mean changes were very small (0.001–0.006 mm after DTM and 0.021–0.033 mm after FDM) and below the nominal axial resolution of the transducer. After therapy, VAS was lower after FDM than after DTM in the arm (r = 0.60) and forearm (r = 0.47; both Holm-adjusted p < 0.001), but not in the calf; adjusted for baseline, VAS was 2.4 (arm) and 2.2 (forearm) points lower after FDM. Post-treatment fascia thickness did not differ between groups after correction for multiple comparisons, and the baseline-adjusted decreases, although greater after FDM by about 0.02 mm in all regions, remained below the resolution of the method. Conclusions: Both therapies were followed by short-term pain reduction, which was greater after FDM in the arm and forearm. The changes in fascia thickness are within the probable measurement error and should not be interpreted as structural tissue remodeling. Given the non-randomized design, the absence of an untreated control group, and the 7-day follow-up, the findings are exploratory and do not allow the mechanism proposed by the FDM to be confirmed.
1. Introduction
In recent years, physiotherapeutic methods for acute and chronic pain have developed considerably, especially manual therapies directed at connective tissue. Fascia is described as a tissue that envelops every structure of the body and forms a structural continuity that gives shape to tissues and organs [1]. It surrounds, penetrates, and supports blood vessels, bone, the meninges, the spinal cord, organs, and skeletal muscles [2,3]. Fascia is richly innervated, although the density and type of innervation are not homogeneous, and it can perceive mechanical distortion or tension along a particular axis. It can play a key role in proprioception, nociception, and coordination [4,5]. Through tensegrity and mechanotransduction, tension is transferred to structures far from its origin. Current studies indicate that about 30% of the force generated by a muscle is transmitted to the surrounding fascia and the remaining 70% to the bone to produce movement [6]. Increased fascia thickness has been associated with reduced joint flexibility and with pain, including post-traumatic pain [7,8]. Ultrasound imaging is an important tool for assessing connective tissue [9], and in recent years researchers have begun to evaluate structures that could not be visualized before, fascia among them [10,11].
Fascia is classified mainly into superficial (SF) and deep (DF) layers. The superficial fascia lies within the subcutaneous tissue: superficial adipose tissue (SAT) is an integral part of it, and a fibroelastic layer of superficial fascia is firmly connected to the skin through the SAT. Beneath the SF lies deep adipose tissue (DAT), which is closely related to the deep fascia surrounding the muscles. On ultrasound, fascia appears as a hyperechoic fibroelastic layer connected by septa, with the SF strongly related to the skin and the DF to the muscle [12,13,14].
In the early 1990s, Stephen Typaldos described a strong correlation between presenting pain symptoms and fascial distortion, and he created the Fascial Distortion Model (FDM), a method of diagnosis and treatment focused on connective tissue. In this model, diagnosis relies on the patient’s verbal and nonverbal communication to identify specific fascial deformities [15,16]. Studies indicate that FDM is applicable in physiotherapy, can reduce pain, and can improve joint range of motion [17,18,19,20,21,22,23]. The method rests on the hypothesis that deformation or distortion of the fascia is responsible for musculoskeletal disorders. The literature contains many discrepancies, which hinder clinical application, and the model has been criticized because too few clinical or basic studies support its empirical foundations [16].
Deep tissue massage is a widely used form of soft-tissue therapy in which slow, deep strokes and sustained pressure are applied to muscles and fascia over relatively large areas. It has been shown to reduce pain, for example, in patients with low back pain [24]. Clinical trials and systematic reviews of myofascial release likewise report reductions in pain and improvements in function in musculoskeletal conditions [25,26]. These clinical outcomes, however, should be distinguished from direct evidence of structural change in fascial tissue, which is scarce, and pain relief after manual therapy is increasingly explained by neurophysiological mechanisms rather than by mechanical deformation of tissue [27]. Although some FDM techniques use deep gliding pressure similar to DTM, the two approaches differ in rationale: FDM is a targeted, analytical approach in which a precise force vector is applied to a specific distortion identified from the patient’s description and body language, whereas DTM is a more global approach in which force is distributed over a larger area.
The aim of this study was to assess, with ultrasound, the thickness of the superficial and deep fascia, and pain intensity in patients treated with FDM or DTM, and to compare the two therapies. Specifically, do fascia thickness change after a short course of each therapy, does the reduction in pain differ between a targeted (FDM) and (DTM) manual approach, and is fascia thickness related to age, body weight, and pain? Because allocation was not randomized and no untreated control group was included, the study was designed as an exploratory comparison.
2. Materials and Methods
2.1. Study Design, Allocation, and Participants
This prospective, non-randomized, comparative study was conducted from September 2023 to July 2024 at the Family Medica clinic in Warsaw, Poland. Treatment allocation was not randomized. Patients presenting with musculoskeletal pain of the arm, forearm, or calf were examined by a physician who was blinded to the aims of the study and who prescribed one of two myofascial treatments, FDM or DTM, as part of routine clinical care. A medical registrar who had no information about the research then assigned each patient to an available physiotherapist delivering the prescribed treatment. No random sequence was generated, and no allocation concealment procedure was used; thus, selection bias and confounding by indication cannot be excluded. Patients could not be blinded to the type of therapy; the physiotherapist who performed treatment was not blinded; and the ultrasound examinations and measurements were blinded to the aims of the study. Gender was defined as how patients view themselves. In total, 295 patients (148 men and 147 women) were included. Each therapy group was divided into three subgroups according to the location of symptoms: arm, forearm, and calf. Patients received three treatments on alternate days. Participant characteristics (range, followed by mean and standard deviation in parentheses) were as follows:
- •
- DTM, arm (n = 50): age 18–58 years (36.92, 12.40); weight 61–96 kg (76.36, 9.03); baseline VAS 3–10 (6.24, 1.86).
- •
- DTM, forearm (n = 48): age 18–60 years (36.52, 12.17); weight 61–102 kg (77.94, 9.77); baseline VAS 2–10 (5.81, 2.08).
- •
- DTM, calf (n = 47): age 18–60 years (37.00, 12.63); weight 61–102 kg (78.00, 9.61); baseline VAS 2–10 (5.98, 2.33).
- •
- FDM, arm (n = 50): age 18–60 years (37.12, 13.16); weight 60–96 kg (75.82, 9.44); baseline VAS 1–10 (5.8, 2.27).
- •
- FDM, forearm (n = 50): age 18–59 years (33.08, 11.19); weight 60–99 kg (75.84, 9.30); baseline VAS 2–10 (6.64, 2.19).
- •
- FDM, calf (n = 50): age 18–60 years (37.92, 12.10); weight 61–102 kg (77.90, 9.49); baseline VAS 2–10 (5.78, 2.29).
Inclusion criteria were age 18–60 years, pain of musculoskeletal origin treated with FDM or deep tissue massage, no contraindications to myofascial therapy, no neurological disease, and voluntary consent to participate. Exclusion criteria were withdrawal of consent or from the study, cancer, disrupted skin continuity at the examination site, previous surgery at the study site, large vascular changes, inflammatory changes or sensory disturbances in the examined areas, and discontinuation or change of the type of therapy. Patients presented with painful shoulder syndrome, tennis elbow, muscle strains, and overuse-related pain at varying intervals following the onset of initial symptoms. 295 patients completed both assessments and therapy and were analyzed. Patients were also asked not to receive other treatments for the same complaint during the study period.
2.2. Interventions
Both interventions were delivered in three sessions on alternate days. Each session lasted approximately 30 min. FDM was delivered by a physiotherapist certified in FDM with 6 years of clinical experience, and DTM by a physiotherapist with 8 years of experience in massage therapy. Each therapist delivered only one type of intervention, and the therapists were not informed of the study aims.
Treatment followed the FDM diagnostic and therapeutic approach [15]. The type of distortion was identified from the patient’s verbal description of the pain and from body language, and the corresponding technique was applied. The trigger band technique (gliding thumb pressure along the line indicated by the patient, starting from the painful starting point, with the interphalangeal joint of the thumb flexed to about 90° and the force vector not passing in a straight line through the forearm and wrist). The continuum distortion technique (strong, stationary thumb pressure on the painful point at the transition zone, held for 5–30 s until release). The herniated trigger point technique (gradually increasing, stationary thumb pressure directed into the most sensitive part of the tissue protrusion for at least 5–10 s, aimed at moving the protruding tissue below the fascial plane); the folding distortion techniques (joint traction, or compression with a thrust at the end of the range, with the force vector changed until relief was reported). The cylinder distortion techniques (the two-handed “squeegee” and double-thumb techniques) and, for tectonic fixation, the tectonic pump (slow, rhythmic passive movement of the joint, one cycle every 3–5 s). Thus, in addition to deep gliding pressure, strong stationary pressure techniques and joint traction and compression were used whenever indicated by the diagnosis. Pressure was not measured instrumentally. In the FDM approach, the intensity was graded to the patient’s tolerance and to the perceived yielding of the tissue. The selection and number of techniques were individualized and were not recorded per session.
DTM consisted of superficial effleurage to warm the tissue, followed by slow, deep longitudinal gliding strokes and sustained pressure applied with the thumbs, knuckles, forearm, and elbow along and across the fibers of the muscles and fascia of the symptomatic region. Pressure was increased progressively to the patient’s tolerance without provoking muscle guarding and, as in the FDM group, was not measured instrumentally.
Treatment fidelity was not formally monitored (no checklists or recordings were used). The standardization relied on the therapists’ training in the respective method.
2.3. Ultrasound Examination
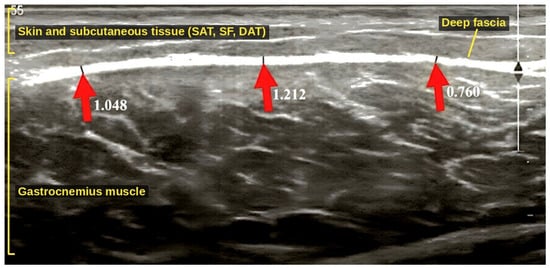
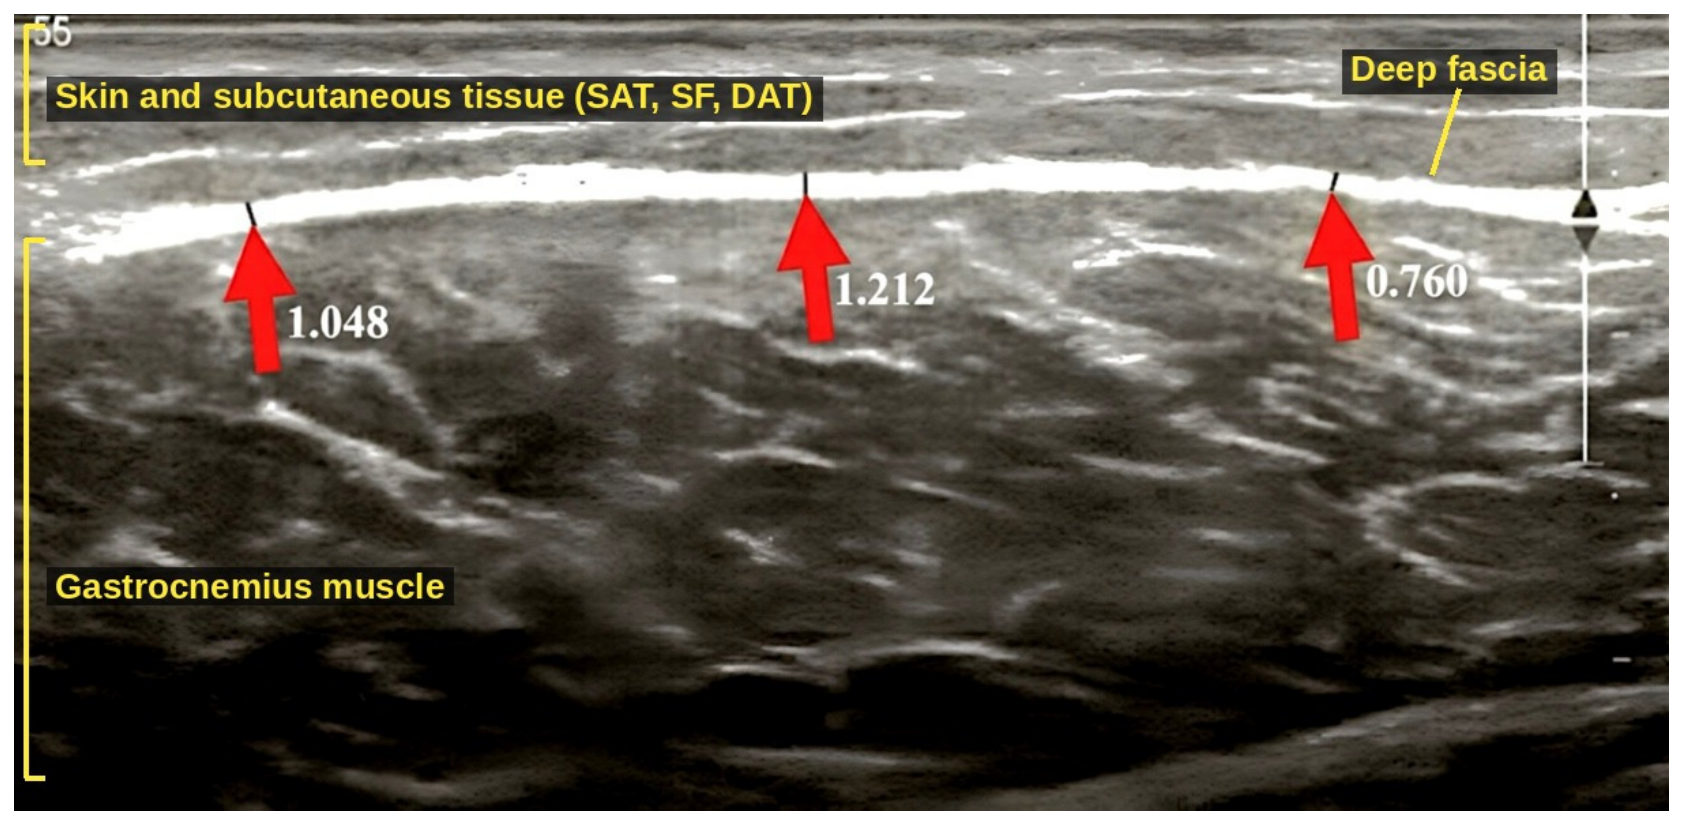
Ultrasound examinations were performed by one physiotherapist qualified in soft-tissue ultrasound (5 years of experience), who was blinded to the study aims and did not deliver the interventions. Two examinations were performed, before the first session and 7 days after the last session, with a Philips Affiniti 70G ultrasound system (Philips Polska sp.z.o.o, Al. Jerozolimskie 195B, 02-222 Warsaw, Poland) and a linear transducer (5–12 MHz; model L12-5 50mm). The examinations were performed in the superficial (musculoskeletal) mode. The range of control settings was operating frequency 5–12 MHz, gain 50–60%, depth 1.5–6.0 cm (approximately 3 cm for most acquisitions), focus 0.5–6.0 cm, and dynamic range 65–75 dB. To standardize the assessment, the ultrasound protocol described by Pirri et al. [8,13,14] was used. The same examiner, equipment, presets, patient positions, and anatomical landmarks (measured with a tape from bony landmarks) were used at both examinations. The transducer was placed longitudinally on a generous layer of gel and stabilized with light contact, sufficient only to maintain full skin contact and a good-quality image, to avoid compression of the subcutaneous tissue. The beam was kept perpendicular to the fascial layers to avoid anisotropy. Probe pressure was not measured instrumentally. For each site and time point, the image with the best visibility of the examined fascial layer was stored. Fascia thickness was measured in millimeters with ImageJ version 1.54 ( Research Services Branch (RSB) of the National Institute of Mental Health (NIMH), Bethesda, Maryland, USA) as the distance between the upper and lower borders of the hyperechoic fascial layer at three representative points, and the three values were averaged (Figure 1). Intra- and inter-rater reliability were not assessed in this study. Calibration and setting the scale were carried out using the straight-line tool. A reference segment was marked as a 2.5 cm-long bar. The software measured the length of this selection in pixels (ImageJ determines that 100 pixels correspond to 1 cm). The information is stored in the program’s memory as a conversion factor. Drawn measurement lines at the locations indicated by arrows in the image (Figure 1), ImageJ measures the length of each of these lines in pixels. The software automatically divides the line length (measured in pixels) by the scale factor derived from the reference bar. The result is instantly converted and displayed in physical units (millimeters).
Figure 1.
Measurement of deep fascia thickness of the gastrocnemius muscle in ImageJ. Longitudinal ultrasound image of the calf, with the skin and subcutaneous tissue (superficial adipose tissue, superficial fascia, deep adipose tissue) at the top, the hyperechoic deep fascia, and the gastrocnemius muscle below. Red arrows indicate the three measurement points of the deep fascia, measured from its upper to its lower border; the numbers next to the arrows are the measured thicknesses in millimeters, and their mean (1.007 mm) was used for analysis.
Scanning covered a rectangular area of 3 × 5 cm at the following sites:
- •
- Arm: patient supine, upper limb in a neutral position; ventral side of the arm, 10 cm distal to the coracoid process of the scapula, at the level of the biceps brachii muscle.
- •
- Forearm: patient supine, upper limb along the body, forearm pronated; dorsal side, 10 cm distal to the olecranon.
- •
- Calf: patient prone with straight legs and support under the ankles; 10 cm distal to the top of the head of the fibula, over the gastrocnemius muscle.
2.4. Statistical Analysis
Statistical analysis was performed with Statistica 13 (StatSoft Polska, Kraków, Poland). Fascia thickness (SF and DF) was defined as the primary outcome and pain intensity (VAS) as the secondary outcome; the correlation analyses were exploratory. Normality of distribution was assessed with the Shapiro–Wilk test. Differences before and after therapy within groups were tested with Student’s t test for dependent samples or the Wilcoxon test, depending on the distribution of the variable. For the t test, the mean difference (after − before) with its 95% confidence interval (CI) and Cohen’s dz are reported. Differences between groups after therapy were tested with Student’s t test for independent samples (normally distributed data, mean difference, 95% CI, and Cohen’s d) or the Mann–Whitney U test (non-normally distributed data, U, Z with continuity and tie correction, and the effect size r = Z/√N). The comparisons between groups were performed with the Holm–Bonferroni procedure [28]. Correlations are interpreted as exploratory. Because baseline values differed between groups, particularly for VAS, the mean changes (before and after) in both groups and their between-group differences are also reported, and baseline-adjusted between-group differences were estimated with analysis of covariance (ANCOVA), with the post-treatment value as the dependent variable, group as the factor, and the baseline value as the covariate [29]. The nine ANCOVA p values were adjusted with the Holm–Bonferroni procedure, partial η2 is reported as the effect size, and homogeneity of regression slopes was checked by adding a group × baseline interaction term. ANCOVA was computed from the raw data in Python3.13 (NumPy 2.5, SciPy 1.18). Relationships between age, body weight, VAS, and fascia thickness were assessed with Spearman’s rank correlation coefficient. No a priori sample size calculation was performed; all eligible patients treated during the study period were included. A sensitivity analysis showed that 47–50 patients per subgroup would be required. The study had 80% power (two-sided α = 0.05) to detect a between-group standardized difference of d = 0.58 (d = 0.75 at the Bonferroni-corrected α = 0.0056). Differences were considered statistically significant at p < 0.05.
2.5. Ethical Approval and Registration
The study was carried out in accordance with the Declaration of Helsinki (2013). The experimental protocol was approved by the Ethics Senate Committee on Research Ethics (No. SKE 01-61/2023), and informed consent was obtained from all participants. The study was registered at ClinicalTrials.gov retrospectively after the completion of recruitment.
3. Results
The normality of the distributions of individual variables in the studied groups is shown in Table 1. Some variables deviated from a normal distribution (marked with an asterisk), which determined the test used for the comparisons before and after therapy: Student’s t test for normally distributed variables (Table 2) and the Wilcoxon test for the remaining variables (Table 3). Mean fascia thickness varied with location; the structures were thinnest in the arm and thickest in the calf (Table 1). Across regions, mean changes after therapy in SF and DF thickness ranged from 0.001 to 0.006 mm in the DTM group and from 0.021 to 0.033 mm in the FDM group. These changes are smaller than the nominal axial resolution of the transducer (approximately 0.1–0.2 mm), and their reliability could not be established. Mean reductions in VAS ranged from 2.15 to 3.96 points (37–66%) in the DTM group and from 3.80 to 4.78 points (66–78%) in the FDM group (Table 4).
Table 1.
Shapiro–Wilk test of normality for individual variables before and after therapy in the studied groups.
Table 2.
Differences in individual variables before and after therapy (Student’s t test for dependent samples).
Table 3.
Differences in individual variables before and after therapy (Wilcoxon matched-pair test).
All fascia thickness variables analyzed decreased statistically significantly after therapy in both groups (Table 2 and Table 3, all p ≤ 0.003); however, the absolute changes were very small, particularly in the DTM group. Pain (VAS) also decreased significantly in all DTM and FDM subgroups (Table 3). The mean reductions in thickness and in VAS were larger in the FDM group than in the DTM group. When values after therapy were compared between groups with the Mann–Whitney U and Student’s t tests (Table 5), VAS was lower in the FDM group in the arm (Z = 5.958, r = 0.60, Holm-adjusted p < 0.001) and forearm (Z = 4.646, r = 0.47, Holm-adjusted p < 0.001), corresponding to differences of 2.56 and 1.81 points in post-treatment VAS. Forearm SF thickness after therapy was smaller in the FDM group (Z = 2.356, r = 0.24, p = 0.018), but this difference was not significant after correction for multiple comparisons (Holm-adjusted p = 0.129). No differences were found in the calf. Because the forearm FDM subgroup had a higher baseline VAS than the DTM subgroup (6.64 vs. 5.81), baseline-adjusted analyses were also performed (Table 4). After adjustment for baseline VAS (ANCOVA), VAS after therapy was lower in the FDM group by 2.41 points (95% CI 1.77–3.04) in the arm and by 2.21 points (95% CI 1.65–2.78) in the forearm (both Holm-adjusted p < 0.001; partial η2 = 0.37 and 0.39), whereas no difference was found in the calf (0.01 points, 95% CI −0.58 to 0.60; p = 0.976). For fascia thickness, the baseline-adjusted post-treatment values were lower in the FDM group in all regions, by 0.020–0.024 mm (Holm-adjusted p ≤ 0.038). These adjusted differences are, however, an order of magnitude smaller than the nominal axial resolution of the transducer, and the assumption of homogeneous regression slopes was not met for several thickness outcomes and for arm VAS (Table 4), so they should be interpreted with caution.
Table 4.
Mean changes after therapy and baseline-adjusted between-group differences (ANCOVA).
Table 5.
Differences between groups in superficial and deep fascia thickness and pain after therapy (Mann–Whitney U test and independent Student’s t test).
Spearman’s analysis (Table 6) revealed a statistically significant, moderate, negative correlation between VAS and DF thickness before therapy in the DTM arm group, a weak, negative correlation between body weight and VAS before therapy in the DTM calf group, and a weak, negative correlation between body weight and SF thickness after therapy in the FDM forearm group. Age was not significantly correlated with fascia thickness in any subgroup, and the remaining variables did not show statistically significant correlations. These correlation analyses were exploratory and were not corrected for multiple testing; they should be regarded as hypothesis-generating.
Table 6.
Statistically significant correlations of selected variables (Spearman’s rank correlation).
4. Discussion
Ultrasound is increasingly used by physiotherapists worldwide. It enables monitoring of the effects of therapy and visualization of tissues such as fascia and muscle [30]. Manual therapy can be a supportive or primary treatment in many difficult cases in which conventional treatment has not brought satisfactory results, as reported for chronic low back pain, entrapment neuropathies of the limbs, neuralgias, headaches, and even painful erection [31,32,33,34,35,36,37,38]. The pain reduction in both groups of the present study is consistent with these reports (mean VAS in the arm, from 6.24 to 3.84 after DTM and from 5.86 to 1.28 after FDM). Despite the reported effectiveness of these methods, myofascial therapy continues to attract criticism, mainly because its mechanism of action is unclear, which has led to low-quality studies with a high risk of bias [16,39,40]. We therefore attempted to describe changes in connective tissue after therapy using a standardized ultrasound protocol [13]. In both groups, the measured thickness of the superficial and deep fascia decreased slightly. However, these observations are morphological measurements only; they do not show whether the tissue was stretched, became less stiff, or was reorganized because none of these properties were assessed.
The magnitude of the observed changes requires caution. The mean changes after DTM (0.001–0.006 mm) and after FDM (0.021–0.033 mm) are smaller than the nominal axial resolution of a 12 MHz transducer (approximately 0.1–0.2 mm) and smaller than, or of the order of, the size of a single image pixel. Their statistical significance results might be from the small variability of paired differences in a large sample, not from a demonstrably large effect. The same applies to the baseline-adjusted between-group differences (about 0.02 mm greater decrease after FDM in all regions). Because intra- and inter-rater reliability, the standard error of measurement, and the minimal detectable change were not determined, we cannot exclude that the differences reflect measurement variability, systematic bias between examinations, or transient changes in tissue hydration and temperature rather than genuine structural change. The differences in fascia thickness should therefore be regarded as exploratory, and they should not be interpreted as tissue stretching or remodeling. Future studies should establish the reliability and minimal detectable change of the protocol before the intervention [41,42].
No significant correlation between age and fascia thickness was found in any subgroup. Wilke et al. [7] found that in some regions connective tissue is thinner in older than in younger people and that fascia thickness is correlated with joint range of motion: the thicker the fascia, the greater the stiffness and the more limited the range of motion. The relatively narrow age range of our participants (18–60 years) may explain why no such relation was observed. Larivière et al. [43], using rehabilitative ultrasound imaging, found soft-tissue changes of the lumbar spine in people with chronic low back pain, such as fatty infiltration and fibrosis of the lumbar multifidus muscle and changes in thoracolumbar fascia thickness, which were associated with limited range of motion.
Another observation is the correlation between VAS and DF thickness before therapy in the DTM arm group, which may suggest that pain level varies with the properties of the deep fascia. Kondrup et al. [44] report that pathological fascia is characterized by increased tissue stiffness and by altered myofibroblast activity and extracellular matrix, in terms of both collagen and matrix metalloproteinase levels, together with markers of inflammation such as pro-inflammatory cytokines and immune cells. It is conceivable that manual therapy influences nociceptive sensitization and inflammatory activity in fascia. However, this remains hypothetical, because neither tissue properties nor inflammatory markers were measured in the present study, and the correlation was not adjusted for multiple testing.
In the DTM calf group, patients with higher body weight had lower baseline pain intensity (VAS), and in the FDM forearm group, SF thickness after therapy was weakly and inversely related to weight. These weak, exploratory associations do not agree with Hanson-Viana et al. [45], who found that fascia thickness increased minimally with higher body mass index. However, the ethnic origin of the patients should be considered, and age, sex, walking activity, exercise, and environmental conditions may also play a role.
Despite the reduction in pain in both groups, it is not possible to confirm the assumptions of the method created by Typaldos, which postulates the existence of fascial distortions. This may be due to the limitations of two-dimensional ultrasound; however, some distortions, such as the trigger band, should be possible to visualize with this tool. It may be that these assumptions are incorrect and that the type and manner of pain described by patients depend mainly on its location. The recorded changes are not inconsistent with the densification model proposed by Stecco (Fascial Manipulation) [46], although our data do not test it directly. The techniques used in FDM may act through their effect on selected receptors in the treated tissue rather than by returning it to its original “shape,” as its creator emphasized [47]. Stecco [46], Hughes et al. [48], and Pirri et al. [49] presented results supporting the hypothesis that densifications in fascia reflect localized thickening of loose connective tissue elements and potential differences in perceived pain sensitivity across somatic regions. Regarding clinical reasoning, the present data do not allow a distinction between a global thixotropic (viscosity-related) response of the loose connective tissue and an analytical change in the architecture of collagen fibers. Remodeling of collagen requires weeks to months [50], so if the small differences observed 7 days after three sessions are real, a transient change in the hydration or viscosity of the extracellular matrix appears more plausible than a change in collagen architecture.
Pain reduction after manual therapy can also be explained without any structural change in fascia. Mechanical stimulation activates peripheral receptors and primary afferent nociceptors (PAN) and modulates spinal and supraspinal pain processing; expectation, the therapeutic relationship, and placebo-related mechanisms also contribute [27]. Excessive stimulation of the spinal cord by PAN can alter conduction in the nerve roots innervating the treated tissues, which contain both somatic efferent axons innervating skeletal muscle and the surrounding fascia [38]. Because the present study had no sham or untreated control group, natural recovery, regression to the mean (patients often seek treatment when pain is at its worst), placebo effects, patients’ expectations, and possible concurrent treatments may all have contributed to the improvement in both groups. The greater pain reduction after FDM in the arm and forearm may reflect the more targeted application of force, but it may equally reflect differences in patient selection, therapist, or expectations, given the non-randomized allocation.
Regarding clinical relevance, a reduction of about 2 points (or 30%) on a 0–10 pain scale is commonly regarded as the minimal clinically important change [51,52]. Within-group reductions exceeded this threshold in all subgroups (2.15–4.78 points, 37–78%). Between groups, the differences in post-treatment VAS in the arm (2.56 points) and forearm (1.81 points), the differences in mean change (2.18 and 2.63 points), and the baseline-adjusted differences (2.41 and 2.21 points; lower limits of the 95% CI 1.77 and 1.65 points) are close to or above this threshold, whereas no difference was found in the calf. These between-group differences are, however, short-term (7 days) and adjusted only for baseline values, not for other potential confounders, and they should not be interpreted as evidence of long-term superiority of FDM. Whether the improvement is sustained, and whether the response differs between acute and chronic pain, could not be determined, because symptom duration differed and was not recorded. Finally, FDM and DTM need not be regarded as competing approaches. Targeted FDM techniques and more global DTM could be combined in clinical practice, and possible therapeutic synergies deserve investigation in randomized trials.
The present study provides descriptive ultrasound data on connective tissue after myofascial therapy, but the exact changes in the treated area cannot be determined from these data. Reliability studies of the ultrasound protocol, higher-frequency transducers, elastography, functional magnetic resonance imaging, and blood tests to determine biochemical changes would be helpful. Randomized studies with a sham or usual care control group, standardized and recorded treatment protocols, and longer follow-up are needed to understand which processes occur in connective tissue during therapy performed by physiotherapists.
Limitations
This study has several limitations. First, allocation to FDM or DTM was not randomized, and there was no allocation concealment. Treatment was prescribed by a physician as part of routine care, so selection bias and confounding by indication cannot be excluded, and baseline differences were present. Second, there was no sham or untreated control group, and patients were not blinded. Therefore, the pain reduction cannot be attributed specifically to the interventions, and natural recovery, regression to the mean, placebo effects, expectations, and concurrent treatments may have contributed. Third, the reliability of the ultrasound measurements (intra- and inter-rater ICC, standard error of measurement, and minimal detectable change) was not assessed, probe pressure was not controlled instrumentally, and one image per site and time point was analyzed; the very small changes in fascia thickness may therefore lie within the measurement error. Fourth, a linear transducer with a maximum frequency of 12 MHz was used. Higher-frequency transducers (15–18 MHz or more) provide better resolution of thin superficial and deep fascial layers and would be preferable in future studies. Fifth, specific clinical diagnoses, symptom duration, and baseline functional status were not included. The three anatomical regions represent different anatomical and biomechanical environments. The region and specific results should therefore be interpreted separately. Sixth, no a priori sample size calculation was performed, and the study was registered retrospectively. Seventh, the techniques used in each session were individualized and not recorded, and treatment fidelity was not monitored. Eighth, connective tissue could not be followed over a longer period. The final assessment took place 7 days after therapy because the study was performed in private health care and another visit would have increased costs for patients. The durability of the effects is therefore unknown. Furthermore, all participants were white Europeans, and individual variability may have influenced the results. Subcutaneous (SAT) and deep adipose tissue (DAT) were not examined, although this could have enabled a deeper analysis of correlations with weight. After treatment, these tissues appeared disorganized on the images, which made reliable and repeatable measurement impossible. Ultrasound provides a two-dimensional image, which may be insufficient for a full analysis of possible changes. It is also difficult to indicate which mechanisms are responsible for the pain reduction: a change at the level of connective tissue, mechanisms related to piezoelectricity, activation of PAN by tissue stimulation, or nonspecific effects. Biochemical analysis of blood could help explain the processes occurring in tissues during therapy. The study does not analyze the results separately for men and women. Hormonal and other sex-related factors may influence the elasticity of connective tissue and therefore how fascia responds to treatment, but the study was designed to compare the two therapies overall. Stratifying the data by sex would result in sample sizes too small to allow for a meaningful comparison. Further research involving a larger cohort and sex-based stratification is necessary to draw valid conclusions. The researchers were unable to examine the relationship between hormone levels and connective tissue response, an analysis that could have been valuable for predicting sex dependent tissue changes.
5. Conclusions
In this non-randomized, exploratory study, both FDM and DTM were followed by a short-term reduction in pain of myofascial origin, and pain reduction was greater after FDM in the arm and forearm, but not in the calf. Both therapies were accompanied by statistically significant but very small decreases in the measured thickness of the superficial and deep fascia, which are within the probable measurement error of the method and should not be interpreted as evidence of structural tissue remodeling. Post-treatment fascia thickness did not differ between the groups after correction for multiple comparisons, and the baseline-adjusted decreases, although about 0.02 mm greater after FDM, remained below the resolution of the method. Statistically significant findings should not be equated with demonstrated clinical benefit, and the durability of the effects is unknown. Ultrasound may be useful for describing tissues undergoing manual therapy, provided that the reliability of the measurements is established. The findings do not allow the assumptions of the FDM about fascial distortion to be confirmed, and the mechanisms of pain reduction require further study in randomized, controlled trials.
Author Contributions
Conceptualization: A.R. and G.B.-K., methodology, A.R. and G.B.-K., investigation: I.Z., K.P. (Kamil Poboży) and T.C., writing original draft preparation: A.R., J.W., and K.P. (Katarzyna Placek), writing review and editing: A.R. and G.T., supervision: M.Z., G.B.-K., and G.T. All authors have read and agreed to the published version of the manuscript.
Funding
This research received no specific grant from any funding agency in the public, commercial, or not-for-profit sectors.
Institutional Review Board Statement
The study was conducted in accordance with the Declaration of Helsinki and approved by the Ethics Senate Committee on Research Ethics No. SKE 01-61/2023; approval date: 13 September 2023. The study was retrospectively registered at ClinicalTrials.gov.
Informed Consent Statement
Informed consent was obtained from all subjects involved in the study.
Data Availability Statement
The data supporting the findings of this study are available from the corresponding author on reasonable request.
Acknowledgments
We thank the Family Medica clinic for making the research possible. During the preparation of this work, the authors used Claude (Anthropic) to improve the language.
Conflicts of Interest
The authors declare no conflict of interest.
Abbreviations
The following abbreviations are used in this manuscript:
| DAT | deep adipose tissue |
| DF | deep fascia |
| DTM | deep tissue massage |
| FDM | Fascial Distortion Model |
| PAN | primary afferent nociceptors |
| SAT | superficial adipose tissue |
| SF | superficial fascia |
| VAS | visual analog scale |
References
- Findley, T.W.; Chaitow, L.; Huijing, P.A.; Schleip, R. Fascia: The Tensional Network of the Human Body; Churchill Livingstone Elsevier: Edinburgh, UK, 2012; pp. 5–57. [Google Scholar]
- Bordoni, B.; Mahabadi, N.; Varacallo, M. Anatomy, Fascia. In StatPearls [Internet]; StatPearls Publishing: Treasure Island, FL, USA, 2023. Available online: https://www.ncbi.nlm.nih.gov/books/NBK526038/ (accessed on 9 September 2024).
- Schleip, R.; Jäger, H.; Klingler, W. What is ‘fascia’? A review of different nomenclatures. J. Bodyw. Mov. Ther. 2012, 16, 496–502. [Google Scholar] [CrossRef] [Scilit]
- Stecco, C.; Pirri, C.; Fede, C.; Fan, C.; Giordani, F.; Stecco, L.; Foti, C.; De Caro, R. Dermatome and fasciatome. Clin. Anat. 2019, 32, 896–902. [Google Scholar] [CrossRef] [Scilit]
- Schleip, R. Fascial plasticity—A new neurobiological explanation: Part 1. J. Bodyw. Mov. Ther. 2003, 7, 11–19. [Google Scholar] [CrossRef] [Scilit]
- Huijing, P.A. Muscle as a collagen fiber reinforced composite: A review of force transmission in muscle and whole limb. J. Biomech. 1999, 32, 329–345. [Google Scholar] [CrossRef] [Scilit]
- Wilke, J.; Macchi, V.; De Caro, R.; Stecco, C. Fascia thickness, aging and flexibility: Is there an association? J. Anat. 2019, 234, 43–49. [Google Scholar] [CrossRef] [Scilit]
- Pirri, C.; Fede, C.; Stecco, C. Ultrasound imaging of crural fascia and epimysial fascia thicknesses in basketball players with previous ankle sprains versus healthy subjects. Diagnostics 2021, 11, 177. [Google Scholar] [CrossRef] [Scilit]
- Pirri, C.; Stecco, C.; Fede, C. Ultrasound imaging of the fascial layers: You see (only) what you know. J. Ultrasound Med. 2020, 39, 827–828. [Google Scholar] [CrossRef] [Scilit]
- Stecco, A.; Fede, C.; Pirri, C. Ultrasound imaging of a scar on the knee: Sonopalpation for fascia and subcutaneous tissues. Eur. J. Transl. Myol. 2020, 30, 150–153. [Google Scholar] [CrossRef] [Scilit]
- Stecco, C.; Pirri, N.; Pirri, C. Ultrasound examination for a heel scar: Seeing/treating the painful superficial fascia. Med. Ultrason. 2022, 24, 255–256. [Google Scholar] [CrossRef] [Scilit]
- Pirri, C.; Stecco, C.; Petrelli, L. Reappraisal on the superficial fascia in the subcutaneous tissue: Ultrasound and histological images speaking louder than words. Plast. Reconstr. Surg. 2022, 150, 244–245. [Google Scholar] [CrossRef] [Scilit]
- Pirri, C.; Pirri, N.; Stecco, C. Ultrasound imaging of the superficial fascia in the upper limb: Arm and forearm. Diagnostics 2022, 12, 1884. [Google Scholar] [CrossRef] [Scilit]
- Pirri, C.; Guidolin, D.; Fede, C.; Stecco, C. Ultrasound imaging of brachial and antebrachial fasciae. Diagnostics 2021, 11, 2261. [Google Scholar] [CrossRef] [Scilit]
- Liem, T.; Tozzi, P.; Chila, A. (Eds.) Fascia in the Osteopathic Field; Handspring Publishing: Pencaitland, UK, 2017; pp. 360–367. [Google Scholar]
- Thalhamer, C. A fundamental critique of the fascial distortion model and its application in clinical practice. J. Bodyw. Mov. Ther. 2018, 22, 112–117. [Google Scholar] [CrossRef] [Scilit]
- Rogala, A.; Molik, B.; Brzuszkiewicz-Kuźmicka, G.; Truszczyńska-Baszak, A. The impact of Fascial Distortion Model on shoulder girdle dysfunction. Med. Rehabil. 2022, 26, 17–26. [Google Scholar] [CrossRef] [Scilit]
- Richter, D.; Karst, M.; Buhck, H. Efficacy of Fascial Distortion Model treatment for acute, nonspecific low-back pain in primary care: A prospective controlled trial. Altern. Ther. Health Med. 2017, 23, 24–32. [Google Scholar]
- Boucher, J.D.; Figueroa, J. Restoration of full shoulder range of motion after application of the Fascial Distortion Model. J. Am. Osteopath. Assoc. 2018, 118, 341–344. [Google Scholar] [CrossRef] [Scilit]
- Baird, C.J.; Shumate, S.M.; Tancredi, M.P.; Cayce, L.M.; Wibbenmeyer, J.L. The effects of the fascial distortion model on chronic hamstring tightness. Top. Integr. Health Care 2014, 6, 1074–1086. [Google Scholar]
- Lee, C.K.; Kim, M. Comparison of maximum isometric strength, proprioceptive, dynamic balance, and maximum angle by applying the fascial distortion model to chronic ankle instability subjects. J. Korean Phys. Ther. 2021, 33, 224–230. [Google Scholar] [CrossRef] [Scilit]
- Ghorbanpour, A. Fascial treatment in frozen shoulder: A case report. J. Mod. Rehabil. 2019, 13, 123–128. [Google Scholar] [CrossRef] [Scilit]
- Schulze, C.; Finze, S.; Bader, R.; Lison, A. Treatment of medial tibial stress syndrome according to the fascial distortion model: A prospective case control study. Sci. World J. 2014, 2014, 790626. [Google Scholar] [CrossRef] [Scilit]
- Majchrzycki, M.; Kocur, P.; Kotwicki, T. Deep tissue massage and nonsteroidal anti-inflammatory drugs for low back pain: A prospective randomized trial. Sci. World J. 2014, 2014, 287597. [Google Scholar] [CrossRef] [Scilit]
- Ajimsha, M.S.; Al-Mudahka, N.R.; Al-Madzhar, J.A. Effectiveness of myofascial release: Systematic review of randomized controlled trials. J. Bodyw. Mov. Ther. 2015, 19, 102–112. [Google Scholar] [CrossRef] [Scilit]
- Laimi, K.; Mäkilä, A.; Bärlund, E.; Katajapuu, N.; Oksanen, A.; Seikkula, V.; Karppinen, J.; Saltychev, M. Effectiveness of myofascial release in treatment of chronic musculoskeletal pain: A systematic review. Clin. Rehabil. 2018, 32, 440–450. [Google Scholar] [CrossRef] [Scilit]
- Bialosky, J.E.; Bishop, M.D.; Price, D.D.; Robinson, M.E.; George, S.Z. The mechanisms of manual therapy in the treatment of musculoskeletal pain: A comprehensive model. Man. Ther. 2009, 14, 531–538. [Google Scholar] [CrossRef] [Scilit]
- Holm, S. A simple sequentially rejective multiple test procedure. Scand. J. Stat. 1979, 6, 65–70. [Google Scholar]
- Vickers, A.J.; Altman, D.G. Statistics notes: Analysing controlled trials with baseline and follow up measurements. BMJ 2001, 323, 1123–1124. [Google Scholar] [CrossRef] [Scilit]
- Barassi, G.; Guerri, S.; Tavani, R.; Ricucci, G.; De Luca, G.; Rabini, A.; Di Iorio, A. Ultrasonography in physiotherapy and rehabilitation. J. Adv. Health Care 2021, 3, 1–3. [Google Scholar] [CrossRef] [Scilit]
- Ghorbanpour, A.; Shadmehr, A.; Moghaddam, S.T.; Rasanani, M.H. The possibility of changes of brain activity following myofascial release in patients with nonspecific chronic low back pain: A hypothesis. Med. Hypotheses 2023, 176, 111082. [Google Scholar] [CrossRef] [Scilit]
- Tamartash, H.; Bahrpeyma, F.; Dizaji, M.M. The effect of remote myofascial release on chronic nonspecific low back pain with hamstrings tightness. J. Sport Rehabil. 2023, 32, 549–556. [Google Scholar] [CrossRef] [Scilit]
- Kim, H.; Lee, S. The impact of manual therapy on pain catastrophizing in chronic pain conditions: A systematic review and meta-analysis. Phys. Ther. Rehabil. Sci. 2023, 12, 177–184. [Google Scholar] [CrossRef] [Scilit]
- Iogna Prat, P.; Milan, N.; Huber, J.; Ridehalgh, C. The effectiveness of nerve mechanical interface treatment for entrapment neuropathies in the limbs: A systematic review with meta-analysis. Musculoskelet. Sci. Pract. 2024, 69, 102907. [Google Scholar] [CrossRef] [Scilit]
- Rogala, A.; Warzecha, A.; Turek, G.; Brzuszkiewicz-Kuźmicka, G.; Raźniak, M.; Dzierzęcki, S.; Ząbek, M. The importance of manual therapy in occipital neuralgia—Case study. Ból 2023, 24, 44–51. [Google Scholar] [CrossRef] [Scilit]
- Cumplido-Trasmonte, C.; Fernández-González, P.; Alguacil-Diego, I.M.; Molina-Rueda, F. Manual therapy in adults with tension-type headache: A systematic review. Neurologia 2021, 36, 537–547. [Google Scholar] [CrossRef] [Scilit]
- Núñez-Cabaleiro, P.; Leirós-Rodríguez, R. Effectiveness of manual therapy in the treatment of cervicogenic headache: A systematic review. Headache 2022, 62, 271–283. [Google Scholar] [CrossRef] [Scilit]
- Rogala, A.; Brzuszkiewicz-Kuźmicka, G. Influence of myofascial therapy on painful erection—case study. Ból 2020, 21, 54–59. [Google Scholar] [CrossRef] [Scilit]
- Clar, C.; Tsertsvadze, A.; Court, R.; Hundt, G.L.; Clarke, A.; Sutcliffe, P. Clinical effectiveness of manual therapy for the management of musculoskeletal and non-musculoskeletal conditions: Systematic review and update of UK evidence report. Chiropr. Man. Ther. 2014, 22, 12. [Google Scholar] [CrossRef] [Scilit]
- Asquini, G.; Pitance, L.; Michelotti, A.; Falla, D. Effectiveness of manual therapy applied to craniomandibular structures in temporomandibular disorders: A systematic review. J. Oral Rehabil. 2022, 49, 442–455. [Google Scholar] [CrossRef] [Scilit]
- Koo, T.K.; Li, M.Y. A guideline of selecting and reporting intraclass correlation coefficients for reliability research. J. Chiropr. Med. 2016, 15, 155–163. [Google Scholar] [CrossRef] [Scilit]
- Weir, J.P. Quantifying test-retest reliability using the intraclass correlation coefficient and the SEM. J. Strength Cond. Res. 2005, 19, 231–240. [Google Scholar] [CrossRef] [Scilit]
- Larivière, C.; Preuss, R.; Gagnon, D.H.; Mecheri, H.; Driscoll, M.; Henry, S.M. The relationship between clinical examination measures and ultrasound measures of fascia thickness surrounding trunk muscles or lumbar multifidus fatty infiltrations: An exploratory study. J. Anat. 2023, 242, 666–682. [Google Scholar] [CrossRef] [Scilit]
- Kondrup, F.; Gaudreault, N.; Venne, G. The deep fascia and its role in chronic pain and pathological conditions: A review. Clin. Anat. 2022, 35, 649–659. [Google Scholar] [CrossRef] [Scilit]
- Hanson-Viana, R.; Rojas-Ortiz, J.; Rendón-Medina, M.A.; Pacheco-López, R.C.; López, R.L.; Luciano, R.; Palacios-Juárez, J. Influence of BMI, age, and gender on the thickness of most common thinned flaps. Plast. Reconstr. Surg. Glob. Open 2021, 9, e3409. [Google Scholar] [CrossRef] [Scilit]
- Stecco, A. Physiology of the fascia. In Fascia, Function, and Medical Applications; Taylor & Francis: New York, NY, USA, 2020; pp. 47–60. [Google Scholar]
- Chaudhry, H.; Schleip, R.; Ji, Z.; Bukiet, B.; Maney, M.; Findley, T. Three-dimensional mathematical model for deformation of human fasciae in manual therapy. J. Am. Osteopath. Assoc. 2008, 108, 379–390. [Google Scholar] [CrossRef] [Scilit]
- Hughes, E.; Koenig, J.; Lee, R.; McDermott, K.; Freilicher, T.; Pitcher, M. Pilot study assessing the effect of Fascial Manipulation on fascial densifications and associated pain. Eur. J. Transl. Myol. 2022, 32, 10369. [Google Scholar] [CrossRef] [Scilit]
- Pirri, C.; Petrelli, L.; Guidolin, D.; Porzionato, A.; Fede, C.; Macchi, V.; De Caro, R.; Stecco, C. Myofascial junction: Emerging insights into the connection between deep/muscular fascia and muscle. Clin. Anat. 2024, 37, 534–545. [Google Scholar] [CrossRef] [Scilit]
- Zügel, M.; Maganaris, C.N.; Wilke, J.; Jurkat-Rott, K.; Klingler, W.; Wearing, S.C.; Findley, T.; Barbe, M.F.; Steinacker, J.M.; Vleeming, A.; et al. Fascial tissue research in sports medicine: From molecules to tissue adaptation, injury and diagnostics: Consensus statement. Br. J. Sports Med. 2018, 52, 1497. [Google Scholar] [CrossRef] [Scilit]
- Farrar, J.T.; Young, J.P., Jr.; LaMoreaux, L.; Werth, J.L.; Poole, R.M. Clinical importance of changes in chronic pain intensity measured on an 11-point numerical pain rating scale. Pain 2001, 94, 149–158. [Google Scholar] [CrossRef] [Scilit]
- Ostelo, R.W.; Deyo, R.A.; Stratford, P.; Waddell, G.; Croft, P.; Von Korff, M.; Bouter, L.M.; de Vet, H.C. Interpreting change scores for pain and functional status in low back pain: Towards international consensus regarding minimal important change. Spine 2008, 33, 90–94. [Google Scholar] [CrossRef] [Scilit]
Disclaimer/Publisher’s Note: The statements, opinions and data contained in all publications are solely those of the individual author(s) and contributor(s) and not of MDPI and/or the editor(s). MDPI and/or the editor(s) disclaim responsibility for any injury to people or property resulting from any ideas, methods, instructions or products referred to in the content. |
© 2026 by the authors. Licensee MDPI, Basel, Switzerland. This article is an open access article distributed under the terms and conditions of the Creative Commons Attribution (CC BY) license.