


Abstract
Multimodal retinal imaging enables repeated, noninvasive assessment of vascular, neuroretinal, choroidal, perfusion, oxygenation, and flow-related phenotypes, positioning the retina as a platform for systemic microvascular phenotyping. Chronic kidney disease (CKD) provides an informative translational reference model because estimated glomerular filtration rate (eGFR) and urinary albumin-to-creatinine ratio (UACR) offer standardized clinical anchors across disease severity and progression. This critical narrative review, informed by structured searches of PubMed/MEDLINE, Embase, and Web of Science, evaluates retinal phenotypes from biological association and longitudinal prediction to incremental clinical value, external validation, and implementation. Fundus photography, ultra-widefield imaging, optical coherence tomography (OCT), OCT angiography (OCTA), and functional retinal imaging provide complementary information, but retinal signals are not organ-specific. Artificial intelligence (AI)-enabled models may support automated phenotyping and opportunistic risk enrichment, but credible translation requires appropriate comparators, external validation, calibration, subgroup assessment, decision-analytic utility, and workflow evaluation. Retinal imaging should therefore be viewed as an adjunctive platform rather than a stand-alone CKD diagnostic test, with its near-term role being to identify individuals warranting confirmatory kidney assessment when retinal images are already available and recent eGFR/UACR data are absent.
1. Background
Retinal imaging provides a unique opportunity to characterize microvascular and neurovascular health repeatedly and noninvasively in vivo, making the retina an increasingly attractive platform for systemic phenotyping. Chronic kidney disease (CKD) provides a particularly informative clinical model within this broader framework. In 2023, an estimated 788 million people aged 20 years or older were living with CKD, corresponding to a global age-standardized prevalence of 14.2% [1]. CKD is diagnosed and staged using estimated glomerular filtration rate (eGFR) and markers of kidney damage, particularly urinary albumin-to-creatinine ratio (UACR), interpreted according to chronicity and clinical context [2,3]. These measures are indispensable but do not directly characterize systemic microvascular structure or function; moreover, CKD spans a continuum from early kidney damage to kidney failure, with longitudinal changes measurable during disease progression and after kidney transplantation [2,3,4]. These characteristics provide standardized clinical anchors against which retinal phenotypes can be evaluated without assuming the existence of a kidney-specific retinal signature.
The retina provides high-resolution access to vascular geometry, capillary perfusion, neuroretinal and choroidal structure, and selected functional responses through complementary imaging modalities [5,6,7,8]. Importantly, however, retinal abnormalities associated with systemic disease are rarely organ-specific. Retinal phenotypes may reflect combined renal, cardiovascular, metabolic, inflammatory, ocular, treatment-related, and aging-associated influences [4,9,10,11,12]. This limited specificity is both a challenge and an opportunity: it constrains disease-specific interpretation while supporting retinal imaging as a potential platform for characterizing shared systemic microvascular injury. Cardiovascular and cardiometabolic diseases provide the strongest comparative context, whereas liver- and gut-related pathways and other neurodegenerative or immune-inflammatory conditions help define broader multi-organ influences and potential sources of heterogeneity [5,8,10,13,14].
Artificial intelligence (AI) may further extend retinal phenotyping by transforming conventional and multimodal images into automated quantitative features and risk estimates. Retinal image-based models have demonstrated the ability to detect prevalent CKD and, in selected longitudinal cohorts, estimate incident CKD risk [15,16,17,18]. In patients with diabetes, retinal models have shown potential for detecting clinically attributed diabetic kidney disease (DKD) and, in biopsy-defined cohorts, differentiating diabetic nephropathy (DN) from non-diabetic kidney disease (NDKD) [19]. Nevertheless, discrimination alone does not establish clinical usefulness. Translation requires external validation, calibration, fairness assessment, clinically interpretable outputs, decision-curve analysis, and prospective workflow evaluation [20,21,22,23,24,25,26]. Given the shared nature of retinal microvascular signals, the most credible near-term role of these approaches is systemic risk enrichment and decision support rather than stand-alone organ-specific diagnosis.
Previous work has established the broader concept of retinal imaging and oculomics as windows into systemic health [8,27], summarized retinal manifestations of kidney disease [6,7,28], examined shared small-vessel abnormalities across the brain, retina, and kidney [29], and reviewed AI-enabled retinal oculomics [30,31]. Taken together, these contributions leave a complementary translational question insufficiently addressed: how multimodal retinal phenotypes progress from biological association and longitudinal prediction to incremental clinical value, external validation, and implementation, while explicitly accounting for the limited organ specificity of shared retinal signals.
Accordingly, this critical narrative review uses CKD as a clinically anchored reference model to evaluate the translational value of multimodal retinal imaging. We focus on five questions: the biological rationale for shared retinal and renal microvascular abnormalities; the retinal imaging phenotypes associated with CKD; the strength of longitudinal and incremental predictive evidence; the contribution of AI-enabled risk models; and the evidence required before clinical implementation. Diabetes, hypertension, and cardiovascular disease are considered primarily to distinguish kidney-associated findings from shared cardiometabolic microvascular burden. The central question is whether retinal information improves a defined clinical decision beyond available clinical and laboratory assessment.
Literature Search and Evidence Synthesis
This critical narrative review was informed by structured searches of PubMed/MEDLINE, Embase (Ovid), and Web of Science Core Collection from database inception through 27 July 2026, supplemented by targeted searches and reference-list screening updated through 31 July 2026. Evidence was prioritized according to direct relevance, methodological informativeness, longitudinal or external validation, and translational utility. This review was not designed as a systematic review or meta-analysis. Full search strategies, record counts, evidence-selection criteria, and the evidence-selection framework are provided in Supporting Information S1. Narrative-review transparency was informed by the Scale for the Assessment of Narrative Review Articles (SANRA) framework [32].
3. Multimodal Ophthalmic Imaging Biomarkers
Each imaging modality captures a different component of the systemic microvascular phenotype; no single measure is interchangeable with another, nor is any measure specific to CKD (Figure 2). Fundus photography characterizes vascular morphology and retinopathy signs; optical coherence tomography (OCT) assesses retinal and choroidal structure; OCTA provides depth-resolved microvascular flow signals; and functional techniques add information on oxygenation, blood-flow dynamics, and vascular reactivity.
Figure 2.
Multimodal ophthalmic imaging biomarkers for systemic microvascular phenotyping. Complementary ophthalmic imaging modalities characterize distinct dimensions of retinal and choroidal morphology, neuroretinal structure, capillary perfusion, oxygenation, blood flow dynamics, vascular reactivity, leakage, ischemia, and cellular or metabolic signatures. FP and UWF imaging support scalable assessment of retinal vascular morphology and peripheral retinal features; OCT and OCTA provide structural and depth-resolved microvascular phenotyping; retinal oximetry, LSFG, and DVA assess functional alterations; FFA and ICGA enable targeted evaluation of leakage, nonperfusion, and choroidal circulation; and AO, hyperspectral imaging, and FLIO remain primarily exploratory. Together, these complementary measurements provide an integrated retinal readout of systemic microvascular phenotypes, but the translational positions indicated in the figure are contextual rather than formal evidence grades. Retinal measurements should therefore be interpreted alongside systemic clinical and laboratory biomarkers. AO, adaptive optics; AVR, arteriolar-to-venular ratio; DVA, dynamic vessel analysis; FAZ, foveal avascular zone; FD, fractal dimension; FFA, fundus fluorescein angiography; FLIO, fluorescence lifetime imaging ophthalmoscopy; FP, fundus photography; GCIPL, ganglion cell–inner plexiform layer; ICGA, indocyanine green angiography; LSFG, laser speckle flowgraphy; OCT, optical coherence tomography; OCTA, optical coherence tomography angiography; RNFL, retinal nerve fiber layer; UWF, ultra-widefield imaging.
3.1. Fundus Photography and Ultra-Widefield Imaging
Color fundus photography (FP) is the most scalable modality for automated assessment of vessel caliber, arteriolar-to-venular ratio (AVR), tortuosity, fractal dimension (FD), branching geometry, and retinopathy [8,9,45,46]. These features have been associated with CKD and cardiometabolic outcomes but remain sensitive to demographic, vascular, ocular, image-quality, and analytic factors; they indicate systemic microvascular burden rather than kidney-specific injury [9,35,39,42,47].
Ultra-widefield (UWF) imaging expands retinal coverage and can reveal peripheral vascular or retinopathy lesions that may be missed by conventional central-field photography. This wider field of view is clinically valuable in retinal diseases with diagnostically or prognostically relevant peripheral involvement; for example, predominantly peripheral diabetic retinopathy lesions have been associated with subsequent disease progression [46]. In CKD, a multicenter study reported modestly higher discrimination for a UWF–based model than for a central-region model, both internally and in multicenter testing, suggesting that peripheral retinal information may improve discrimination compared with central-field images [18]. However, peripheral vessel annotation and segmentation are technically more difficult, and current CKD evidence remains largely cross-sectional, device-specific, and geographically limited. UWF imaging should therefore be regarded as a potentially informative extension of FP rather than an established requirement for CKD screening.
3.2. OCT and OCTA
OCT provides high-resolution structural assessment of the neuroretina and choroid, including thickness measurements of the retinal nerve fiber layer (RNFL), ganglion cell–inner plexiform layer (GCIPL), macula, and choroid. Reduced inner retinal thickness and choroidal alterations have been reported in CKD and may reflect neurovascular vulnerability, chronic hypoxia, fluid-related changes, or systemic vascular remodeling [4,38,48,49]. In a cross-cohort analysis, lower baseline eGFR was associated with thinner GCIPL in 23,014 UK Biobank participants and with faster GCIPL loss over approximately three years in 2197 Chinese participants; relative to eGFR ≥ 90 mL/min/1.73 m2, the fully adjusted annual excess thinning was 0.30 μm for eGFR 60–89 and 0.52 μm for eGFR < 60 [50]. In 1408 ocular treatment-naive adults with type 2 diabetes, lower eGFR was also associated with lower peripapillary choroidal thickness and selected peripapillary retinal nerve fiber layer (pRNFL) thickness measures, while microalbuminuria was inversely associated with average peripapillary choroidal thickness [51]. A separate 2-year cohort found faster pRNFL loss in 152 CKD participants than in 40 controls (−0.87 versus −0.26 μm/year), with progressively greater loss from G3a to kidney failure [52]; the single-center design and 22% attrition limit generalizability. Together, these observational studies broaden retinal biomarker research beyond vascular morphology alone without proving kidney-specific neurodegeneration.
OCTA provides dye-free, depth-resolved flow-related measures such as vessel or perfusion density, foveal avascular zone (FAZ) morphology, and choriocapillaris flow deficits [4,12,53,54,55,56,57], but it neither quantifies absolute blood flow nor demonstrates leakage. Measurements are influenced by signal strength, scan size, segmentation boundaries, motion and projection artifacts, axial length, diurnal variation, test–retest variability, and proprietary device algorithms; deep-capillary-plexus metrics are particularly vulnerable to segmentation and projection errors [54,56,58,59]. Small between-group differences should therefore be interpreted alongside device- and protocol-specific repeatability and potential systematic differences in image quality or segmentation [58,59]. Statistical significance at the group level does not establish reliable individual-level discrimination. Similarly, small within-person changes require comparison with measurement variability before being interpreted as biological progression or treatment response.
3.3. Retinal Oximetry, LSFG, and Dynamic Vessel Analysis
Retinal oximetry, laser speckle flowgraphy (LSFG), and dynamic vessel analysis (DVA) add functional information on oxygenation, relative blood-flow signals, and vascular reactivity [11,60,61]. In an age-matched analysis, hemodialysis patients had attenuated flicker-induced arteriolar and venular dilation compared with healthy controls [62], although substantial between-group differences in diabetes, hypertension, inflammatory status, and vascular disease burden preclude kidney-specific attribution. Associations between retinal vascular responses and mortality in dialysis populations further support biological relevance [63], but sensitivity to measurement conditions, limited reference ranges, and uncertain incremental value currently restrict these methods to complementary research applications.
3.4. FFA and ICGA
Fundus fluorescein angiography (FFA) demonstrates leakage, nonperfusion, ischemia, and neovascularization, while indocyanine green angiography (ICGA) visualizes the choroidal circulation [46]. Intravenous dye and limited CKD-specific evidence make both selective ocular problem-solving tools rather than platforms for population risk enrichment.
3.5. Emerging Technologies: Adaptive Optics, Hyperspectral Imaging, and FLIO
Adaptive optics offers near-cellular visualization, hyperspectral imaging captures wavelength-resolved tissue signatures, and fluorescence lifetime imaging ophthalmoscopy (FLIO) measures endogenous fluorescence lifetimes [64,65,66]. Evidence for their systemic and CKD applications remains preliminary; translation requires standardized protocols, normative data, repeatability, external validation, and added value beyond established imaging and clinical biomarkers.
Across modalities, three practical translational positions can be distinguished. Conventional fundus photography is the most scalable platform for prospective evaluation of opportunistic CKD risk enrichment, with UWF imaging offering an extension where equipment is available [16,17,18,19]. Quantitative OCT/OCTA measures and functional assessments remain research applications for CKD: selected OCT/OCTA measures have emerging longitudinal evidence, DVA has prognostic evidence in dialysis populations, and retinal oximetry and LSFG provide complementary physiological information [4,12,50,52,60,61,62,63]. Adaptive optics, hyperspectral imaging, and FLIO remain exploratory for CKD-related applications [64,65,66]. These positions reflect practical availability, standardization, reproducibility, resource requirements, and CKD-specific evidence rather than formal evidence grades. Established ophthalmic use does not itself establish readiness for CKD risk assessment; FFA and ICGA retain selective ocular indications rather than a role in routine opportunistic kidney-risk assessment.
4. Clinical Evidence: CKD as a Translational Reference Model
CKD permits evaluation of retinal phenotypes in relation to kidney function, albuminuria, disease severity, prognosis, and treatment-related changes [3,4,9]. Table 2 summarizes representative studies. Figure 3 summarizes overlapping population-level retinal associations reported across kidney-function categories and treatment contexts. Features shown in different groups are not exclusive to those groups, and their arrangement does not imply a validated within-person progression sequence.
Figure 3.
Reported retinal imaging associations across CKD severity and treatment contexts. This schematic summarizes overlapping population-level findings from heterogeneous studies, predominantly cross-sectional. Features are not exclusive to individual kidney-function categories, and the panel order does not represent a validated retinal staging system, within-person progression sequence, or causal kidney-to-retina pathway. Dialysis and transplantation are shown separately as treatment contexts rather than successive stages on an eGFR continuum. Treatment-associated changes remain preliminary and should not be interpreted as established microvascular repair. CKD, chronic kidney disease; eGFR, estimated glomerular filtration rate; FD, fractal dimension; OCT, optical coherence tomography; OCTA, optical coherence tomography angiography; UACR, urinary albumin-to-creatinine ratio.
4.1. Cross-Sectional Evidence
Cross-sectional studies constitute the largest body of evidence linking retinal abnormalities with CKD. A systematic review of 42 studies identified associations between retinopathy, retinal vascular caliber, and several kidney outcomes, including prevalent CKD, albuminuria, kidney failure, and eGFR decline [9]. Population cohorts have linked venular tortuosity and reduced vascular network complexity with impaired kidney function [67,68], but in the Singapore Malay Eye Study (SiMES), retinal geometry and qualitative signs were associated with continuous eGFR or albuminuria, whereas none independently identified prevalent CKD as a binary outcome; adding retinal markers improved the area under the receiver operating characteristic curve (AUC) for microalbuminuria from 0.77 to 0.80 but not for CKD [69]. Scanning laser Doppler flowmetry has also identified arteriolar remodeling and capillary rarefaction in moderately severe CKD [70]. In diabetes, albuminuria was associated with diabetic retinopathy, whereas isolated eGFR < 60 mL/min/1.73 m2 without albuminuria was not associated with diabetic retinopathy; the combined low-eGFR/albuminuric phenotype had the strongest association [71]. This heterogeneity cautions against treating all reduced-eGFR phenotypes as equivalent manifestations of diabetic microangiopathy.
OCTA studies, including hypertensive and mixed CKD cohorts, have reported lower retinal vessel density and larger flow-void areas [12,72,73,74]. OCT studies provide complementary evidence of inner retinal and choroidal thinning, although some abnormalities are more apparent in advanced disease than in early CKD [4,38]. Not all cohorts have demonstrated consistent associations, highlighting the effects of diabetes, hypertension, age, ocular disease, imaging protocol, and statistical adjustment [75].
4.2. Longitudinal and Prognostic Evidence
Longitudinal evidence is less extensive but more clinically informative. In SiMES, smaller baseline retinal arterioles, larger venules, and retinopathy were associated with incident CKD over a median follow-up of six years [35]. In two additional Asian cohorts, retinopathy predicted incident kidney failure (reported as end-stage renal disease [ESRD]; adjusted hazard ratio (HR) 2.51), whereas caliber and FD did not; only 33 events occurred and most were in participants with diabetes [76]. The Multi-Ethnic Study of Atherosclerosis found no overall association between retinal caliber and incident G3 CKD, with an association for arteriolar narrowing confined to White participants [77]. Over 15 years in Beaver Dam, baseline caliber did not predict incident low eGFR, and low eGFR did not predict subsequent caliber change [78]. In the Cardiovascular Health Study, retinopathy was associated with creatinine and eGFR deterioration [79], but retinal photography overlapped the kidney-function observation window. In multiethnic diabetes populations, retinal microvascular signs have been linked to diabetic kidney disease, but the clinical contribution beyond conventional risk factors requires evaluation against prespecified comparators [42]. These findings support risk enrichment while showing that an association does not necessarily translate into clinically meaningful incremental predictive value.
Prospective evidence spans vascular morphology, vascular reactivity, OCTA perfusion, and OCT-derived structure. Among 906 people with type 2 diabetes but no diabetic retinopathy, lower baseline superficial and radial peripapillary capillary perfusion densities at the optic nerve head predicted faster eGFR decline over three years; adding OCTA increased AUC from 0.696 to 0.725, with directionally consistent findings in a second 400-person cohort from the same project rather than in an independent external validation cohort [80]. In a cardiovascular-risk cohort, attenuated flicker-induced arteriolar dilation was associated with faster long-term eGFR decline among participants with initially preserved kidney function [81]. In a non-diabetic population, wider retinal arteriolar and venular calibers were associated with steeper decline in measured glomerular filtration rate (GFR) over a median 11-year follow-up [82]. Lower macular volume and choroidal thickness have also been associated with subsequent eGFR decline [4]. In kidney failure, impaired flicker-induced retinal venular dilation independently predicted all-cause mortality in a multicenter dialysis cohort [63]; this finding reflects systemic vascular prognosis rather than prediction of CKD onset or stage.
Table 2.
Representative clinical evidence linking retinal imaging phenotypes with CKD.
4.3. Differences Across CKD Stages
Current studies suggest an overall severity–related gradient, but no reproducible stage-specific retinal signatures. Findings among participants with eGFR 60–89 mL/min/1.73 m2 or other early-risk features are subtle and inconsistent and may include differences in vascular caliber, OCT/OCTA measures, FD, or oxygenation. An eGFR of 60–89 mL/min/1.73 m2 alone does not establish CKD; evidence of kidney damage persisting for at least 3 months is required. Studies without this documentation describe a G2-range kidney-function phenotype rather than confirmed G2 CKD. Their ability to distinguish early CKD from cardiometabolic risk without kidney disease remains uncertain. In G3 CKD, reductions in OCTA-derived vessel or perfusion density and early retinal or choroidal alterations are reported more consistently [73,84]. Advanced G4–G5 CKD has been associated with greater capillary rarefaction, inner retinal thinning, choroidal thinning, and impaired perfusion [4,38]. Kidney failure and dialysis may additionally involve impaired vascular reactivity and altered oxygenation or blood flow dynamics [11,63].
4.4. Diabetic Versus Non-Diabetic CKD
Diabetes is a major effect modifier in the relationship between retinal imaging phenotypes and CKD. In diabetic CKD, retinal abnormalities may reflect the combined effects of chronic hyperglycemia, hypertension, endothelial dysfunction, inflammation, diabetic retinopathy, and kidney-related microvascular injury. OCTA studies have associated lower superficial capillary density and altered choroidal measures with reduced eGFR or increased albuminuria, including among patients without clinically apparent diabetic retinopathy [42,53,55,85]. The absence of diabetic retinopathy therefore does not exclude a retinal microvascular signal associated with renal impairment. Conversely, the Singapore Prospective Study Program and Singapore Malay Eye Study cohorts showed that diabetic retinopathy was associated more consistently with albuminuric CKD than with isolated low eGFR [71]. It remains difficult to determine how much of any retinal signal is attributable specifically to kidney disease, and eGFR and albuminuria should be analyzed as complementary rather than interchangeable phenotypes.
Non-diabetic CKD provides an opportunity to examine retina–kidney associations without chronic hyperglycemic injury. A small study excluding diabetes found narrower retinal arterioles and lower AVR in 34 CKD participants than in 33 controls [86], but inconsistent eGFR equations and the small sample size limit the weight of this evidence. Other non-diabetic, hypertensive, or mixed CKD cohorts have reported capillary rarefaction, retinal neurovascular impairment, inner retinal or choroidal thinning, and altered retinal oxygenation [4,11,12,37,38,70,72,74]. Removal of diabetic confounding does not confer kidney specificity, because hypertensive and uremic vascular injury, aging, anemia, CKD etiology, and treatment may generate overlapping retinal phenotypes. Distinguishing kidney-associated retinal changes from shared cardiometabolic injury should guide comparisons across these populations. Where feasible, studies should include CKD with and without diabetes, diabetes without CKD, hypertension without CKD, and appropriately matched controls. Comparisons should characterize blood-pressure exposure, diabetes duration and control, retinopathy, cardiovascular disease, medication use, and ocular determinants alongside eGFR and albuminuria. This design would help identify retinal features associated with kidney status within comparable cardiometabolic backgrounds and distinguish them from features reflecting a broader microvascular burden. Both may be clinically informative: the former could refine kidney-related risk assessment, while the latter could support integrated cardiorenal risk enrichment.
4.5. Blood-Pressure Exposure, Treatment Response, and Kidney Transplantation
An important translational question is whether retinal imaging biomarkers are responsive to changes in systemic disease status. Current evidence supports biological sensitivity but does not yet establish retinal imaging as a validated treatment-response endpoint. In patients with CKD stages G3–G5, lower OCTA-derived vessel density and larger superficial flow-void areas were associated with systolic blood pressure levels and variability during the preceding year [73]. Retinal vascular caliber differences have also been reported across CKD stages in hypertensive populations [84]. These observational findings cannot determine whether improving blood-pressure control directly reverses retinal microvascular abnormalities.
Kidney transplantation provides a stronger natural model for assessing sensitivity to changes in systemic status. Prospective studies have reported increases in choroidal thickness after transplantation in parallel with improved kidney function, although not all choroidal parameters changed consistently [48]. In a series of cross-sectional and longitudinal OCT studies, retinal and choroidal thinning were associated with kidney injury and subsequent eGFR decline, while selected choroidal and retinal measurements changed following kidney transplantation or donation [4]. The parameter-specific nature of these findings argues against interpreting post-transplant changes as uniform microvascular recovery.
Changes after treatment or transplantation may reflect altered blood pressure, fluid balance, anemia, inflammation, glycemic status, or immunosuppressive exposure in addition to restored kidney function. Future studies should therefore incorporate standardized serial imaging, predefined time points, concurrent systemic measurements, appropriate control groups, and assessment of test–retest variability. Clinical translation will require evidence that imaging changes exceed measurement variability, correspond to meaningful renal or cardiovascular outcomes, and provide information beyond conventional laboratory monitoring.
5. Comparative Cardiorenal Contexts and Exploratory Modifiers
Cardiovascular disease, hypertension, and diabetes provide the principal comparative contexts for interpreting retinal findings in CKD because they share vascular exposures and may independently influence retinal phenotypes. Other systemic conditions are considered more briefly as potential sources of heterogeneity. Table 1 summarizes these relationships and their interpretive limitations.
5.1. Cardiovascular and Hypertensive Disease
Cardiovascular and hypertensive diseases share endothelial dysfunction, vascular remodeling, oxidative stress, inflammation, and impaired autoregulation with CKD [5,6]. Quantitative fundus phenotypes, including arteriolar narrowing, venular widening, tortuosity, reduced FD, and retinopathy signs, have been associated with blood-pressure exposure, hypertensive target-organ damage, and cardiovascular outcomes [5,39]. These associations are relevant to CKD studies because hypertension and cardiovascular disease can contribute to both kidney dysfunction and retinal abnormalities.
Functional measurements of vascular reactivity, blood-flow-related signals, and oxygenation may provide complementary information about systemic vascular dysfunction [11,60,61,63]. Their interpretation should account for blood pressure, cardiovascular disease, and treatment exposure. The central translational question is whether these measurements add information about kidney-related or broader cardiorenal risk beyond established clinical variables.
5.2. Diabetes and Cardiometabolic Disease
Diabetes is a major modifier of CKD-associated retinal phenotypes. Fundus, OCT, and OCTA studies have associated retinal vascular caliber, capillary density, and choroidal parameters with eGFR, albuminuria, and DKD [42,53,55,85,87,88]. OCTA and choroidal alterations have also been reported in participants without clinically apparent diabetic retinopathy [53,55,85]. These findings extend the detectable phenotype beyond visible retinopathy, but do not separate kidney-associated changes from the effects of diabetes itself.
Interpretation should therefore consider glycemic control, including glycated hemoglobin (HbA1c), diabetes duration, retinopathy severity, blood pressure, adiposity, medication exposure, and ocular disease. Ocular treatment history also warrants consideration: intravitreal anti-vascular endothelial growth factor (anti-VEGF) therapy and panretinal photocoagulation have been associated with changes in choroidal thickness [89,90]. Treatment type and timing relative to imaging should therefore be documented when interpreting retinal or choroidal findings in diabetic populations. Associations of retinal vascular caliber with metabolic syndrome and reported OCTA changes after metabolic interventions further illustrate the influence of the wider cardiometabolic context [91,92,93]. Existing diabetic eye-screening programs provide a practical setting for evaluating whether routinely acquired retinal information improves identification of individuals needing kidney assessment. Detailed evidence on diabetic versus non-diabetic CKD is discussed in Section 4.4, and candidate clinical pathways are considered in Section 7.
5.3. Other Systemic Modifiers
Liver-related, gut-related, neurodegenerative, and immune-inflammatory conditions may contribute to retinal phenotypic heterogeneity, but their relevance to CKD-specific interpretation remains uncertain. Liver–retina evidence is heterogeneous: a meta-analysis found no significant overall association between fatty liver disease and retinopathy [13]. Direct human evidence integrating microbiome profiles, quantitative retinal imaging, and CKD outcomes remains limited [14,40]. Neurodegenerative and immune-inflammatory conditions provide additional contexts for overlapping neural, vascular, and inflammatory retinal changes [6,8,44,65]. These domains are retained as potential confounders or effect modifiers rather than developed as parallel screening targets.
6. AI-Enabled Retinal Phenotyping and Multimodal Risk Modeling
Representative AI models are summarized in Table 3. Here, detection denotes classification of an existing kidney condition using study-defined labels, prediction estimates future onset or progression, and screening refers to a proposed workflow in which a retinal signal prompts confirmatory kidney assessment. Because task definitions, disease prevalence, imaging inputs, and validation designs differ substantially, performance estimates should not be compared directly across studies.
6.1. Automated Retinal Feature Extraction and Phenotype Standardization
AI can quantify predefined features, which retain biological interpretability, or learn latent image representations that may capture complex signals but are harder to separate from artifacts and confounding [5,46,94,95,96]. Reproducibility requires standardized acquisition, image quality and artifact handling, and explicit CKD labels with appropriate temporal alignment to imaging. For supervised models, labels should specify the eGFR equation, albuminuria definition, evidence of chronicity, and timing between retinal imaging and kidney measurements. Patient-level partitioning is essential to prevent leakage between eyes, visits, or repeated images [22,23].
6.2. AI Models for CKD Detection and Risk Prediction
Interpretation of retinal AI models requires attention to differences in kidney disease ascertainment across studies. Models detecting CKD, clinically attributed DKD, or biopsy-defined DN address distinct clinical tasks, and CKD in people with diabetes should not be assumed to represent DKD. Retinal AI studies show that fundus and OCTA images contain signals for detection of prevalent CKD or prediction of future kidney dysfunction, but external performance varies by population, setting, and device [15,16,17,18,97,98,99]. In multiethnic diabetes-screening cohorts, image-only DKD AUC decreased from 0.826 internally to 0.764 in the Singapore Epidemiology of Eye Diseases (SEED) study and 0.726 in the Singapore Macroangiopathy and Microvascular Reactivity in Type 2 Diabetes (SMART2D) study, while hybrid clinical–image models reached 0.828 and 0.761, respectively [100]; label definitions and performance still varied across cohorts. A small OCTA nomogram illustrates the limitations of interpretable feature-based models: a concordance index (C-index) of 0.678 in same-center validation, no external cohort, and no eGFR or urinary albumin excretion data [101]. Longitudinal Reti–CKD results were promising but added only modestly to eGFR–based models [15].
DeepDKD underwent broad multiethnic validation for DKD detection and was also evaluated for differentiating biopsy-defined DN from non-diabetic kidney disease (NDKD) [19]. Its smaller biopsy cohorts and attenuated external performance support use as a potential triage aid rather than a substitute for nephrology assessment or biopsy.
Biopsy-linked systems have extended retinal AI to pathological classification and nephrology triage. KIDS explored CKD screening, pathological classification, and prognosis, whereas Trans-MUF differentiated DN from non-diabetic renal disease (NDRD) using retinal and clinical information [102,103]. Their interpretation remains task-specific: selected biopsy populations, small external cohorts, and differences between image-level and participant-level performance affect applicability. Detailed model characteristics and validation results are summarized in Table 3.
The evidence now includes external validation and prospective proof-of-concept evaluation, but these should be distinguished from studies demonstrating benefit from model-guided care [16,17,18,19,102,103]. The key translational questions are whether performance transfers across settings, whether retinal information adds value beyond clinical assessment, and whether its use improves testing or management decisions.
6.3. Multimodal Risk Modeling Across Retinal and Systemic Biomarkers
Clinically meaningful incremental value beyond conventional assessment remains limited. Reti–CKD improved the C-index by 0.020–0.024 over eGFR-based comparators in cohorts that excluded participants with baseline eGFR < 90 mL/min/1.73 m2 or proteinuria [15]. This setting differs from the Kidney Failure Risk Equation (KFRE), which uses age, sex, eGFR, and UACR to estimate kidney-failure risk in people with established CKD [104]. These findings support evaluating retinal models for risk enrichment or opportunistic case finding when recent kidney laboratory results are unavailable. Retinal-plus-urine or image–clinical models have not consistently outperformed simple clinical comparators in external cohorts [16,97].
Comparators should reflect the intended decision point. When recent kidney tests are unavailable, retinal models should be evaluated against clinical risk assessment and relevant targeted or universal eGFR/UACR testing strategies. When laboratory results are available, retinal features should demonstrate added value beyond kidney and cardiometabolic variables. Improvements over image-only models do not establish the incremental contribution of retinal imaging; discrimination gains should be considered alongside calibration and decision-analytic net benefit [26,105].
Table 3.
Representative retinal AI models for kidney disease assessment.
6.4. Generalizability, Calibration, and Subgroup Performance
The external performance attenuation observed in retinal CKD models makes transportability a central interpretive issue [16,17,18,19,97]. Evaluation should distinguish independent external cohorts from same-center hold-out testing and document differences in population, imaging device, field of view, and kidney-outcome definitions. In particular, differences in diabetes and retinopathy status, CKD severity, and eGFR or albuminuria ascertainment may alter both the retinal signal and the clinical task.
Discrimination should be considered alongside calibration and performance at thresholds relevant to confirmatory kidney testing [24]. Subgroup assessment should examine clinically consequential errors and ungradable-image rates, as well as overall accuracy, because pooled performance may conceal differences across age, ethnicity, diabetes status, ocular comorbidity, and devices [21]. These assessments determine whether a model can support the intended CKD-testing pathway in a new setting. Supporting frameworks include the Transparent Reporting of a multivariable prediction model for Individual Prognosis Or Diagnosis plus artificial intelligence (TRIPOD+AI) reporting guideline and the Prediction model Risk Of Bias ASsessment Tool plus artificial intelligence (PROBAST+AI) appraisal tool [22,23].
6.5. Explainability, Decision Curve Analysis, and Clinical Utility
Explainability is relevant when interpreting whether retinal models rely on measurable vascular or structural features, ocular disease, or shared cardiometabolic signals. Linking model outputs to quantified retinal phenotypes can strengthen biological interpretation, whereas plausible heatmaps alone do not establish kidney specificity or causality [20,106]. Clinical usefulness nevertheless depends on the decision supported by the model, rather than the plausibility of its visual explanation.
For a proposed action such as confirmatory eGFR/UACR testing, decision-curve analysis should compare retinal-guided assessment with relevant clinical-only, test-all, test-none, and usual-care strategies across clinically plausible thresholds [26,105]. This provides decision-analytic evidence, which should remain distinct from prospective model validation and clinical-impact evaluation. Prospective studies should determine whether retinal guidance improves appropriate testing and referral, shortens time to kidney assessment, and provides benefits that justify false alerts, workload, and costs [25,26]. The proposed clinical framework is discussed in Section 7.
7. Potential Clinical Applications and Requirements for Prospective Evaluation
7.1. Opportunistic Screening in Ophthalmology Settings
Translation is most plausible where retinal images are already acquired, particularly in routine eye care and diabetic screening [8]. Conventional FP provides the most scalable starting point for prospective evaluation of opportunistic CKD risk enrichment. UWF imaging may extend retinal coverage where available, while quantitative OCT/OCTA assessment offers a complementary research approach. Quantitative features or AI-derived risk could flag patients with no recent kidney assessment for confirmatory testing [16,17,19]. Diabetic eye screening is the most practical initial setting because imaging infrastructure, repeated attendance, and a high risk of kidney disease coexist. Retinal outputs should trigger a defined action—such as eGFR/UACR testing or primary-care review—rather than an unexplained systemic risk score; programs must track image quality, referral completion, and patient communication [107,108].
7.2. CKD Risk Enrichment Rather than Stand-Alone Diagnosis
Retinal imaging should be positioned as a risk-enrichment tool, not a stand-alone diagnostic test. CKD diagnosis and staging remain based on eGFR, UACR, and chronicity [2,3]. Because retinal vascular, structural, perfusion, and AI-derived features are influenced by systemic, ocular, and technical factors, an elevated signal should prompt confirmatory assessment rather than be used to assign a CKD label. Clinical value must be judged against existing risk-based or universal testing strategies, not image interpretation alone [5,6,9,19,39,99].
7.3. Proposed Framework for Prospective Evaluation
Figure 4 presents a proposed framework for prospective evaluation, rather than a clinically validated pathway. It links an existing retinal imaging encounter, quality control and phenotyping, integration with clinical context, confirmatory kidney assessment, and proportionate follow-up. Within this proposed framework, retinal findings would be interpreted alongside age, diabetes and hypertension status, cardiovascular history, medication exposure, and previous kidney results. A retinal signal meeting a prospectively specified study threshold would prompt consideration of serum creatinine-based eGFR and UACR testing, rather than establish a CKD diagnosis [2,3].
Figure 4.
Proposed framework for prospective evaluation of retinal imaging-guided CKD risk enrichment. The schematic illustrates how retinal signals could be integrated with clinical context to prompt confirmatory eGFR and UACR testing, followed by results communication and management according to established clinical guidance. Feedback could support quality assurance and model monitoring. The retinal-guided framework has not been established as a clinically validated pathway: actionable retinal thresholds, improved patient outcomes, cost-effectiveness, and generalizable workflow performance require prospective evaluation. The arrows indicate proposed information and care processes, not demonstrated clinical benefit. AI, artificial intelligence; CKD, chronic kidney disease; CVD, cardiovascular disease; eGFR, estimated glomerular filtration rate; EHR, electronic health record; OCT, optical coherence tomography; OCTA, optical coherence tomography angiography; UACR, urinary albumin-to-creatinine ratio.
Once kidney abnormalities are identified, their evaluation and management should follow established clinical pathways. Normal kidney tests may lead to routine risk–factor management and interval reassessment. Reduced eGFR, persistent albuminuria, a sustained clinically meaningful decline in eGFR on serial testing, resistant hypertension, or suspected DKD should prompt management according to local guidance, ranging from primary-care optimization and endocrinology consultation to nephrology referral. Kidney results, referral completion, safety events, and subsequent outcomes should feed back into the linked imaging and electronic health record (EHR) system for quality assurance, calibration monitoring, governed threshold review, and model recalibration. Prospective implementation studies should test whether this closed loop improves case finding and net clinical benefit rather than merely increasing referrals [25,26,105].
The framework does not specify validated retinal action thresholds, and improved patient outcomes, cost-effectiveness, and generalizable workflow performance have not been established for this proposed pathway. Prospective studies should define the intended population and action thresholds, assign responsibility for communication and confirmatory testing, and compare the retinal-guided strategy with relevant clinical or testing alternatives [25,26,105,109]. Evaluation should include testing and referral completion, false-alert burden, subgroup equity, service capacity, patient outcomes, and costs [21,25,110].
7.4. Integration with Systemic Biomarkers and Electronic Health Records
Retinal phenotypes may reflect accumulated microvascular, neuroretinal, and choroidal injury, whereas eGFR, UACR, and their longitudinal trajectories establish kidney status, and blood pressure, HbA1c, and medication history inform clinical actionability. Some multimodal models improve performance or stability, but gains remain task- and population-dependent [16,17,97]. EHR integration should serve the decision rather than simply add predictors. The system should identify missing or outdated kidney tests, display the retinal signal alongside prior eGFR/UACR results and relevant comorbidities, document the action taken, and capture downstream outcomes.
7.5. Implementation in Resource-Limited and High-Volume Settings
High-volume and resource-limited services may benefit from retinal risk enrichment, but implementation should begin with the simplest sustainable pathway. Non-mydriatic or handheld FP, automated image-quality assessment, and targeted eGFR/UACR testing are more scalable than deploying specialist OCTA or functional imaging solely for CKD screening. Teleophthalmology and real-world diabetic retinopathy screening programs demonstrate that non-specialist acquisition and automated triage can extend reach, while unreadable images, staff training, referral completion, and downstream capacity remain decisive constraints [107,108].
Local validation must address camera and illumination differences, disease prevalence, rates of ungradable images, subgroup performance, laboratory and referral capacity, acceptability, and workload [21,25,107]. A system that identifies more high-risk patients but exceeds confirmatory testing or referral capacity may provide little net benefit.
7.6. Candidate Clinical Scenarios for Prospective Evaluation
Table 4 summarizes candidate clinical scenarios and their principal evidence gaps. Diabetic eye screening is a priority setting for prospective evaluation because retinal images are routinely acquired and externally validated CKD/DKD models are available [16,17,19]. In established CKD, dialysis, and post-transplant care, quantitative and functional imaging offers a complementary research setting for longitudinal phenotyping [4,11,61,63]. Broad screening of average-risk asymptomatic populations is not currently justified.
Table 4.
Candidate clinical scenarios for prospective evaluation of retinal imaging-based CKD risk enrichment.
7.7. Evidence Needed Before Routine Adoption
Routine adoption requires a linked evidence chain: analytical validity (acquisition reliability, repeatability, failure detection, and cross-device performance); clinical validity (external validation, calibration, subgroup performance, and incremental value beyond routine kidney and cardiometabolic variables); and clinical utility. Workflow-embedded studies should determine whether retinal guidance improves appropriate eGFR/UACR testing, referral, and risk-factor management and provides net clinical benefit without disproportionate false alerts, anxiety, inequity, or workload [25,26,105]. Pragmatic and health-economic evaluation should precede broad adoption.
8. Barriers and Methodological Challenges
8.1. Imaging Standardization and Inter-Device Reproducibility
Technical variation in camera characteristics, field of view, illumination, scan protocol, segmentation, artifact correction, and software can obscure subtle biological differences. Even acceptable within-device repeatability does not ensure cross-platform agreement: seven OCTA devices produced non-interchangeable measurements of vessel density, FD, and FAZ [111]. Device-specific thresholds should therefore not be transferred across platforms without harmonization and independent validation. Studies should report device, acquisition, and software details, quality thresholds, exclusions, segmentation review and correction, and harmonization procedures. For longitudinal studies, device- and protocol-specific intraclass correlation coefficients, coefficients of variation, and minimal detectable change should be estimated before an observed change is interpreted as biological progression or treatment response [58,59]. Studies using bilateral images should prespecify eye-selection rules or account for within-participant correlation, and should clearly distinguish eye-level from participant-level outcomes.
8.2. Population Heterogeneity and Confounding
Retinal phenotypes in CKD are composite signals shaped by kidney status, systemic vascular exposure, ocular disease, and technical factors. Adjustment quality is uneven across the literature: age and sex are commonly included, whereas contemporaneous blood pressure and antihypertensive treatment, diabetes duration, HbA1c and diabetic retinopathy severity, hemoglobin or anemia, albuminuria and CKD etiology, cardiovascular risk, and ocular determinants such as axial length, refractive error, ocular comorbidities, and image quality are handled inconsistently [4,5,6,9,10,39,71,73,75,80,83]. Consequently, fully adjusted, time-aligned longitudinal analyses should carry greater interpretive weight than minimally adjusted cross-sectional comparisons; residual confounding nevertheless continues to preclude kidney-specific attribution.
Outcome definitions are also inconsistent. CKD may be defined using a single eGFR value, repeated measurements, albuminuria, clinical coding, or combinations of these criteria, while DKD, hypertensive nephropathy, glomerular disease, kidney failure, and transplant populations are often pooled [2,3]. Several retinal studies classified eGFR 60–89 mL/min/1.73 m2 as mild CKD without documenting chronicity or another marker of kidney damage, and others defined incident CKD using a single follow-up eGFR < 60 mL/min/1.73 m2. This heterogeneity can inflate or dilute associations and makes subgroup estimates difficult to transport. Analyses should prespecify kidney definitions, distinguish major etiologic and treatment groups when feasible, and evaluate interactions rather than relying only on covariate adjustment. For AI models, subgroup discrimination, calibration, missingness, and rates of image-quality-related failure should be reported because an acceptable pooled AUC can conceal clinically important underperformance [21,22].
The evidence base is geographically concentrated, with many retinal CKD and AI studies derived from East and Southeast Asian cohorts. Transportability to populations in Africa, Latin America, and the Middle East, as well as to Indigenous and other under-represented populations, remains uncertain because retinal pigmentation, CKD etiology, cardiometabolic burden, imaging devices, disease prevalence, and healthcare context may affect both measured phenotypes and model calibration [15,16,17,18,19,97].
8.3. Organ Specificity and Causal Interpretation
A central interpretive task is to distinguish retinal features associated with kidney status from those reflecting shared cardiometabolic microvascular burden. Vascular geometry, OCT/OCTA measures, and neuroretinal or choroidal structure may reflect overlapping influences of CKD, diabetes, hypertension, aging, ocular disease, and treatment [5,6,9]. Statistical adjustment is important, but clinically informative comparator groups provide an additional means of examining whether associations differ across kidney and cardiometabolic phenotypes. Organ specificity and clinical usefulness are distinct questions: a retinal feature need not be kidney-specific to contribute to risk assessment, provided that its incremental value is demonstrated for a defined clinical task.
Most evidence is cross-sectional and cannot establish whether retinal changes precede kidney dysfunction, develop in parallel, or reflect shared exposures. Longitudinal studies remain vulnerable to residual confounding, competing risks, treatment effects, measurement error, and reverse causation through the consequences or treatment of kidney disease, including uremia, anemia, fluid shifts, dialysis, and immunosuppression [4,48,73]. Mechanistic claims should therefore not exceed study design; current evidence supports complementary risk phenotyping rather than a causal or CKD-specific signature. Emerging causal-inference studies may help clarify directionality. A 2026 bidirectional two-sample Mendelian randomization analysis suggested associations in both kidney-to-retina and retina-to-kidney directions; however, restriction to a specific ancestry, heterogeneous DKD phenotypes, multiple testing, and instrument selection assumptions make these findings hypothesis-generating rather than definitive evidence of causality [112].
8.4. AI Deployment, Governance, and Workflow Integration
Deployment requires a defined target population, specified eligible image types and compatible devices, action thresholds, failure handling, human oversight, responsibility for confirmatory testing or referral, and post-deployment monitoring. Governance should cover data provenance, cybersecurity, privacy, auditability, version control, calibration drift, subgroup performance, human–AI interaction, alert burden, and unintended consequences [21,25]. Governance and workflow integration should therefore be treated as components of clinical performance rather than as administrative steps undertaken after model validation.
9. Future Roadmap
Figure 5 summarizes the translational evidence continuum: biological plausibility and cross-sectional associations are comparatively well developed, whereas longitudinal prediction, incremental clinical value, and clinical utility remain progressively less established [5,16,99].
Figure 5.
Translational evidence continuum for retinal imaging biomarkers in CKD. This conceptual narrative framework describes the maturity of the translational evidence chain. It is not a formal Grading of Recommendations Assessment, Development and Evaluation (GRADE) assessment. Biological plausibility and cross-sectional association do not establish incremental clinical value. Incremental value requires comparison with a prespecified clinical baseline, alongside calibration, subgroup performance, and decision-analytic benefit; routine clinical utility remains unestablished. CKD, chronic kidney disease; DLA, deep learning algorithm; eGFR, estimated glomerular filtration rate; MMDL, multimodal deep learning; OCT, optical coherence tomography; OCTA, optical coherence tomography angiography; SiMES, Singapore Malay Eye Study.
9.1. Multicenter Prospective Cohorts with Standardized Imaging Protocols
The immediate priority is multicenter prospective cohorts designed to distinguish kidney-associated retinal signals from shared cardiometabolic microvascular burden. Recruitment should, where feasible, incorporate the comparator groups outlined in Section 4.4, with time-aligned retinal imaging, eGFR, UACR, treatment exposures, and clinical outcomes. Prespecified analyses should assess within-group associations and interactions by diabetes and hypertension status, alongside standardized acquisition, quality control, device harmonization, and test–retest reliability [4,9,35,46,58,59,111]. Nested AI analyses should lock model specifications before outcome evaluation and separate development and validation by site, device, geography, or time. Such cohorts can support longitudinal biomarker validation, treatment-response assessment, and subsequent pragmatic trials, moving the field beyond isolated cross-sectional analyses.
9.2. Multi-Organ Biomarker Panels and Longitudinal Assessment
Biomarker development should use a tiered strategy. A deployable core panel could combine retinal morphology or perfusion features with eGFR, UACR, blood pressure, diabetes status, HbA1c, medication exposure, and cardiovascular risk. A discovery tier could then add circulating or urinary markers of endothelial injury, inflammation, oxidative stress, uremic exposure, extracellular vesicle signaling, and selected omics data. This tiered structure would test whether retinal phenotypes identify a cross-organ microvascular state while preserving a pathway toward routine implementation [6,34]. The goal is the smallest panel that improves a prespecified clinical decision. Nested-model or ablation analyses should quantify retinal, laboratory, and omics contributions against a parsimonious clinical baseline.
Longitudinal studies should time-align repeated retinal imaging with eGFR and UACR trajectories, treatments and medications, fluid status, hemoglobin, blood pressure, omics measurements where available, and clinical outcomes. Imaging intervals should be prespecified, and the provenance and timing of laboratory, imaging, omics, and outcome data should be preserved in linked research datasets or EHRs.
9.3. Pragmatic Trials and Real-World Implementation
Once prospective clinical validity is established, evaluation should progress from silent-mode workflow testing to pilot impact studies and pragmatic or cluster-randomized trials. Recent ophthalmology-specific literature describes AI applications in trial recruitment, patient monitoring, and outcome assessment [113]. This provides complementary context for planning retinal CKD studies, while the clinical benefit of a retinal-guided kidney-testing strategy requires evaluation within its intended care setting. Outcomes should cover testing completion, newly detected reduced eGFR or albuminuria, referral appropriateness, time to review, workload, resource use, patient outcomes, and equity; decision-curve and health-economic analyses should test whether benefits outweigh the harms and costs associated with false alerts and over-referral [26,105].
9.4. Ophthalmology as a Partner in Systemic Microvascular Risk Assessment
Ophthalmology can provide an entry point for systemic risk recognition through existing eye-care and diabetic-screening pathways [8]. A sustainable shared-care model requires structured retinal reports, EHR interoperability, agreed testing and referral criteria, clear responsibility for patient communication, and feedback across eye care, primary care, endocrinology, cardiology, and nephrology. Training should prepare eye-care professionals to recognize and communicate systemic risk without transferring responsibility for kidney diagnosis or management into ophthalmology.
10. Conclusions
Retinal imaging provides noninvasive access to systemic microvascular and neurovascular phenotypes. CKD is a useful translational reference because eGFR, UACR, disease severity, and treatment transitions offer clinical anchors for evaluating retinal measurements. The same signals may arise from shared cardiovascular, metabolic, inflammatory, ocular, and aging-related processes [2,3,4,5,6,8,9].
Retinal imaging offers a promising adjunctive approach to systemic microvascular risk enrichment, particularly when routinely acquired images can identify individuals needing kidney assessment. Prospective studies should establish the incremental clinical utility of retinal-guided strategies beyond existing clinical approaches by assessing testing, referral, and patient outcomes, while addressing image quality, device compatibility, actionable thresholds, responsibility for confirmatory testing, and downstream service capacity [2,3,25,26,99]. Ophthalmology can contribute to this evaluation through coordinated care with primary care and relevant specialties.
Supplementary Materials
The following supporting information can be downloaded at: https://www.mdpi.com/article/10.3390/jcm15218657/s1, Supporting Information S1. Literature search and evidence-selection framework. Full database search strategies, record counts, evidence-selection framework, evidence prioritization, and author oversight.
Author Contributions
Q.G. conceived and designed the review, conducted the literature search and evidence synthesis, drafted the manuscript, and prepared the figures and tables. F.L. and Y.Z. contributed to the conception and design of the review, supervised the work, interpreted the evidence, and critically revised the manuscript. Z.C. and J.W. contributed to literature screening, evidence extraction, reference verification, and manuscript revision. Z.G., H.Q., and Z.H. contributed to literature screening, reference checking, and manuscript editing. All authors have read and agreed to the published version of the manuscript.
Funding
This review was supported by the Sichuan Provincial Healthcare Research Project (Popularization and Application Project) [grant number Chuan Jian Yan 2026–113], the West China Hospital of Sichuan University 1–3–5 Artificial Intelligence Project [grant number ZYAI24034], and the Horizontal Cooperation Project of West China Hospital, Sichuan University [grant number HX-H2510449]. The funders had no role in the design or conduct of the review, evidence interpretation, manuscript preparation, or decision to submit the manuscript.
Institutional Review Board Statement
Not applicable. This article is a critical narrative review of previously published literature and did not involve new research with human participants or animals.
Informed Consent Statement
Not applicable.
Data Availability Statement
No new data were created or analyzed in this study. The complete database search strategies and evidence-selection framework are provided in Supporting Information S1.
Acknowledgments
The authors used OpenAI Codex to assist with the development and checking of a Python-based relevance-ranking workflow solely to prioritize literature records for author review, and generative AI tools for English-language editing. All AI-assisted outputs were reviewed and verified by the authors, who take full responsibility for the manuscript.
Conflicts of Interest
The authors declare no conflicts of interest.
Abbreviations
AI: artificial intelligence; AUC: area under the receiver operating characteristic curve; AVR: arteriolar-to-venular ratio; C-index: concordance index; CKD: chronic kidney disease; DKD: diabetic kidney disease; DN: diabetic nephropathy; DVA: dynamic vessel analysis; eGFR: estimated glomerular filtration rate; EHR: electronic health record; ESRD: end-stage renal disease (retained only when reporting terminology used in the source studies); FAZ: foveal avascular zone; FD: fractal dimension; FFA: fundus fluorescein angiography; FLIO: fluorescence lifetime imaging ophthalmoscopy; FP: fundus photography; GCIPL: ganglion cell–inner plexiform layer; GFR: glomerular filtration rate; HbA1c: glycated hemoglobin; HR: hazard ratio; ICGA: indocyanine green angiography; LSFG: laser speckle flowgraphy; MASLD: metabolic dysfunction-associated steatotic liver disease; NDKD: non-diabetic kidney disease; NDRD: non-diabetic renal disease; NVU: neurovascular unit; OCT: optical coherence tomography; OCTA: optical coherence tomography angiography; pRNFL: peripapillary retinal nerve fiber layer; PROBAST+AI: Prediction Model Risk of Bias Assessment Tool–Artificial Intelligence; RAAS: renin–angiotensin–aldosterone system; RNFL: retinal nerve fiber layer; TRIPOD+AI: Transparent Reporting of a Multivariable Prediction Model for Individual Prognosis or Diagnosis–Artificial Intelligence; UACR: urinary albumin-to-creatinine ratio; UWF: ultra-widefield imaging.
References
- GBD 2023 Chronic Kidney Disease Collaborators. Global, regional, and national burden of chronic kidney disease in adults, 1990–2023, and its attributable risk factors: A systematic analysis for the Global Burden of Disease Study 2023. Lancet 2025, 406, 2461–2482. [Google Scholar] [CrossRef] [Scilit] [PubMed]
- Chen, T.K.; Knicely, D.H.; Grams, M.E. Chronic Kidney Disease Diagnosis and Management: A Review. JAMA 2019, 322, 1294–1304. [Google Scholar] [CrossRef] [Scilit] [PubMed]
- Kidney Disease: Improving Global Outcomes (KDIGO) CKD Work Group. KDIGO 2024 Clinical Practice Guideline for the Evaluation and Management of Chronic Kidney Disease. Kidney Int. 2024, 105, S117–S314. [Google Scholar] [CrossRef] [Scilit] [PubMed]
- Farrah, T.E.; Pugh, D.; Chapman, F.A.; Godden, E.; Balmforth, C.; Oniscu, G.C.; Webb, D.J.; Dhillon, B.; Dear, J.W.; Bailey, M.A.; et al. Choroidal and retinal thinning in chronic kidney disease independently associate with eGFR decline and are modifiable with treatment. Nat. Commun. 2023, 14, 7720. [Google Scholar] [CrossRef] [Scilit] [PubMed]
- Chew, E.Y.; Burns, S.A.; Abraham, A.G.; Bakhoum, M.F.; Beckman, J.A.; Chui, T.Y.P.; Finger, R.P.; Frangi, A.F.; Gottesman, R.F.; Grant, M.B.; et al. Standardization and clinical applications of retinal imaging biomarkers for cardiovascular disease: A Roadmap from an NHLBI workshop. Nat. Rev. Cardiol. 2025, 22, 47–63. [Google Scholar] [CrossRef] [Scilit] [PubMed]
- Farrah, T.E.; Dhillon, B.; Keane, P.A.; Webb, D.J.; Dhaun, N. The eye, the kidney, and cardiovascular disease: Old concepts, better tools, and new horizons. Kidney Int. 2020, 98, 323–342. [Google Scholar] [CrossRef] [Scilit] [PubMed]
- Kanbay, M.; Guldan, M.; Ozbek, L.; Copur, S.; Mallamaci, F.; Zoccali, C. Unveiling the intricacies of chronic kidney disease: From ocular manifestations to therapeutic frontiers. Eur. J. Clin. Investig. 2025, 55, e14324. [Google Scholar] [CrossRef] [Scilit] [PubMed]
- Wagner, S.K.; Fu, D.J.; Faes, L.; Liu, X.; Huemer, J.; Khalid, H.; Ferraz, D.; Korot, E.; Kelly, C.; Balaskas, K.; et al. Insights into Systemic Disease through Retinal Imaging-Based Oculomics. Transl. Vis. Sci. Technol. 2020, 9, 6, Erratum in Transl. Vis. Sci. Technol. 2021, 10, 13. https://doi.org/10.1167/tvst.9.2.6. [Google Scholar] [CrossRef] [Scilit] [PubMed]
- Aronov, M.; Allon, R.; Stave, D.; Belkin, M.; Margalit, E.; Fabian, I.D.; Rosenzweig, B. Retinal Vascular Signs as Screening and Prognostic Factors for Chronic Kidney Disease: A Systematic Review and Meta-Analysis of Current Evidence. J. Pers. Med. 2021, 11, 665. [Google Scholar] [CrossRef] [Scilit] [PubMed]
- Horton, W.B.; Barrett, E.J. Microvascular Dysfunction in Diabetes Mellitus and Cardiometabolic Disease. Endocr. Rev. 2021, 42, 29–55. [Google Scholar] [CrossRef] [Scilit] [PubMed]
- Liu, R.; Jian, W.; Zhao, Y.; Lu, X.; Wu, Y.; Duan, J. Retinal oxygen saturation and vessel diameter in patients with chronic kidney disease. Acta Ophthalmol. 2021, 99, e352–e359. [Google Scholar] [CrossRef] [Scilit] [PubMed]
- Yeung, L.; Wu, I.W.; Sun, C.C.; Liu, C.F.; Chen, S.Y.; Tseng, C.H.; Lee, H.; Lee, C. Early retinal microvascular abnormalities in patients with chronic kidney disease. Microcirculation 2019, 26, e12555. [Google Scholar] [CrossRef] [Scilit] [PubMed]
- Orfanidou, M.; Ntenti, C.; Evripidou, K.; Mataftsi, A.; Goulas, A.; Polyzos, S.A. Retinal Vascular Lesions in Patients with Nonalcoholic Fatty Liver Disease: A Systematic Review and Meta-Analysis. J. Pers. Med. 2023, 13, 1148. [Google Scholar] [CrossRef] [Scilit] [PubMed]
- Zysset-Burri, D.C.; Morandi, S.; Herzog, E.L.; Berger, L.E.; Zinkernagel, M.S. The role of the gut microbiome in eye diseases. Prog. Retin. Eye Res. 2023, 92, 101117. [Google Scholar] [CrossRef] [Scilit] [PubMed]
- Joo, Y.S.; Rim, T.H.; Koh, H.B.; Yi, J.; Kim, H.; Lee, G.; Kim, Y.A.; Kang, S.-W.; Kim, S.S.; Park, J.T. Non-invasive chronic kidney disease risk stratification tool derived from retina-based deep learning and clinical factors. npj Digit. Med. 2023, 6, 114. [Google Scholar] [CrossRef] [Scilit] [PubMed]
- Sabanayagam, C.; Xu, D.; Ting, D.S.W.; Nusinovici, S.; Banu, R.; Hamzah, H.; Lim, C.; Tham, Y.-C.; Cheung, C.Y.; Tai, E.S.; et al. A deep learning algorithm to detect chronic kidney disease from retinal photographs in community-based populations. Lancet Digit. Health 2020, 2, e295–e302. [Google Scholar] [CrossRef] [Scilit] [PubMed]
- Zhang, K.; Liu, X.; Xu, J.; Yuan, J.; Cai, W.; Chen, T.; Wang, K.; Gao, Y.; Nie, S.; Xu, X.; et al. Deep-learning models for the detection and incidence prediction of chronic kidney disease and type 2 diabetes from retinal fundus images. Nat. Biomed. Eng. 2021, 5, 533–545. [Google Scholar] [CrossRef] [Scilit] [PubMed]
- Zhao, X.; Gu, X.; Meng, L.; Chen, Y.; Zhao, Q.; Cheng, S.; Zhang, W.; Cheng, T.; Wang, C.; Shi, Z.; et al. Screening chronic kidney disease through deep learning utilizing ultra-wide-field fundus images. npj Digit. Med. 2024, 7, 275. [Google Scholar] [CrossRef] [Scilit] [PubMed]
- Meng, Z.; Guan, Z.; Yu, S.; Wu, Y.; Zhao, Y.; Shen, J.; Lim, C.C.; Chen, T.; Yang, D.; Ran, A.R.; et al. Non-invasive biopsy diagnosis of diabetic kidney disease via deep learning applied to retinal images: A population-based study. Lancet Digit. Health 2025, 7, 100868. [Google Scholar] [CrossRef] [Scilit] [PubMed]
- An, S.; Teo, K.; McConnell, M.V.; Marshall, J.; Galloway, C.; Squirrell, D. AI explainability in oculomics: How it works, its role in establishing trust, and what still needs to be addressed. Prog. Retin. Eye Res. 2025, 106, 101352. [Google Scholar] [CrossRef] [Scilit] [PubMed]
- Chen, R.J.; Wang, J.J.; Williamson, D.F.K.; Chen, T.Y.; Lipkova, J.; Lu, M.Y.; Sahai, S.; Mahmood, F. Algorithmic fairness in artificial intelligence for medicine and healthcare. Nat. Biomed. Eng. 2023, 7, 719–742. [Google Scholar] [CrossRef] [Scilit] [PubMed]
- Collins, G.S.; Moons, K.G.M.; Dhiman, P.; Riley, R.D.; Beam, A.L.; Van Calster, B.; Ghassemi, M.; Liu, X.; Reitsma, J.B.; van Smeden, M.; et al. TRIPOD+AI statement: Updated guidance for reporting clinical prediction models that use regression or machine learning methods. BMJ 2024, 385, e078378, Correction in BMJ 2024, 385, q902. https://doi.org/10.1136/bmj-2023-078378. [Google Scholar] [CrossRef] [Scilit] [PubMed]
- Moons, K.G.M.; Damen, J.A.A.; Kaul, T.; Hooft, L.; Andaur Navarro, C.; Dhiman, P.; Beam, A.L.; Van Calster, B.; Celi, L.A.; Denaxas, S.; et al. PROBAST+AI: An updated quality, risk of bias, and applicability assessment tool for prediction models using regression or artificial intelligence methods. BMJ 2025, 388, e082505. [Google Scholar] [CrossRef] [Scilit] [PubMed]
- Van Calster, B.; McLernon, D.J.; van Smeden, M.; Wynants, L.; Steyerberg, E.W.; Topic Group ‘Evaluating diagnostic tests and prediction models’ of the STRATOS initiative. Calibration: The Achilles heel of predictive analytics. BMC Med. 2019, 17, 230. [Google Scholar] [CrossRef] [Scilit] [PubMed]
- Vasey, B.; Nagendran, M.; Campbell, B.; Clifton, D.A.; Collins, G.S.; Denaxas, S.; Denniston, A.K.; Faes, L.; Geerts, B.; Ibrahim, M.; et al. Reporting guideline for the early-stage clinical evaluation of decision support systems driven by artificial intelligence: DECIDE-AI. Nat. Med. 2022, 28, 924–933. [Google Scholar] [CrossRef] [PubMed]
- Vickers, A.J.; Elkin, E.B. Decision curve analysis: A novel method for evaluating prediction models. Med. Decis. Mak. 2006, 26, 565–574. [Google Scholar] [CrossRef] [Scilit] [PubMed]
- Weinreb, R.N.; Keane, P.A.; Cooley, A.; Chaglasian, M.; Lee, A.Y.; McConnell, M.V.; Leng, T.; Hashemi, Z.; Ferrara, D.; Rhew, D. A Framework for Healthcare from the Eye: Oculomics as a Powerful Window to Systemic Health. Ophthalmology 2026, 133, 733–741. [Google Scholar] [CrossRef] [Scilit] [PubMed]
- De Rosa, G.; De Rosa, F.P.; Ottonelli, G.; Romano, M.R. Choroidal and Retinal Permeability Changes in Chronic Kidney Disease—A Literature Review. J. Clin. Med. 2025, 14, 8767. [Google Scholar] [CrossRef] [Scilit] [PubMed]
- Abbas, K.; Lu, Y.; Bavishi, S.; Mishra, N.; TomThundyil, S.; Sawant, S.A.; Shahjouei, S.; Abedi, V.; Zand, R. A Simple Review of Small Vessel Disease Manifestation in the Brain, Retina, and Kidneys. J. Clin. Med. 2022, 11, 5546. [Google Scholar] [CrossRef] [Scilit] [PubMed]
- Wu, J.H.; Liu, T.Y.A. Application of Deep Learning to Retinal-Image-Based Oculomics for Evaluation of Systemic Health: A Review. J. Clin. Med. 2023, 12, 152. [Google Scholar] [CrossRef] [Scilit] [PubMed]
- Ran, A.R.; Zhu, Z.; Cheng, K.H.L.; Ng, C.F.; Choi, O.Y.M.; He, Q.; Zheng, C.; Hu, W.; Hu, X.; Chan, V.T.T.; et al. Artificial intelligence-based retinal imaging for brain health assessment: A scoping review. Lancet Digit. Health 2026, 8, 101020. [Google Scholar] [CrossRef] [Scilit] [PubMed]
- Baethge, C.; Goldbeck-Wood, S.; Mertens, S. SANRA-a scale for the quality assessment of narrative review articles. Res. Integr. Peer Rev. 2019, 4, 5. [Google Scholar] [CrossRef] [Scilit] [PubMed]
- Caturano, A.; Rocco, M.; Tagliaferri, G.; Piacevole, A.; Nilo, D.; Di Lorenzo, G.; Iadicicco, I.; Donnarumma, M.; Galiero, R.; Acierno, C.; et al. Oxidative Stress and Cardiovascular Complications in Type 2 Diabetes: From Pathophysiology to Lifestyle Modifications. Antioxidants 2025, 14, 72. [Google Scholar] [CrossRef] [Scilit] [PubMed]
- Krishnan, S.; Suarez-Martinez, A.D.; Bagher, P.; Gonzalez, A.; Liu, R.; Murfee, W.L.; Mohandas, R. Microvascular dysfunction and kidney disease: Challenges and opportunities. Microcirculation 2021, 28, e12661. [Google Scholar] [CrossRef] [Scilit] [PubMed]
- Yip, W.; Ong, P.G.; Teo, B.W.; Cheung, C.Y.-L.; Tai, E.S.; Cheng, C.-Y.; Lamoureux, E.; Wong, T.Y.; Sabanayagam, C. Retinal Vascular Imaging Markers and Incident Chronic Kidney Disease: A Prospective Cohort Study. Sci. Rep. 2017, 7, 9374. [Google Scholar] [CrossRef] [Scilit] [PubMed]
- Nian, S.; Lo, A.C.Y.; Mi, Y.; Ren, K.; Yang, D. Neurovascular unit in diabetic retinopathy: Pathophysiological roles and potential therapeutical targets. Eye Vis. 2021, 8, 15. [Google Scholar] [CrossRef] [Scilit] [PubMed]
- Zeng, X.; Hu, Y.; Chen, Y.; Lin, Z.; Liang, Y.; Liu, B.; Zhong, P.; Xiao, Y.; Li, C.; Wu, G.; et al. Retinal Neurovascular Impairment in Non-diabetic and Non-dialytic Chronic Kidney Disease Patients. Front. Neurosci. 2021, 15, 703898. [Google Scholar] [CrossRef] [Scilit] [PubMed]
- Paterson, E.N.; Ravindran, M.L.; Griffiths, K.; Le Velly, C.A.; Cardwell, C.C.; McCarter, R.V.; Nicol, P.; Chhablani, J.K.; Rasheed, M.A.; Vupparaboina, K.K.; et al. Association of reduced inner retinal thicknesses with chronic kidney disease. BMC Nephrol. 2020, 21, 37. [Google Scholar] [CrossRef] [Scilit] [PubMed]
- Cheung, C.Y.; Ikram, M.K.; Sabanayagam, C.; Wong, T.Y. Retinal microvasculature as a model to study the manifestations of hypertension. Hypertension 2012, 60, 1094–1103. [Google Scholar] [CrossRef] [Scilit] [PubMed]
- Nguyen, Y.; Manis, J.R.Z.; Ronczkowski, N.M.; Bui, T.; Oxenrider, A.; Jadeja, R.N.; Thounaojam, M.C. Unveiling the gut-eye axis: How microbial metabolites influence ocular health and disease. Front. Med. 2024, 11, 1377186. [Google Scholar] [CrossRef] [Scilit] [PubMed]
- Rinella, M.E.; Lazarus, J.V.; Ratziu, V.; Francque, S.M.; Sanyal, A.J.; Kanwal, F.; Romero, D.; Abdelmalek, M.F.; Anstee, Q.M.; Arab, J.P.; et al. A multisociety Delphi consensus statement on new fatty liver disease nomenclature. J. Hepatol. 2023, 79, 1542–1556. [Google Scholar] [CrossRef] [PubMed]
- Nusinovici, S.; Sabanayagam, C.; Lee, K.E.; Zhang, L.; Cheung, C.Y.; Tai, E.S.; Tan, G.S.W.; Cheng, C.Y.; Klein, B.E.K.; Wong, T.Y. Retinal microvascular signs and risk of diabetic kidney disease in asian and white populations. Sci. Rep. 2021, 11, 4898. [Google Scholar] [CrossRef] [Scilit] [PubMed]
- Liccardo, D.; Mosca, A.; Petroni, S.; Valente, P.; Giordano, U.; Mico’, A.G.A.; Pescosolido, S.; Buzzonetti, L.; Nobili, V. The association between retinal microvascular changes, metabolic risk factors, and liver histology in pediatric patients with non-alcoholic fatty liver disease (NAFLD). J. Gastroenterol. 2015, 50, 903–912. [Google Scholar] [CrossRef] [Scilit] [PubMed]
- Sturm, B.; Zang, A.-L.; Stingl, J.; Hasseli-Fräbel, R.; Fanouriakis, A.; Schwarting, A.; Geber, C.; Weinmann-Menke, J.; Alhaddad, M.; Triantafyllias, K. Ocular markers of microangiopathy and their possible association with cardiovascular risk in patients with systemic inflammatory rheumatic diseases: A systematic review. Front. Immunol. 2025, 16, 1543157. [Google Scholar] [CrossRef] [Scilit] [PubMed]
- Amir Hamzah, N.A.; Wan Zaki, W.M.D.; Wan Abdul Halim, W.H.; Mustafar, R.; Saad, A.H. Evaluating the potential of retinal photography in chronic kidney disease detection: A review. PeerJ 2024, 12, e17786. [Google Scholar] [CrossRef] [Scilit] [PubMed]
- Fogel-Levin, M.; Sadda, S.R.; Rosenfeld, P.J.; Waheed, N.; Querques, G.; Freund, B.K.; Sarraf, D. Advanced retinal imaging and applications for clinical practice: A consensus review. Surv. Ophthalmol. 2022, 67, 1373–1390. [Google Scholar] [CrossRef] [Scilit] [PubMed]
- Zhao, X.; Liu, Y.; Zhang, W.; Meng, L.; Lv, B.; Lv, C.; Xie, G.; Chen, Y. Relationships Between Retinal Vascular Characteristics and Renal Function in Patients with Type 2 Diabetes Mellitus. Transl. Vis. Sci. Technol. 2021, 10, 20. [Google Scholar] [CrossRef] [Scilit] [PubMed]
- Aksoy, M.; Asena, L.; Tekindal, M.A.; Ayvazoğlu Soy, E.H.; Yılmaz, G.; Haberal, M. Choroidal Vascularity Index and Choroidal Thickness Changes Following Renal Transplantation. Turk. J. Ophthalmol. 2023, 53, 97–104. [Google Scholar] [CrossRef] [Scilit] [PubMed]
- Ranchod, T.M. Systemic retinal biomarkers. Curr. Opin. Ophthalmol. 2021, 32, 439–444. [Google Scholar] [CrossRef] [Scilit] [PubMed]
- Guo, X.; Zhu, Z.; Bulloch, G.; Huang, W.; Wang, W. Impacts of Chronic Kidney Disease on Retinal Neurodegeneration: A Cross-Cohort Analysis. Am. J. Ophthalmol. 2024, 258, 173–182. [Google Scholar] [CrossRef] [Scilit] [PubMed]
- Liu, S.; Wang, W.; Tan, Y.; He, M.; Wang, L.; Li, Y.; Huang, W. Correlation between Renal Function and Peripapillary Choroidal Thickness in Treatment-Naive Diabetic Eyes Using Swept-Source Optical Coherence Tomography. Curr. Eye Res. 2020, 45, 1526–1534. [Google Scholar] [CrossRef] [Scilit] [PubMed]
- Yeung, L.; Wu, I.W.; Liu, C.F.; Lin, Y.T.; Lee, C.C.; Sun, C.C. Accelerated Peripapillary Retinal Nerve Fiber Layer Degeneration in Patients with Chronic Kidney Disease: A 2-Year Longitudinal Study. Transl. Vis. Sci. Technol. 2022, 11, 10. [Google Scholar] [CrossRef] [Scilit] [PubMed]
- Liu, K.; Zhu, Y.; Chen, S.; Ye, M.; Guo, X.; Qiu, Y.; Yang, H.; Huang, W. Renal function and its association with retinal microcirculation and choroidal thickness in type 2 diabetes: Insights from cystatin C and creatinine. Diabetes Res. Clin. Pract. 2025, 226, 112348. [Google Scholar] [CrossRef] [Scilit] [PubMed]
- Ran, A.; Cheung, C.Y. Deep Learning-Based Optical Coherence Tomography and Optical Coherence Tomography Angiography Image Analysis: An Updated Summary. Asia-Pac. J. Ophthalmol. 2021, 10, 253–260. [Google Scholar] [CrossRef] [Scilit] [PubMed]
- Xing, X.; Wei, J.; Shen, Y.; Ma, Y.; Gu, L.; Wang, Y.; Liu, K.; Su, L. Correlation between renal function and OCTA parameters of the retina and choroid in early-stage diabetic patients. J. Transl. Med. 2025, 23, 1368. [Google Scholar] [CrossRef] [Scilit] [PubMed]
- Yang, D.; Ran, A.R.; Nguyen, T.X.; Lin, T.P.H.; Chen, H.; Lai, T.Y.Y.; Tham, C.C.; Cheung, C.Y. Deep Learning in Optical Coherence Tomography Angiography: Current Progress, Challenges, and Future Directions. Diagnostics 2023, 13, 326. [Google Scholar] [CrossRef] [Scilit] [PubMed]
- Yong, M.H.; Ong, M.Y.; Tan, K.S.; Hussein, S.H.; Mohd Zain, A.M.; Mohd, R.; Mustafar, R.; Halim, W.H.W.A. Retinal Optical Coherence Tomography Angiography Parameters Between Patients with Different Causes of Chronic Kidney Disease. Front. Cell. Neurosci. 2022, 16, 766619. [Google Scholar] [CrossRef] [Scilit] [PubMed]
- Monferrer-Adsuara, C.; Remolí-Sargues, L.; Navarro-Palop, C.; Cervera-Taulet, E.; Montero-Hernández, J.; Medina-Bessó, P.; Castro-Navarro, V. Repeatability of swept-source optical coherence tomography angiography automated macular vessel density. Eur. J. Ophthalmol. 2024, 34, 1964–1974. [Google Scholar] [CrossRef] [Scilit] [PubMed]
- Tekin Altinbay, B.; Kurt, E.; Altinisik, M. Changes in optical coherence tomography angiography measures throughout the day: Diurnal variation or test-retest variability. Retina 2024, 44, 731–740. [Google Scholar] [CrossRef] [Scilit] [PubMed]
- Heitmar, R.; Varma, C.; De, P.; Lau, Y.C.; Blann, A.D. The relationship of systemic markers of renal function and vascular function with retinal blood vessel responses. Graefes Arch. Clin. Exp. Ophthalmol. 2016, 254, 2257–2265. [Google Scholar] [CrossRef] [Scilit] [PubMed]
- Iwase, T.; Ueno, Y.; Tomita, R.; Terasaki, H. Relationship Between Retinal Microcirculation and Renal Function in Patients with Diabetes and Chronic Kidney Disease by Laser Speckle Flowgraphy. Life 2023, 13, 424. [Google Scholar] [CrossRef] [Scilit] [PubMed]
- Günthner, R.; Lorenz, G.; Braunisch, M.C.; Angermann, S.; Matschkal, J.; Hausinger, R.; Kuchler, T.; Glaser, P.; Schicktanz, F.; Haller, B.; et al. Endothelial dysfunction in retinal vessels of hemodialysis patients compared to healthy controls. Sci. Rep. 2024, 14, 13948. [Google Scholar] [CrossRef] [Scilit] [PubMed]
- Günthner, R.; Hanssen, H.; Hauser, C.; Angermann, S.; Lorenz, G.; Kemmner, S.; Matschkal, J.; Braunisch, M.C.; Kuechle, C.; Renders, L.; et al. Impaired Retinal Vessel Dilation Predicts Mortality in End-Stage Renal Disease. Circ. Res. 2019, 124, 1796–1807. [Google Scholar] [CrossRef] [Scilit] [PubMed]
- Du, X.; Park, J.; Zhao, R.; Smith, R.T.; Koronyo, Y.; Koronyo-Hamaoui, M.; Gao, L. Hyperspectral retinal imaging in Alzheimer’s disease and age-related macular degeneration: A review. Acta Neuropathol. Commun. 2024, 12, 157. [Google Scholar] [CrossRef] [Scilit] [PubMed]
- Markowitz, D.M.; Affel, E.; Hajnóczky, G.; Sergott, R.C. Future applications of fluorescence lifetime imaging ophthalmoscopy in neuro-ophthalmology, neurology, and neurodegenerative conditions. Front. Neurol. 2025, 16, 1493876. [Google Scholar] [CrossRef] [Scilit] [PubMed]
- Mirescu, A.-E.; Deleanu, D.G.; Baltă, G.; Tofolean, I.T.; Baltă, F.; Cristescu, I.-E.; Jurja, S. Adaptive Optics Imaging in Diabetic Retinopathy: A Comprehensive Review. Rom. J. Ophthalmol. 2025, 69, 299–309. [Google Scholar] [CrossRef] [Scilit] [PubMed]
- O’Neill, R.A.; Maxwell, A.P.; Kee, F.; Young, I.; McGuinness, B.; Hogg, R.E.; McKay, G.J. Association of retinal venular tortuosity with impaired renal function in the Northern Ireland Cohort for the Longitudinal Study of Ageing. BMC Nephrol. 2020, 21, 382. [Google Scholar] [CrossRef] [Scilit] [PubMed]
- Paterson, E.N.; Cardwell, C.; MacGillivray, T.J.; Trucco, E.; Doney, A.S.; Foster, P.; Maxwell, A.P.; McKay, G.J. Investigation of associations between retinal microvascular parameters and albuminuria in UK Biobank: A cross-sectional case-control study. BMC Nephrol. 2021, 22, 72. [Google Scholar] [CrossRef] [Scilit] [PubMed]
- Lim, L.S.; Cheung, C.Y.-L.; Sabanayagam, C.; Lim, S.C.; Tai, E.S.; Huang, L.; Wong, T.Y. Structural Changes in the Retinal Microvasculature and Renal Function. Investig. Ophthalmol. Vis. Sci. 2013, 54, 2970–2976. [Google Scholar] [CrossRef] [Scilit] [PubMed]
- Bosch, A.; Scheppach, J.B.; Harazny, J.M.; Raff, U.; Eckardt, K.-U.; Schmieder, R.E.; Schneider, M.P. Retinal capillary and arteriolar changes in patients with chronic kidney disease. Microvasc. Res. 2018, 118, 121–127. [Google Scholar] [CrossRef] [Scilit] [PubMed]
- Sabanayagam, C.; Foo, V.H.X.; Ikram, M.K.; Huang, H.; Lim, S.C.; Lamoureux, E.L.; Tai, E.S.; Wong, T.Y. Is chronic kidney disease associated with diabetic retinopathy in Asian adults? J. Diabetes 2014, 6, 556–563. [Google Scholar] [CrossRef] [Scilit] [PubMed]
- Carollo, C.; Vadalà, M.; Sorce, A.; Cirafici, E.; Bennici, M.; Castellucci, M.; Bonfiglio, V.M.E.; Mulè, G.; Geraci, G. Early Renal Dysfunction and Reduced Retinal Vascular Density Assessed by Angio-OCT in Hypertensive Patients. Biomedicines 2025, 13, 1176. [Google Scholar] [CrossRef] [Scilit] [PubMed]
- Peng, S.-Y.; Lee, Y.-C.; Wu, I.-W.N.; Lee, C.-C.; Sun, C.-C.; Ding, J.-J.; Liu, C.-F.; Yeung, L. Impact of blood pressure control on retinal microvasculature in patients with chronic kidney disease. Sci. Rep. 2020, 10, 14275. [Google Scholar] [CrossRef] [Scilit] [PubMed]
- Vadalà, M.; Castellucci, M.; Guarrasi, G.; Terrasi, M.; La Blasca, T.; Mulè, G. Retinal and choroidal vasculature changes associated with chronic kidney disease. Graefes Arch. Clin. Exp. Ophthalmol. 2019, 257, 1687–1698. [Google Scholar] [CrossRef] [Scilit] [PubMed]
- McKay, G.J.; Paterson, E.N.; Maxwell, A.P.; Cardwell, C.C.; Wang, R.; Hogg, S.; MacGillivray, T.J.; Trucco, E.; Doney, A.S. Retinal microvascular parameters are not associated with reduced renal function in a study of individuals with type 2 diabetes. Sci. Rep. 2018, 8, 3931. [Google Scholar] [CrossRef] [Scilit] [PubMed]
- Yip, W.; Sabanayagam, C.; Teo, B.W.; Tay, W.T.; Ikram, M.K.; Tai, E.S.; Chow, K.Y.; Wong, T.Y.; Cheung, C.Y. Retinal Microvascular Abnormalities and Risk of Renal Failure in Asian Populations. PLoS ONE 2015, 10, e0118076. [Google Scholar] [CrossRef] [Scilit] [PubMed]
- Yau, J.W.Y.; Xie, J.; Kawasaki, R.; Kramer, H.; Shlipak, M.; Klein, R.; Klein, B.; Cotch, M.F.; Wong, T.Y. Retinal Arteriolar Narrowing and Subsequent Development of CKD Stage 3: The Multi-Ethnic Study of Atherosclerosis (MESA). Am. J. Kidney Dis. 2011, 58, 39–46. [Google Scholar] [CrossRef] [Scilit] [PubMed]
- Sabanayagam, C.; Shankar, A.; Klein, B.E.; Lee, K.E.; Muntner, P.; Nieto, F.J.; Tsai, M.Y.; Cruickshanks, K.J.; Schubert, C.R.; Brazy, P.C.; et al. Bidirectional Association of Retinal Vessel Diameters and Estimated Glomerular Filtration Rate Decline: The Beaver Dam CKD Study. Am. J. Kidney Dis. 2011, 57, 682–691, Erratum in Am. J. Kidney Dis. 2018, 72, 157. https://doi.org/10.1053/j.ajkd.2010.11.025. [Google Scholar] [CrossRef] [Scilit] [PubMed]
- Edwards, M.S.; Wilson, D.B.; Craven, T.E.; Stafford, J.; Fried, L.F.; Wong, T.Y.; Klein, R.; Burke, G.L.; Hansen, K.J. Associations between retinal microvascular abnormalities and declining renal function in the elderly population: The Cardiovascular Health Study. Am. J. Kidney Dis. 2005, 46, 214–224. [Google Scholar] [CrossRef] [Scilit] [PubMed]
- Huang, Y.; Yuan, Y.; Seth, I.; Bulloch, G.; Cheng, W.; Chen, Y.; Shang, X.; Kiburg, K.; Zhu, Z.; Wang, W. Optic Nerve Head Capillary Network Quantified by Optical Coherence Tomography Angiography and Decline of Renal Function in Type 2 Diabetes: A Three-Year Prospective Study. Am. J. Ophthalmol. 2023, 253, 96–105. [Google Scholar] [CrossRef] [Scilit] [PubMed]
- Theuerle, J.D.; Al-Fiadh, A.H.; Wong, E.; Patel, S.K.; Ashraf, G.; Nguyen, T.; Wong, T.Y.; Ierino, F.L.; Burrell, L.M.; Farouque, O. Retinal microvascular function predicts chronic kidney disease in patients with cardiovascular risk factors. Atherosclerosis 2022, 341, 63–70. [Google Scholar] [CrossRef] [Scilit] [PubMed]
- Småbrekke, S.; Brobakk, K.M.; Rinde, N.B.; Von Hanno, T.; Bertelsen, G.; Eriksen, B.O.; Melsom, T. The Retinal Vasculature and Risk of Age-Related GFR Decline—The Renal Iohexol Clearance Survey. Kidney Int. Rep. 2025, 10, 1384–1392. [Google Scholar] [CrossRef] [Scilit] [PubMed]
- Betzler, B.K.; Sabanayagam, C.; Tham, Y.-C.; Cheung, C.Y.; Cheng, C.-Y.; Wong, T.; Nusinovici, S. Retinal vascular profile in predicting incident cardiometabolic diseases among individuals with diabetes. Microcirculation 2022, 29, e12772. [Google Scholar] [CrossRef] [Scilit] [PubMed]
- Kannenkeril, D.; Frost, S.; Nolde, J.M.; Kiuchi, M.G.; Carnagarin, R.; Lugo-Gavidia, L.M.; Chan, J.; Joyson, A.; Matthews, V.B.; Herat, L.Y.; et al. Microvascular changes at different stages of chronic kidney disease. J. Clin. Hypertens. 2021, 23, 309–316. [Google Scholar] [CrossRef] [Scilit] [PubMed]
- Wang, Q.; Liu, L.; Jonas, J.B.; Gao, B.; Wu, S.L.; Chen, S.H.; Ni Yan, Y.; Yang, J.Y.; Zhou, W.J.; Yang, M.C.; et al. Albuminuria and retinal vessel density in diabetes without diabetic retinopathy: The Kailuan Eye Study. Acta Ophthalmol. 2021, 99, e669–e678. [Google Scholar] [CrossRef] [Scilit] [PubMed]
- Baumann, M.; Schwarz, S.; Kotliar, K.; von Eynatten, M.; Schmidt-Trucksaess, A.S.; Burkhardt, K.; Lutz, J.; Heemann, U.; Lanzl, I. Non-Diabetic Chronic Kidney Disease Influences Retinal Microvasculature. Kidney Blood Press. Res. 2009, 32, 428–433. [Google Scholar] [CrossRef] [Scilit] [PubMed]
- Ma, R.; Zheng, C.; Niu, Y.; Cao, D.; Hu, Y.; Jin, L. Changes of retinal microvascular parameters in patients with type 2 diabetes mellitus with or without diabetic kidney disease. Front. Endocrinol. 2026, 17, 1727260. [Google Scholar] [CrossRef] [Scilit] [PubMed]
- Xu, X.; Gao, B.; Ding, W.; Wang, Q.; Zhang, M.; Tan, T.; Sun, F.; Lei, J.; Ji, Q.; Xu, F. Retinal image measurements and their association with chronic kidney disease in Chinese patients with type 2 diabetes: The NCD study. Acta Diabetol. 2021, 58, 363–370. [Google Scholar] [CrossRef] [Scilit] [PubMed]
- Yiu, G.; Manjunath, V.; Chiu, S.J.; Farsiu, S.; Mahmoud, T.H. Effect of anti-vascular endothelial growth factor therapy on choroidal thickness in diabetic macular edema. Am. J. Ophthalmol. 2014, 158, 745–751.e2. [Google Scholar] [CrossRef] [Scilit] [PubMed]
- Okamoto, M.; Matsuura, T.; Ogata, N. Effects of panretinal photocoagulation on choroidal thickness and choroidal blood flow in patients with severe nonproliferative diabetic retinopathy. Retina 2016, 36, 805–811. [Google Scholar] [CrossRef] [Scilit] [PubMed]
- Chen, Y.; Liu, Y.; Cong, L.; Liu, A.; Song, X.; Liu, W.; Hua, R.; Shen, Q.; Shao, Y.; Xue, Y.; et al. Sleeve gastrectomy improved microvascular phenotypes from obesity cohort, detected with optical coherence tomography angiography. J. Diabetes 2023, 15, 313–324. [Google Scholar] [CrossRef] [Scilit] [PubMed]
- Saito, K.; Kawasaki, Y.; Nagao, Y.; Kawasaki, R. Retinal arteriolar narrowing is associated with a 4-year risk of incident metabolic syndrome. Nutr. Diabetes 2015, 5, e165. [Google Scholar] [CrossRef] [Scilit] [PubMed]
- Wang, S.B.; Mitchell, P.; Plant, A.J.H.; Phan, K.; Liew, G.; Thiagalingam, A.; Burlutsky, G.; Gopinath, B. Metabolic syndrome and retinal microvascular calibre in a high cardiovascular disease risk cohort. Br. J. Ophthalmol. 2016, 100, 1041–1046. [Google Scholar] [CrossRef] [Scilit] [PubMed]
- Wang, J.; Wang, Y.X.; Zeng, D.; Zhu, Z.; Li, D.; Liu, Y.; Sheng, B.; Grzybowski, A.; Wong, T.Y. Artificial intelligence-enhanced retinal imaging as a biomarker for systemic diseases. Theranostics 2025, 15, 3223–3233. [Google Scholar] [CrossRef] [Scilit] [PubMed]
- Zekavat, S.M.; Raghu, V.K.; Trinder, M.; Ye, Y.; Koyama, S.; Honigberg, M.C.; Yu, Z.; Pampana, A.; Urbut, S.; Haidermota, S.; et al. Deep Learning of the Retina Enables Phenome- and Genome-Wide Analyses of the Microvasculature. Circulation 2022, 145, 134–150. [Google Scholar] [CrossRef] [Scilit] [PubMed]
- Shi, D.; Lin, Z.; Wang, W.; Tan, Z.; Shang, X.; Zhang, X.; Meng, W.; Ge, Z.; He, M. A Deep Learning System for Fully Automated Retinal Vessel Measurement in High Throughput Image Analysis. Front. Cardiovasc. Med. 2022, 9, 823436. [Google Scholar] [CrossRef] [Scilit] [PubMed]
- Bhak, Y.; Lee, Y.H.; Kim, J.; Lee, K.; Lee, D.; Jang, E.C.; Jang, E.; Lee, C.S.; Kang, E.S.; Park, S.; et al. Diagnosis of Chronic Kidney Disease Using Retinal Imaging and Urine Dipstick Data: Multimodal Deep Learning Approach. JMIR Med. Inform. 2025, 13, e55825. [Google Scholar] [CrossRef] [Scilit] [PubMed]
- Hsu, C.F.; Yu, T.M.; Wu, Y.L.; Wang, W.C.; Wang, J.S.; Chang, S.S. Prediction of advanced chronic kidney disease through retinal fundus images by deep learning. Sci. Rep. 2025, 15, 37318. [Google Scholar] [CrossRef] [Scilit] [PubMed]
- Tan, Y.; Ma, Y.; Rao, S.; Sun, X. Performance of deep learning for detection of chronic kidney disease from retinal fundus photographs: A systematic review and meta-analysis. Eur. J. Ophthalmol. 2024, 34, 502–509. [Google Scholar] [CrossRef] [Scilit] [PubMed]
- Betzler, B.K.; Chee, E.Y.L.; He, F.; Lim, C.C.; Ho, J.; Hamzah, H.; Tan, N.C.; Liew, G.; McKay, G.J.; Hogg, R.E.; et al. Deep Learning Algorithms to Detect Diabetic Kidney Disease from Retinal Photographs in Multiethnic Populations with Diabetes. J. Am. Med. Inform. Assoc. 2023, 30, 1904–1914, Correction in J. Am. Med. Inform. Assoc. 2024, 31, 1047. https://doi.org/10.1093/jamia/ocad179. [Google Scholar] [CrossRef] [Scilit] [PubMed]
- Tshedron, L.; Li, Z. Diabetic nephropathy nomogram construction based on optical coherence tomography angiography variables. Photodiagn. Photodyn. Ther. 2025, 54, 104718. [Google Scholar] [CrossRef] [Scilit] [PubMed]
- Dong, Z.; Wang, X.; Pan, S.; Weng, T.; Chen, X.; Jiang, S.; Li, Y.; Wang, Z.; Cao, X.; Wang, Q.; et al. A multimodal transformer system for noninvasive diabetic nephropathy diagnosis via retinal imaging. npj Digit. Med. 2025, 8, 50. [Google Scholar] [CrossRef] [Scilit] [PubMed]
- Wu, Q.; Li, J.; Zhao, L.; Liu, D.; Wen, J.; Wang, Y.; Wang, Y.; Huang, N.; Jiang, L.; Liu, Q.; et al. A noninvasive model for chronic kidney disease screening and common pathological type identification from retinal images. Nat. Commun. 2025, 16, 6962, Correction in Nat. Commun. 2025, 16, 8333. https://doi.org/10.1038/s41467-025-62273-0. [Google Scholar] [CrossRef] [Scilit] [PubMed]
- Tangri, N.; Grams, M.E.; Levey, A.S.; Coresh, J.; Appel, L.J.; Astor, B.C.; Chodick, G.; Collins, A.J.; Djurdjev, O.; Elley, C.R.; et al. Multinational assessment of accuracy of equations for predicting risk of kidney failure: A meta-analysis. JAMA 2016, 315, 164–174, Correction in JAMA 2016, 315, 822. https://doi.org/10.1001/jama.2015.18202. [Google Scholar] [CrossRef] [Scilit] [PubMed]
- Vickers, A.J.; van Calster, B.; Steyerberg, E.W. A simple, step-by-step guide to interpreting decision curve analysis. Diagn. Progn. Res. 2019, 3, 18. [Google Scholar] [CrossRef] [Scilit] [PubMed]
- Arun, N.; Gaw, N.; Singh, P.; Chang, K.; Aggarwal, M.; Chen, B.; Hoebel, K.; Gupta, S.; Patel, J.; Gidwani, M.; et al. Assessing the Trustworthiness of Saliency Maps for Localizing Abnormalities in Medical Imaging. Radiol. Artif. Intell. 2021, 3, e200267. [Google Scholar] [CrossRef] [Scilit] [PubMed]
- Scheetz, J.; Koca, D.; McGuinness, M.; Holloway, E.; Tan, Z.; Zhu, Z.; O’dAy, R.; Sandhu, S.; MacIsaac, R.J.; Gilfillan, C.; et al. Real-world artificial intelligence-based opportunistic screening for diabetic retinopathy in endocrinology and indigenous healthcare settings in Australia. Sci. Rep. 2021, 11, 15808. [Google Scholar] [CrossRef] [Scilit] [PubMed]
- Zikhali, T.; Kalinda, C.; Xulu-Kasaba, Z.N. Screening of Diabetic Retinopathy Using Teleophthalmology to Complement Human Resources for Eye Health: A Systematic Review and Meta-Analysis. Clin. Pract. 2022, 12, 457–467. [Google Scholar] [CrossRef] [Scilit] [PubMed]
- Wynants, L.; van Smeden, M.; McLernon, D.J.; Timmerman, D.; Steyerberg, E.W.; Van Calster, B. Three myths about risk thresholds for prediction models. BMC Med. 2019, 17, 192. [Google Scholar] [CrossRef] [Scilit] [PubMed]
- Olakotan, O.O.; Yusof, M.M. The appropriateness of clinical decision support systems alerts in supporting clinical workflows: A systematic review. Health Inform. J. 2021, 27, 14604582211007536. [Google Scholar] [CrossRef] [Scilit] [PubMed]
- Corvi, F.; Pellegrini, M.; Erba, S.; Cozzi, M.; Staurenghi, G.; Giani, A. Reproducibility of Vessel Density, Fractal Dimension, and Foveal Avascular Zone Using 7 Different Optical Coherence Tomography Angiography Devices. Am. J. Ophthalmol. 2018, 186, 25–31. [Google Scholar] [CrossRef] [Scilit] [PubMed]
- Man, S.; Mou, K.; Zhang, Y.; Gao, Y.; Wu, X.; Xu, H.; Zhang, M. Retinal structural and vascular alterations in diabetic kidney disease: A bidirectional Mendelian randomization study. Microvasc. Res. 2026, 166, 104928. [Google Scholar] [CrossRef] [Scilit] [PubMed]
- Rahmanipour, E.; Afazel, S.; Ashrafi, S.; Sadeghi, E.; Ghorbani, M.; Zarranz-Ventura, J.; Chhablani, J. Artificial intelligence in ophthalmology clinical trials: A narrative review. Graefes Arch. Clin. Exp. Ophthalmol. 2026, 264, 1–17. [Google Scholar] [CrossRef] [Scilit] [PubMed]
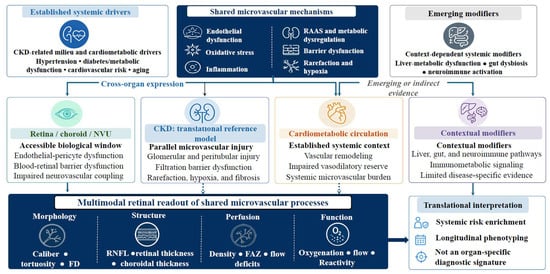
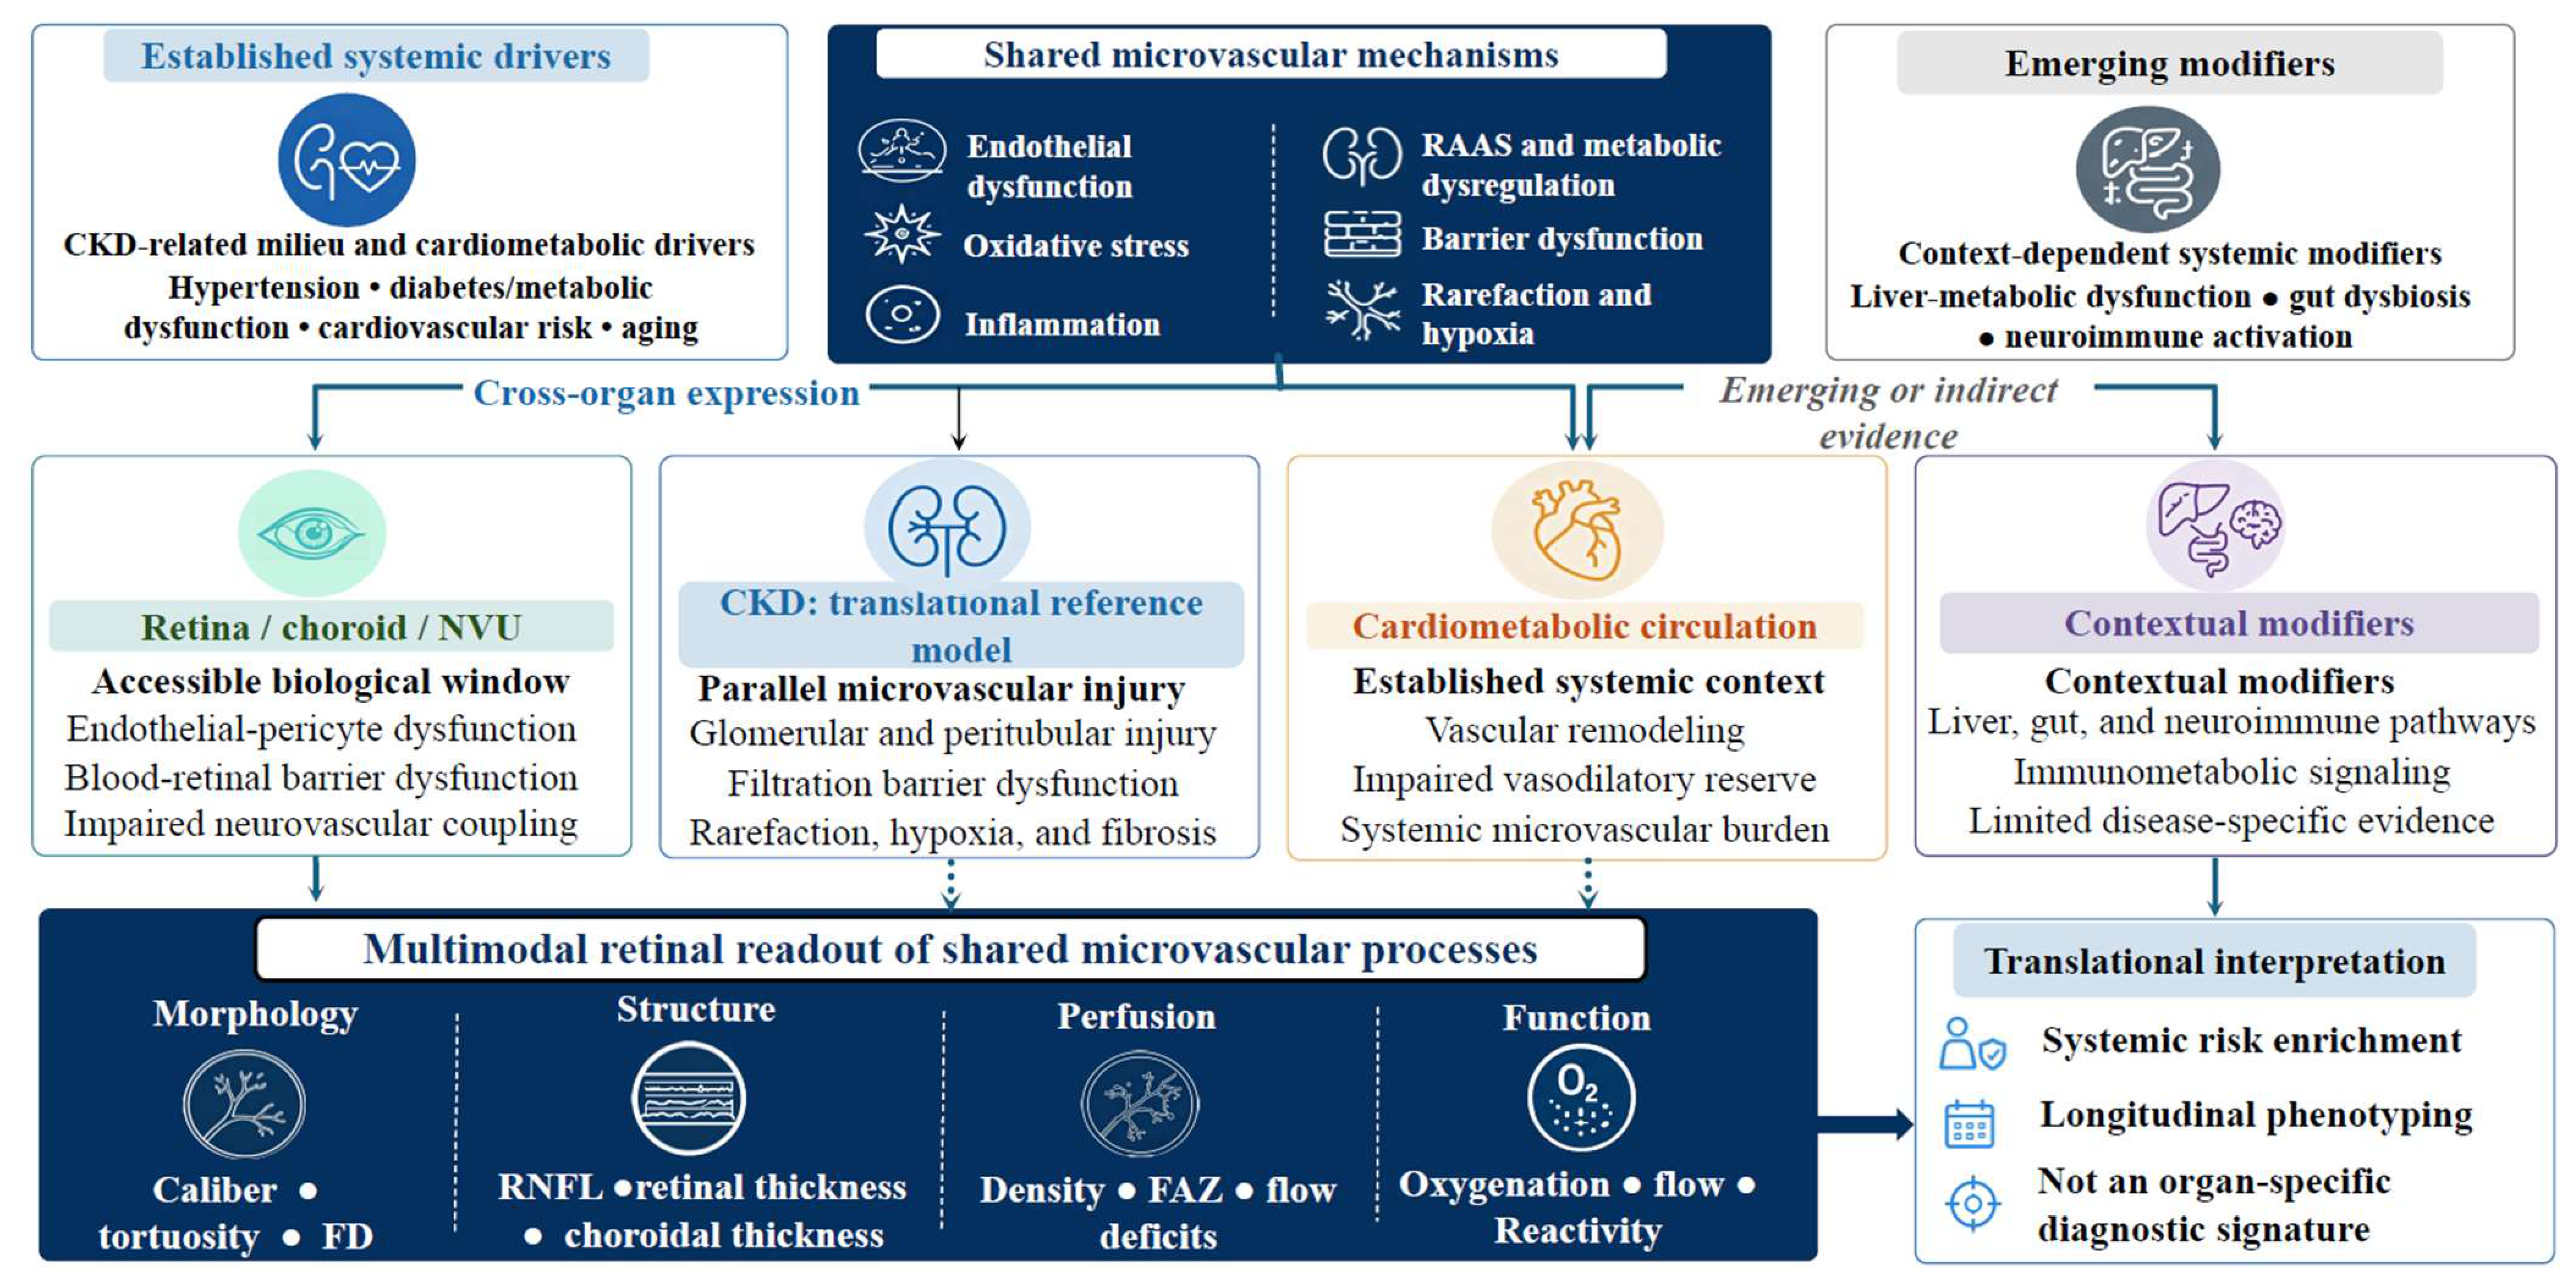
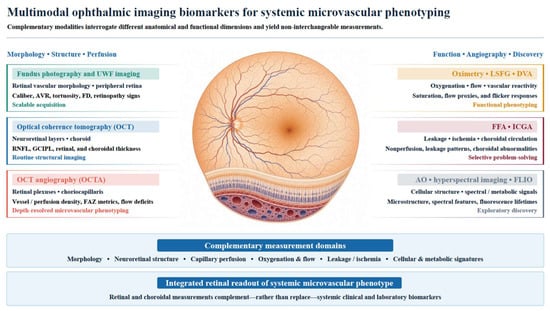
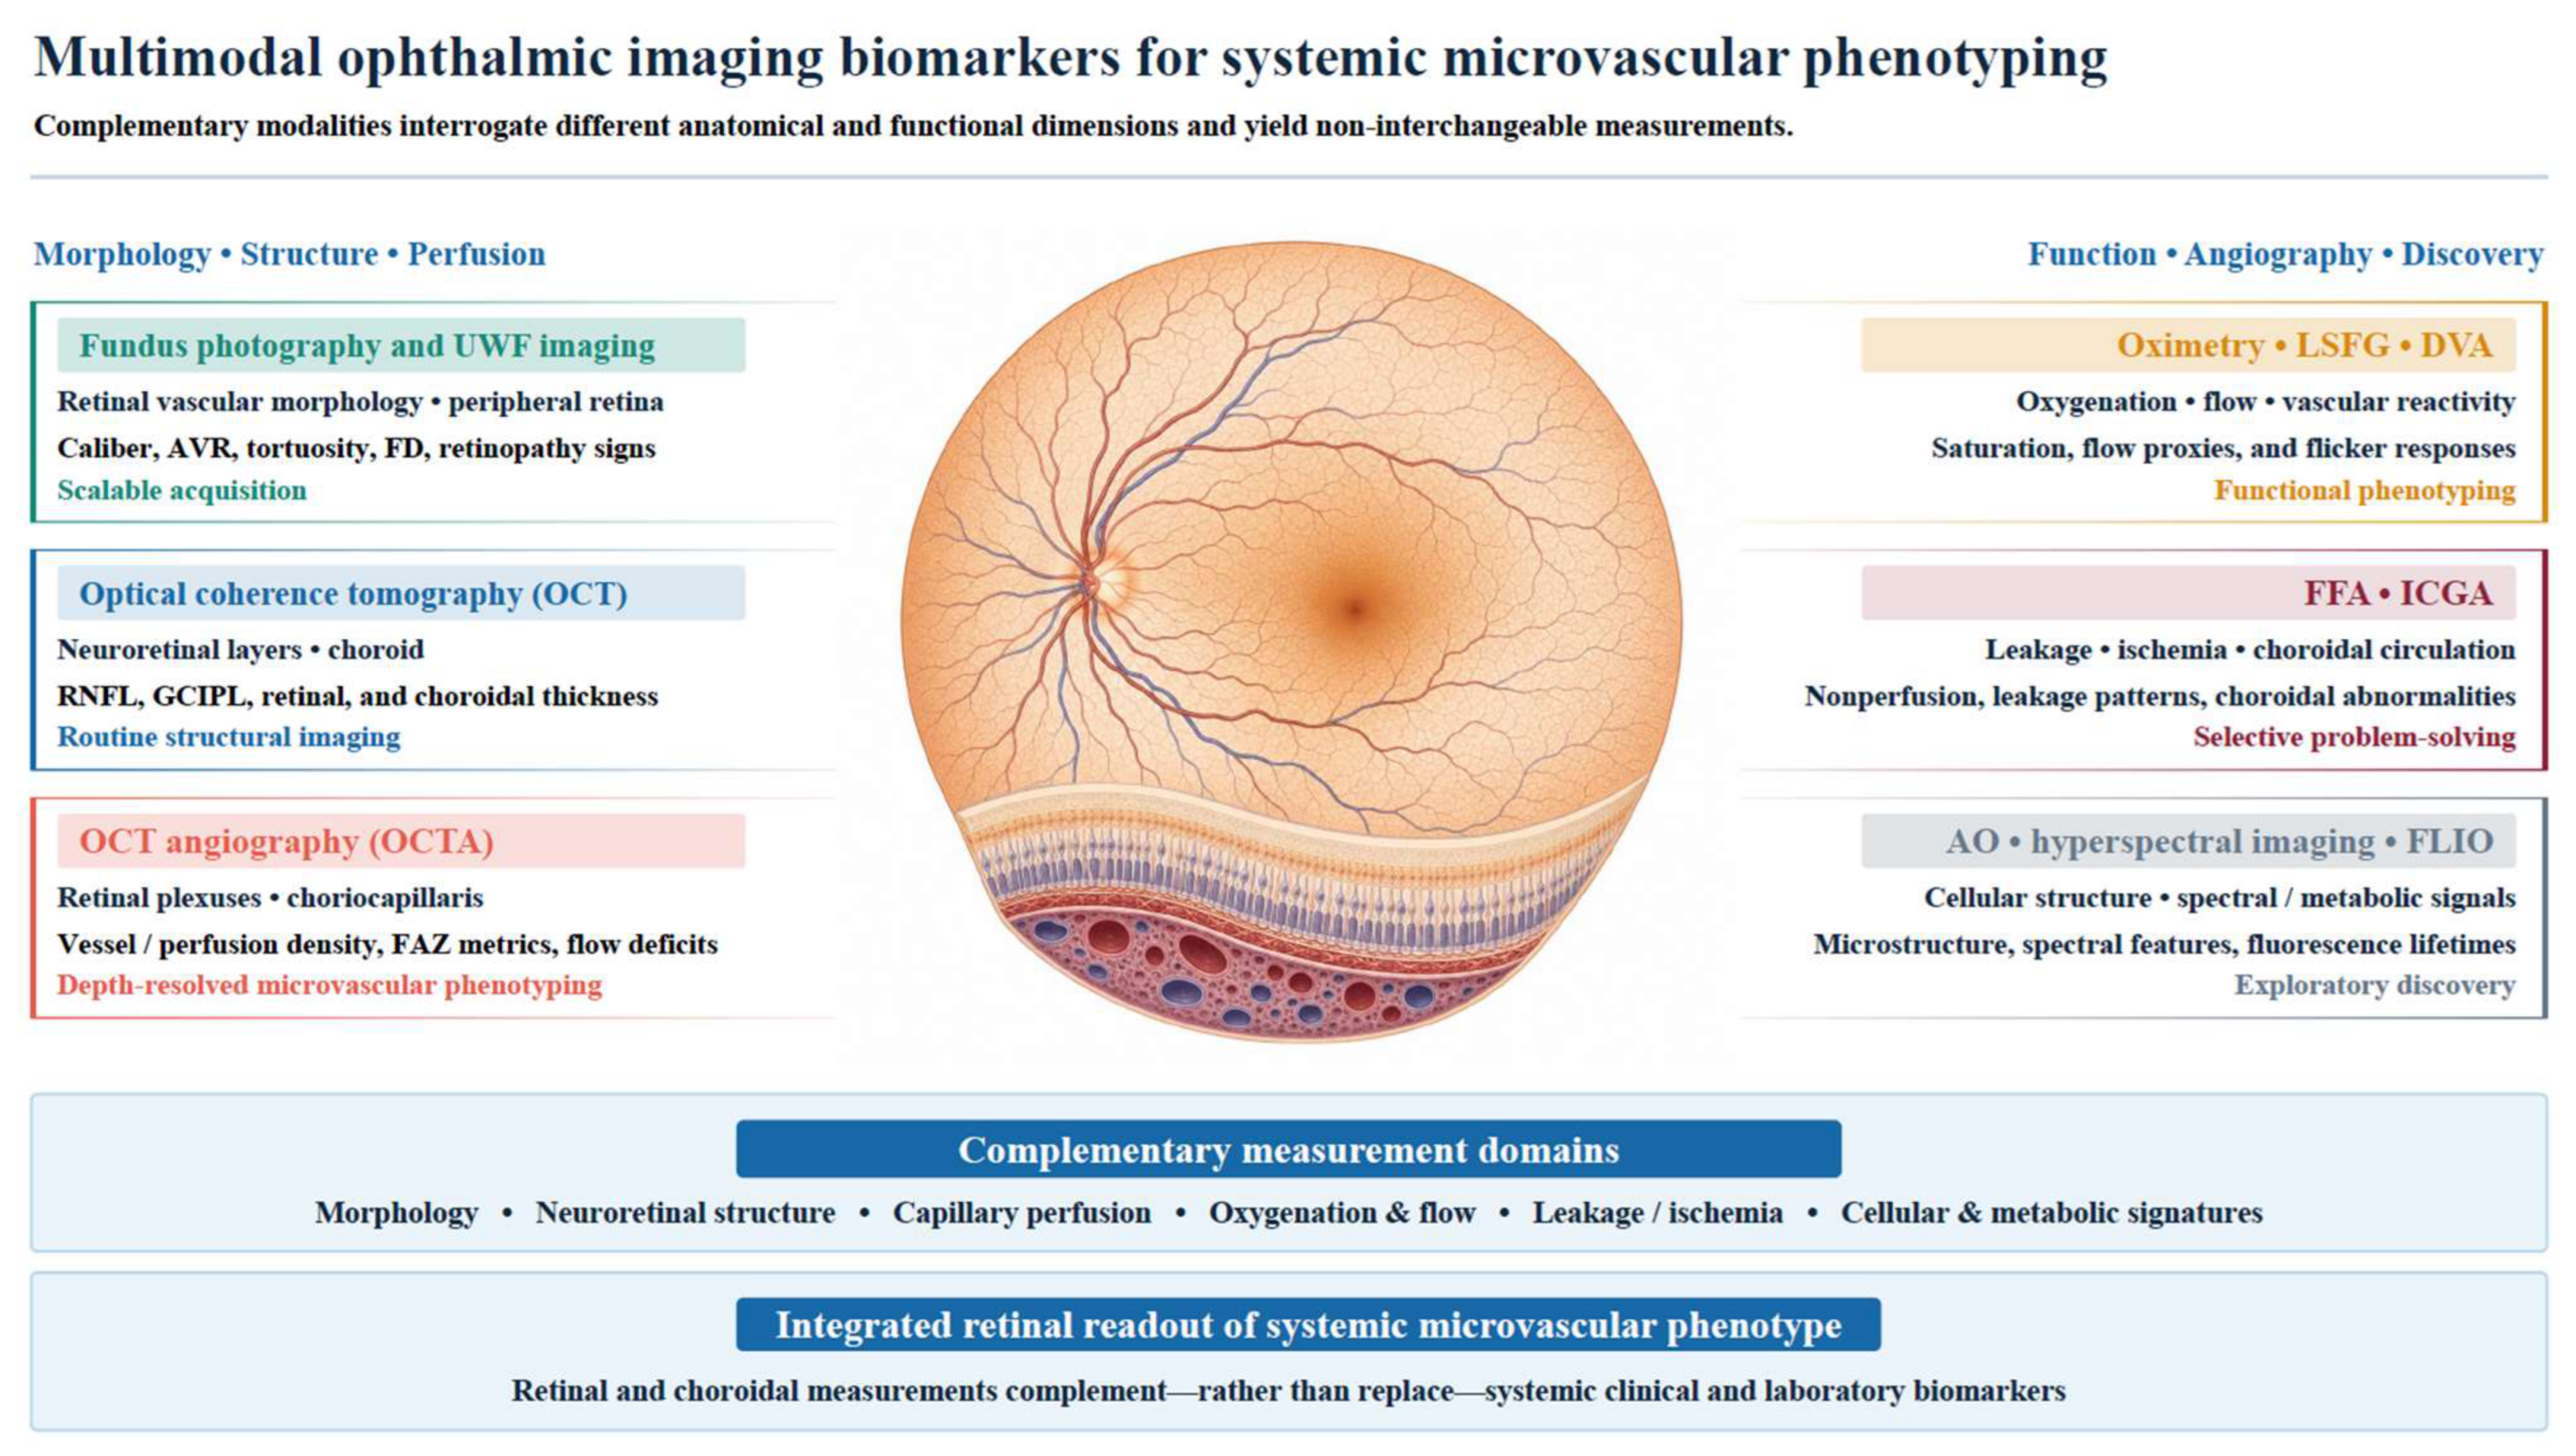
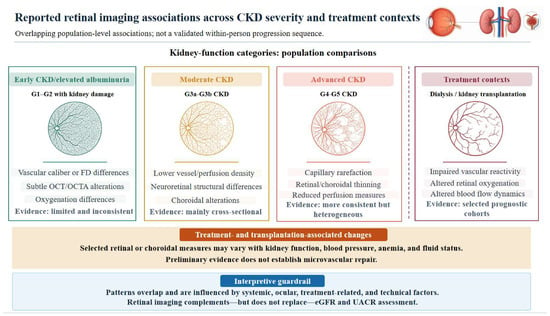
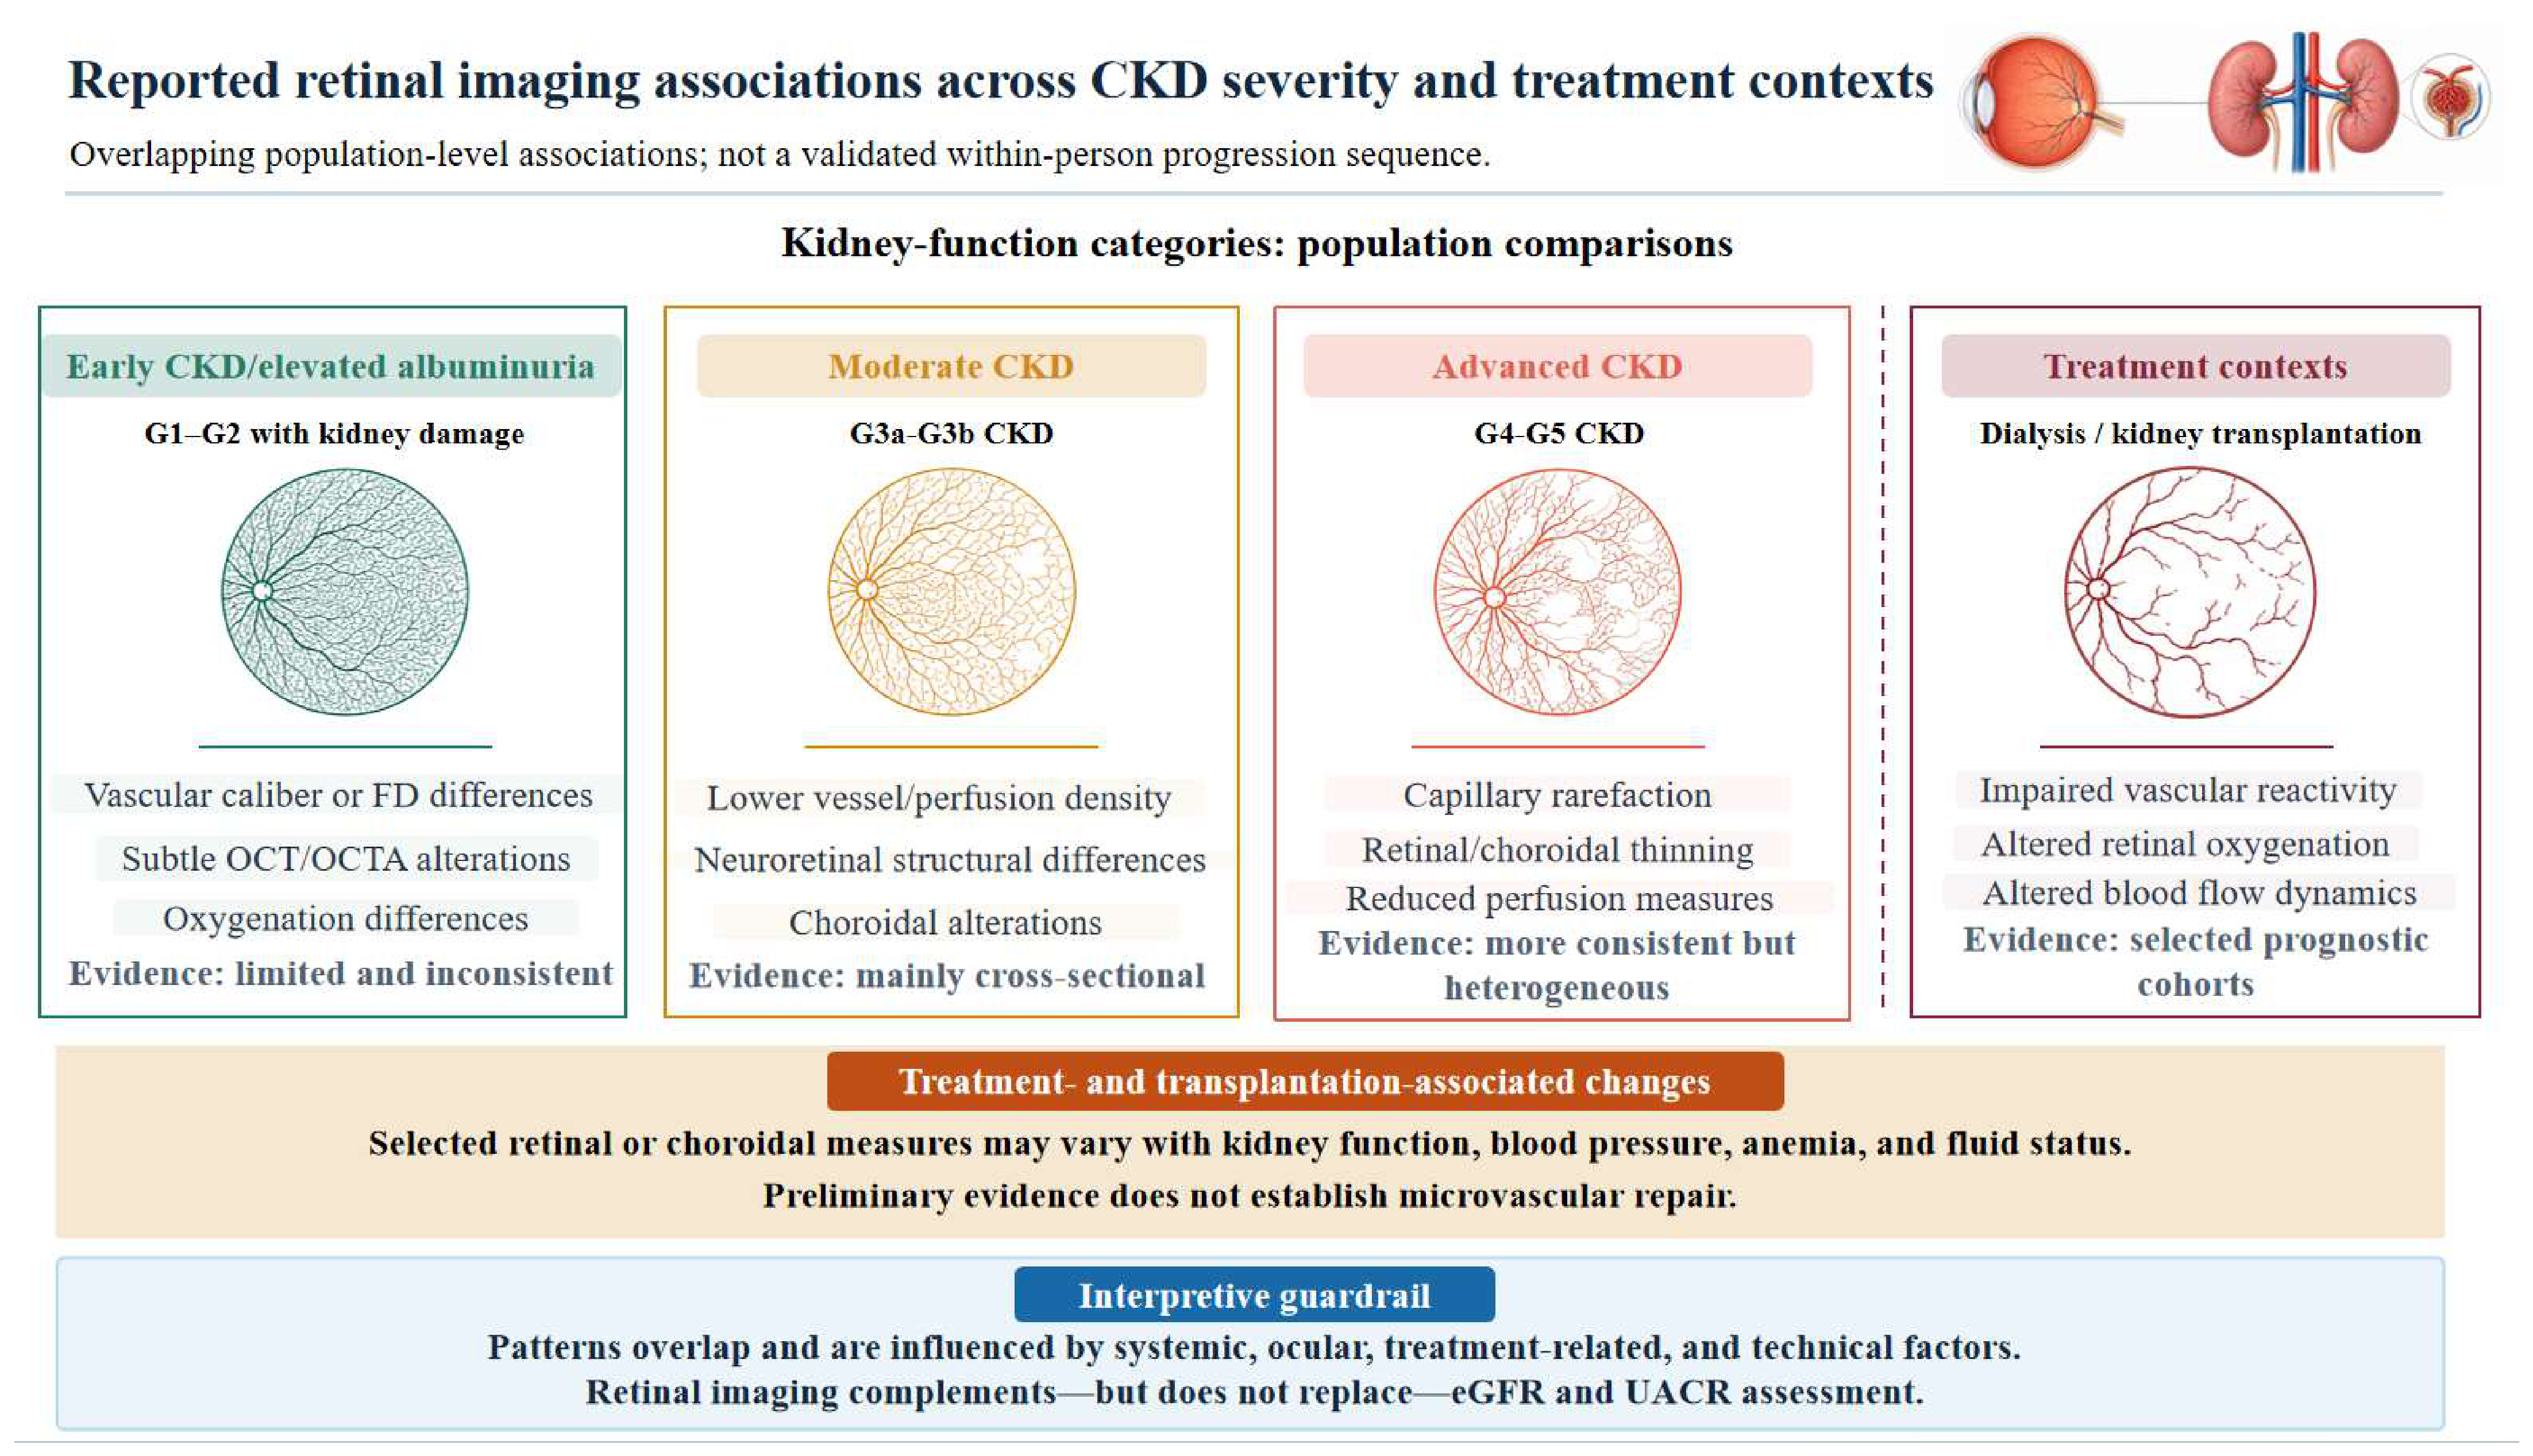
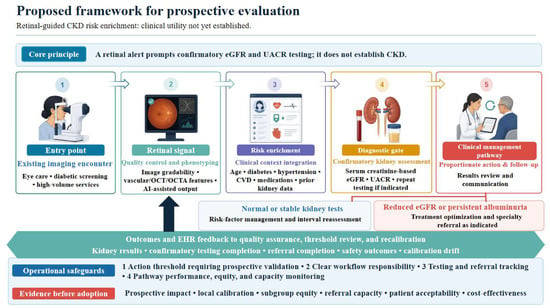
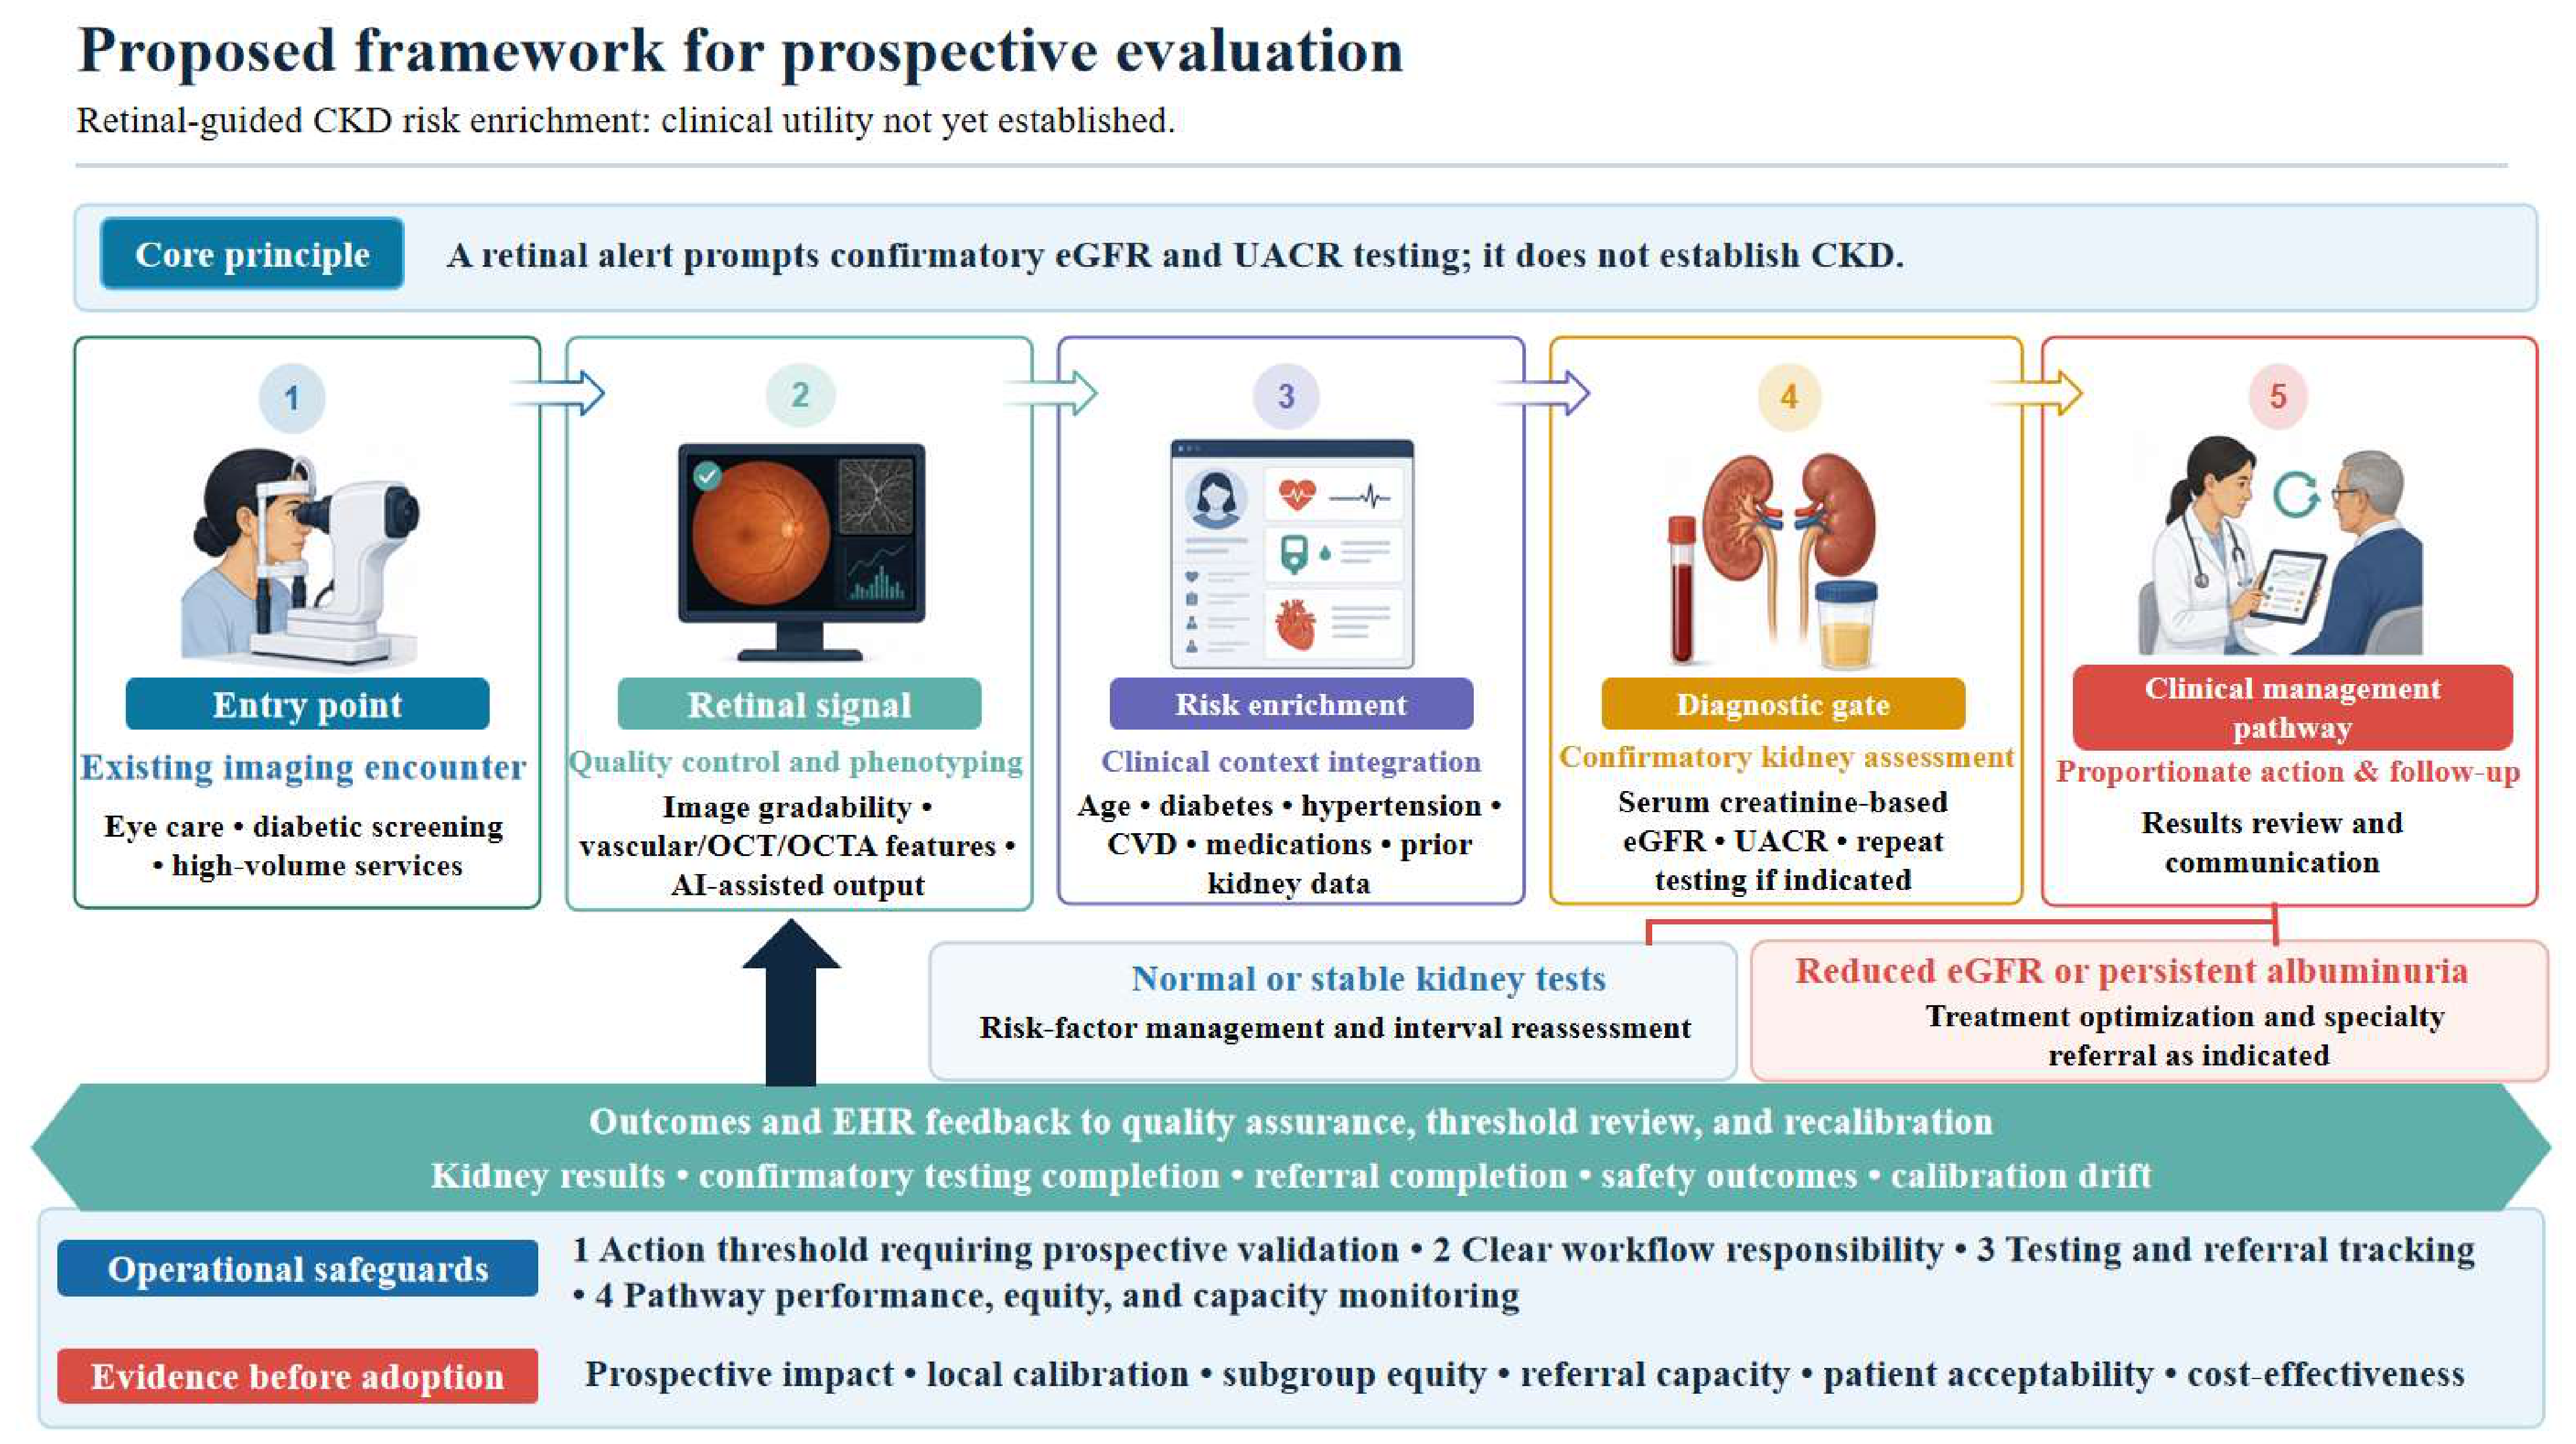
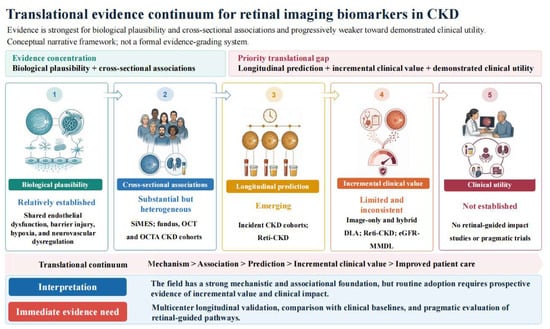
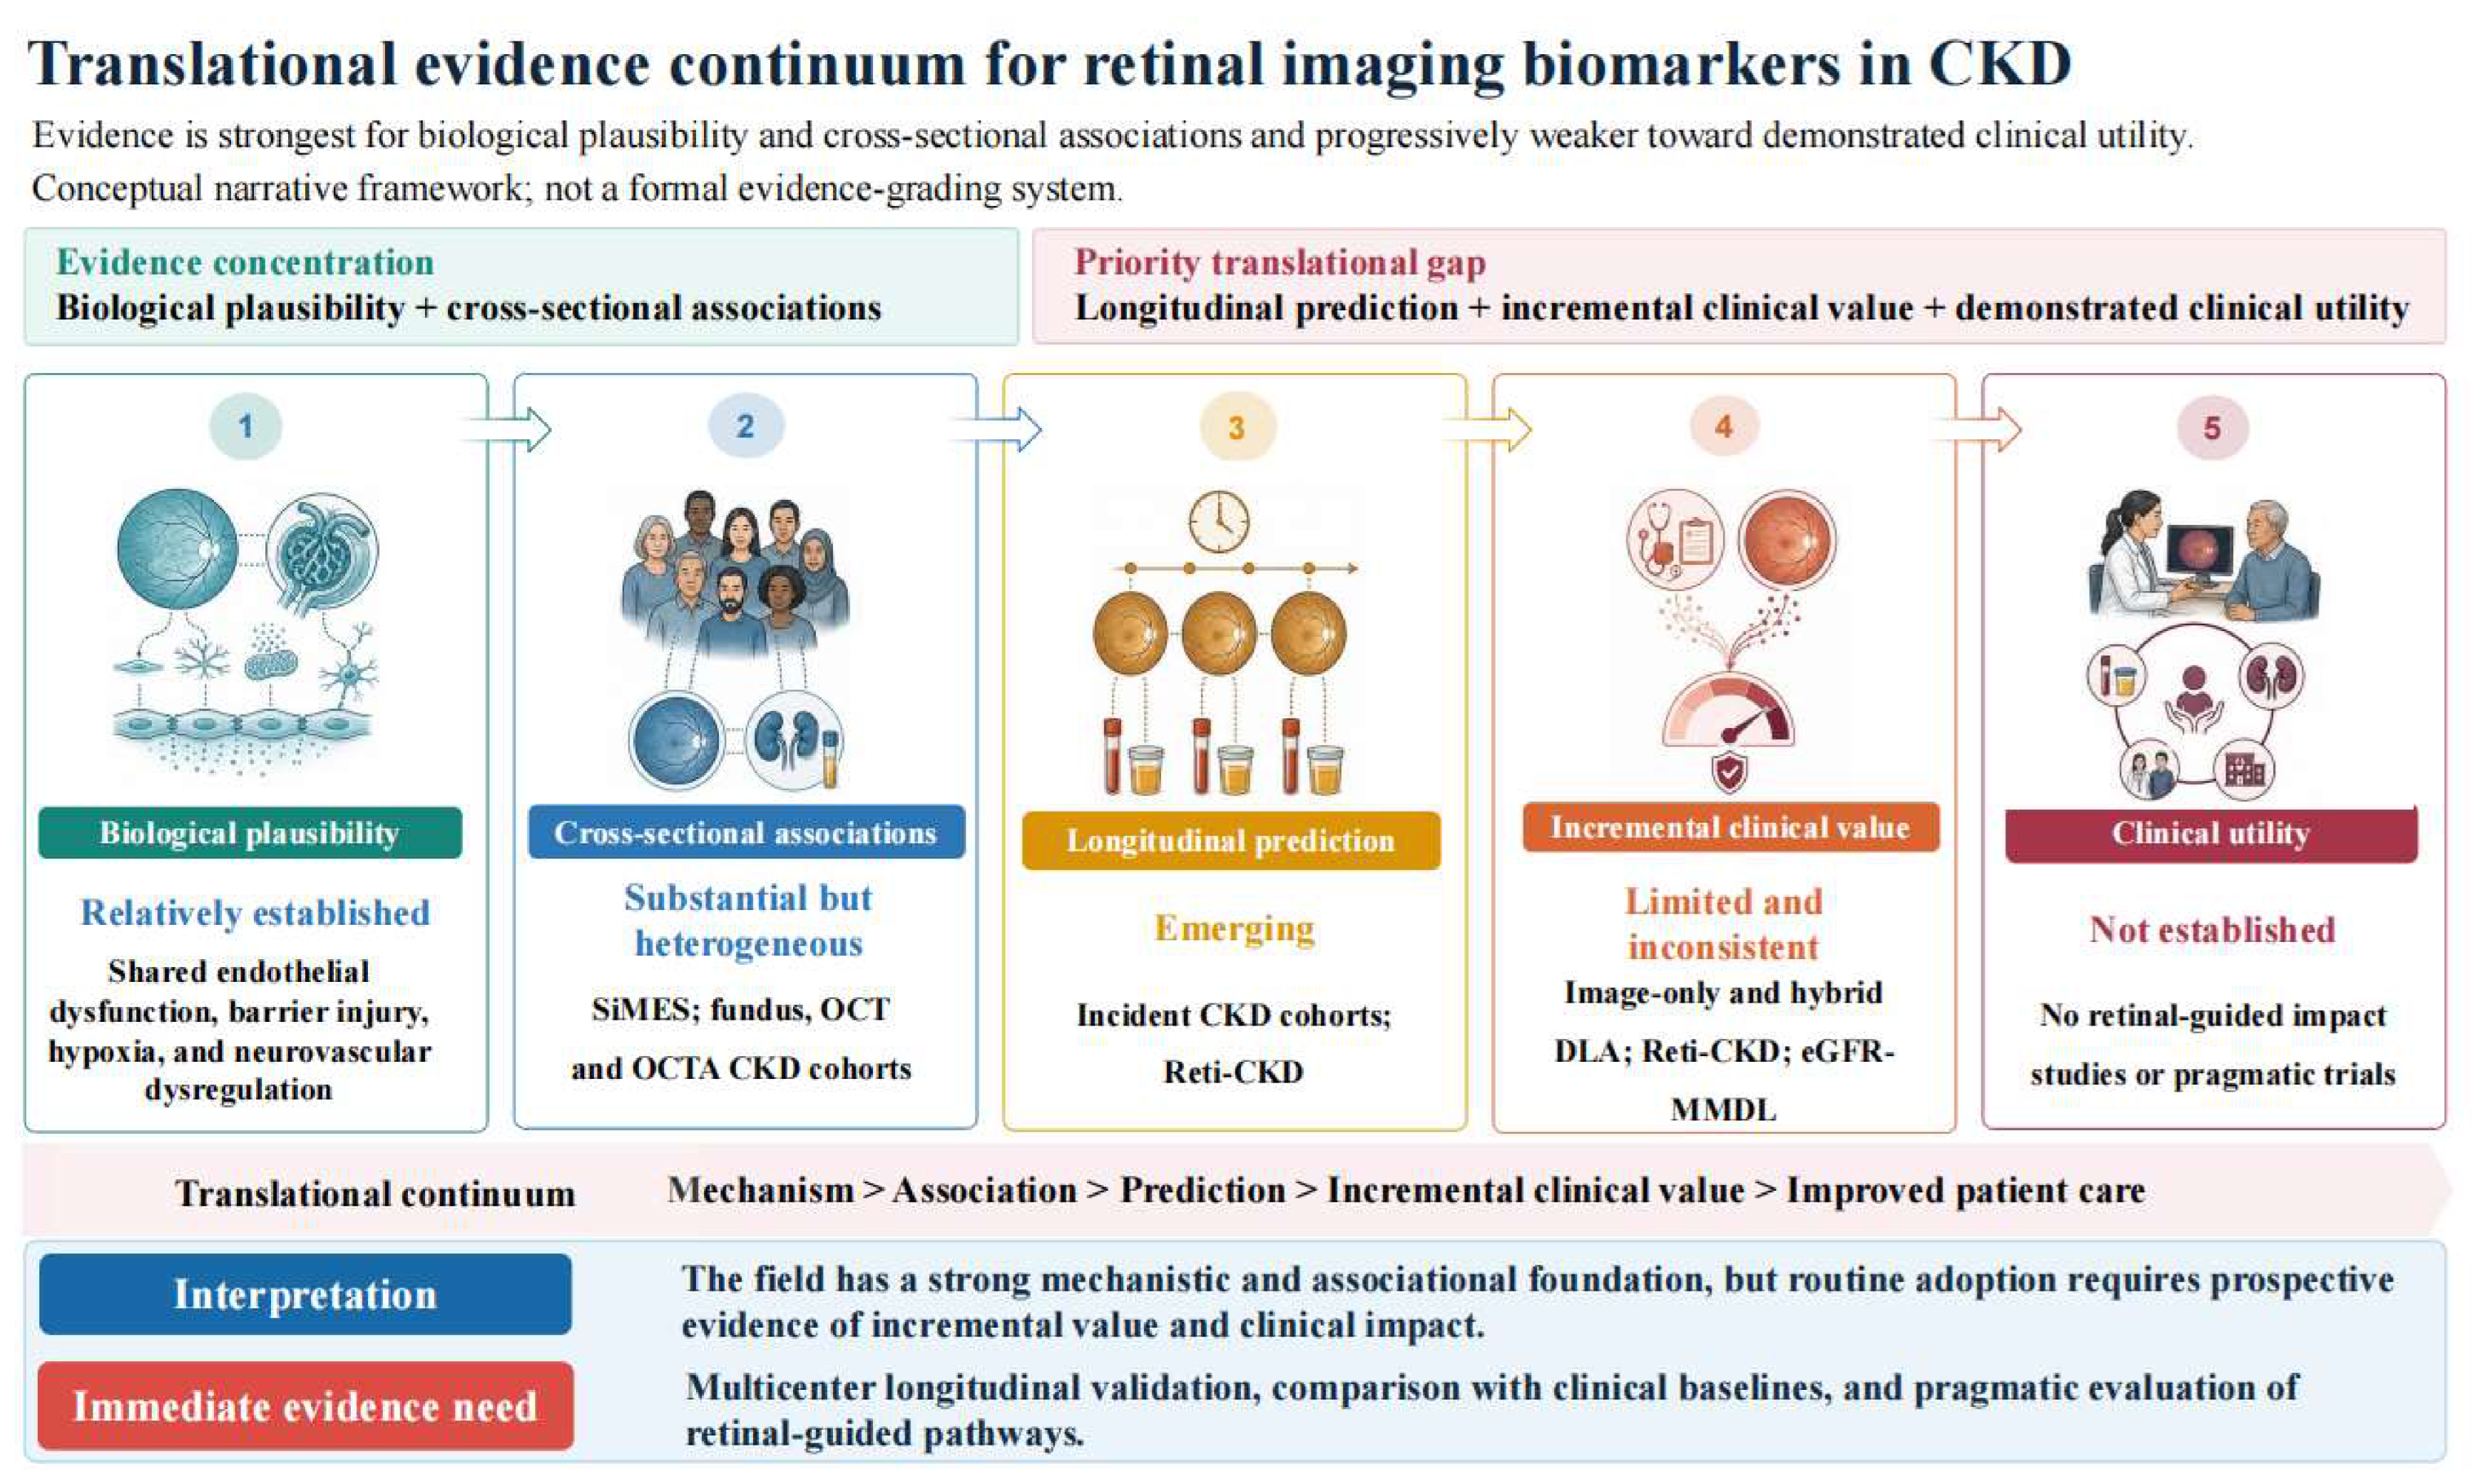

Disclaimer/Publisher’s Note: The statements, opinions and data contained in all publications are solely those of the individual author(s) and contributor(s) and not of MDPI and/or the editor(s). MDPI and/or the editor(s) disclaim responsibility for any injury to people or property resulting from any ideas, methods, instructions or products referred to in the content. |
© 2026 by the authors. Licensee MDPI, Basel, Switzerland. This article is an open access article distributed under the terms and conditions of the Creative Commons Attribution (CC BY) license.