


Abstract
Background: Obstructive sleep apnea (OSA) is characterized by chronic intermittent hypoxia (CIH), which causes numerous metabolic changes, leading to non-alcoholic fatty liver disease (NAFLD). Our study explored the suggested role of hypoxia-inducible factor 1-α (HIF-1α) in the pathophysiological mechanisms linking OSA with NAFLD. Methods: This case-control study was conducted at the Sleep Disorders Unit at Qena University Hospital from March 2022 to October 2023, including 64 subjects (48 OSA patients; in a secondary analysis, OSA patients were further stratified according to the presence or absence of NAFLD–16 controls) who were subjected to a polysomnography (PSG) for apnea hypopnea index (AHI) and transient elastography for controlled attenuation parameter (CAP) score and liver stiffness measurement (LSM). Serum levels of HIF 1-α, fasting blood glucose, and fasting insulin were measured. Results: HIF-1α level showed the highest significant value was in the severe group (p = 0.001). Additionally, the severe group had the highest LSM compared to the other groups (p = 0.032). OSA patients with NAFLD, compared to OSA patients without NAFLD, showed significantly higher BMI (42.74 vs. 29.11 kg/m2, p < 0.001), homeostatic model assessment for insulin resistance (HOMA-IR) mean score (3.92 vs. 1.21, p < 0.0001), HIF-1α level (6.01 vs. 2.14 ng/L, p = 0.045), and the LSM score (5.55 vs. 3.85 kPa, p < 0.001). HIF-1α showed significant positive correlations with AHI (r = 0.515, p < 0.001), waist circumference WC (r = 0.291, p = 0.045), HSI (r = 0.3, p = 0.038), and CAP score (r = 0.288, p = 0.047). Conclusions: Although serum HIF-1α levels were significantly higher in OSA patients with NAFLD and correlated with indices of hepatic steatosis, HIF-1α was not identified as an independent predictor of NAFLD after adjustment for metabolic confounders, suggesting a potential role of hypoxia-responsive pathways in pathophysiology of NAFLD in OSA.
1. Introduction
Obstructive sleep apnea (OSA) is a chronic disorder characterized by both chronic intermittent hypoxia (CIH) and sleep fragmentation (SF), resulting in many changes, including dysregulation of glucose metabolism, alterations in lipid metabolism and insulin resistance (IR) [1]. OSA affects approximately 17–34% of adults [2] and its prevalence is about four to five times higher in obese individuals than in the lean subjects [3]. Both OSA and non-alcoholic fatty liver disease (NAFLD) are common metabolism-related disorders. NAFLD is considered a complex metabolic disorder and the most common chronic liver disease among children and adults. Its percentage is around 80% among diabetic and obese individuals [4].
Many studies demonstrate a strong connection between OSA and NAFLD prognosis, suggesting that CIH may be linked to the pathogenesis and severity of the NAFLD [5,6]. Until now, the pathophysiological mechanisms linking both disorders are not clear enough. It is suggested that CIH can cause damage to various target organs by inducing metabolic dysregulation and IR [7], oxidative stress [8], and increasing hypoxia inducible factor 1-α (HIF 1-α) expression [9]. These adaptive mechanisms promote modifications in metabolism to match the oxygen availability [10]. The impact of the CIH effect is evident through abnormal liver enzymes, glucose metabolism, and blood lipids, in addition to observable changes in the pathology of the liver [6].
Connections between OSA and NAFLD lead to complex multifactorial diseases, and the exact role of HIF-1α in the onset and prognosis of NAFLD in OSA patients is still unclear. Our study explores the suggested role of HIF-1α in the pathophysiological mechanisms linking OSA with NAFLD. Also, we aim to clarify if the degree of IR, hepatic steatosis or fibrosis is associated with OSA severity.
2. Patients and Methods
This case–control study was conducted at the Sleep Disorders Unit, Chest Disease Department, South Valley University Hospital, from March 2022 to October 2023. This study included 48 cases diagnosed with OSA and not yet treated and 16 controls, ranging from 18 to 60 years old. Among the 48 OSA patients, 34 had NAFLD and 14 did not have NAFLD according to CAP score criteria. The exclusion criteria for both cases and controls were having a known history of vascular events (stroke, unstable angina, coronary artery disease, or acute myocardial infarction), evidence of neoplastic diseases, hepatitis B viral infection, hepatitis C viral infection, cholecystitis, hypothyroidism, Wilson’s disease, or alcoholism. Also, patients with known chronic chest diseases or whose polysomnography study showed central apnea or Cheyne–Stokes disorder were excluded.
Participants were recruited consecutively from eligible patients attending the sleep clinic during the study period. The final sample size was determined by the number of individuals fulfilling the inclusion criteria and consenting to participate. The distribution of participants across study groups reflected the natural prevalence of NAFLD among enrolled OSA patients and was not based on a predefined allocation ratio.
A full medical history, clinical examination, and measurements of the anthropometric parameters were done for all cases and controls. Polysomnography (PSG) was done using SOMNOscreen ™ plus EEG 32, SOMNOmedics America Inc. (Coral Gables, FL, USA). The recorded parameters included the apnea-hypopnea index (AHI), the number of desaturation index (ODI), and the time of desaturations below 90%. The diagnosis of OSA was based on the American Academy of Sleep Medicine (AASM( guidelines criteria as follows: normal (if AHI < 5), mild OSA degree (if 5 ≤ AHI < 15), moderate OSA degree (15 ≤ AHI < 30), and severe OSA degree (if AHI ≥ 30) [11].
Hepatic assessment was done using transient elastography using a FibroScan® device and the hepatic steatosis index (HSI). A controlled attenuation parameter (CAP) score and liver stiffness measurement (LSM) value were obtained using a FibroScan® device (FibroScan, Echosens, Paris, France). LSM value was used to evaluate the presence of fibrosis according to the stages of METAVIR fibrosis, and the cut value is 7.0 kPa [12]. CAP score was expressed in dB/m and its values were used to evaluate the stages of hepatic steatosis as follows: S0: < 238 dB/m, S1: 238–258 dB/m, S2: 259–291 dB/m, and S3: ≥292 dB/m [12].
A venous blood sample (about 6 milliliters) was taken. Later, we obtained the serum by centrifugation at 4000 rpm for 20 min. Measurement of alanine aminotransferase (ALT) and aspartate transaminase (AST) levels was performed and used for the calculation of the hepatic steatosis index (HSI) as (HSI) = 8 × (ALT/AST) + BMI + (2, if diabetes mellitus) + (2, if female).
Fasting blood glucose (FBG) and fasting insulin levels were used to detect the homeostatic model assessment for insulin resistance (HOMA-IR). (HOMA-IR = fasting insulin (microU/L) × fasting glucose (mg/dL)/405). HOMA-IR values above 2.0 show enhanced diagnostic value in discriminating NAFLD from non-NAFLD cases [13].
Serum HIF-1α concentrations were quantified using a commercially available sandwich ELISA kit (purchased from Biospes (Chongqing, China), Cat. No.: BZEK1618, intra-assay CV ˂ 6.9% and inter-assay CV ˂ 8.7%) according to the manufacturer’s instructions. Absorbance was measured using an EMR-500 microplate reader (Labomed, Inc., Los Angeles, CA, USA), and concentrations were calculated from a standard calibration curve.
3. Statistical Analysis
Data were analyzed using the Statistical Package for Social Science (SPSS) software program version 25.0 (SPSS Inc., Chicago, IL, USA). Normality testing was carried out via the Shapiro test, and accordingly, parametric or non-parametric tests were used. The data were presented as mean ± SD for the normally distributed data, median with interquartile range (IQR) for the non-normally distributed data. Student’s t-test and one-way ANOVA were used for normally distributed variables, whereas Mann–Whitney U and Kruskal–Wallis tests were applied for non-normally distributed variables. The Spearman rho test was used in the correlation analysis. Univariate logistic regression analysis was initially performed to evaluate the association between each clinical and biochemical variable and the presence of NAFLD, and to identify factors independently associated with hepatic steatosis and fibrosis severity using CAP score and liver stiffness measurement (LSM) as dependent variables. Variables showing potential associations were subsequently entered into a multivariate logistic regression model to identify independent predictors. Results were expressed as odds ratios (ORs) or B (the unstandardized regression coefficient) and 95% confidence intervals (CIs). Serum HIF-1α level, BMI, WC, HOMA-IR, age, and sex were included as explanatory variables. Statistical significance was considered at p < 0.05.
4. Results
This study included 64 subjects (48 cases—16 controls). Their median age is 40.5 (30–44.82) years, and their mean BMI is 38.63 (±10.35) kg/m2. There are 42 (66%) males and 22 (34%) females among the total study sample.
Table 1 compares control and OSA patients with different severities. A significant gender difference was observed, with a higher ratio of males in the severe OSA group (100%) (p = 0.005). Body mass index (BMI) shows significant statistical differences among moderate vs. severe OSA degrees (34.26 ± 10.64 vs. 44.38 ± 5.01, p = 0.026), while WC is between moderate vs. severe OSA degrees (106 ± 25.57 vs. 134.75 ± 8.54) and between moderate vs. control (106 ± 25.57 vs. 112.62 ± 14.99) with (p < 0.001).
Table 1.
Comparison among control and different grades of OSA patents.
PSG results show that AHI statistically significantly differs among the four different groups: control, mild, moderate, and severe groups) 3.05 (1.92–4.93), 8.85 (7.72–9.07), 17.4 (15.6–20.02), 47.5 (34.78–56.65), respectively, with (p < 0.001)). HOMA-IR does not show significant differences among groups (p = 0.539) while FBG level is statistically significantly elevated in the severe OSA group vs. the mild group (114.5 (102.75–150.7) vs. 86.5 (76.5–90.5) mg/dL, p = 0.001). Also, the HIF-1α level is statistically significantly different between control vs. severe (5.45 (2.32–12.46) vs. 10.21 (5.6–17.11)), mild vs. severe (1.61 (0.74–3.53) vs. 10.21 (5.6–17.11)), and moderate vs. severe (5.44 (2.25–21.33) vs. 10.21 (5.6–17.11)), (p = 0.001).
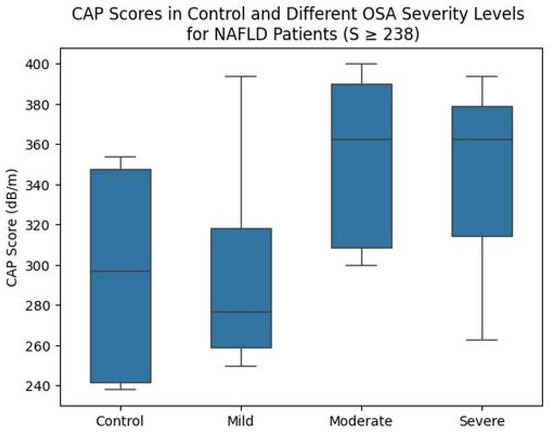
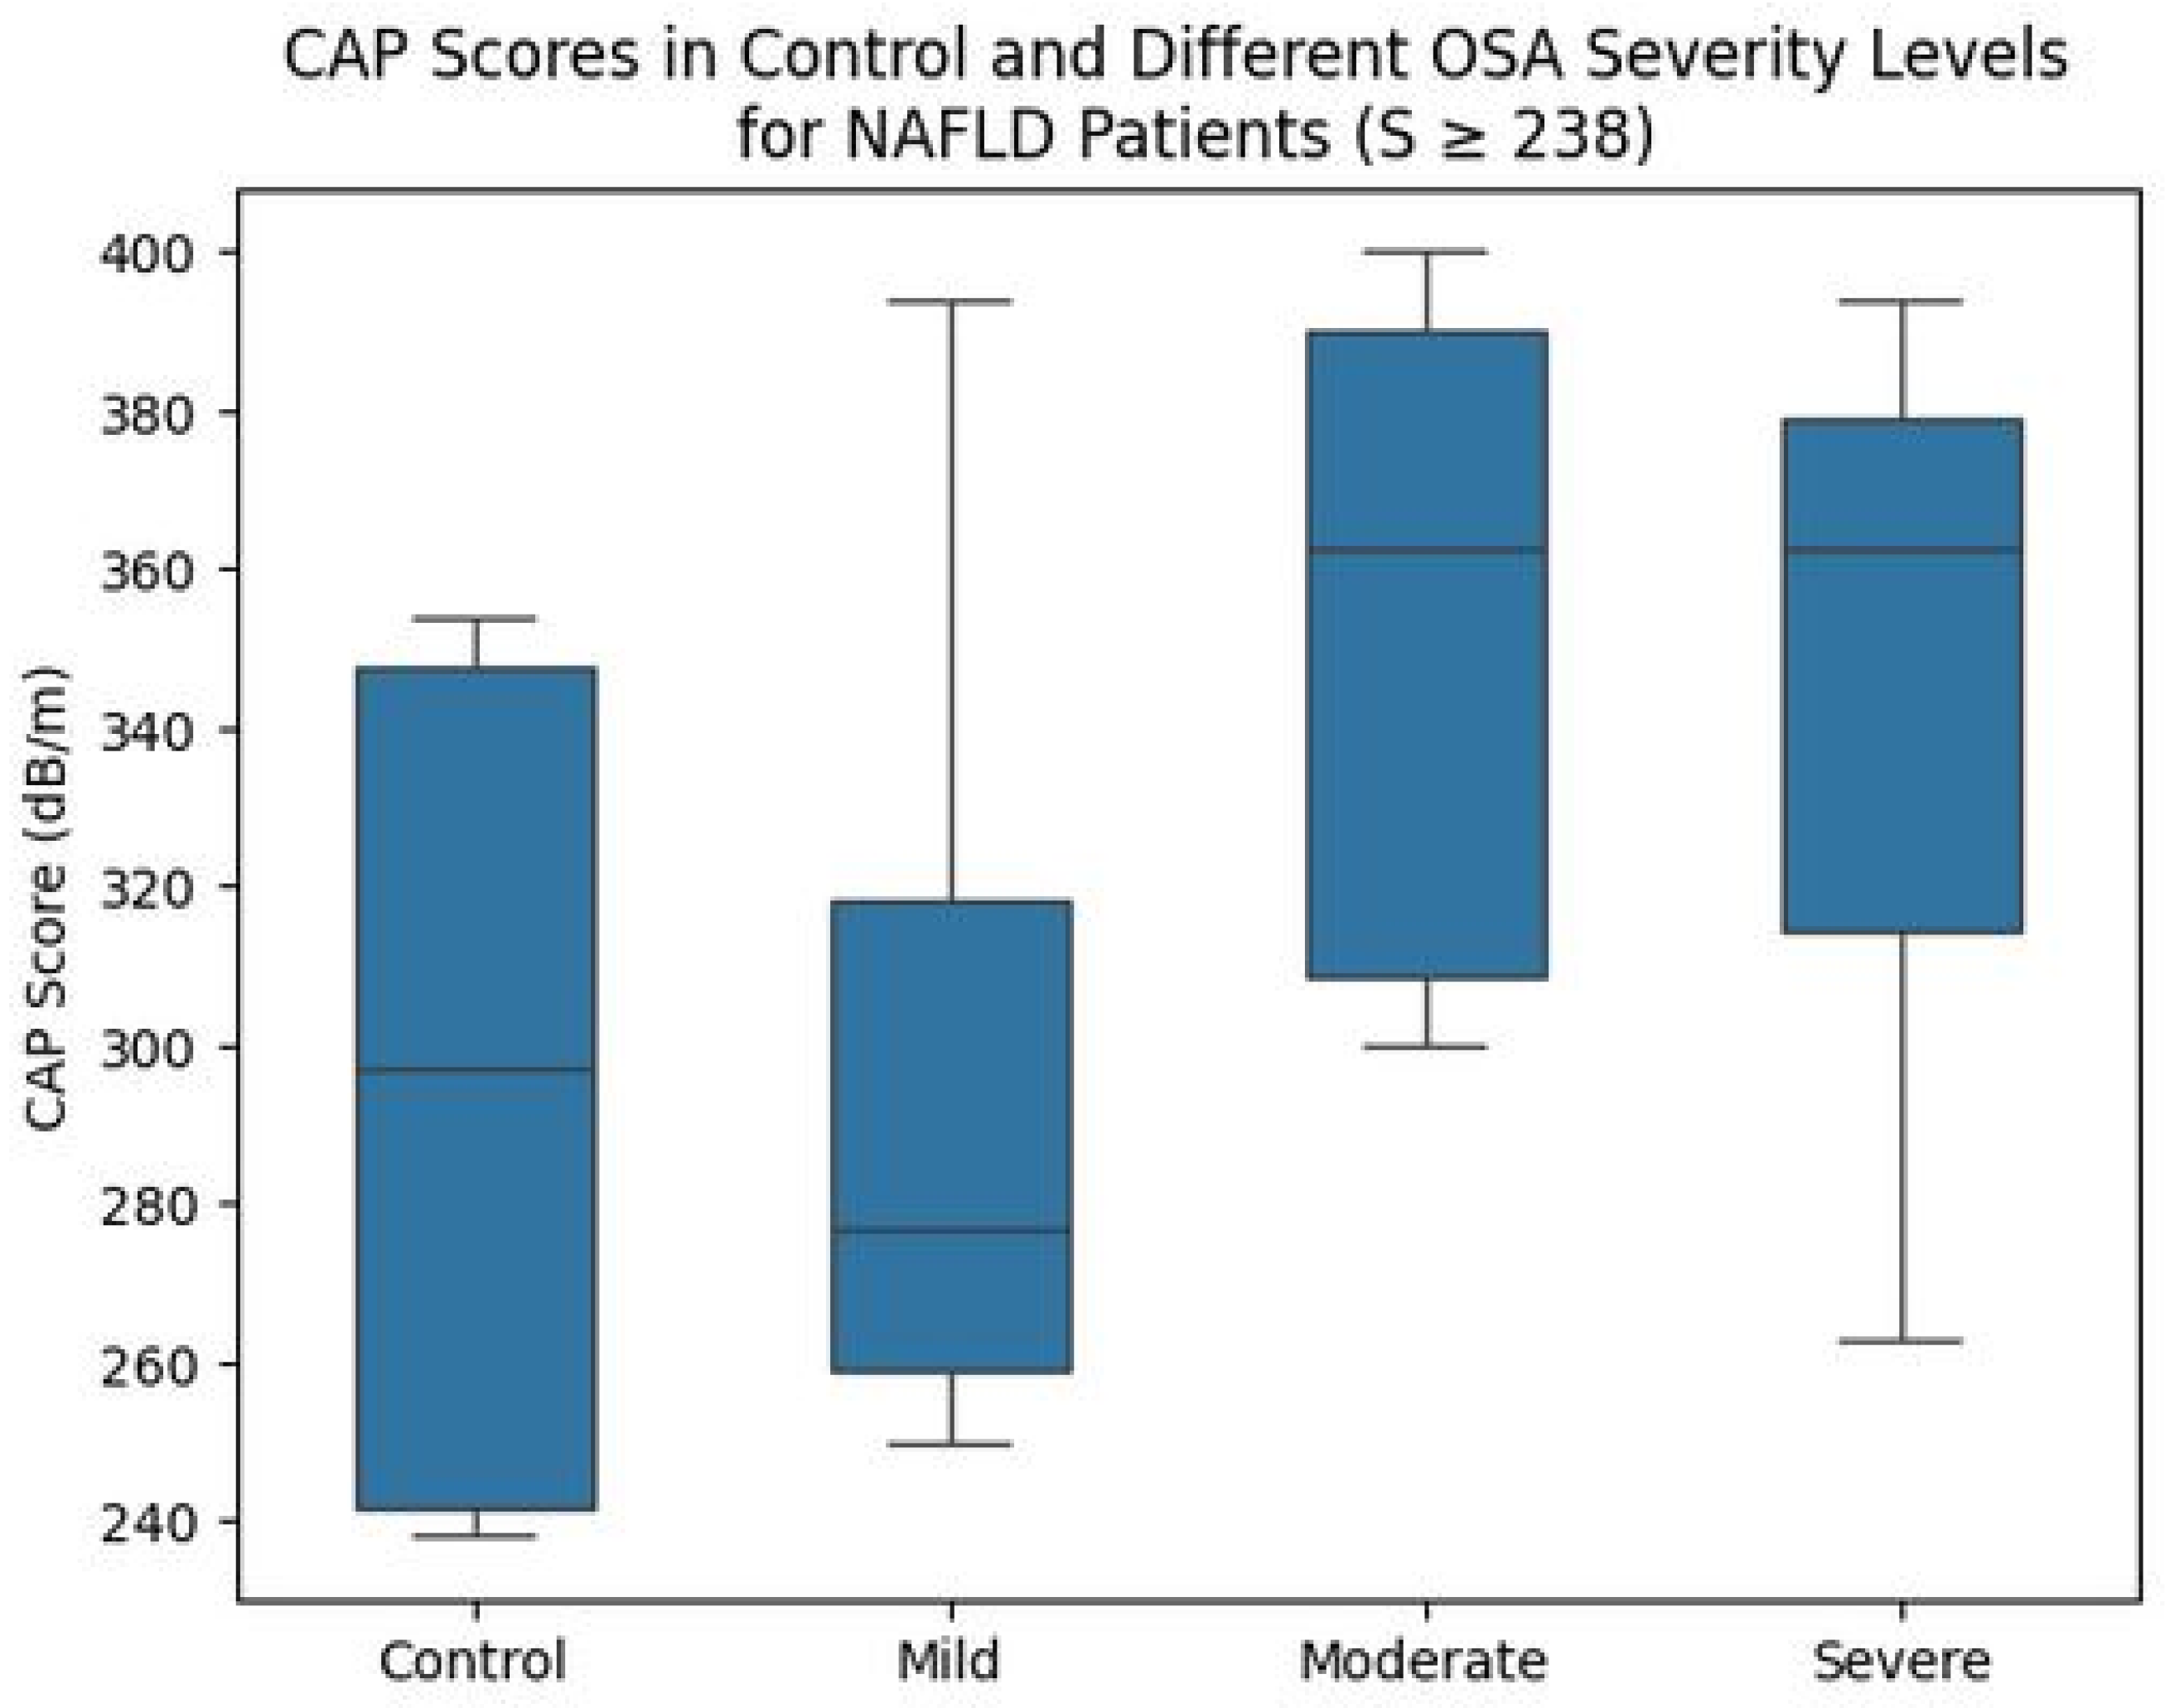
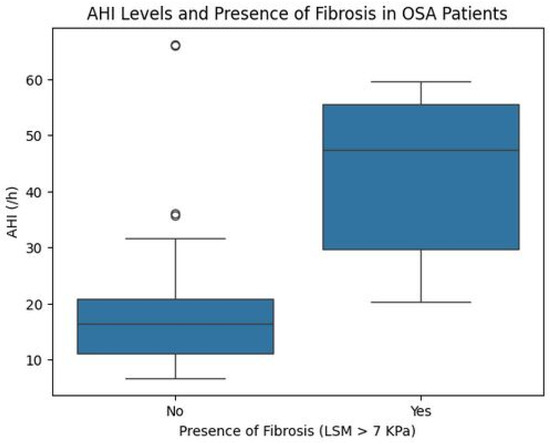
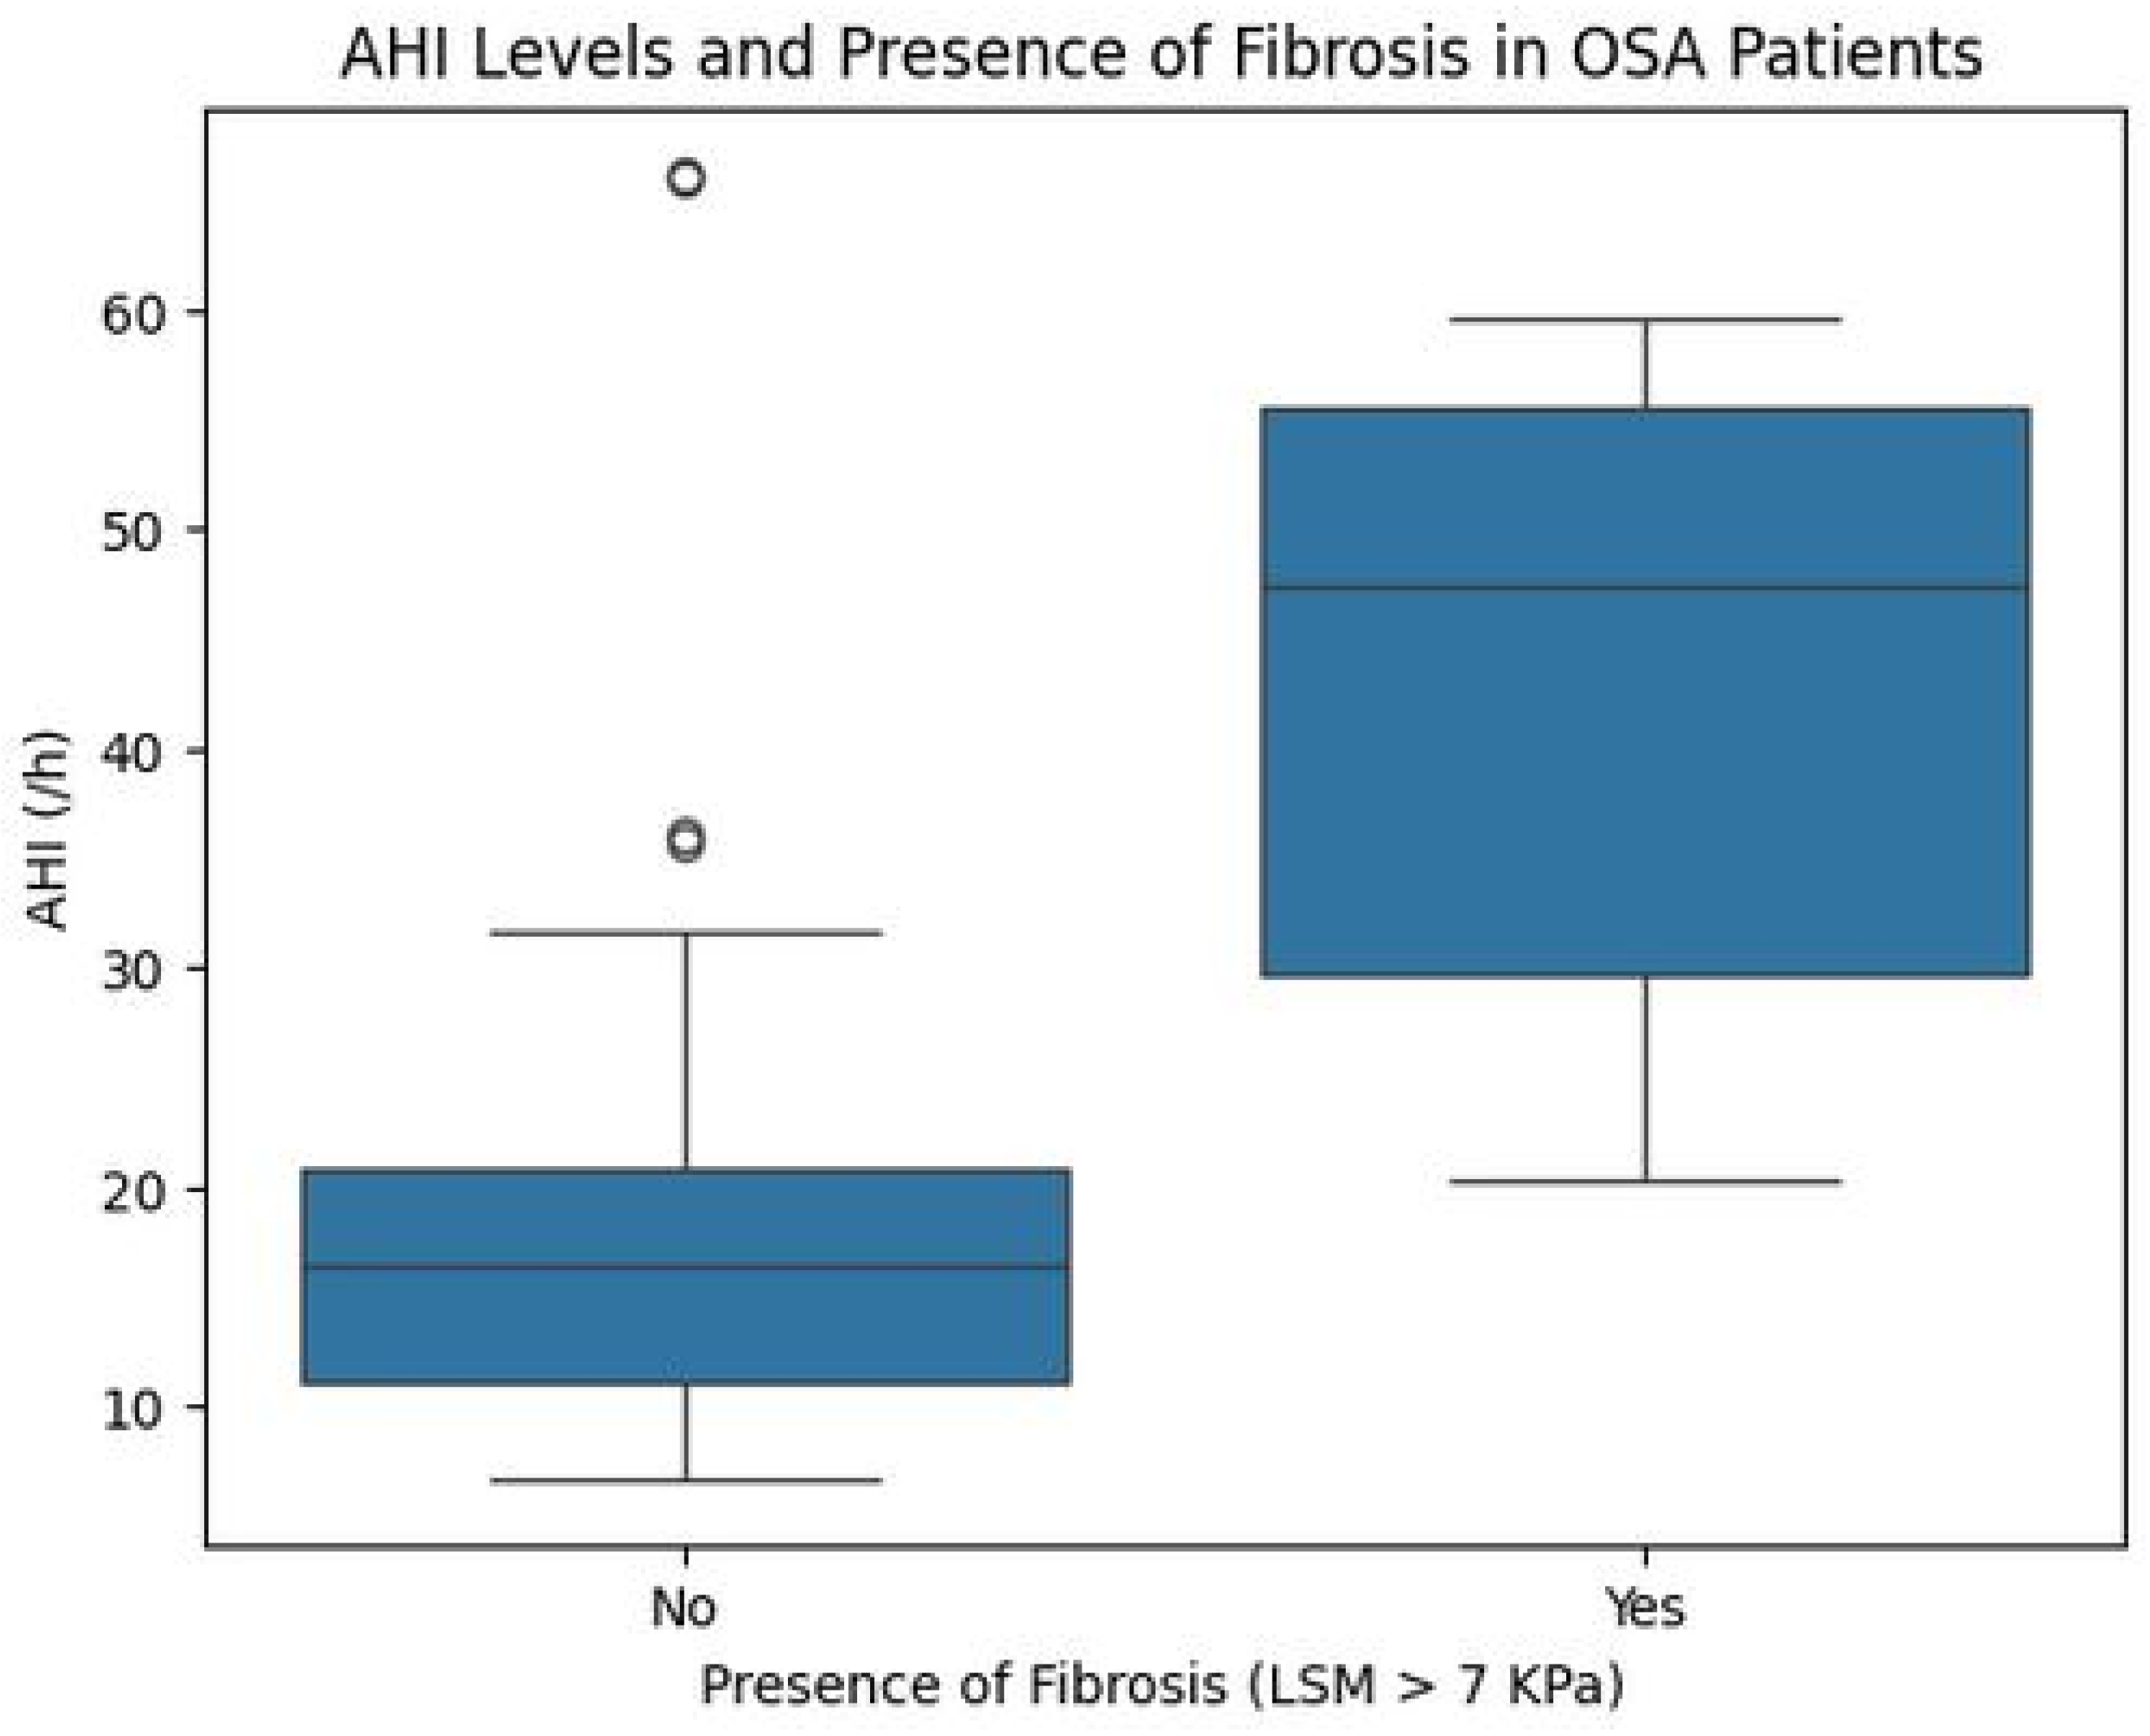
HSI shows statistically significant differences among the mild vs. moderate (51.02 (±11.6) vs. 45.16 (±13.14)) and mild vs. severe (51.02 (±11.6) vs. 57.46 (±9.36)), with p = 0.026. While there is no significant difference in the CAP score when comparing all control and OSA degrees, while comparing the CAP score in control and different OSA degrees who are NAFLD (CAP score ≥ 238), we find a statistically significant difference between control vs. moderate (297 (241.5–347.75 vs. 362.5 (308.5–390.25)) and control vs. severe (297 (241.5–347.75 vs. 362.5 (314.25–379.25)) (p= 0.006) as illustrated in Figure 1. The LSM value is significantly different between control vs. severe (4.6 (3.8–5.85) vs. 11 (4.92–15.32)), mild vs. severe (4.9 (4.35–5.6) vs. 11 (4.92–15.32)), moderate vs. severe (5.05 (4.7–5.5) vs. 11 (4.92–15.32)) with (p = 0.032). Figure 2 shows the level of AHI in OSA patients with\without liver fibrosis (cut value 7 kPa) (47.5 (29.68–55.55) vs. 16.35 (11.15–20.92) with (p < 0.001).
Figure 1.
Box plot of the CAP score in control and different OSA degrees who are NAFLD (CAP score ≥ 238). (OSA: obstructive sleep apnea, CAP: controlled attenuation parameter; NAFLD: non-alcoholic fatty liver disease).
Figure 2.
Box blot of the level of AHI in OSA patients with\without liver fibrosis (cut value of LSM 7 kPa) (OSA: obstructive sleep apnea, AHI: apnea-hypopnea index, LSM: liver stiffness measurement).
Table 2 illustrates the differences between OSA patients with and without NAFLD (N = 34, 14, respectively). The NAFLD group presented significantly higher BMI (42.74 ± 9 vs. 29.11 ± 8.23 kg/m2, p < 0.001), NC (44.12 ± 3.94 vs. 40.43 ± 3.99 cm, p = 0.005), and WC (131.5 vs. 101.5 cm, p < 0.001).
Table 2.
Comparison between OSA patients with\without NAFLD.
Additionally, the HOMA-IR mean score was a highly statistically significant difference between OSA with and without NAFLD groups (3.92 vs. 1.21, respectively, p < 0.0001), HIF-1α level was also statistically significantly elevated in the NAFLD group (6.01 vs. 2.14 ng/L, p = 0.045). Also, the LSM score was considerably higher in the NAFLD group compared to OSA patients without NAFLD (5.55 vs. 3.85 kPa, p < 0.001).
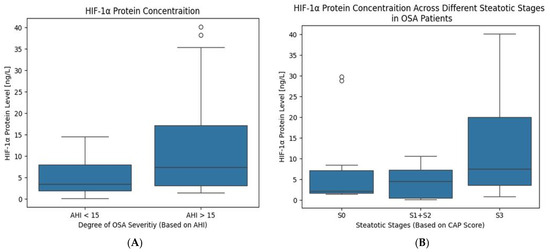
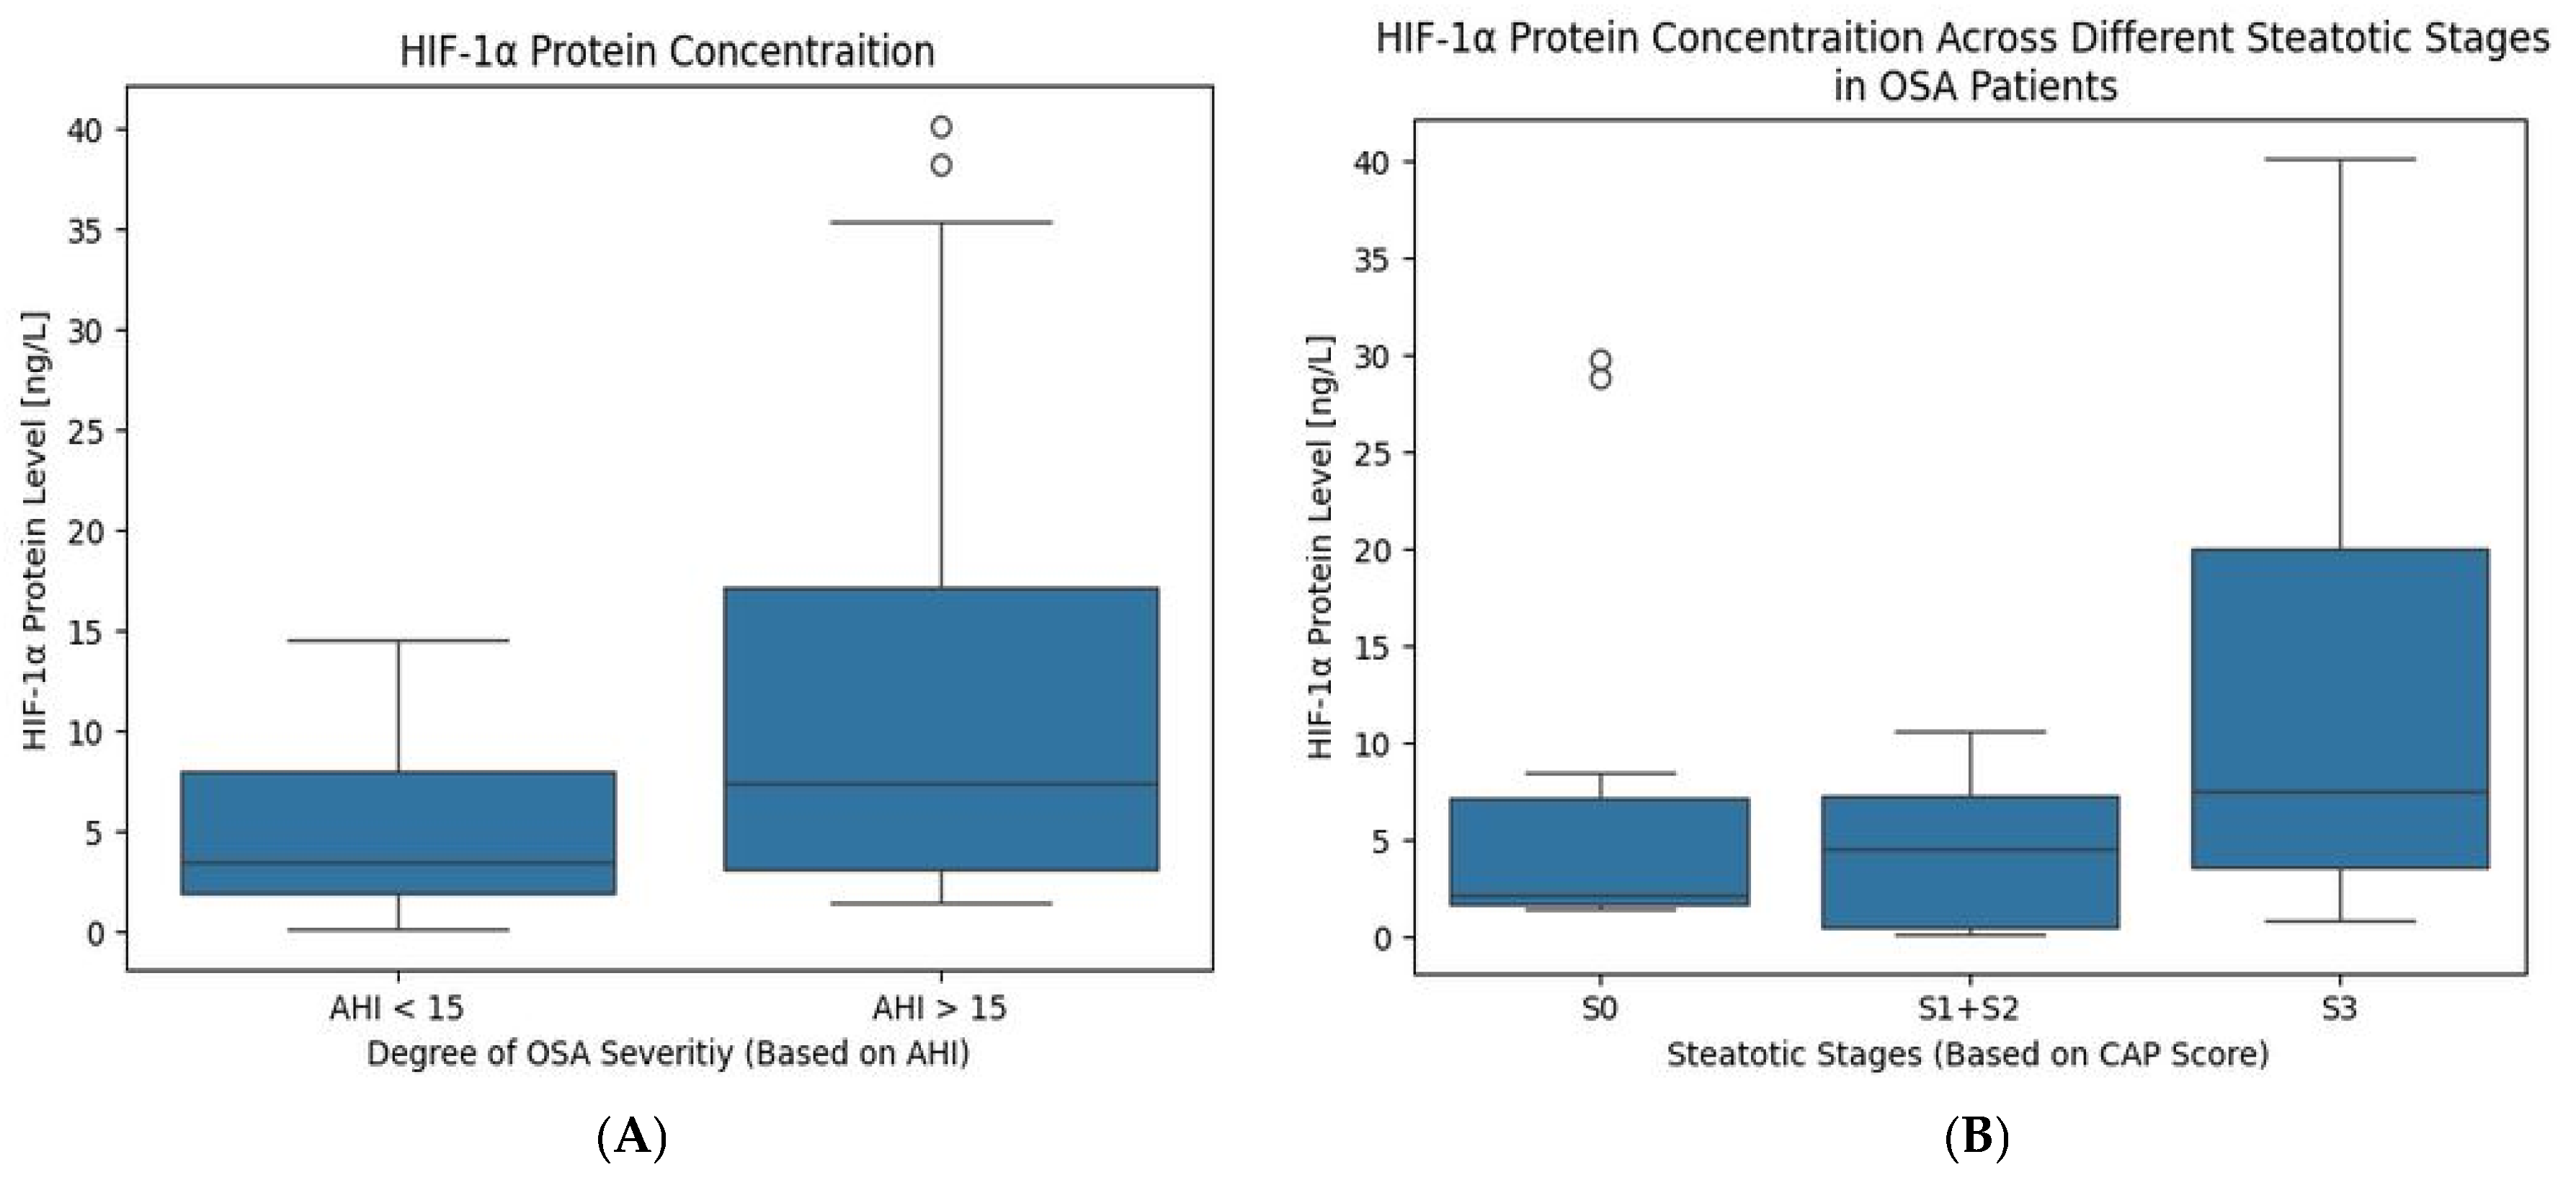
Figure 3 shows the level of HIF-1α in OSA patients if they are classified into different groups:
Figure 3.
Levels of HIF 1-α in OSA patients. They are classified into (A) non-severe (if AHI < 15) and severe (if AHI > 15), (B) according to steatosis stages (S0 < 238 dB/m, S1: 238–258 dB/m, S2: 259–291 dB/m and S3: ≥292 dB/m) (OSA: obstructive sleep apnea; HIF-1α: hypoxia-inducible factor 1-Alpha; AHI: apnea-hypopnea index).
(Figure 3A) According to AHI into non-severe (if AHI < 15) vs. severe (if AHI > 15) OSA degrees, (1.61 (0.74–3.53) vs. 7.43 (3.12–17.17) with (p < 0.001).
(Figure 3B) According to steatosis stages as S0 (2.14 (1.68–7.13), S1 + 2 (4.56 (0.48–7.24), S3 (7.51 (3.45–19.97)), with (p = 0.023).
Table 3 presents the correlation analysis of HIF-1α, HOMA-IR, and CAP scores in OSA patients to other parameters. HIF-1α showed significant positive correlations with AHI (r = 0.515, p < 0.001), WC (r = 0.291, p = 0.045), HSI (r = 0.3, p = 0.038), and CAP score (r = 0.288, p = 0.047). Additionally, HIF-1α was correlated with FBG (r = 0.503, p < 0.001), AST (r = 0.335, p = 0.02) and ALT (r = 0.354, p = 0.014).
Table 3.
Correlation between different numerical variables in OSA patients.
HOMA-IR was significantly correlated with the HSI (r = 0.521, p < 0.001), CAP score (r = 0.626, p > 0.001), BMI (r = 0.439, p = 0.002), and WC (r = 0.517, p > 0.001). CAP score showed a positive significant correlation with BMI (r = 0.53, p > 0.001), WC (r = 0.578, p > 0.001), and NC (r = 0.355, p = 0.013). Also, a significant correlation was detected between CAP score and ALT (r = 0.362, p = 0.011) and LSM value (r = 0.464, p = 0.001).
Univariate logistic regression analysis demonstrated significant associations between BMI, waist circumference, HOMA-IR, and the presence of NAFLD. After adjustment for potential confounders, waist circumference and HOMA-IR remained significant independent predictors of NAFLD, whereas HIF-1α was not independently associated with disease occurrence as shown in Table 4.
Table 4.
Univariate and multivariate logistic regression analysis for predictors of NAFLD among OSA patients.
Table 5 identified that in univariate linear regression analysis, BMI, waist circumference, and HOMA-IR were significantly associated with CAP score. After adjustment, HOMA-IR remained as the only significant independent predictor of CAP score. The final model explained 54.3% of the variability in CAP score (R2 = 0.543, adjusted R2 = 0.477) and was statistically significant overall (F = 8.13, p < 0.001). Neither serum HIF-1α levels nor anthropometric parameters showed independent associations with steatosis severity after adjustment for confounding variables.
Table 5.
Univariate and multivariate logistic regression analysis for predictors of CAP score among OSA patients.
Table 6 revealed that waist circumference and HOMA-IR were independently associated with liver stiffness values. These findings suggest that central obesity and insulin resistance contribute substantially to liver fibrosis severity. The model explained 50.7% of the variability in LSM (R2 = 0.507, adjusted R2 = 0.434) and was statistically significant overall (F = 7.02, p < 0.001). Serum HIF-1α levels did not demonstrate an independent association with liver stiffness after adjustment for metabolic and demographic factors.
Table 6.
Univariate and multivariate logistic regression analysis for predictors of LSM among OSA patients.
5. Discussion
OSA is characterized by CIH, which significantly impacts different metabolic processes [14]. Our study suggests that OSA might be correlated to NAFLD via alternation in HIF-1α, glucose metabolism, and insulin resistance.
One of the adaptive mechanisms of CIH is stabilizing hypoxia-inducible factors (HIFs) and preventing its hydroxylation and ubiquitin-mediated proteasome degradation. This helps in maintaining cellular oxygen homeostasis and ATP levels, but it changes the metabolic process [15].
Some studies found a significant elevation of HIF-1α in OSA patients vs. controls [9,16]; and another study observed that the elevation is higher in moderate to severe OSA cases (AHI ≥ 15) [17]. Our study supports this association, as HIF-1α serum level is positively correlated with AHI, as CIH causes increased expression of HIF-1α in many organs, including pancreatic beta cells. Elevated HIF-1α levels can lead to inflammatory responses and increase reactive oxygen species (ROS) production, which induce IR [18].
Our study supports this association, as FBG is associated with OSA severity. Notably, there is a significant difference in FBG levels between mild and severe OSA degrees, suggesting that OSA severity is independently associated with elevated FBG levels. This difference may be attributed to several underlying mechanisms, including sympathetic nervous system activation or pancreatic inflammation. Sympathetic overactivity promotes hyperglycemia, while pancreatic inflammation may lead to β-cell dysfunction and apoptosis, which may further exacerbate insulin secretion impairment, thus linking OSA to metabolic dysfunction [19].
The relationship between HOMA-IR and OSA severity is unclear and complex. An established correlation between OSA severity and IR—assessed by HOMA-IR—indicates that IR worsens when oxygen saturation decreases [7,19].
On the other side, a study found that whole-body insulin sensitivity does not correlate with the AHI; in contrast, OSA severity is linked to adipose tissue insulin sensitivity, which can produce or worsen IR via changing free fatty acids (FFA) metabolism [20]. This supports that obesity is one of the most effective risk factors for developing HOMA-IR. In our study, there is a positive correlation between HOMA-IR and various obesity-related parameters, including BMI, WC, and NC. However, no significant correlation was found between HOMA-IR and AHI, indicating that while OSA contributes to metabolic disturbances, obesity, especially central obesity, may play a more critical role in developing IR [1]. Additionally, the present study demonstrated that insulin resistance, as reflected by HOMA-IR, was the strongest independent determinant of both NAFLD occurrence and steatosis severity. Moreover, waist circumference emerged as an independent predictor of NAFLD and liver stiffness, highlighting the pivotal role of visceral adiposity in the progression of fatty liver disease. These findings provide evidence that central obesity and insulin resistance remain key drivers of hepatic steatosis and fibrosis.
IR increases the level of FFA in the bloodstream, with subsequent intake by the liver, and also induces de novo lipogenesis (DNL) in the liver due to hyperinsulinemia [21]. In addition, IR stimulates abnormal adipose tissue function, including an abnormality in adipokine secretion, and elevated TNF-α and IL-6 levels. This can highlight the multifaceted interplay between OSA, obesity, and metabolic dysfunction, including IR and explain how the bidirectional relationship between obesity and OSA as a vicious circle increases the prognosis of NAFLD [22,23].
On the other side, one of the changes in metabolic processes resulting from increased HIF-1α expression is enhancing the expression of many genes that involved in glucose uptake and glycolysis, particularly the glucose transporters as GLUT1 and GLUT3. This leads to enhanced hepatocytes uptake of glucose, and glycolysis provides more substrate (pyruvate) for lipogenesis, leading to the accumulation of triglycerides. In addition to promoting DNL, HIFs repress β-oxidation of fatty acids and induce FFA uptake, thus exacerbating the toxic lipid accumulation in the liver and inducing hepatic steatosis [24,25].
Additionally, the level of HIF-1α is further elevated due to local tissue hypoxia resulting from lipid accumulation within adipocytes and hepatocytes, which can reduce local perfusion, establishing a vicious cycle that exacerbates metabolic dysregulation [26]. In our study, we observed a weak but significant correlation between HIF-1α levels at one side and WC, HSI, and CAP score on the other side, highlighting the link between visceral fat accumulation, local tissue hypoxia, and altered hepatic function.
Some studies suggest that hypoxia and HIF-1α play a critical role in the pathogenesis of liver fibrosis via multiple mechanisms, including lipid accumulation and the induction of oxidative stress [25,27]. We noticed a significant difference in HIF-1α level between OSA grades and between NAFLD and non-NAFLD groups in OSA patients. This suggests that HIF-1α is correlated with AHI, indicating the influence of OSA severity on HIF-1α levels. In addition, AHI is associated with the LSM score (an indicator of liver fibrosis), which supports the hypothesis that OSA is implicated in liver fibrosis progression, which increases with the severity of OSA [27]. Absence of difference in AHI between NAFLD and non-NAFLD groups can be explained by the fact that AHI is not an accurate tool to detect the health consequences, while hypoxic burden measures the actual oxygen desaturation, providing a better assessment [28]. Although serum HIF-1α levels were elevated in patients with OSA and NAFLD, supporting the hypothesis that chronic intermittent hypoxia contributes to hepatic steatosis through activation of hypoxia-responsive pathways. However, the observed associations in our study did not remain significant after adjustment for obesity-related and metabolic variables. This suggests that the effect of hypoxia-related pathways on NAFLD may be partially mediated indirectly through metabolic abnormalities triggered by intermittent hypoxia, particularly visceral adiposity and insulin resistance rather than representing an independent pathogenic mechanism, indicating that HIF-1α activation is closely linked to metabolic dysfunction and obesity-associated inflammation.
Finally, other studies found that OSA correlated with increased levels of ALT more than AST as the increase in their levels is approximately 13.3% and 4.4%, respectively [6,29]. In our study, HIF-1α is correlated with both ALT and AST, while the CAP score is associated with ALT enzyme elevation only, which is more specific to hepatocellular injury than AST. Also, ALT and AST are associated with fibrosis. The presence of elevation in hepatic enzymes suggests that NAFLD is progressing to fibrosis [30].
Briefly, CIH, characteristic of OSA, leads to generalized tissue hypoxia. This condition stimulates adaptive mechanisms in tissues, one of which is the increased HIF-1α expression. This increase is correlated with the severity of OSA and NAFLD and is suspected to play a role in the pathophysiological mechanisms underlying HOMA-IR and NAFLD.
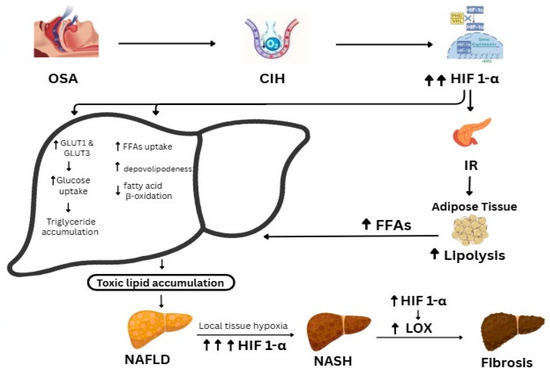
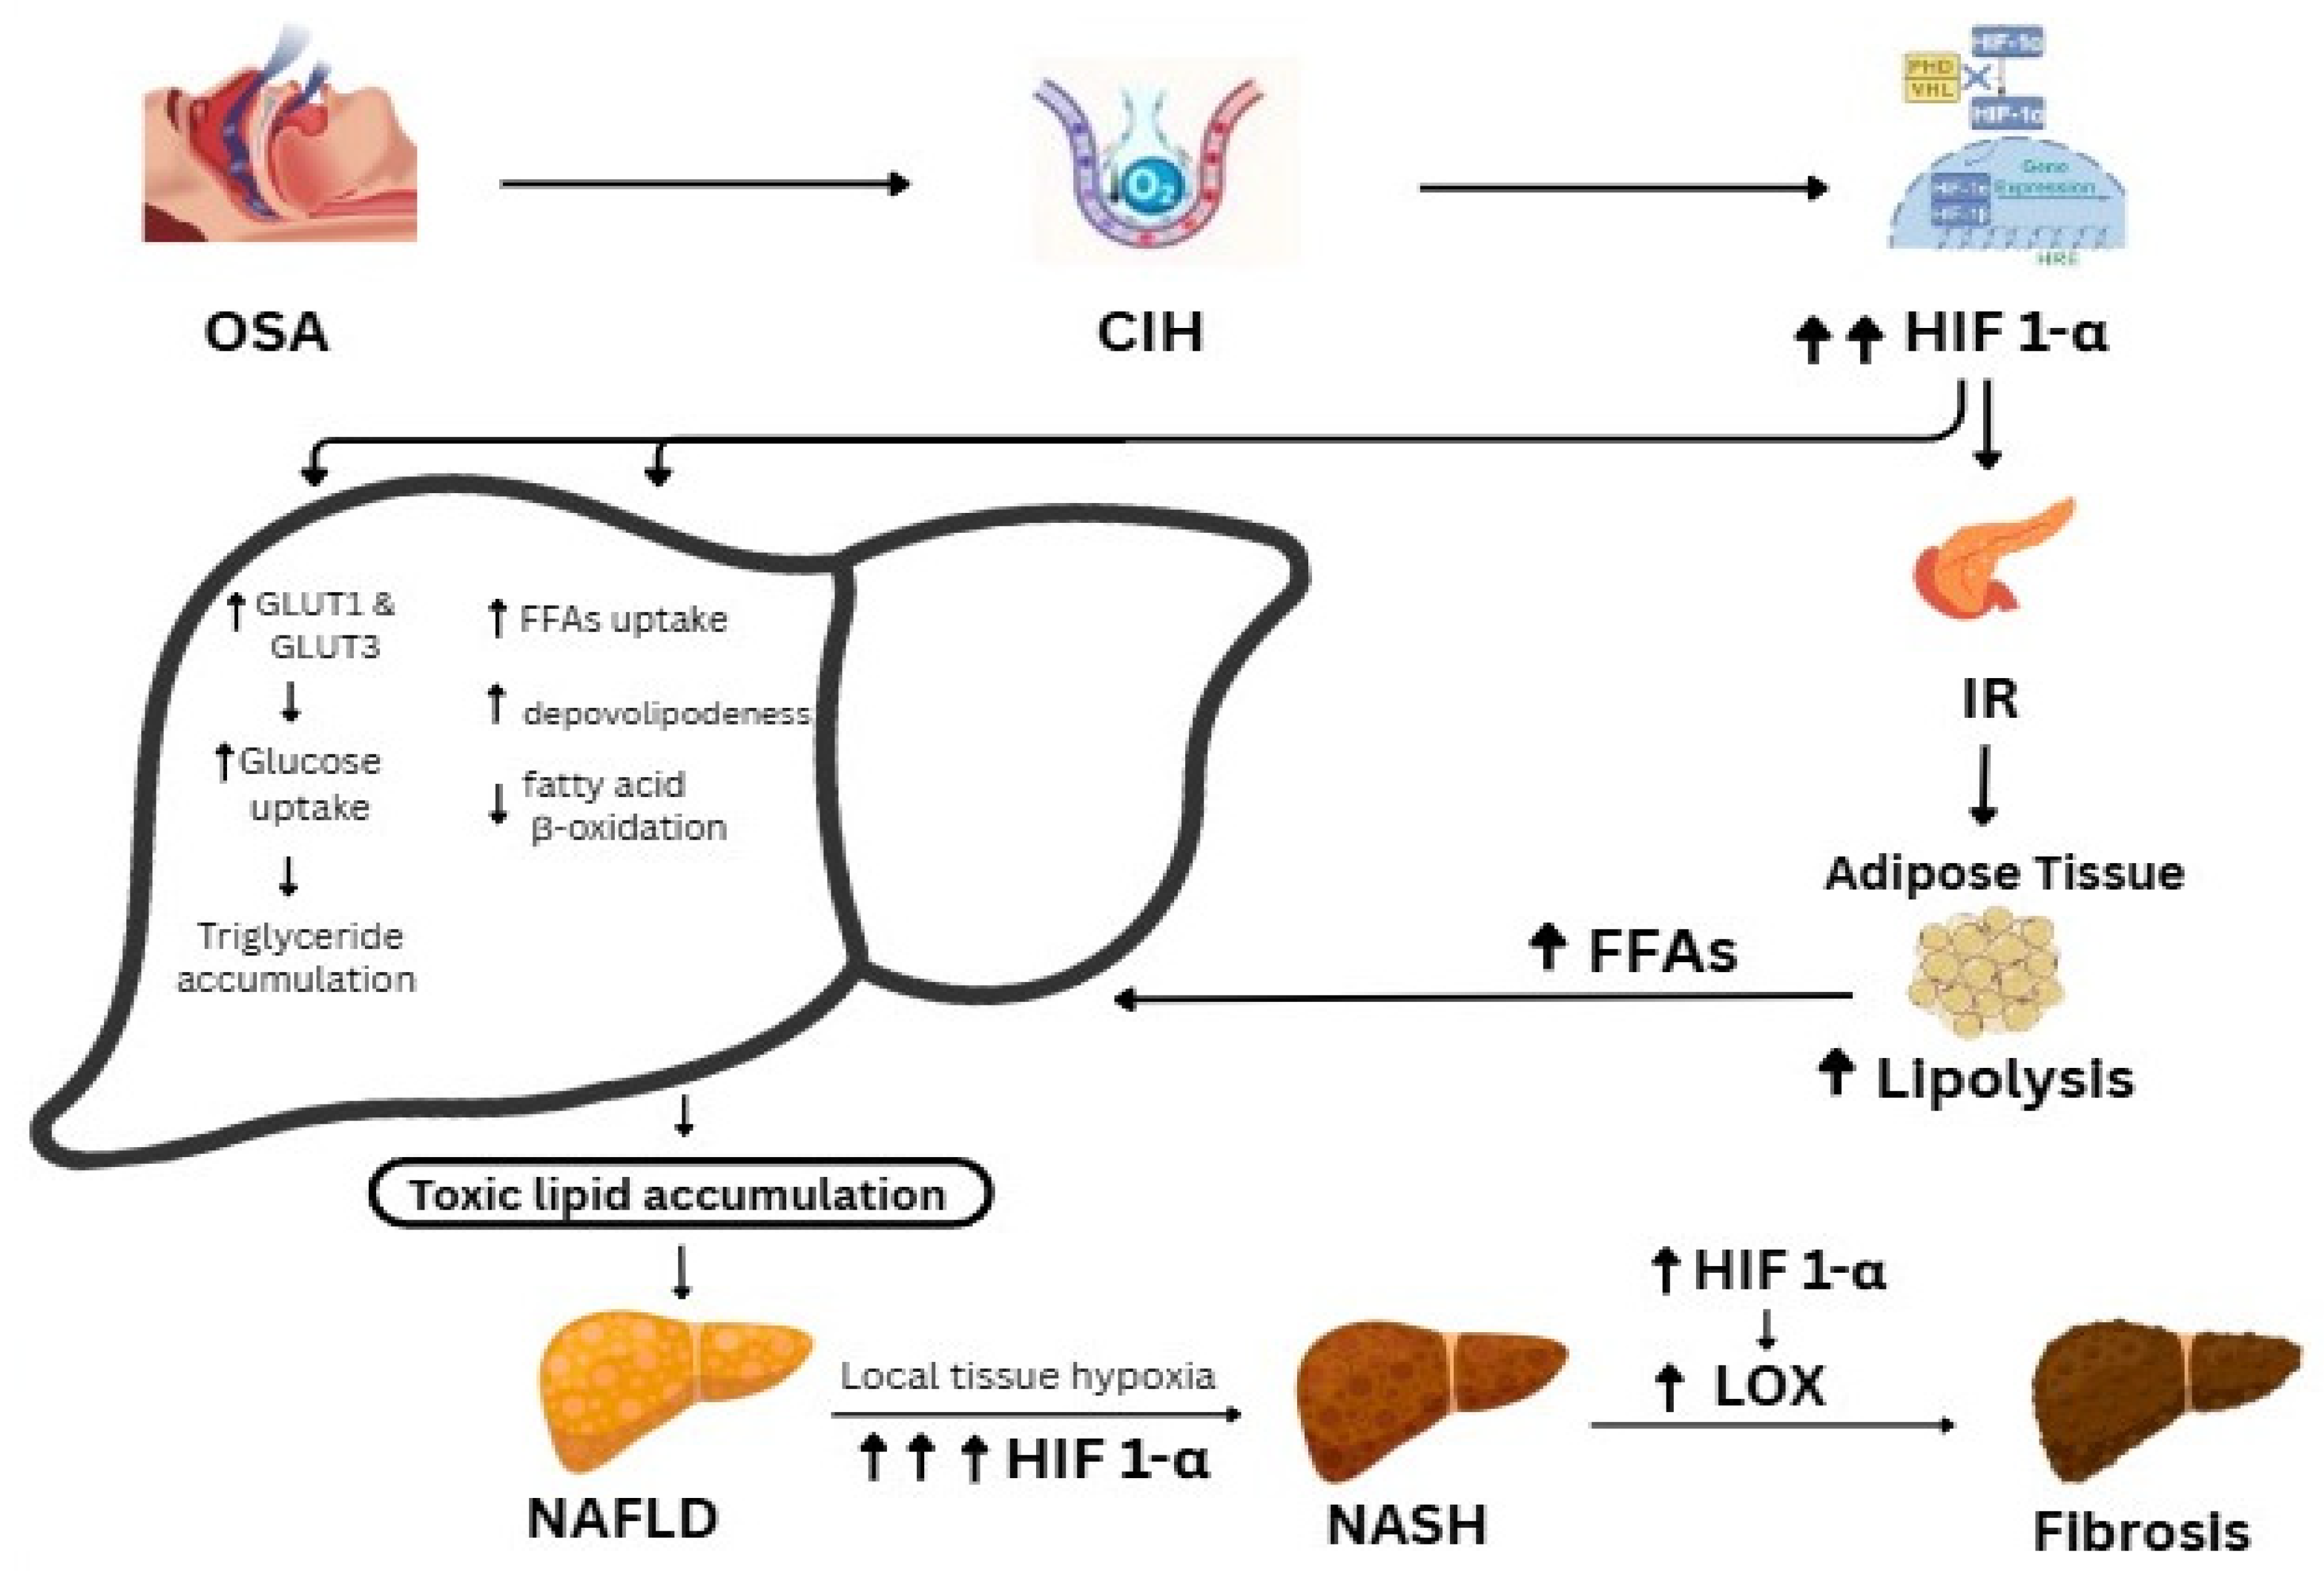
The suggested mechanism is that HIF-1α induces IR by altering metabolic processes or stimulating β-cell inflammation. This IR, in turn, promotes lipolysis and increases FFAs. Conversely, in hepatocytes, HIF-1α enhances glucose uptake, FFAs uptake, and DNL, while inhibiting β-oxidation. This results in toxic lipid accumulation within hepatocytes, leading to local tissue hypoxia, which further elevates HIF-1α levels. This cycle stimulates LOX and contributes to NAFLD progression to NASH, as shown in (Figure 4).
Figure 4.
A flow chart illustrates the role of HIF-1α in IR, NAFLD, and NASH in OSA patients (OSA: obstructive sleep apnea; CIH: chronic intermittent hypoxia; HIF-1α: hypoxia-inducible factor 1-Alpha; IR: insulin resistance; FFAs: free fatty acids; NAFLD: non-alcoholic fatty liver disease; LOX: Lysyl Oxidase; NASH: non-alcoholic steatohepatitis.).
All these metabolic changes are suspected to initiate in cases of moderate to severe OSA (AHI > 15), with HOMA-IR and NAFLD preceding the development of metabolic syndrome and its associated features.
6. Conclusions
The present study highlights a significant association between circulating HIF-1α levels and both obstructive sleep apnea severity and hepatic steatosis. These findings suggest that hypoxia-responsive pathways may contribute to the metabolic alterations linking chronic intermittent hypoxia to NAFLD. Nevertheless, obesity and insulin resistance emerged as the principal determinants of disease severity, indicating that the contribution of HIF-1α is likely integrated within a broader network of metabolic disturbances rather than acting as an independent driver. Given the cross-sectional nature of the study, further longitudinal and mechanistic investigations are warranted to clarify the causal role of HIF-1α in the development and progression of NAFLD among OSA patients.
Limitations of the Study
One limitation of the present study is the relatively small sample size, which may have reduced the statistical power to identify an independent association between HIF-1α and NAFLD severity after adjustment for potential confounders In addition, the unequal distribution of participants across study groups may have further limited the ability to detect modest associations, particularly in subgroup analyses and multivariable models. Accordingly, larger, well-powered prospective studies are needed to better delineate the role of HIF-1α in the pathogenesis of NAFLD among patients with obstructive sleep apnea.
Another important limitation is that the control group was predominantly obese, which may have attenuated between-group differences and complicated the isolation of the independent effects of OSA from obesity-related metabolic influences. Moreover, the imbalance between cases and controls reflects the recruitment characteristics of the eligible study population and may have affected the precision and stability of the estimated effects.
For Future Research: Investigating if treatment of OSA with Continuous Positive Airway Pressure (CPAP) would affect HIF-1α level and CAP score. Also, it is recommended to detect if adipose tissue insulin sensitivity is more accurate than HOMA-IR to detect IR in OSA patients.
Author Contributions
Conceptualization, R.T., T.A.S., E.D., F.R.A.H., O.G.A., A.M.S.A., M.H.H., M.A., and R.H.A.-A.; Methodology, R.T., E.D., F.R.A.H., O.G.A., A.M.S.A., M.H.H., M.A., and R.H.A.-A.; Software, T.A.S., E.D., F.R.A.H., O.G.A., A.M.S.A., and R.H.A.-A.; Validation, R.T., T.A.S., E.D., F.R.A.H., O.G.A., A.M.S.A., M.A., and R.H.A.-A.; Formal analysis, R.T., T.A.S., E.D., O.G.A., A.M.S.A., M.H.H., M.A., and R.H.A.-A.; Investigation, R.T., E.D., A.M.S.A., M.H.H., M.A., and R.H.A.-A.; Data curation, R.T., T.A.S., E.D., A.M.S.A., M.H.H., M.A., and R.H.A.-A.; Writing—original draft, F.R.A.H., M.H.H., and R.H.A.-A.; Writing—review and editing, F.R.A.H., M.H.H., and R.H.A.-A.; Visualization, F.R.A.H., and O.G.A.; Supervision, R.T., T.A.S., E.D., O.G.A., A.M.S.A., M.H.H., M.A., and R.H.A.-A.; Funding acquisition, T.A.S. All authors have read and agreed to the published version of the manuscript.
Funding
This research received no external funding.
Institutional Review Board Statement
The proposal of this study was reviewed and approved by IRB of Faculty of Medicine, Qena University (code: SVU-MED-PHY003-4-25-4-8, date of approval: 10 February 2022). It was performed in accordance with the 1964 Helsinki declaration and its later amendments or comparable ethical standards.
Informed Consent Statement
Informed written consent was obtained from all individual participants included in the study.
Data Availability Statement
The data are available from the corresponding author upon reasonable request.
Acknowledgments
The Researchers would like to thank the Deanship of Graduate Studies and Scientific Research at Qassim University (www.qu.edu.sa) for financial support (QU-APC-2026).
Conflicts of Interest
The authors declare that they have no competing interests.
Abbreviations
OSA: obstructive sleep apnea, CIH: chronic intermittent hypoxia, SF: sleep fragmentation, IR: insulin resistance, NALD: non-alcoholic fatty liver disease, HIF 1-α: hypoxia inducible factor 1-α, PSG: polysomnography, AHI: apnea-hypopnea index, ODI: the number of desaturation index, HIS: hepatic steatosis index, CAP: controlled attenuation parameter, LSM: liver stiffness measurement, ALT: alanine aminotransferase, AST: aspartate transaminase, FBG: fasting blood glucose, HOMA-IR: homeostatic model assessment for insulin resistance.
References
- Tong, Y.; Xu, S.; Huang, L.; Chen, C. Obesity and insulin resistance: Pathophysiology and treatment. Drug Discov. Today 2022, 27, 822–830. [Google Scholar] [CrossRef] [Scilit] [PubMed]
- Yeghiazarians, Y.; Jneid, H.; Tietjens, J.R.; Redline, S.; Brown, D.L.; El-Sherif, N.; Mehra, R.; Bozkurt, B.; Ndumele, C.E.; Somers, V.K.; et al. Obstructive sleep apnea and cardiovascular disease: A scientific statement from the American Heart Association. Circulation 2021, 144, e56–e67. [Google Scholar] [CrossRef] [Scilit] [PubMed]
- Bin-Hasan, S.; Katz, S.; Nugent, Z.; Nehme, J.; Lu, Z.; Khayat, A.; Al-Saleh, S.; Amin, R.; Narang, I. Prevalence of obstructive sleep apnea among obese toddlers and preschool children. Sleep Breath. 2018, 22, 511–515. [Google Scholar] [PubMed]
- Younossi, Z.M.; Stepanova, M.; Younossi, Y.; Golabi, P.; Mishra, A.; Rafiq, N.; Henry, L. Epidemiology of chronic liver diseases in the USA in the past three decades. Gut 2020, 69, 564–568. [Google Scholar] [PubMed]
- Umbro, I.; Fabiani, V.; Fabiani, M.; Angelico, F.; Del Ben, M. Association between non-alcoholic fatty liver disease and obstructive sleep apnea. World J. Gastroenterol. 2020, 26, 2669–2681. [Google Scholar] [CrossRef] [Scilit] [PubMed]
- Tang, H.; Lv, F.; Zhang, P.; Liu, J.; Mao, J. The impact of obstructive sleep apnea on nonalcoholic fatty liver disease. Front. Endocrinol. 2023, 14, 1254459. [Google Scholar] [CrossRef] [Scilit]
- Lee, J.-Y.; Kim, C.-W.; Lee, K.-C.; Lee, J.-H.; Kang, S.-H.; Li, S.-W.; Kim, K.; Hong, S.-J. Effect of intermittent hypoxia on metabolic syndrome and insulin resistance in the general male population. Medicina 2021, 57, 668. [Google Scholar] [CrossRef] [Scilit] [PubMed]
- Lavalle, S.; Masiello, E.; Iannella, G.; Magliulo, G.; Pace, A.; Lechien, J.R.; Calvo-Henriquez, C.; Cocuzza, S.; Parisi, F.M.; Favier, V.; et al. Unraveling the complexities of oxidative stress and inflammation biomarkers in obstructive sleep apnea syndrome: A comprehensive review. Antioxidants 2024, 14, 425. [Google Scholar] [CrossRef] [Scilit]
- Polat, D.; Pala, E.; Gerçeker, F. HIF-1α: A potential biomarker in obstructive sleep apnea. Int. J. Chem. Technol. 2023, 7, 139–143. [Google Scholar] [CrossRef] [Scilit]
- Xie, H.; Simon, M.C. Oxygen availability and metabolic reprogramming in cancer. J. Biol. Chem. 2017, 292, 16825–16832. [Google Scholar] [CrossRef] [Scilit] [PubMed]
- Berry, R.B.; Brooks, R.; Gamaldo, C.E.; Harding, S.M.; Lloyd, R.M.; Marcus, C.L.; Vaughn, B.V. The AASM Manual for the Scoring of Sleep and Associated Events: Rules, Terminology and Technical Specifications, Version 2.2; American Academy of Sleep Medicine: Darien, IL, USA, 2015; Available online: www.aasm.org (accessed on 22 June 2024).
- Ismael, H.; Tag-Adeen, M.; Abdel-Rady, A.; Shazly, M.; Hussein, A. Non-alcoholic fatty liver disease as a coronary heart disease severity predictor. Int. J. Clin. Med. 2020, 11, 182–192. [Google Scholar] [CrossRef]
- Isokuortti, E.; Zhou, Y.; Peltonen, M.; Bugianesi, E.; Clement, K.; Bonnefont-Rousselot, D.; Lacorte, J.-M.; Gastaldelli, A.; Schuppan, D.; Schattenberg, J.M.; et al. Use of HOMA-IR to diagnose non-alcoholic fatty liver disease: A population-based and inter-laboratory study. Diabetologia 2017, 60, 1873–1882. [Google Scholar] [CrossRef] [Scilit] [PubMed]
- Lv, R.; Liu, X.; Zhang, Y.; Dong, N.; Wang, X.; He, Y.; Yue, H.; Yin, Q. Pathophysiological mechanisms and therapeutic approaches in obstructive sleep apnea syndrome. Signal Transduct. Target. Ther. 2023, 8, 218. [Google Scholar] [CrossRef] [Scilit] [PubMed]
- Luo, Z.; Tian, M.; Yang, G.; Tan, Q.; Chen, Y.; Li, G.; Zhang, Q.; Li, Y.; Wan, P.; Wu, J. Hypoxia signaling in human health and diseases: Implications and prospects for therapeutics. Signal Transduct. Target. Ther. 2022, 7, 218. [Google Scholar] [CrossRef] [Scilit] [PubMed]
- Gabryelska, A.; Szmyd, B.; Szemraj, J.; Stawski, R.; Sochal, M.; Białasiewicz, P. Patients with obstructive sleep apnea present with chronic upregulation of serum HIF-1α protein. J. Clin. Sleep Med. 2020, 16, 1761–1768. [Google Scholar] [CrossRef] [Scilit] [PubMed]
- Suen, C.; Ryan, C.M.; Mubashir, T.; Ayas, N.T.; Abrahamyan, L.; Wong, J.; Mokhlesi, B.; Chung, F. Sleep study and oximetry parameters for predicting postoperative complications in patients with OSA. Chest 2019, 155, 855–867. [Google Scholar] [CrossRef] [Scilit] [PubMed]
- Prabhakar, N.R.; Peng, Y.J.; Nanduri, J. Hypoxia-inducible factors and obstructive sleep apnea. J. Clin. Investig. 2020, 130, 5042–5051. [Google Scholar] [CrossRef] [Scilit] [PubMed]
- Umano, G.R.; Galderisi, A.; Aiello, F.; Martino, M.; Camponesco, O.; Di Sessa, A.; Marzuillo, P.; Alfonso, P.; del Giudice, E.M. Obstructive sleep apnea is associated with impairment of beta-cell response to glucose in children and adolescents with obesity. Int. J. Obes. 2023, 47, 257–262. [Google Scholar] [CrossRef] [Scilit]
- Rodrigues, S.; Bortolotto, L.A.; Beyl, R.A.; Singh, P. Severity of sleep apnea impairs adipose tissue insulin sensitivity in individuals with obesity and newly diagnosed obstructive sleep apnea. Front. Sleep 2023, 2, 1295301. [Google Scholar] [CrossRef] [Scilit] [PubMed]
- Sobczak, A.I.; Blindauer, C.A.; Stewart, A.J. Changes in plasma free fatty acids associated with type 2 diabetes. Nutrients 2019, 11, 2022. [Google Scholar] [CrossRef] [Scilit]
- Zhang, L.; Zhang, X.; Meng, H.; Li, Y.; Han, T.; Wang, C. Obstructive sleep apnea and liver injury in severely obese patients with nonalcoholic fatty liver disease. Sleep Breath. 2020, 24, 1515–1521. [Google Scholar] [CrossRef] [Scilit] [PubMed]
- Wang, L.; Liu, H.; Zhou, L.; Zheng, P.; Li, H.; Zhang, H.; Liu, W. Association of obstructive sleep apnea with nonalcoholic fatty liver disease: Evidence, mechanism, and treatment. Nat. Sci. Sleep 2024, 16, 917–933. [Google Scholar] [CrossRef] [Scilit] [PubMed]
- Taylor, C.T.; Scholz, C.C. The effect of HIF on metabolism and immunity. Nat. Rev. Nephrol. 2022, 18, 573–587. [Google Scholar] [CrossRef] [Scilit] [PubMed]
- Luo, M.; Li, T.; Sang, H. The role of hypoxia-inducible factor 1α in hepatic lipid metabolism. J. Mol. Med. 2023, 101, 487–500. [Google Scholar] [CrossRef] [Scilit] [PubMed]
- Kang, G.S.; Jo, H.J.; Lee, Y.R.; Oh, T.; Park, H.J.; Ahn, G.O. Sensing the oxygen and temperature in adipose tissues—Who’s sensing what? Exp. Mol. Med. 2023, 55, 2300–2307. [Google Scholar] [CrossRef] [Scilit] [PubMed]
- Foglia, B.; Novo, E.; Protopapa, F.; Maggiora, M.; Bocca, C.; Cannito, S.; Parola, M. Hypoxia, hypoxia-inducible factors and liver fibrosis. Cells 2021, 10, 1764. [Google Scholar] [CrossRef] [Scilit] [PubMed]
- Parekh, A. Hypoxic burden—Definitions, pathophysiological concepts, methods of evaluation, and clinical relevance. Curr. Opin. Pulm. Med. 2024, 30, 600–606. [Google Scholar] [CrossRef] [Scilit] [PubMed]
- Kalas, M.A.; Chavez, L.; Leon, M.; Taweesedt, P.T.; Surani, S. Abnormal liver enzymes: A review for clinicians. World J. Hepatol. 2021, 13, 1688–1698. [Google Scholar] [CrossRef] [Scilit] [PubMed]
- Xuan, Y.; Wu, D.; Zhang, Q.; Yu, Z.; Yu, J.; Zhou, D. Elevated ALT/AST ratio as a marker for NAFLD risk and severity: Insights from a cross-sectional analysis in the United States. Front. Endocrinol. 2024, 15, 1457598. [Google Scholar] [CrossRef] [Scilit]

Disclaimer/Publisher’s Note: The statements, opinions and data contained in all publications are solely those of the individual author(s) and contributor(s) and not of MDPI and/or the editor(s). MDPI and/or the editor(s) disclaim responsibility for any injury to people or property resulting from any ideas, methods, instructions or products referred to in the content. |
© 2026 by the authors. Licensee MDPI, Basel, Switzerland. This article is an open access article distributed under the terms and conditions of the Creative Commons Attribution (CC BY) license.