


Abstract
Digestate from anaerobic digestion is rich in recoverable ammonium, phosphorus, and potassium, which are valuable nutrients; however, its high water content poses challenges for storage, transportation, and agricultural use. This study investigated the feasibility of a hybrid membrane separation process to concentrate these nutrients from a synthetic feed solution in the FO process using ammonium sulfate in a draw solution and a commercial CTA membrane, followed by regenerating a dilute draw solution in a subsequent RO process using a commercial TFC membrane. The permeances of K+ and NH4+ in the CTA membrane were in the order of 10−7 m·s−1 and that of PO43− was in the order of 10−9 m·s−1. The corresponding rejections of PO43− and K+ were 99% and at least 70%, respectively. The water permeance of the CTA membrane of approximately 3 × 10⁻⁵ L·m−2·s−1·bar−1 was practically independent of the composition and concentration of the feed solution. The subsequent RO process could not reconcentrate the dilute draw solution to the initial FO value because PO43− and K+ increased the osmotic pressure and were highly rejected by the TFC membrane. However, for a hybrid FO-RO process, recovering the initial osmotic pressure is more important than fully restoring the initial NH4+ concentration.
1. Introduction
Anaerobic digestion (AD) is a sustainable process that supports the circular economy by utilizing organic waste or liquid slurry from upstream processes as feedstock and converting it into renewable energy in the form of biogas and nutrient-rich liquid effluent [1,2,3,4,5,6]. Among AD byproducts, digestate typically accounts for 90–95% of the total influent mass and contains substantial concentrations of ammonium (NH4+), phosphate (PO43−), and potassium (K+) ions, often referred to as N, P, and K [1,7]. The nutrient composition of AD digestate depends on the feedstock type (e.g., animal manure, agricultural residue) [1,8,9]. For example, NH4+, PO43−, and K+ in liquid digestate from animal manure such as Guinea pig manure feedstock have concentrations of 202 ppm, 189 ppm, and 251 ppm, respectively, which are much higher than those in digestate originating from food waste (11.3 ppm, 6.5 ppm, 37.6 ppm) [8,9]. The nutrient content of digestate makes it a suitable alternative to mineral fertilizers [10,11]. The value of digestate as a crop fertilizer or soil amendment is primarily attributed to its NH4+, PO43−, and K+ content. However, the land application of digestate, particularly during periods of low crop nutrient uptake, can increase the risk of N and P losses through leaching into groundwater and surface water resources, raising environmental concerns. Therefore, effective management and recovery of digestate nutrient contents are essential to minimize nutrient losses, address associated environmental concerns, and promote sustainable agricultural applications [12].
Another challenge associated with the use of AD digestate as a fertilizer is its low nutrient-to-volume ratio, mainly because of its high-water content. Digestate often must be transported and stored until it can be applied during an appropriate agricultural season; however, handling and transporting large volumes of diluted digestate can substantially increase storage requirements, transportation costs, and overall management complexity [13]. Therefore, further treatment is often required to reduce its volume and increase nutrient density. Processes such as solid–liquid separation, dewatering, and nutrient concentration can reduce digestate volume while retaining valuable nutrients, enabling more efficient transportation, storage, and subsequent fertilizer application. Consequently, developing efficient processes for digestate dewatering and nutrient concentration has received increasing attention as a means of improving the economic and practical feasibility of AD digestate utilization while promoting nutrient recovery within a circular nutrient management framework [4,14,15,16].
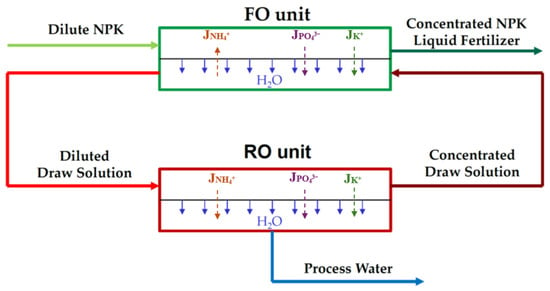
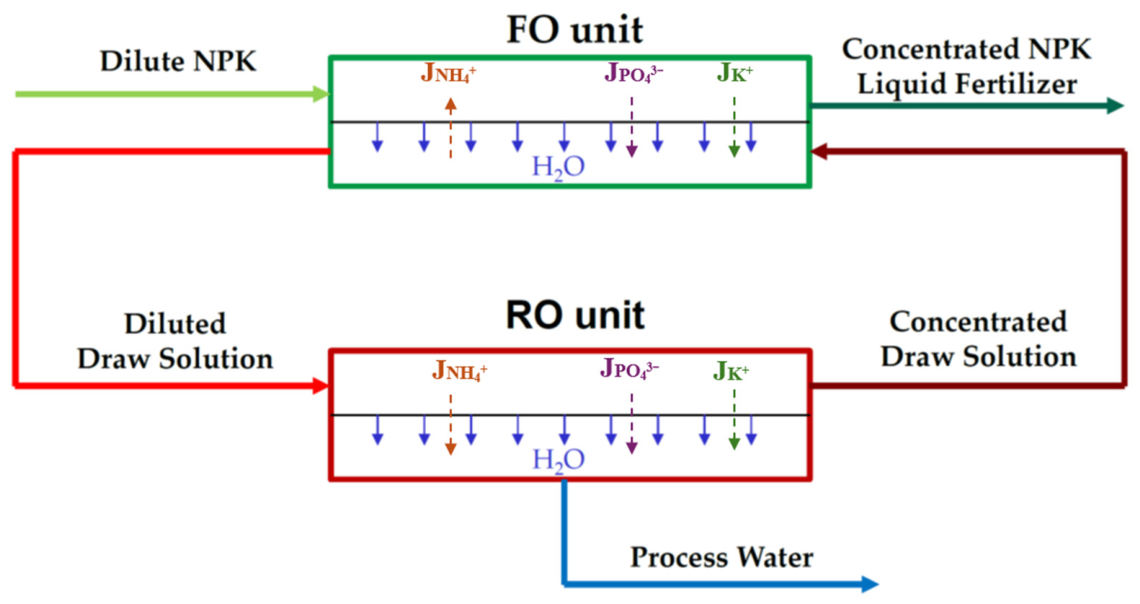
The forward osmosis (FO) process has been studied for recovering and concentrating N, P, and K from various wastewaters used as feed solution (FS), such as municipal sewage [17], municipal wastewater [18], and anaerobic digestate liquid effluent [17,18]. Compared with pressure-driven reverse osmosis (RO) and nanofiltration (NF) membrane separation processes, FO has lower fouling tendencies and higher nutrient-rejection efficiency [19,20]. The choice of draw solution (DS) strongly influences FO performance for nutrient recovery because it determines the osmotic driving force, water flux, reverse solute flux (RSF), and nutrient transport behavior [21,22]. Ideally, a continuous waste stream with sufficiently high osmotic pressure could eliminate the need for DS regeneration while also providing a beneficial use for a difficult-to-dispose waste stream [21,22]. For example, concentrated brine (retentate) from desalination processes contains high concentrations of dissolved salts and, consequently, high osmotic pressure, making it a potentially attractive DS for FO applications [23,24]. At the same time, concentrated brine can be diluted while dewatering nutrient-rich feed streams, allowing its safe disposal [24,25]. However, this approach is geographically constrained because a suitable high-salinity waste stream and the target feed source, such as an agricultural or digestate stream, must be available in proximity. When a high-osmotic-pressure waste stream is unavailable, a synthetic DS must be reconcentrated after the FO process. Figure 1 illustrates an integrated, hybrid FO-RO process in which RO reconcentrates dilute DS and then returns it to the FO unit for recycling and reuse. Unlike direct dewatering of a “dirty” NPK feed stream in the RO unit, which can result in severe and rapid membrane fouling, the process configuration presented in Figure 1 dewaters the relatively clean DS, potentially reducing RO membrane fouling and facilitating DS regeneration [26].
Figure 1.
Schematic representation of the integrated forward osmosis–reverse osmosis (FO–RO) process for NPK nutrient concentration and draw-solution regeneration.
In this context, selecting an appropriate DS requires balancing a sufficiently high osmotic pressure to achieve adequate water flux with minimizing RSF to limit feed-solution contamination while enabling efficient regeneration [27,28]. Researchers have investigated a wide range of DSs for nutrient recovery by FO, including inorganic salts such as NaCl and MgCl2 and organic compounds such as glucose and glycine [29]. NaCl is one of the most widely used DSs because of its high osmotic pressure and thus its ability to generate high water flux; however, its relatively high RSF can adversely affect process performance and feed quality [30]. Multivalent salts such as MgCl2 can reduce RSF while maintaining high osmotic pressure. Almoalimi et al. (2022) investigated NaCl, MgCl2, glucose, and glycine as DSs and reported the highest rejection of NH4+, 98.5–100%, when non-ionic DSs such as glucose and glycine were used [17]. However, the lower osmotic pressures of these DSs resulted in lower water fluxes, highlighting the trade-off between nutrient retention and FO water transport performance [17].
In a previous study, (NH4)2SO4 and NaCl were compared as DSs for FO using a commercial CTA membrane with deionized (DI) water as the FS [31]. (NH4)2SO4 was used as a DS because its RSF, although not desired for maintaining high osmotic pressure, would increase the concentration of NH4+ in the FS. Although NaCl produced slightly higher water fluxes than (NH4)2SO4 at comparable theoretical osmotic pressures, its RSF was substantially higher. Moreover, because of its multivalence, (NH4)2SO4 was rejected better than NaCl in the subsequent RO process using a commercial thin-film composite (TFC) membrane. These findings established (NH4)2SO4 as a promising draw solution for the FO–RO nutrient-recovery process [31]. However, because DI was used as an FS in this study, the concentration of nutrients was not considered.
Only a few studies have systematically evaluated the simultaneous transport and selective retention of NH4+, PO43−, and K+ in synthetic digestate using an ammonium-based draw solution [24,32]. Additionally, they primarily focused on nutrient concentration in the FS. Beyond nutrient concentration, other membrane transport parameters, such as water and solute permeances, are equally essential for understanding FO behavior and predicting water flux under longer and more realistic experimental conditions. Another study considered different NaCl concentrations as DSs, ranging from 0.5 mol L−1 to the concentration of NaCl in actual seawater desalination brine, to dewater different urine sources (fresh urine, stale urine, hydrolyzed urine, and treated urine) by FO using a CTA membrane [24]. They reported that the CTA membrane’s water permeance was practically independent of the feed and draw solutions, ranging from 2.62 × 10⁻⁴ to 2.80 × 10⁻⁴ L m−2 s−1 bar−1. Also, the permeances of NH4+, K+, and PO43−, were relatively constant, with the respective values of 1.0 × 10⁻⁶ m s−1, 2.2 ×10⁻⁷ m s−1, and 4.45 × 10⁻⁸ m s−1. The corresponding RSF and Na+ permeance were not reported [24].
In this study, the transport of NH4+, PO43−, and K+ from a synthetic feed solution through a commercial CTA membrane was investigated using the FO process. Unlike Zhang et al. [24], (NH4)2SO4 was used as DS because its RSF does not “contaminate” the FS [31]. FO experiments were conducted in a closed testing system, with the feed and draw solutions circulated over the membrane for 4 h in short-term tests and 6 days in long-term tests. To better understand the effect of PO43− and K+ on the transport of NH4+, long-term experiments were also performed using DI water as the FS and FS containing only NH4+. The resulting permeances of water and ions in short- and long-term experiments revealed important insights into chemical interactions between NH4+ and PO43−, ion-membrane interactions, and permeation dynamics, which have not been reported elsewhere. Following the long-term FO experiment, the diluted DS was reconcentrated by circulating it over a commercial TFC membrane in continuous RO tests. Similar to the FO experiments, the effects of PO43− and K+ on the TFC membrane’s productivity and NH4+ rejection were investigated by performing continuous RO experiments with a feed solution containing only NH4+ at an initial concentration similar to that in the diluted DS after the long-term FO tests.
This study represents an intermediate step toward investigating real digestate after coagulation–flocculation pretreatment, containing organics, colloids and trace cations. These will undoubtedly alter ion transport, membrane fouling, and scaling behaviour. Nevertheless, the transport parameters obtained in this study will serve as a reference, enabling better assessment of membrane fouling and scaling when using pre-treated real digestate as the feed solution.
2. Materials and Methods
2.1. Materials
The forward osmosis (FO) membrane used in this study was a commercial cellulose triacetate (CTA) membrane (FTSH2 Industries, Inc., Albany, OR, USA). According to the manufacturer, the membrane operates at a maximum temperature of 50 °C, with a minimum transmembrane pressure of 5 psi and a maximum inlet pressure of 75 psi. For draw solution reconcentration, a commercial thin-film composite (TFC) reverse osmosis (RO) membrane, ACM4 (TriSep Industries, Inc., Goleta, CA, USA), was used. This membrane comprises an active polyamide (PA) layer supported by a polysulfone (PS) layer and a polyethylene terephthalate (PET) nonwoven backing. The manufacturer reports 99.2% NaCl rejection and a water flux of 30 gfd at 150 psi.
Analytical-grade ammonium sulfate (NH4)2SO4 (≥98% purity), purchased from Thermo Fisher Scientific (Waltham, MA, USA), was used to prepare the draw solute in FO experiments and as the feed in RO experiments. Multi-solute feed solutions were prepared using analytical-grade ammonium sulfate, potassium dihydrogen phosphate (KH2PO4), and potassium chloride (KCl) purchased from Thermo Fisher Scientific, USA, with ≥98% purity. Deionized (DI) water was used for solution preparation, as a control feed in selected FO runs, and to clean the systems before and between experiments.
NH4+, K+, and PO43− concentrations in multi-solute FO and RO experiments were determined using test kits manufactured by Hach Company (Loveland, CO, USA). NH4+ was measured using the TNTplus 832 Ammonia Vial Test (measurement range: 2–47 mg/L NH3–N), while total phosphate was analyzed using the TNTplus 843 Phosphorus Vial Test (0.15–4.50 mg/L PO43−). We determined potassium concentrations using the Potassium Reagent 2459100-CA kit from Hach Company (Loveland, CO, USA).
2.2. Forward Osmosis Experiments and Analysis
FO tests were conducted in a laboratory-scale forward osmosis (FO) system, as described in detail in another study [33]. Briefly, the system used a Teflon crossflow membrane cell (CF016D-FO Cell, Sterlitech, Auburn, WA, USA) with an effective area of 20.6 cm2 and a hold-up volume of 13.0 cm3. The feed and draw solutions were circulated independently using identical centrifugal pumps (TE-3-MD-HC, Little Giant Pump Company, Oklahoma City, OK, USA), maintaining circulation rates of 2.4 L min−1 on both sides. The system temperature was maintained at 21.5 ± 0.5 °C using heat exchangers connected to an isothermal bath circulator (Thermo Fisher Scientific, Waltham, MA, USA). The masses of the feed and draw solution containers were monitored on a continuous basis, and the feed conductivity and temperature were monitored using two identical high-resolution balances (6202-1S, Entris Precision, Sartorius AG, Göttingen, Germany) and a benchtop conductivity/temperature meter installed in the feed tank, respectively. These instruments were interfaced with a computer, and LabVIEW recorded data every 5 s.
The CTA membranes were tested in short-term (4-h) and long-term (6-day) experiments in the active-layer-feed-solution orientation. We conducted the short-term tests using three concentrations of the synthetic multi-ion feed solution: C0, 2C0, and 4C0. The NPK C0 solution was prepared by dissolving 2.93 g of (NH4)2SO4, 0.054 g of K2HPO4, and 3.31 g of KCl in 800 mL of DI water to obtain the following concentrations of ions: 1000 ppm NH4+, 37 ppm PO43−, and 2200 ppm K+. The initial and final pH of the C0 solution were approximately 5.33 and 5.39, respectively. These ion concentrations represent typical values for an anaerobic liquid digestate coming from agricultural feedstocks, particularly dairy manure and corn silage. The corresponding draw solution was a 0.5 mol L−1 (~18,000 ppm) aqueous (NH4)2SO4 solution. We determined the draw solute and its concentration in our previous study [31]. To mimic concentrated nutrients in the feed, we doubled (2C0) and quadrupled (4C0) the concentrations of the respective ions while keeping the ammonium sulfate concentration in the draw solution at 0.5 mol L−1. Before the experiments with the synthetic multi-solute feed solutions, the membranes were tested with DI water as the feed solution and a 0.5 mol L−1 ammonium sulfate draw solution to establish the reference performance, i.e., water flux (Jw) and permeance (A), and the reverse solute flux (Js) and permeance (B) of CTA membranes. For each synthetic feed concentration, we tested at least three coupons, and after each experiment, we installed a new coupon in the membrane cell.
The long-term FO experiments were conducted for 6 days using three feed solutions: DI water, an ammonium sulfate solution, and a multi-solute C0 solution. The concentrations of NH4+, PO43−, and K+ in the feed solution were the same as those in the short-term tests corresponding to C0. The concentration of NH4+ in the feed solution in the single-ion tests was the same as in the multi-ion tests, i.e., 1000 mg L−1. In each test, we used a fresh CTA membrane coupon. In all long-term tests, the initial concentration of (NH4)2SO4 in DS was 0.5 mol L−1.
We evaluated water flux from the change in draw-solution mass over time (dmw/dt) and, as previously stated, continuously monitored the masses of the draw and feed solutions.
where Am is the area of the membrane (16 cm2) and ρ is the water density. Because the driving force decreased in the long-term experiments, Jw decreased accordingly. To capture time-dependent behavior, we used a moving-window approach: we performed a linear regression of dmw/dt over a predetermined time window and assigned the corresponding Jw to the middle of that window.
In experiments with DI and (NH4)2SO4, we determined reverse solute flux from continuous conductivity monitoring in the feed solution container.
where ms is a time-dependent mass of the draw solute in the feed solution. In turn, ms was evaluated from:
cs and VF represent the time-dependent concentration of the draw solute in the feed solution and the volume of the feed solution, respectively. We evaluated cs from the feed solution’s measured conductivity, while we calculated VF from its measured mass.
In multi-solute FO experiments, although the feed solution conductivity was continuously monitored, the cs required to evaluate ms and, thus, Js was determined using spectrophotometric methods with commercially available Hach test kits (Loveland, CO, USA) according to the manufacturer’s protocols. All measurements were conducted using a UV–Vis spectrophotometer (DR 6000, Hach Company, Loveland, CO, USA) in accordance with standard colorimetric methods. Samples were filtered (if applicable) and diluted as needed to keep concentrations within the respective calibration ranges. Method detection limits were defined by the lower bounds of each kit’s measurement range. All analyses were performed in duplicate, and the average values are reported. The relative standard deviation between replicates was maintained between 5 and 10%, ensuring good analytical precision. Quality control was maintained through periodic calibration checks and blank measurements. No significant interference was observed under the tested conditions. In the short-term 4-h tests, samples for the test kits were taken before and after the experiment. In the long-term 6-day tests, the samples for analysis were taken before, in the middle (i.e., after 3 days), and after the test.
Js in multi-ion tests was also determined from Equation (2); however, the required ms was evaluated using the appropriate mass balance at the feed or the draw side of the membrane.
where c is the ion concentration determined using the appropriate test kit, and V is the solution volume determined from the total mass of the container. The subscripts D and F refer to the draw and feed side, respectively, and the subscripts i and f to the initial and final state. Since ms from Equation (4) is the total mass of the ion transferred over the time between the initial and final state, the resulting Js represents the average ion flux over the corresponding time between the initial and final state. For the short-term tests, the time was 4 h; for the long-term tests, approximately 3 days.
In addition to determining Jw and Js in multi-solvent tests, the average rejections (R) of K+ and PO43− by the CTA membrane over the appropriate time were also evaluated from:
where cf is the average concentration of the ion in the feed solution, and cp is the average concentration of the ion in the permeate (i.e., the draw solution) based on ms evaluated from Equation (4):
The effect of ions on the transport properties of the CTA membrane in FO experiments was assessed based on the comparison of water permeance (A) and ion permeance (B) determined from:
where Δπi and Δci are the average osmotic and concentration gradients of i during the experiment. The osmotic pressure of i was evaluated using van’t Hoff’s equation:
where i is the number of ions the solute dissociates into, ci is the molar solute concentration, R is the universal gas constant, and T is the absolute temperature. For an ion, i is always unity, and the ion concentration is obtained by multiplying the solute concentration by the number of ions resulting from the complete dissociation of the solute.
2.3. Reverse Osmosis Experiments and Analysis
Reverse osmosis (RO) experiments were conducted to evaluate the reconcentration of (NH4)2SO4 from a diluted draw solution using a crossflow system adapted from Carter et al. [34]. More details about the system are described elsewhere [31]. Briefly, the system included three membrane cells (each with an effective permeation area of 12.6 cm2) operated in parallel. Individual cells could be isolated without disrupting system operation by adjusting the corresponding valves. The system design enabled independent control of feed flow rate and pressure via a bypass line equipped with flow-control valves. Prior to each experiment, the system was operated in bypass mode to reach thermal equilibrium (28.5 ± 1 °C) and ensure proper mixing. The experiments were performed at a feed pressure of 30 bars, with a corresponding crossflow of 3.5 L/min. Permeate from each membrane cell was continuously removed from the system to observe solute reconcentration in the feed solution. The water flux was measured periodically by collecting a fixed volume of permeate (at least 8 mL) and recording the collection time; Jw was then evaluated using Equation (1). The collected samples were analyzed to determine solute concentration in the permeate (cp). At the same time, a sample was also taken from the feed tank to determine the corresponding solute concentration in the feed (cf). Knowing cp and the corresponding cf allowed monitoring of solute rejection over the course of the experiment using Equation (6).
The RO experiments were performed with an initial (NH4)2SO4 concentration of 0.3 mol L−1 in the feed solution, which approximately corresponds to the concentration in the diluted draw solution at the end of six-day continuous FO tests. In addition, in some experiments, we added appropriate amounts of KH2PO4 and KCl to match the concentrations of the respective ions (0.3 ppm PO43− and 397 ppm K+), corresponding to those in the diluted draw solution at the end of six-day FO tests with NPK. The initial feed volume was 14 L, and the RO experiments ran until the feed volume decreased to about 7 L, which took more than 24 h. In experiments in which (NH4)2SO4 was the only solute, its concentration in the feed and permeate samples was determined from conductivity measurements. When KH2PO4 and KCl were also present, we determined the concentrations of NH4+, K+, and PO43− using the appropriate test kits.
3. Results and Discussion
3.1. Basic Characterization of CTA Membrane in FO Experiments
The water (A) and ammonium sulfate (B) permeances of CTA membranes were determined from FO tests in the active-layer-feed-solution orientation using 0.5 mol L−1 (NH4)SO4 in water as the draw solution and DI water as the feed solution. First, we evaluated the water flux and reverse solute flux using Equations (1) and (2), respectively, and the determined Jw and Js were then used to evaluate A and B using Equations (7) and (8), respectively. Using five different coupons from the CTA membrane sheet, the following averages were determined: A = 2.32 × 10⁻⁵ ± 2.69 × 10⁻⁶ L m−2 s−1 bar−1 and B = 6.59 × 10⁻¹⁰ ± 9.63 × 10⁻¹¹ m s−1. Interestingly, in our previous study, CTA membranes procured from the same manufacturer were much more permeable, with corresponding values of A = 1.37 × 10⁻⁴ [L m−2 s−1 bar−1] and B = 5.40 × 10⁻⁹ m s−1 [31]. In other words, the new batch of CTA membranes had water permeance nearly six times lower and solute permeance more than eight times lower than the old batch. The membrane manufacturer verified these differences, confirming that a different fabrication protocol yielded less permeable but more stable and repeatable membranes.
3.2. Multi-Ion Feed Solution Experiments
The CTA membranes were also tested with multi-ion feed solutions in short-term (4-h) and long-term (6-day) experiments. In the short-term experiments, we varied the feed-solution concentration. As noted above, the CTA membranes were not very permeable; therefore, we assumed the feed- and draw-side concentrations were constant, approximating steady-state conditions. In contrast, in the long-term experiments, in which feed and draw solutions were continuously circulated on opposite sides of the membrane, their composition and concentration continued to change over time.
3.2.1. Short-Term FO Experiments
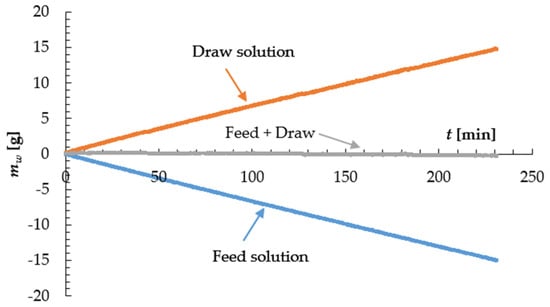
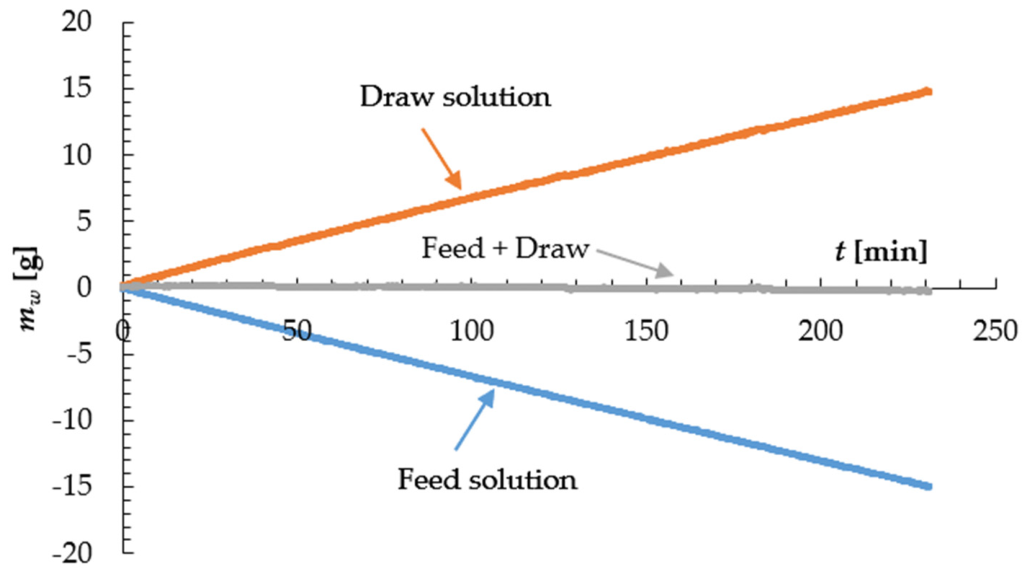
After thorough in situ cleaning of the membranes following experiments with DI as the feed solution, the membranes were retested with multi-ion feed solutions at three initial NPK concentrations: C0, 2C0, and 4C0. For each feed-solution concentration, we used a new CTA membrane. Figure 2 shows the progress of the experiment using the C0 feed solution, with normalized feed and draw solution masses plotted over time.
Figure 2.
Example of the progress of a short-term, multi-ion (NPK) feed solution FO experiment using the CTA membrane. The experiment was performed with the C0 feed solution.
The mass of the draw and feed solutions changes linearly with time from the start of the experiment, indicating an instantaneous steady state. The total mass of the normalized draw and feed solutions is zero, as expected. The average rate of water transfer across the membrane during the entire experiment in Figure 2 is dmw/dt = 0.0654 [g min−1]. Therefore, the corresponding water flux from Equation (1) and water permeance from Equation (7) for the experiment in Figure 2 are Jw = 2.54 × 10⁻⁴ [L m−2 s−1] and A = 3.69 × 10⁻⁵ [L m−2 s−1 bar−1].
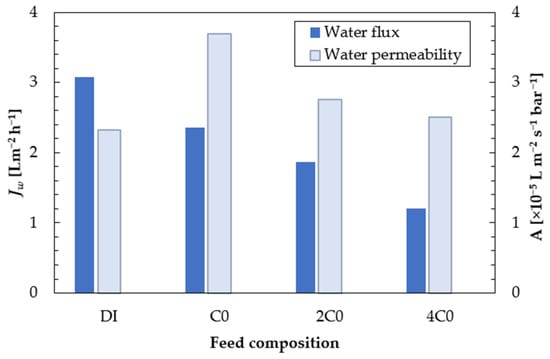
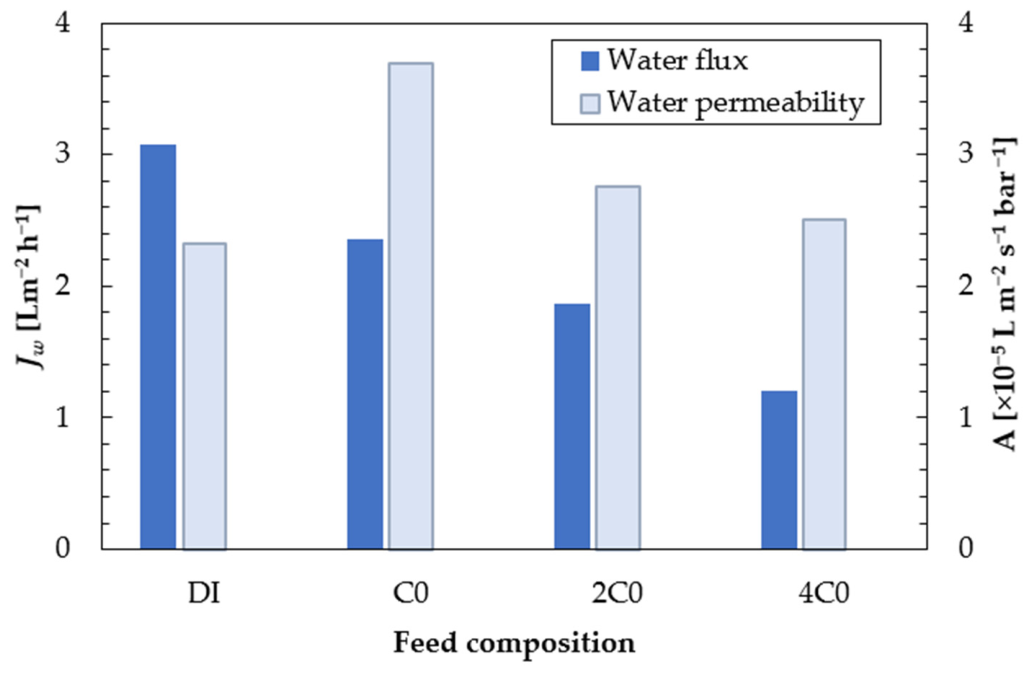
Figure 3 summarizes Jw and the corresponding A for C0 and other feed solution concentrations (2C0 and 4C0), plus DI as the reference feed solution.
Figure 3.
The effect of the feed concentration (C0, 2C0, 4C0) on the water flux (Jw) and water permeance (A) of CTA membranes in short-term, multi-ion (NPK) feed solution tests. For comparison, we also included an experiment with deionized water as the feed solution (DI).
As the ion concentration in the feed solution increases, the water flux decreases. This is because the osmotic pressure gradient, i.e., the driving force for water transport, decreases. Interestingly, despite the largest Jw for the DI feed solution, the corresponding A was smaller than in experiments with multi-ion feed solutions. To calculate A, we assumed the applicability of van’t Hoff’s equation, which does not account for the interactions between different ions in the solution. If we assume that A is independent of the composition and concentration of the feed solution, the fact that A for C0 is greater than for DI suggests that the simple van’t Hoff equation might underestimate the osmotic pressure of the multi-ion feed solution. Moreover, as the ion concentration in the feed solution increases from C0 to 4C0, not only does Jw decrease, as expected, but also the corresponding A decreases. Again, if A were constant, i.e., independent of the osmotic pressure gradient, it would indicate that doubling the ion concentration does not quite double the corresponding osmotic pressure. Nevertheless, despite the variation in A when using a simple van’t Hoff equation, the differences in A depicted in Figure 3 are not significant, ranging from 2.32 × 10⁻⁵ to 3.69 × 10⁻⁵ L m−2 s−1 bar−1, and as such, for modelling the concentration of nutrients in the feed solution by the CTA membrane, one could use an average value for A of approximately 3 × 10⁻⁵ L m−2 s−1 bar−1.
Regardless of feed solution concentration, the draw solution initially contained no PO43− or K+, and the amounts of these ions that crossed the CTA membrane were too small to detect with the test kits, even after the 4-h experiments. Therefore, we performed the mass balance to determine ms, Js, and ultimately B for these ions only on the feed side, or more generally on the high concentration side of the membrane. For NH4+, the high-concentration side was the draw side of the membrane. Unlike PO43− and K+, the concentration of NH4+ at the low-concentration, i.e., the feed side of the membrane was not zero, and we could perform the mass balance for the determination of its B at both sides of the membrane. Table 1 summarizes apparent ion permeances from the short-term experiments, based on the respective mass balances at the high-concentration side of the membrane. In addition, the initial and final concentrations of the ions used to evaluate B are also provided. Ion permeance values obtained from the 4 h FO experiments are apparent values affected by transient operating conditions and should not be used directly for process simulation. The 6-day experiments were conducted to obtain more reliable estimates of ion permeance under long-term operating conditions.
Table 1.
Summary of apparent ion permeances for different NPK concentrations in the feed solution, based on the initial and final ion concentrations at the high-concentration side of the membrane from 4-h experiments *.
The concentration of NH4+ at the draw side decreased during the 4-h experiment, as expected, because water transport from the feed side diluted the draw solution and NH4+ permeated to the feed side. However, the corresponding B was 4 orders of magnitude greater than that determined experimentally with DI as the feed solution, in which the increase in feed solution conductivity assessed the mass of NH4+ that crossed the membrane. Determining ion permeance based on mass balance at the high-concentration side assumes the system is at steady state, or, more precisely, pseudo-steady state. According to Figure 2, the water transfer was at steady state right from the start of the experiment.
Assuming the solution-diffusion mechanism for ion transport, ions are first sorbed at the high-concentration side, then diffuse across the membrane and desorb at the low-concentration side [35,36,37]. Initially, the CTA membrane was ion-free, so once the experiment began, it acted as a “sponge” and absorbed ions. Relying on ion mass balance on the high-concentration side is equivalent to monitoring pressure decay in time-lag experiments, which overestimates the resulting B under transient conditions [38].
Although not reported in Table 1, the initial and final concentrations of NH4+ on the low-concentration side (i.e., the feed side of the membrane) were also measured. For the 2C0 and 4C0 experiments, the NH4+ concentration decreased over the 4-h experiment, likely due to “consumption” of the ions by the initially ion-free CTA membrane. NH4+ ions are known to have a strong affinity for CTA membranes, much stronger than, for example, that of TFC membranes [39]. In other words, it appears that because of the very slow dynamics of NH4+ transport and its strong affinity towards the CTA membrane, the 4-h experiments are too short to determine the reliable permeance of this ion.
Considering the concentrations of PO43− and K+ at the high-concentration side of the membrane in Table 1, similar to NH4+, they decreased during the experiment, which at first may appear surprising. On the one hand, because of the concentration gradient, these ions are transported from the feed to the draw side. On the other hand, water was also transferred in the same direction. The concentration of nutrients in the feed solution requires the rate of water transfer to be much greater than the rate of ion transfer across the membrane, yet Table 1 indicates the opposite. In addition, a decrease in the concentration of PO43− and K+ during the 4-h experiment implies negative rejection of these ions by the CTA membrane. These unexpected results can also be explained by transient permeation during the 4-h experiment.
An important question arises: why does water transfer appear to reach a steady state immediately after the FO experiment begins, whereas ion transfer does not reach steady state even after four hours? First, the system might be in a pseudo-steady state after 4 h. However, because we measured ion concentrations only before and after the test, the results reflect a highly transient period immediately after the experiment began. We cannot determine whether the system reached pseudo-steady state during the 4-h experiment. Secondly, water transport is driven by the osmotic pressure gradient, which is determined by the total ion concentration gradient. Despite variation in individual ion concentrations, the major contributor to the osmotic pressure gradient in all experiments was the concentration of (NH4)2SO4 on the draw side, which remained relatively constant during the short-term experiments.
Although short-term experiments cannot reliably determine ion permeances, they showed that nutrients in the feed solution could be concentrated several times, as indicated by a reasonable water flux observed using 4C0 feed solution.
3.2.2. Long-Term FO Experiments
To test the hypothesis of slow ion-transport dynamics, which prevents estimation of meaningful ion permeances, we performed 6-day experiments and collected samples at the midpoint (i.e., after 3 days). As in the short-term experiments, the transient period after experiment initiation would influence the results during the first three days. However, because the time scale is much longer (3 days versus 4 h), this influence should be minimized. In principle, we could take samples from the feed and draw solutions more frequently, thereby enabling a better understanding of ion permeation dynamics. However, sampling the system caused a significant performance disturbance because it was closed, i.e., the feed and draw solutions circulated on opposite sides of the membrane. Also, the main objective was to determine reliable ion permeance values for future steady-state modelling of the FO process to concentrate nutrients in the feed solution.
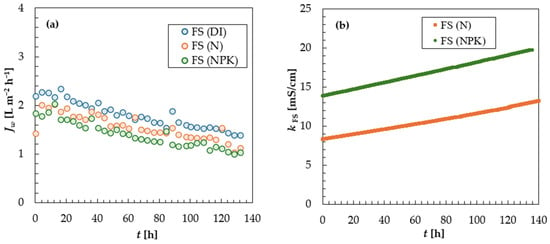
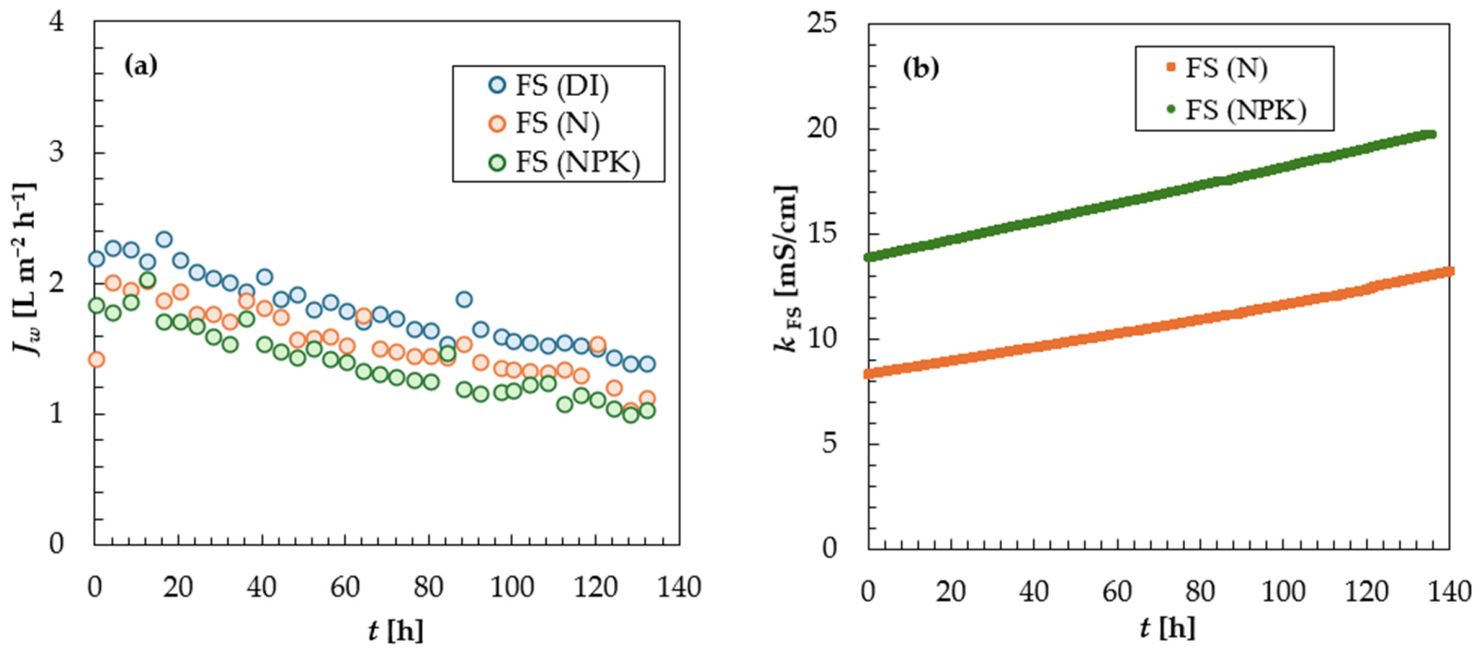
Figure 4 shows the progress of a long-term experiment using three different feed solutions: DI water, single-solute, and multi-solute. The change in the water flux and the feed solution conductivity are presented in Figure 4a,b, respectively. We used the same membrane for all experiments shown in Figure 4 and thoroughly cleaned it in situ before each experiment. The initial concentration of NH4+ in the single- and multi-solute feed solutions was approximately 1000 ppm, the same as C0 in the short-term experiments. The initial concentrations of the other solutes in multi-solute feed solution experiments also corresponded to C0 from the short-term experiments. In all experiments, the initial concentration of (NH4)2SO4 in the draw solution was also the same, 0.5 mol L−1.
Figure 4.
Example of the progress of a long-term FO experiment with a CTA membrane (active layer facing the feed solution)—water flux (a); feed solution conductivity (b)—using three different feed solutions: DI, single solute (N), and multi-solute (NPK).
As shown in Figure 4a, regardless of the feed solution, water flux decreases over time due to dewatering (i.e., increased solute concentration), thereby reducing the driving force for water transport. At any given time, Jw was highest in the experiment with DI as a feed solution, followed by the single-solute and the multi-solute feed solutions. However, towards the end of the experiments, the water fluxes in the single- and multi-solute experiments appear to converge. The observed order of Jw was expected because adding solutes to the feed solution increases its osmotic pressure, as shown by higher initial feed-solution conductivity (13.9 mS/cm vs. 8.4 mS/cm; Figure 4b), thereby reducing the driving force for water transport. The concentration of nutrients was confirmed by an increase in the feed solution conductivity (Figure 4b). The magnitude of the conductivity increase was greater in the multi-solute than in the single-solute experiments (5.9 mS/cm versus 4.4 mS/cm). However, the relative conductivity increase was greater in the single-solute than in the multi-solute feed solution experiment (58% versus 42%).
Although not reported in Figure 4, the corresponding water permeance, based on monitoring the conductivity of the feed solution, oscillated between 2.3 × 10⁻⁵ and 3.5 × 10⁻⁵ L m−2 s−1 bar−1 in experiments with DI and single-solute feed solutions. A could not be determined for the experiment using a multi-solute feed solution from the conductivity measurements. However, given that Jw was smaller and the initial feed solution conductivity was greater than in the other experiments, the corresponding A must be in a similar range. This range is consistent with an average A = 3.0 × 10⁻⁵ L m−2 s−1 bar−1, confirming relatively constant water permeance of the CTA membranes regardless of the feed solution [23].
Table 2 presents the average ion concentrations from four independent experiments before, in the middle (i.e., after 3 days), and at the end (after 6 days). The three days were sufficient for the concentrations of K+ and PO43− on the draw side to fall within the detectable range of their respective test kits. Unlike the short-term experiments, ion concentrations increased as expected, and the corresponding increases after 3 and 6 days are also included.
Table 2.
Average and relative standard deviations (RSD) of nutrient (ion) concentrations in the feed solution in long-term FO experiments with single- and multi-ion feed solutions at different times, along with the corresponding concentration increases.
The largest ion concentration was observed for NH4+ in the single solute system, i.e., when only (NH4)2SO4 was present on both sides of the membrane. However, when PO43− and K+ were added to the feed solution, the concentration increase after 6 days dropped sharply from 117% to 33%. This suggests a decrease in the CTA membrane permeance for NH4+ in the presence of these ions. From a practical point of view, this is highly desirable because reduced transport of NH4+ from the draw to the feed solution slows the rate of decrease in the driving force for water transport, allowing greater increases in the concentration of the other ions in the feed solution.
For multi-solute feed solutions, the concentration increase after 6 days, ranging from 25% to 36%, was smaller than the corresponding increase in feed solution conductivity by 42% in Figure 4b. The concentration increase of the multivalent PO43− at a given time was expected to be greater than that of the monovalent K+, because the CTA membrane should more effectively reject the former. Also, the PO43− and K+ concentration increases in the first 3 days were greater than in the last three days of the experiments. Again, this could be expected because the ion concentration gradient decreased over time. However, the NH4+ results might at first appear surprising. The concentration gradient for NH4+ was much greater than for other ions. Consequently, its concentration in the feed should increase not only due to dewatering, but also due to the transport of NH4+ from the draw to the feed solution. On the other hand, this result is qualitatively consistent with a decrease in NH4+ permeance in the presence of PO43− and K+. It should also be mentioned that, unlike PO43− and K+, the increase in NH4+ concentration was greater in the last three days of the experiment than in the first three days, despite a decrease in the driving force for the transport of this ion.
The ion concentrations in the feed and draw solutions, summarized in Table 2, combined with the mass of the feed and draw solutions monitored in real time, enabled tracking of each ion’s mass over time and, consequently, any potential mass losses. The results of this analysis are summarized in Table 3.
Table 3.
Example of monitoring ion mass in long-term FO experiments with single- and multi-ion feed solutions at different times, along with corresponding mass losses.
The experiments show a clear loss of NH4+ mass. However, this mass loss appears to be greater in the presence of PO43− and K+ in the feed solution. Our testing system, including the feed and draw solution containers, was airtight, so the mass loss cannot be attributed to NH3 gas leaving the system. Before discussing the possible reasons for the observed NH4+ mass loss, it is also important to note some PO43− mass loss, which, although significantly smaller in absolute value, was comparable on a relative basis. At the same time, there appears to be no K+ mass loss. After 3 days, the apparent mass of K+ slightly increased, which is physically impossible; therefore, Table 3 does not report values for this ion after 3 days. Over the 6 days, there was some K+ loss, but it is within the test kit’s experimental error. Interestingly, the mass losses during the last three days for both NH4+ and PO43− were greater than in the first three days of the experiment.
Visually, we have observed some white/yellow solids in the tubes, particularly on the feed side toward the end of the experiments with the multi-ion feed solution. On the other hand, we did not observe any deposition of solids in the experiments when only (NH4)2SO4 was present on both sides of the membrane. This may suggest that (NH4)2SO4 and KH2PO4 participate in a chemical reaction that forms white/yellow solids. Scaling in fertilizer-drawn FO systems containing Ca2+ and Mg2+ is well known [40,41,42]. However, these ions should not be present in our system because we used DI water to clean the system and prepare all feed and draw solutions. Phuntsho et al. reported significant FO scaling attributed to diammonium phosphate, even in the absence of Ca2+ and Mg2+ [42]. In general, the literature suggests that phosphate-containing fertilizer chemistry, with ammonia as the main component, can cause scaling in FO [41,42,43]. However, in our experiments, the observed scaling did not significantly affect the water flux. As shown in Figure 4a, Jw decreased over time, but this decrease was attributed to a decline in the osmotic pressure gradient, as supported by a relatively constant water permeance.
In addition to scaling, it is possible that much greater NH4+ mass loss than PO43− arises from ion adsorption by the membrane. As previously noted, the NH4+ ions are known to have a strong affinity to CTA membranes, much stronger than, for example, to TFC membranes [39]. Similar to NH4+ consumed by a chemical reaction, adsorbed NH4+ would not be detected in samples from the feed and draw solutions. The possibility of NH4+ adsorption by the CTA membrane is supported by its mass loss in single-solute experiments, when chemical reaction was not possible. Moreover, differences in NH4+ mass loss between feed solutions with and without other ions may indicate how the lost NH4+ is distributed between chemical reaction and adsorption. However, the current experimental setup did not allow us to quantitatively distinguish NH4+ mass loss due to adsorption from chemical reaction leading to precipitation.
The measured ion concentrations in the feed and draw solutions before, during, and at the end of long-term tests enabled determination of the average ion permeances for the first and last three days of the experiments. We determined the mass of the transferred ion using mass balances at the feed and draw sides. For NH4+, the ion concentration at the draw side was greater than at the feed side. For PO43− and K+, the situation was the opposite: the ion concentration at the feed side was greater than at the draw side. Table 4 summarizes the average ion permeances from four CTA membranes in the first three and the last three days of the experiments based on the mass balances at the draw side and the feed side of the membrane for the single- and multi-solute experiments. In addition, PO43− and K+ ion rejections are also provided.
Table 4.
Summary of average and RDS of ion permeances from four CTA membranes on the first three and last three days of long-term FO experiments, based on mass balances at the feed and draw sides, along with the rejections of PO43− and K+. The initial composition of the NPK feed solution: 1000 ppm of NH4+ (the same as in the N feed solution), 37 ppm of PO43−, and 2200 ppm of K+.
Comparing the permeances from the first three days, evaluated from the mass balance at the high-concentration side of the membrane in Table 4, with the corresponding permeances from the short-term experiments in Table 1 shows a decrease of 1–2 orders of magnitude. This was expected because the highly transient period immediately after starting the experiments, attributed to the overestimation of B values in Table 1, should be greatly reduced after three days of the experiment. Using the same argument, the permeances from the last three days of the experiment, evaluated from the mass balance at the high-concentration side of the membrane, should be even smaller than those from the first three days. However, Table 4 does not show this, suggesting that other phenomena, in addition to permeation dynamics, affect permeances.
Considering the permeances evaluated from the mass balance at the low-concentration side of the membrane (FS for NH4+ and DS for PO43− and K+), except for K+, they are significantly lower than those based on the mass balance at the high- concentration side of the membrane, regardless of the time frame. This result is consistent with the suspected chemical reaction (NH4+ and PO43−) and adsorption (NH4+), which are more pronounced on the high-concentration side of the membrane and lead to an overestimation of these ions’ permeance. It should be emphasized that chemical reactions (NH4+ and PO43−) and adsorption (NH4+) at the low-concentration side of the membrane would lead to an underestimation of the permeance of these ions based on the mass balance. However, this underestimation at the low-concentration side should not be as significant as the overestimation at the high-concentration side of the membrane. The situation is further complicated because the high-concentration side for NH4+ is the draw solution, whereas for PO43−, it is the feed solution. To add to the complexity of evaluating NH4+ and PO43− permeances, adsorption of NH4+ should be most prominent at the beginning of the experiments. In contrast, based on visual observation of forming while/yellow solids inside the tubes, the chemical reaction was more prominent towards the end of the process.
Table 4 quantifies the previously suggested effect of PO43− and K+ on reducing NH4+ permeance in the CTA membrane. The reduction in permeance relative to the single-solute feed solution ranges from 1.5 to 3, depending on the side used for mass balance and the experimental time frame.
Given the complexity of ion permeation in a multi-solute feed solution associated with adsorption of NH4+ by the CTA membrane and chemical reaction involving NH4+ and PO43−, it is not possible to provide single values for the permeance of the three ions of interest. Nevertheless, the following ranges appear close to intrinsic ion permeances. For NH4+, B appears to be between 1.3 × 10⁻⁷ and 4.2 × 10⁻⁷ m·s. This range excludes B based on the mass balance at the feed side during the first 3 days of the experiment, which was significantly below the above range. For PO43−, B appears to be between 7.2 × 10⁻⁹ and 7.5 × 10⁻⁹ m s−1, which excludes significantly greater permeances based on the mass balance at the feed side, which were likely overestimated because of PO43− participation in the reaction responsible for the observed scaling. The corresponding rejection of PO43− by the CTA membrane is close to 99%, which is the consequence of very small B. It is important to emphasize that the permeances of PO43− and NH4+ differ by nearly two orders of magnitude, which is not surprising given the multivalency of the former ion. For K+, B appears to be between 1.4 × 10⁻⁷ and 2.4 × 10⁻⁷ m s−1, which is comparable to the range of B for the monovalent NH4+. As K+ does not participate in the scaling reaction and is not strongly adsorbed by the CTA membranes, this range covers all the permeance values for this ion listed in Table 4. The corresponding K+ rejection by the CTA membrane ranges from 70% to 85%. To the best of our knowledge, the literature has not reported B values for NH4+, K+, and PO43− in CTA membranes using (NH4)2SO4 as a draw solute. However, compared to the study that used NaCl as a draw solute, the above ion permeances are significantly lower, except for K+, which is comparable [24].
3.3. Reconcentration of Dilute Draw Solution Using RO Process
Long-term FO experiments resulted in nutrient concentration in the multi-solute feed solution (Table 2). At the same time, dewatering of the feed solution diluted the draw solution. The average composition of the draw solution at the end of the 6-day tests was 9000 ppm NH4+, 0.3 ppm PO43−, and 397 ppm K+. The much lower PO43− concentration than K+ results from its lower concentration in the initial feed solution and the CTA membrane’s very high rejection of PO43−. The objective of the RO experiments was to demonstrate the possibility of reconcentrating NH4+ to its initial concentration of 18,000 ppm, corresponding to 0.5 mol L−1 of (NH4)2SO4 in the draw solution. According to van’t Hoff’s equation, the osmotic pressure of 0.5 mol L−1 of (NH4)2SO4 is approximately 36 bar. However, in our previous study, we showed that the experimentally determined osmotic pressure of 0.5 mol L−1 (NH4)2SO4 was approximately 26 bar. Therefore, we performed the RO experiments at a feed pressure of 30 bar to ensure non-negligible water flux even when the desired initial concentration of (NH4)2SO4 was reached. To study the effects of PO43− and K+ ions on the diluted draw solution concentration, the test was also performed using a feed solution containing only (NH4)2SO4, with an initial NH4+ concentration of 9000 ppm, corresponding to a 0.25 mol L−1 concentration of (NH4)2SO4.
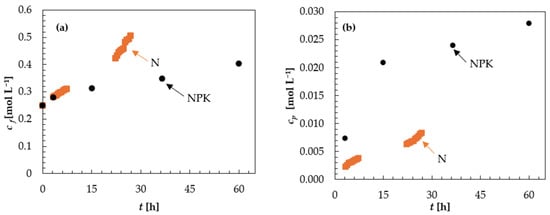
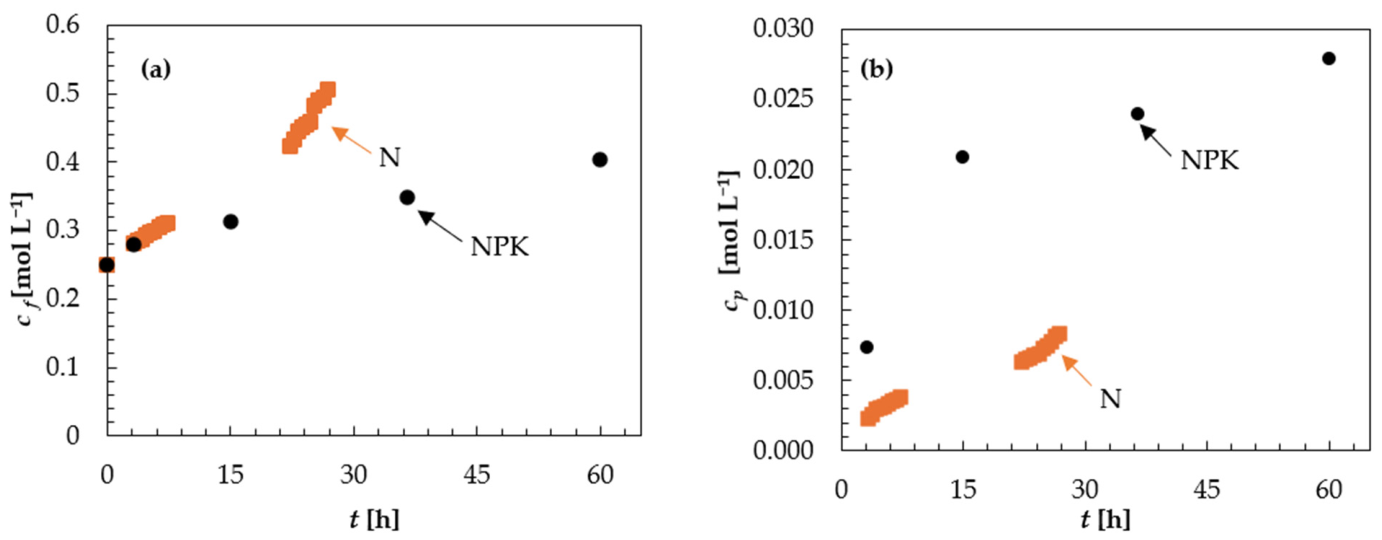
Figure 5 presents the time-dependent concentration of the feed (Figure 5a) and permeate (Figure 5b) in RO experiments with feed solution imitating the diluted draw solution at the end of the long-term FO experiments, referred to as the NPK solution, and the reference feed solution containing only (NH4)2SO4 at a similar initial concentration, referred to as the N solution. For the reference experiment, because the feed solution contained only (NH4)2SO4, we determined its concentration in the feed and permeate streams from the conductivities of the respective samples. In experiments with the NPK feed solution, we determined the concentrations of NH4+ in the feed and permeate using the appropriate test kit on samples taken at prescribed times.
Figure 5.
Equivalent concentration of (NH4)2SO4 in the feed (a) and permeate (b) in RO experiments at T = 28.5 ± 1 °C with the N and NPK feed solutions using the TFC membrane. The experiments used feed recirculation and continuous permeate removal.
The rate of concentration increase in the feed solution (Figure 5a) was much faster in the experiment with the N feed solution. The 18,000 ppm concentration of NH4+ (0.5 mol L−1 of (NH4)2SO4) was reached in less than 27 h. In contrast, in the NPK feed solution experiment, after 60 h the NH4+ concentration reached only 14,500 ppm, i.e., the equivalent concentration of (NH4)2SO4 was only slightly above 0.4 mol L−1. At the same time, the equivalent concentration of (NH4)2SO4 in the permeate (Figure 5b) was significantly greater in the NPK feed solution experiment than in the N feed solution experiment, which implied that the presence of PO43− and K+ in the feed solution reduced the rejection of (NH4)2SO4 by the TFC membrane.
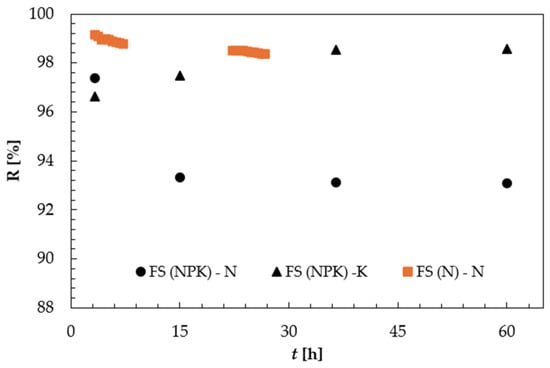
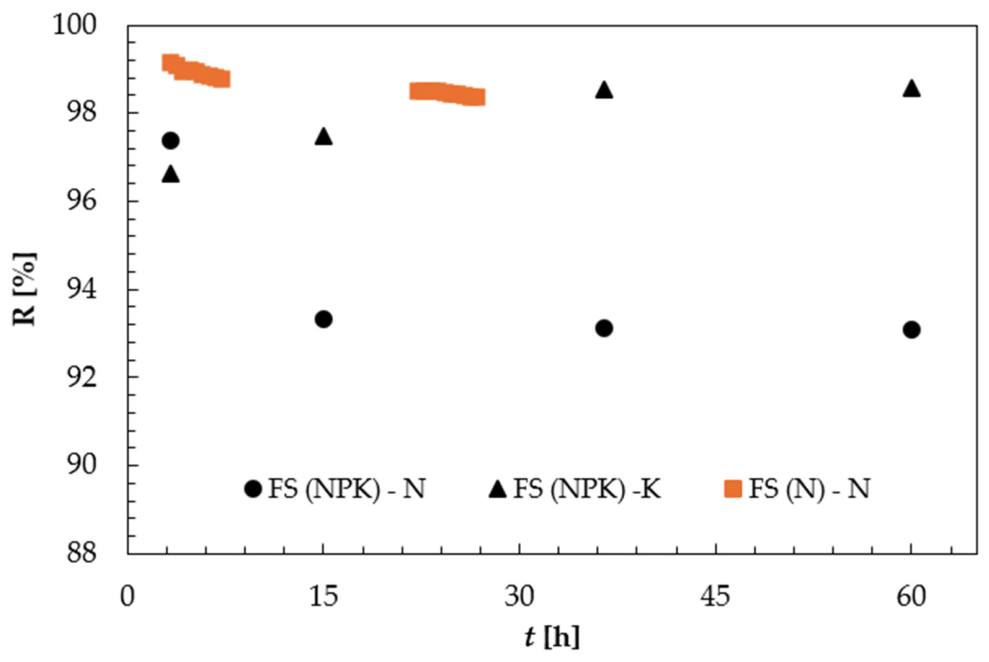
Figure 6 summarizes the time-dependent rejections of NH4+ in experiments with the N and NPK feed solutions; it also includes K+ rejection. PO43− could not be detected in any permeate samples because its concentration, if any, was below the phosphate test kit’s minimum detection level.
Figure 6.
Ion rejection in RO experiments at T = 28.5 ± 1 °C with the N and NPK feed solutions using the TFC membrane. The experiments were conducted with recirculation of the feed solution and continuous removal of the permeate. The rejection of PO43− (P) is not included because the concentration in the permeate was below the minimum detectable level.
In the experiment with the N feed solution, NH4+ rejection decreased slightly over time (i.e., with increasing feed solution concentration; Figure 5a), from 99.2% to 98.4%. In contrast, NH4+ rejection in the NPK feed solution experiment was significantly lower and also decreased over time, from 97.4% to 93%. The largest drop in NH4+ rejection occurred between 3 and 15 h after the experiment began. The lower NH4+ rejection in the presence of other ions results from increased osmotic pressure, which, as will be shown in Figure 7, decreases Jw. At the same time, the driving force for NH4+, i.e., its concentration gradient, was the same. Thus, when Jw decreases while Js remains the same, the corresponding rejection must decrease. Interestingly, K+ rejection increased over time in the same experiment, from 96.6% to 98.6%.
Figure 7.
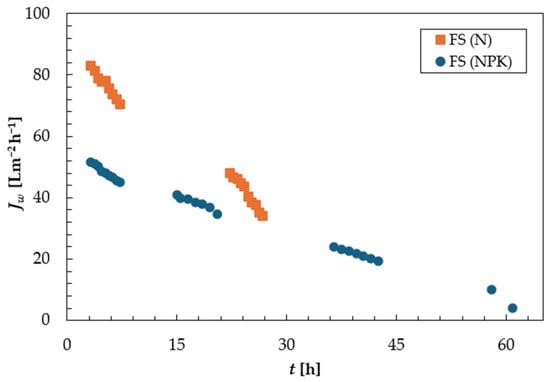
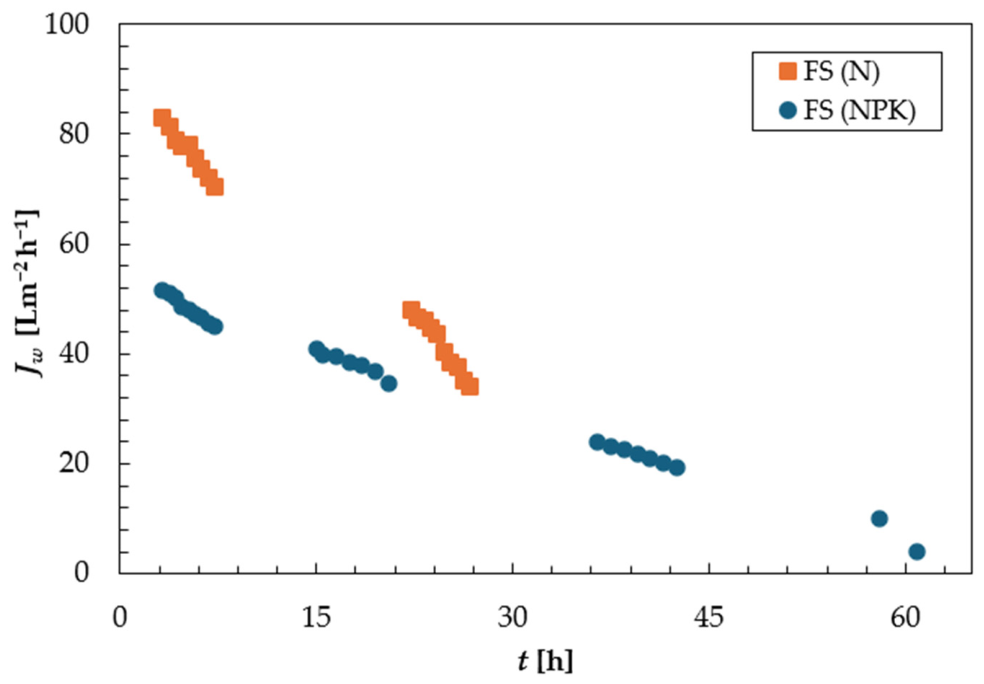
Water flux in RO experiments at T = 27 ± 1 °C with the N and NPK feed solutions using the TFC membrane. The experiments used feed-solution recirculation and continuous permeate removal.
From a practical point of view, the results in Figure 6 illustrate a key limitation of reconcentrating (NH4)2SO4 in the presence of other nutrients. Because PO43− and K+ reduce NH4+ rejection by the TFC membrane, reconcentration of (NH4)2SO4 in the feed solution was limited (Figure 5a) to 0.4 mol L−1 instead of the desired 0.5 mol L−1, even after 60 h of continuous operation. The RO experiment with the NPK feed solution could not be run beyond 60 h, as shown in Figure 7, where the water flux practically disappeared.
In the reference experiment with the N feed solution, the water flux decreased from about 83 L m−2 h−1 to 34 L m−2 h−1 after 27 h, when the feed reached a concentration of 0.5 mol L−1. A more than twofold drop in Jw when the feed concentration increased by a factor of 2 indicates that water permeance decreased with feed concentration, consistent with our previous study [35]. In the NPK feed solution experiment, however, Jw decreased more slowly than in the reference experiment. Nevertheless, after 60 h, collecting 15 mL of permeate, which was the minimum volume for the determination of the concentrations of NH4+, PO43−, and K+ in the sample, took more than 2 h. Consequently, the experiment was terminated. We did not measure the osmotic pressure of the retentate directly. However, we speculate that when the equivalent concentration of (NH4)2SO4 reached 0.4 mol L−1, the osmotic pressure of the feed solution approached the hydraulic pressure gradient.
In Figure 3, we noted that PO43− and K+ ions, along with NH4+, must have increased the solution’s osmotic pressure beyond the value predicted by the van’t Hoff equation. Similarly, PO43− and K+ interacting with NH4+ in the concentrated NPK feed solution might be responsible for the effective osmotic pressure approaching 30 bar after the 60-h experiment.
This finding has significant practical implications for the proposed hybrid FO-RO process, schematically depicted in Figure 1. In this process, the feed solution containing dilute nutrients is passed over an FO membrane. Consequently, unlike the FO test in this work, the FO process could operate at steady state. In contrast, the resulting dilute draw solution is circulated over an RO membrane to dewater it, thereby recovering the initial osmotic pressure of the concentrated draw solution entering the FO system. If the FO and RO membranes perfectly rejected all ions and allowed only water transport, the composition of the concentrated draw solution in Figure 1 would remain constant. However, the practical FO and RO membranes used in our study are not perfect. This means the composition of the draw solution circulating over the RO membrane would change over time. On the other hand, despite the varying composition of the draw solution entering the FO system, the key is to maintain its fixed osmotic pressure at that point over time. In other words, the effective osmotic pressure of the draw solution matters more than its actual composition.
If the CTA membrane were used in the FO system and the TFC membrane in the RO system as shown in Figure 1, the concentrations of PO43− and K+ in the draw solution would increase, but the concentration of NH4+ would decrease over time. However, if the effective osmotic pressure of the concentrate draw solution were constant, the dewatering rate of the feed solution would also be approximately constant. Moreover, as PO43− and K+ concentrations increase, the concentration gradient driving their transport from the feed to the draw solution (i.e., their loss) decreases. In other words, their concentration in the concentrated feed solution would increase over time. It is important to emphasize that the increase in PO43− concentration in the concentrated draw solution should be controlled, as it may lead to a reaction between PO43− and NH4+, resulting in scaling, which would be highly undesirable. In practice, this could be accomplished by bleeding the draw solution to avoid excessive PO43− concentration. At the same time, unlike the FO experiments, we did not observe any scaling in the RO experiment with the NPK solution, likely because the PO43− concentration in the concentrated draw solution was less than 1 ppm, which was much smaller than its concentration in the feed solution of the FO process (Table 3). At the same time, the lack of visually observable scaling does not guarantee the absence of scaling. Therefore, although the observed flux decline in Figure 7 is believed to result from increased osmotic pressure in the concentrated retentate solution, membrane scaling cannot be entirely ruled out.
4. Conclusions
This study investigated the feasibility of a hybrid membrane separation process for the concentration of nutrients (NH4+, PO43−, and K+) from a synthetic feed solution in the FO process using (NH4)2SO4 in a draw solution and a commercial CTA membrane, followed by the regeneration of a dilute draw solution in a subsequent RO process using a commercial TFC membrane. Special focus was given to the quantification of water and ion permeances through the CTA membrane, which is essential for future modelling and design of the FO part of the hybrid process.
Although a constant water flux was observed immediately after initiating the FO experiments, it took more than 4 h to reach constant ion fluxes, which made evaluation of their permeances challenging. Apart from the very slow diffusion of NH4+, PO43−, and K+ in the CTA membrane, which is advantageous for concentrating these ions in the feed solution, the permeation experiments revealed a strong affinity of NH4+ towards the membrane and a reaction between NH4+ and PO43−, which led to some scaling. The permeances of K+ and NH4+ in the CTA membrane were in the order of 10−7 m s−1, and that of PO43− was in the order of 10−9 m s−1. The corresponding rejections of PO43− and K+ were 99% and at least 70%, respectively. The permeance of NH4+ in the presence of PO43− and K+ was much lower than in their absence, which is beneficial in practice because PO43− and K+ reduce the undesirable reverse flux of the draw solute. On the other hand, the water permeance of the CTA membrane was practically independent of the composition and concentration of the feed solution.
During regeneration of the dilute draw solution in subsequent RO experiments, PO43− and K+ significantly reduced TFC membrane productivity and prevented NH4+ from reaching the desired initial concentration in the draw solution. This was primarily because PO43− and K+ increased the osmotic pressure of the diluted draw solution and were highly rejected by the TFC membrane. From the perspective of a future integrated FO-RO process, in which the feed solution containing diluted nutrients passes through the FO system and the draw solution circulates over an RO membrane, fully restoring the initial NH4+ concentration is less critical than recovering the initial osmotic pressure. The main goal is to recover the initial osmotic pressure, regardless of draw-solution composition. Moreover, increasing the concentration of PO43− and K+ in the circulating draw solution could also minimize the loss of these ions and nutrients transfer from the feed solution, thereby improving nutrient recovery.
Overall, this study demonstrated the strong potential of the hybrid FO–RO process as a low-energy platform for nutrient concentration and draw solution regeneration. It provided a system-level understanding of multicomponent nutrient transport in hybrid membrane systems and supports the development of sustainable nutrient recovery strategies for digestate valorization and circular fertilizer production. This study will also serve as a reference, enabling better assessment of membrane fouling and scaling when using pre-treated real digestate as the feed solution.
Author Contributions
Conceptualization, B.K., N.A. and M.S.; methodology, B.K., N.A. and M.S. validation, M.T.; formal analysis, M.T.; investigation, M.T. and B.K.; resources, B.K., M.S.; writing—original draft preparation, M.T.; writing—review and editing, B.K., M.S. and N.A.; B.K., N.A. and M.S.; project administration, N.A.; funding acquisition, N.A. and B.K. All authors have read and agreed to the published version of the manuscript.
Funding
This research was funded by Agriculture and Agri-Food Canada (AAFC) through the Agricultural Clean Technology (ACT)—Research and Innovation (RI) stream, ACT-RI-102, and the Natural Sciences and Engineering Research Council (NSERC) of Canada, Discovery Grant, DG: 04443.
Institutional Review Board Statement
Not applicable.
Informed Consent Statement
Not applicable.
Data Availability Statement
The data presented in this study are available on request from the corresponding author.
Acknowledgments
The authors express their gratitude to Benjamin Strehler and Mohamad Adghim from CHFour Biogas Company for their help in acquiring funding from AACF and for their technical assistance throughout the project.
Conflicts of Interest
The authors declare no conflicts of interest. The funders had no role in the design of the study; in the collection, analysis, or interpretation of data; in the writing of the manuscript; or in the decision to publish the results.
Nomenclature
| Symbols | |
| A | Water permeance [L m−2 s−1 bar−1] |
| A | Area [m2] |
| B | Solute permeance [m s−1] |
| c | Molar concentration [mol L−1 or mg L−1] |
| J | Flux [L m−2 h−1] |
| k | Feed-solution conductivity [mS cm−1] |
| m | mass [kg] |
| p | Pressure [bar] |
| R | Solute rejection [-] |
| R | Universal gas constant [J mol−1 K−1] |
| t | Time [min or h] |
| T | Absolute temperature [K] |
| V | Volume [L] |
| Greek symbols | |
| Δc | Average concentration gradient [mol L−1] |
| Δπ | Average osmotic pressure gradient [bar] |
| ρ | Water density [kg L−1] |
| π | Osmotic pressure [bar] |
| Subscripts | |
| D | Draw solution |
| F | Feed solution |
| f | Final |
| i | Initial, ion |
| m | Membrane |
| p | Permeate solution |
| s | Solute |
| w | Water |
| Abbreviation | |
| FO | Forward osmosis |
| RO | Reverse osmosis |
| CTA | Cellulose triacetate |
| TFC | Thin-film composite |
| AD | Anaerobic digestion |
| FS | Feed solution |
| NF | Nanofilteration |
| DS | Draw solution |
| RSF | Reverse solute flux |
| PS | Polysulfone |
| PET | Polyethylene terephthalate |
| PA | Polyamide |
| DI | Deionized water |
| NPK | Nitrogen–phosphorus–potassium |
References
- Lamolinara, B.; Pérez-Martínez, A.; Guardado-Yordi, E.; Guillén Fiallos, C.; Diéguez-Santana, K.; Ruiz-Mercado, G.J. Anaerobic Digestate Management, Environmental Impacts, and Techno-Economic Challenges. Waste Manag. 2022, 140, 14–30. [Google Scholar] [CrossRef] [Scilit] [PubMed]
- Malhotra, M.; Aboudi, K.; Pisharody, L.; Singh, A.; Banu, J.R.; Bhatia, S.K.; Varjani, S.; Kumar, S.; González-Fernández, C.; Kumar, S.; et al. Biorefinery of Anaerobic Digestate in a Circular Bioeconomy: Opportunities, Challenges and Perspectives. Renew. Sustain. Energy Rev. 2022, 166, 112642. [Google Scholar] [CrossRef] [Scilit]
- Viancelli, A.; Schneider, T.M.; Demczuk, T.; Delmoral, A.P.G.; Petry, B.; Collato, M.M.; Michelon, W. Unlocking the Value of Biomass: Exploring Microbial Strategies for Biogas and Volatile Fatty Acids Generation. Bioresour. Technol. Rep. 2023, 23, 101552. [Google Scholar] [CrossRef] [Scilit]
- van Midden, C.; Harris, J.; Shaw, L.; Sizmur, T.; Pawlett, M. The Impact of Anaerobic Digestate on Soil Life: A Review. Appl. Soil Ecol. 2023, 191, 105066. [Google Scholar] [CrossRef] [Scilit]
- Adghim, M.; Sartaj, M.; Abdehagh, N. The Applications of Renewable Natural Gas in Ammonia Stripping and Its Impacts on Microbial Diversity to Enhance Biogas Production. Bioresour. Technol. Rep. 2023, 21, 101334. [Google Scholar] [CrossRef] [Scilit]
- Adghim, M.; Sartaj, M.; Abdehagh, N.; Strehlar, B. Post-Hydrolysis versus Side-Stream Ammonia Stripping in Semi-Continuous Two-Stage Anaerobic Digestion of High Nitrogen Feedstock. Waste Manag. 2023, 168, 74–82. [Google Scholar] [CrossRef] [Scilit] [PubMed]
- Häfner, F.; Hartung, J.; Möller, K. Digestate Composition Affecting N Fertiliser Value and C Mineralisation. Waste Biomass Valorization 2022, 13, 3445–3462. [Google Scholar] [CrossRef] [Scilit]
- Garfí, M.; Gelman, P.; Comas, J.; Carrasco, W.; Ferrer, I. Agricultural Reuse of the Digestate from Low-Cost Tubular Digesters in Rural Andean Communities. Waste Manag. 2011, 31, 2584–2589. [Google Scholar] [CrossRef] [Scilit] [PubMed]
- Rigby, H.; Smith, S.R. Nitrogen Availability and Indirect Measurements of Greenhouse Gas Emissions from Aerobic and Anaerobic Biowaste Digestates Applied to Agricultural Soils. Waste Manag. 2013, 33, 2641–2652. [Google Scholar] [CrossRef] [Scilit] [PubMed]
- Lukehurst, C.T.; Frost, P.; Al Seadi, T. Utilisation of digestate from biogas plants as biofertiliser. IEA Bioenergy Task 37 2010. [Google Scholar]
- Gao, Y.; Fang, Z.; Liang, P.; Huang, X. Direct Concentration of Municipal Sewage by Forward Osmosis and Membrane Fouling Behavior. Bioresour. Technol. 2018, 247, 730–735. [Google Scholar] [CrossRef] [Scilit] [PubMed]
- Yang, S.; Gao, B.; Jang, A.; kyong Shon, H.; Yue, Q. Municipal Wastewater Treatment by Forward Osmosis Using Seawater Concentrate as Draw Solution. Chemosphere 2019, 237, 124485. [Google Scholar] [CrossRef] [Scilit] [PubMed]
- Feiz, R.; Carraro, G.; Brienza, C.; Meers, E.; Verbeke, M.; Tonderski, K. Systems Analysis of Digestate Primary Processing Techniques. Waste Manag. 2022, 150, 352–363. [Google Scholar] [CrossRef] [Scilit] [PubMed]
- Möller, K.; Schulz, R.; Müller, T. Substrate Inputs, Nutrient Flows and Nitrogen Loss of Two Centralized Biogas Plants in Southern Germany. Nutr. Cycl. Agroecosyst. 2010, 87, 307–325. [Google Scholar] [CrossRef] [Scilit]
- Thomas, C.L.; Haefele, S.M.; Adler, I. Anaerobic Digestate as a Fertiliser: A Comparison of the Nutritional Quality and Gaseous Emissions of Raw Slurry, Digestate, and Inorganic Fertiliser. Agronomy 2026, 16, 287. [Google Scholar] [CrossRef] [Scilit]
- Chojnacka, K.; Moustakas, K. Anaerobic Digestate Management for Carbon Neutrality and Fertilizer Use: A Review of Current Practices and Future Opportunities. Biomass Bioenergy 2024, 180, 106991. [Google Scholar] [CrossRef] [Scilit]
- Almoalimi, K.; Liu, Y.Q. Enhancing Ammonium Rejection in Forward Osmosis for Wastewater Treatment by Minimizing Cation Exchange. J. Membr. Sci. 2022, 648, 120365. [Google Scholar] [CrossRef] [Scilit]
- Mendoza, E.; Buttiglieri, G.; Blandin, G.; Comas, J. Exploring the Limitations of Forward Osmosis for Direct Hydroponic Fertigation: Impact of Ion Transfer and Fertilizer Composition on Effective Dilution. J. Environ. Manag. 2022, 305, 114339. [Google Scholar] [CrossRef] [Scilit] [PubMed]
- Schneider, C.; Rajmohan, R.S.; Zarebska, A.; Tsapekos, P.; Hélix-Nielsen, C. Treating Anaerobic Effluents Using Forward Osmosis for Combined Water Purification and Biogas Production. Sci. Total Environ. 2019, 647, 1021–1030. [Google Scholar] [CrossRef] [Scilit] [PubMed]
- Blandin, G.; Ferrari, F.; Lesage, G.; Le-Clech, P.; Héran, M.; Martinez-Lladó, X. Forward Osmosis as Concentration Process: Review of Opportunities and Challenges. Membranes 2020, 10, 284. [Google Scholar] [CrossRef] [Scilit] [PubMed]
- Johnson, D.J.; Suwaileh, W.A.; Mohammed, A.W.; Hilal, N. Osmotic’s Potential: An Overview of Draw Solutes for Forward Osmosis. Desalination 2018, 434, 100–120. [Google Scholar] [CrossRef] [Scilit]
- Ge, Q.; Ling, M.; Chung, T.S. Draw Solutions for Forward Osmosis Processes: Developments, Challenges, and Prospects for the Future. J. Memb. Sci. 2013, 442, 225–237. [Google Scholar] [CrossRef] [Scilit]
- Francis, L.; Ogunbiyi, O.; Saththasivam, J.; Lawler, J.; Liu, Z. A Comprehensive Review of Forward Osmosis and Niche Applications. Environ. Sci. Water Res. Technol. 2020, 6, 1986–2015. [Google Scholar] [CrossRef] [Scilit]
- Zhang, J.; She, Q.; Chang, V.W.C.; Tang, C.Y.; Webster, R.D. Mining Nutrients (N, K, P) from Urban Source-Separated Urine by Forward Osmosis Dewatering. Environ. Sci. Technol. 2014, 48, 3386–3394. [Google Scholar] [CrossRef] [Scilit] [PubMed]
- El Zayat, H.; Nasr, P.; Sewilam, H. Investigating Sustainable Management of Desalination Brine through Concentration Using Forward Osmosis. Environ. Sci. Pollut. Res. 2021, 28, 39938. [Google Scholar] [CrossRef] [Scilit] [PubMed]
- Atashgar, A.; Emadzadeh, D.; Kruczek, B. The Effect of Cu2+ and Pb2+ in the Feed Solution on the Water and Reverse Solute Fluxes in the Forward Osmosis (FO) Process Using Nanofiltration (NF) Membranes. Processes 2023, 11, 2198. [Google Scholar] [CrossRef] [Scilit]
- Li, S.; Kim, Y.; Chekli, L.; Phuntsho, S.; Shon, H.K.; Leiknes, T.O.; Ghaffour, N. Impact of Reverse Nutrient Diffusion on Membrane Biofouling in Fertilizer-Drawn Forward Osmosis. J. Membr. Sci. 2017, 539, 108–115. [Google Scholar] [CrossRef] [Scilit]
- Volpin, F.; Heo, H.; Hasan Johir, M.A.; Cho, J.; Phuntsho, S.; Shon, H.K. Techno-Economic Feasibility of Recovering Phosphorus, Nitrogen and Water from Dilute Human Urine via Forward Osmosis. Water Res. 2019, 150, 47–55. [Google Scholar] [CrossRef] [Scilit] [PubMed]
- Shahgodari, S.; Llorens, J.; Labanda, J. Viability of Total Ammoniacal Nitrogen Recovery Using a Polymeric Thin-Film Composite Forward Osmosis Membrane: Determination of Ammonia Permeability Coefficient. Polymers 2024, 16, 1834. [Google Scholar] [CrossRef] [Scilit] [PubMed]
- Jafarinejad, S.; Park, H.; Mayton, H.; Walker, S.L.; Jiang, S.C. Concentrating Ammonium in Wastewater by Forward Osmosis Using a Surface Modified Nanofiltration Membrane. Environ. Sci. Water Res. Technol. 2019, 5, 246–255. [Google Scholar] [CrossRef] [Scilit]
- Tolouei, M.; Abraham, R.; Abdehagh, N.; Sartaj, M.; Kruczek, B. The Evaluation of Ammonium Sulphate as a Potential Draw Solute in a Hybrid FO-RO Process to Concentrate Nutrients (NPK) from a Simulated Liquid Digestate—Part I: Deionized Water as a Feed Solution. Membranes 2025, 15, 366. [Google Scholar] [CrossRef] [Scilit] [PubMed]
- Pocock, J.; Muzhingi, A.; Mercer, E.; Velkushnova, K.; Septien, S.; Buckley, C.A. Water and Nutrient Recovery from Stored Urine by Forward Osmosis with an Ammonium Bicarbonate Draw Solution. Front. Environ. Sci. 2022, 10, 937456. [Google Scholar] [CrossRef] [Scilit]
- Bai, D.; Asempour, F.; Kruczek, B. Can the Time-Lag Method Be Used for the Characterization of Liquid Permeation Membranes? Chem. Eng. Res. Des. 2020, 162, 228–237. [Google Scholar] [CrossRef] [Scilit]
- Carter, D.; Rose, L.; Awobusuyi, T.; Gauthier, M.; Tezel, F.H.; Kruczek, B. Characterization of Commercial RO Membranes for the Concentration of Ammonia Converted to Ammonium Sulfate from Anaerobic Digesters. Desalination 2015, 368, 127–134. [Google Scholar] [CrossRef] [Scilit]
- McCutcheon, J.R.; McGinnis, R.L.; Elimelech, M. A Novel Ammonia—Carbon Dioxide Forward (Direct) Osmosis Desalination Process. Desalination 2005, 174, 1–11. [Google Scholar] [CrossRef] [Scilit]
- Shah, M.R.; Noble, R.D.; Clough, D.E. Analysis of Transient Permeation as a Technique for Determination of Sorption and Diffusion in Supported Membranes. J. Memb. Sci. 2006, 280, 452–460. [Google Scholar] [CrossRef] [Scilit]
- Heintz, A.; Stephan, W. A Generalized Solution—Diffusion Model of the Pervaporation Process through Composite Membranes Part II. Concentration Polarization, Coupled Diffusion and the Influence of the Porous Support Layer. J. Memb. Sci. 1994, 89, 153–169. [Google Scholar] [CrossRef] [Scilit]
- Cao, Z.; Thibault, J.; Kruczek, B. Direct Determination of Permeability, Diffusivity and Solubility of Gases in Membrane Based on Simultaneous Monitoring of Pressure Rise and Decay in a Single Time-Lag Experiment. J. Memb. Sci. 2025, 720, 123741. [Google Scholar] [CrossRef] [Scilit]
- Lu, X.; Boo, C.; Ma, J.; Elimelech, M. Bidirectional Diffusion of Ammonium and Sodium Cations in Forward Osmosis: Role of Membrane Active Layer Surface Chemistry and Charge. Environ. Sci. Technol. 2014, 48, 14369–14376. [Google Scholar] [CrossRef] [Scilit] [PubMed]
- Zhang, M.; She, Q.; Yan, X.; Tang, C.Y. Effect of Reverse Solute Diffusion on Scaling in Forward Osmosis: A New Control Strategy by Tailoring Draw Solution Chemistry. Desalination 2017, 401, 230–237. [Google Scholar] [CrossRef] [Scilit]
- Jeong, G.; Jang, D.; Lee, H.; Jang, A. Effects of Feed Solution Chemistry on Membrane Scaling in Fertilizer-Drawn Forward Osmosis Process for Sustainable Agricultural Reuse. Desalination 2023, 545, 116150. [Google Scholar] [CrossRef] [Scilit]
- Phuntsho, S.; Lotfi, F.; Hong, S.; Shaffer, D.L.; Elimelech, M.; Shon, H.K. Membrane Scaling and Flux Decline during Fertiliser-Drawn Forward Osmosis Desalination of Brackish Groundwater. Water Res. 2014, 57, 172–182. [Google Scholar] [CrossRef] [Scilit] [PubMed]
- Jeong, G.; Jang, D.; Jang, A. Evaluating the Feasibility of Green Scaling Inhibitors in Fertilizer-Driven Forward Osmosis Process: Application of Methylglycinediacetic Acid (MGDA) and Glutamic Acid Diacetate (GLDA) to Replace Commercial Scaling Inhibitors. Desalination 2026, 618, 119503. [Google Scholar] [CrossRef] [Scilit]

Disclaimer/Publisher’s Note: The statements, opinions and data contained in all publications are solely those of the individual author(s) and contributor(s) and not of MDPI and/or the editor(s). MDPI and/or the editor(s) disclaim responsibility for any injury to people or property resulting from any ideas, methods, instructions or products referred to in the content. |
© 2026 by the authors. Licensee MDPI, Basel, Switzerland. This article is an open access article distributed under the terms and conditions of the Creative Commons Attribution (CC BY) license.