


Abstract
The aim of this study was to determine whether quercetin-mediated Kv1.3 inhibition is a general flavonol effect or compound-specific. The impact of quercetin and morin—differing by a single B-ring hydroxyl—on the endogenous Kv1.3 current in Jurkat T was compared. Currents were recorded using whole-cell patch-clamp across the 30–105 µM concentration range. Quercetin inhibited the current abruptly: no effect at 30 µM, a 40% reduction at 60 µM, followed 50% reduction in higher concentrations. Morin inhibited the current throughout the range, but its effect depended marginally on concentration. No changes in activation or inactivation kinetics were detected, and inhibition reversed upon washout. The 48 h MTT-assessed viability IC50 for quercetin was 6.25 µM, an order of magnitude below current-inhibiting concentrations, and 30.1 µM for morin. Additionally, quercetin at 30 µM, inactive alone, combined with simvastatin (6 µM), left only a quarter of the current—well below the predicted value, though exploratory testing did not establish synergy. This study reports morin’s action on Kv1.3 in Jurkat cells for the first time, showing that both flavonols inhibit the channel but that the attainable extent of inhibition is compound-specific.
Keywords:
Kv1.3 channel; Jurkat T cells; quercetin; morin; simvastatin; mevastatin; patch clamp; MTT assay; concentration–response 1. Introduction
Quercetin and morin are naturally occurring polyhydroxylated flavonols. Both share the flavonoid benzo-γ-pyrone scaffold but differ in the substitution pattern of hydroxyl groups. These chemical properties may affect redox activity, membrane partitioning, and interactions with cellular proteins. Quercetin occurs in many fruits, vegetables, and herbs (e.g., onions, capers, berries), whereas morin is found in leaves, fruits, stems, and branches of several plant species (e.g., white mulberry, guava, jackfruit, apples). Both compounds have been associated with a broad range of biological activities in experimental models, including antioxidant, anti-inflammatory, and antiproliferative effects [1,2].
Flavonols can modulate multiple potassium channel subtypes. Reported targets include voltage-gated Kv1.5 and Kv11.1 channels, large-conductance calcium-activated potassium (BKCa) channels, and mitochondrial ATP-sensitive, inwardly rectifying potassium channels [3,4,5,6,7,8,9,10,11,12,13]. Kv1.5 and Kv11.1 are voltage-gated potassium channels and should be distinguished from BKCa channels, which are activated by membrane depolarization and increased intracellular Ca2+ concentration. The functional outcome of flavonol exposure may therefore depend on the channel subtype, cell type, and experimental conditions. It has been proposed that some of the antioxidant, cardioprotective, antihypertensive and anticancer effects of quercetin and morin stem, at least in part, from their modulation activity on various potassium channels located in plasmalemmal and mitochondrial membranes [3,4,5,6,7,8,9,10,11,12].
Kv1.3 is a voltage-gated potassium channel encoded by KCNA3 gene. It is expressed in numerous normal and malignant cell types and has been identified in the plasma membrane and in the inner mitochondrial membrane [14,15]. Kv1.3 expression is markedly altered in certain cancers (e.g., melanoma, pancreatic ductal adenocarcinoma, multiple myeloma and B-type chronic lymphocytic leukemia) [16,17,18,19,20,21]. In Kv1.3-expressing cells, plasma-membrane and mitochondrial channel pools have been associated with cellular signaling, proliferation, and apoptosis, depending on the experimental context [16,17,18,19,20,21].
Previous studies have reported that selected lipophilic compounds, including some flavonoids, polyphenols, chalcones, and statins, can inhibit Kv1.3 currents and that some combinations produce stronger current inhibition than either compound alone [20,22,23]. Our recent book chapter summarized preliminary observations of the concentration-dependent quercetin inhibition of Kv1.3 current and enhanced inhibition during co-application with statins [24].
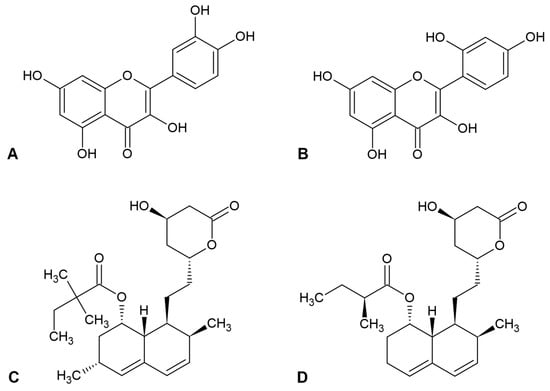
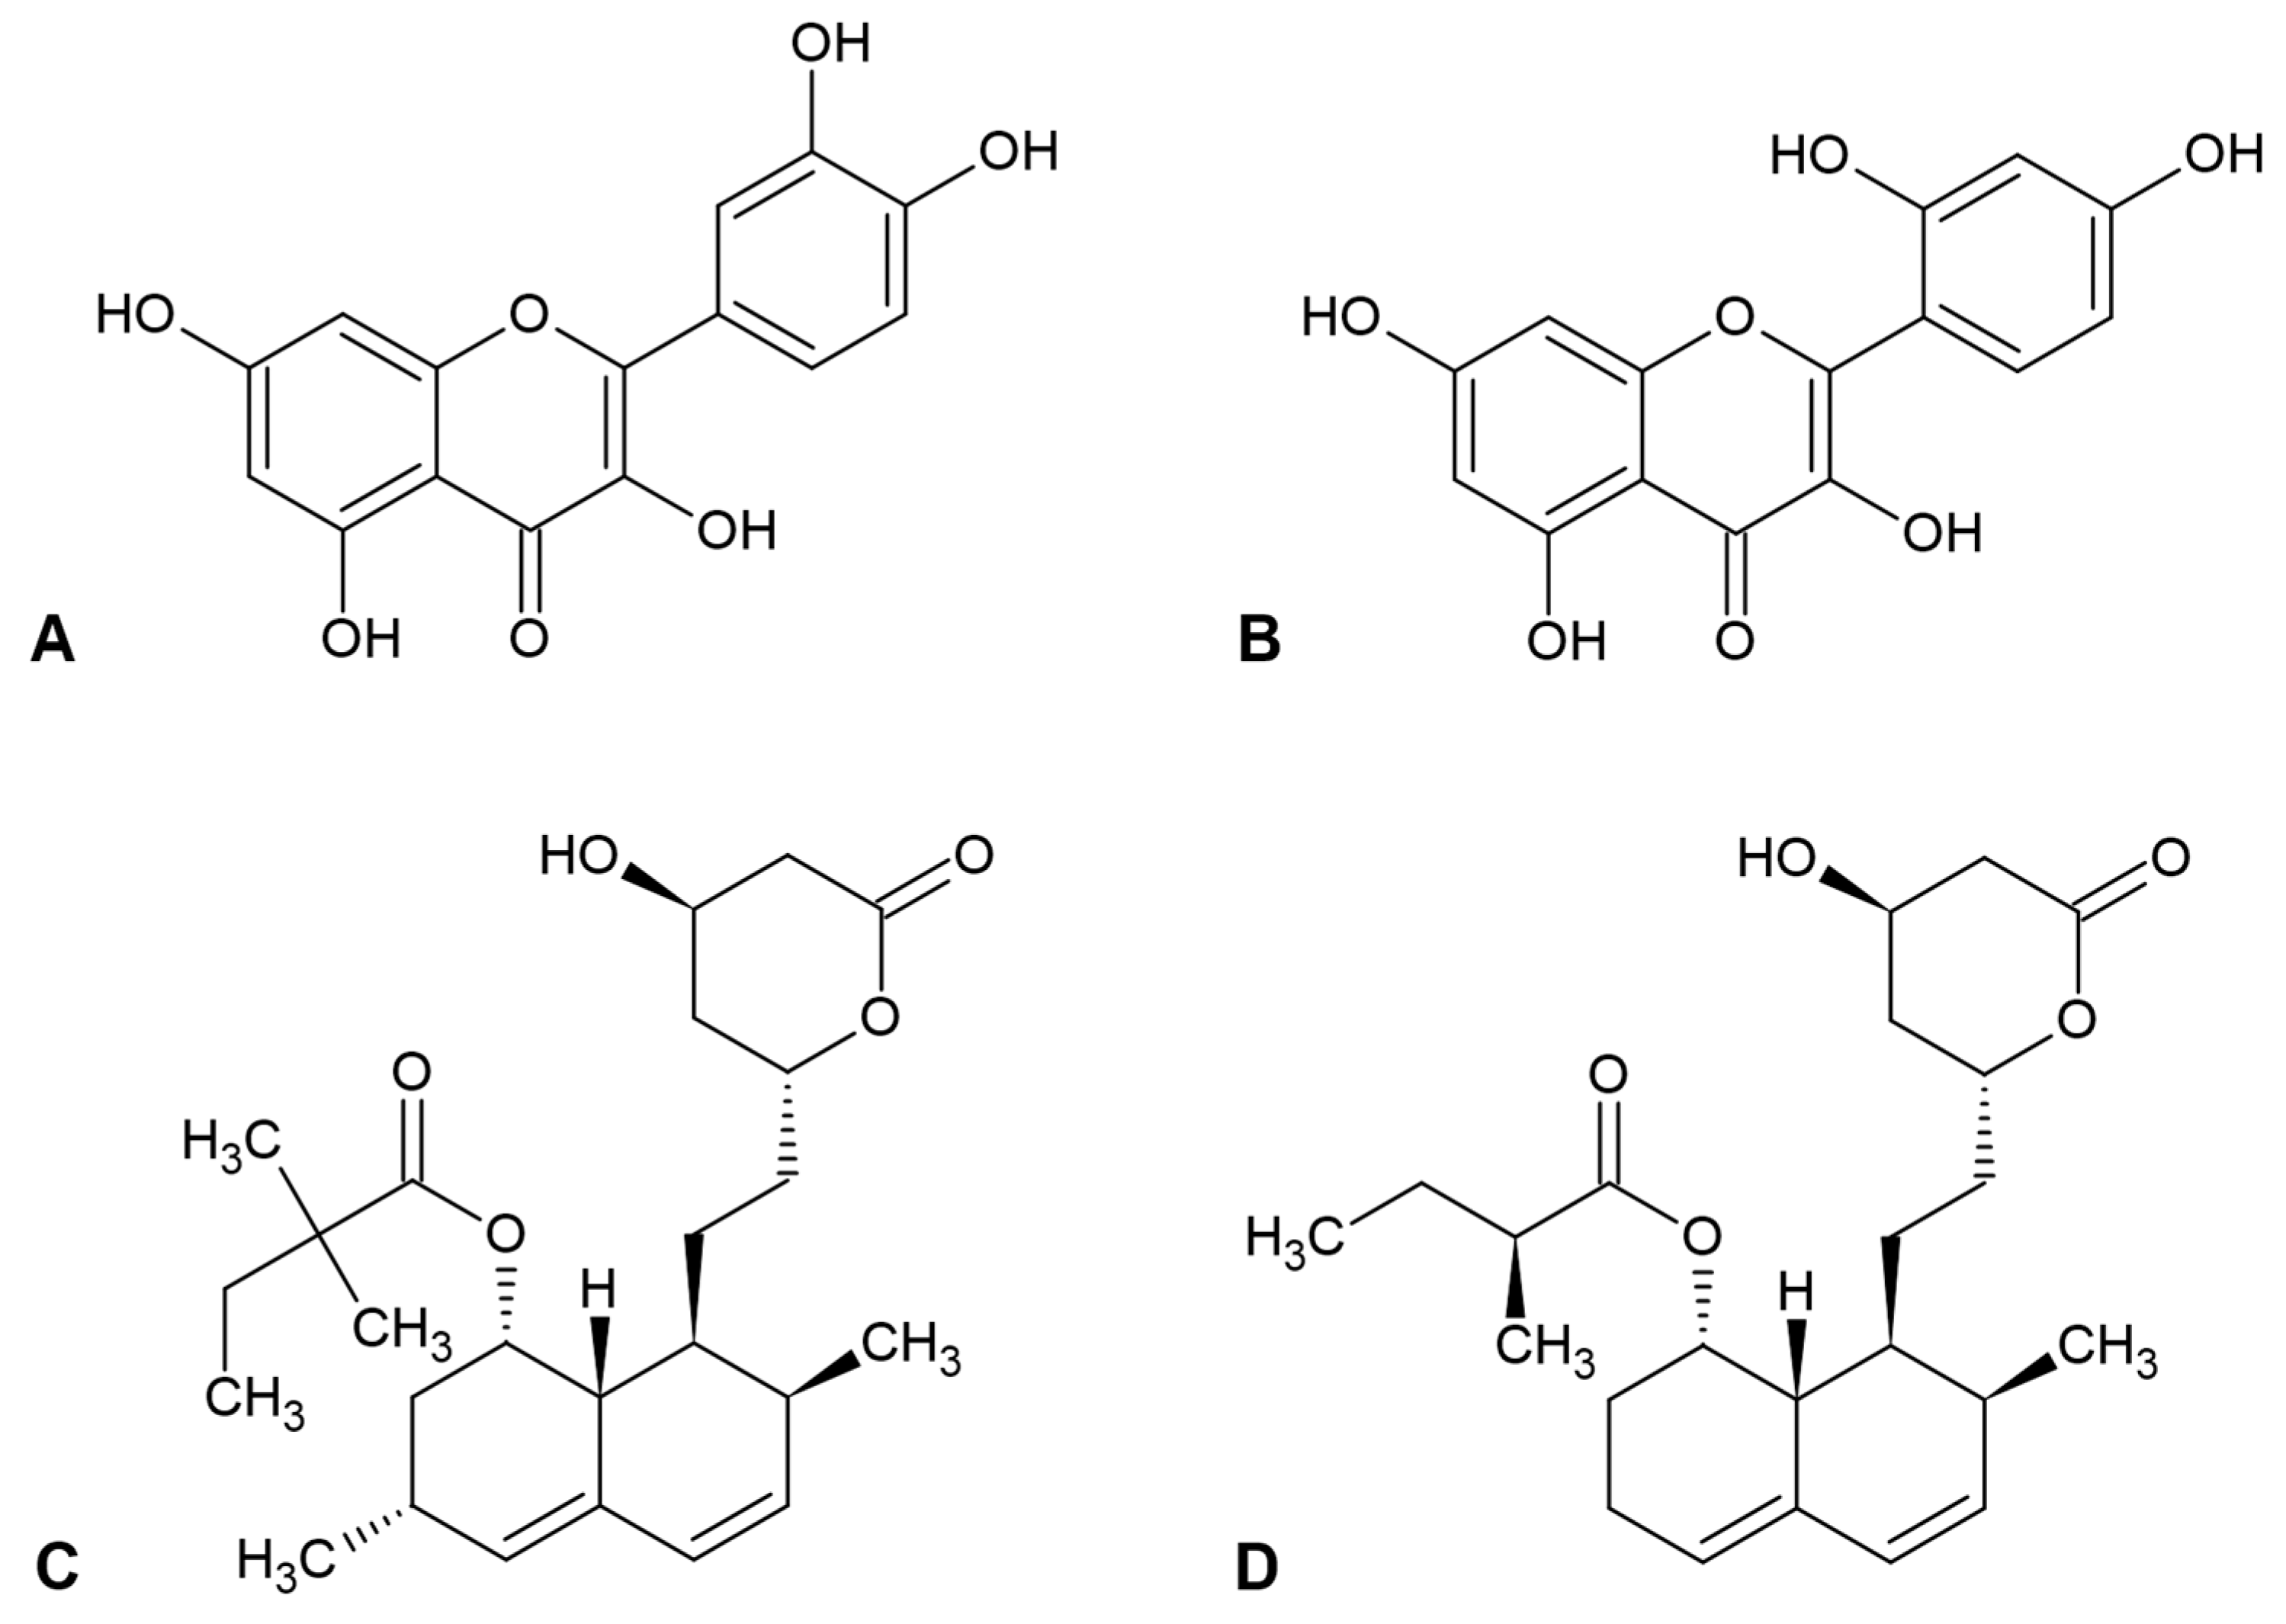
The present study builds on those observations by providing quantitative concentration–response data for quercetin, measurements of reversibility and current kinetics. The aim of this study was to determine whether quercetin-mediated Kv1.3 inhibition represents a general flavonol effect or is compound-specific. To address this question, we compared the effects of quercetin and morin, which differ by a single hydroxyl group on the B-ring, on endogenous Kv1.3 currents in Jurkat T cells. To our knowledge, this is the first study to investigate the effects of morin on Kv1.3 channels. The impact of both compounds on Jurkat T cell viability was also measured. Moreover, five different co-application conditions of flavonols and statins were tested, and the results were analyzed with a multiplicative-independence model. The chemical structures of all tested compounds are presented in Figure 1.
Figure 1.
Chemical structures of quercetin (A), morin (B), simvastatin (C), and mevastatin (D).
2. Materials and Methods
2.1. Cell Culture
Jurkat (clone E6-1) human leukemic T cells were obtained from the American Type Culture Collection (Manassas, VA, USA). Cells were cultured in RPMI 1640 medium supplemented with 10% heat-inactivated fetal bovine serum, 10 mM HEPES, and 2 mM glutamine. Cultures were maintained at 37 °C in a humidified incubator with 5% CO2 CO2.
2.2. Reagents
The reagents were purchased from the Polish Chemical Company (POCH, Gliwice, Poland). HEPES and EGTA were obtained from Sigma-Aldrich (Poznań, Poland). Quercetin, morin, simvastatin, and mevastatin were applied in the final concentrations specified in the figure captions.
2.3. Whole-Cell Patch-Clamp Recordings
During recordings, cells were bathed in an external solution containing 150 mM NaCl, 4.5 mM KCl, 1 mM CaCl2, 1 mM MgCl2, 10 mM HEPES, and 10 mM glucose; pH was adjusted to 7.35 with NaOH. The internal pipette solution contained 150 mM KCl, 1 mM CaCl2, 2 mM MgCl2, 10 mM HEPES, and 10 mM EGTA; pH was adjusted to 7.2 with KOH. The calculated free intracellular Ca2+ concentration was below 100 nM [25], which is below the activation range reported for KCa2.2 channels in Jurkat T cells [26].
Cells were placed in recording dishes on an inverted Olympus IMT-2 microscope. Test solutions were delivered through an eight-channel gravity-driven perfusion system (ALA Scientific Instruments, Farmingdale, NY, USA). Pipettes were pulled from borosilicate glass and had resistances greater than 3 MΩ. Whole-cell recordings [27] were obtained using an EPC-7 amplifier (HEKA Elektronik, Reutlingen, Germany), low-pass filtered at 3 kHz, digitized with a CED Micro 1401 A/D converter (CED Ltd., Cambridge, UK), and sampled at 10 kHz.
For concentration–response and combination experiments, voltage ramps depolarized the membrane from −100 mV to +40 mV over 340 ms and were applied every 30 s. Cells were held at −90 mV between ramps. Kv1.3 current at +40 mV was calculated by subtracting the leak current estimated at +40 mV from the total ramp current recorded at this potential. Representative raw traces are shown to illustrate recording characteristics and reversibility. Quantitative analyses were based on leak-subtracted currents.
To assess activation and inactivation kinetics, 500 ms depolarizing voltage steps from −90 mV to +60 mV were applied every 30 s. All recordings were performed at room temperature (22–24 °C).
2.4. MTT Viability Assay and IC50 Estimation
Jurkat T cell metabolic viability was assessed using the MTT assay following the previously described procedure [28]. Cells were seeded in 96-well plates at 3 × 10⁴ cells per well and exposed to each compound separately for 48 h at 37 °C in a humidified atmosphere containing 5% CO2. The tested concentration ranges were 1–150 µM for quercetin (1, 2.5, 5, 10, 20, 30, 60, 90, 105, and 150 µM), 5–300 µM for morin (5, 15, 30, 60, 90, 105, 150, 200, and 300 µM), 0.5–100 µM for simvastatin (0.5, 1.5, 3, 6, 10, 15, 25, 40, 60, and 100 µM), and 0.5–60 µM for mevastatin (0.5, 1.5, 3, 6, 10, 15, 25, 40, and 60 µM).
After compound exposure, MTT reagent (5 mg/mL) was added and the plates were incubated for a further 4 h. Formazan crystals were dissolved in dimethyl sulfoxide, and absorbance was measured at 570 nm using a Tecan Infinite M200 spectrophotometer (Tecan Group Ltd., Männedorf, Switzerland). MTT responses were expressed relative to control samples (non-treated), assigned to 100%. Three independent experiments were performed.
The MTT-derived endpoint is reported as the 48 h MTT viability IC50 (IC50,MTT), distinct from the apparent relative IC50, Kv1.3 obtained from acute current recordings. It reflects the inhibition of the normalized metabolic-viability response.
2.5. Electrophysiological Data Analysis
Normalized Kv1.3 current was expressed as I/Icontrol, where I is the leak-subtracted current measured at +40 mV during application of a tested compound and Icontrol is the corresponding current recorded under control conditions in the same cell. Activation kinetics were quantified using time to peak (Tpeak); larger values indicate slower activation. Inactivation kinetics were fitted with a single exponential:
where A1 and A2 are fit constants, t is time, and τ is the inactivation time constant. Larger τ values indicate slower inactivation.
I(t) = A1exp(−t/τ) + A2
For quercetin, an unweighted nonlinear least-squares Hill-type fit was applied to the four concentration-specific means calculated from the individual normalized currents in Table S1:
Here, Y is normalized current and C is quercetin concentration. IC50 in Equation (2) denotes the apparent relative IC50,Kv1.3, corresponding to Y = (Ytop + Ybottom)/2 and thus to half of the fitted maximal inhibition rather than 50% inhibition of control current. The upper asymptote Ytop was fixed at one. The lower asymptote Ybottom, midpoint, and Hill coefficient nH were fitted. Bounds were zero to one for Ybottom, 1–1000 µM for the midpoint, and 0.01–100 for nH. Fits were performed using scipy.optimize.curve_fit (SciPy 1.18.1; NumPy 2.5.3). All observations were included.
For drug-combination experiments, the expected normalized current under a multiplicative-independence model was calculated as
The signed deviation from the reference was calculated as observed minus predicted normalized current. Negative deviations indicate greater-than-predicted inhibition and positive deviations indicate less-than-predicted inhibition. These descriptions refer to the specified multiplicative reference, not to a mechanistically established interaction. Failure to detect a difference from the reference was not interpreted as proof of additivity or equivalence.
2.6. Statistical Analysis
Electrophysiological summaries were recalculated from the numerical observations in Tables S1–S6 and are reported as mean ± standard deviation (SD). For concentration–response and combination datasets, n denotes the number of normalized-current observations. For kinetics, n denotes the number of listed parameter values. The tabulated lists do not retain identifiers linking control and treatment observations. For the MTT assay, n = 3 denotes independent experiments, not individual wells.
Normalized-current observations were compared to the control reference of one using two-sided one-sample t-tests. Overall concentration effects were evaluated by one-way ANOVA, with Kruskal–Wallis tests as sensitivity analyses. Shapiro–Wilk testing identified a deviation from normality in the 105 µM quercetin group (p = 0.0194). A two-sided Wilcoxon signed-rank sensitivity analysis against one was therefore also performed for that group. Holm correction was applied within the four concentration-specific comparisons for each flavonol. Raw and adjusted p-values are distinguished in the text.
Kinetic parameters were compared between control and treatment groups using exploratory two-sided Welch t-tests, with two-sided Mann–Whitney U tests as sensitivity analyses. The analyses assumed independent observations because cell identifiers and control–treatment pairing were unavailable in the tabulated data. Therefore, the analysis did not account for potential within-cell pairing or clustering.
For the five combinations of compounds, two-sided one-sample t-tests compared observed normalized currents to fixed multiplicative reference values. The quercetin and morin reference means were calculated from Tables S1 and S2. Simvastatin and mevastatin reference currents at 6 µM were 0.500 and 0.410, respectively, as reported previously [23]. Holm-adjusted p-values across the five comparisons are provided alongside raw p-values. Two-sided p-values are reported numerically, with p < 0.05 used as the nominal threshold.
3. Results
3.1. Quercetin and Morin Reversibly Reduce Kv1.3 Current in Jurkat T Cells
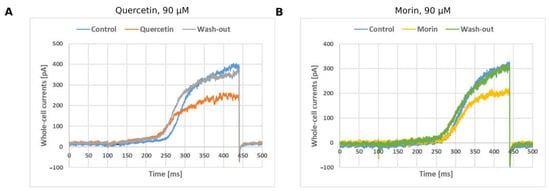
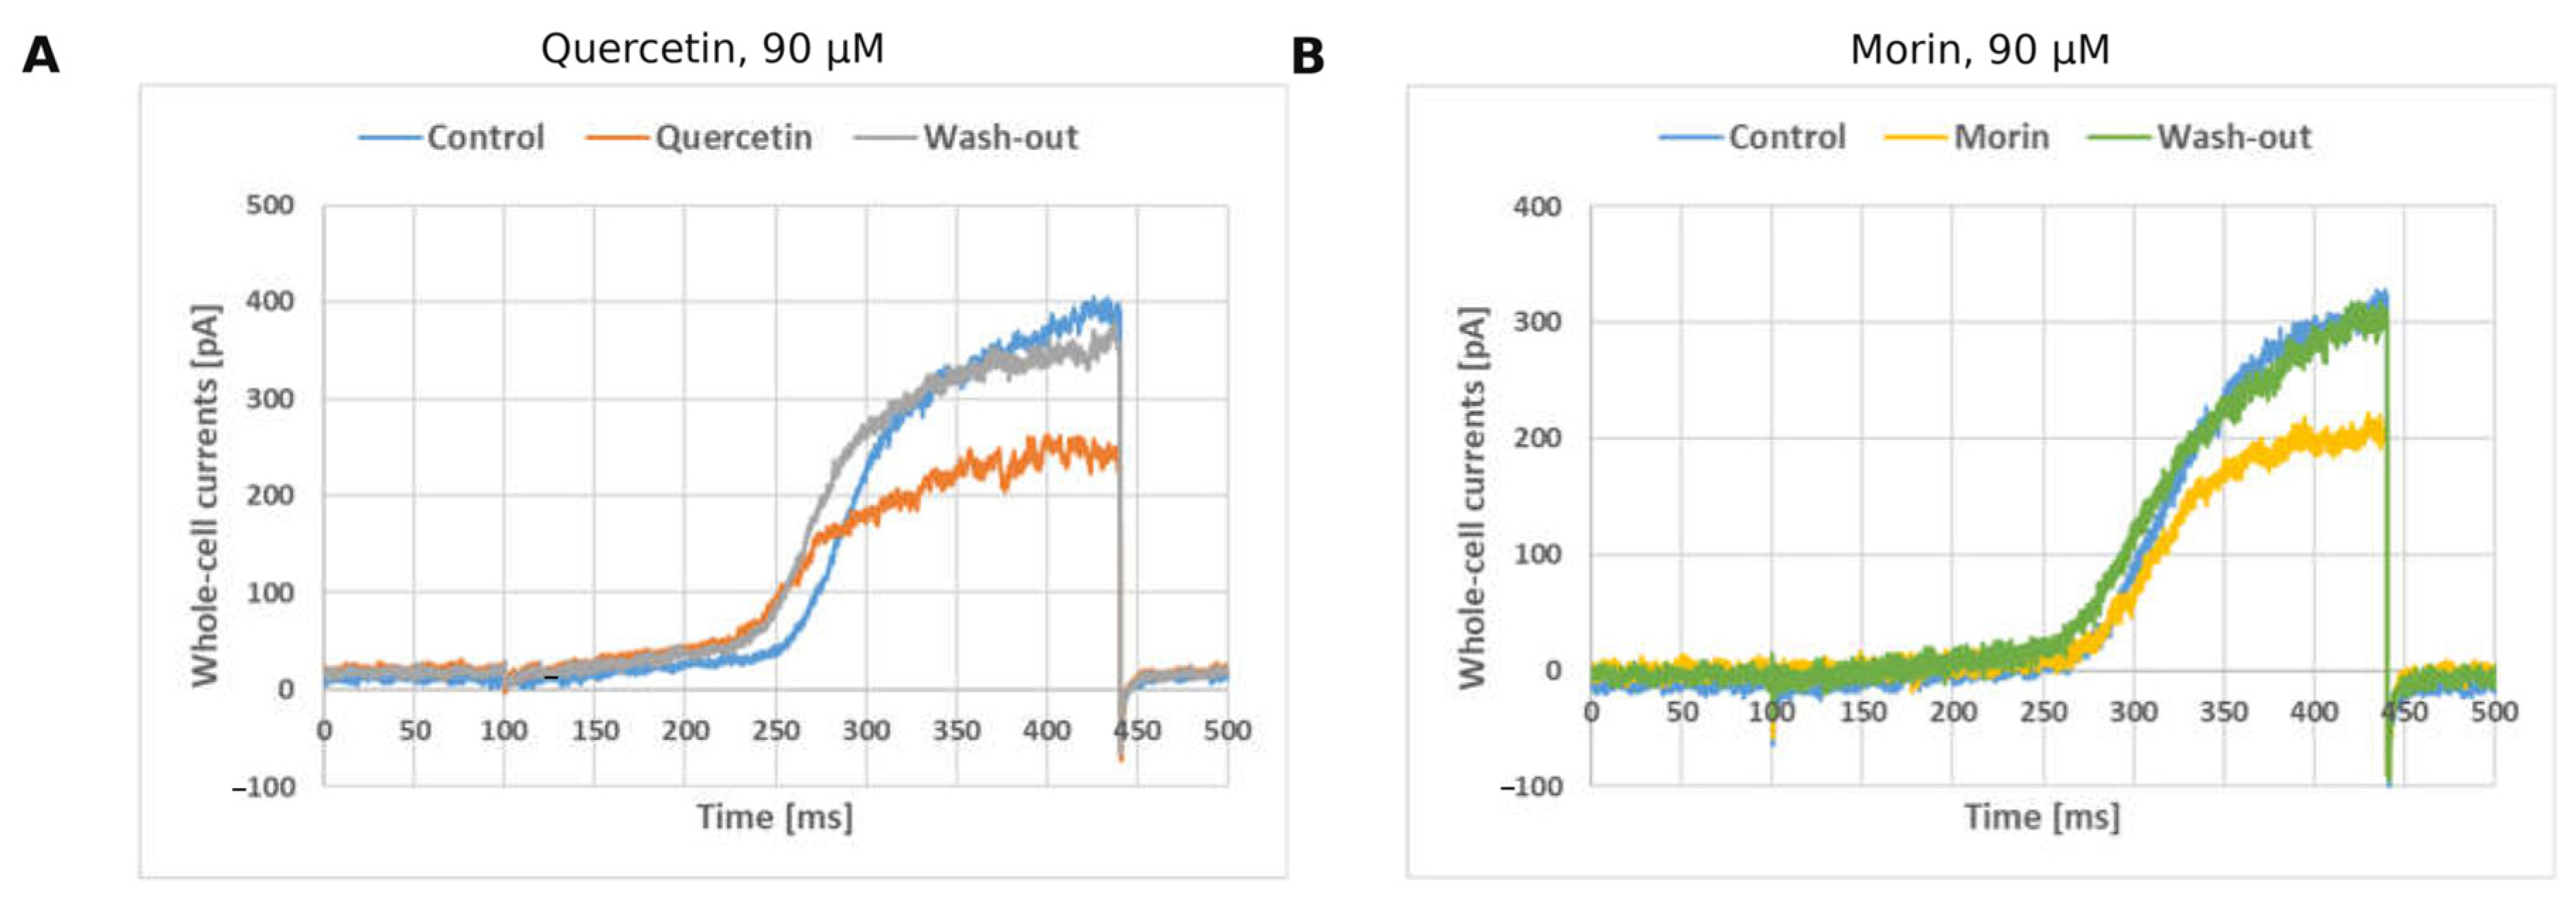
To determine whether quercetin and morin inhibit the Kv1.3 current in Jurkat T cells, and whether such inhibition is reversible, currents were compared before, during and after flavonol application. Representative whole-cell ramp currents recorded in Jurkat T cells are shown under control conditions, during exposure to quercetin or morin, and after washout (Figure 2). Raw ramp currents contained a small approximately linear component attributable to nonspecific leak current and a larger nonlinear outward component consistent with Kv1.3-channel activation [29]. The nonlinear component decreased during flavonol application and recovered after washout, indicating reversible current inhibition in these recordings. The reversibility of this change indicates that the reduction follows from an interaction with the channel that is removed on washout, and not from progressive deterioration of the cell or of the seal, which would not permit recovery of the initial current. It also justifies the use of I/Icontrol, referred to the pre-application current in the same cell, as the measure applied throughout the analyses below.
Figure 2.
Representative whole-cell ramp currents in Jurkat T cells under control conditions, during flavonol application, and after washout for quercetin, 90 µM (A), and morin, 90 µM (B). Ramps ran from −100 to +40 mV over 340 ms, every 30 s, from a holding potential of −90 mV. Each panel shows one representative recording. Quantitative analyses used leak-subtracted current at +40 mV.
3.2. Concentration-Dependent Effects of Quercetin and Morin
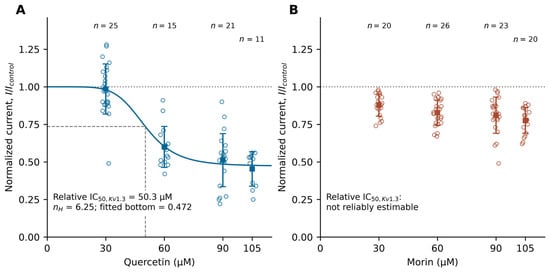
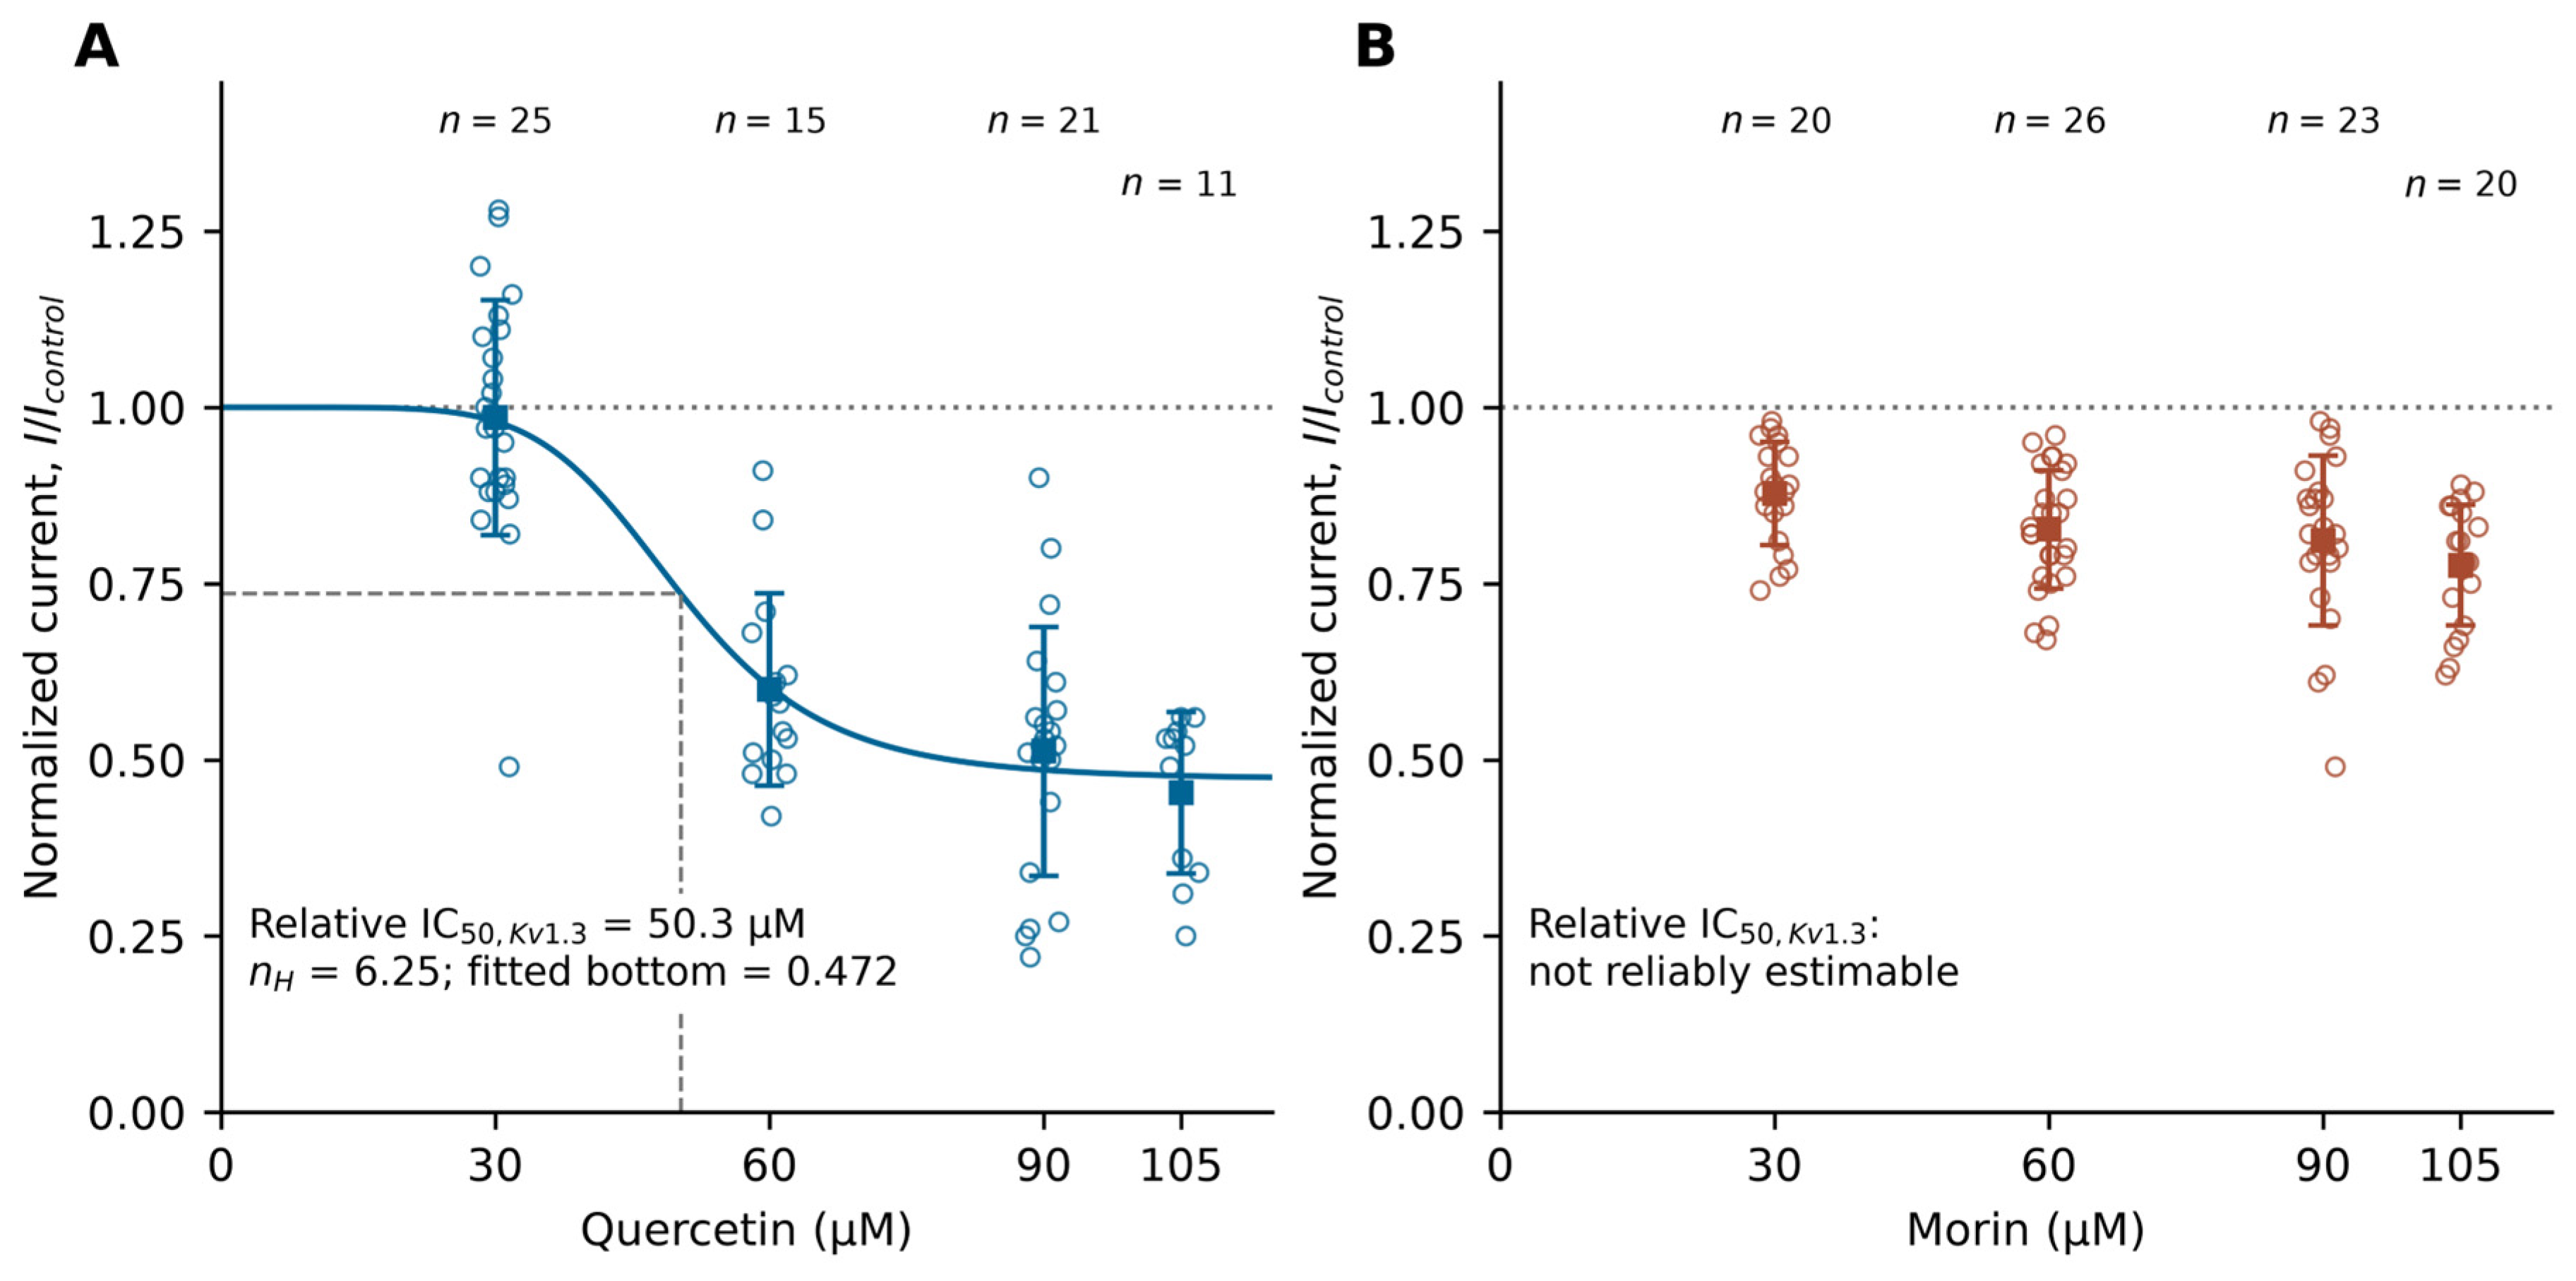
To establish how this inhibition depended on concentration, normalized currents were determined at four quercetin concentrations and compared to the control value of one. Quercetin reduced normalized Kv1.3 current in a concentration-dependent manner (Figure 3A; Table S1). Mean I/Icontrol values at 30, 60, 90, and 105 µM were 0.985 ± 0.167 (n = 25), 0.600 ± 0.137 (n = 15), 0.512 ± 0.176 (n = 21), and 0.454 ± 0.115 (n = 11), respectively. Two-sided one-sample t-tests against one yielded t(24) = −0.44, p = 0.661; t(14) = −11.35, p = 1.91 × 10⁻⁸; t(20) = −12.68, p = 5.09 × 10⁻¹¹; and t(10) = −15.82, p = 2.10 × 10⁻⁸, respectively. Holm-adjusted p-values were 0.661, 5.74 × 10⁻⁸, 2.03 × 10⁻¹⁰, and 5.74 × 10⁻⁸. The overall concentration effect was significant by ANOVA (F(3,68) = 48.24, p = 8.00 × 10⁻¹⁷) and by the Kruskal–Wallis sensitivity test (H(3) = 42.50, p = 3.14 × 10⁻⁹). For 105 µM quercetin, the Wilcoxon sensitivity test also detected a reduction (p = 0.000977). The results indicate a concentration dependence that is threshold-like rather than gradual: the absence of an effect at 30 µM and the loss of two fifths of the current at 60 µM show that the transition occurs within a narrow concentration range, above which the current settles at a reduced but stable level. The consistency between the rank-based and parametric tests suggests that the observed concentration-dependent pattern is robust and not driven by the assumptions of a particular statistical approach.
Figure 3.
Concentration–response relationships for Kv1.3-current inhibition by (A) quercetin and (B) morin in Jurkat T cells. Open circles represent individual normalized-current observations Squares and error bars show mean ± SD. Sample sizes at 30, 60, 90, and 105 µM are 25, 15, 21, and 11 for quercetin, and 20, 26, 23, and 20 for morin. Currents were measured at +40 mV using the ramp protocol described in Figure 2 legend. The dotted line denotes the control reference of one. The solid line in A is the descriptive Hill fit: relative IC50,Kv1.3 = 50.3 µM, nH = 6.25, Ybottom = 0.472, and Ytop = 1. Dashed guides mark the fitted midpoint (normalized current 0.736), not 50% control current. No Hill curve is fitted to morin. Raw one-sample t-test p-values against one, in ascending concentration order are 0.661, 1.91 × 10⁻⁸, 5.09 × 10⁻¹¹, and 2.10 × 10⁻⁸ for quercetin, and 4.82 × 10⁻⁷, 1.14 × 10⁻¹⁰, 1.68 × 10⁻⁷, and 3.69 × 10⁻¹⁰ for morin. ANOVA p-values are 8.00 × 10⁻¹⁷ and 0.00837, respectively. Holm-adjusted results and sensitivity analyses are reported in Section 3.2.
To provide a single measure of potency, a descriptive Hill-type curve was fitted to the mean responses observed at each quercetin concentration. The descriptive Hill fit yielded an apparent relative IC50, Kv1.3 of 50.3 µM, nH = 6.25, and Ybottom = 0.472, with Ytop fixed at one. At this midpoint, predicted normalized current is 0.736, corresponding to 26.4% inhibition relative to control. Thus, 50.3 µM is not the concentration for 50% inhibition of control current. The fitted lower asymptote of 0.472 indicates partial rather than complete inhibition, since about half the current persists at saturating concentrations. The slope factor of 6.25 follows from the abruptness of the transition between 30 and 60 µM. However, since the curve was fitted to only four mean values and was not based on an independent binding model, this parameter should be interpreted as a measure of curve steepness rather than as evidence for a specific number of cooperative binding sites.
To compare the two flavonols under identical conditions, and to thereby assess the influence of B-ring hydroxylation on KB1.3 current, morin was applied in the same concentrations and analyzed in the same way. Morin produced weaker inhibition (Figure 3B; Table S2). At 30, 60, 90, and 105 µM, mean I/Icontrol values were 0.878 ± 0.073 (n = 20), 0.827 ± 0.084 (n = 26), 0.811 ± 0.121 (n = 23), and 0.776 ± 0.085 (n = 20), respectively. One-sample t-tests against one gave t(19) = −7.44, p = 4.82 × 10⁻⁷; t(25) = −10.52, p = 1.14 × 10⁻¹⁰; t(22) = −7.51, p = 1.68 × 10⁻⁷; and t(19) = −11.75, p = 3.69 × 10⁻¹⁰. Holm-adjusted p-values were 4.82 × 10⁻⁷, 4.57 × 10⁻¹⁰, 3.35 × 10⁻⁷, and 1.11 × 10⁻⁹, respectively. ANOVA indicated an overall concentration effect (F(3,85) = 4.17, p = 0.00837), supported by Kruskal–Wallis analysis (H(3) = 11.92, p = 0.00767). The tested range did not define a stable lower asymptote, so a reliable relative IC50, Kv1.3 was not estimated. This did not imply that the MTT viability IC50 exceeded 105 µM. The results indicate inhibition that is statistically robust at every concentration but shallow in extent: the reduction present already at 30 µM deepens by only about a tenth of the control current over a more-than-threefold rise in concentration. This shows that the two flavonols differ in attainable efficacy and not merely in potency, and it accounts for the absence of a fitted midpoint, which cannot be determined without a plateau. Whether this difference in efficacy reflects the different B-ring hydroxylation of the two molecules, the 2′,4′ pattern of morin in place of the 3′,4′-catechol arrangement of quercetin cannot be decided from functional measurements alone.
3.3. Effects of Quercetin and Morin on Activation and Inactivation Kinetics
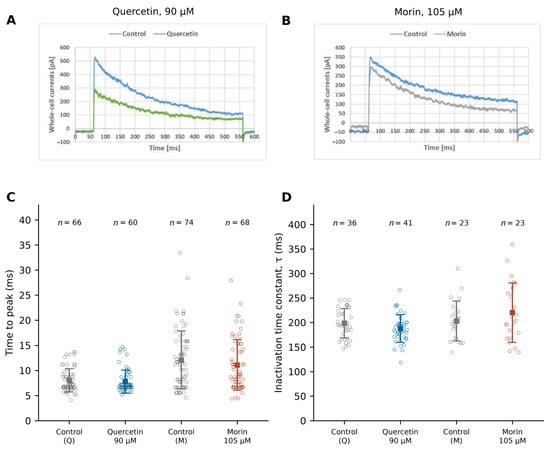
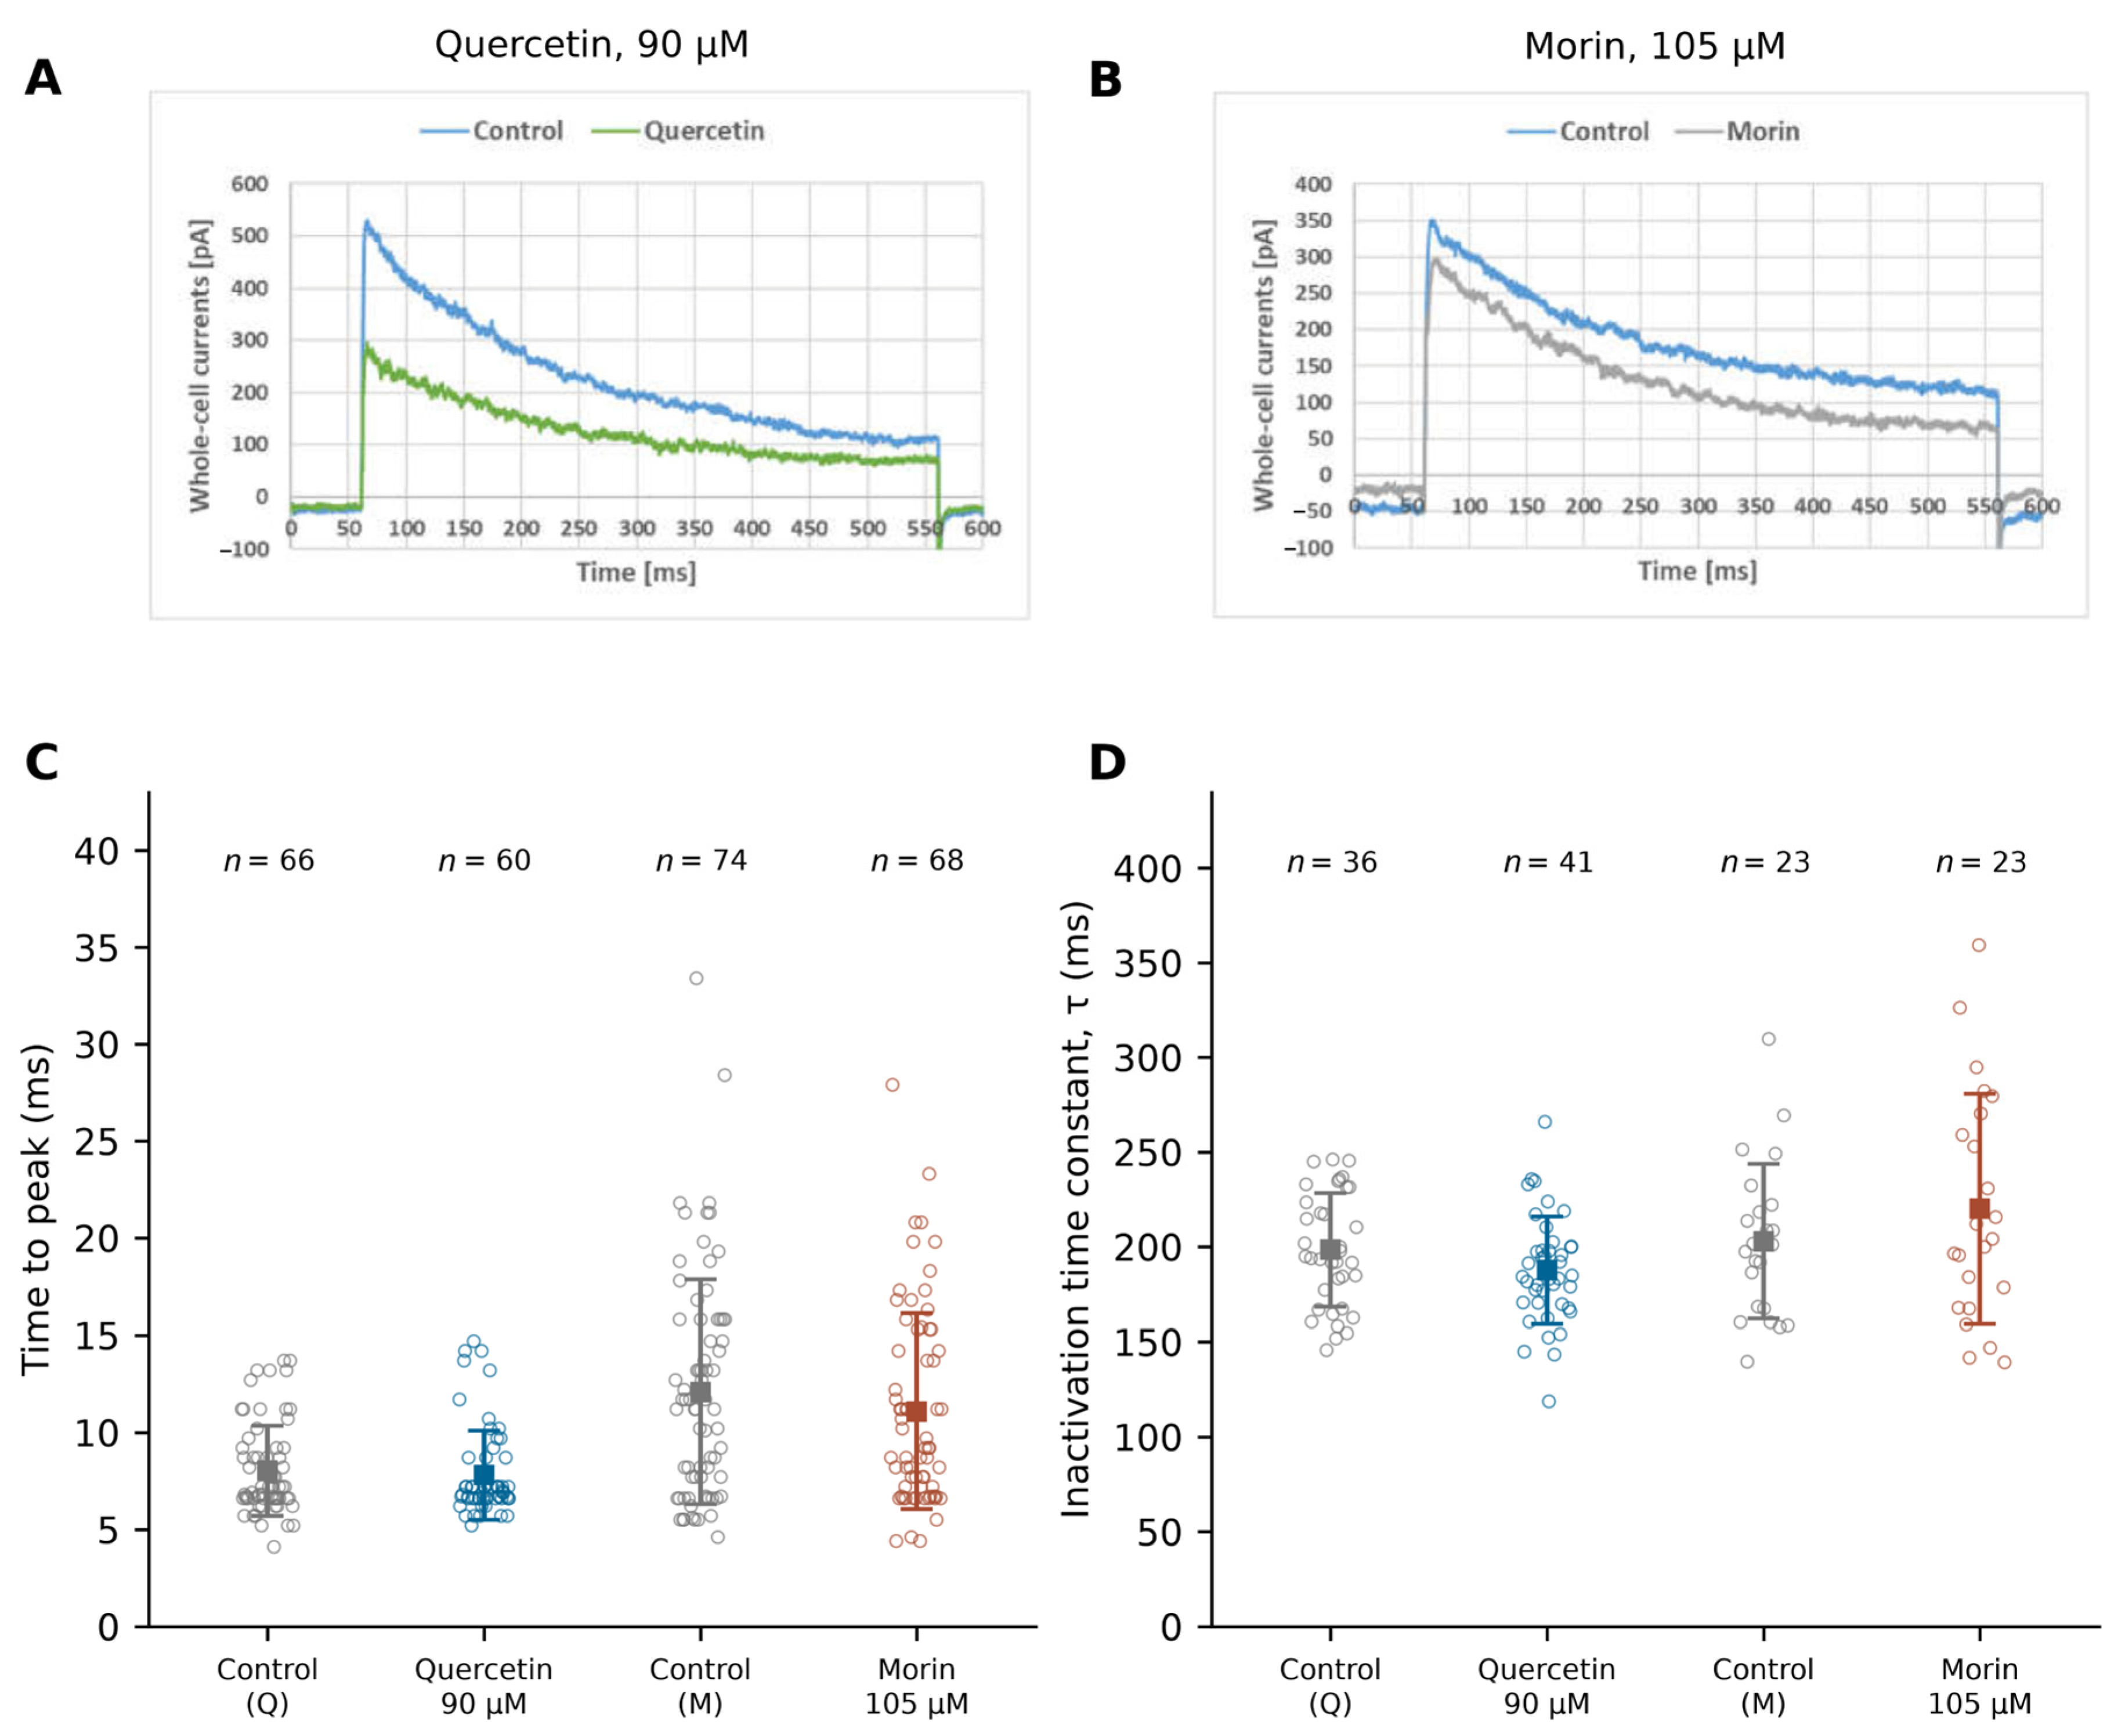
To determine whether the reduced amplitude follows from altered gating rather than from a smaller available conductance, activation was assessed as the interval between the depolarizing step and the peak current. Recalculation from the complete lists in Tables S3 and S4 gave time-to-peak values of 8.03 ± 2.32 ms for control (n = 66) and 7.80 ± 2.29 ms for 90 µM quercetin (n = 60), and 12.08 ± 5.77 ms for control (n = 74) and 11.08 ± 5.04 ms for 105 µM morin (n = 68; Figure 4). Exploratory Welch comparisons yielded p = 0.574 and p = 0.275, respectively; Mann–Whitney sensitivity analyses yielded p = 0.618 and p = 0.402. These unpaired analyses revealed no significant difference; however, this finding alone is insufficient to conclude that activation kinetics remained unchanged. The absence of a detected difference indicates that the currents are reduced without being slowed, which points to a decrease in the conductance available after opening rather than to a change in the activation process itself.
Figure 4.
Activation and inactivation measurements for Kv1.3 current. Representative control and treatment traces for quercetin, 90 µM (A), and morin, 105 µM (B) elicited by 500 ms steps from −90 to +60 mV every 30 s; time to peak (C), and inactivation time constant τ (D). Open circles show all tabulated observations; squares and error bars show mean ± SD. In C, n = 66, 60, 74, and 68; in D, n = 36, 41, 23, and 23, in the displayed group order. Here n counts listed parameter values. Exploratory two-sided Welch p-values for control versus quercetin and control versus morin are 0.574 and 0.275 for C, and 0.112 and 0.264 for D. These comparisons assume independence. Nonparametric sensitivity analyses are reported in Section 3.3.
To establish whether the flavonols promote entry into the inactivated state, the inactivation time constant was determined from the same recordings. The inactivation time constants recalculated from Table S5 were 198.34 ± 30.01 ms for control (n = 36) and 187.61 ± 28.26 ms for 90 µM quercetin (n = 41), and 202.86 ± 40.78 ms for control (n = 23) and 220.13 ± 60.69 ms for 105 µM morin (n = 23; Figure 4). Exploratory Welch comparisons gave p = 0.112 and p = 0.264, respectively; Mann–Whitney sensitivity analyses gave p = 0.136 and p = 0.448. Neither compound accelerated inactivation, and the opposing directions of the two non-significant trends indicate scatter rather than an effect. Together with the unchanged time to peak, this shows that the reduction in amplitude described in Section 3.2 does not follow from altered kinetics, and that it constitutes the primary action of both flavonols on the current.
3.4. Effects of Compound Combinations Compared to a Multiplicative-Independence Model
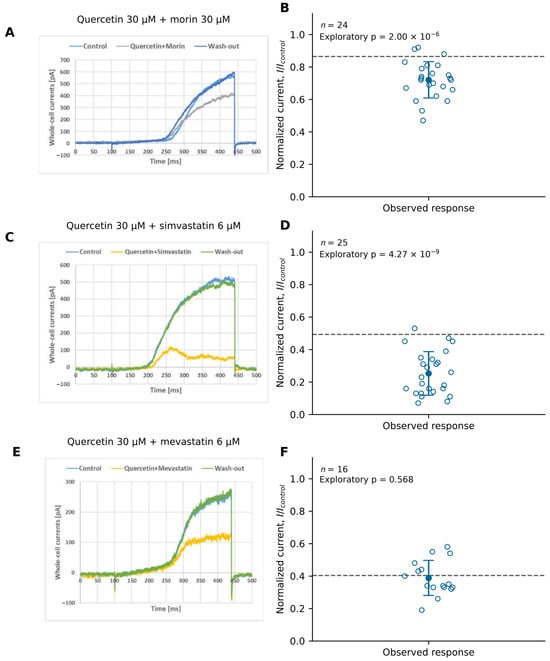
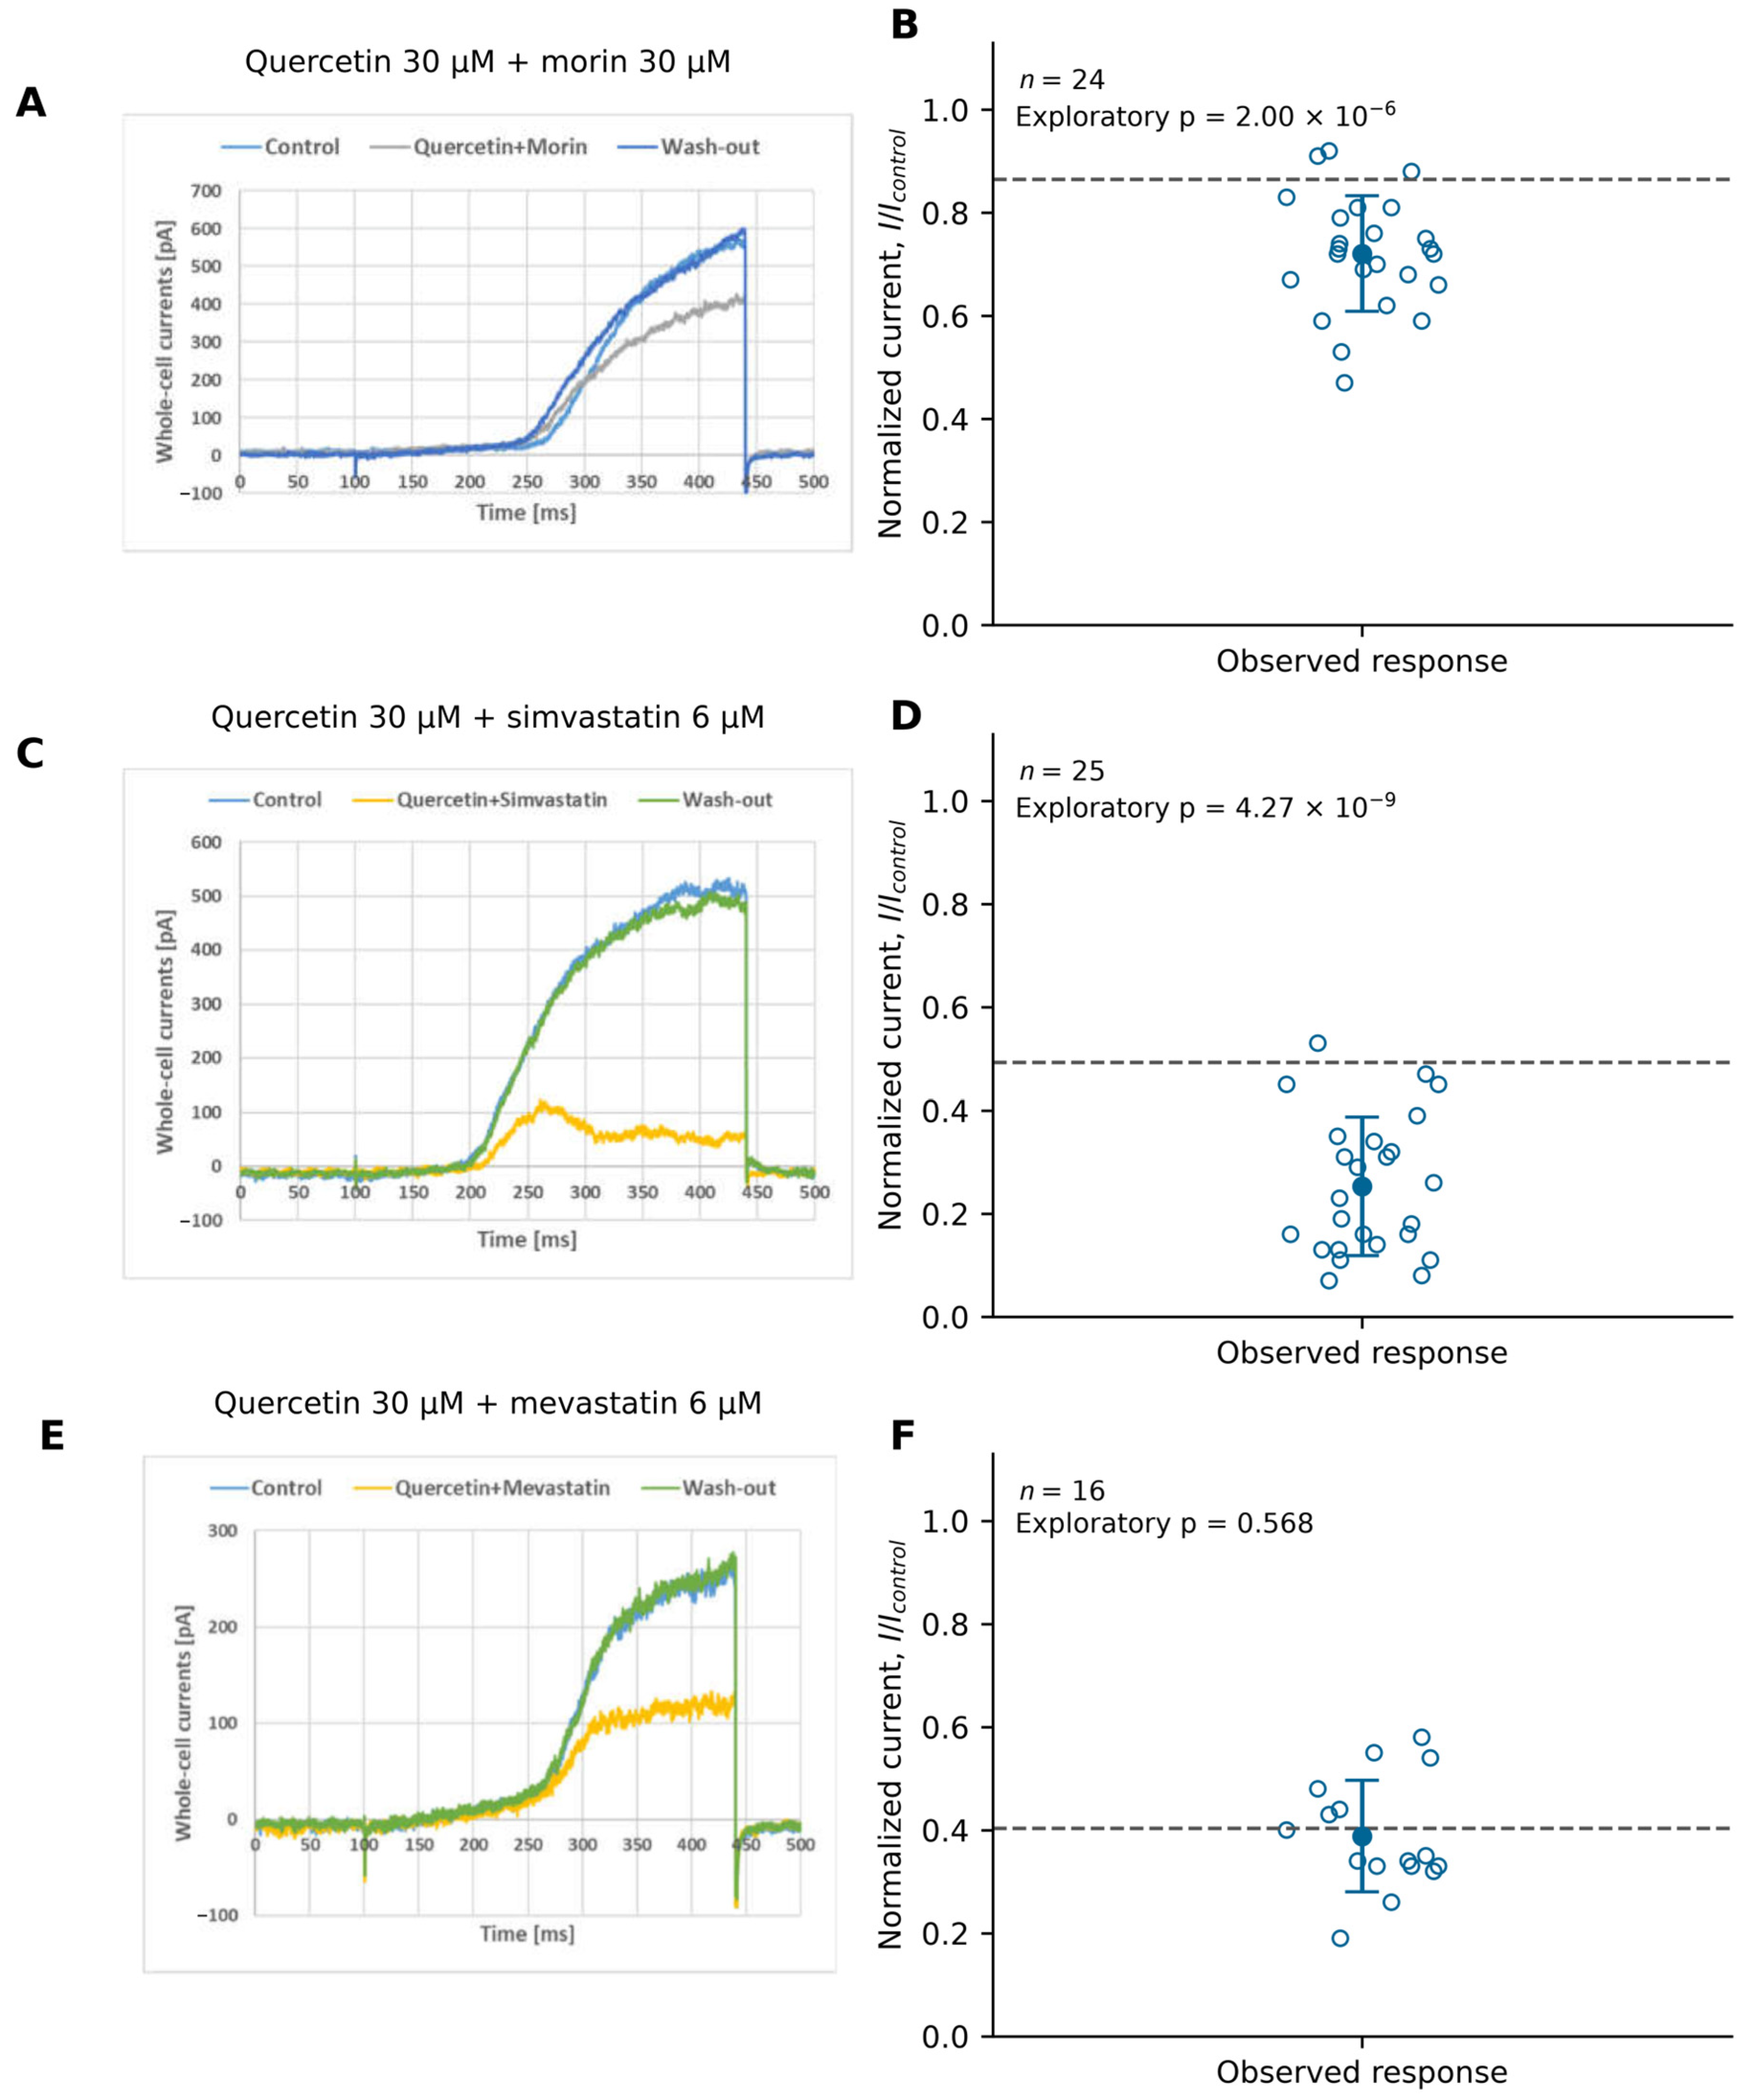
To establish whether the effects of the flavonols and the statins combine independently, five pairs of compounds were co-applied and the observed normalized currents were compared to a multiplicative reference, that is, with the current expected if each compound acted on the channel population without regard to the other. The results are summarized in Table 1 and Figure 5 and Figure 6. Quercetin (30 µM) plus morin (30 µM) yielded a normalized current of 0.721 ± 0.112 (n = 24), below the multiplicative reference of 0.865 (0.9852 × 0.878). The exploratory fixed-reference comparison gave t(23) = −6.30, raw p = 2.00 × 10⁻⁶, and Holm-adjusted p = 8.01 × 10⁻⁶ (Figure 5A,B). The observed current lies below this reference, which indicates inhibition exceeding the multiplicative prediction—the more so because quercetin at 30 µM leaves the current unchanged when applied alone.
Table 1.
Observed normalized Kv1.3 currents compared to fixed multiplicative-independence references.
Figure 5.
Quercetin-containing combinations. (A,B) Quercetin 30 µM plus morin 30 µM. (C,D) Quercetin 30 µM plus simvastatin 6 µM. (E,F) Quercetin 30 µM plus mevastatin 6 µM. Left panels show representative control, co-application, and washout ramp currents. Ramps ran from −100 to +40 mV over 340 ms every 30 s, from −90 mV. Right panels show individual leak-subtracted normalized currents, mean ± SD, and fixed multiplicative predictions (dashed). (B): n = 24, observed = 0.721 ± 0.112, predicted = 0.865, raw p = 2.00 × 10⁻⁶. (D): n = 25, observed = 0.253 ± 0.134, predicted = 0.493, raw p = 4.27 × 10⁻⁹. (F): n = 16, observed = 0.388 ± 0.108, predicted = 0.404, raw p = 0.568. Tests are exploratory two-sided one-sample t-tests against fixed references. Holm-adjusted results appear in Table 1.
Figure 6.
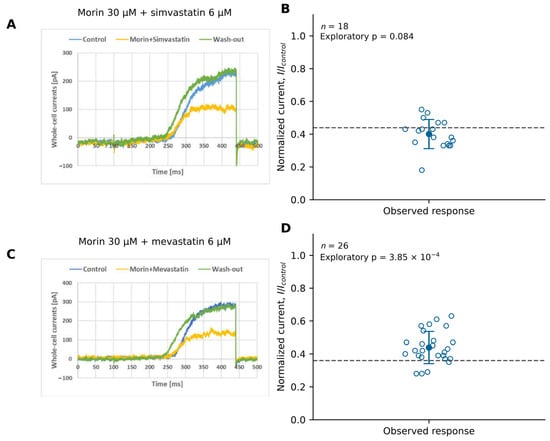
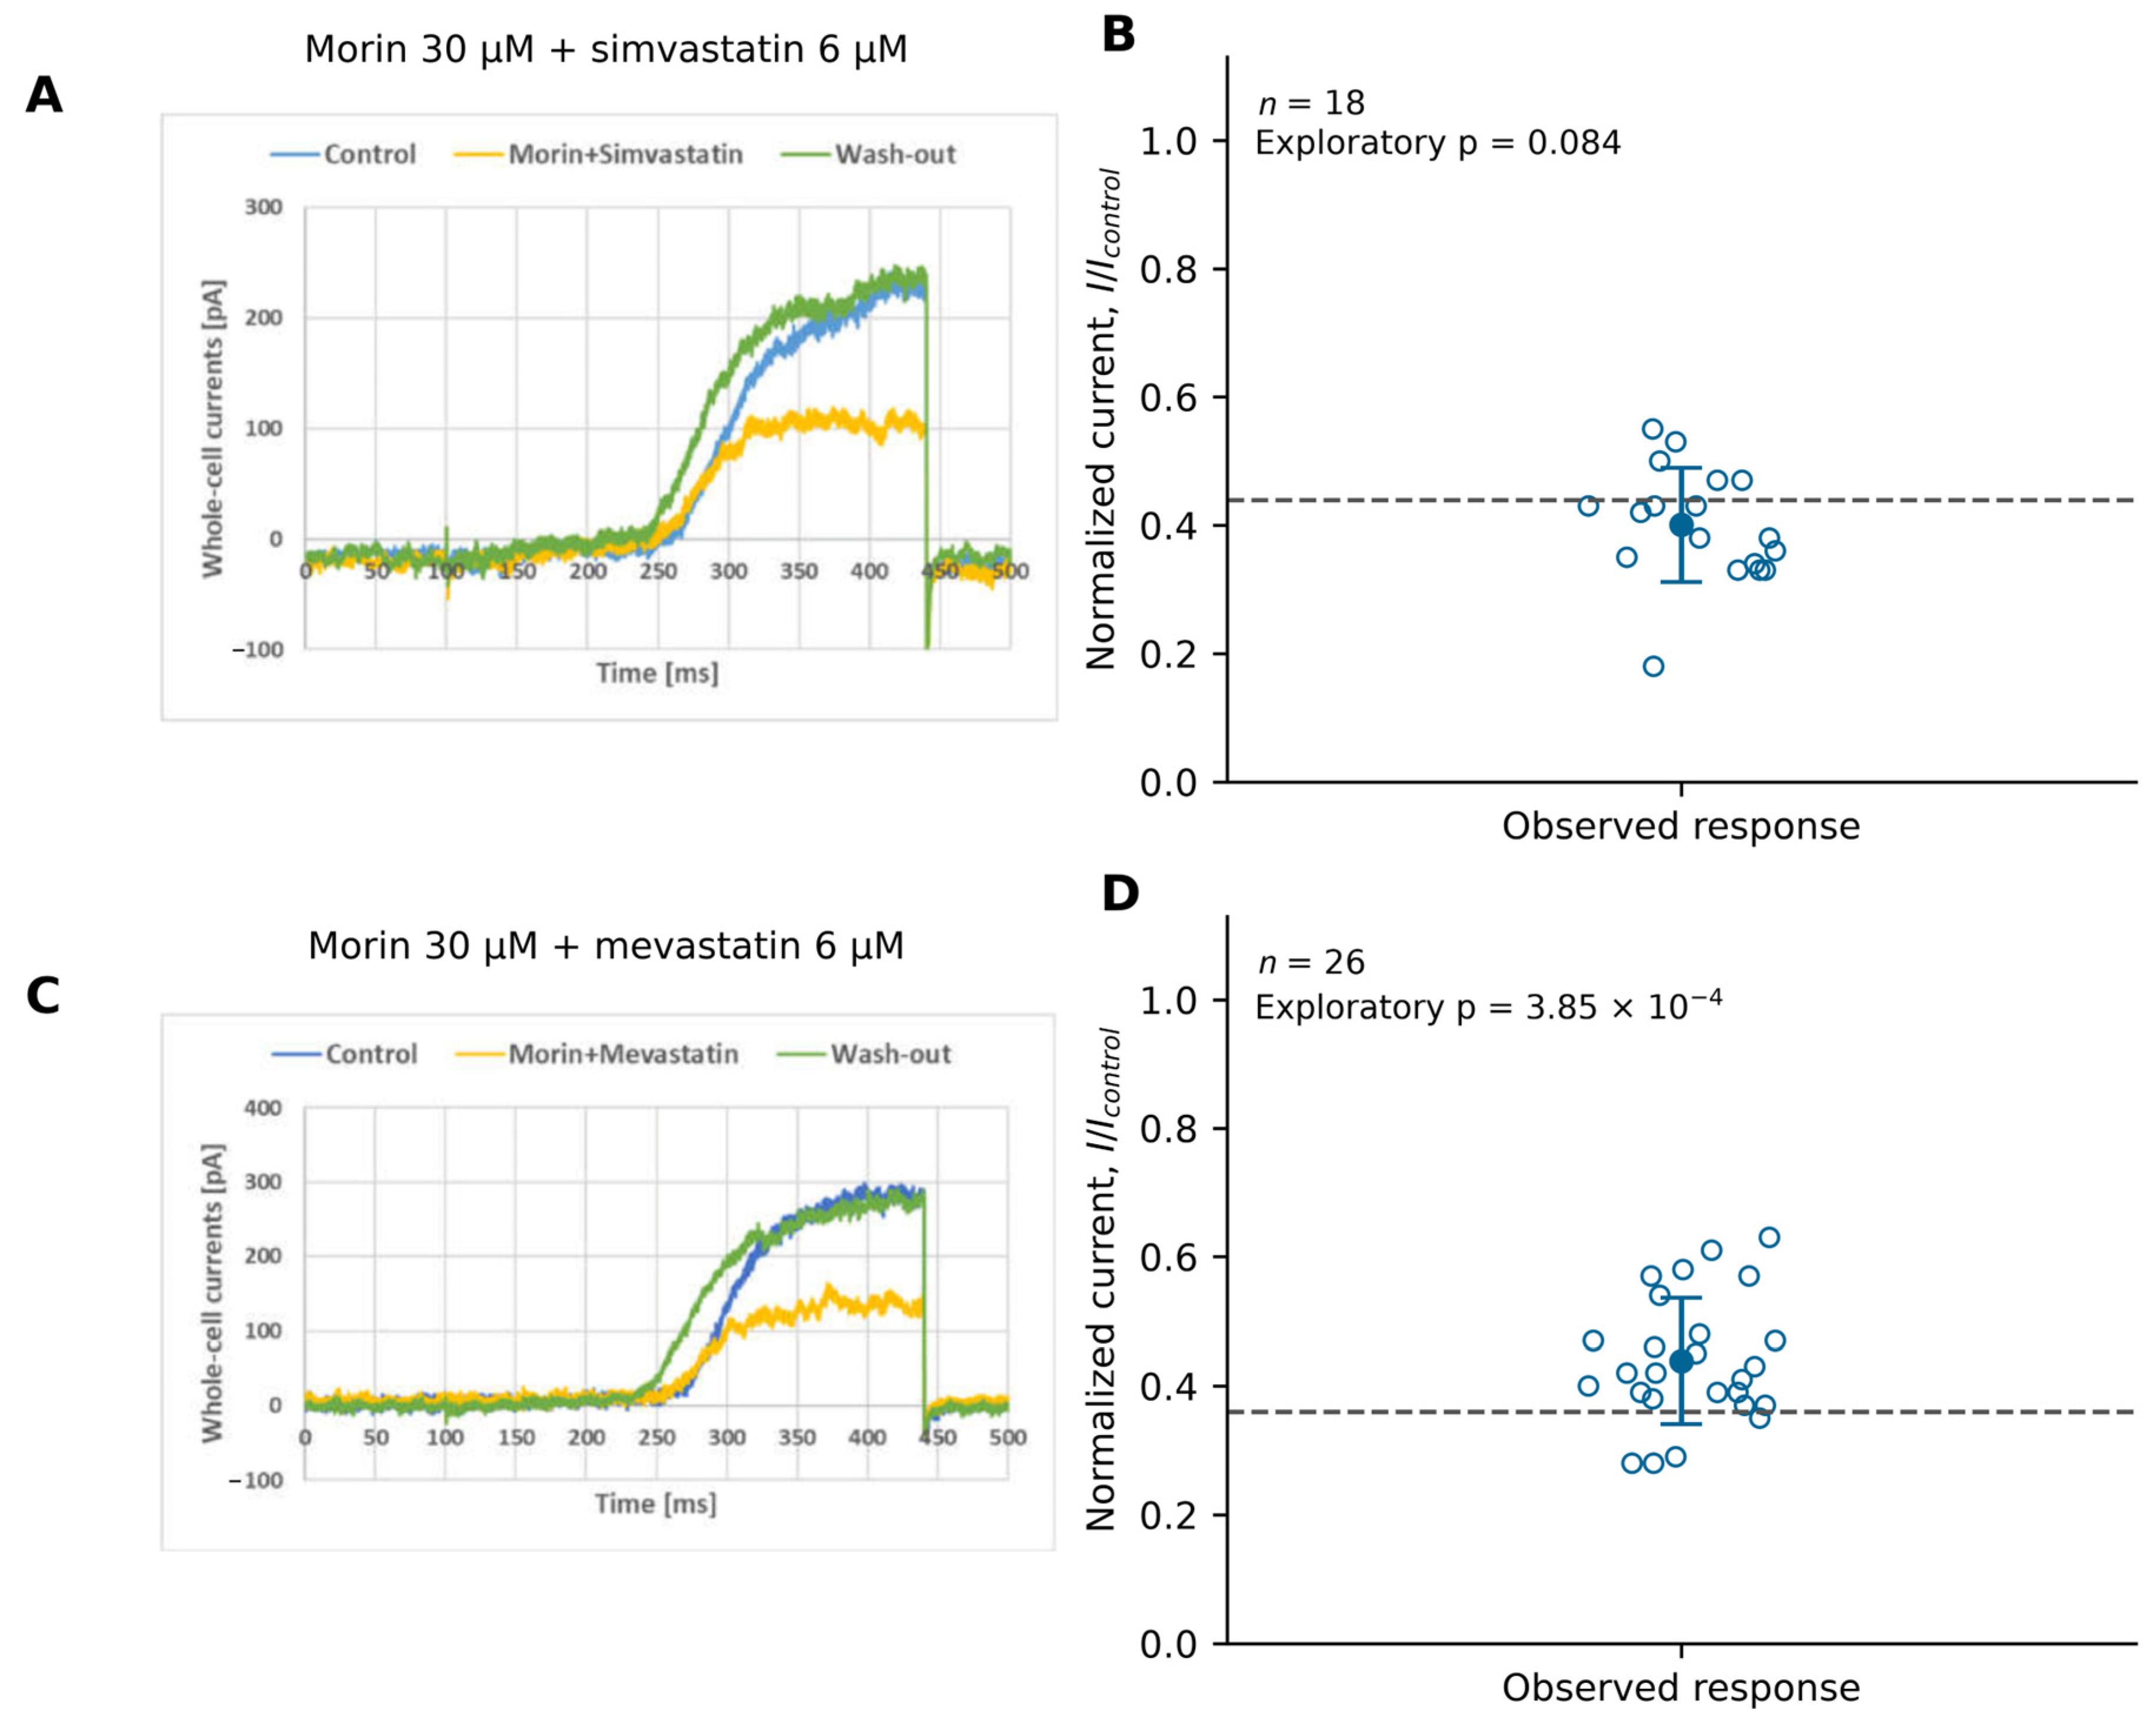
Morin–statin combinations. (A,B) Morin 30 µM plus simvastatin 6 µM. (C,D) Morin 30 µM plus mevastatin 6 µM. Left panels show representative raw control, co-application, and washout currents; right panels show individual normalized-current observations, mean ± SD, and fixed multiplicative references (dashed lines). Ramps ran from −100 to +40 mV over 340 ms every 30 s from −90 mV; quantitative currents were leak-subtracted at +40 mV. (B): n = 18, observed = 0.401 ± 0.089, predicted = 0.439, raw p = 0.0836. (D): n = 26, observed = 0.438 ± 0.098, predicted = 0.360, raw p = 3.85 × 10⁻⁴. Tests are exploratory two-sided one-sample t-tests against fixed references, without propagation of reference uncertainty. Holm-adjusted results appear in Table 1.
Quercetin (30 µM) plus simvastatin (6 µM) yielded 0.253 ± 0.134 (n = 25), compared to a reference of 0.493 (0.9852 × 0.500). The exploratory comparison gave t(24) = −8.93, raw p = 4.27 × 10⁻⁹, and Holm-adjusted p = 2.14 × 10⁻⁸ (Figure 5C,D). This is the largest deviation obtained: the observed current amounts to roughly half the predicted value, which indicates that the combined inhibition considerably exceeds the multiplicative expectation.
Morin (30 µM) plus simvastatin (6 µM) yielded 0.401 ± 0.089 (n = 18), compared to a reference of 0.439 (0.878 × 0.500). No deviation was detected in the exploratory comparison: t(17) = −1.84, raw p = 0.0836, and Holm-adjusted p = 0.167 (Figure 6A,B). The agreement between observation and prediction indicates that the combined effect of this pair requires no assumption beyond independent action.
Quercetin (30 µM) plus mevastatin (6 µM) yielded 0.388 ± 0.108 (n = 16), compared to a reference of 0.404 (0.9852 × 0.410). The exploratory comparison gave t(15) = −0.58, raw p = 0.568, and Holm-adjusted p = 0.568 (Figure 5E,F), without evidence of a deviation from the fixed reference.
Morin (30 µM) plus mevastatin (6 µM) yielded 0.438 ± 0.098 (n = 26), above the reference of 0.360 (0.878 × 0.410). The exploratory comparison gave t(25) = 4.10, raw p = 3.85 × 10⁻⁴, and Holm-adjusted p = 0.00115 (Figure 6C,D). This indicates less inhibition than the fixed-reference prediction; not demonstrated pharmacological observed effects depend on the individual compound rather than the compound class: both quercetin-containing pairs were below the reference value, while morin either matched it or, with mevastatin, exceeded it.
3.5. MTT Viability IC50 Values After 48 h
To relate the concentrations that inhibit the current to those affecting cell survival, metabolic viability was assessed independently after 48 h of exposure. The 48 h MTT viability IC50 estimates were 6.25 µM for quercetin, 30.1 µM for morin, 23 µM for simvastatin, and 30.1 µM for mevastatin (Table 2). Each concentration series was examined in three independent experiments. Quercetin had the lowest IC50 value. For quercetin, the two endpoints differ by approximately an order of magnitude: half the viability signal is lost at 6.25 µM, whereas the current remains unchanged at 30 µM and is clearly reduced only from 60 µM upwards. This indicates that the loss of viability at low-micromolar concentrations does not follow from Kv1.3 inhibition, which becomes relevant only above the viability midpoint.
Table 2.
MTT viability IC50 estimates for individual compounds in Jurkat T cells after 48 h.
4. Discussion
The present experiments were undertaken to characterize the modulation of endogenous Kv1.3 current by two closely related flavonols and to relate that modulation to their effect on cell viability. Quercetin and morin reduced endogenous Kv1.3 current in Jurkat T cells and decreased the 48 h MTT viability as assessed in separate experiments. Quercetin produced a stronger concentration-dependent inhibition of Kv1.3 current than morin over the 30–105 µM concentration range. Recovery of a current after washout supports reversible current modulation, whereas the separate MTT experiments address the effects of prolonged exposure. Both observations fit the pattern described by Richter–Laskowska et al., who concluded in their survey of flavonoid action on potassium channels that both the direction and the magnitude of modulation depend on the channel subtype and on the substitution of the flavonoid molecule [13]. The comparison with other subtypes is instructive here. Yang et al. demonstrated that quercetin activated human Kv1.5 and assigned the effect to residue I502 in the S6 segment [3]; Melnyk et al. reported that liposomal quercetin potentiated Maxi-K openings in smooth muscle [8]; and Kampa et al. showed that the same flavonol activated mitochondrial BKCa channels in endothelial cells [9]. Our results stand in contrast to those reports, since in Jurkat T cell quercetin reduced rather than increased the current, which indicated that the sign of flavonol action could not be transferred between channel subtypes. Within the Kv1.3 literature itself, our findings are, by contrast, in agreement with earlier observations from this laboratory, in which flavonoids, chalcones, statins and other polyphenols inhibited the channel in the high-micromolar range [22,24].
Quercetin’s descriptive Hill fit yielded an apparent relative IC50,Kv1.3 of 50.3 µM and nH = 6.25. With Ytop = 1 and Ybottom = 0.472, this midpoint corresponds to normalized current 0.736, or 26.4% inhibition relative to control. It therefore describes half of the fitted maximal effect rather than 50% blockade of the control current. Morin’s weaker response did not support a reliable relative IC50,Kv1.3 estimate. Importantly, these functional measurements do not determine binding affinity. Because the fitted maximal effect corresponds to partial inhibition, the value obtained here cannot be compared directly with a conventional IC50 values derived from a curve descending to zero, and that distinction has to be kept in view when our midpoint is set beside the potencies reported by Teisseyre et al. for genistein and resveratrol in the same cell model [23]. The persistence of about half the current at saturating concentrations may itself be informative, since it is what would be expected if only part of the channel population, or only certain channel states, were accessible to the compound; and distinguishing these possibilities would require state-dependent protocols rather than the voltage ramps used here.
Quercetin plus morin and quercetin plus simvastatin produced currents below the fixed multiplicative references, whereas morin plus mevastatin produced a current above its reference. No deviation was detected for morin plus simvastatin or quercetin plus mevastatin. These outcomes remained qualitatively unchanged after Holm correction. Comparable behavior has already been described in this cell model. Teisseyre et al. showed that genistein and resveratrol inhibited Kv1.3 channels in cancer cells [23] and, subsequently, that selected chalcones co-applied with other lipophilic compounds inhibited the channel more strongly than either compound alone [28]. Our results are in agreement with those reports in so far as both quercetin-containing pairs suppressed more current than the multiplicative reference predicted. Two mechanisms remain compatible with our data. Both partners are lipophilic and accumulate in the lipid phase of the membrane, so one compound may raise the local concentration of the other or alter its partitioning without any interaction at a shared site. Alternatively, the two may act at distinct sites on the channel whose effects do not combine multiplicatively. The present design cannot separate the putative mechanisms, because a multiplicative reference tests the arithmetic of the combined effect and not its mechanism. The observation that the deviations were confined to quercetin-containing pairs, while morin with mevastatin left more current than predicted, indicated that the effect followed the individual flavonol rather than the compound class, in line with the difference in attainable efficacy shown in Section 3.2.
Human Kv1.3 structures in apo- and dalazatide-bound forms are available and show ligand-associated rearrangement of the selectivity filter [30]. They provide a framework for future structure-guided work, but they do not establish binding sites for quercetin, morin, or statins. The MTT and patch-clamp experiments assessed different endpoints and exposure durations. Quercetin’s 48 h MTT IC50 was 6.25 µM, compared to an apparent relative IC50,Kv1.3 of 50.3 µM, while morin had an MTT IC50 of 30.1 µM despite modest acute current inhibition over 30–105 µM (Table 2). These differences should be interpreted in the context of the two assays rather than as a measure of selectivity or evidence of a causal relationship. MTT measures cellular reducing activity and cannot distinguish reduced proliferation, altered metabolism, and cell death [31]. The size of the gap between the two endpoints may nevertheless have a specific explanation. Gulbins et al. demonstrated that Kv1.3 was present in the inner mitochondrial membrane of lymphocytes and that its inhibition participated in apoptotic signaling [15], and Prosdocimi et al. and Checchetto et al. developed that observation into a strategy for killing tumor cells with mitochondrially directed inhibitors [18,19]. Because our recordings report the plasma-membrane current alone, a compound reaching the mitochondrial pool could affect viability at concentrations below those required to produce a detectable change in whole-cell current. This remains a hypothesis rather than a conclusion, as we neither localized the compounds nor assessed mitochondrial function, and the low-micromolar effect of quercetin on the MTT signal may equally follow from targets unrelated to Kv1.3.
Table 3 places the present findings in the context of reported Kv1.3 inhibition by non-flavonol compounds [32,33,34]. PAP-1 and Psora-4 act in nanomolar concentrations, while clofazimine inhibits human Jurkat Kv1.3 current at submicromolar concentrations. These reports contrast with the high-micromolar concentrations used in the present flavonol experiments. Comparisons require caution, however, because recording protocols differed and the relative midpoint reported here differed from a conventional 50% block endpoint. Measured against PAP-1, and designed by Schmitz et al. as a selective small-molecule blocker [32], the 5-phenylalkoxypsoralens introduced by Vennekamp et al. [33] and clofazimine as characterized by Ren et al. [34], neither flavonol can serve as a selective pharmacological tool for Kv1.3, and the concentrations required here exceed those attainable in plasma after dietary intake. The value of our observations lies elsewhere—in the prospect that a pair of compounds differing only in the position of a single hydroxyl group could, with docking and mutagenesis, help define the structural requirements the channel tolerates, and in the prospect of combining flavonols with drugs already in therapeutic use, for which our statin pairs provide a first indication. Since Tyagi et al. have shown that the selectivity filter of human Kv1.3 rearranges upon ligand binding [30], questions of this kind are now approachable, even though the binding sites of the flavonols themselves remain unknown.
Table 3.
Comparison with reported functional potency of non-flavonol Kv1.3 inhibitors.
5. Conclusions
Quercetin and morin modulated endogenous Kv1.3 current in Jurkat T cells. Quercetin’s apparent relative IC50,Kv1.3 was 50.3 µM for half of the fitted maximal inhibition; a reliable relative midpoint was not established for morin over 30–105 µM. Selected co-applications deviated from fixed multiplicative references, but these exploratory comparisons do not establish pharmacological synergy.
Separate 48 h MTT experiments yielded viability IC50 estimates of 6.25 µM for quercetin, 30.1 µM for morin, 23 µM for simvastatin, and 30.1 µM for mevastatin. The relationship between these metabolic-viability effects and Kv1.3 inhibition remains to be established. Further studies are needed to assess the underlying mechanisms, cellular selectivity, and potential therapeutic relevance.
Supplementary Materials
The following supporting information can be downloaded at https://www.mdpi.com/article/10.3390/membranes16110372/s1, Table S1: quercetin: normalized KV1.3 currents Individual normalized currents for quercetin; Table S2: morin: normalized KV1.3 currentsIndividual normalized currents for morin; Table S3: quercetin: time to peakTime-to-peak values for quercetin; Table S4: morin: time to peak Time-to-peak values for morin; Table S5: Inactivation time constants; Table S6: compound combinations: normalized Kv1.3 currents Normalized currents for compound combinations.
Author Contributions
Conceptualization, A.T., A.P.-Ł. and K.Ś.-P.; methodology, K.Ś.-P., A.T. and A.U.; software, A.T.; validation, A.T.; formal analysis, A.T.; investigation, K.Ś.-P., O.W., M.P. and A.T.; resources, A.P.-Ł., K.Ś.-P. and A.U.; data curation, A.T., A.P.-Ł. and K.Ś.-P.; writing—original draft preparation, A.T.; writing—review and editing, A.T., O.W. and K.Ś.-P.; visualization, A.T. and M.P.; supervision, A.T., A.P.-Ł. and K.Ś.-P.; project administration, A.T., A.P.-Ł. and K.Ś.-P.; funding acquisition, A.T., A.P.-Ł. and K.Ś.-P. All authors have read and agreed to the published version of the manuscript.
Funding
This research was funded by Polish Ministry of Research and Higher Education funds allocated to Wrocław Medical University.
Institutional Review Board Statement
Not applicable.
Informed Consent Statement
Not applicable.
Data Availability Statement
The individual electrophysiological values used in the analyses are provided in Tables S1–S6. Additional data supporting this study are available on request from the corresponding author.
Acknowledgments
The authors thank Przemysław Gogolewski for valuable technical assistance. During preparation of this revision, GenAI Claude opus 5.5 was used to language correction and to create the graphics for the graphical abstract (the authors determined its scientific content, and reviewed the final version).
Conflicts of Interest
The authors declare no conflicts of interest.
Abbreviations
The following abbreviations are used in this manuscript:
| BKCa | Large-conductance calcium-activated potassium channel |
| IC50,MTT | 48 h MTT viability concentration–response midpoint estimate |
| IC50,Kv1.3 | Concentration producing half of the fitted maximal Kv1.3-current inhibition |
| Kv1.3 | Voltage-gated potassium channel Kv1.3 |
| MTT | 3-(4,5-Dimethylthiazol-2-yl)-2,5-diphenyl-2H-tetrazolium bromide |
| ROS | Reactive oxygen species |
| SD | Standard deviation |
| Tpeak | Time-to-peak current |
| τ | Inactivation time constant |
References
- Wang, W.; Sun, C.; Mao, L.; Ma, P.; Liu, F.; Yang, J.; Gao, Y. The biological activities, chemical stability, metabolism and delivery systems of quercetin: A review. Trends Food Sci. Technol. 2016, 56, 21–38. [Google Scholar] [CrossRef] [Scilit]
- Sithara, T.; Arun, K.; Syama, H.; Reshmitha, T.; Nisha, P. Morin inhibits proliferation of SW480 colorectal cancer cells by inducing apoptosis mediated by reactive oxygen species formation and uncoupling of warburg effect. Front. Pharmacol. 2017, 8, 640. [Google Scholar] [CrossRef] [Scilit] [PubMed]
- Yang, L.; Ma, J.; Zhang, P.; Zou, A.; Tu, D. Quercetin activates human Kv1.5 channels by a residue I502 in the S6 segment. Clin. Exp. Pharmacol. Physiol. 2009, 36, 154–161. [Google Scholar] [CrossRef] [Scilit] [PubMed]
- Zitron, E.; Scholz, E.; Owen, R.W.; LücK, S.; Kiesecker, C.; Thomas, D.; Kathöfer, S.; Niroomand, F.; Kiehn, J.; Kreye, V.A.; et al. QTc prolongation by grapefruit juice and its potential pharmacological basis. Circulation 2005, 111, 835–838. [Google Scholar] [CrossRef] [Scilit] [PubMed]
- Sun, X.; Xu, B.; Xue, Y.; Li, H.; Zhang, H.; Zhang, Y.; Kang, L.; Zhang, X.; Zhang, J.; Jia, Z.; et al. Characterization and structure-activity relationship of natural flavonoids as hERG K+ channel modulators. Int. Immunopharmacol. 2017, 45, 187–193. [Google Scholar] [CrossRef] [Scilit] [PubMed]
- Morales-Cano, D.; Menendez, C.; Moreno, E.; Moral-Sanz, J.; Barreira, B.; Galindo, P.; Pandolfi, R.; Jimenez, R.; Moreno, L.; Cogolludo, A.; et al. The flavonoid quercetin reverses pulmonary hypertension in rats. PLoS ONE 2014, 9, e114492. [Google Scholar] [CrossRef] [Scilit] [PubMed]
- Kim, Y.; Kim, W.; Cha, E. Quercetin-induced growth inhibition in human bladder cancer cells is associated with an increase in Ca2+-activated K+ channels. Korean J. Physiol. Pharmacol. 2011, 15, 279–283. [Google Scholar] [CrossRef] [Scilit] [PubMed]
- Melnyk, M.; Dryn, D.; Al Kury, L.; Zholos, A.; Soloviev, A. Liposomal quercetin potentiates maxi-K-channel openings in smooth muscles and restores its activity after oxidative stress. J. Liposome Res. 2019, 29, 94–101. [Google Scholar] [CrossRef] [Scilit] [PubMed]
- Kampa, R.; Sęk, A.; Szewczyk, A.; Bednarczyk, P. Cytoprotective effects of the flavonoid quercetin by activating mitochondrial BKCa channels in endothelial cells. Biomed. Pharmacother. 2021, 142, 112039. [Google Scholar] [CrossRef] [Scilit] [PubMed]
- Kampa, P.; Gliździńska, A.; Szewczyk, A.; Bednarczyk, P.; Filipek, S. Flavonoid quercetin abolishes paxilline inhibition of the mitochondrial BKCa channel. Mitochondrion 2022, 65, 23–32. [Google Scholar] [CrossRef] [Scilit] [PubMed]
- Trezza, A.; Cicaloni, V.; Porciatti, P.; Langella, A.; Fusi, F.; Saponara, S.; Spiga, O. From in silico to in vitro: A trip to reveal flavonoid binding on the Rattus norvegicus Kir6.1 ATP-sensitive inward rectifier potassium channels. PeerJ 2018, 6, e4680. [Google Scholar] [CrossRef] [Scilit] [PubMed]
- Rameshrad, M.; Omidkhoda, S.; Razavi, B.M.; Hosseinzadeh, H. Evaluating the possible role of mitochondrial ATP-sensitive potassium channels in the cardioprotective effects of morin in the isolated rat heart. Life Sci. 2021, 264, 118659. [Google Scholar] [CrossRef] [Scilit] [PubMed]
- Richter-Laskowska, M.; Trybek, P.; Delfino, V.; Wawrzkiewicz-Jałowiecka, A. Flavonoids as modulators of potassium channels. Int. J. Mol. Sci. 2023, 24, 1311. [Google Scholar] [CrossRef] [Scilit] [PubMed]
- Gutman, G.A.; Chandy, K.G.; Grissmer, S.; Lazdunski, M.; Mckinnon, D.; Pardo, L.A.; Robertson, G.A.; Rudy, B.; Sanguinetti, M.C.; Stühmer, W.; et al. International union of pharmacology. LIII. Nomenclature and molecular relationships of voltage-gated potassium channels. Pharmacol. Rev. 2005, 57, 473–508. [Google Scholar] [CrossRef] [Scilit] [PubMed]
- Gulbins, E.; Sassi, N.; Grassmé, H.; Zoratti, M.; Szabò, I. Role of Kv1.3 mitochondrial potassium channels in apoptotic signaling in lymphocytes. Biochim. Biophys. Acta Bioenerg. 2010, 1797, 1251–1259. [Google Scholar] [CrossRef] [Scilit] [PubMed]
- Pérez-Verdaguer, M.; Càrpeta, J.; Serrano-Novillo, C.; Estadella, I.; Sastre, D.; Felipe, A. The voltage-gated potassium channel Kv1.3 is a promising multitherapeutic target against human pathologies. Expert Opin. Ther. Targets 2016, 20, 577–591. [Google Scholar] [CrossRef] [Scilit] [PubMed]
- Serrano-Albarrás, A.; Estadella, I.; Cirera-Rocosa, S.; Navarro-Pérez, M.; Felipe, A. Kv1.3: A Multifunctional Channel with Many Pathological Implications. Expert Opin. Ther. Targets 2018, 22, 101–105. [Google Scholar] [CrossRef] [Scilit] [PubMed]
- Prosdocimi, E.; Checchetto, V.; Leanza, L. Targeting the mitochondrial potassium channel Kv1.3 to kill cancer cells: Drugs, strategies and new perspectives. SLAS Discov. 2019, 24, 882–892. [Google Scholar] [CrossRef] [Scilit] [PubMed]
- Checchetto, V.; Prosdocimi, E.; Leanza, L. Mitochondrial Kv1.3: A New target in cancer biology? Cell. Physiol. Biochem. 2019, 53, 52–62. [Google Scholar] [CrossRef] [Scilit] [PubMed]
- Teisseyre, A.; Palko-Labuz, A.; Środa-Pomianek, K.; Michalak, K. Voltage-gated potassium channel Kv1.3 as a target in therapy of cancer. Front. Oncol. 2019, 9, 933. [Google Scholar] [CrossRef] [Scilit] [PubMed]
- Cheng, S.; Jiang, D.; Lan, X.; Liu, K.; Fan, C. Voltage-gated potassium channel Kv1.3: A promising molecular target in multiple disease therapy. Biomed. Pharmacother. 2024, 175, 116651. [Google Scholar] [CrossRef] [Scilit] [PubMed]
- Teisseyre, A.; Środa-Pomianek, K.; Palko-Łabuz, A. The influence of naturally occurring flavonoids, chalcones and statins on the activity of voltage-gated potassium channels Kv1.3 and viability of Kv1.3 channel-expressing cancer cells. J. Mol. Struct. 2024, 1307, 137967. [Google Scholar] [CrossRef] [Scilit]
- Teisseyre, A.; Uryga, A.; Środa-Pomianek, K.; Palko-Labuz, A. Genistein and resveratrol: Inhibitors of Kv1.3 channels in cancer cells. Membranes 2026, 16, 159. [Google Scholar] [CrossRef] [Scilit] [PubMed]
- Teisseyre, A.; Środa-Pomianek, K.; Palko-Labuz, A. Modulatory effects of selected flavonoids and other polyphenols on the activity of voltage-gated potassium channels Kv1.3. In Flavonoids—Biochemistry, Molecular Mechanisms, and Biological Roles [Working Title]; IntechOpen: London, UK, 2026. [Google Scholar] [CrossRef] [Scilit]
- Grissmer, S.; Nguyen, A.N.; Cahalan, M.D. Calcium-activated potassium channels in resting and activated human T lymphocytes. Expression levels, calcium dependence, ion selectivity, and pharmacology. J. Gen. Physiol. 1993, 102, 601–630. [Google Scholar] [CrossRef] [Scilit] [PubMed]
- Grissmer, S.; Lewis, R.S.; Cahalan, M.D. Ca2+-activated K+ channels in human leukemic T cells. J. Gen. Physiol. 1992, 99, 63–84. [Google Scholar] [CrossRef] [Scilit] [PubMed]
- Hamill, O.P.; Marty, A.; Neher, E.; Sakmann, B.; Sigworth, F.J. Improved patch-clamp techniques for high-resolution current recording from cells and cell-free membrane patches. Pflügers Arch. 1981, 391, 85–100. [Google Scholar] [CrossRef] [Scilit] [PubMed]
- Teisseyre, A.; Środa-Pomianek, K.; Uryga, A.; Kostrzewa-Susłow, E.; Palko-Łabuz, A. Co-inhibition of Kv1.3 channel activity by selected chalcones and statins in a model of cancer cell line Jurkat T. Molecules 2026, 31, 766. [Google Scholar] [CrossRef] [Scilit] [PubMed]
- Teisseyre, A.; Mozrzymas, J.W. Inhibition of the activity of T lymphocyte Kv1.3 channels by extracellular zinc. Biochem. Pharmacol. 2002, 64, 595–607. [Google Scholar] [CrossRef] [Scilit] [PubMed]
- Tyagi, A.; Ahmed, T.; Jian, S.; Bajaj, S.; Ong, S.T.; Goay, S.S.M.; Zhao, Y.; Vorobyov, I.; Tian, C.; Chandy, K.G.; et al. Rearrangement of a unique Kv1.3 selectivity filter conformation upon binding of a drug. Proc. Natl. Acad. Sci. USA 2022, 119, e2113536119. [Google Scholar] [CrossRef] [Scilit] [PubMed]
- Stepanenko, A.A.; Dmitrenko, V.V. Pitfalls of the MTT assay: Direct and off-target effects of inhibitors can result in over/underestimation of cell viability. Gene 2015, 574, 193–203. [Google Scholar] [CrossRef] [Scilit] [PubMed]
- Schmitz, A.; Sankaranarayanan, A.; Azam, P.; Schmidt-Lassen, K.; Homerick, D.; Hänsel, W.; Wulff, H. Design of PAP-1, a selective small molecule Kv1.3 blocker, for the suppression of effector memory T cells in autoimmune diseases. Mol. Pharmacol. 2005, 68, 1254–1270. [Google Scholar] [CrossRef] [Scilit] [PubMed]
- Vennekamp, J.; Wulff, H.; Beeton, C.; Calabresi, P.A.; Grissmer, S.; Hänsel, W.; Chandy, K.G. Kv1.3-blocking 5-phenylalkoxypsoralens: A new class of immunomodulators. Mol. Pharmacol. 2004, 65, 1364–1374. [Google Scholar] [CrossRef] [Scilit] [PubMed]
- Ren, Y.R.; Pan, F.; Parvez, S.; Fleig, A.; Chong, C.R.; Xu, J.; Dang, Y.; Zhang, J.; Jiang, H.; Penner, R.; et al. Clofazimine inhibits human Kv1.3 potassium channel by perturbing calcium oscillation in T lymphocytes. PLoS ONE 2008, 3, e4009. [Google Scholar] [CrossRef] [Scilit] [PubMed]

Disclaimer/Publisher’s Note: The statements, opinions and data contained in all publications are solely those of the individual author(s) and contributor(s) and not of MDPI and/or the editor(s). MDPI and/or the editor(s) disclaim responsibility for any injury to people or property resulting from any ideas, methods, instructions or products referred to in the content. |
© 2026 by the authors. Licensee MDPI, Basel, Switzerland. This article is an open access article distributed under the terms and conditions of the Creative Commons Attribution (CC BY) license.