


Abstract
Background/Objectives: Personalised neoantigen vaccines can now be manufactured within weeks, so what a patient receives is decided by which mutations are selected. Selection is organised around predicted peptide–MHC binding, yet presentation also requires that the mutation is transcribed, carried by enough of the tumour, and restricted by an HLA allele the malignant cells still express. A vaccine is also a set rather than a ranked list, and its epitopes must finally be joined into one construct. EvoSet-NeoVax carries these three problems through one label-blind workflow. Methods: Public neoantigen and non-small-cell lung cancer data were harmonised under a typed schema preserving missing values, partitioned under audited leakage control, and used to freeze six comparators. Results: A missingness-aware logistic model reached a precision–recall AUC of 0.869 on the internal test partition of 30 candidates, the best of the six on all five metrics, although no pairwise difference survives Holm correction across the fifteen comparisons. On the external TESLA set all six fell to chance, with receiver-operating-characteristic areas between 0.401 and 0.484. Combining predicted binding with within-patient expression, variant allele frequency and immunopeptidome evidence, twenty peptide records were selected for patient A144 across five retained HLA alleles and both HLA classes, resolving to nineteen mutations in nineteen genes, of which eighteen passed native-flank verification and entered the final modules; none matches the reviewed human proteome exactly. An independent-ranking top-K baseline cannot meet the composition constraints on this pool, and a retrospective comparison against the cohort’s 68 ELISpot outcomes separated neither ranking. Junction-specific linker optimisation reduced predicted linker-overlapping windows from 18 to 11 at high priority and from 88 to 42 at weak priority, and the optimised modules were encoded as three open reading frames of 744, 633 and 531 nucleotides passing exact translation back-check, folding to −268.20, −204.10 and −178.80 kcal/mol, and cloning in silico into an Addgene-verified T7 backbone with exact insert recovery. Conclusions: EvoSet-NeoVax provides a reproducible framework for translating tumour genomic evidence into sequence-verified, synthesis-ready neoantigen vaccine constructs.
1. Introduction
Tumours are visible to T cells because they are genetically different from the tissue they arise in. Somatic mutations that alter a protein-coding sequence generate peptides with no counterpart in the normal proteome, and because those peptides were never present during thymic selection, the T-cell repertoire directed against them escapes central tolerance [1]. This places neoantigens in a category of their own. Unlike tumour-associated self antigens, they are confined to malignant cells, so a response raised against them carries little risk of on-target damage to healthy tissue [2]. Non-small-cell lung cancer (NSCLC) is an informative setting for this biology: tobacco-associated mutagenesis leaves a high somatic mutation burden [3], mutation burden tracks clinical benefit from immune checkpoint blockade across lung cohorts [4,5], and T cells recognising mutant peptides can be recovered directly from resected lung tumours [6]. Turning that biology into a therapeutic has become practical. Synthetic long peptide and messenger RNA platforms allow a mutation set called from one patient’s tumour to be manufactured within weeks, and the process and regulatory groundwork laid during the development of mRNA vaccines against SARS-CoV-2 removed much of the delivery risk [7,8,9,10]. Individualised neoantigen vaccines have since induced de novo, polyfunctional CD4 and CD8 responses against mutations that were not immunogenic before vaccination, with responses persisting for years in melanoma [11,12,13] and associating with delayed recurrence in resected pancreatic cancer [14]. A randomised adjuvant melanoma trial reported improved recurrence-free survival when an individualised mRNA vaccine was added to checkpoint blockade [15], and personalised neoantigen vaccines have been reviewed across indications and manufacturing routes [16,17]. Delivery is no longer the constraint. What decides whether such a vaccine can work in a given patient is which mutations are put into it.
Candidate selection is currently organised around predicted peptide–MHC binding. Variant calls are translated into every mutant peptide of appropriate length, each is scored against the patient’s HLA alleles by a trained predictor, and pipelines such as pVACtools assemble and rank the result [18]. Predictor accuracy improved substantially once eluted-ligand data from mass spectrometry were incorporated alongside measured binding affinities [19,20]. The scale of the output is what makes the task difficult. An exome carrying a few hundred coding mutations yields thousands of predicted binders per patient, of which only a small minority elicit a detectable T-cell response when tested [21]. The TESLA consortium quantified this across laboratories on a common set of candidates and found that binding prediction alone separated immunogenic from non-immunogenic peptides poorly, while expression, binding stability, hydrophobicity near the anchor residues, and dissimilarity from the wild-type peptide each carried additional information [22]. Those additional correlates point at something a binding score cannot represent. For a mutant peptide to reach the surface of a tumour cell, the mutation must be transcribed, it must be carried by enough of the tumour to matter, and the HLA allele that would present it must still be expressed by the malignant cells. Each of these conditions fails often enough to matter. Mutations confined to a minority subclone give rise to responses that cannot reach the bulk of the disease [23,24], and loss of heterozygosity at the HLA locus arises in a substantial fraction of NSCLC, removing an entire restriction element together with every neoantigen that depends on it [25]. Immunopeptidomic evidence that the source protein is genuinely sampled by the presentation pathway is seldom used at the ranking stage, even where it exists for the same cohort. Treating these as filters applied after ranking, rather than as evidence contributing to the rank itself, leaves candidates near the top of the list that the tumour is not in a position to present.
A second constraint is structural rather than biological. A vaccine is a set of fixed size, commonly ten to twenty epitopes, and not a ranked list. Scoring each candidate independently optimises the elements in isolation, so the head of a ranked list is often occupied by overlapping peptides from one gene, restricted by one allele, differing only by a shifted register. The properties that matter for the product are joint: how many distinct HLA alleles are engaged, whether class I and class II are both represented, how many independent genes and tumour clones are covered, and how much redundancy the set carries. Composition is constrained once more when the chosen epitopes are assembled into a physical construct. Concatenating epitopes creates a junction sequence present in no tumour protein, and the linkers chosen at those junctions govern both how the construct is processed and whether the junctions themselves generate binders that compete with the intended epitopes [26,27]. Preserving the residues that natively flank each mutation is one way to keep proteasomal context intact [28]. Evidence weighting, set composition, and construct design are usually handled as separate problems, by different tools, at different stages, and against different endpoints. To our knowledge they have not been carried through a single provenance-controlled workflow in which ranking stays blind to the assay labels later used to evaluate it, and in which one selected set is followed as far as a synthesisable sequence for a named patient.
Here, we present EvoSet-NeoVax, a framework built to span that distance. It harmonises public neoantigen and cohort data under one typed schema that preserves missing biological values rather than imputing them, and it scores candidates by combining predicted binding with within-patient expression, variant allele frequency, and immunopeptidome evidence into a single label-blind measure of immune visibility. Selection is then posed as a constrained set problem rather than a ranking, with explicit terms for candidate quality, sequence diversity, and HLA, gene, and clone breadth, and with hard requirements for tumour evidence and retained HLA. The clone-breadth term carries zero weight in the worked case, because the cohort reports neither cancer-cell fraction nor clonal assignment for these candidates, and we claim no clone-coverage result. Applying the framework to patient A144 of a published NSCLC cohort [29], we follow one twenty-epitope set from candidate scoring through blinded reagent design, human proteome specificity screening, multi-epitope construct assembly, junction screening and linker redesign, and native-flank recovery, to three platform-neutral messenger RNA open reading frames, so that every step from a public variant call to a synthesisable sequence is explicit and reproducible.
2. Materials and Methods
2.1. Study Design
We built a single reproducible pipeline that starts from provenance-locked public data and ends at platform-neutral messenger RNA open reading frames for one worked patient case in non-small-cell lung cancer (NSCLC). The pipeline has five stages that run in fixed order: data harmonisation under an explicit schema, leakage-controlled partitioning, candidate-level and patient-level immunogenicity modelling, constrained multi-objective vaccine-set selection, and antigen-cassette design with junction, structure, sequence, and cloning audits. Every stage writes immutable artefacts, refuses to overwrite an existing output directory, and records a run manifest containing resolved parameters, input and split hashes, environment details, seeds, and timestamps. The worked case is patient A144 from a published NSCLC cohort. A144 was carried through candidate selection, blinded reagent-panel construction, multi-epitope construct assembly, junction optimisation, native-flank consolidation, and coding-sequence design. All selection and ranking steps were label-blind: measured interferon-gamma ELISpot outcomes were used only for retrospective evaluation and never entered any score, weight, or ranking input. The software implementing every step is distributed as the Python package evoset-neovax version 0.3.0, with a command-line interface that reproduces each artefact reported here.
2.2. Data Sources and Provenance Control
Five public sources were used. Each is pinned by a manifest under data/manifests/ recording the exact retrieval URL, access date, licence note, raw filename, SHA-256 checksum, and the parser module that consumes it. Downloads are verified against the recorded checksum before parsing, and a checksum mismatch aborts the run. The immunogenicity training source was ITSNdb, retrieved at repository on 23 June 2026. Parsing yielded 199 paired mutant and wild-type records, comprising 129 immunogenic and 70 non-immunogenic candidates across 31 distinct HLA references, with no exact duplicates. The external evaluation source was the CC BY 4.0 Mendeley redistribution of the TESLA tested neoepitope table (DOI 10.17632/6x87nx8jtc.1), retrieved on 23 June 2026. Parsing yielded 711 unique candidate rows, 33 positive and 678 negative, together with three recorded duplicate groups. TSNAdb v2 [30,31] supplied 1439 valid positive-reference candidates; 417 rows whose MHC annotation failed normalisation were retained in a rejection table rather than discarded silently. The official IEDB T-cell archive [32] was retrieved and checksum-verified for provenance completeness. HLA protein references were built from the release-tagged IPD-IMGT/HLA protein FASTA v3.65.0-alpha [33]. The patient-linked cohort was the complete supplementary data package of Nicholas et al. [28], retrieved at repository commit 8d161fe on 24 June 2026. Tables S1 and S4–S9 of that cohort were used: patient and HLA typing (Table S1), allele-specific HLA loss of heterozygosity (Tables S4 and S5), the complete class-I and class-II pVACseq prediction pools (Tables S6 and S7), the immunopeptidome-enriched shared-protein table (Table S8), and the tested-candidate ELISpot table (Table S9). Parsing the complete pools produced 154,461 patient-specific peptide-HLA predictions across 24 biological patients after mapping source sample A146P7 to patient A146 [29]. Exact joins on patient, gene, mutant peptide, and normalised HLA allele recovered 69 HLA-linked tested candidates, of which 68 carry a strict binary ELISpot outcome (8 Strong and 60 None) and one carries a Weak outcome.
2.3. Canonical Schema and Harmonisation
All sources were mapped into five canonical tables defined as typed Pydantic models: candidates, patients, HLA, T-cell receptors, and longitudinal variants. Every column named by the schema is required at each processing boundary, and each mapping from a source column to a canonical column is declared explicitly in the corresponding parser rather than inferred. Nullability is enforced as a biological statement. Missing RNA expression, DNA and RNA variant allele frequency, copy number, cancer-cell fraction, and assay labels remain null and are never imputed to zero at the data boundary. Labels accept only 0, 1, or null, so an unassayed candidate is never converted into a negative. Variant allele frequency and cancer-cell fraction must lie in the closed interval [0, 1]. Mutation positions use one-based indexing and may not exceed the peptide length. Peptide length must equal the length of the mutant peptide and, when a wild-type counterpart is present, the two must be equal in length. HLA alleles are normalised to star-and-colon nomenclature such as HLA-A*02:01. Source-specific provenance columns are carried through unchanged so that any harmonised row can be traced to its original record. Harmonised tables are written to Parquet with an accompanying quality-control report that records per-column missingness, value ranges, class balance, and the number and reason of every rejected row.
2.4. Deduplication and Label Consensus
Exact duplicates were collapsed on a candidate key composed of the patient identifier, mutant peptide, wild-type peptide, and normalised HLA allele. Within each duplicate group, a binary label was assigned only when all observed values agreed. Disagreement was recorded as an explicit conflict flag for that label rather than resolved by majority vote, and the complete duplicate and conflict report was written alongside the deduplicated table. Three duplicate groups were recorded for TESLA, and none for ITSNdb.
2.5. Leakage-Controlled Partitioning
Six grouping strategies are implemented: patient-held-out, peptide-cluster, cohort-held-out, HLA-held-out, cancer-type-held-out, and temporal. Assignment operates on groups rather than rows, so every row sharing a group identifier lands in the same partition. Group order is shuffled with a seeded NumPy generator (default seed 42) and split at 0.70 train and 0.15 validation, leaving the remainder as test. At least three independent groups are required. Peptide grouping uses transitive single-linkage clustering on aligned positional identity. For two peptides a and b of equal length L, identity is defined by Equation (1):
Peptides of unequal length are treated as non-neighbours by construction. Any pair with ID greater than or equal to 0.8 is merged into one cluster. When patient identifiers are complete, peptide clusters that share a patient are further merged by a union-find pass, so a patient cannot be split across partitions through peptide-cluster membership. Every split is audited before use. The audit reports cross-partition overlap of patient identifiers, of exact candidate keys, and of near-identical peptides at the same 0.8 identity threshold, and it writes the findings next to the assignment table. The frozen ITSNdb peptide-cluster split used in this work contains 138 training, 31 validation, and 30 test rows, with 18 positive and 12 negative observed labels in the test partition, and the audit recorded zero exact and zero near-peptide cross-partition overlap. Equation (1) is a conservative neighbour detector, and two of its properties limit what the audit sees. It assigns zero identity to any pair of unequal length, and it compares two registers of one sequence position by position, so a sliding window over a single mutation scores as unrelated. The frozen partitions reported here were built with Equation (1) as specified. For the composition audit of a selected set we also compute an alignment-based overlap, the length of the longest common substring divided by the shorter peptide length, and we group candidates by the annotated mutation key of Section 2.21 whenever set composition is reported.
2.6. Candidate Feature Representation
Classical models consume a fitted, missingness-aware encoder that is fitted on the training partition only and then applied unchanged to validation, test, and external tables. Peptide features comprise length, the twenty amino-acid composition fractions, mean Kyte–Doolittle hydropathy [34], mean residue mass, mean charge, and aromaticity, computed separately for the mutant peptide and, when present, for the wild-type peptide. Substitution features comprise the signed mutant-minus-wild-type differences in hydropathy, mass, charge, and aromaticity, a binary indicator that the substitution changed the sequence, and the mutation position expressed relative to peptide length. When a wild-type counterpart is absent, its peptide block is set to a zero vector so that the feature dimension is fixed. Seven numeric fields (RNA expression, mutant RNA expression, DNA variant allele frequency, RNA variant allele frequency, copy number, cancer-cell fraction, and assay value) each contribute two columns: the value, median-imputed using the training-partition median, and an explicit binary missingness indicator. Five categorical fields (HLA allele, tumour type, gene, clonal status, and mutation type) are one-hot encoded with an explicit <MISSING> level and handle_unknown=“ignore”, so an allele unseen during training produces an all-zero block rather than an error. Numeric columns are standardised with statistics estimated on the training partition alone. The assay value field records the mean spot-forming-cell count of the mutant peptide where a source reports one. Only the NSCLC cohort parser populates it, and the ITSNdb, TESLA and TSNAdb parsers set it to null by construction, so the field is null in all 199 rows of the source used to train and evaluate every model reported here. Median imputation then returns one value for every row and the missingness indicator is one for every row, so both derived columns have zero variance and the training-partition scaler maps them to exactly zero. Section 3.3 reports the ablation that confirms this empirically. The NSCLC cohort was never used for training, and its assay values entered no score, weight or ranking input at any stage.
2.7. Candidate-Level Models
Six candidate-level comparators were trained on the same frozen split with the same seed, then locked before evaluation. They do not share one input representation. The three classical models consume the fitted missingness-aware encoder of Section 2.6. The convolutional and transformer baselines consume the tokenised mutant peptide sequence alone. The multitask model consumes the paired mutant and wild-type peptides, the HLA protein sequence, and the masked tumour and evolution context blocks. The comparison is therefore between model families on their native inputs.
2.7.1. Classical Models
Logistic regression was fitted with max_iter = 2000, class_weight = “balanced”, and random_state = 42. The random forest used 500 trees, min_samples_leaf = 2, class_weight = “balanced_subsample”, and random_state = 42. XGBoost [35] used 500 estimators, max_depth = 4, learning_rate = 0.05, subsample = 0.8, colsample_bytree = 0.8, eval_metric = “logloss”, and random_state = 42. Hyperparameter exploration used a deterministic grouped search driven by JSON grids under configs/search/, scored on the validation partition only.
2.7.2. Peptide-Only Neural Baselines
Amino-acid sequences were tokenized over a 27-symbol vocabulary comprising a padding symbol, the twenty standard residues, and the ambiguity codes B, X, Z, J, U, and O, with unknown characters mapped to X. A validity mask marks real positions. The convolutional baseline embeds tokens in 32 dimensions, applies one 64-channel one-dimensional convolution with kernel size 3 and padding 1, applies a GELU non-linearity, performs padding-safe global maximum pooling, and projects to a 64-dimensional representation. The transformer baseline embeds tokens in 64 dimensions, applies two TransformerEncoderLayer blocks with 4 attention heads and feed-forward width 256, dropout 0.1, and no positional encoding, then applies masked mean pooling and a 64-dimensional linear projection. Both feed a single linear immunogenicity head. Training used AdamW, learning rate 1 × 10⁻³, batch size 64, 20 epochs, and seed 42, with deterministic CPU and CUDA seeding.
2.7.3. Mutant/Wild-Type Multitask Model
The multitask candidate model encodes the mutant and wild-type peptides with one shared transformer encoder and fuses them as the concatenation of the mutant representation, the wild-type representation, their signed difference, their absolute difference, and their elementwise product, giving a five-block counterfactual representation that is projected through a linear, GELU, and LayerNorm stack to 128 dimensions. A second encoder embeds the HLA protein sequence. Tumour context (8 features) and static evolution context (6 features) are each encoded by a masked numeric encoder that concatenates the zero-filled values with their explicit observation mask before projection to 32 dimensions, so missingness is a model input rather than a silent zero. An optional T-cell receptor encoder can be attached at the same fusion point. The fused representation passes through a linear, GELU, dropout 0.1, and LayerNorm block, and feeds five independent linear heads: presentation, immunogenicity, T-cell-receptor recognition, persistence, and historical selection. Because different sources observe different endpoints, the model is trained under a masked multitask objective that evaluates each head only on the rows where that head’s label is observed, as given by Equation (2):
Here, T is the set of task heads, Ot is the observed index set for head t, Lt is the mean binary cross-entropy of head t over its observed rows, wt is the task weight (1.0 by default), and L evaluates to zero when every Ot is empty. Training used AdamW with learning rate 1 × 10⁻³ for 10 epochs with checkpointing, and the resulting checkpoint, learned representations, predictions, metrics, and run manifest were written to a locked artefact directory.
2.8. Patient-Level Set Encoders
Two permutation-invariant encoders score a whole patient candidate pool jointly. Variable-length patient sets are padded to the batch maximum and accompanied by a validity mask; padded positions are excluded from every pooling operation and their logits are set to negative infinity. The Deep Sets encoder maps each candidate through a linear and GELU block, forms a masked patient context by pooling over valid elements as given by Equation (3), concatenates that context back onto every candidate, and scores each candidate through a second linear and GELU block followed by a linear head:
Here, xj is candidate j, mj in (0, 1) is its validity mask, φ is the shared candidate encoder, and c is the patient context vector. The Set Transformer encoder projects candidates to 128 dimensions and applies two TransformerEncoderLayer blocks with 4 heads, batch-first ordering, and key padding masks, with no positional encoding, so candidate ordering carries no information. A linear head returns one context-aware logit per valid candidate.
2.9. Constrained Multi-Objective Vaccine-Set Selection
Selection returns a set rather than a ranking, and therefore optimises quality jointly with diversity and breadth under hard feasibility constraints. Hard constraints are: a capacity K; a minimum number of distinct retained HLA alleles; a maximum number of candidates per gene; a requirement that each candidate carry positive tumour evidence in RNA expression or DNA variant allele frequency; and exclusion of any candidate restricted by an HLA allele recorded as lost in that tumour. Uniqueness of candidate identifiers and of mutant peptides is enforced, and a returned set that violates any constraint raises an error rather than being silently repaired. Set redundancy is the mean pairwise identity among the selected mutant peptides, using the identity of Equation (1):
The set objective combines summed candidate quality with breadth rewards and two penalties, as given by Equation (5):
Here, si is the candidate quality score; H(S), G(S), and C(S) are the sets of distinct HLA alleles, genes, and tumour clones represented in S; σi is the wild-type similarity of candidate i; and wq, wd, wh, wg, wc, and ww are the objective weights.
Three solvers optimise Equation (5). The top-K solver ranks by quality alone after removing duplicate mutant peptides and serves as the independent-ranking comparator. The greedy solver adds, at each step, the feasible candidate with the largest marginal gain in F(S), evaluating gene-capacity and peptide-uniqueness feasibility before scoring and breaking ties by candidate identifier for determinism. The exact solver expresses the additive quality, HLA, gene, and clone-breadth terms as a binary program in OR-Tools CP-SAT, with coefficients scaled by 1 × 10⁶, one indicator variable per distinct allele, gene, and clone linked by maximum-equality constraints, capacity and per-gene limits as linear inequalities, and a single search worker for reproducibility. Pairwise redundancy is quadratic and is therefore optimised by the greedy solver rather than linearized. For the A144 design the constraints were K = 20, at least three distinct retained HLA alleles, at most two candidates per gene, required tumour evidence, and exclusion of HLA-lost alleles. The objective weights were wq = 1.00, wd = 0.25, wh = 0.20, wg = 0.10, wc = 0, and ww = 0.10. Setting wc = 0 disables the clone-breadth term, because the A144 pool carries no cancer-cell fraction and no clonal assignment and C(S) cannot be evaluated for these candidates. The implementation retains the term for cohorts that supply those fields. The remaining five weights were fixed before any evaluation, on the reasoning that candidate quality should dominate while redundancy and breadth act as corrections, and they were not tuned.
2.10. Label-Blind Immune-Visibility Scoring
Candidate quality for the NSCLC pools was defined by a locked score built only from prediction and tumour-evidence inputs. The pVACseq comparator score is 1 minus the reported rank percentile, clipped to [0, 1]. RNA expression and DNA variant allele frequency were converted to within-patient average-rank percentiles, so patients with different sequencing depth and expression scales remain comparable. Immunopeptidome support was taken as the tumour-only observed-protein count for the candidate’s source protein, transformed as log(1 + n) and then converted to a within-patient average-rank percentile. The composite score is given by Equation (6):
Vi = 0.45 · Pi + 0.20 · Ei + 0.15 · Ai + 0.20 · Mi
Here, Pi is the pVACseq score, Ei the within-patient RNA-expression percentile, Ai the within-patient DNA variant-allele-frequency percentile, and Mi the within-patient immunopeptidome-evidence percentile, each on [0, 1]. The weights in Equation (6) were fixed before any evaluation and were never refitted on assay outcomes. Ranking within each patient sorts by score in descending order with the candidate identifier as a stable secondary key. Missing components are handled as follows, and the weights are never renormalised. A missing pVACseq rank percentile gives Pi = 0. RNA expression and DNA variant allele frequency are converted to within-patient average-rank percentiles with unmeasured rows excluded from the ranking and then assigned Ei = 0 or Ai = 0, so an unmeasured value takes the worst attainable percentile while a measured zero receives the mean rank of the tied zero group and is strictly greater than zero; those two states are distinguished. Immunopeptidome support is handled differently. The tumour-only observed-protein count is set to zero before the logarithmic transform, so a protein absent from the observed-protein table and a protein present with a count of zero fall into one tie group and are not distinguished. Absence from that table is the informative state for this source, which is why the two are pooled, and the consequence is that Mi is effectively binary within a patient pool. Because the weights are fixed, a candidate lacking a component retains the full weight on a term of value zero, so Equation (6) returns a finite score for every candidate, including candidates with no measured expression.
2.11. Evaluation Metrics
Candidate-level metrics were computed on observed labels only: precision–recall area under the curve (PR-AUC, computed as average precision), receiver-operating-characteristic area under the curve (ROC-AUC), the Matthews correlation coefficient at a 0.5 decision threshold, the Brier score, and the expected calibration error over ten equal-width bins as given by Equation (7):
Here, Bb is the set of predictions falling in bin b, N is the number of observed rows, ȳb is the mean observed label in bin b, and is the mean predicted probability in bin b. The Brier score is a proper scoring rule that combines calibration with discrimination and sharpness. It is reported here as an overall measure of probability quality, and expected calibration error is the calibration-specific quantity.
2.11.1. External Evaluation on Independent Sources
Each frozen comparator was applied unchanged to the harmonised TESLA table. Peptides at or above 0.8 aligned identity to any ITSNdb peptide were removed before scoring, which excluded 5 of 711 rows and left 706 evaluated candidates carrying 31 observed positives, and the evaluation records the model checksum, the external dataset hash and the training reference hash. The candidate-level metrics defined above were then computed on the external labels. Patient-level overlap between the two sources cannot be audited, because neither public table publishes patient identifiers, so the exclusion operates at the peptide level only. Two structural limits of the external sources are reported with the result rather than worked around. The multitask model requires a paired wild-type peptide for every row, and the harmonised TESLA table supplies a wild-type counterpart for none of the 706 rows, so that comparator cannot be scored on this source. TSNAdb v2 supplies validated positive references without matched negatives, so discrimination and calibration metrics are undefined on it; we report instead what a positives-only source can show, which is the fraction of known positives each model places above the 0.5 threshold.
2.11.2. Retrospective Evaluation Against Measured ELISpot Outcomes
The locked visibility score and the pVACseq comparator were evaluated against the cohort’s interferon-gamma ELISpot table after every selection and ranking step had been completed, so that no outcome could reach a score, weight or ranking input. Of the 69 HLA-linked tested candidates, 68 carry a strict binary outcome, 8 Strong and 60 None, and the single Weak outcome is held as unknown rather than converted to a negative. Both rankings were applied to the complete class-I and class-II pools of every patient, and recall at K, patient hit rate and normalised discounted cumulative gain at K were computed per patient at K = 5, 10 and 20. Five of the 24 patients carry at least one positive peptide and are the unit of analysis. Paired per-patient differences were summarised with a 10,000-resample bootstrap at seed 144 and an exact sign-flip test, and the median rank percentile of the positive peptides within each patient pool was recorded as a continuous secondary endpoint that does not depend on a cut-off at K. Two features of the design limit its resolution and are reported with the result: the tested candidates were pre-selected for assay by the original investigators rather than sampled from the pool, and five patients carrying eight positive peptides give very limited precision.
2.11.3. Sensitivity of the Locked Weights and the Selector
Because the weights of Equations (5) and (6) were fixed rather than fitted, their influence was measured directly. Fifteen variants of the Equation (6) weight vector were evaluated, covering binding-only and tumour-evidence-only scoring, equal quarters, removal of each evidence term in turn, and halving and doubling of each weight with the remainder renormalised. For every variant the candidate pool was rescored, the ELISpot ranking endpoint was recomputed, and the A144 set was reselected and compared with the reported set. The weights of the Equation (5) set objective were perturbed in the same way, each to zero and to twice its locked value, with the clone-breadth term additionally switched on to confirm that it is inert when no clonal annotation is available. The two reviewer-requested comparators, alongside the greedy solver, binding-only ranking and the independent top-K solver, were run on the identical pool under the identical hard constraints. Variants were compared on set composition, on overlap with the reported set, and on feasibility against the hard constraints.
2.11.4. Configuration Search for the Candidate Comparators
Because the six comparators were trained at fixed default settings, the space of alternatives was searched explicitly. One hundred and five combinations were evaluated, crossing four model families (L2-penalised and L1-penalised logistic regression, random forest and gradient boosting), their regularisation and capacity parameters, and three encoder column policies: all columns, all columns with those constant in the training fold removed, and peptide and substitution columns only. Each was scored by five-fold cross-validation over the development rows; that is, the training and validation partitions combined, stratified on the label and grouped so that no peptide cluster at the 0.8 aligned-identity threshold is split across folds. The frozen test partition and the external sources were not consulted during the search. One configuration was then carried forward and scored once on the frozen test partition and once on the external set, alongside the published configuration refitted on the same development rows, so that the effect of the configuration and the effect of the additional training rows can be read separately.
2.11.5. Reproduction of the Archived Results
Before the analyses of this section were run, the analysis environment was rebuilt from the released package and the archived artefacts, and its output was checked against the published values. Twenty-two published quantities were re-derived: the five internal test metrics of the frozen logistic model and its observed row count, the six external metrics of its TESLA transfer, and the median positive rank percentile of both rankings for each of the five positive-bearing patients. All twenty-two agree with the published values to within 5 × 10⁻⁹, and the archived multitask checkpoint reproduces its published test metrics exactly.
2.12. Uncertainty and Hypothesis Testing
Paired model comparisons were resampled on the candidate-level test partition. For each pair of frozen models the difference in mean Brier loss was estimated with a nonparametric bootstrap of 2000 resamples at a fixed seed of 42, reported as the point estimate with a percentile 95% confidence interval. The same paired differences were tested with a two-sided sign-flip permutation test using 10,000 permutations and seed 42, where the p-value is the number of permuted mean absolute differences at least as large as the observed value, plus one, divided by the number of permutations plus one. The resampling unit is the individual candidate and is recorded with every reported interval. Six frozen models generate fifteen pairwise comparisons, so the permutation p-values are also adjusted across that family by the Holm–Bonferroni step-down procedure, and raw and adjusted values are reported together in Table S1. The resampling unit is the individual candidate, because ITSNdb publishes no patient identifiers.
2.13. Model Interpretation
The frozen logistic model was interpreted with SHAP values computed over the locked test partition using the named feature vector of Section 2.6, so every attribution maps to a declared feature rather than a positional index. Counterfactual scoring compared each mutant peptide against its paired wild-type peptide through the same encoder and model, and integrated gradients were computed for the neural encoders. Attribution tables and editable figures were written to a locked interpretation directory.
2.14. A144 Research Candidate Set
The A144 candidate pool was ranked with Equation (6), filtered by the hard constraints of Section 2.9, and selected with the greedy solver under the weights recorded there. The resulting 20-candidate set was exported as CSV, Parquet, and FASTA, together with a JSON manifest recording the strategy, the hard constraints, the source scope, per-file SHA-256 checksums and byte sizes, and an explicit research-use status field. The selected set spans 7 class-I and 13 class-II epitopes drawn from 19 genes and restricted by five HLA alleles: HLA-A*29:02, HLA-B*44:02, HLA-B*44:04, HLA-DRB1*04:01, and HLA-DRB1*13:01.
2.15. Blinded Reagent Panel and Synthesis-Risk Screening
A blinded peptide panel was generated for prospective mutant-versus-wild-type functional testing. The panel contains 51 reagents: 39 prospective sequences from the selected set, 4 published positive-control sequences, and 8 published negative-control sequences, with mutant and available wild-type counterparts blinded independently under identifiers of the form EVX-NNN-M and EVX-NNN-W. Uniqueness of blinded identifiers is enforced. The package comprises the blinded sequence list, a triplicate 96-well plate map, a result-capture template, a separately stored blinding key, and prespecified numeric acceptance criteria recorded before unblinding. Result import validates that every returned identifier exists in the panel, that no identifier is duplicated, and that the join is one-to-one, and it fails closed on any missing or discordant record. Synthesis risk was screened by transparent sequence heuristics rather than by manufacturing assay. Each sequence was scored for length outside 8 to 35 residues, hydrophobic fraction above 0.55, absolute net charge above 6, more than two cysteines, and a longest contiguous hydrophobic run of at least 5 residues. A sequence passes when none of the five flags is raised. Of the 51 reagents, 37 passed all five criteria and 14 raised at least one flag for confirmation by the synthesis provider.
2.16. Reviewed Human Proteome Specificity Screening
Every unique selected peptide was screened against the UniProt reviewed human proteome [36] (UP000005640, release 2026_02) for exact and single-mismatch matches. Each query peptide of length L was split into two seeds, positions 1 to floor(L/2) and floor(L/2) + 1 to L. Every exact occurrence of either seed in a target protein defines a candidate window of length L at the implied offset; the window is retained when it lies entirely within the protein and differs from the query at no more than one position. This two-seed rule is exhaustive for windows carrying at most one mismatch, because a single substitution can fall in only one of the two seeds. Match counts, positions, mismatch counts, and source protein headers were recorded for every peptide. None of the 20 selected mutant peptides has an exact match in the reviewed human proteome, and 18 have a one-mismatch match, which corresponds to the wild-type parent sequence expected for a single-residue neoantigen.
2.17. Multi-Epitope Construct Assembly
Three antigen-only 20-epitope constructs were assembled from the selected set to make the ordering and linker assumptions independently testable. A144-MEV-01 blocks epitopes by HLA class and uses AAY within the class-I block, GPGPG within the class-II block, and EAAAK between blocks, giving 342 residues. A144-MEV-02 interleaves the two classes with class-aware linkers, giving 354 residues. A144-MEV-03 uses GGGGS at every junction as a flexible control, giving 354 residues. No adjuvant domain, signal peptide, carrier, trafficking signal, purification tag, or affinity tag was added, so the three constructs differ only in epitope order and junction chemistry. Every junction position and its flanking window was recorded in a junction table.
2.18. Structure Prediction and Confidence Audit
Structure inputs were exported in three formats: FASTA, a ColabFold batch CSV, and per-construct AlphaFold 3 JSON with model seeds 1 to 5. A multi-job AlphaFold Server [37] JSON was written in the alphafoldserver dialect. The three constructs were submitted to the official AlphaFold Server on 24 June 2026, and all five returned models per job were analysed; the raw bundles are checksum-locked. For LocalColabFold [38] execution the prespecified settings are AlphaFold2-ptm [39] with the remote MMseqs2 MSA service, five seeds, and three recycles. For every returned model the audit parses C-alpha records and per-residue pLDDT and computes the mean and median pLDDT, the fraction of residues below pLDDT 50, the fraction at or above pLDDT 70, the radius of gyration, the end-to-end distance, the count of non-local C-alpha pairs closer than 3 A, and the mean predicted aligned error from the accompanying PAE matrix. Across the five models of a job, agreement was quantified as the Kabsch-superposition C-alpha RMSD of each model to model 0. Per-residue confidence was mapped onto epitope coordinates so that every selected epitope carries its own confidence summary. AlphaFold ranking_score was compared only within a job and never across independently submitted jobs. These metrics are used to triage between candidate architectures and to locate low-confidence regions within one job. No claim about a defined global fold rests on them, and no structural conclusion in this work rests on a predicted coordinate. Confidence values of the magnitude returned for linker-rich concatenated antigens are expected for chains of this composition, and they carry no information about antigen processing, presentation or immunogenicity.
2.19. Physicochemical and Population-Coverage Profiling
Construct-level physicochemical properties were computed directly from the sequence. Molecular weight is the sum of residue masses plus one water molecule. Net charge at a given pH follows the Henderson–Hasselbalch form of Equation (8), and the isoelectric point is the pH at which Equation (8) evaluates to zero, located by 80 iterations of bisection on the interval [0, 14]:
Here, nX is the count of residue X, and the two unsubscripted terms are the free alpha-amino and alpha-carboxyl groups. Hydropathy uses the Kyte–Doolittle scale. GRAVY is the mean over all residues, and local hydrophobicity is the sliding 19-residue mean of Equation (9), from which the maximum window value and the number of windows exceeding 1.6 are reported:
Here, H(r) is the Kyte–Doolittle value of residue r and L is the sequence length.
The profile additionally reports aromatic fraction, glycine plus proline fraction, cysteine and methionine counts, the longest homopolymer run, the Shannon entropy of the composition in bits, and N-linked glycosylation sequons defined as N followed by any residue other than proline followed by S or T. For A144-MEV-03 this gives 354 residues, 35.38 kDa, isoelectric point 6.22, GRAVY −0.033, and no 19-residue window above the 1.6 threshold. Population coverage of the five restricting alleles was estimated with the IEDB population coverage tool [40] (https://tools.iedb.org/population/, accessed on 24 June 2026) for class I, class II, and the combined set across twelve geographic regions and the world aggregate, reporting projected coverage, average number of epitope hits, and the minimum number of hits in 90% of the population.
2.20. Junction Screening and Linker Redesign
Junction behaviour was screened with the official IEDB recommended 2023.09 predictors [19,20]. Class-I predictions used HLA-A*29:02, HLA-B*44:02, and HLA-B*44:04 at lengths 8, 9, 10, and 11; class-II predictions used HLA-DRB1*04:01 and HLA-DRB1*13:01 at length 15. A predicted window was called high priority at a percentile rank at or below 0.5 for class I and at or below 2.0 for class II, and weak at or below 2.0 and 10.0 respectively. A predicted peptide was counted as linker-overlapping when its start coordinate is at or before the linker end coordinate and its end coordinate is at or after the linker start coordinate. Two screening levels were run. The local screen builds, for each junction, four variants formed from the 15 C-terminal residues of the left epitope, one of AAY, EAAAK, GPGPG, or GGGGS, and the 15 N-terminal residues of the right epitope, and submits all variants as one numbered FASTA. The full-construct screen submits the complete assembled sequence, with junction coordinates shifted where an initiator methionine was added.
Each junction variant was scored by the weighted junction risk of Equation (10):
W = 10 · nhigh + 2 · nweak
Here, nhigh and nweak are the counts of linker-overlapping predicted windows at high and weak priority. The linker for each junction was chosen as the variant minimising W, with ties broken in order by high-priority count, weak-priority count, a class-aware preference rank, and then the weakest best rank. The class-aware preference orders AAY, EAAAK, GPGPG, GGGGS for a class-I to class-I junction; GPGPG, EAAAK, AAY, GGGGS for class-II to class-II; and EAAAK, AAY, GPGPG, GGGGS for mixed-class junctions. The redesigned construct A144-MEV-03R is 350 residues and uses 2 AAY, 1 EAAAK, 10 GGGGS, and 6 GPGPG linkers while preserving the same 20 epitopes, the same order, and the same HLA restrictions, so its population coverage is unchanged by construction. Linear B-cell propensity across the construct was profiled with IEDB BepiPred-2.0 [41], and residue calls were partitioned into linker and non-linker positions using the recorded junction coordinates, so linker enrichment is measured rather than assumed.
2.21. Native-Flank Platform Redesign
For the delivery-ready design, the 20 selected peptide records were consolidated on the mutation key of gene, transcript, chromosome, position, reference allele, and alternate allele, yielding 19 unique mutations. For each mutation the exact source protein was retrieved from the Ensembl [42] REST endpoint /sequence/id/(id)?type=protein using the stable protein identifier parsed from the recorded HGVS protein annotation, and each retrieved sequence was stored with its returned version, endpoint, and SHA-256 hash. Native context was reconstructed under three verification gates. The reference residue at the annotated one-based protein position must match the reference allele; the mutant protein is formed by substituting the alternate allele at that position; and every source mutant peptide that contributed to the mutation record must be contained within the reconstructed context. Failing any gate marks the mutation with an explicit blocking status rather than emitting an unverified sequence. Long peptides were cut with 15 native residues on each side of the substitution, giving verified native-flank sequences for 18 of the 19 mutations. The 18 verified long peptides were partitioned into three antigen modules: one class-I module joined by AAY, and two class-II modules joined by GPGPG formed by alternating assignment of the class-II mutations. Each module junction was then rescreened and reoptimized.
2.22. Research Open Reading Frame Design
Each optimised antigen module was converted to a coding sequence by a deterministic codon-selection procedure using a human codon table ordered by usage from the FDA HIVE-CoCoPUTs Homo sapiens reference [43]. An initiator methionine was prepended when the antigen did not already begin with methionine. Codons are chosen left to right; for the prefix built so far, each synonymous codon is scored by Equation (11) and the minimum-penalty codon is selected, with the codon string itself as a deterministic tie-breaker:
π = 0.05 · rank + 30 · | GC60 − 0.55 | + 20 · max(0, hp − 4)
+ 100 · 1[motif introduced] + 3 · 1[6 − mer repeated upstream]
+ 100 · 1[motif introduced] + 3 · 1[6 − mer repeated upstream]
Here, π is the penalty of a candidate codon given the prefix built so far, rank is the zero-based codon-usage rank, GC60 is the guanine–cytosine fraction of the trailing 60-nucleotide window of the extended prefix, hp is the longest homopolymer run in its trailing 12 nucleotides, the motif indicator fires on any of the avoided sequences, and the final indicator fires when the trailing 6-mer already occurs upstream. The avoided motifs are the canonical and alternative polyadenylation signals AATAAA and ATTAAA and the common cloning sites EcoRI (GAATTC), HindIII (AAGCTT), BamHI (GGATCC), BsaI (GGTCTC), BsmBI (CGTCTC), and NotI (GCGGCCGC). Any motif surviving the greedy pass is removed by a deterministic synonymous-repair loop that evaluates every synonymous substitution across the affected codons, accepts only substitutions that strictly reduce the total motif count, and ranks admissible substitutions by GC deviation from 0.55, remaining motif count, codon-usage rank, and codon string. Both the greedy pass and the repair loop assert an exact translation back-check against the intended protein, and the loop raises rather than returns if the encoded protein has changed. Each design reports the guanine–cytosine fraction overall and as the minimum and maximum over sliding 60-nucleotide windows, the longest homopolymer, CpG and TA dinucleotide counts, a start-region self-complementarity proxy computed over the first 90 nucleotides, the surviving motif table, a SHA-256 sequence identifier, and the codon-table provenance string. The three designs are A144-mRNA-IR (7 epitopes, 6 junctions, 247-residue antigen, 248-residue encoded protein, 744 nucleotides excluding the stop codon, 26.77 kDa, GC 0.535), A144-mRNA-II-1R (6 epitopes, 5 junctions, 211 residues, 633 nucleotides, 22.95 kDa, GC 0.553), and A144-mRNA-II-2R (5 epitopes, 4 junctions, 176-residue antigen, 177-residue encoded protein, 531 nucleotides, 18.61 kDa, GC 0.550). All three pass the exact translation back-check, carry zero surviving avoided motifs, and use TGA as the stop codon. The fifteen encoded-protein junctions were consolidated into one processing-risk table carrying the junction window, the local screen weighted risk of Equation (10), the full-construct prediction counts with initiator-adjusted coordinates, the best predicted rank, and a risk class. Forty-five unique junction-spanning peptide reagents were generated from these windows for prespecified targeted immunopeptidomics and T-cell assays.
2.23. In Silico Cloning
Cloning simulation takes one complete, unambiguous circular vector sequence in FASTA, a zero-based insertion coordinate, and an optional replacement end coordinate. Given such a vector it writes a complete simulated clone as FASTA and GenBank, verifies by exact substring recovery that the insert is present and unmodified at the intended coordinates, records SHA-256 identifiers for the vector, insert and product, and audits the product for the common restriction sites. The intended research backbone is pGEM4Z-T7-5′UTR-EGFP-3’UTR-A64 (Addgene plasmid #203348), which supplies a T7 promoter, Xenopus beta-globin untranslated regions, an encoded poly(A) tract, HindIII and PacI cloning sites, and SpeI linearization. The Addgene-verified complete sequence of that plasmid was obtained from the repository record for accession 203348 and is 3540 bp of circular unambiguous DNA. The annotated EGFP coding region occupies one-based positions 2760 to 3479, begins ATG, ends TAA and is 720 bp long; that interval defines the replacement coordinates, and each open reading frame including its stop codon was substituted for it in turn. Transcript length for the SpeI-linearised template was measured from the T7 transcription start to the run-off end, crossing the circular origin once. The start is the terminal guanine of the TAATACGACTCACTATAG consensus at one-based position 2691, and not the end of the annotated promoter feature, which extends one base further because the following base is also a guanine; the end is the SpeI top-strand cut, which leaves the template ending on the adenine at one-based position 188 of A-CTAGT. Circular plasmid blueprints and linear in vitro transcription cassette maps were rendered with DNA Features Viewer 3.1.5.
2.24. Software and Environment
All analyses ran under evoset-neovax 0.3.0 on Python 3.12. Core dependencies were NumPy 2.3.5 [44], pandas 2.3.3 [45], PyArrow 19.0.1, Pydantic 2.13.4, Hydra 1.3.5, scikit-learn 1.9.0, SciPy 1.18.1 [46], XGBoost 3.4.1, PyTorch 2.13.0, OR-Tools 9.15.6755, SHAP 0.52.0, joblib 1.5.3, Matplotlib 3.11.1 [47], Plotly 6.9.0, and DNA Features Viewer 3.1.5. External services were the official IEDB analysis resource (recommended 2023.09 class-I and class-II binding predictors, BepiPred-2.0, and the population coverage tool), the AlphaFold Server, and the Ensembl REST API. Minimum free energy secondary structure of the three open reading frames was computed with ViennaRNA RNAfold 2.7.2 on the coding sequence including the stop codon and excluding untranslated regions and the poly(A) tract.
3. Results
3.1. One Workflow Carries a Public Variant Call to a Synthesisable Sequence
We first fixed the path a candidate takes from a public dataset to a coding sequence, so that every later result rests on the same audited chain. Figure 1a lays out the six stages in the order they run: checksum-pinned public sources, a canonical typed table that keeps missing biological values as null, leakage-audited partitioning with six frozen comparator models, the label-blind visibility score of Equation (6), constrained set selection under Equation (5) at K = 20, and three junction-optimised messenger RNA open reading frames. Assay outcomes enter only where the arrow ends, at evaluation, and never at any scoring or ranking step. The two panels beneath resolve the parts of that chain that decide what a vaccine set contains. Figure 1b shows the locked composition of the visibility score, in which predicted binding contributes 0.45 and the three tumour-evidence terms contribute the remaining 0.55 as within-patient percentiles: RNA expression 0.20, DNA variant allele frequency 0.15, and immunopeptidome support 0.20. Evidence that a mutation is transcribed, clonal enough to matter and drawn from a protein the presentation pathway actually samples therefore enters the rank itself rather than acting as a filter applied afterwards. Figure 1c lists the six hard constraints the selector must satisfy: capacity of twenty candidates, at least three retained HLA alleles, at most two candidates per gene, positive tumour evidence in expression or DNA variant allele frequency, exclusion of any allele recorded as lost in that tumour, and no repeated mutant peptide. These are the nominal weights of the locked score. What each term contributed in practice depends on how often the corresponding evidence was measured, and is reported in Section 3.5.
Figure 1.
The EvoSet-NeoVax workflow, visibility weighting and set constraints. (a) The six pipeline stages in execution order, from checksum-pinned public sources to three junction-optimised messenger RNA open reading frames; assay labels enter only at evaluation. (b) Composition of the locked immune-visibility score of Equation (6), with predicted binding weighted 0.45 and the three tumour-evidence terms 0.55 in total. (c) The six hard feasibility constraints applied during constrained set selection.
3.2. A Harmonised Benchmark with Audited Partitions
Harmonisation of the ITSNdb source under the canonical schema produced 199 paired mutant and wild-type candidates across 31 HLA references with no exact duplicates. Peptide-cluster partitioning at 0.8 aligned identity gave the frozen partitions used for every model in this work. Table 1 records the resulting internal test set: 30 candidates carrying 18 observed positive and 12 observed negative endpoints, with no unknown label among them, so every test row contributes to every metric. ITSNdb publishes no patient identifiers, so the Patients column of Table 1 reads zero and the union-find pass that would keep one patient inside a single partition could not run. Grouping is by peptide cluster alone. The audit therefore establishes leakage control at the sequence level, and the resampling unit in every interval reported below is the candidate rather than the patient.
Table 1.
Locked internal test-set characteristics. Composition of the frozen ITSNdb peptide-cluster test partition used for every candidate-level result in this work.
Figure 2 shows the composition behind that table. Figure 2a gives the observed endpoint labels across the harmonised source, 129 positive and 70 negative, with zero candidates left in the unknown state once the schema had been applied. Because unassayed candidates are never converted into negatives, this count is a statement about what was measured rather than an artefact of imputation. Figure 2b gives the partition sizes the clustering produced, 138 training, 31 validation and 30 test candidates. The leakage audit over these partitions returned zero exact-candidate and zero near-peptide overlap at the same 0.8 identity threshold used to build the clusters, so no test peptide has a near neighbour in training.
Figure 2.
Dataset composition and controls. (a) Observed endpoint labels across the harmonised source, with unassayed candidates never converted into negatives. (b) Candidate counts in the frozen train, validation and test partitions produced by peptide-cluster grouping at 0.8 aligned identity.
3.3. Six Frozen Models on a Common Split
We trained six candidate-level comparators on the identical frozen partition with the identical seed, each on its native input representation as specified, then locked them before any evaluation. Figure 3 characterises the strongest of them, the missingness-aware logistic model, on the held-out test partition. Figure 3a shows the precision–recall curve reaching an average precision of 0.87 against a prevalence baseline of 0.60, with precision held at 1.00 across the first four tenths of recall, so the highest-scoring candidates are positive without exception. Figure 3b gives the corresponding receiver-operating characteristic with an area of 0.80, the curve rising steeply and staying above the diagonal across the full range. Figure 3c plots observed positive fraction against predicted probability in ten equal-width bins, and the points track the identity line closely from the middle of the range upward.
Figure 3.
Locked internal performance of the frozen logistic model. (a) Precision–recall curve on the held-out test partition, with the dashed line marking prevalence. (b) Receiver-operating characteristic against the chance diagonal. (c) Calibration over ten equal-width bins, with the dashed line marking perfect agreement between predicted probability and observed fraction.
Table 2 reports the frozen comparison across all six models on that same test partition, with five metrics each. Logistic regression records the best value on every one: PR-AUC 0.869, ROC-AUC 0.796, Matthews correlation 0.365, Brier score 0.182 and expected calibration error 0.117. Figure 4 displays the same comparison as five zero-based dot plots so the spacing between models is read directly. Figure 4a ranks the models by PR-AUC from logistic regression at 0.869 down through random forest at 0.827, XGBoost at 0.818, the peptide convolutional network at 0.762, the multitask model at 0.721 and the small transformer at 0.714. Figure 4b shows the same ordering under ROC-AUC, from 0.796 to 0.579. Figure 4c gives Matthews correlation at the 0.5 threshold, where logistic regression reaches 0.365 against 0.272 for the next model. Figure 4d,e give the two probability-quality measures, Brier score and expected calibration error, on which the two transparent classical models are the closest to observed frequencies, logistic regression at 0.182 and 0.117 and random forest at 0.211 and 0.117.
Table 2.
Frozen model comparison on the internal candidate-level test set. Five metrics for each of the six comparators, all trained on the identical frozen partition with the identical seed and locked before evaluation. The six models do not share one input representation, and the ordering is descriptive of this 30-candidate partition, since no pairwise difference survives Holm correction.
Figure 4.
Frozen candidate-model comparison. Zero-based dot plots of (a) PR-AUC, (b) ROC-AUC, (c) Matthews correlation coefficient at a 0.5 threshold, (d) Brier score and (e) expected calibration error for the six frozen comparators.
Table S1 puts confidence intervals and paired tests around those differences across all fifteen model pairs. The advantage of logistic regression over XGBoost in mean Brier loss is 0.101 with a 95% interval from 0.025 to 0.180 and a paired permutation p of 0.023, and its advantage over the multitask model is 0.128 with an interval from 0.038 to 0.233 and p of 0.016. Both unadjusted intervals exclude zero. Across the family of fifteen comparisons, neither survives multiplicity correction: the smallest raw p-value is 0.016, which Holm–Bonferroni adjustment raises to 0.246, and no comparison reaches 0.05 after adjustment. With 30 test candidates, 18 of them positive, the family is underpowered for pairwise discrimination among six models, so the ordering in Table 2 and Figure 4 describes this partition and we claim no superiority for any model. What the comparison does support is that the transparent missingness-aware logistic model is not outperformed by the neural encoders on any of the five metrics on this partition, which is why it was carried forward as the interpretable reference model. Figure S1 shows what the frozen logistic model uses to reach those scores, as mean absolute SHAP attribution over the locked test partition. The two largest terms are mutant mean residue mass at 0.597 and wild-type mean residue mass at 0.507, followed by the restriction allele HLA-B*27:05 at 0.289 and the paired peptide lengths at 0.267 each. Substitution terms carry the next tier, with mutation delta mass at 0.260 and mutation delta hydropathy at 0.216. Attribution therefore concentrates on the paired mutant and wild-type description of the peptide and on the change between them, which is the representation the encoder was built to expose.
The assay value field of Section 2.6 is the only encoder input that could in principle carry information derived from an outcome, so all three classical comparators were retrained with it removed. The field is null in all 199 ITSNdb rows, both derived columns are exactly zero after scaling, and the fitted logistic coefficient on each is exactly zero, so it carries no information about any candidate. Table 3 gives the ablation. Metrics move only in the third decimal and not in a consistent direction, because the number of encoder columns enters the optimiser stopping point for logistic regression and the per-split random feature subspace for the random forest and for XGBoost 3.4.1. Logistic regression remains the leading model on precision–recall AUC with and without the field, at 0.869 and 0.872, and the random-forest and XGBoost ordering exchanges between the two settings, which is what the multiplicity-corrected comparison above would predict for differences of this size. No reported conclusion depends on the field.
Table 3.
Assay-value ablation on the internal test partition. Every classical comparator retrained with and without the assay value field in the encoder, on the identical frozen partition and seed. The field is null in all 199 rows of the source, so both of its encoder columns are constant and are mapped to zero by the training-partition scaler; the residual differences reflect encoder width entering the optimiser path and the random feature subspace, not information carried by the field.
The six comparators were trained at fixed default settings, so the space of alternatives was searched directly. One hundred and five combinations of model family, regularisation and encoder column policy were evaluated by five-fold grouped cross-validation over the development rows, with peptide clusters never split across folds and with the frozen test partition and the external sets left untouched during selection (Section 2.11.4). Table 4 reports the search. The highest cross-validated precision–recall AUC is 0.881 with a fold standard deviation of 0.058, against 0.860 for the published logistic configuration under the same protocol. The configuration the cross-validation ranked first, a random forest with unrestricted leaves, scored 0.788 on the frozen test partition, against 0.885 for the published logistic configuration with both refitted on the same development rows. Refitting that locked configuration on the development rows rather than the training partition alone, 169 labelled candidates instead of 138, gives a precision–recall AUC of 0.885, a receiver-operating-characteristic area of 0.829, a Matthews correlation coefficient of 0.515, a Brier score of 0.168 and an expected calibration error of 0.162, against 0.869, 0.796, 0.365, 0.182 and 0.117 for the frozen protocol.
Table 4.
Configuration search for the candidate-level comparator. The ten highest-ranked of 105 combinations of model family, regularisation and encoder column policy, by five-fold grouped cross-validated precision–recall AUC over the development rows, with the published logistic configuration shown under the same protocol for reference. Peptide clusters were never split across folds. Selection used development rows only; the frozen test partition and the external sets were scored once, after selection, and are reported in the text rather than used for ranking.
3.4. External Transfer of the Frozen Comparators
We then applied each frozen comparator, unchanged, to the harmonised TESLA table. On the 706 candidates retained after removing peptides at or above 0.8 aligned identity to any ITSNdb peptide, receiver-operating-characteristic areas run from 0.401 for logistic regression to 0.484 for the small transformer, against 0.500 for an uninformative predictor, and precision–recall values run from 0.036 to 0.053 against a no-skill baseline of 0.044 set by the 31 positives among those 706 candidates. Table 5 gives all six comparators. The calibration columns spread more widely than the discrimination columns: the internal partition carries 60% positives and the external table 4.4%, and logistic regression returns a Brier score of 0.909 and an expected calibration error of 0.931 while the peptide convolutional network, whose predictions are less confident, returns 0.466 and 0.604. Two properties of the external sources shape what that comparison measures. The harmonised TESLA table supplies a wild-type counterpart for none of its 706 rows, while every ITSNdb training row carries one, so the encoder returns a zero wild-type block and a zero substitution block for every external candidate, and the multitask model, which requires a paired wild-type peptide, cannot be scored on this source. We therefore reconstructed the missing counterparts from the reviewed human proteome using the single-mismatch window search of Section 2.16, which reads the mutant peptide and the reference sequence alone. Counterparts were recovered for 678 of the 706 rows, 96.0%, carrying 30 of the 31 positives, 644 of them from a unique window. On that repaired representation logistic regression returns a Brier score of 0.589 and an expected calibration error of 0.712, against 0.909 and 0.930 on the identical rows without it, and XGBoost returns a receiver-operating-characteristic area of 0.487 against 0.440. TSNAdb v2 carries validated positive references without matched negatives, so the four metrics above are undefined on it; the fraction of known positives placed above the 0.5 threshold runs from 0.69 for the two sequence models to 1.00 for logistic regression.
Table 5.
External transfer of the six frozen comparators to TESLA. Each model trained on the frozen ITSNdb partition and applied unchanged, after removal of peptides at or above 0.8 aligned identity to any ITSNdb peptide. The no-skill reference row gives the values an uninformative predictor would attain at the observed prevalence. The multitask model requires a paired wild-type peptide for every row, which this source supplies for none.
3.5. Label-Blind Scoring Selects a Diverse Set for Patient A144
We then applied the locked score and the constrained selector to the complete class-I and class-II candidate pools of patient A144, using only prediction and tumour-evidence inputs. Figure 5 shows what the objective returned. Figure 5a ranks the twenty selected candidates by locked visibility score, from FKBP8 at 0.787 down to FBN1 at 0.687, coloured by restriction class, and the set carries both classes rather than filling with whichever class scores highest. Figure 5b decomposes each of those scores into its four weighted terms, and the decomposition shows that nominal and realised weights diverge. Averaged over the twenty candidates, predicted binding supplied 0.412 of the mean score of 0.716, which is 57.5%, the immunopeptidome supported 0.152 or 21.3%, DNA variant allele frequency 0.118 or 16.5%, and RNA expression 0.034 or 4.7%. The expression term is small because RNA expression is unmeasured for 16 of the 20 selected candidates and is exactly zero for them under the rule of Section 2.10. The immunopeptidome term takes two values within this pool, 0.986 for the 11 candidates whose source protein appears once in the tumour-only observed-protein table and 0.486 for the 9 that do not appear, so within a patient it acts as a binary indicator rather than a graded percentile. Five candidates, in KANK2, SHKBP1, SLC39A2, C15orf65 and FBN1, carry neither measured expression nor immunopeptidome support, and their scores rest on predicted binding and DNA variant allele frequency alone. Figure 5c gives the HLA breadth the hard constraints delivered: five distinct retained alleles carry the set, HLA-DRB1*04:01 with ten candidates, HLA-B*44:02 with four, HLA-DRB1*13:01 with three, HLA-A*29:02 with two and HLA-B*44:04 with one, so the minimum of three alleles is exceeded. Figure 5d summarises the evidence behind the set, with DNA variant allele frequency reported for all twenty candidates, RNA expression reported for four, tumour-only protein observation for eleven, and nineteen unique genes represented among twenty candidates, which is the per-gene cap of two acting on a single repeated gene. The two FKBP8 records are two reading registers of one mutation, FKBP8 D95Y, so the set spans nineteen mutations rather than twenty independent antigenic events, and Equation (1) does not detect this. The two peptides, LYILGNGLLRKKTLV and PEEWLYILGNGLLRK, are both fifteen residues long and share an eleven-residue tract, yet position-wise identity scores them at 0.067 while the alignment-based overlap of Section 2.5 scores them at 0.733. Across all 190 pairs in the set, mean position-wise identity is 0.029 against a mean alignment-based overlap of 0.135, 105 of the 190 pairs are of unequal length and receive identity zero by construction, and the FKBP8 pair is the only pair whose alignment-based overlap reaches 0.5. Because the set redundancy of Equation (4) is the mean of these position-wise identities, the duplicated mutation contributes almost nothing to the redundancy penalty. Grouped by annotated mutation key, the set contains nineteen mutations across nineteen genes.
Figure 5.
Label-blind constrained selection for patient A144. (a) The twenty selected candidates ranked by locked visibility score and coloured by HLA restriction class. (b) Decomposition of each score into its four weighted evidence terms. (c) HLA allele breadth delivered by the hard constraints. (d) Tumour evidence and gene diversity across the selected set. Assay outcomes were not used at any stage of scoring or selection.
Table 6 gives the candidate-level evidence and missingness matrix for those twenty selections, with all twenty-four evidence fields exposed per row rather than summarised. Nineteen of the twenty selected candidates carry a mutant peptide that differs from an available wild-type counterpart. The exception is the SLC39A2 record at selection rank 17: the published class-II pool supplies no wild-type counterpart for it, and the annotated protein change at position 142, recorded as W/X, admits no reconstructed mutant translation, so Table S2 carries an empty wild-type field for that record and the native-flank audit of Section 3.10 records it with the context status blocked_frameshift_mutant_translation_unavailable. It is the one mutation of the nineteen that fails the verification gates of Section 2.21. Every candidate is restricted by an allele retained in the tumour, and the availability of each evidence field is stated explicitly for each candidate rather than inferred. The set is twenty peptide records resolving to nineteen mutations, eighteen of which enter the final antigen modules.
Table 6.
A144 selected-candidate evidence and missingness matrix. Key evidence fields for the twenty selected candidates. The complete twenty-four-field matrix is provided as the source table and the full sixty-six-field record as Table S2.
Table S2 is the complete sixty-six-field record for the same twenty candidates, carrying source dataset, source row, transcript and protein identifiers, genomic coordinates, predicted binding values and the four score components, so any selection can be traced to its original supplementary row. Table S3 resolves the breadth of Figure 5c to the gene level, showing that the ten HLA-DRB1*04:01 candidates arise from ten distinct genes and the four HLA-B*44:02 candidates from four, so allele concentration is not accompanied by gene concentration.
Because the weights of Equations (5) and (6) were fixed rather than fitted, we measured how far the returned set depends on them, and compared the greedy solver against the two independent-ranking baselines on the identical pool under the identical hard constraints. Table 7 collates the result. The independent top-K solver does not return a feasible set on this pool. Ranking by quality alone and taking the first twenty distinct peptides fills fifteen of the twenty slots with reading registers of the single FKBP8 mutation and returns two distinct genes and two distinct mutations, so it exceeds the per-gene cap of two by a factor of seven, overlaps the reported set by 2 of 20, and fails the feasibility validator rather than being silently repaired. Ranking on predicted binding alone is better spread but still infeasible, returning seven genes with five records from ZNF544. Across the fifteen weight variants the composition of the set is stable while its membership moves: gene and mutation counts stay between 17 and 20 of 20 in every variant except tumour-evidence-only scoring, and all five retained alleles are carried throughout, while overlap with the reported set ranges from 0 to 17 of 20. Within the set objective, the gene-breadth term does the most work. Removing it collapses the set from 19 distinct mutations to 11, whereas removing the wild-type penalty, or switching the clone-breadth term on at 0.20, returns the reported set unchanged at an identical objective value, confirming that the clone term is inert in the absence of clonal annotation rather than merely unused. On the rank percentile of the measured positive peptides the variants span 0.322 for predicted binding alone and 0.559 for tumour evidence without binding, with the locked weights at 0.347.
Table 7.
Sensitivity of the selected set to the locked weights and to the choice of selector. Fifteen variants of Equation (6) weight vector, the two independent-ranking baselines, and perturbation of each Equation (5) set-objective weight, all on the complete A144 pool under the hard constraints of Section 2.9. Overlap counts candidates shared with the reported set. The rank-percentile column is the mean across the five positive-bearing patients of the median rank percentile of their measured positive peptides, for which lower is better.
3.6. Retrospective Comparison with Measured ELISpot Outcomes
With selection and ranking complete, we compared the locked visibility score and the pVACseq comparator against the cohort’s measured interferon-gamma ELISpot outcomes. Of the 69 HLA-linked tested candidates, 68 carry a strict binary outcome, 8 Strong and 60 None, and one Weak outcome is held as unknown rather than converted to a negative. The eight positive peptides fall in five of the 24 patients, which makes the patient the unit of analysis and five the sample size. Recall at 5, 10 and 20, patient hit rate and normalised discounted cumulative gain are zero for both, so the paired difference is zero with a zero-width bootstrap interval. On the continuous secondary endpoint, which does not depend on a cut-off at K, the median rank percentile of the positive peptides was 0.322 under pVACseq and 0.347 under the visibility score, a paired difference of 0.026 with a 95% bootstrap interval from −0.081 to 0.126 and an exact sign-flip p of 0.69. Per-patient values ran in both directions, favouring the visibility score for A144 and A148 and pVACseq for A119, A134 and A147. Table 8 gives the per-patient and summary values.
Table 8.
Retrospective evaluation against measured interferon-gamma ELISpot outcomes. The locked visibility score and the pVACseq comparator evaluated after all selection and ranking had been completed. For the continuous endpoint a lower rank percentile is better, so a positive difference favours pVACseq. Per-patient values are median rank percentiles of that patient’s positive peptides. Intervals are 10,000-resample bootstraps at seed 144.
Pool sizes run from 855 to 13,070 candidates per patient against one or two positive peptides each. The tested candidates were selected for assay by the original investigators rather than sampled from the pool, and one further observed response, in ALYREF, carries no peptide-HLA prediction in the published pools and is therefore not rankable by either method.
3.7. A Blinded Reagent Panel and a Clean Proteome Screen
The selected set was then converted into experimental and construct-level material. Figure S2 summarises that handoff. Figure S2a shows the blinded mutant and wild-type peptide panel, 51 reagents comprising 39 prospective sequences from the selected set together with four published positive-control and eight published negative-control sequences, each blinded under an independent identifier. Figure S2b gives the three antigen-only linker variants built from the same twenty epitopes, and Figure S2c their explicit junction composition by linker type, so the ordering assumption is recorded rather than assumed. Figure S2d gives the synthesis-risk triage across the panel under five transparent sequence criteria, on which 37 of the 51 reagents pass all five. Table S4 reports the specificity screen of every unique selected peptide against the UniProt reviewed human proteome. No selected mutant peptide has an exact match anywhere in the reviewed proteome. Eighteen of the twenty carry a single-mismatch match, recorded across nineteen rows with the source protein header and the matched position, and every one of those matches differs at exactly one position, which is the signature of the wild-type parent sequence expected for a single-residue neoantigen. The screen therefore confirms that the selected sequences are tumour-restricted at exact-match resolution.
3.8. Structural and Presentation Audit of the Multi-Epitope Constructs
The three antigen-only constructs were submitted to the AlphaFold Server [37] and all five returned models per job were analysed. Figure S3a,b give the per-residue confidence traces for the returned models, coloured on the shared sequential scale, and Figure S3c–e give the predicted aligned error matrices for A144-MEV-01, A144-MEV-02 and A144-MEV-03 respectively. Across the three architectures A144-MEV-03 records the highest mean pLDDT at 54.79, the lowest mean predicted aligned error at 19.96 Å, the highest pTM at 0.392, the lowest disorder fraction at 0.096 and the tightest agreement between models at a mean C-alpha RMSD of 7.30 Å, and it was carried forward on that combination. Figure S4 audits that construct in detail. Figure S4a gives the IEDB population-coverage estimate for its five restricting alleles, Figure S4b the epitope-level structure confidence, Figure S4c the sequence and confidence profile along the 354-residue chain, and Figure S4d the concentration of restriction across alleles. The construct has a calculated mass of 35.38 kDa, an isoelectric point of 6.22 and a GRAVY of −0.033, and no nineteen-residue window anywhere in the sequence exceeds the prespecified mean-hydropathy threshold of 1.6, so the design carries no hydrophobic stretch of the length associated with aggregation. Table 9 gives the population-coverage estimate behind Figure S4a across twelve regions and the world aggregate, with projected worldwide coverage of 11.27% for class I, 19.47% for class II and 28.54% combined, and the highest regional values in North America at 33.70% and Europe at 34.84%. Table S5 resolves Figure S4b to the individual epitope, giving model-0 mean and minimum pLDDT and local packing for all twenty epitopes, with epitope mean confidence ranging from 26.65 to 65.60 and averaging 49.82. Mean pLDDT of 54.79 sits below the value of 70 conventionally taken to mark a confidently modelled region, the mean predicted aligned error of 19.96 Angstrom is of the order of the radius of gyration, and the mean inter-model C-alpha RMSD is 7.30 Angstrom across the five returned models. These values ranked the three candidate architectures and located the low-confidence regions within each job. The population coverage reported next is an allele-frequency projection for the five alleles this patient retained.
Table 9.
IEDB population-coverage estimates for the selected HLA set. Projected coverage, average epitope hits and minimum hits in 90% of the population for class I, class II and the combined allele set across twelve regions and the world aggregate. Values are allele-frequency projections rather than observed clinical coverage.
Presentation behaviour across the assembled sequence was screened with the official IEDB predictors. Figure S5a,b give the full-construct class-I and class-II predictions respectively, with each predicted window placed against the junction coordinates so that linker-overlapping calls are separated from calls falling inside an epitope. Figure S6 gives the BepiPred-2.0 linear B-cell propensity trace along the same chain, and Table S6 lists the fifteen predicted linear segments with their coordinates, sequences, mean scores and the fraction of each segment made up of linker residues, which averages 0.449 across the segments.
3.9. Junction-Specific Redesign Reduces Linker-Overlapping Predictions
Because the flexible control architecture places a GGGGS linker at every junction, we screened each junction separately against the four candidate linkers using the same official predictors, and rebuilt the construct from the winning choices. Figure S7 shows that per-junction screen and the linkers it selected under the weighted junction risk of Equation (10). The redesigned construct A144-MEV-03R is 350 residues and uses two AAY, one EAAAK, ten GGGGS and six GPGPG linkers while preserving the same twenty epitopes in the same order with the same restrictions, so its population coverage is unchanged by construction. Figure S8a,b compare the parent and redesigned constructs on predicted junction behaviour. High-priority linker-overlapping windows fall from 26 to 18, weaker windows from 90 to 83, and the fraction of linker residues called linear-B-cell-prone falls from 91.6% to 78.0%. Table S7 gives the full physicochemical and prediction comparison behind those panels, confirming that the two constructs remain closely matched in bulk properties, at 354 against 350 residues, 35.38 against 35.81 kDa, isoelectric point 6.22 against 6.23 and GRAVY −0.033 against −0.040, so the junction gain is not bought with a change in the overall character of the molecule. Figure S9 gives the template-sensitivity audit of the redesigned construct across independent prediction runs, and Table S8 records its structural-confidence summary, with mean pLDDT 28.06, mean predicted aligned error 26.62 Å, pTM 0.168, mean linker pLDDT 30.96 and mean epitope pLDDT 27.05. Those values sit below the parent construct’s, with a mean inter-model C-alpha RMSD of 15.78 Angstrom, and Table S8 records the status field structure_confidence_status as low_global_confidence_flexible_or_disordered. A144-MEV-03R is the endpoint of the minimal-epitope construct line and is not the antigen carried into the coding sequences. The three open reading frames of Section 3.10 and Section 3.11 were built from the native-flank modules of Section 2.21, which use eighteen verified long peptides carrying fifteen native residues on each side of every substitution. The minimal-epitope constructs are retained in this report because they establish the junction-optimisation result on a fixed epitope set.
3.10. Native-Flank Recovery and Modular Junction Optimisation
We then rebuilt the antigen on native sequence context. The twenty selected peptide records consolidate onto nineteen unique mutations, and each was mapped back to its exact Ensembl source protein under three verification gates: the reference residue must match at the annotated position, the mutant protein is formed by substitution at that position, and every contributing source peptide must be contained within the reconstructed context. Table S9 records that audit for all nineteen mutations, with the transcript, protein identifier, protein position, amino-acid change and reconstruction status for each, and eighteen pass all three gates to give verified long peptides carrying fifteen native residues on each side of the substitution. The eighteen verified long peptides were partitioned into three antigen modules, one class-I module joined by AAY and two class-II modules joined by GPGPG, and every module junction was rescreened and reoptimised. Figure 6 gives the result of that optimisation. Figure 6a shows high-priority linker-overlapping windows per module before and after junction optimisation, falling from nine to four in the class-I module and from nine to seven in the first class-II module, with the second class-II module carrying none under either design. Figure 6b shows the weaker windows on the same comparison, falling from 65 to 19 in the class-I module while the two class-II modules remain close to their starting values. Summed across the three modules, high-priority linker-overlapping windows fall from 18 to 11 and weaker windows from 88 to 42. Table S10 gives the module-level counts plotted in Figure 6, and Table S11 gives the fifteen optimised module junctions individually, each with its linker choice, one-based position, junction window and screen-derived risk. The mutation that fails is SLC39A2, so the final modules carry eighteen of the nineteen mutations and nineteen of the twenty original peptide records.
Figure 6.
Native-flank platform and junction optimisation. Predicted linker-overlapping HLA windows per antigen module before and after junction-specific linker optimisation, for (a) high-priority and (b) weaker predicted windows.
3.11. Three Exact Platform-Neutral Open Reading Frames
Each optimised module was converted to a coding sequence by deterministic codon selection under Equation (11), using a human codon table ordered by usage. Figure 7 gives the resulting architecture. Figure 7a draws the three encoded proteins to residue scale with every native-flank epitope, its gene, its mutation and the optimised linker at each junction, showing the class-I module of 248 residues carrying seven epitopes, the first class-II module of 211 residues carrying six, and the second class-II module of 177 residues carrying five. Figure 7b gives the exact encoded-sequence and junction audit for the three modules side by side. Table 10 records the same three designs numerically: antigen lengths of 247, 211 and 176 residues, encoded proteins of 248, 211 and 177 residues, open reading frames of 744, 633 and 531 nucleotides excluding the stop codon, masses of 26.77, 22.95 and 18.61 kDa, and guanine–cytosine fractions of 0.535, 0.553 and 0.550. All three pass the exact translation back-check and all three use TGA as the stop codon.
Figure 7.
A144 three-module encoded antigen sequence architecture. (a) The three encoded proteins drawn to residue scale, showing each native-flank epitope with its gene and mutation and the optimised linker at every junction. (b) Exact encoded-sequence and junction audit for the three modules.
Table 10.
Three-module antigen and ORF design summary. Design attributes of the three research open reading frames, transposed so each attribute occupies one row. All three pass the exact translation back-check.
Table S12 lists the fifteen junction coordinates within the encoded proteins after the initiator-methionine shift, so every junction in Figure 7a can be located in the final sequence. Table S13 gives the complete sequence-design metrics for the three open reading frames, including minimum and maximum guanine–cytosine fraction over sliding sixty-nucleotide windows, longest homopolymer of four, five and five, CpG counts of 30, 33 and 25, a start-region self-complementarity proxy of six for each, and an empty surviving-motif table for all three, confirming that none of the avoided polyadenylation or common cloning motifs remains. Each design carries its own SHA-256 sequence identifier and codon-table provenance string. Figure S10 audits the three encoded sequences directly, and Figure S11 displays the complete amino-acid FASTA records with one-based residue coordinates and per-sequence hashes, so the released sequences can be checked against the figure without opening a file. Table S14 reports the full-length rescreen of the final encoded proteins with the official predictors and initiator-adjusted junction coordinates: 3342 predictions for the class-I module, 2824 and 2348 for the two class-II modules, yielding 31, 23 and 10 high-priority and 64, 87 and 49 weaker calls respectively across the complete sequences. Table S15 consolidates the fifteen encoded-protein junctions into a single experiment-ready processing-risk matrix, giving for each junction its window sequence, the local screen risk, the full-construct prediction counts, the best predicted rank and a risk class. Five junctions carry no predicted overlapping binder at all and seven carry only weak-priority calls, leaving three that concentrate the high-priority signal, so targeted experimental work can be directed at a defined minority of the junctions rather than at all fifteen. Forty-five unique junction-spanning peptide reagents were generated from these windows for prespecified targeted immunopeptidomics and T-cell assays. Finally, the coding sequences were placed in a cloning context. Figure S12 gives the circular plasmid blueprints for the pGEM4Z-T7-5′UTR-EGFP-3′UTR-A64 research backbone with each open reading frame replacing the EGFP coding region, and Figure S13 gives the corresponding linear in vitro transcription cassette maps, with the three open reading frames drawn at their exact resolved lengths of 744, 633 and 531 nucleotides. After optimisation, eleven high-priority and forty-two weak-priority linker-overlapping windows remain across the three modules, and the full-length rescreen of the encoded proteins returns 4, 7 and 0 linker-overlapping high-priority calls and 19, 17 and 6 weak-priority calls for the class-I and the two class-II modules respectively. Three of the fifteen junctions carry the high-priority signal, at encoded-protein positions 69 in the class-I module and 140 and 176 in the first class-II module, and the junction-spanning reagents were generated from those windows.
Minimum free energy secondary structure of the three coding sequences is given in Table 11. The three designs fold to −268.20, −204.10 and −178.80 kcal/mol, which is −0.359, −0.321 and −0.335 kcal/mol per nucleotide, so folding stability per base is closely matched across the three modules despite their different lengths. Paired-base fractions of 0.661, 0.607 and 0.633 and ensemble free energies within 13.4 kcal/mol of the minimum free energy in every case describe the extensively paired structures expected of the guanine–cytosine-balanced coding sequence at this length. The first ninety nucleotides, taken alone as a proxy for start-region accessibility, fold to −21.90, −28.20 and −21.10 kcal/mol, placing the first class-II module about 6 kcal/mol more structured at its five-prime end than the other two. These are predictions on the coding sequence alone; the untranslated regions and poly(A) tract of a delivered construct are not included and would alter them.
Table 11.
Predicted minimum free energy secondary structure of the three open reading frames. ViennaRNA RNAfold 2.7.2 on the coding sequence including the stop codon, excluding untranslated regions and the poly(A) tract. The start-region row gives the minimum free energy of the first ninety nucleotides taken alone.
Finally, each open reading frame was placed in its cloning context. The Addgene-verified complete sequence of the research backbone, 3540 bp of circular DNA, was used to substitute each coding sequence for the 720 bp EGFP region at one-based positions 2760 to 3479, giving the three simulated clones of Table 12 at 3567, 3456 and 3354 bp. Exact substring recovery of the insert at the intended coordinates passed for all three, and each clone carries its own SHA-256 identifier. The restriction audit returned no new site for any of the six screened enzymes, because none of the three inserts contains one, and the single HindIII, EcoRI, BsaI and BsmBI sites of the backbone are retained, so the designs leave the documented cloning and linearisation strategy intact. Linearisation with SpeI gives in vitro transcription templates of 1065, 954 and 852 nucleotides, measured from the T7 transcription start to the run-off end at the SpeI top-strand cut as described in Section 2.23. The same calculation returns 1038 nucleotides for the parent EGFP construct, which is the length the depositor reports, and each predicted transcript begins with the GGG typical of a T7 start and ends inside the encoded poly(A) tract.
Table 12.
In silico cloning of the three open reading frames into the research backbone. Each coding sequence, including its stop codon, substituted for the 720 bp EGFP region of the Addgene-verified 3540 bp plasmid record. Transcript lengths are for SpeI-linearised template, computed from the T7 transcription start to the run-off end (Section 2.23); the same calculation reproduces the 1038 nucleotides the depositor reports for the parent EGFP construct. Recovery is exact substring recovery of the insert at the intended coordinates.
4. Discussion
The result we consider most informative is not any single metric but the demonstration that evidence weighting, set composition and construct design can be carried through one chain in which nothing downstream is allowed to see the assay labels. Each has been handled well in isolation. What is unusual is running them together, because each is normally handed to a different tool with its own conventions and its own idea of what a candidate is. Running them under one typed schema, one frozen partition and one locked objective changes what reaches the end of the pipeline, because the decisions that determine a vaccine set are made jointly rather than sequentially. Placing tumour evidence inside the rank rather than after it follows from what presentation requires. A mutant peptide reaches the cell surface only if the mutation is transcribed, carried by enough of the tumour to matter, and restricted by an allele the malignant cells still express, and each of those conditions fails often enough that treating them as post hoc filters lets candidates the tumour cannot present occupy the top of a ranked list. The locked score gives predicted binding slightly less than half its weight and distributes the remainder across within-patient expression, variant allele frequency and immunopeptidome support, all as percentiles so that patients with different sequencing depth remain comparable. The composition of the A144 set shows the mechanism acting: eleven of the twenty candidates carry immunopeptidome support directly in their score, and DNA variant allele frequency contributes to all twenty. Realised weights diverge from nominal ones, because RNA expression was unmeasured for sixteen of the twenty candidates and the expression term is zero for them. The construction implements the observation from the TESLA consortium that expression and wild-type dissimilarity add information beyond binding prediction [22] as a ranking input rather than a post hoc filter, and the public outcome data available here are too sparse to show whether that placement improves which candidates are chosen [48,49].
The second departure is treating the vaccine as a set. Independent scoring optimises each element alone. That is why the head of a ranked list so often fills with overlapping peptides from one gene restricted by one allele. Posing selection as a constrained objective with explicit terms for redundancy and for HLA, gene and clone breadth makes composition something the method is asked for rather than something it happens to produce. For A144 the returned set spans five retained alleles across both classes and nineteen mutations in nineteen distinct genes among twenty peptide records, and class-II representation matters because mutant class-II epitopes can themselves drive therapeutic responses [50], with the single repeat arising from the per-gene cap rather than from score crowding. Breadth of this kind matters because a response distributed across several restriction elements and several genes is less easily lost to the allele-specific and antigen-specific escape routes that are well documented in this disease, including loss of heterozygosity at the HLA locus [21,51]. Among the frozen comparators, the transparent missingness-aware logistic model matched or exceeded the neural encoders on every metric we recorded, although no pairwise difference survives Holm correction across the fifteen comparisons, and the six models were not matched on input representation. We read the pattern as a statement about the regime rather than about model families. With a few hundred labelled peptides, what a model can learn is bounded by how well the representation exposes the relevant contrast, and attribution in the frozen model concentrated on the paired mutant and wild-type description of the peptide and on the substitution terms between them. That the difference between a mutant peptide and its wild-type counterpart carries most of the usable signal is consistent with the biology that motivates neoantigen selection in the first place, and with the improvement that followed when eluted-ligand data were brought into binding predictors [19]. It also argues for keeping missingness explicit: encoding an unmeasured expression value as a value plus an observation flag preserves a distinction that zero-filling destroys. The baselines in Table 7 show what the constraint is doing. Ranking the same pool by quality alone returns fifteen reading registers of one FKBP8 mutation across twenty slots and two distinct genes, and so does not satisfy the per-gene cap at all, while ranking on predicted binding alone returns seven genes with five records from one of them. The crowding that motivates posing selection as a set problem is therefore not a hypothetical property of ranked lists but the behaviour of this pool, and it is invisible to Equation (1), whose position-wise identity scores those FKBP8 registers as unrelated. Within the objective the gene-breadth term carries most of that work: removing it drops the set from nineteen distinct mutations to eleven, whereas removing the wild-type penalty, or enabling the clone-breadth term, returns the same set at the same objective value, which is what a term with no clonal annotation behind it should do.
Junction design is usually settled by convention. Our results suggest it is the part of multi-epitope construction most open to systematic optimisation. Concatenating epitopes creates a sequence that exists in no tumour protein, and the linker chosen at each junction determines both how that sequence is processed and whether it generates binders competing with the intended epitopes [26]. Scoring each junction separately against four candidate linkers and rebuilding the construct from the winning choices reduced predicted linker-overlapping windows at both priority levels while leaving the epitope set, its order and its restrictions untouched, so population coverage is unchanged by construction and the bulk properties of the molecule move very little. Recovering fifteen native residues on each side of every mutation addresses the same problem from the other direction, restoring the proteasomal context in which these sequences are normally processed [28,52] rather than presenting minimal epitopes stripped of their flanks. The exact coding sequence is what makes the junction analysis actionable. Deterministic codon selection under an explicit penalty produced three open reading frames that pass exact translation back-check, carry no surviving polyadenylation or common cloning motif, and hold guanine–cytosine content near the target across sliding windows. Because every junction has a resolved coordinate in the final encoded protein, the consolidated processing-risk matrix resolves to the level at which experiments are actually designed: five of the fifteen junctions carry no predicted overlapping binder, seven carry only weak-priority calls, and three concentrate the high-priority signal. Targeted immunopeptidomics and T-cell work can therefore be pointed at a defined minority of junctions, supported by the forty-five junction-spanning reagents generated from those windows [53,54], instead of being spread evenly across a construct.
What the framework offers beyond this worked case is a reusable path. Its inputs are a variant table with expression and variant allele frequency, high-resolution HLA typing, allele-specific loss data and, where available, cohort immunopeptidomics, all of which are increasingly standard in neoantigen cohorts [24,28]. Every stage writes checksum-verified artefacts and refuses to overwrite them, so a selection can be traced from a public supplementary row to a synthesisable sequence and rerun to the same result, which is also the level of specification that manufacturing and cost assessment of personalised peptide sets requires [55]. The natural extension is prospective application within a cohort that carries these fields [11,56], where the locked score and the constrained objective can be applied unchanged and the junction analysis can be tested directly against natural presentation at the junctions the matrix already identifies.
Three limitations bound the conclusions, and all three follow from the public data rather than from the workflow. The internal benchmark rests on a 30-candidate test partition, and across the fifteen pairwise comparisons no difference survives Holm correction, so the model ordering describes that partition and supports no claim about architectures. ITSNdb publishes no patient identifiers, so partitioning and resampling operate at the candidate level and leakage control is demonstrated at the sequence level; the same absence prevents a patient-level audit of independence between ITSNdb and TESLA. And none of the six comparators transferred to TESLA, where every receiver-operating-characteristic area lies below 0.5 and the calibration failure follows the shift from 60% positive internally to 4.4% positive externally. A few hundred curated labelled peptides, drawn from one curation pipeline, are not a basis for a predictor that generalises across cohorts, and the retrospective ELISpot comparison, on five patients carrying eight positive peptides against pools of up to 13,070 candidates, does not have the resolution to separate two rankings. The locked score is therefore label-blind by construction and not validated against outcomes, and no setting of its weights ranks the measured positives better than its binding term alone. Reconstructing the wild-type counterparts the external table omits recovers most of the calibration, which places the remaining gap in discrimination rather than in the representation, and a positives-only source such as TSNAdb cannot close it, because the fraction of known positives a model accepts rises with its confidence rather than with its accuracy. Where the limit lies is the more useful question, and the configuration search answers it: across 105 combinations of model family, regularisation and encoder columns the best cross-validated score sits inside one fold standard deviation of the default, and the configuration cross-validation preferred then scored lower on the held-out partition. The ceiling is the quantity of labelled data, not the choice of model, which is the reading the multiplicity correction gives from the other direction.
The predicted and structural outputs carry their own limits. Mean pLDDT of 54.79 for A144-MEV-03 and 28.06 for A144-MEV-03R, with inter-model C-alpha RMSD of 7.30 and 15.78 Angstrom, are what a flexible linker-rich concatenated antigen should be expected to return; they served to rank candidate architectures and to locate low-confidence regions, and they establish neither a defined global fold nor anything about processing or presentation. The binding and B-cell results stand on the same footing, and junction optimisation reduced predicted linker-overlapping windows without removing them, leaving three junctions that concentrate the high-priority signal and mark where experimental work should start. Projected population coverage of 11.27% for class I and 28.54% combined worldwide follows from restricting the construct to the five alleles this patient retained, so it bounds reuse of that allele set rather than use in this patient. The cloning is a sequence-level simulation against a verified backbone record: insert recovery is exact and the backbone cloning sites are retained, and no assembly chemistry was validated, no plasmid was sequenced and no clone was built. What would carry the framework further is a cohort in which linked expression, variant allele frequency, HLA typing, allele-loss and immunopeptidome fields are complete and a selected set is tested prospectively, beginning at the junction windows this analysis already names.
5. Conclusions
Neoantigen vaccine design is usually assembled from tools that solve one part of the problem well and hand the rest on. EvoSet-NeoVax shows that the three decisions which actually determine a vaccine set—how candidate evidence is weighted, how the set is composed, and how the epitopes are joined—can be made inside one workflow that never sees the assay labels used to evaluate it. Putting expression, variant allele frequency and immunopeptidome support into the rank rather than into a filter changes which candidates reach the top, and the public outcome data available here are too sparse to show whether that change is an improvement. Posing selection as a constrained set problem rather than a ranking produced a set for patient A144 spanning five retained alleles, both HLA classes and nineteen mutations in nineteen genes, where an independent-ranking baseline cannot meet the composition constraints at all, and screening every junction separately against four linkers reduced predicted linker-overlapping windows across the three antigen modules. The design is delivered at the resolution at which it can be built. Three research open reading frames of 744, 633 and 531 nucleotides encode the optimised modules, pass exact translation back-check, carry no surviving polyadenylation or cloning motif, and place all fifteen junctions at resolved coordinates in the final proteins. That coordinate resolution turns junction behaviour into a short experimental list rather than a property of the whole construct, with five junctions carrying no predicted overlapping binder, seven carrying only weak-priority calls, and three concentrating the high-priority signal. Because every stage writes checksum-verified artefacts from commit-pinned public sources, the entire path from the supplementary row to the synthesisable sequence can be reproduced and applied unchanged to any cohort carrying linked variant, expression, HLA typing and allele-loss data.
Supplementary Materials
The following supporting information can be downloaded at: https://www.mdpi.com/article/10.3390/vaccines14110939/s1, Figure S1: Frozen-model interpretation; Figure S2: Initial vaccine-development handoff for the A144 selected set; Figure S3: AlphaFold audit of the three provisional A144 linker architectures; Figure S4: Primary-candidate audit of A144-MEV-03; Figure S5: Full-construct HLA presentation audit of A144-MEV-03; Figure S6: Linear B-cell propensity of A144-MEV-03; Figure S7: Junction-specific linker optimisation producing A144-MEV-03R; Figure S8: Comparison of A144-MEV-03 with the redesigned A144-MEV-03R; Figure S9: Template-sensitivity audit of A144-MEV-03R; Figure S10: Sequence audit of the three A144 mRNA research open reading frames; Figure S11: Exact FASTA representation of the three encoded A144 antigen modules; Figure S12: Circular plasmid blueprints for the three research open reading frames; Figure S13: Linear in-vitro-transcription cassette architecture; Table S1: Paired candidate-level model comparisons; Table S2: Full A144 selected-candidate records; Table S3: Selected-candidate HLA allele breadth; Table S4: Reviewed-human-proteome near-match audit; Table S5: Epitope-level AlphaFold confidence metrics; Table S6: Predicted linear B-cell segments; Table S7: MEV-03 versus MEV03R computational comparison; Table S8: MEV03R AlphaFold structural-confidence summary; Table S9: Native-flank mutation and reference-protein audit; Table S10: Default-versus-optimized linker comparison; Table S11: Optimized antigen-module junctions; Table S12: Encoded-protein ORF junction coordinates; Table S13: mRNA ORF sequence-design metrics; Table S14: Full-ORF IEDB rescreen summary; Table S15: Encoded-protein junction-processing risk matrix.
Author Contributions
Conceptualization, R.A. and K.S.A.; methodology, R.A.; software, R.A.; validation, R.A. and K.S.A.; formal analysis, R.A.; investigation, R.A.; data curation, R.A.; writing of the original draft, R.A.; review and editing, R.A. and K.S.A.; visualisation, R.A.; supervision, K.S.A.; project administration, K.S.A.; funding acquisition, R.A. All authors have read and agreed to the published version of the manuscript.
Funding
This research was supported by the Deanship of Graduate Studies and Scientific Research at Qassim University (QU-APC-2026).
Institutional Review Board Statement
Not applicable. The study used only previously published, publicly available data.
Informed Consent Statement
Not applicable.
Data Availability Statement
The analysis code, configuration, provenance manifests and all derived artefacts, including the figures, tables and sequence files reported here, are archived at Zenodo under DOI 10.5281/zenodo.22722518 (https://doi.org/10.5281/zenodo.22722518). The backbone record used for cloning is Addgene plasmid 203348.
Acknowledgments
The researchers would like to thank the Deanship of Graduate Studies and Scientific Research at Qassim University (https://www.qu.edu.sa) for financial support (QU-APC-2026).
Conflicts of Interest
The authors declare no conflicts of interest.
References
- Zhang, T.; Kurban, E.; Wang, Z. Neoantigens: The Novel Precision Cancer Immunotherapy. Biologics 2023, 3, 321–334. [Google Scholar] [CrossRef] [Scilit]
- Schreiber, R.D.; Old, L.J.; Smyth, M.J. Cancer immunoediting: Integrating immunity’s roles in cancer suppression and promotion. Science 2011, 331, 1565–1570. [Google Scholar] [CrossRef] [Scilit]
- Alexandrov, L.B.; Ju, Y.S.; Haase, K.; van Loo, P.; Martincorena, I.; Nik-Zainal, S.; Totoki, Y.; Fujimoto, A.; Nakagawa, H.; Shibata, T.; et al. Mutational signatures associated with tobacco smoking in human cancer. Science 2016, 354, 618–622. [Google Scholar] [CrossRef] [Scilit]
- Rizvi, N.A.; Hellmann, M.D.; Snyder, A.; Kvistborg, P.; Makarov, V.; Havel, J.J.; Lee, W.; Yuan, J.; Wong, P.; Ho, T.S.; et al. Cancer immunology. Mutational landscape determines sensitivity to PD-1 blockade in non-small cell lung cancer. Science 2015, 348, 124–128. [Google Scholar] [CrossRef] [Scilit]
- Hellmann, M.D.; Callahan, M.K.; Awad, M.M.; Calvo, E.; Ascierto, P.A.; Atmaca, A.; Rizvi, N.A.; Hirsch, F.R.; Selvaggi, G.; Szustakowski, J.D.; et al. Tumor Mutational Burden and Efficacy of Nivolumab Monotherapy and in Combination with Ipilimumab in Small-Cell Lung Cancer. Cancer Cell 2019, 35, 329. [Google Scholar] [CrossRef] [Scilit]
- Verdegaal, E.M.; de Miranda, N.F.; Visser, M.; Harryvan, T.; van Buuren, M.M.; Andersen, R.S.; Hadrup, S.R.; van der Minne, C.E.; Schotte, R.; Spits, H.; et al. Neoantigen landscape dynamics during human melanoma-T cell interactions. Nature 2016, 536, 91–95. [Google Scholar] [CrossRef] [Scilit]
- Pardi, N.; Hogan, M.J.; Porter, F.W.; Weissman, D. MRNA vaccines—A new era in vaccinology. Nat. Rev. Drug Discov. 2018, 17, 261–279. [Google Scholar] [CrossRef] [Scilit]
- Ni, L. Advances in mRNA-Based Cancer Vaccines. Vaccines 2023, 11, 1599. [Google Scholar] [CrossRef] [Scilit]
- Zak, M.M.; Zangi, L. Lipid Nanoparticles for Organ-Specific mRNA Therapeutic Delivery. Pharmaceutics 2021, 13, 1675. [Google Scholar] [CrossRef] [Scilit]
- Aldosari, B.N.; Alfagih, I.M.; Almurshedi, A.S. Lipid Nanoparticles as Delivery Systems for RNA-Based Vaccines. Pharmaceutics 2021, 13, 206. [Google Scholar] [CrossRef] [Scilit]
- Ott, P.A.; Hu, Z.; Keskin, D.B.; Shukla, S.A.; Sun, J.; Bozym, D.J.; Zhang, W.; Luoma, A.; Giobbie-Hurder, A.; Peter, L.; et al. An immunogenic personal neoantigen vaccine for patients with melanoma. Nature 2017, 547, 217–221. [Google Scholar] [CrossRef] [Scilit]
- Sahin, U.; Derhovanessian, E.; Miller, M.; Kloke, B.P.; Simon, P.; Lower, M.; Bukur, V.; Tadmor, A.D.; Luxemburger, U.; Schrors, B.; et al. Personalized RNA mutanome vaccines mobilize poly-specific therapeutic immunity against cancer. Nature 2017, 547, 222–226. [Google Scholar] [CrossRef] [Scilit]
- Sahin, U.; Oehm, P.; Derhovanessian, E.; Jabulowsky, R.A.; Vormehr, M.; Gold, M.; Maurus, D.; Schwarck-Kokarakis, D.; Kuhn, A.N.; Omokoko, T.; et al. An RNA vaccine drives immunity in checkpoint-inhibitor-treated melanoma. Nature 2020, 585, 107–112. [Google Scholar] [CrossRef] [Scilit]
- Rojas, L.A.; Sethna, Z.; Soares, K.C.; Olcese, C.; Pang, N.; Patterson, E.; Lihm, J.; Ceglia, N.; Guasp, P.; Chu, A.; et al. Personalized RNA neoantigen vaccines stimulate T cells in pancreatic cancer. Nature 2023, 618, 144–150. [Google Scholar] [CrossRef] [Scilit]
- Weber, J.S.; Carlino, M.S.; Khattak, A.; Meniawy, T.; Ansstas, G.; Taylor, M.H.; Kim, K.B.; McKean, M.; Long, G.V.; Sullivan, R.J.; et al. Individualised neoantigen therapy mRNA-4157 (V940) plus pembrolizumab versus pembrolizumab monotherapy in resected melanoma (KEYNOTE-942): A randomised, phase 2b study. Lancet 2024, 403, 632–644. [Google Scholar] [CrossRef] [Scilit]
- Reynolds, C.R.; Tran, S.; Jain, M.; Narendran, A. Neoantigen Cancer Vaccines: Generation, Optimization, and Therapeutic Targeting Strategies. Vaccines 2022, 10, 196. [Google Scholar] [CrossRef] [Scilit]
- Khan, M.; Li, X.; Yan, M.; Li, Z.; Yang, H.; Liao, G. Efficacy and Safety of Actively Personalized Neoantigen Vaccination in the Management of Newly Diagnosed Glioblastoma: A Systematic Review. Int. J. Gen. Med. 2021, 14, 5209–5220. [Google Scholar] [CrossRef] [Scilit]
- Hundal, J.; Kiwala, S.; McMichael, J.; Miller, C.A.; Xia, H.; Wollam, A.T.; Liu, C.J.; Zhao, S.; Feng, Y.Y.; Graubert, A.P.; et al. pVACtools: A Computational Toolkit to Identify and Visualize Cancer Neoantigens. Cancer Immunol. Res. 2020, 8, 409–420. [Google Scholar] [CrossRef] [Scilit]
- Reynisson, B.; Alvarez, B.; Paul, S.; Peters, B.; Nielsen, M. NetMHCpan-4.1 and NetMHCIIpan-4.0: Improved predictions of MHC antigen presentation by concurrent motif deconvolution and integration of MS MHC eluted ligand data. Nucleic Acids Res. 2020, 48, W449–W454. [Google Scholar] [CrossRef] [Scilit]
- O’Donnell, T.J.; Rubinsteyn, A.; Laserson, U. MHCflurry 2.0: Improved Pan-Allele Prediction of MHC Class I-Presented Peptides by Incorporating Antigen Processing. Cell Syst. 2020, 11, 418–419. [Google Scholar] [CrossRef] [Scilit]
- Paul, S.; Croft, N.P.; Purcell, A.W.; Tscharke, D.C.; Sette, A.; Nielsen, M.; Peters, B. Benchmarking predictions of MHC class I restricted T cell epitopes in a comprehensively studied model system. PLoS Comput. Biol. 2020, 16, e1007757. [Google Scholar] [CrossRef] [Scilit]
- Wells, D.K.; van Buuren, M.M.; Dang, K.K.; Hubbard-Lucey, V.M.; Sheehan, K.C.F.; Campbell, K.M.; Lamb, A.; Ward, J.P.; Sidney, J.; Blazquez, A.B.; et al. Key Parameters of Tumor Epitope Immunogenicity Revealed Through a Consortium Approach Improve Neoantigen Prediction. Cell 2020, 183, 818–834 e813. [Google Scholar] [CrossRef] [Scilit]
- McGranahan, N.; Furness, A.J.; Rosenthal, R.; Ramskov, S.; Lyngaa, R.; Saini, S.K.; Jamal-Hanjani, M.; Wilson, G.A.; Birkbak, N.J.; Hiley, C.T.; et al. Clonal neoantigens elicit T cell immunoreactivity and sensitivity to immune checkpoint blockade. Science 2016, 351, 1463–1469. [Google Scholar] [CrossRef] [Scilit]
- Jamal-Hanjani, M.; Wilson, G.A.; McGranahan, N.; Birkbak, N.J.; Watkins, T.B.K.; Veeriah, S.; Shafi, S.; Johnson, D.H.; Mitter, R.; Rosenthal, R.; et al. Tracking the Evolution of Non-Small-Cell Lung Cancer. N. Engl. J. Med. 2017, 376, 2109–2121. [Google Scholar] [CrossRef] [Scilit]
- McGranahan, N.; Rosenthal, R.; Hiley, C.T.; Rowan, A.J.; Watkins, T.B.K.; Wilson, G.A.; Birkbak, N.J.; Veeriah, S.; Van Loo, P.; Herrero, J.; et al. Allele-Specific HLA Loss and Immune Escape in Lung Cancer Evolution. Cell 2017, 171, 1259–1271.e1211. [Google Scholar] [CrossRef] [Scilit]
- Pyasi, S.; Sharma, V.; Dipti, K.; Jonniya, N.A.; Nayak, D. Immunoinformatics Approach to Design Multi-Epitope—Subunit Vaccine Against Bovine Ephemeral Fever Disease. Vaccines 2021, 9, 925. [Google Scholar] [CrossRef] [Scilit]
- Yakobi, S.H.; Nwodo, U.U. In Silico Design and Characterization of the Essential Outer-Membrane Lipoprotein LolB-Derived Multi-Epitope Vaccine Candidate Against Pseudomonas aeruginosa. Methods Protoc. 2026, 9, 52. [Google Scholar] [CrossRef] [Scilit]
- Nielsen, M.; Lundegaard, C.; Lund, O.; Kesmir, C. The role of the proteasome in generating cytotoxic T-cell epitopes: Insights obtained from improved predictions of proteasomal cleavage. Immunogenetics 2005, 57, 33–41. [Google Scholar] [CrossRef] [Scilit]
- Nicholas, B.; Bailey, A.; McCann, K.J.; Wood, O.; Currall, E.; Johnson, P.; Elliott, T.; Ottensmeier, C.; Skipp, P. Immunopeptidomics-guided identification of functional neoantigens in non-small cell lung cancer. npj Precis. Oncol. 2026, 10, 359. [Google Scholar] [CrossRef] [Scilit]
- Wu, J.; Chen, W.; Zhou, Y.; Chi, Y.; Hua, X.; Wu, J.; Gu, X.; Chen, S.; Zhou, Z. TSNAdb v2.0: The Updated Version of Tumor-Specific Neoantigen Database. Genom. Proteom. Bioinform. 2023, 21, 259–266. [Google Scholar] [CrossRef] [Scilit]
- Wu, J.; Zhao, W.; Zhou, B.; Su, Z.; Gu, X.; Zhou, Z.; Chen, S. TSNAdb: A Database for Tumor-Specific Neoantigens from Immunogenomics Data Analysis. Genom. Proteom. Bioinform. 2018, 16, 276–282. [Google Scholar] [CrossRef] [Scilit]
- Vita, R.; Mahajan, S.; Overton, J.A.; Dhanda, S.K.; Martini, S.; Cantrell, J.R.; Wheeler, D.K.; Sette, A.; Peters, B. The Immune Epitope Database (IEDB): 2018 Update. Nucleic Acids Res. 2019, 47, D339–D343. [Google Scholar] [CrossRef] [Scilit]
- Robinson, J.; Soormally, A.R.; Hayhurst, J.D.; Marsh, S.G.E. The IPD-IMGT/HLA Database—New Developments in Reporting HLA Variation. Hum. Immunol. 2016, 77, 233–237. [Google Scholar] [CrossRef] [Scilit]
- Kyte, J.; Doolittle, R.F. A simple method for displaying the hydropathic character of a protein. J. Mol. Biol. 1982, 157, 105–132. [Google Scholar] [CrossRef] [Scilit]
- Chen, T.; Guestrin, C. XGBoost: A Scalable Tree Boosting System. In Proceedings of the 22nd ACM SIGKDD International Conference on Knowledge Discovery and Data Mining, San Francisco, CA, USA, 13–17 August 2016; pp. 785–794. [Google Scholar] [CrossRef] [Scilit]
- UniProt Consortium, T. UniProt: The universal protein knowledgebase. Nucleic Acids Res. 2018, 46, 2699. [Google Scholar] [CrossRef] [Scilit]
- Abramson, J.; Adler, J.; Dunger, J.; Evans, R.; Green, T.; Pritzel, A.; Ronneberger, O.; Willmore, L.; Ballard, A.J.; Bambrick, J.; et al. Accurate structure prediction of biomolecular interactions with AlphaFold 3. Nature 2024, 630, 493–500. [Google Scholar] [CrossRef] [Scilit]
- Mirdita, M.; Schutze, K.; Moriwaki, Y.; Heo, L.; Ovchinnikov, S.; Steinegger, M. ColabFold: Making protein folding accessible to all. Nat. Methods 2022, 19, 679–682. [Google Scholar] [CrossRef] [Scilit]
- Jumper, J.; Evans, R.; Pritzel, A.; Green, T.; Figurnov, M.; Ronneberger, O.; Tunyasuvunakool, K.; Bates, R.; Zidek, A.; Potapenko, A.; et al. Highly accurate protein structure prediction with AlphaFold. Nature 2021, 596, 583–589. [Google Scholar] [CrossRef] [Scilit]
- Bui, H.H.; Sidney, J.; Dinh, K.; Southwood, S.; Newman, M.J.; Sette, A. Predicting population coverage of T-cell epitope-based diagnostics and vaccines. BMC Bioinform. 2006, 7, 153. [Google Scholar] [CrossRef] [Scilit]
- Jespersen, M.C.; Peters, B.; Nielsen, M.; Marcatili, P. BepiPred-2.0: Improving sequence-based B-cell epitope prediction using conformational epitopes. Nucleic Acids Res. 2017, 45, W24–W29. [Google Scholar] [CrossRef] [Scilit]
- Martin, F.J.; Amode, M.R.; Aneja, A.; Austine-Orimoloye, O.; Azov, A.G.; Barnes, I.; Becker, A.; Bennett, R.; Berry, A.; Bhai, J.; et al. Ensembl 2023. Nucleic Acids Res. 2023, 51, D933–D941. [Google Scholar] [CrossRef] [Scilit]
- Athey, J.; Alexaki, A.; Osipova, E.; Rostovtsev, A.; Santana-Quintero, L.V.; Katneni, U.; Simonyan, V.; Kimchi-Sarfaty, C. A new and updated resource for codon usage tables. BMC Bioinform. 2017, 18, 391. [Google Scholar] [CrossRef] [Scilit]
- Harris, C.R.; Millman, K.J.; van der Walt, S.J.; Gommers, R.; Virtanen, P.; Cournapeau, D.; Wieser, E.; Taylor, J.; Berg, S.; Smith, N.J.; et al. Array programming with NumPy. Nature 2020, 585, 357–362. [Google Scholar] [CrossRef] [Scilit]
- McKinney, W. Data Structures for Statistical Computing in Python. In Proceedings of the Python in Science Conference, Austin, TX, USA, 28 June–3 July 2010; pp. 56–61. [Google Scholar] [CrossRef] [Scilit]
- Virtanen, P.; Gommers, R.; Oliphant, T.E.; Haberland, M.; Reddy, T.; Cournapeau, D.; Burovski, E.; Peterson, P.; Weckesser, W.; Bright, J.; et al. SciPy 1.0: Fundamental Algorithms for Scientific Computing in Python. Nat. Methods 2020, 17, 261–272. [Google Scholar] [CrossRef] [Scilit]
- Hunter, J.D. Matplotlib: A 2D Graphics Environment. Comput. Sci. Eng. 2007, 9, 90–95. [Google Scholar] [CrossRef] [Scilit]
- Luksza, M.; Riaz, N.; Makarov, V.; Balachandran, V.P.; Hellmann, M.D.; Solovyov, A.; Rizvi, N.A.; Merghoub, T.; Levine, A.J.; Chan, T.A.; et al. A neoantigen fitness model predicts tumour response to checkpoint blockade immunotherapy. Nature 2017, 551, 517–520. [Google Scholar] [CrossRef] [Scilit]
- Savsani, K.; Jabbour, G.; Dakshanamurthy, S. A New Epitope Selection Method: Application to Design a Multi-Valent Epitope Vaccine Targeting HRAS Oncogene in Squamous Cell Carcinoma. Vaccines 2021, 10, 63. [Google Scholar] [CrossRef] [Scilit]
- Kreiter, S.; Vormehr, M.; van de Roemer, N.; Diken, M.; Lower, M.; Diekmann, J.; Boegel, S.; Schrors, B.; Vascotto, F.; Castle, J.C.; et al. Mutant MHC class II epitopes drive therapeutic immune responses to cancer. Nature 2015, 520, 692–696. [Google Scholar] [CrossRef] [Scilit]
- Grizzi, F.; Chiriva-Internati, M.; Hegazi, M.A.A.A.; Rubbino, F.; Pasqualini, F.; Spadaccini, M.; Andreozzi, M.; Mercurio, M.; Cassano, F.; Terrin, M.; et al. Cancer Immune Responsiveness and MHC Class I Antigen Presentation: Mechanisms of Immune Escape and Immunotherapy Resistance in Gastrointestinal Cancers. Cells 2026, 15, 1513. [Google Scholar] [CrossRef] [Scilit]
- Lau, D.; Elliott, T. Imaging antigen processing and presentation in cancer. Immunother. Adv. 2025, 5, ltaf002. [Google Scholar] [CrossRef] [Scilit]
- Purcell, A.W.; Ramarathinam, S.H.; Ternette, N. Mass spectrometry-based identification of MHC-bound peptides for immunopeptidomics. Nat. Protoc. 2019, 14, 1687–1707. [Google Scholar] [CrossRef] [Scilit]
- Marcu, A.; Bichmann, L.; Kuchenbecker, L.; Kowalewski, D.J.; Freudenmann, L.K.; Backert, L.; Muhlenbruch, L.; Szolek, A.; Lubke, M.; Wagner, P.; et al. HLA Ligand Atlas: A benign reference of HLA-presented peptides to improve T-cell-based cancer immunotherapy. J. Immunother. Cancer 2021, 9, e002071. [Google Scholar] [CrossRef] [Scilit]
- Novakova, A.; Morris, S.A.; Vaiarelli, L.; Frank, S. Manufacturing and Financial Evaluation of Peptide-Based Neoantigen Cancer Vaccines for Triple-Negative Breast Cancer in the United Kingdom: Opportunities and Challenges. Vaccines 2025, 13, 144. [Google Scholar] [CrossRef] [Scilit]
- Pardoll, D.M. The blockade of immune checkpoints in cancer immunotherapy. Nat. Rev. Cancer 2012, 12, 252–264. [Google Scholar] [CrossRef] [Scilit]
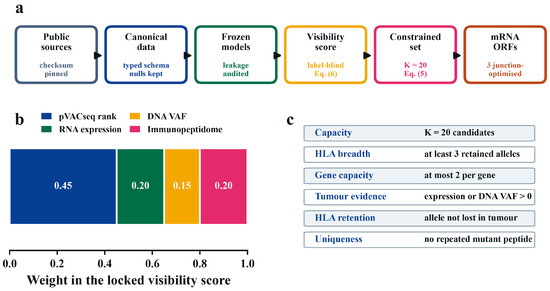
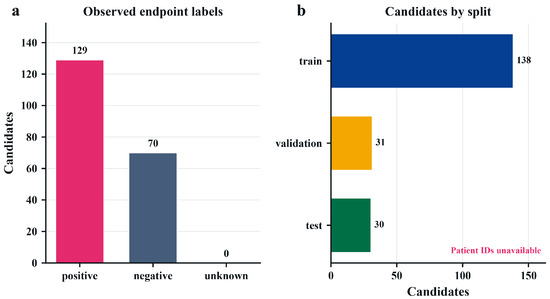
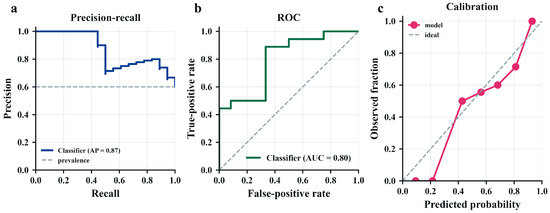
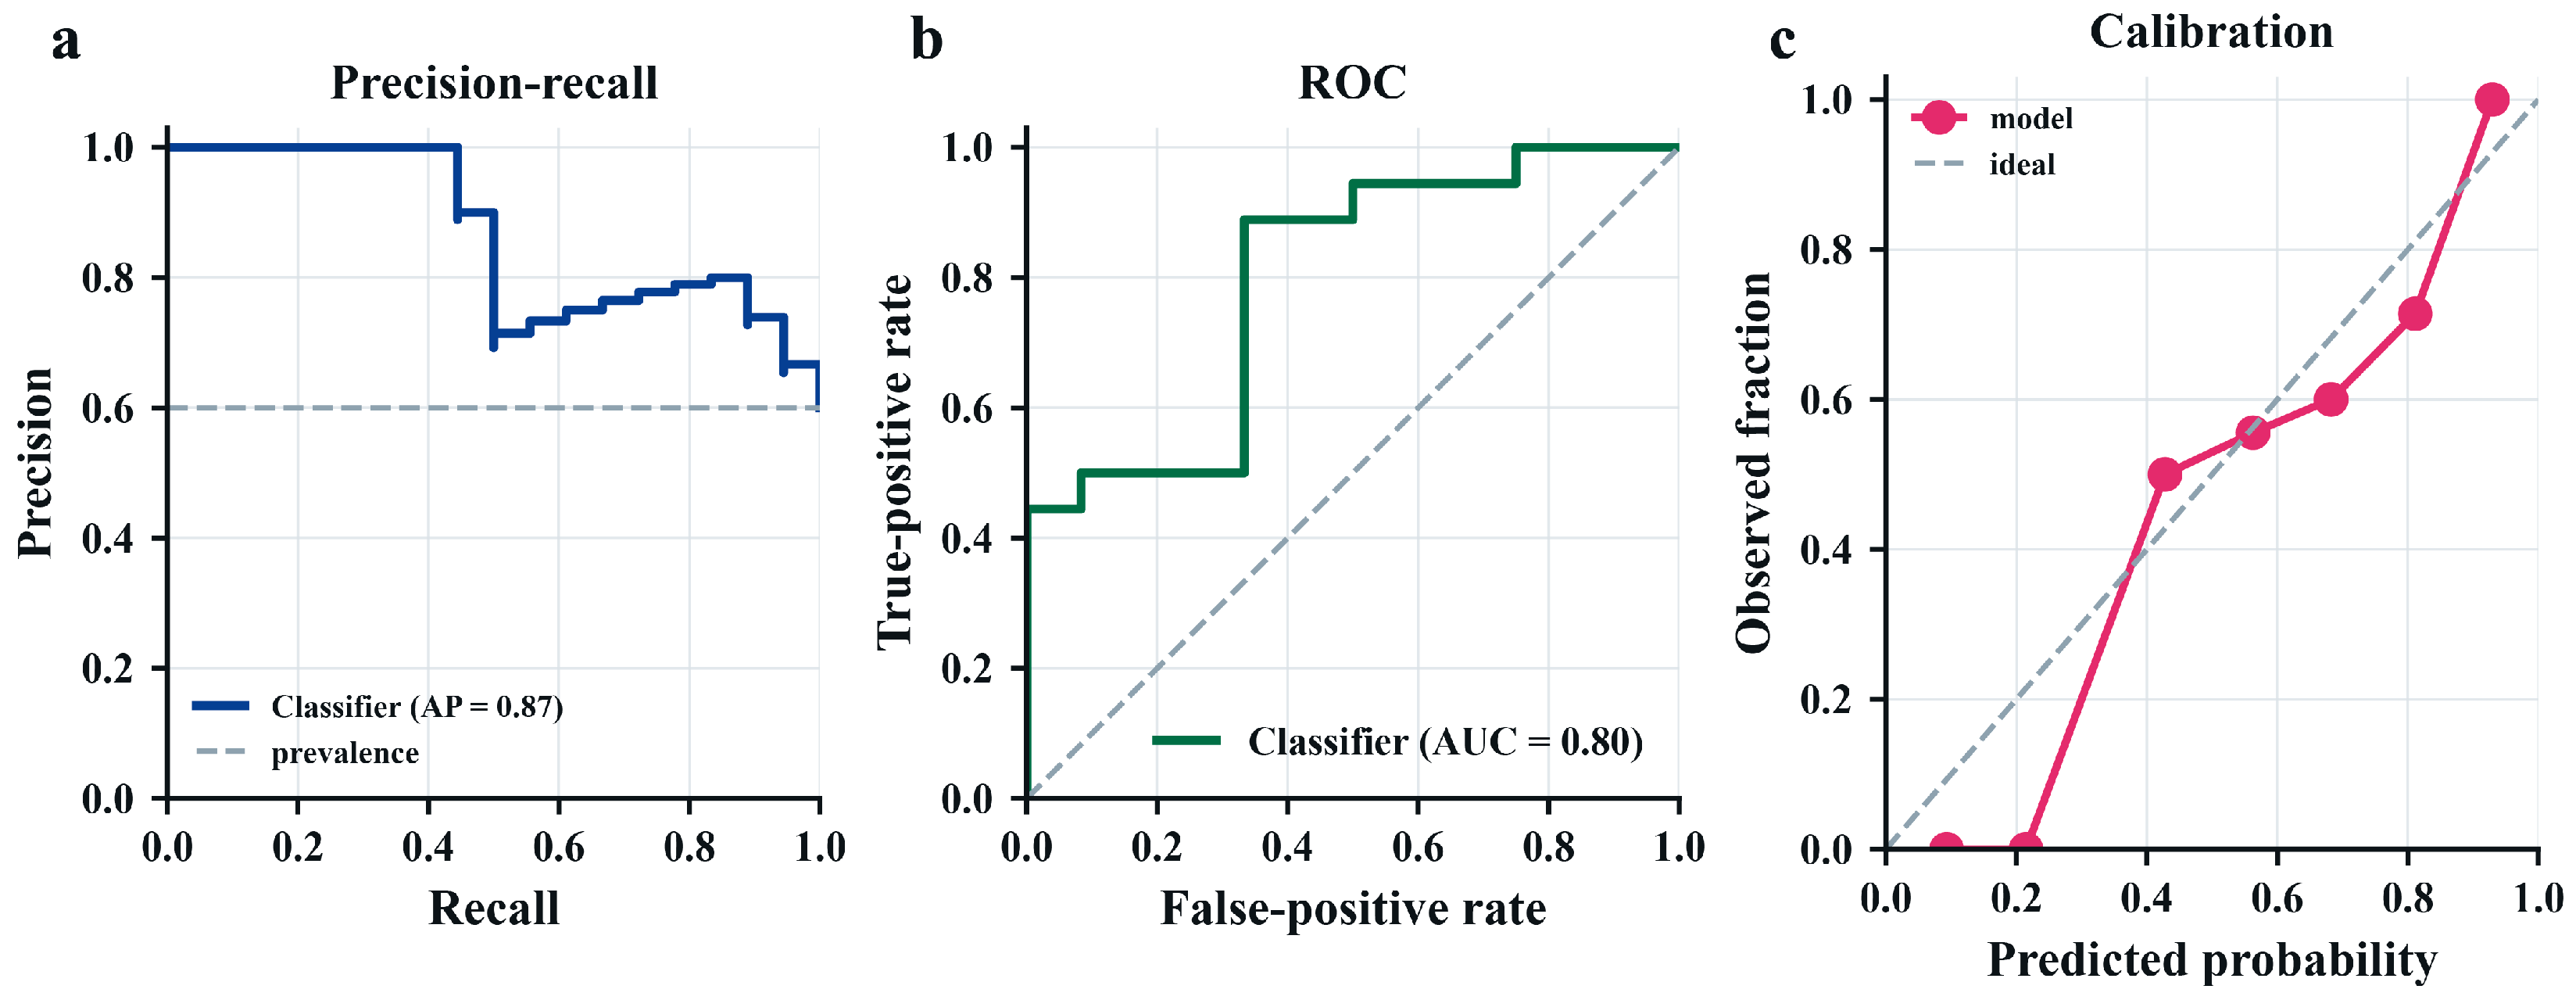
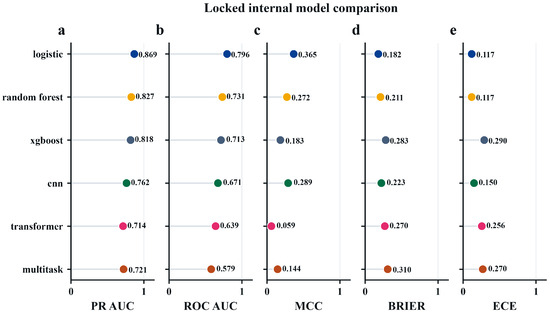
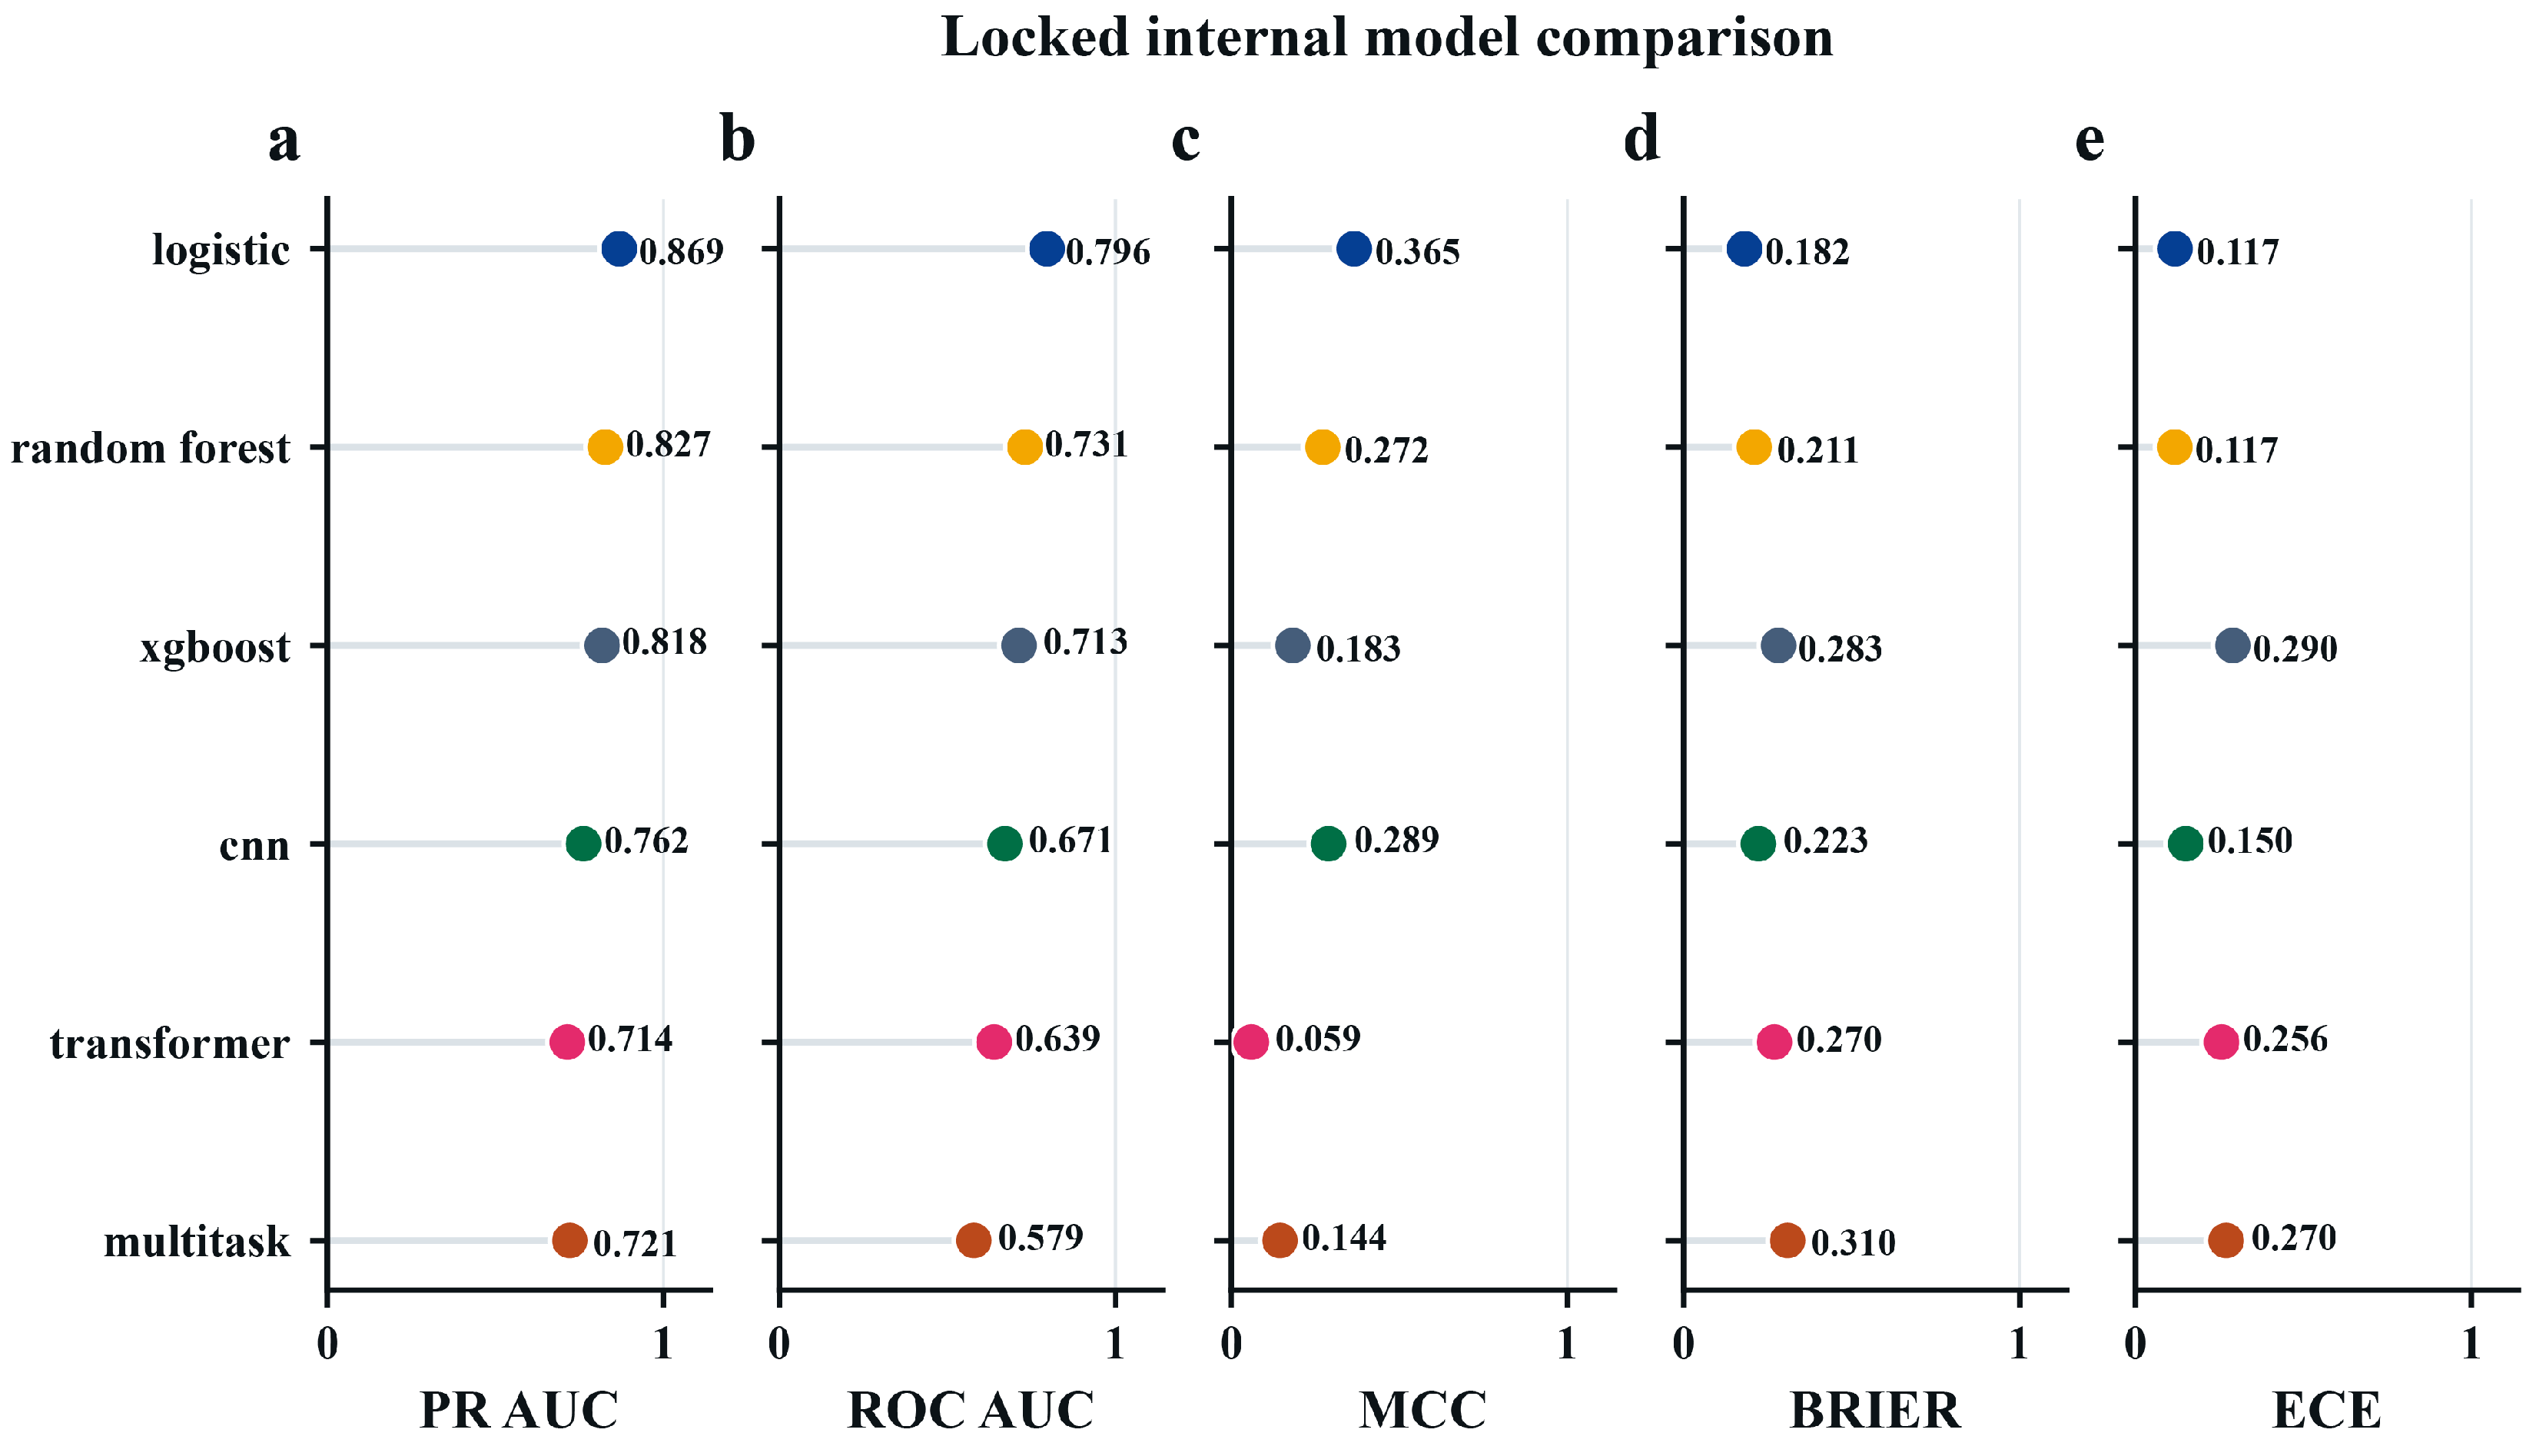
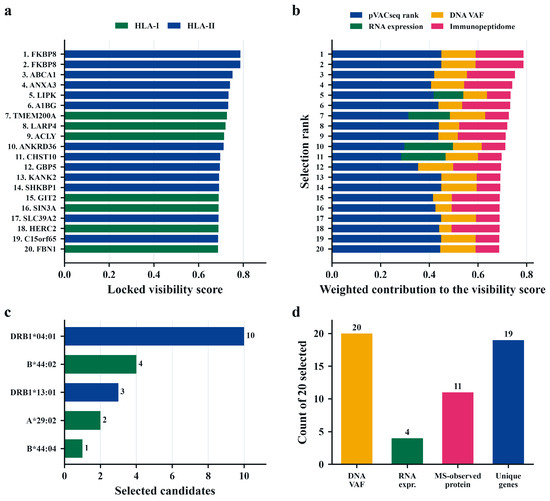
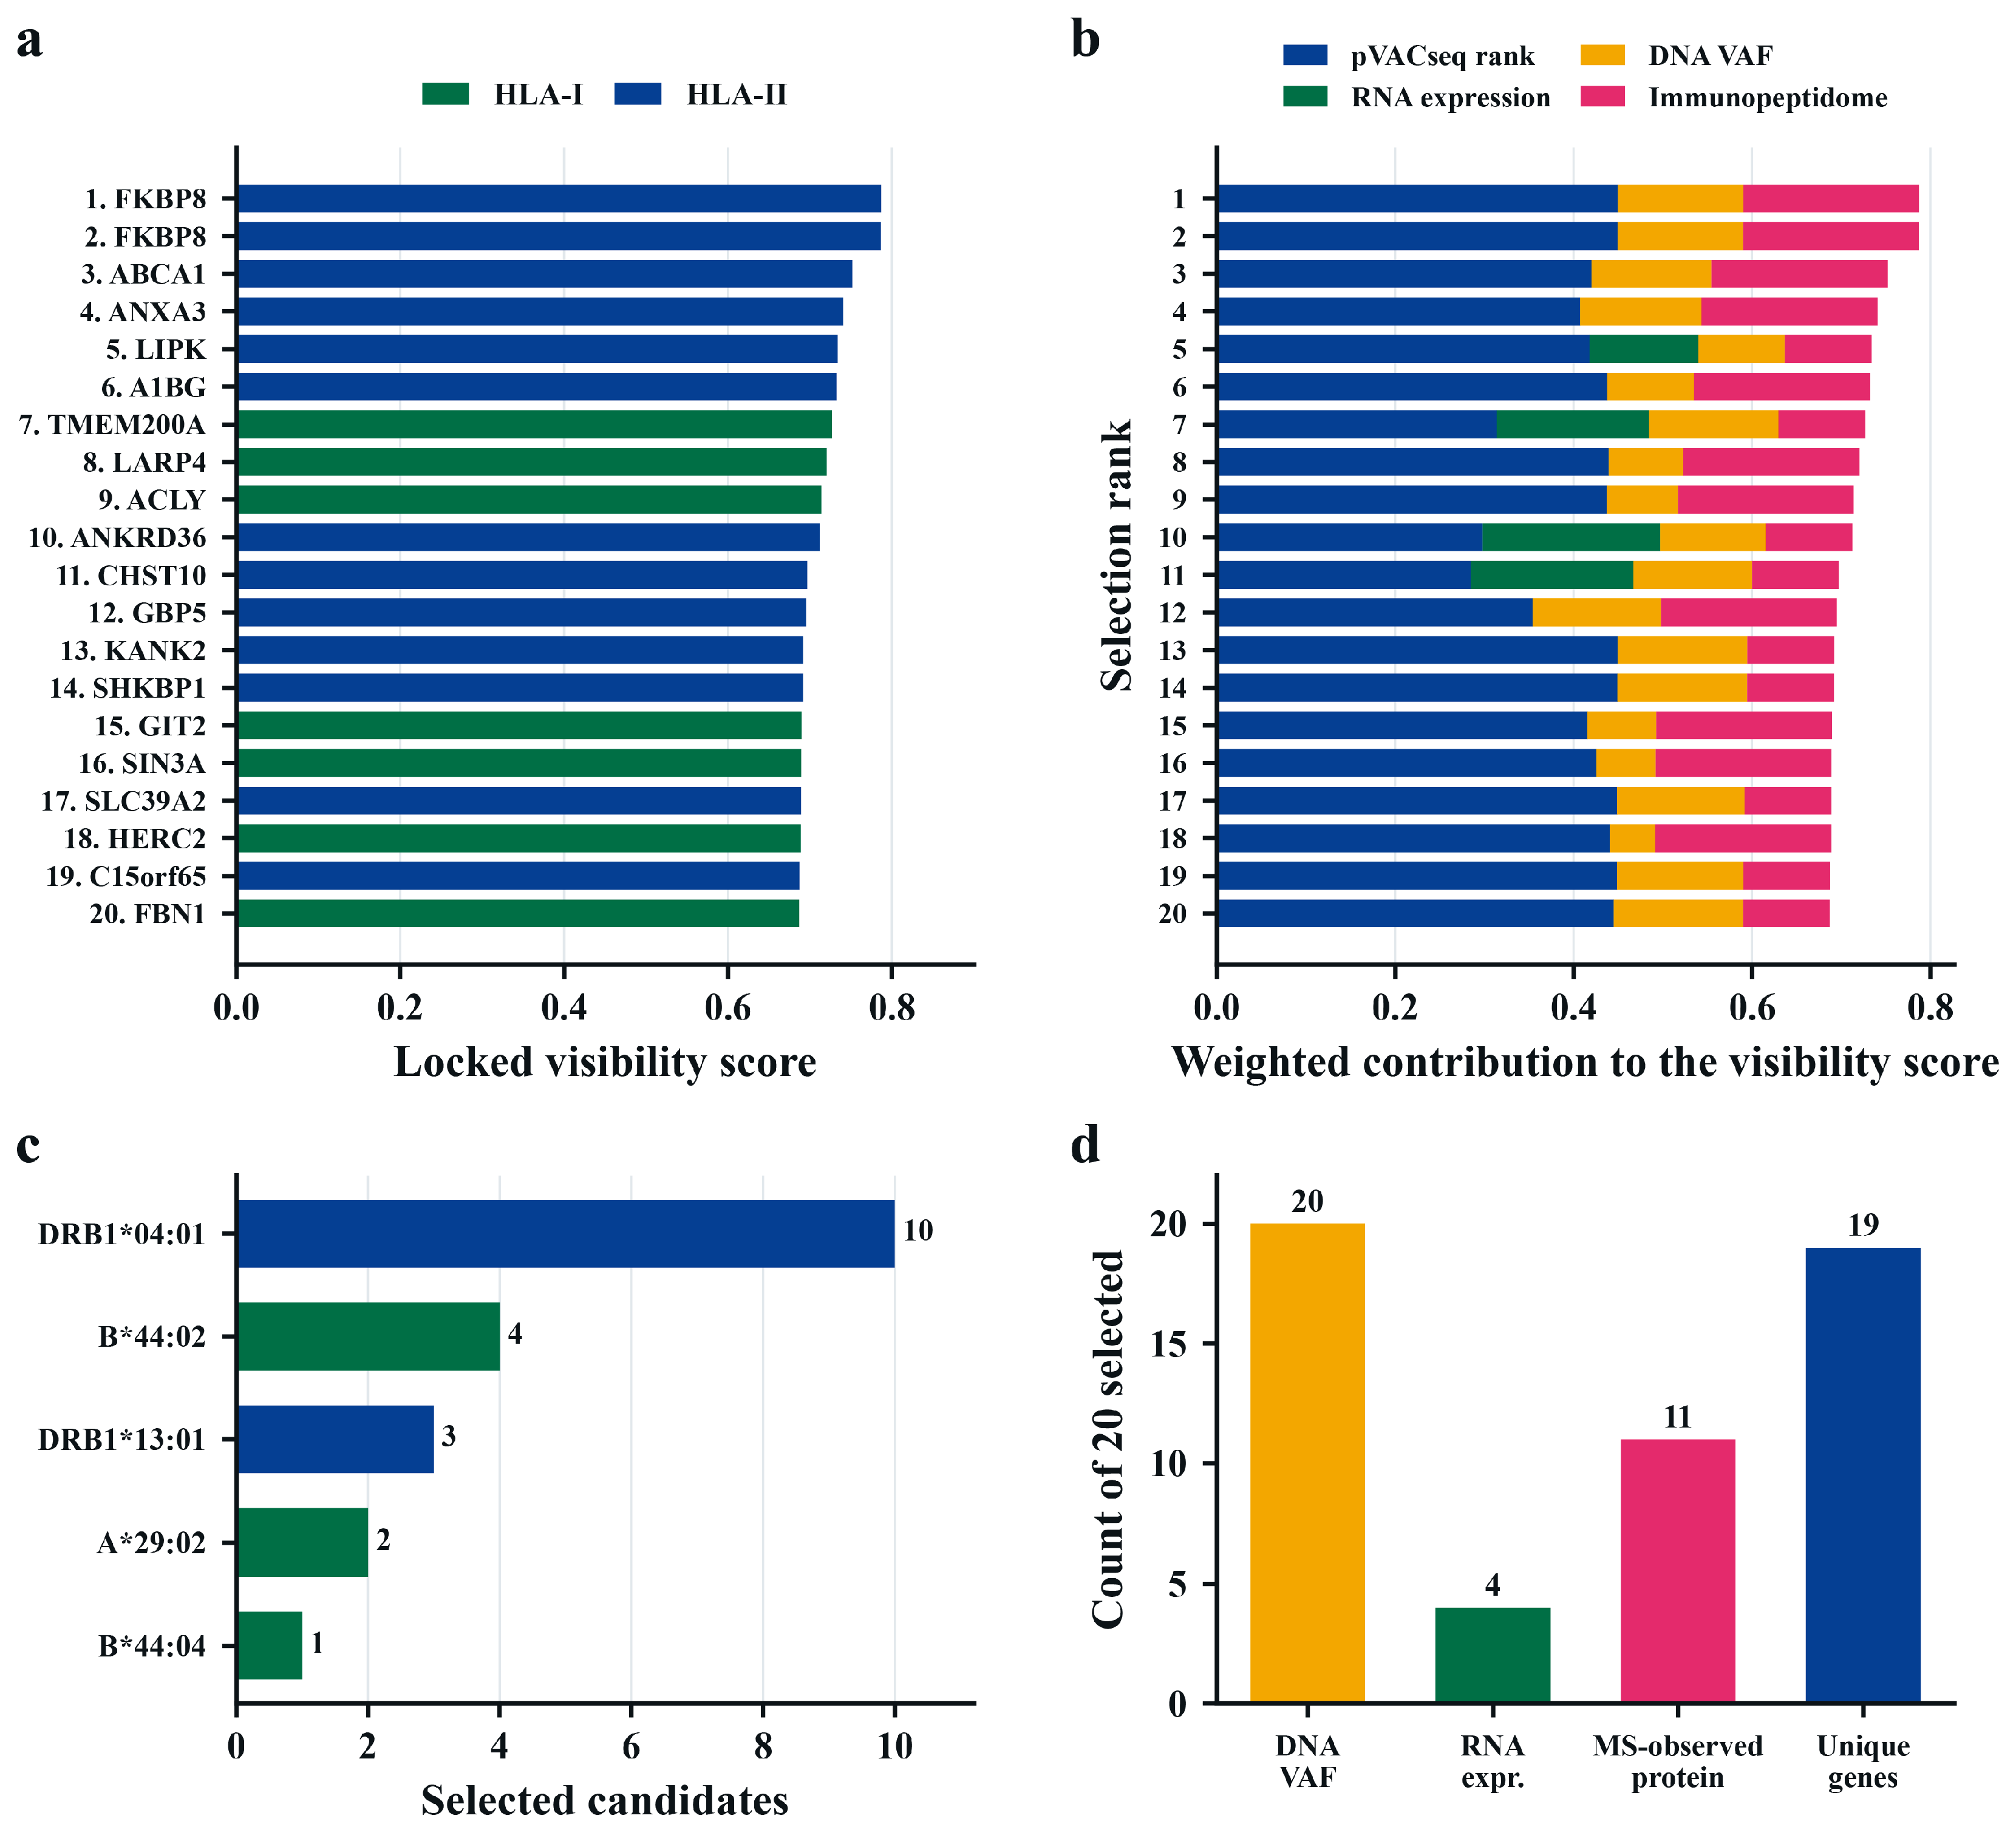
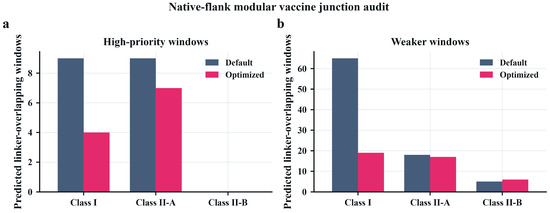
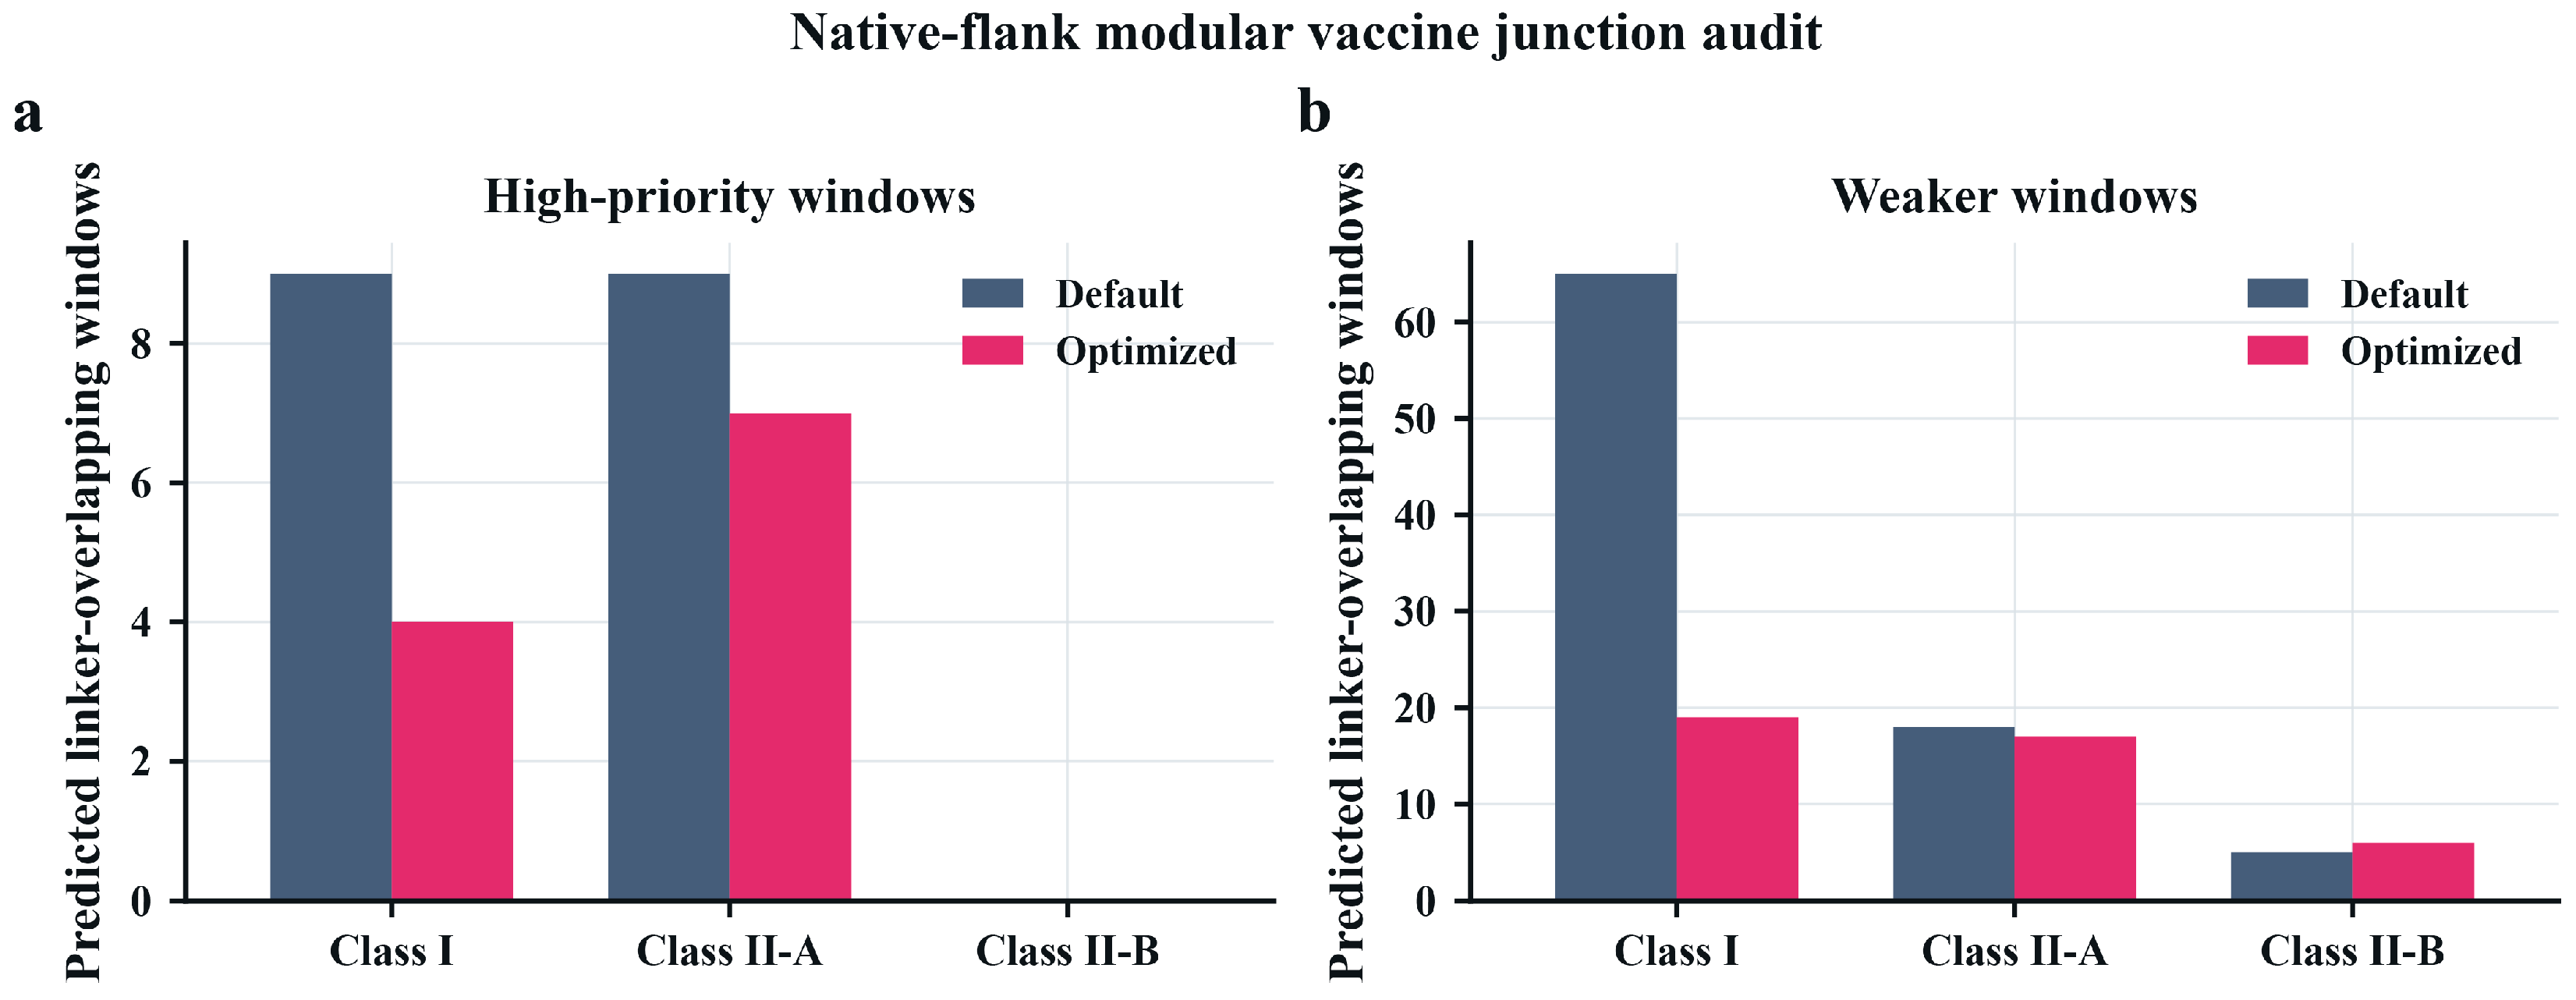
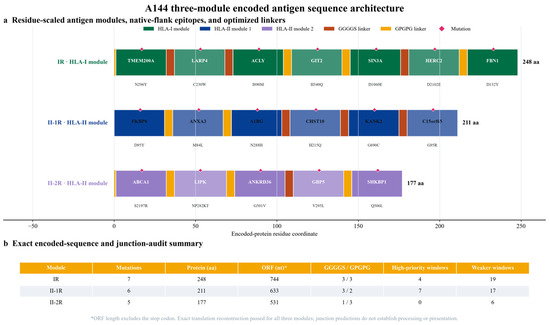
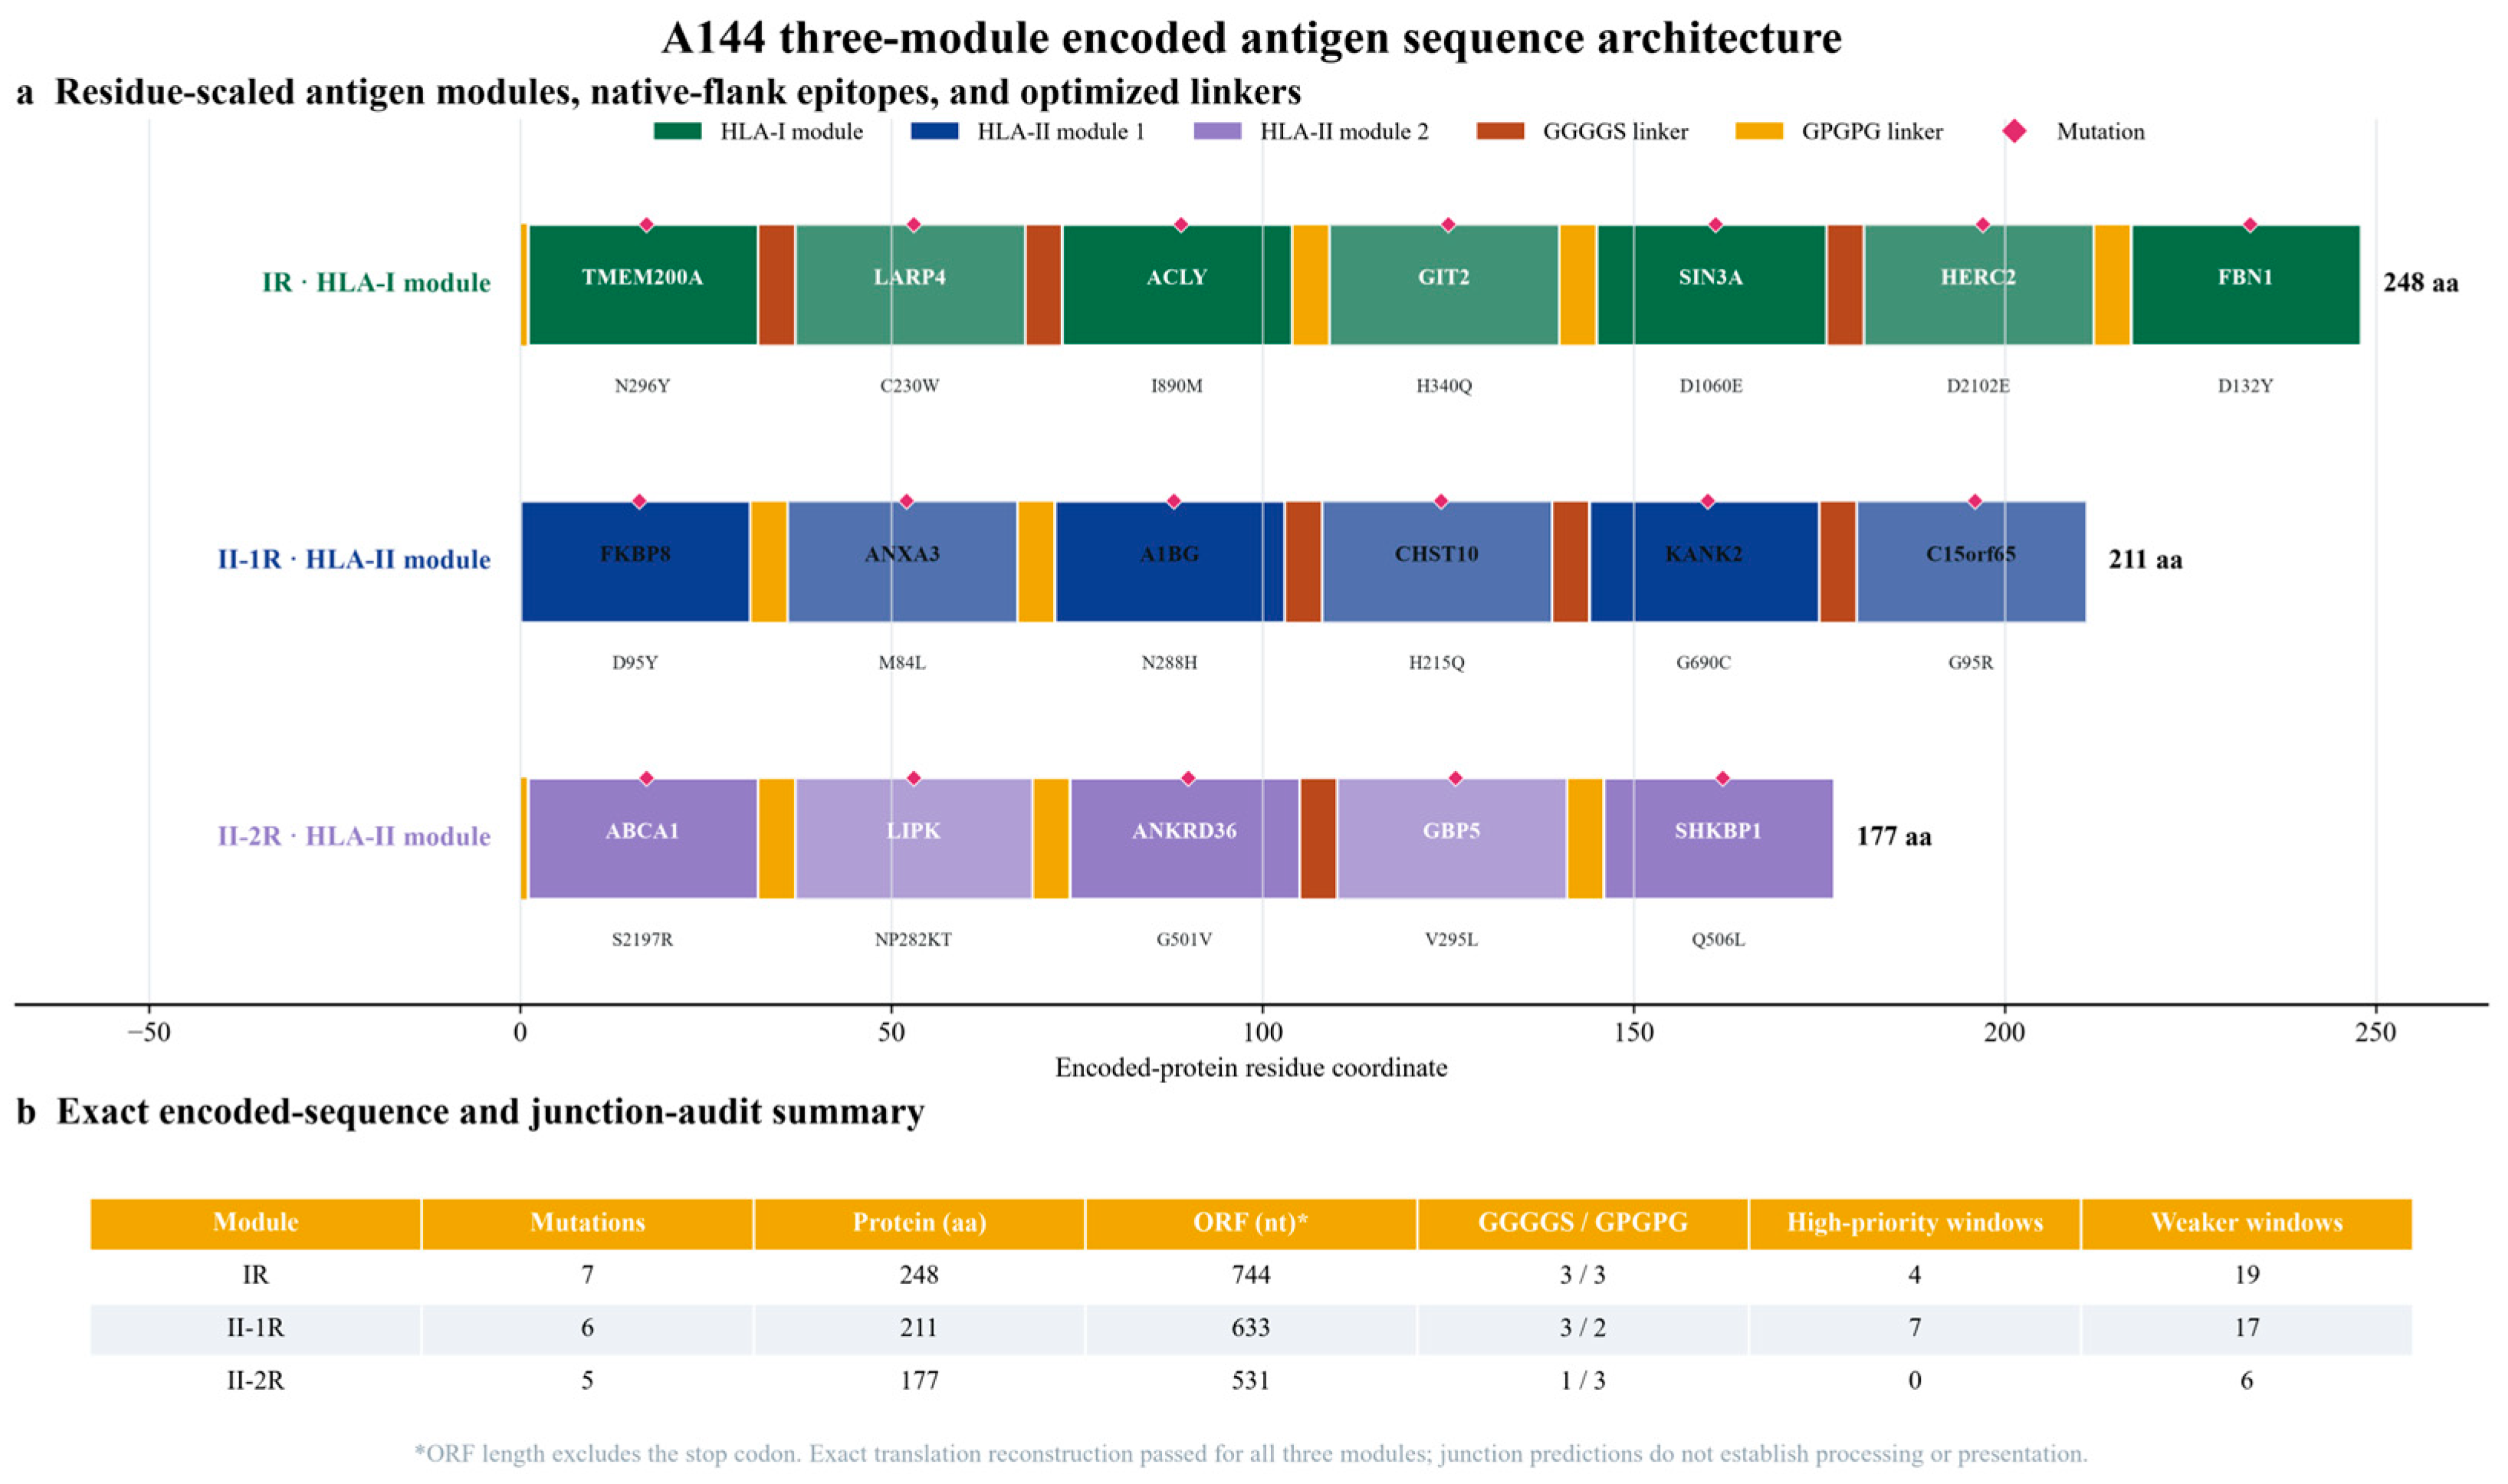

Disclaimer/Publisher’s Note: The statements, opinions and data contained in all publications are solely those of the individual author(s) and contributor(s) and not of MDPI and/or the editor(s). MDPI and/or the editor(s) disclaim responsibility for any injury to people or property resulting from any ideas, methods, instructions or products referred to in the content. |
© 2026 by the authors. Licensee MDPI, Basel, Switzerland. This article is an open access article distributed under the terms and conditions of the Creative Commons Attribution (CC BY) license.