


Abstract
Renal ischaemia–reperfusion injury (IRI) induces oxidative stress, inflammation and tubular apoptosis, leading to acute kidney injury. Autophagy maintains cellular homeostasis under stress, whereas impaired autophagic flux aggravates renal injury. This study investigated whether ginsenoside Rg3 exerts renoprotective effects in renal IRI and whether such effects are accompanied by changes in autophagy markers and AMP-activated protein kinase (AMPK) phosphorylation. In a murine IRI model, pretreatment with Rg3 (10 mg/kg) significantly improved renal function, reduced tubular necrosis, and attenuated oxidative stress and inflammation compared with untreated IRI. Rg3 enhanced antioxidant enzyme expression (SOD1, catalase, GPx) and decreased proinflammatory markers (MCP-1, osteopontin) and F4/80-positive macrophage infiltration. Western blot analysis showed that Rg3 increased LC3-II and phosphorylated AMPK while reducing p62 accumulation, a marker pattern compatible with enhanced autophagic flux. Protection was no longer evident when the lysosomal inhibitors bafilomycin A1 or chloroquine were co-administered with Rg3; because IRI groups receiving these inhibitors without Rg3 were not studied, the independent effect of the inhibitors on IRI cannot be separated from a reversal of Rg3-mediated protection. In HK-2 cells subjected to hypoxia/reoxygenation, Rg3 improved cell viability, reduced apoptosis, increased AMPK phosphorylation and altered autophagy markers; these changes were not observed when compound C or bafilomycin A1 was co-administered. Collectively, Rg3 reduced oxidative stress and apoptosis both in vivo and in vitro, and these effects were accompanied by increased AMPK phosphorylation and by changes in autophagy markers consistent with enhanced autophagic flux. These findings suggest that AMPK phosphorylation and autophagy-related processes may be involved in Rg3-mediated nephroprotection; establishing that they are required for protection will need genetic loss-of-function and direct flux measurements. Rg3 warrants further investigation as a candidate for the prevention of ischaemic acute kidney injury.
1. Introduction
Renal ischaemia–reperfusion injury (IRI) is characterised by restriction of the renal blood supply followed by restoration of blood flow and reoxygenation [1,2,3]. During renal IRI, several deleterious signalling pathways—including ATP depletion, excessive generation of reactive oxygen species (ROS) and mitochondrial dysfunction—collectively contribute to renal cell apoptosis [4,5,6]. Autophagy is activated in response to oxidative stress to protect cells from apoptosis [7], whereas impairment of autophagy causes accumulation of oxidative stress [8]. Induction of autophagy attenuates renal cell death after renal IRI [9], while impaired autophagic flux exacerbates renal injury [10].
Autophagy degrades damaged organelles and unnecessary cellular constituents. The process begins with the formation of autophagosomes—double-membraned vesicles marked by microtubule-associated protein 1 light chain 3 (LC3)—that sequester cellular debris and subsequently fuse with lysosomes for degradation [11]. The efficiency of this process, termed autophagic flux, can be assessed using established molecular markers: LC3 is integral to autophagosome formation and closure, whereas the adaptor protein SQSTM1/p62 links ubiquitinated cargo to LC3 and is itself degraded during effective autophagy [12]. Reduced p62 levels therefore indicate efficient autophagic activity. Importantly, activation of autophagy limits apoptosis and oxidative stress during IRI, whereas defective flux leads to the accumulation of damaged organelles and exacerbation of injury.
Recent evidence indicates that autophagy is not exclusively protective in renal IRI. Although timely activation of autophagy during the ischaemic phase limits tissue injury by mitigating oxidative stress, excessive or prolonged autophagy during the reperfusion phase can result in autophagy-dependent cell death and worsen tissue damage [13]. Furthermore, persistent autophagy after acute kidney injury (AKI) has been implicated in maladaptive tubular repair and progression to chronic kidney disease. Experimental autophagy inhibition during late reperfusion—using genetic or pharmacological approaches—attenuates renal injury in specific models, suggesting that dysregulated autophagy may exert detrimental effects depending on the timing and degree of activation [14,15].
Ginsenoside Rg3 (Rg3) is a pharmacologically active compound derived from heat-processed protopanaxadiol (PPD)-type ginsenosides [16]. Rg3 has dual properties: it exerts pro-apoptotic effects on cancer cells while exhibiting anti-apoptotic and cytoprotective effects in injured normal cells. In cancer cells, Rg3 suppresses NF-κB signalling and ERK activation, resulting in apoptosis [17,18]. Conversely, in normal cells, Rg3 reduces oxidative stress and apoptosis via activation of the PI3K/AKT signalling pathway, thereby protecting the liver from acetaminophen toxicity [19]. Notably, recent studies have demonstrated that Rg3 activates autophagy in various models of tissue injury. Rg3 reduces cardiomyocyte apoptosis in isoproterenol-induced myocardial infarction through AMPK-mediated autophagy activation [20], attenuates neurotoxicity and mitochondrial dysfunction by inducing autophagy [21], and mitigates liver injury through autophagy induction [22].
Despite these promising findings, the renoprotective mechanisms of Rg3—particularly its regulation of autophagic flux via AMPK signalling in ischaemia–reperfusion-induced renal injury—remain insufficiently clarified. We therefore investigated whether ginsenoside Rg3 modulates autophagy in a murine model of renal IRI, with the aim of elucidating its role in the restoration of autophagic flux and its therapeutic potential in acute kidney injury. Specifically, whereas previous studies have described Rg3-induced autophagy in cardiac, neuronal and hepatic injury models [20,21,22], it is unknown whether Rg3 restores the impaired autophagic flux that characterises renal IRI, whether this effect is AMPK-dependent, and whether it is required for its renoprotective action in vivo. To address these questions, we combined a time-course murine IRI model with in vivo pharmacological autophagy inhibition and an HK-2 cell hypoxia/reoxygenation model.
2. Materials and Methods
2.1. Animals and Experimental Design
Male C57BL/6 mice aged 10 weeks and weighing 22–25 g (Damul Science, Daejeon, Republic of Korea) were bred under specific pathogen-free conditions at 22–23 °C, 50–55% humidity and a 12 h light/12 h dark cycle. Ginsenoside Rg3 (≥98% purity, Sigma-Aldrich, St. Louis, MO, USA; Cat. No. SML0184-25MG, Lot No. 0000288594) was dissolved in dimethyl sulfoxide (DMSO) to prepare a stock solution at 50 mg/mL. The stock was diluted in sterile phosphate-buffered saline (PBS) immediately before use to obtain a working concentration of 2 mg/mL, with a final DMSO concentration below 5%. Mice were intraperitoneally injected with Rg3 at a dose of 10 mg/kg body weight (corresponding to 100 μL per 20 g mouse). Vehicle-treated mice received the same volume of PBS containing 5% DMSO. Rg3 or vehicle was administered 1 h before the induction of renal ischemia–reperfusion injury (IRI). In the dose-finding experiment, Rg3 was given at 5, 10 or 30 mg/kg by the same route and schedule. The minimum effective dose producing a significant reduction in blood urea nitrogen (BUN) and creatinine was 10 mg/kg, which was selected for all subsequent experiments (Figure S1). Chloroquine (CQ; Sigma-Aldrich, St. Louis, MO, USA) was administered intraperitoneally at 10 mg/kg and bafilomycin A1 (Baf) at 0.3 mg/kg, each once, 1 h before IRI surgery; both doses are commonly used for in vivo autophagy inhibition [23,24,25,26].
Mice were categorised according to the time of sacrifice after IRI (6, 24 and 72 h). For each time point, animals were randomly assigned using a computer-generated random number sequence and subdivided into four groups: sham, Rg3 + sham, IRI and Rg3 + IRI. In the 24 h post-IRI model, the role of autophagy was assessed by administering the autophagy inhibitors Baf and CQ (Figure S2). The number of animals in each group was as follows: sham and Rg3 + sham, n = 5 each for renal function, histological and in situ analyses, plus one additional animal per group (total n = 6) whose kidneys were used solely for Western blotting, so that each of the three independent immunoblot runs included two animals per group; these animals were sacrificed 24 h after surgery and served as the reference groups for all time points; IRI and Rg3 + IRI, n = 12 per group at each time point (6, 24 and 72 h); and Baf + Rg3 + IRI and CQ + Rg3 + IRI, n = 12 per group at 24 h after IRI. With the exception of the additional sham and Rg3 + sham animals used only for immunoblotting, all animals in each group were used for the assessment of renal function (BUN and serum creatinine) and histology. Molecular and in situ analyses were performed on kidneys from randomly selected subsets of animals within each group: quantitative RT-PCR, TUNEL staining and F4/80 immunohistochemistry on n = 5 (sham and Rg3 + sham) or n = 6 (IRI and Rg3 + IRI) animals per group, and Western blotting on n = 6 animals per group; in the autophagy-inhibitor study, all molecular and in situ analyses were performed on n = 6 animals per group. The individual animal was the experimental unit in all analyses, and the number of animals analysed for each endpoint is stated in the corresponding figure legend and summarised in Table S1.
IRI was induced as previously described [27]. After abdominal incision, both renal pedicles were bluntly clamped, and body temperature was maintained at 36 ± 1 °C throughout the procedure. The clamps were removed after 35 min of ischaemia. Sham mice underwent an identical surgical procedure without clamping. Kidney tissues were collected 24 h after IRI or sham operation unless otherwise stated.
2.2. Ethics Statement
Animal care and all experiments were performed under the institutional guidelines of the Korea Research Institute of Bioscience and Biotechnology, following a protocol approved by the Chungnam National University Institutional Animal Care and Use Committee (CNU-01181). Surgery was performed under anaesthesia with intraperitoneal ketamine (60 mg/kg; Yuhan Ketamine 50 Inj., Yuhan Pharm Co., Seoul, Republic of Korea), and postoperative analgesia was provided with buprenorphine (0.05 mg/kg, subcutaneous) immediately after surgery to minimise pain and distress. No mouse died or showed signs of discomfort, distress or suffering before completion of the experiment. Euthanasia was performed by anaesthetising the mice with ketamine followed by cervical dislocation.
2.3. Blood and Tissue Preparation
Blood was collected from the inferior vena cava after euthanasia under anaesthesia and placed into pre-chilled Eppendorf tubes (4 °C). Serum was separated by centrifugation for 20 min at 4 °C, shock-frozen in liquid nitrogen and stored at −70 °C. Tissues were prepared as described previously [27]. Briefly, the left kidney was excised immediately after sacrifice and cut into three coronal sections. Two pieces were snap-frozen in liquid nitrogen and stored at −70 °C for subsequent RNA and protein analysis. The remaining portion was fixed in 10% buffered formaldehyde at room temperature and embedded in Paraplast (Sherwood Medical, St. Louis, MO, USA) for light microscopy and immunofluorescence analyses.
2.4. Histopathological Analysis
Paraffin-embedded kidney tissue was cut into 4 µm sections, deparaffinised with xylene, stained with haematoxylin and eosin (H&E) and periodic acid–Schiff (PAS), and examined under an Olympus BX51 microscope (Olympus, Tokyo, Japan). In H&E sections, renal cortical vacuolisation, peritubular/proximal tubular leukocyte infiltration and proximal tubular simplification were scored as follows: 0, normal; 1, mild; 2, moderate; 3, severe injury. Tubular damage (epithelial necrosis) in PAS-stained sections was scored as: 0, normal; 1, <10%; 2, 10–25%; 3, 26–75%; 4, >75%. Tubular necrosis was defined as loss of the proximal tubular brush border, blebbing of apical membranes, or intraluminal aggregation of cells and proteins. Sections were evaluated by an experienced pathologist in a blinded manner, with one section per animal and five randomly selected, non-overlapping fields (×200) photographed and scored in each section. Scores from all fields were averaged to yield a single value per animal, and the animal—not the microscopic field—was used as the unit of statistical analysis (sham and Rg3 + sham, n = 5 each; IRI and Rg3 + IRI, n = 12 per group at each time point; Baf + Rg3 + IRI and CQ + Rg3 + IRI, n = 12 each). All sections were scored by a single pathologist blinded to group allocation; inter-observer reproducibility was not assessed.
2.5. Cell Culture and Hypoxia/Reoxygenation
Human renal proximal tubular epithelial cells (HK-2; American Type Culture Collection, Manassas, VA, USA) were cultured in Dulbecco’s modified Eagle medium (DMEM)/F12 (Gibco, New York, NY, USA). At approximately 80% confluence, hypoxia was simulated by immersing HK-2 monolayers in mineral oil (Sigma-Aldrich) for 1 h at 37 °C. After extensive washing with phosphate-buffered saline (PBS), cells were incubated in DMEM/F12 for 23 h to simulate reperfusion. The oil-immersion method, in which a continuous layer of mineral oil prevents oxygen and substrate exchange with the monolayer, is an established in vitro model of renal tubular ischaemia–reperfusion in which 60 min of simulated ischaemia followed by 24 h of reperfusion reproduces the time course of apoptosis observed in vivo [28], and has been used previously by our group with a 30 min immersion [29]. In preliminary experiments, 1 h of immersion produced a reproducible but sub-lethal degree of injury in HK-2 cells and was therefore used throughout the present study. Normoxic cells maintained in parallel in the same medium and vehicle served as the reference condition. Rg3 was dissolved in DMSO at 5 mg/mL (6.37 mM) as a stock solution and diluted in culture medium to the required concentrations; the treatment volume was adjusted to 10 µL for all experimental conditions. The final DMSO concentration was 0.31% (v/v) at the working concentration of 20 µM and did not exceed 0.63% at the highest concentration tested (40 µM). Control and H/R cells received the same volume of medium containing the same concentration of DMSO (0.31%, vehicle). Rg3 (20 µM) and, where indicated, bafilomycin A1 (100 nM) or compound C (10 µM) were added 1 h before mineral-oil immersion and remained present during the reoxygenation period. As in the in vivo model, in which clamping of the renal pedicle is assumed to abolish oxygen delivery without direct measurement of tissue oxygen tension, oxygen tension was not measured directly in the oil-immersion model; induction of H/R injury was instead confirmed in every experiment by the reduction in cell viability and the increase in apoptosis relative to normoxic controls. All in vitro experiments were performed in at least three independent experiments, each using a separate cell passage, and the independent experiment was the unit of analysis.
2.6. Cell Viability Assay
Cell viability was determined with the Ez-Cytox Cell Viability Assay Kit (DoGen, Seoul, Republic of Korea), based on the [4,5-dimethyl-2-thiazolyl]-2,5-diphenyl-2H-tetrazolium bromide (MTT) principle, according to the manufacturer’s instructions. After adding 10 µL of reagent per well, cells were incubated for 2 h and absorbance was measured at 450 nm using a microplate reader (Bio-Rad, Hercules, CA, USA).
2.7. Flow Cytometric Analysis of Apoptosis
HK-2 cells were seeded in six-well plates at 2 × 10⁵ cells/well and assigned to the following groups: control, Rg3 (20 µM), hypoxia/reoxygenation (H/R), Rg3 + H/R (pretreatment with Rg3 for 1 h before hypoxia), Rg3 + H/R + bafilomycin A1 (100 nM) and Rg3 + H/R + compound C (10 µM). After treatment, cells were washed with PBS, detached with trypsin-EDTA, resuspended in fresh medium and stained with annexin V and propidium iodide (PI) (BD Biosciences, San Jose, CA, USA). Apoptosis was analysed by flow cytometry (BD FACSCanto II, BD Biosciences, San Jose, CA, USA), and annexin V- and PI-positive populations were quantified after gating with forward and side scatter. Results were expressed as the apoptosis rate, defined as the percentage of annexin V-positive cells.
2.8. Assessment of GSH Levels, SOD and Catalase Activities
Cellular antioxidant status was evaluated by measuring glutathione (GSH) levels and the enzymatic activities of superoxide dismutase (SOD) and catalase (CAT) using colorimetric assay kits (OxiTec™ BO-GLU-200, BO-SOD-250 and BO-CAT-400, respectively; Biomax, Guri, Republic of Korea), according to the manufacturer’s instructions. Following the indicated treatments, HK-2 cells were harvested at a standardised density of 1 × 10⁶ cells/mL. For GSH, cells were deproteinised in ice-cold 5% metaphosphoric acid, sonicated and centrifuged (12,000 rpm, 10 min, 4 °C); for SOD, cells were lysed in PBS by repeated freeze–thaw cycles and centrifuged (10,000× g, 15 min, 4 °C); for CAT, cells were sonicated in 1× reaction buffer on ice and cleared of debris. Thiol-containing reagents (dithiothreitol, 2-mercaptoethanol) were excluded from all buffers because they interfere with the GSH and SOD assays. Total glutathione was determined by a DTNB-based enzymatic recycling assay with glutathione reductase and NADPH, monitoring the rate of absorbance change at 412 nm against a glutathione standard curve (0.25–8 µM). SOD activity was assessed by the inhibition of xanthine oxidase-mediated WST-formazan formation at 450 nm (37 °C, 30 min), with one unit defined as the amount of enzyme required to inhibit the reaction by 50%, determined from a dilution series of each sample. CAT activity was determined from the enzymatic decomposition of H2O2 (40 µM, 30 min), the remaining H2O2 being quantified by HRP-mediated oxidation of Oxi-Probe at 570 nm against a catalase standard curve (0–500 mU/mL); one unit decomposes 1 µmol H2O2 per min at pH 7.0 and 25 °C. All standards and samples were assayed in duplicate, a fresh standard curve (R2 > 0.99) and the kit blanks were included on every plate, and values were normalised to the total protein content of a parallel aliquot of the same cell suspension determined by the BCA assay. Results are expressed as nmol/mg protein for GSH and U/mg protein for SOD and CAT. All measurements were performed in three independent experiments, each using cells from a different passage, and the independent experiment was the unit of analysis.
2.9. TUNEL Assay
Sections were subjected to TUNEL staining using an in situ cell death detection kit, POD (Roche Diagnostics GmbH, Mannheim, Germany), according to the manufacturer’s recommendations. Briefly, 4 µm paraffin-embedded sections were dewaxed and incubated with 0.3% H2O2 at room temperature to eliminate endogenous peroxidase activity. Proteinase K (10 µg/mL in 0.1 M Tris, 50 mM EDTA, pH 8) was applied for 15 min at room temperature. TdT enzyme was then applied and sections were incubated in a humidified chamber for 1 h at 37 °C to allow extension of nicked DNA ends with digoxigenin-dUTP. Colour was developed using 0.05% DAB with 0.006% H2O2 as substrate; distilled water replaced TdT as a negative control. TUNEL-positive cells were evaluated in five randomly selected high-power fields (×400) per section; cells showing specific nuclear staining above background were counted as immunopositive and expressed as the mean number of positive cells per field.
2.10. Immunohistochemistry
Immunohistochemistry was performed on 4 µm sections that were deparaffinised, rehydrated and subjected to antigen retrieval as previously described [30]. Endogenous peroxidase activity was blocked with 0.3% (v/v) hydrogen peroxide, and sections were incubated overnight at 4 °C with an anti-F4/80 antibody (1:100; Serotec, Oxford, UK) as a marker of macrophage infiltration. After washing, the secondary antibody was applied for 30 min at room temperature, and slides were developed using the REAL EnVision Detection System, Peroxidase/DAB+, Rabbit/Mouse Kit (DAKO, Carpinteria, CA, USA). F4/80-positive cells were quantified as described for the TUNEL assay. All TUNEL and immunohistochemical evaluations were performed by two blinded observers, and discrepancies were resolved by consensus.
2.11. Immunoblotting
Kidneys from sham and IRI mice were dissected and homogenised in lysis buffer. Cells were washed with PBS, lysed in RIPA buffer (Elpis Biotech, Daejeon, Republic of Korea) containing protease inhibitors (Roche Diagnostics, Mannheim, Germany) and centrifuged at 13,000 rpm for 15 min. Protein concentrations were determined using a BCA Protein Assay Kit (Pierce, Rockford, IL, USA). Kidney lysates (15 µg) or cell lysates were separated by 10% or 15% sodium dodecyl sulfate–polyacrylamide gel electrophoresis and transferred to nitrocellulose membranes. Blots were probed with the following primary antibodies (1:1000): p-AMPKα (Thr172) (#2535), AMPKα (#2532), α-tubulin (#2144) and GAPDH (#2118) (Cell Signaling Technology, Beverly, MA, USA); for kidney lysates, LC3B (#2775; Cell Signaling Technology) and p62/SQSTM1 (P0067; Sigma-Aldrich, St. Louis, MO, USA); and for HK-2 cell lysates, LC3 (PD014; MBL, Tokyo, Japan) and SQSTM1/p62 (ab56416; Abcam, Cambridge, UK). Blots were then incubated with anti-rabbit or anti-mouse IgG–HRP-linked secondary antibody (1:1000; Cell Signaling Technology) for 2 h. Protein bands were visualised using a chemiluminescence detection kit (Thermo Scientific, South Logan, UT, USA) and imaged with an Azure 300 imaging system (Azure Biosystems, Dublin, CA, USA) for kidney lysates or a ChemiDoc XRS+ system (Bio-Rad Laboratories, Hercules, CA, USA) for HK-2 cell lysates. Molecular weights were estimated using the Color Prestained Protein Standard, Broad Range (10–250 kDa; #P7719S, New England Biolabs, Ipswich, MA, USA) for kidney lysates and the PAGE-Mark 3-Color Regular Range Protein Marker (10–245 kDa; BPM1100, Biomax, Seoul, Republic of Korea) for HK-2 cell lysates, and optical density was quantified using Gel-Pro Analyzer version 3.1 (Media Cybernetics, Silver Spring, MD, USA).
2.12. RNA Extraction and Quantitative Real-Time PCR
RNA was extracted from the kidneys using an RNeasy Mini Kit (Qiagen, Hilden, Germany) according to the manufacturer’s instructions. cDNA was synthesized from 2 µg total RNA using an oligo dT primer (Amersham Pharmacia, Piscataway, NJ, USA), deoxynucleotide triphosphates (Amersham Pharmacia), Moloney murine leukemia virus reverse transcriptase (Gibco-BRL, Grand Island, NY, USA), 0.1 M dithiothreitol, and buffers in a volume of 20 µL. The cDNA reaction mix was diluted to a total volume of 40 µL and PCR was performed to amplify specific cDNAs from mouse kidney tissue, including SOD1 (forward 5′-ACTGGTGGTCCATGAAAAAGC-3′ and reverse, 5′-AACGACTTCCAGCGTTTCCT-3′), catalase (forward, 5′-CGACCAGGGCATCAAAAACT-3′ and reverse, 5′-ATTGGCGATGGCATTGAAA-3′), Gpx (forward, 5′-TCCGGGACTACACCGAGATG-3′ and reverse, 5′-TTCTCCTGGTGTCCGAACTGA-3′), MCP-1 (forward, 5′-ACTGCATCTGCCCTAAGGTCTTCA-3′ and reverse, 5′-AGAAGTGCTTGAGGT GGTTGTGGA-3′), osteopontin (forward, 5′-GGCATTGCCTCCTCCCTC-3′ and reverse, 5′-CGAGGC TGTAAAGCTTCTCC-3′), β-actin (forward, 5′-TGTTACCAACTGGGACGACA-3′ and reverse, 5′-GGG GTGTTGAAGGTCTCAAA-3′). For HK-2 cell samples, GAPDH was used as an internal control for normalization of relative mRNA expression levels. The primer sequences were as follows (5′–3′): GAPDH (sense: AAGGTCGGAGTCAACGGATTT, anti-sense: ACCAGAGTTAAAAGCAGCCCTG, osteopontin (sense: AGACCTGACATCCAGTACCCTG, anti-sense: GTGGGTTTCAGCACTCTGGT), MCP-1 (sense: GATCTCAGTGCAGAGGCTCG, anti-sense: TGCTTGTCCAGGTGGTCCAT). PCR was performed using SYBR Green PCR Master Mix (Qiagen, Hilden, Germany). Amplification was performed in 20 µL reaction volumes consisting of 10 µL iQ SYBR Green PCR mastermix, 2 µL primers, 2 µL cDNA, and 6 µL water. Amplification and detection were performed on a Rotor-Gene 6000 thermal cycler (Corbett Research, Mortlake, Australia). SYBR green fluorescence was measured at the end of each cycle using the comparative threshold cycle (Ct) method: 2−ΔΔCt = 2−[(Ct of target gene − Ct of β-actin in treated mice) − (Ct of target gene − Ct of β-actin in sham mice)].
2.13. Statistical Analysis
All data were analysed using GraphPad Prism version 10.2 for macOS (GraphPad Software, Boston, MA, USA) and are presented as mean ± standard deviation (SD). Comparisons among multiple groups were made using one-way analysis of variance with Tukey’s multiple-comparisons post hoc test. p < 0.05 was considered statistically significant difference. Normality was assessed using the Shapiro–Wilk test and homogeneity of variance using the Brown–Forsythe test. Right-skewed, heteroscedastic variables (BUN, serum creatinine, mRNA fold-changes and TUNEL- and F4/80-positive cell counts) were log10-transformed before parametric analysis. For the time-course data (6, 24 and 72 h), treatment and time effects and their interaction were analysed by two-way analysis of variance followed by Tukey’s multiple-comparisons test (Table S2); single-time-point comparisons among more than two groups were analysed by one-way analysis of variance followed by Tukey’s test, and ordinal histological injury scores by the Kruskal–Wallis test followed by Dunn’s test with Holm correction (Table S3). Exact p values are reported in the Results and Supplementary Tables; no adjustment was made for the multiplicity of endpoints across different outcomes, which is acknowledged as a limitation. Sample size was determined using G*Power 3.1 (University of Düsseldorf, Düsseldorf, Germany); assuming an effect size (d) of 1.5, α = 0.05 and power (1 − β) of 0.80 for the primary outcomes (BUN and serum creatinine), a minimum of six animals per group was required. Accordingly, n = 12 animals per group were included in the IRI, Rg3 + IRI and inhibitor-treated IRI groups for renal function and histological analyses, to account for the greater biological variability expected after IRI, whereas n = 5 animals per group were included in the sham and Rg3 + sham groups, in which variability was low (one additional animal per group was used solely for Western blotting, giving n = 6 for this analysis; Section 2.1). Molecular and in situ analyses (quantitative RT-PCR, TUNEL, immunohistochemistry and Western blotting) were performed on randomly selected subsets of n = 5–6 animals per group, which met or exceeded the minimum sample size estimated above; the exact n for each analysis is given in the corresponding figure legend and in Table S1. For histological injury scores and TUNEL- and F4/80-positive cell counts, values from multiple microscopic fields were averaged per animal before analysis, and the individual animal was the unit of analysis. No animals were excluded from any analysis.
3. Results
3.1. Effects of Ginsenoside Rg3 on Renal Function and Histology
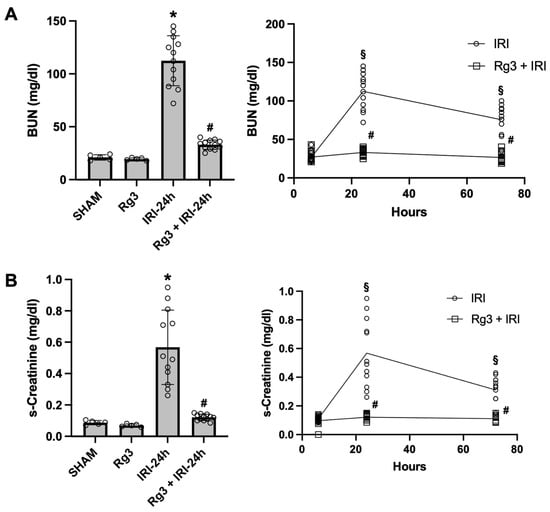
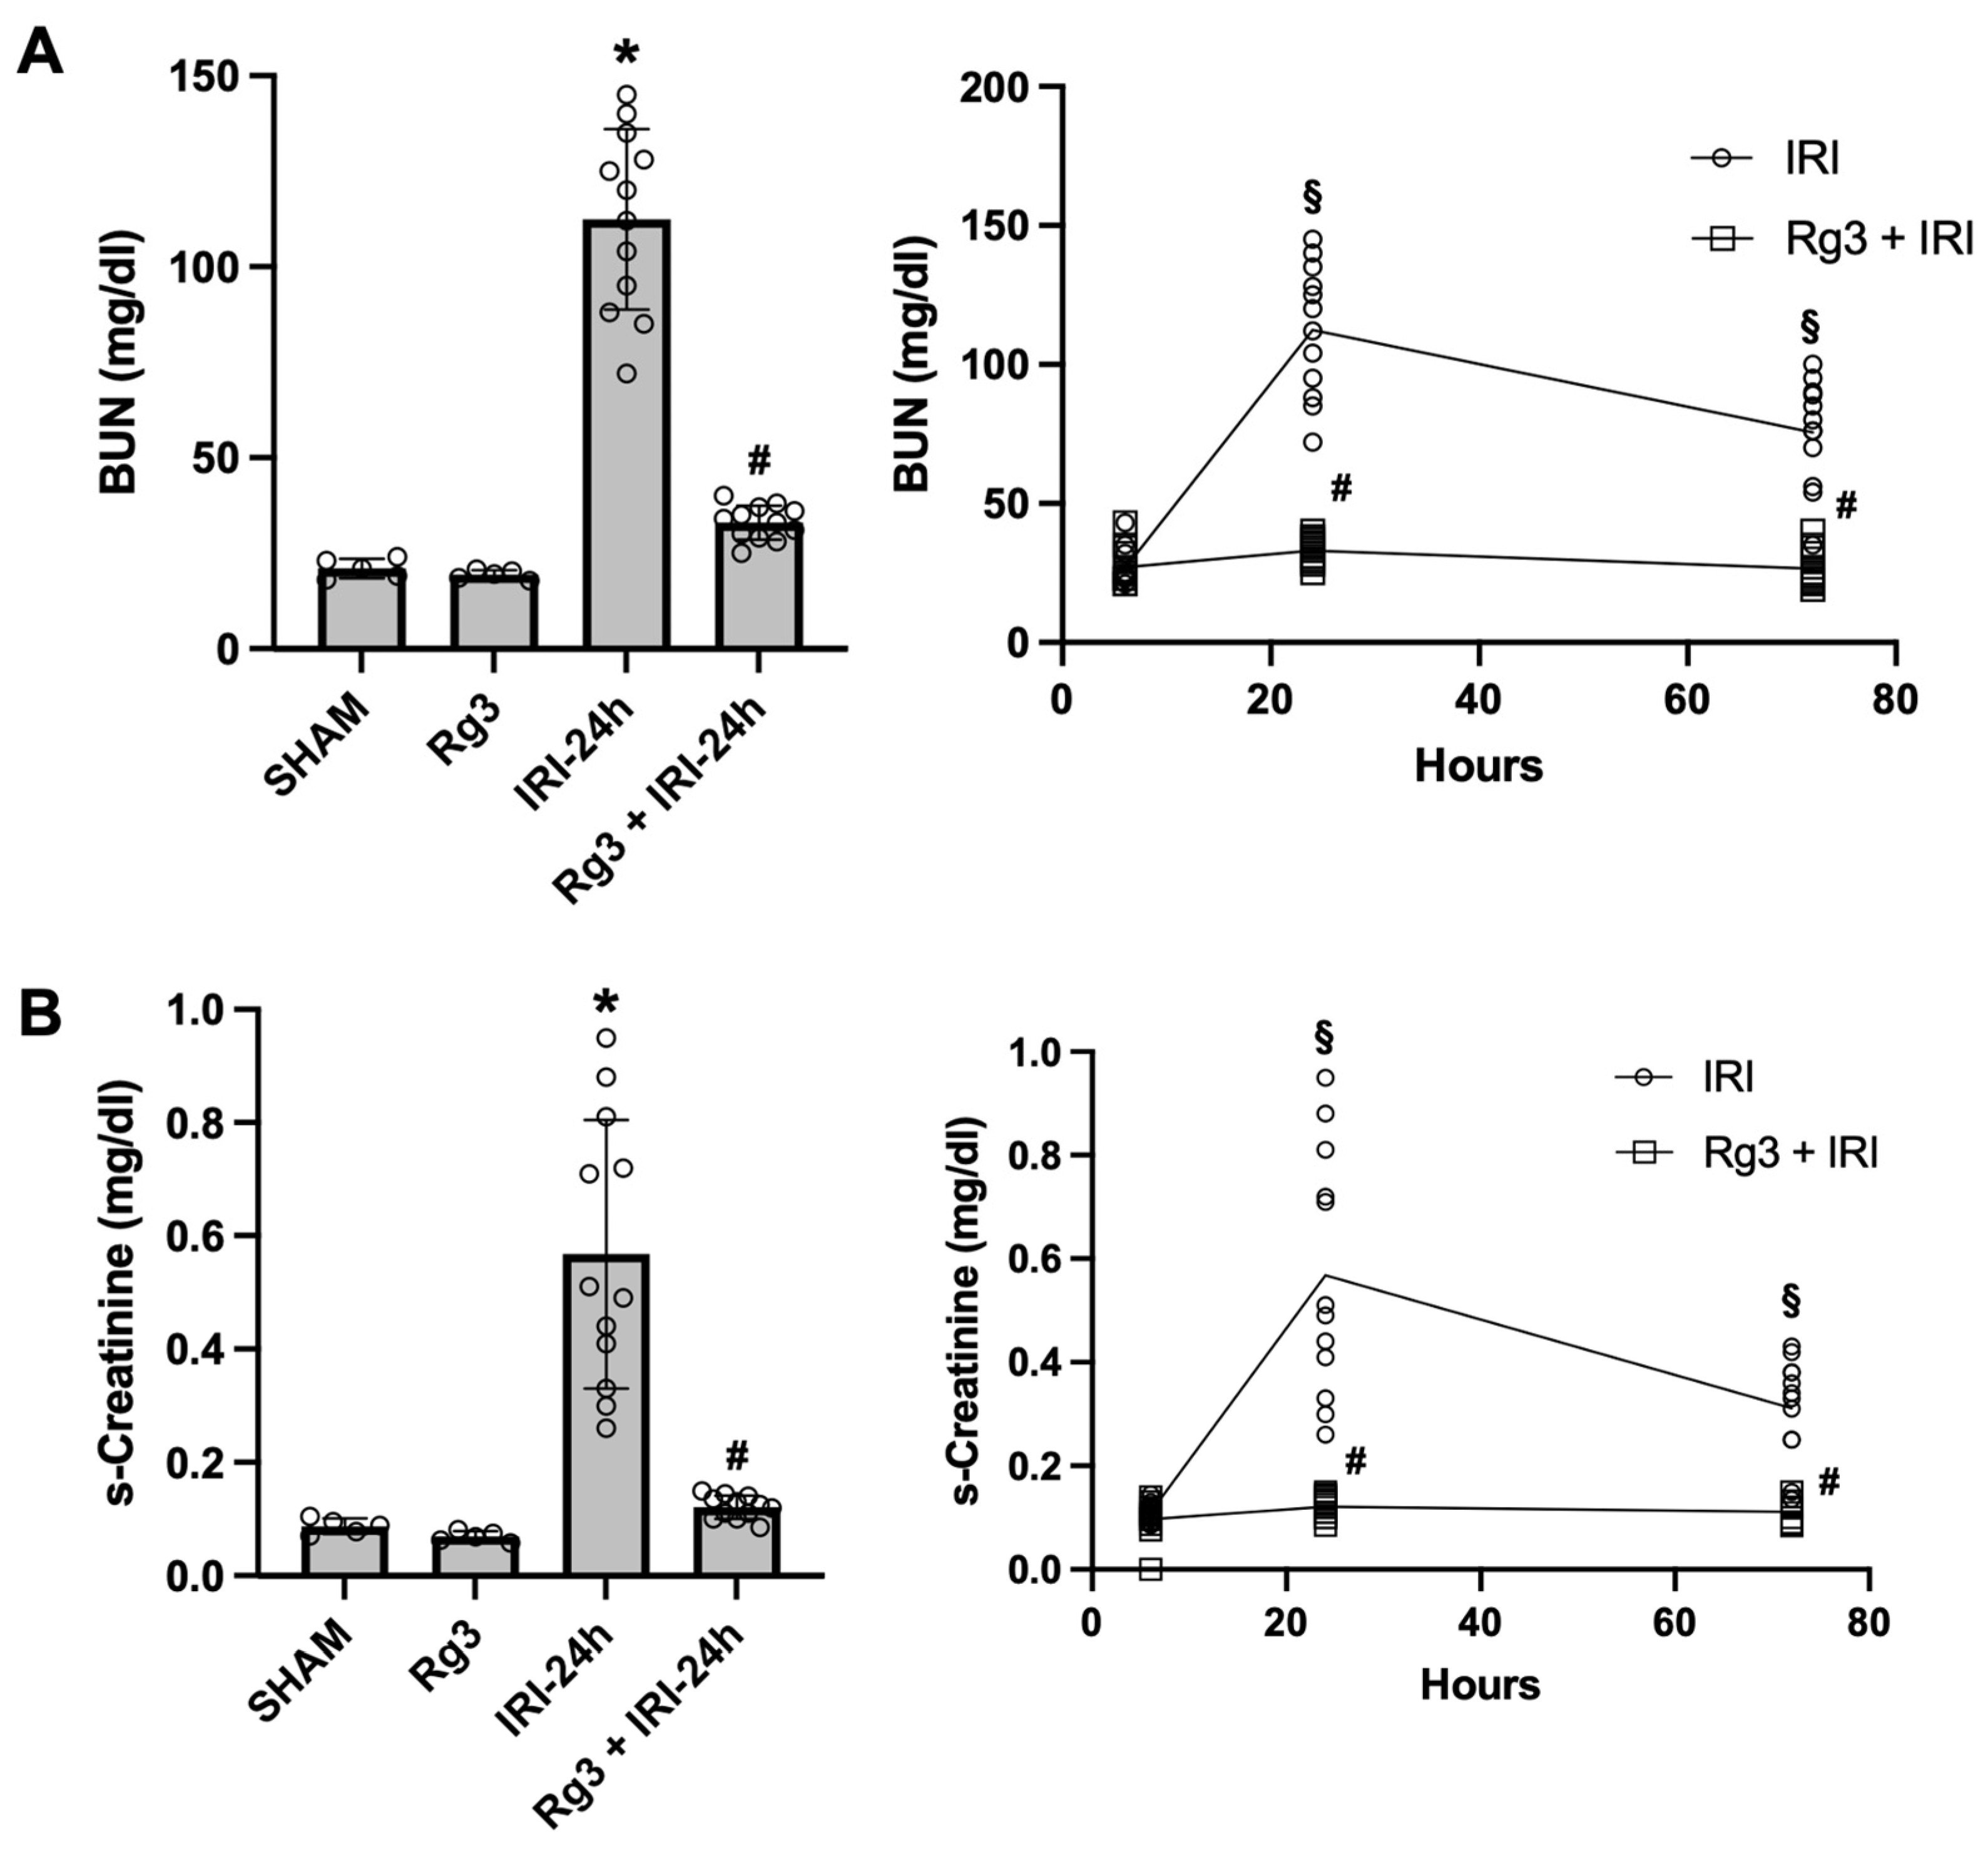
BUN and serum creatinine (s-Cr) levels were significantly increased 24 h after IRI, and Rg3 treatment reduced both parameters in IRI mice. BUN peaked at 24 h and decreased by 72 h; in the Rg3 + IRI group, BUN was significantly reduced at both 24 and 72 h compared with untreated IRI (Figure 1A). Similarly, s-Cr peaked at 24 h post-IRI and decreased by 72 h, and the Rg3 + IRI group showed a significant reduction in s-Cr at 24 h compared with untreated IRI (Figure 1B). Two-way ANOVA confirmed significant effects of treatment, time and their interaction for both BUN (interaction F(2,66) = 48.6, p < 0.0001) and s-Cr (F(2,65) = 40.2, p < 0.0001); Rg3 had no effect at 6 h but reduced BUN at 24 h (mean difference −79.4 mg/dL, 95% CI −95.5 to −63.3; p < 0.0001) and 72 h (−48.9 mg/dL, 95% CI −65.0 to −32.8; p < 0.0001) and s-Cr at 24 h (−0.45 mg/dL, 95% CI −0.58 to −0.32; p < 0.0001) and 72 h (−0.20 mg/dL, 95% CI −0.33 to −0.07; p = 0.0003) (Table S2). Within the untreated IRI group, BUN and s-Cr differed between all time points (p ≤ 0.006), whereas within the Rg3 + IRI group BUN at 24 h was only marginally higher than at 72 h (33.0 ± 4.5 vs. 26.6 ± 6.6 mg/dL; p = 0.042) and not different from 6 h (p = 0.061), and s-Cr did not differ between time points (p ≥ 0.19).
Figure 1.
Effects of ginsenoside Rg3 on renal function. (A) Blood urea nitrogen (BUN) and (B) serum creatinine (s-Cr). Bar graphs show BUN and s-Cr at 24 h after ischaemia–reperfusion injury (IRI); line graphs depict time-course changes at 6, 24 and 72 h after IRI. The IRI group exhibited peak BUN and s-Cr at 24 h, which were significantly reduced in the Rg3 + IRI group compared with IRI alone. * p < 0.05 vs. SHAM; # p < 0.05 vs. IRI. Bars represent mean ± SD. SHAM, sham (n = 5); Rg3, Rg3-treated sham (n = 5); IRI-6 h (n = 12); Rg3 + IRI-6 h (n = 12); IRI-24 h (n = 12); Rg3 + IRI-24 h (n = 12); IRI-72 h (n = 12); Rg3 + IRI-72 h (n = 12). Bar graphs were analysed by one-way ANOVA with Tukey’s multiple-comparisons test and time courses by two-way ANOVA (treatment × time) with Tukey’s test (Table S2). In the line graphs, # p < 0.05 vs. IRI at the same time point; § p < 0.05 vs. the 24 h value within the same group.
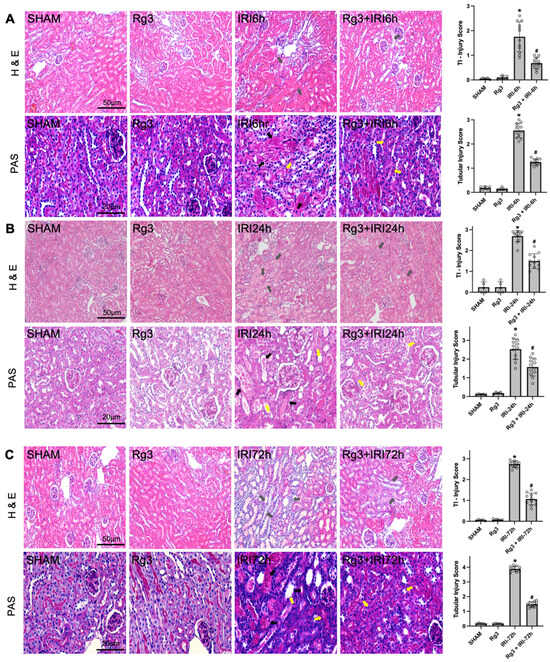
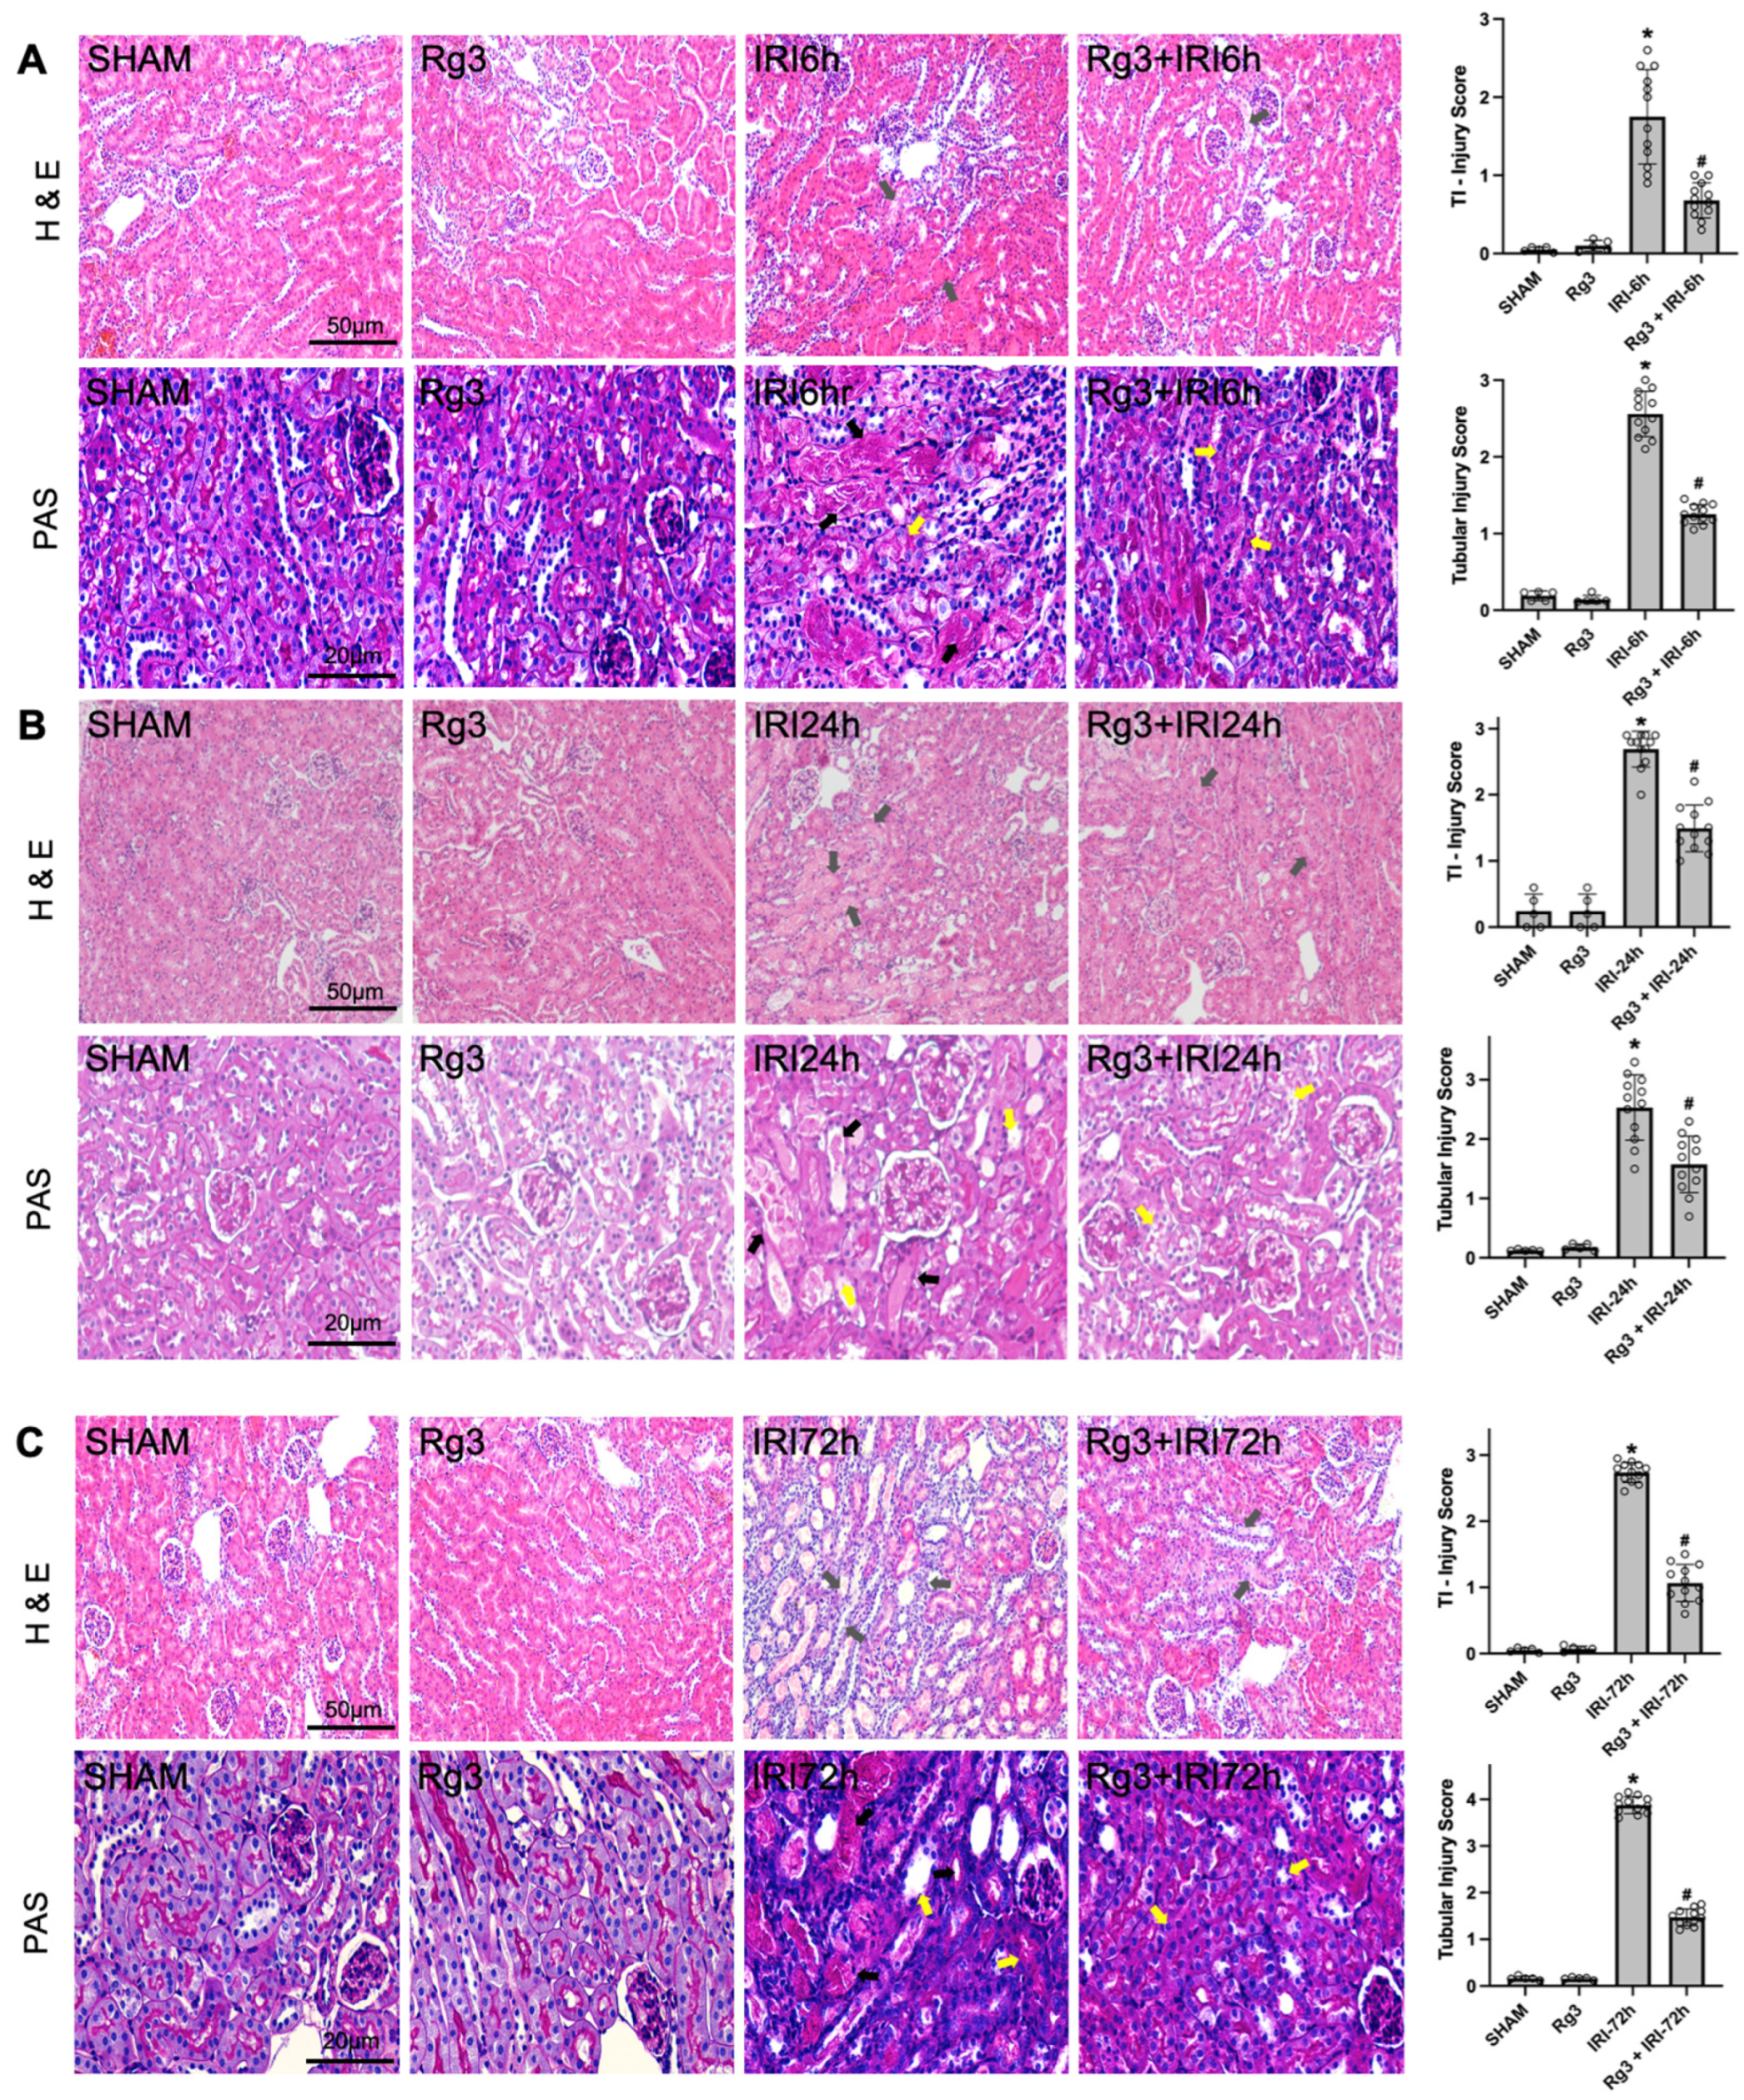
Histological evaluation revealed a time-dependent progression of injury after IRI that was significantly attenuated by Rg3. At 6 h post-IRI, PAS staining showed early signs of tubular injury, including initiation of tubular necrosis and vacuolisation; these structural changes were notably reduced in the Rg3-treated group (Figure 2A). By 24 h, H&E and PAS staining demonstrated severe tubulointerstitial injury characterised by tubular epithelial cell injury, loss of the brush border, epithelial desquamation and marked inflammatory infiltration. Rg3 treatment significantly preserved renal architecture and decreased the severity of these lesions compared with untreated IRI (Figure 2B). Because injury scores are ordinal, group differences were confirmed by Kruskal–Wallis tests (p < 0.0001 at every time point for both H&E and PAS scores), with Dunn’s post hoc test showing lower scores in Rg3 + IRI than in IRI at 6, 24 and 72 h (adjusted p = 0.006–0.018; Table S3); two-way ANOVA also indicated a significant treatment × time interaction (H&E, p = 0.009; PAS, p < 0.0001; Table S2). At 72 h, the untreated IRI group showed further progressive deterioration, marked by extensive tubular necrosis, persistent vacuolisation and widespread cast formation; unlike BUN and s-Cr, which peaked at 24 h, the histological injury scores were highest at 72 h (H&E 2.7 ± 0.2; PAS 3.9 ± 0.2), indicating that structural damage continued to evolve after functional indices had begun to recover. At 72 h, the Rg3 + IRI group showed a marked reduction in these advanced histological changes, indicating that Rg3 provides sustained morphological protection throughout the early and late phases of renal injury (Figure 2C).
Figure 2.
Effects of ginsenoside Rg3 on renal histology. Representative H&E (original magnification, ×200) and PAS-stained kidney sections (original magnification, ×400) at (A) 6 h, (B) 24 h and (C) 72 h after IRI. Tubular necrosis and tubular vacuolisation develop as early as 6 h after IRI and progressively worsen, with extensive tubular necrosis, vacuolisation, inflammation and cast formation by 72 h. Rg3 treatment markedly attenuates these histological changes. Grey arrows, cell debris, tubular necrosis and inflammatory cells; black arrows, cast formation or necrotic tubules; yellow arrows, dilated tubules or loss of the brush border. * p < 0.01 vs. SHAM; # p < 0.01 vs. IRI. Bars represent mean ± SD. SHAM, sham (n = 5); Rg3, Rg3-treated sham (n = 5); IRI, renal IRI (n = 12); Rg3 + IRI, Rg3-treated IRI (n = 12). Injury scores were compared by one-way ANOVA with Tukey’s test; the corresponding non-parametric analysis (Kruskal–Wallis with Dunn’s test) is given in Table S3 and the two-way ANOVA in Table S2.
3.2. Effects of Ginsenoside Rg3 on Oxidative Stress, Apoptosis and Inflammation
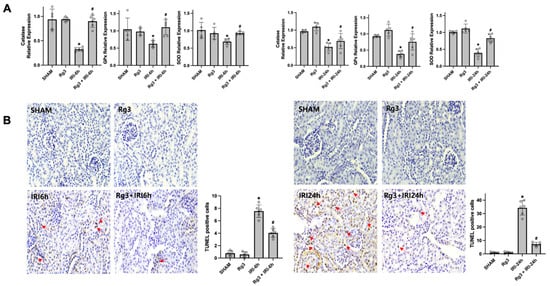
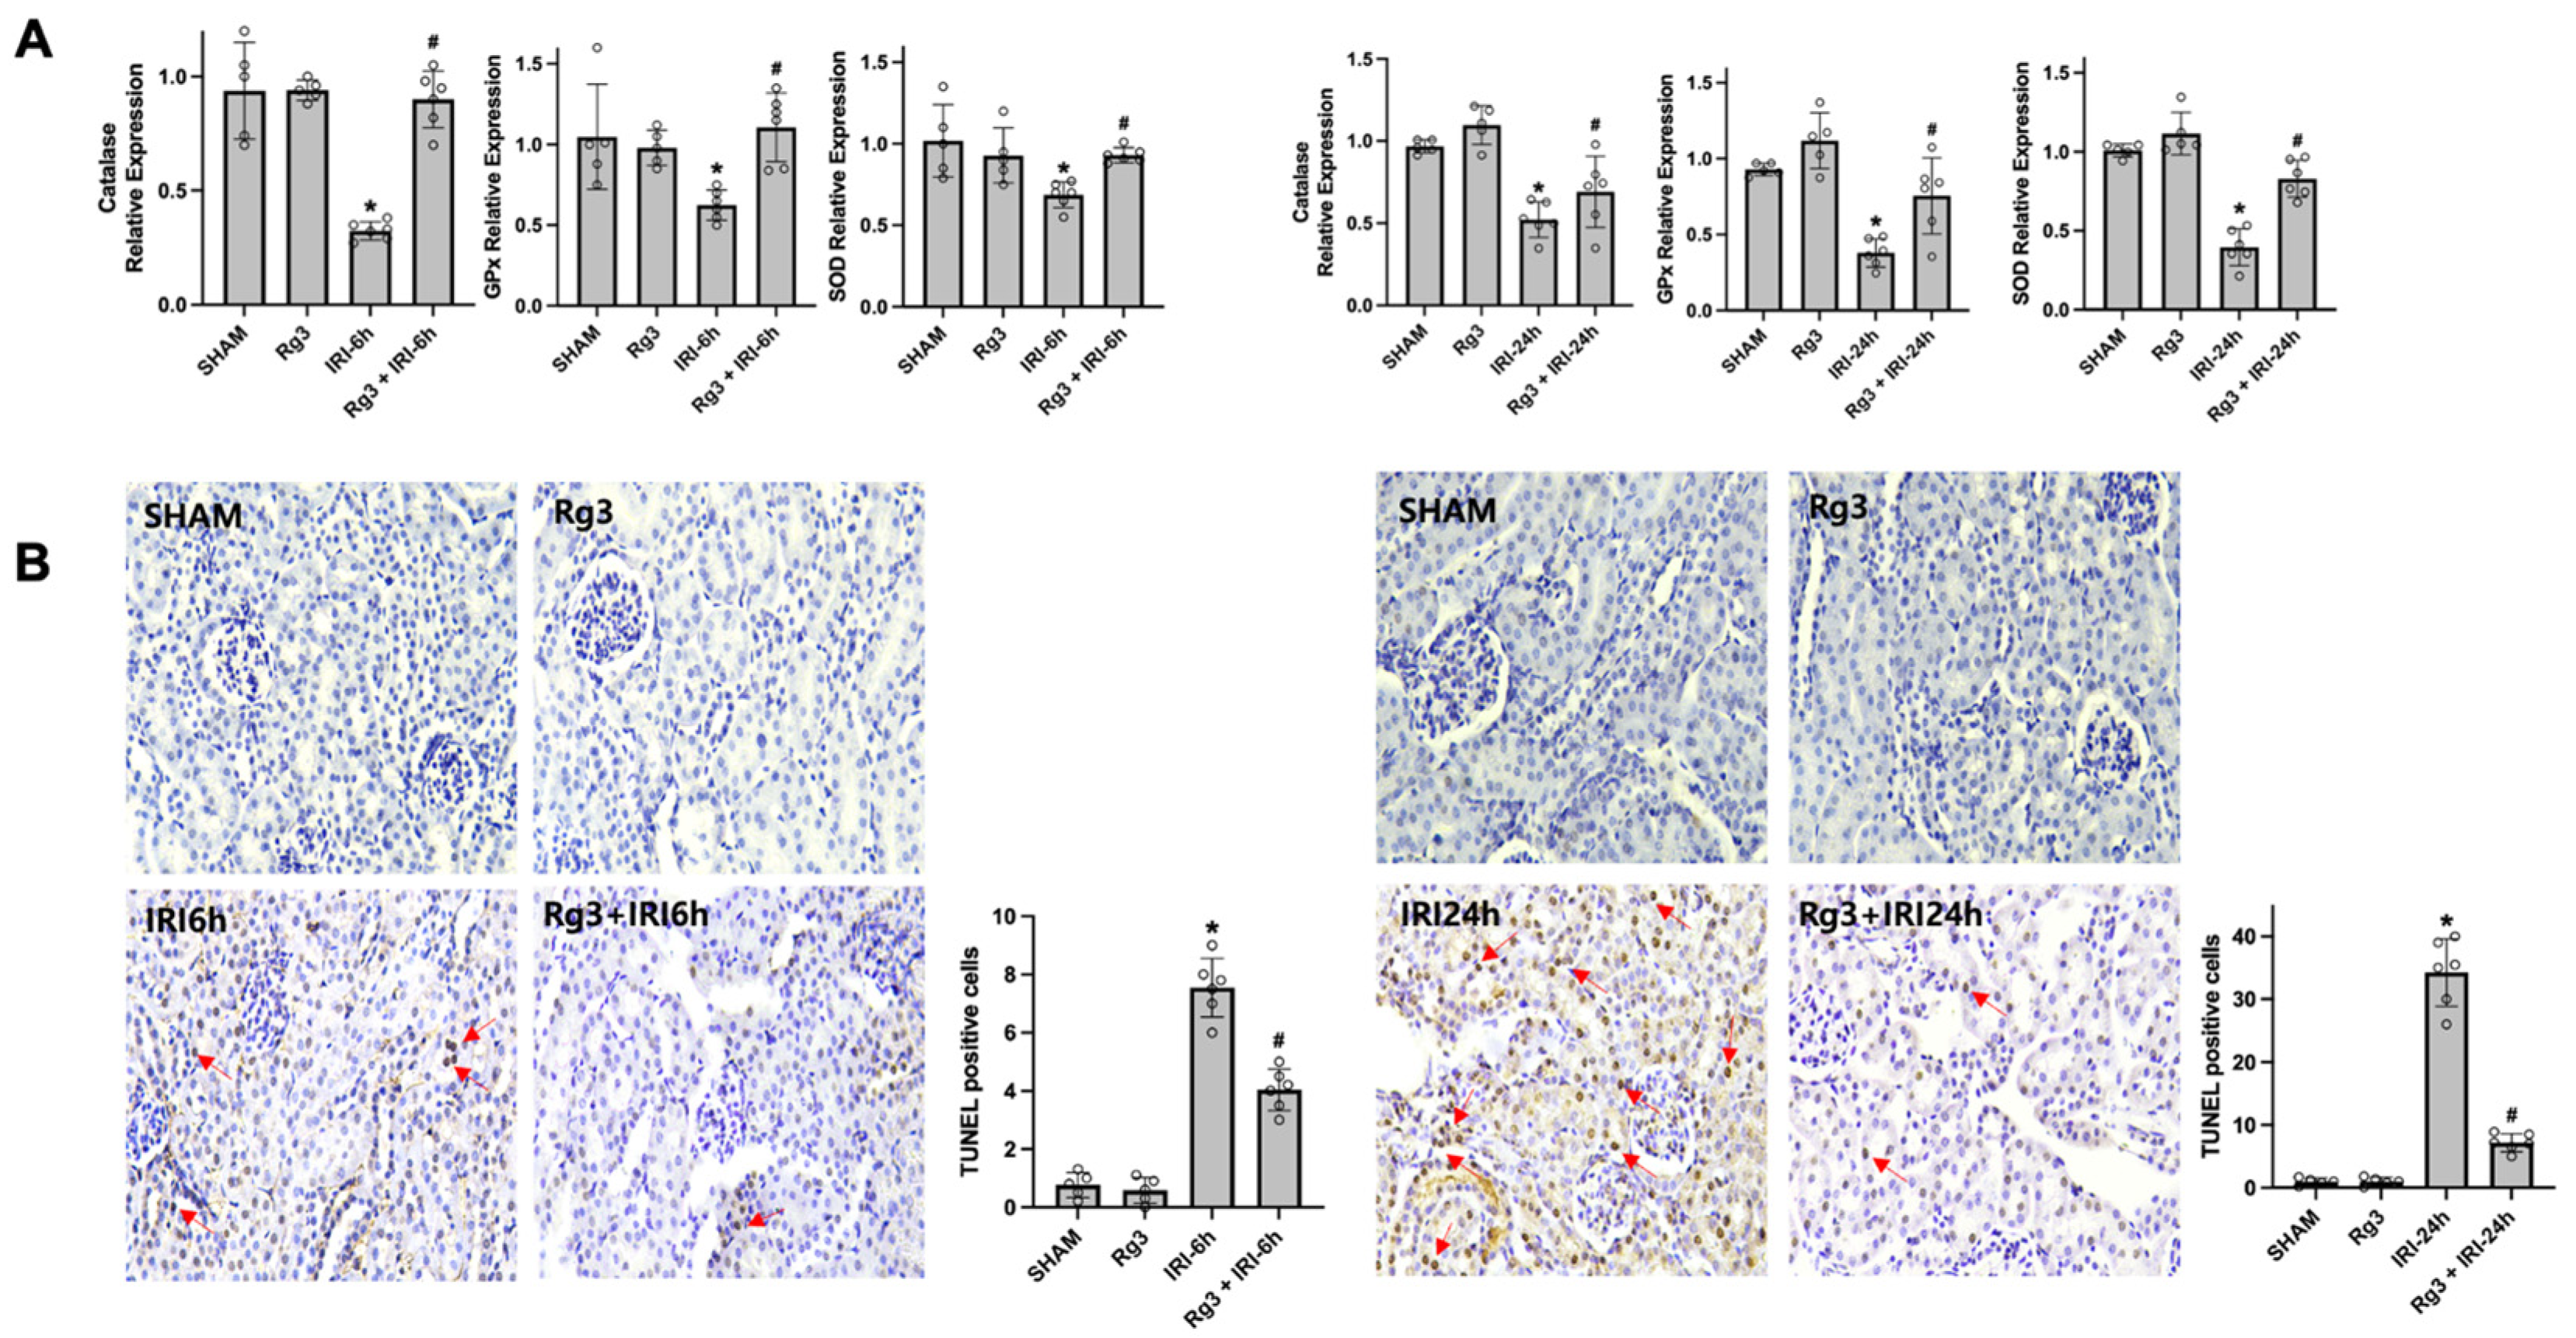
To evaluate oxidative stress, renal mRNA expression of catalase, Gpx and SOD1 was examined at 6 and 24 h after IRI. At both time points, IRI kidneys showed significantly decreased expression of catalase, Gpx and SOD1 compared with sham. Rg3 treatment significantly increased Gpx expression at 6 and 24 h and SOD1 expression at 24 h in IRI kidneys, whereas the increase in catalase expression was significant at 6 h (p < 0.0001) but not at 24 h (two-way ANOVA p = 0.27; one-way ANOVA at 24 h p = 0.19), and the increase in SOD1 at 6 h was of borderline significance in the two-way model (p = 0.051) although it reached significance when the 6 h time point was analysed separately (p = 0.035) (Figure 3A; Table S2). To assess apoptosis, renal TUNEL-positive cells were quantified at 6 and 24 h after IRI. The number of TUNEL-positive cells was increased in IRI compared with sham, and Rg3 + IRI showed a significant reduction at both time points relative to untreated IRI (Figure 3B).
Figure 3.
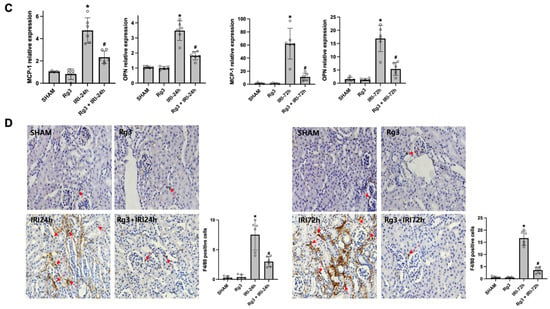
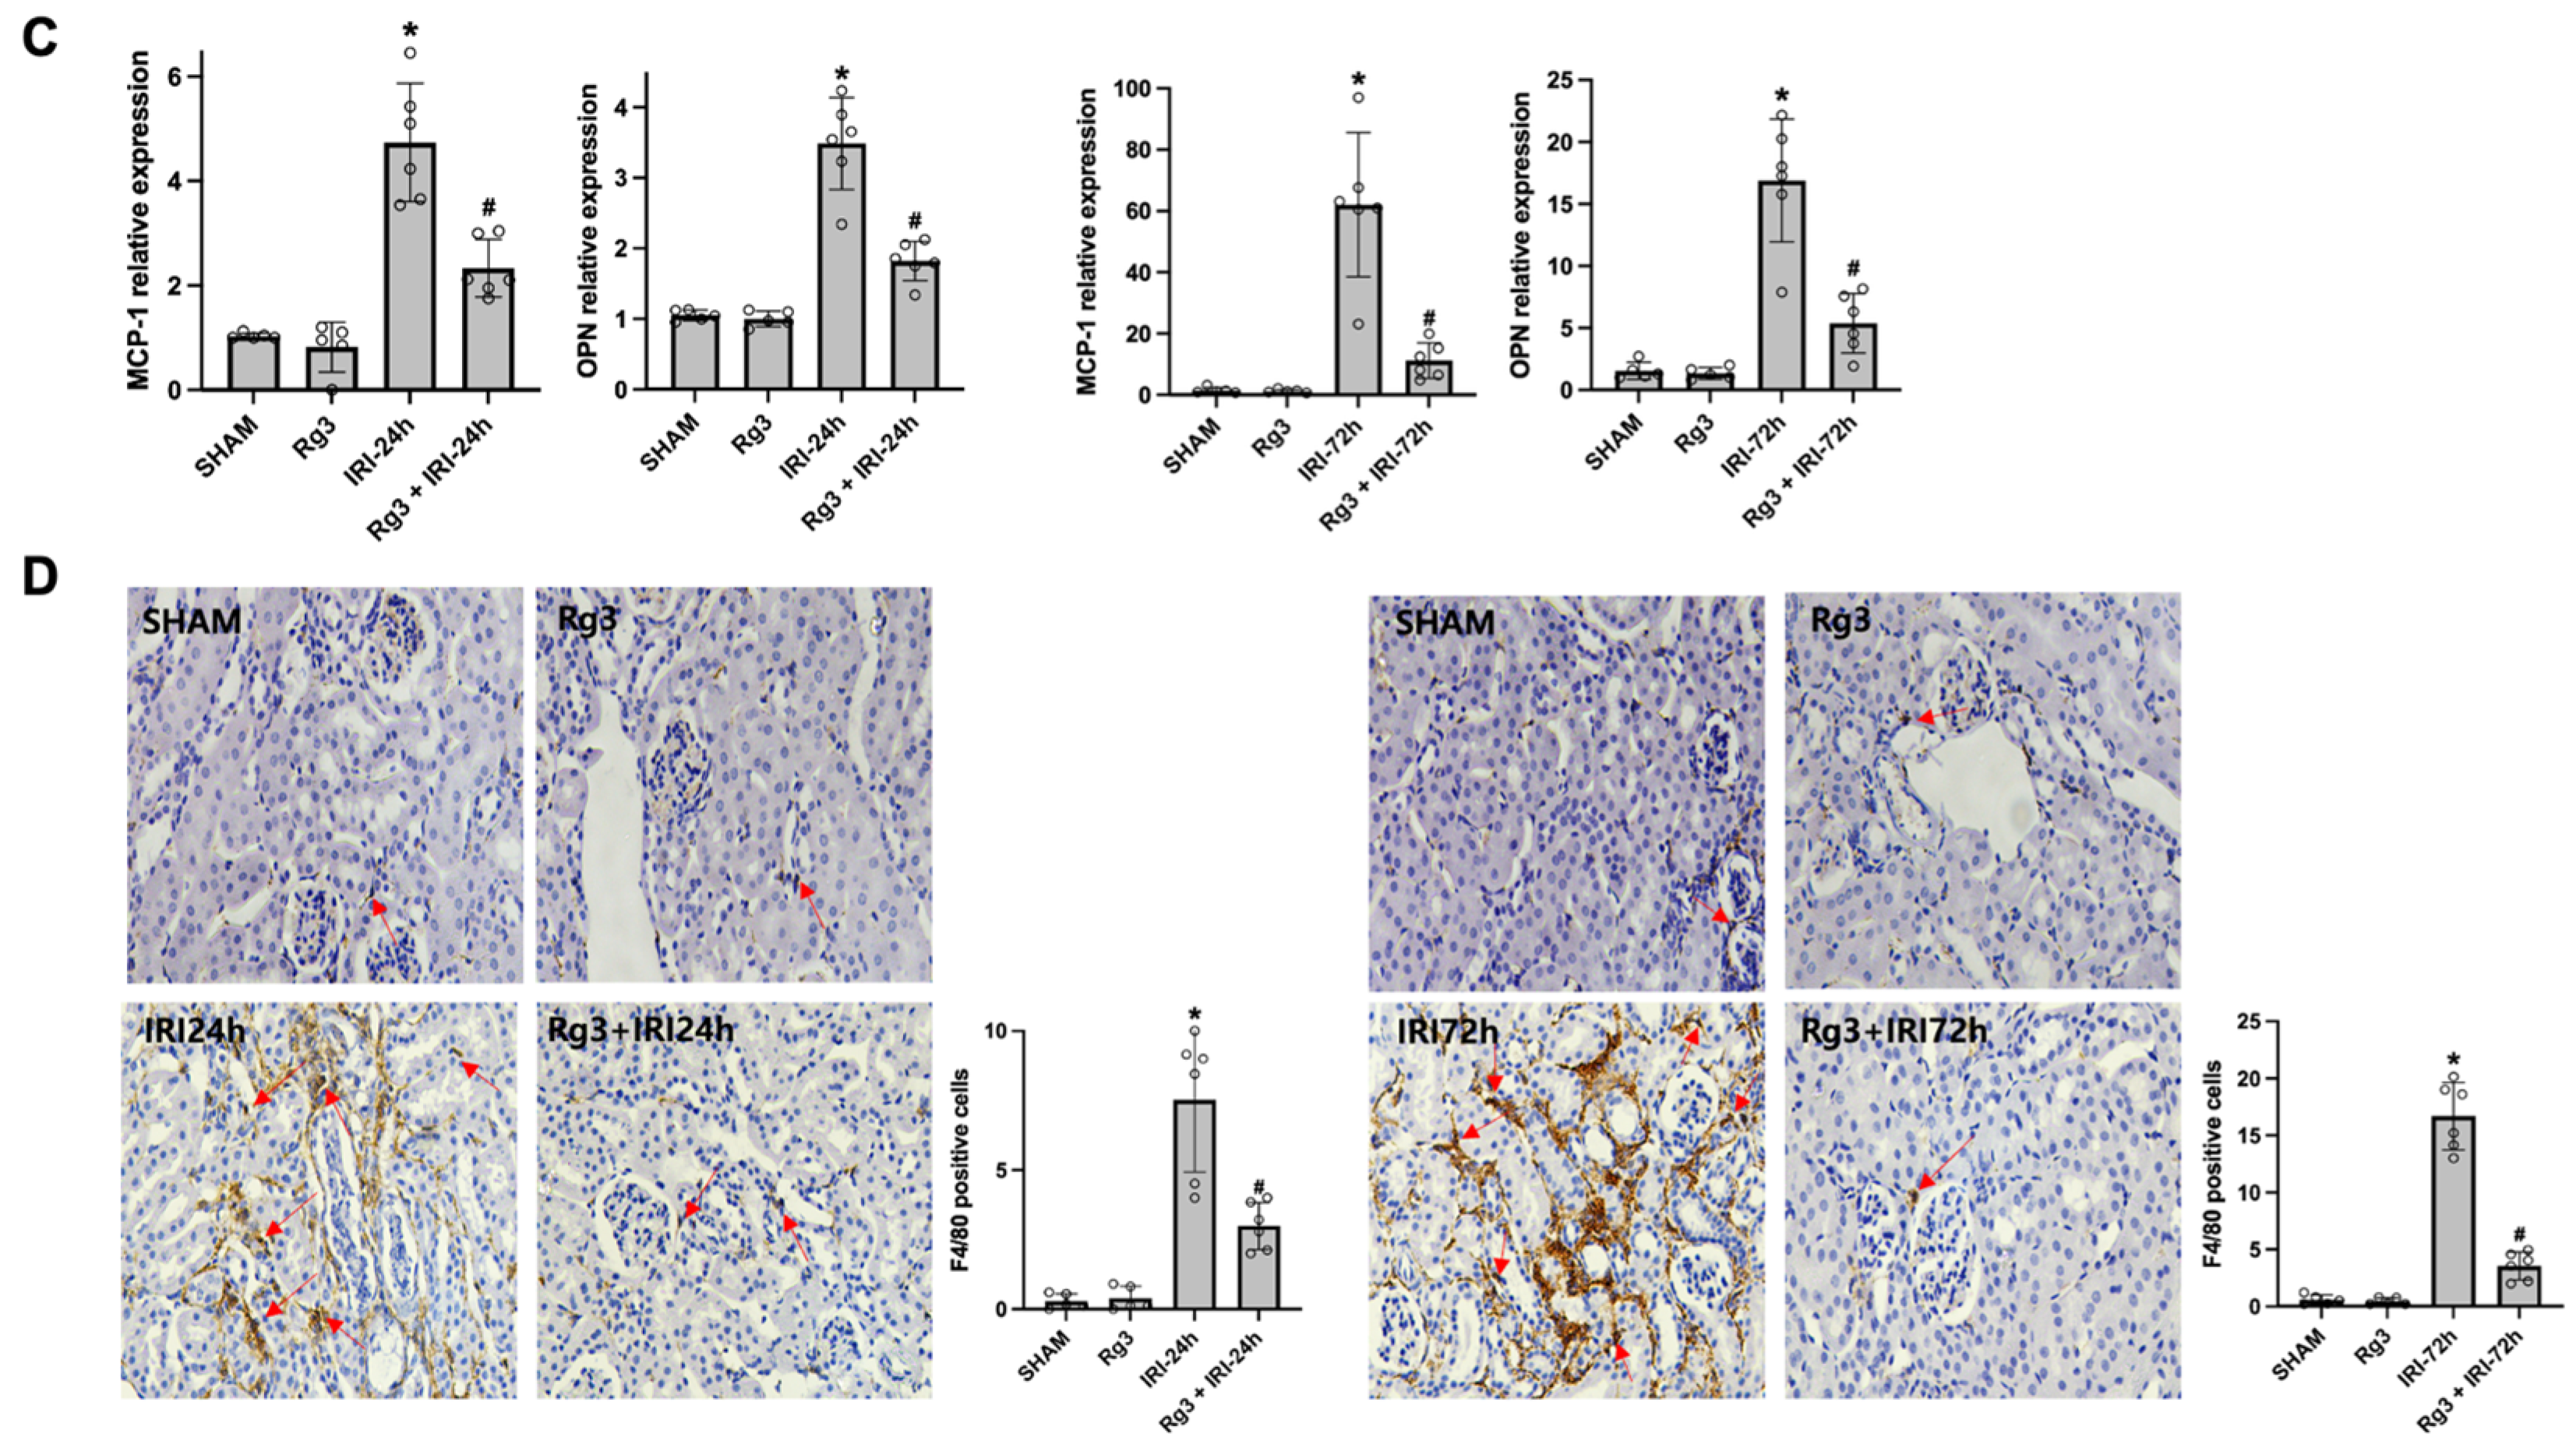
Effects of ginsenoside Rg3 on oxidative stress, apoptosis and inflammation in the kidney. (A) Quantitative real-time RT-PCR of catalase, Gpx and SOD1 in kidney tissue at 6 and 24 h after IRI; Rg3 significantly increased antioxidant enzyme expression in IRI kidneys. (B) Representative TUNEL staining of kidney sections at 6 and 24 h after IRI; Rg3 reduced TUNEL-positive cell death at both time points. Red arrows, TUNEL-positive cells. Original magnification, ×400. (C) Quantitative real-time RT-PCR of MCP-1 and osteopontin in kidney tissue at 24 and 72 h after IRI; Rg3 significantly decreased inflammatory marker expression. (D) Representative immunohistochemical staining for the macrophage marker F4/80 in kidney sections at 24 and 72 h after IRI; Rg3 markedly reduced F4/80-positive cells. Red arrows, F4/80-positive cells. Original magnification, ×400. * p < 0.05 vs. SHAM; # p < 0.05 vs. IRI. Bars represent mean ± SD. SHAM, sham (n = 5); Rg3, Rg3-treated sham (n = 5); IRI, renal IRI (n = 6); Rg3 + IRI, Rg3-treated IRI (n = 6). Groups were compared at each time point by one-way ANOVA with Tukey’s test; two-way ANOVA (treatment × time) results are given in Table S2.
To evaluate inflammation, MCP-1 and osteopontin mRNA expression and renal F4/80-positive cells were examined at 24 and 72 h after IRI. IRI kidneys showed significantly increased MCP-1 and osteopontin expression compared with sham, with even higher expression at 72 h (Figure 3C), and the number of F4/80-positive cells was likewise higher in IRI than in sham, especially at 72 h (Figure 3D). Rg3 treatment significantly reduced MCP-1 and osteopontin expression in IRI kidneys at both 24 and 72 h, and significantly reduced the number of F4/80-positive cells at both time points compared with untreated IRI (Figure 3C,D).
3.3. Effects of Ginsenoside Rg3 on Autophagy Activation
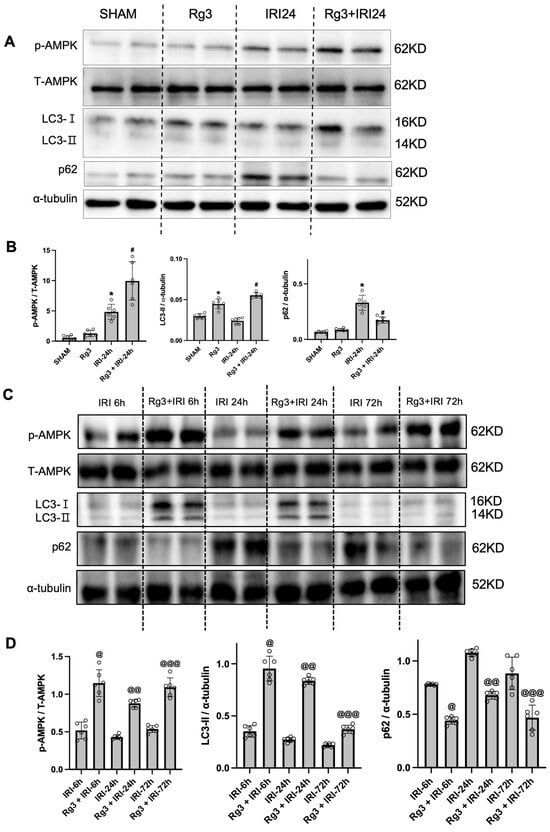
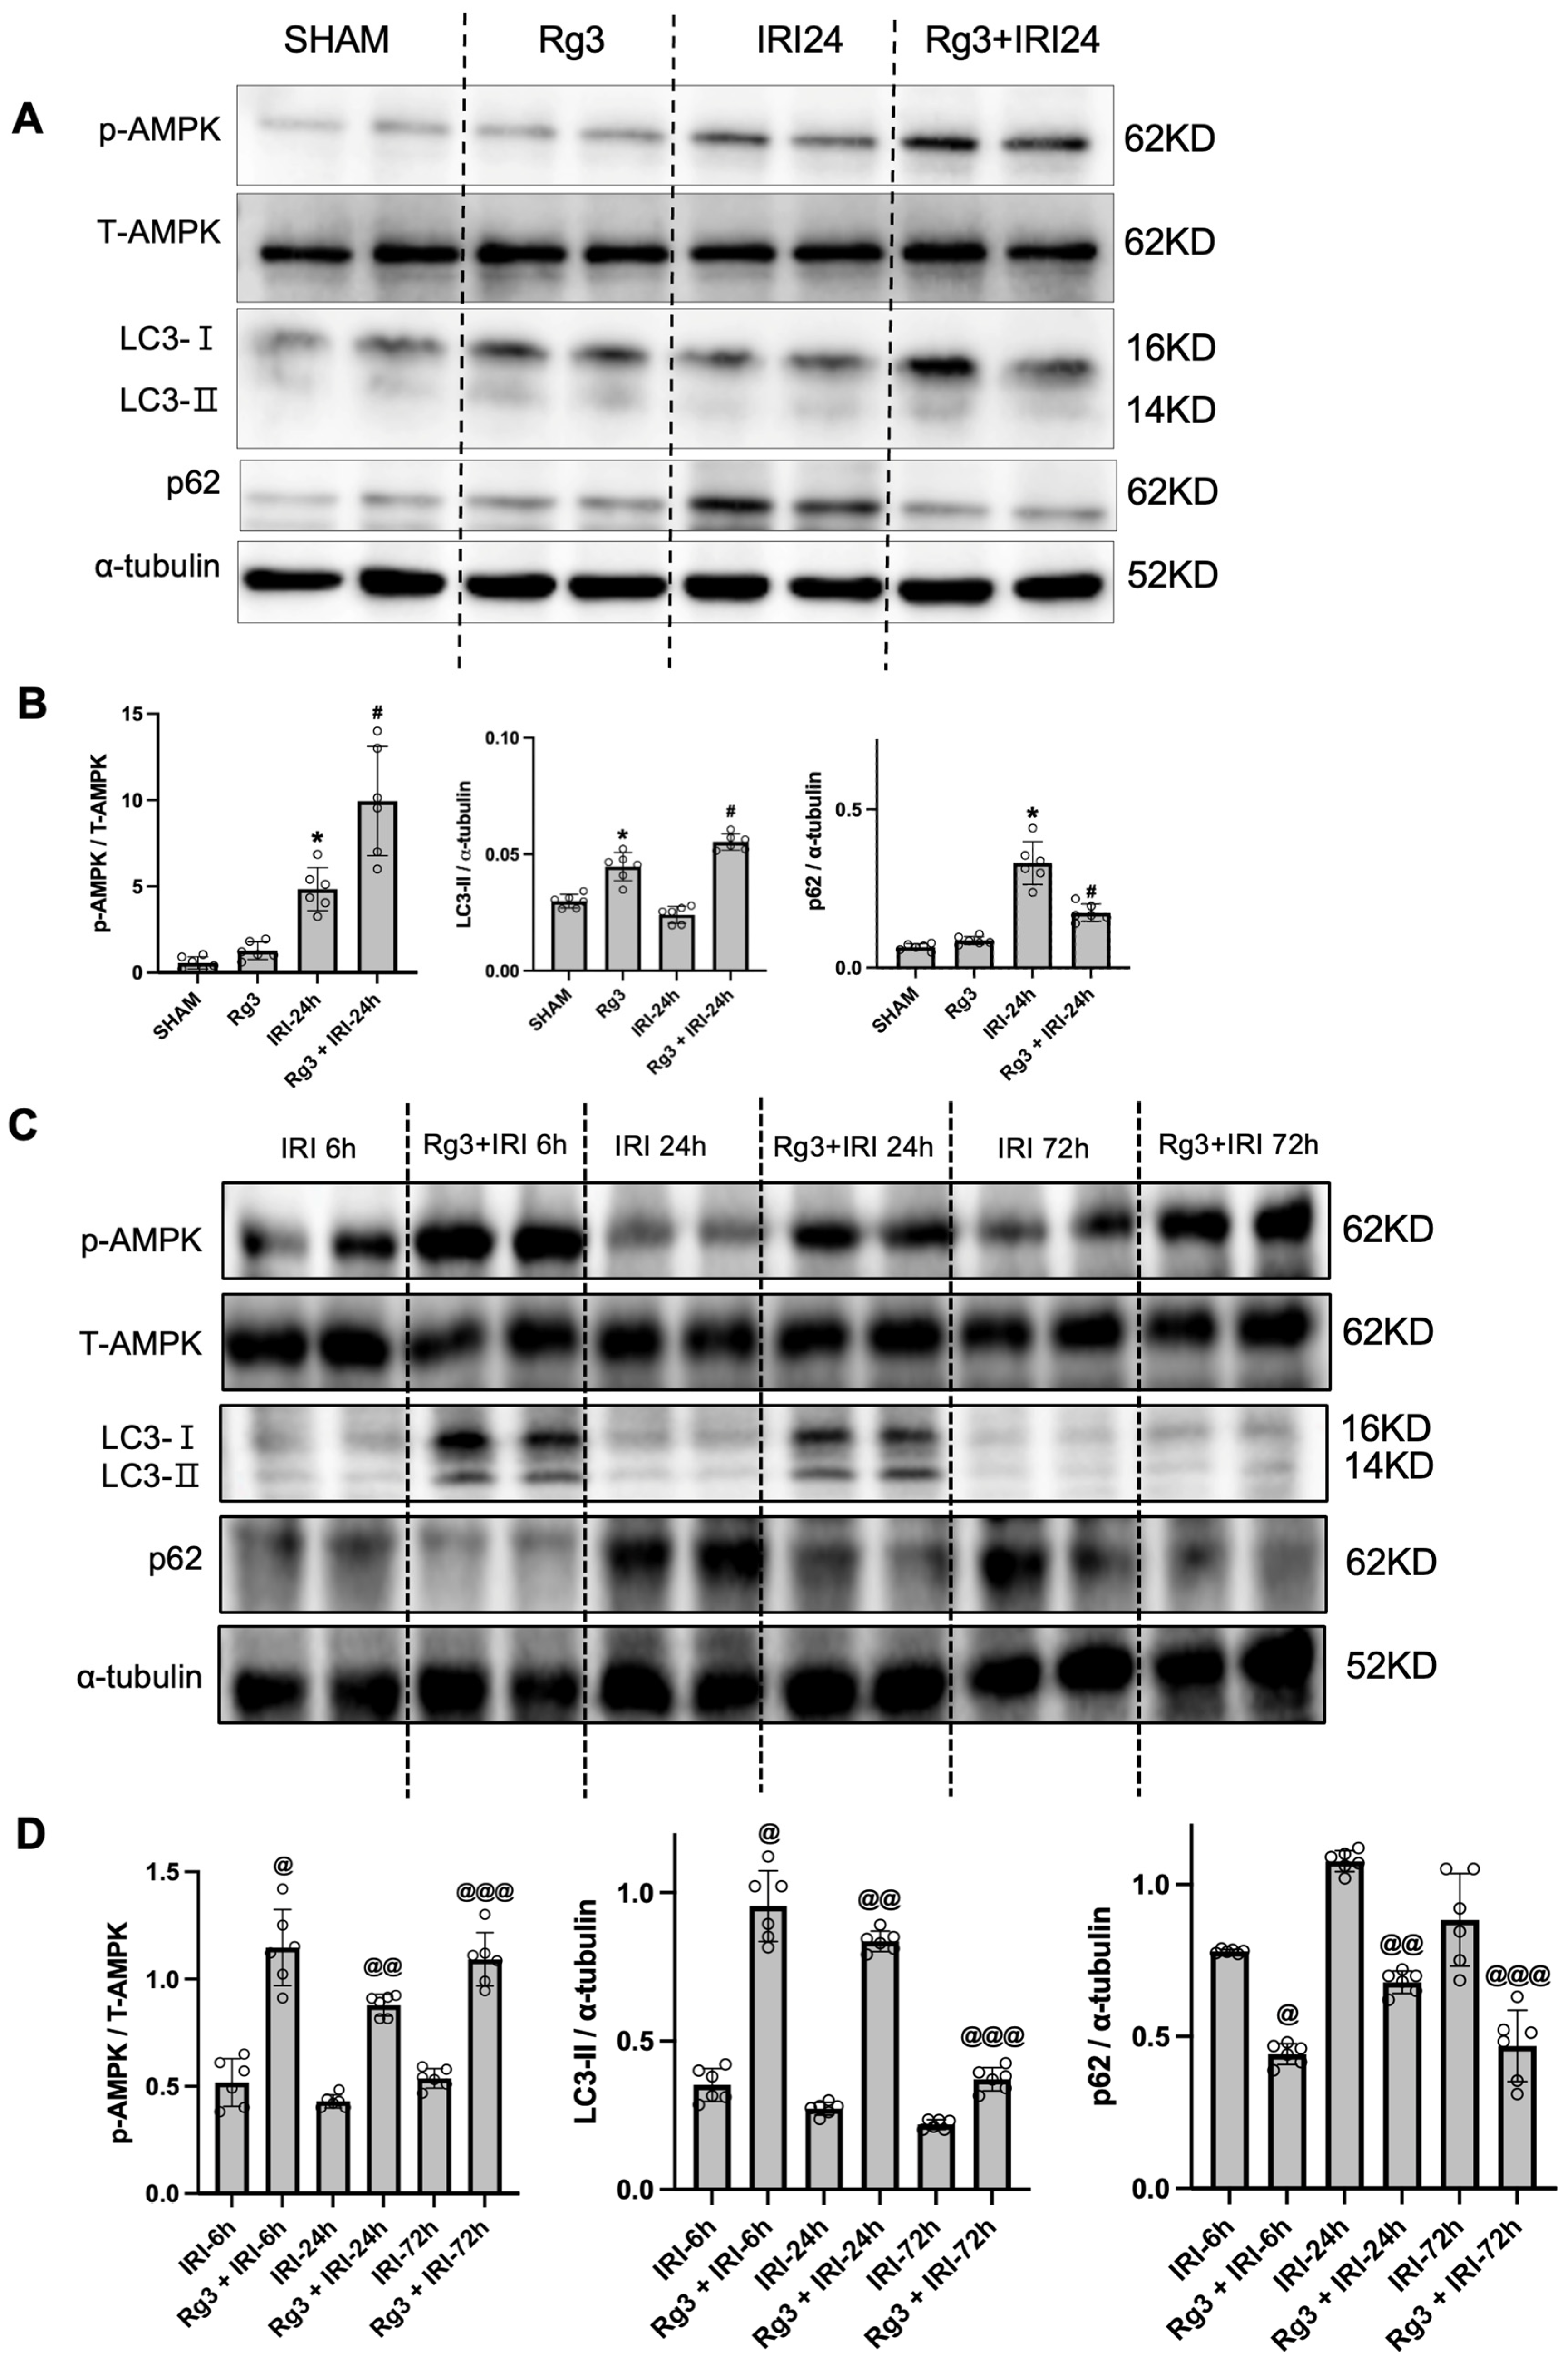
Rg3 increased the activity of AMPK, a key regulator of energy metabolism and autophagy. AMPK phosphorylation was significantly increased in the Rg3 + IRI-24 h group compared with IRI-24 h (Figure 4A). To examine changes over time, p-AMPK was assessed at 6, 24 and 72 h after IRI. At each time point, Rg3-treated groups showed a significant increase in p-AMPK compared with untreated IRI, although these increases did not follow a distinct time-dependent trend (Figure 4C,D).
Figure 4.
Effects of ginsenoside Rg3 on autophagy activation. (A) Representative immunoblots of p-AMPK, LC3 and p62 in kidney tissue. (B) Bar graphs show the p-AMPK/total AMPK ratio and the LC3-II/α-tubulin and p62/α-tubulin ratios determined by densitometry. SHAM, sham (n = 6); Rg3, Rg3-treated sham (n = 6); IRI, renal IRI (n = 6); Rg3 + IRI, Rg3-treated IRI sacrificed 24 h after IRI (n = 6). * p < 0.01 vs. SHAM; # p < 0.01 vs. IRI. (C) Expression of p-AMPK, LC3 and p62 in kidney tissue at 6, 24 and 72 h after IRI. (D) Bar graphs show the corresponding densitometric ratios. IRI-6 h (n = 6), Rg3 + IRI-6 h (n = 6), IRI-24 h (n = 6), Rg3 + IRI-24 h (n = 6), IRI-72 h (n = 6), Rg3 + IRI-72 h (n = 6). @ p < 0.01 vs. IRI-6 h; @@ p < 0.01 vs. IRI-24 h; @@@ p < 0.01 vs. IRI-72 h. Bars represent mean ± SD. One-way ANOVA with Tukey’s test (A, B); two-way ANOVA (treatment × time) with Tukey’s test (D; Table S2).
To estimate autophagic flux, renal LC3-II and p62 levels were evaluated. LC3-II did not decrease significantly in the IRI group compared with sham; however, Rg3 treatment markedly increased LC3-II expression in IRI mice. p62 was significantly increased in IRI compared with sham but was significantly decreased in Rg3 + IRI compared with IRI (Figure 4A,B). In Rg3 + IRI kidneys, LC3-II remained consistently higher than in untreated IRI at 6, 24 and 72 h after IRI, although at 72 h LC3-II decreased markedly compared with 6 and 24 h even in the Rg3 + IRI group. Similarly, p62 remained consistently lower in Rg3 + IRI kidneys than in untreated IRI at 6, 24 and 72 h (Figure 4C,D). Collectively, these results indicate that Rg3 enhances the induction and activation of autophagy.
3.4. Co-Administration of Bafilomycin A1 or Chloroquine Is Associated with Loss of Ginsenoside Rg3-Mediated Protection
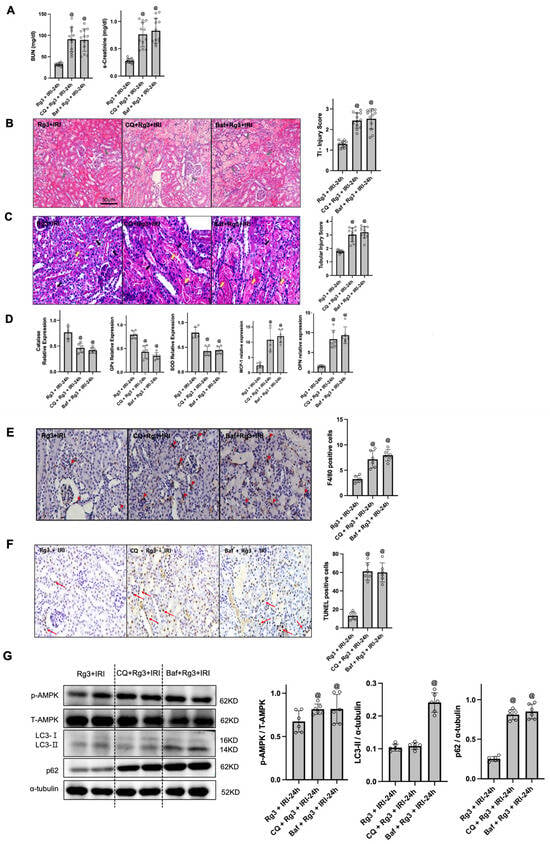
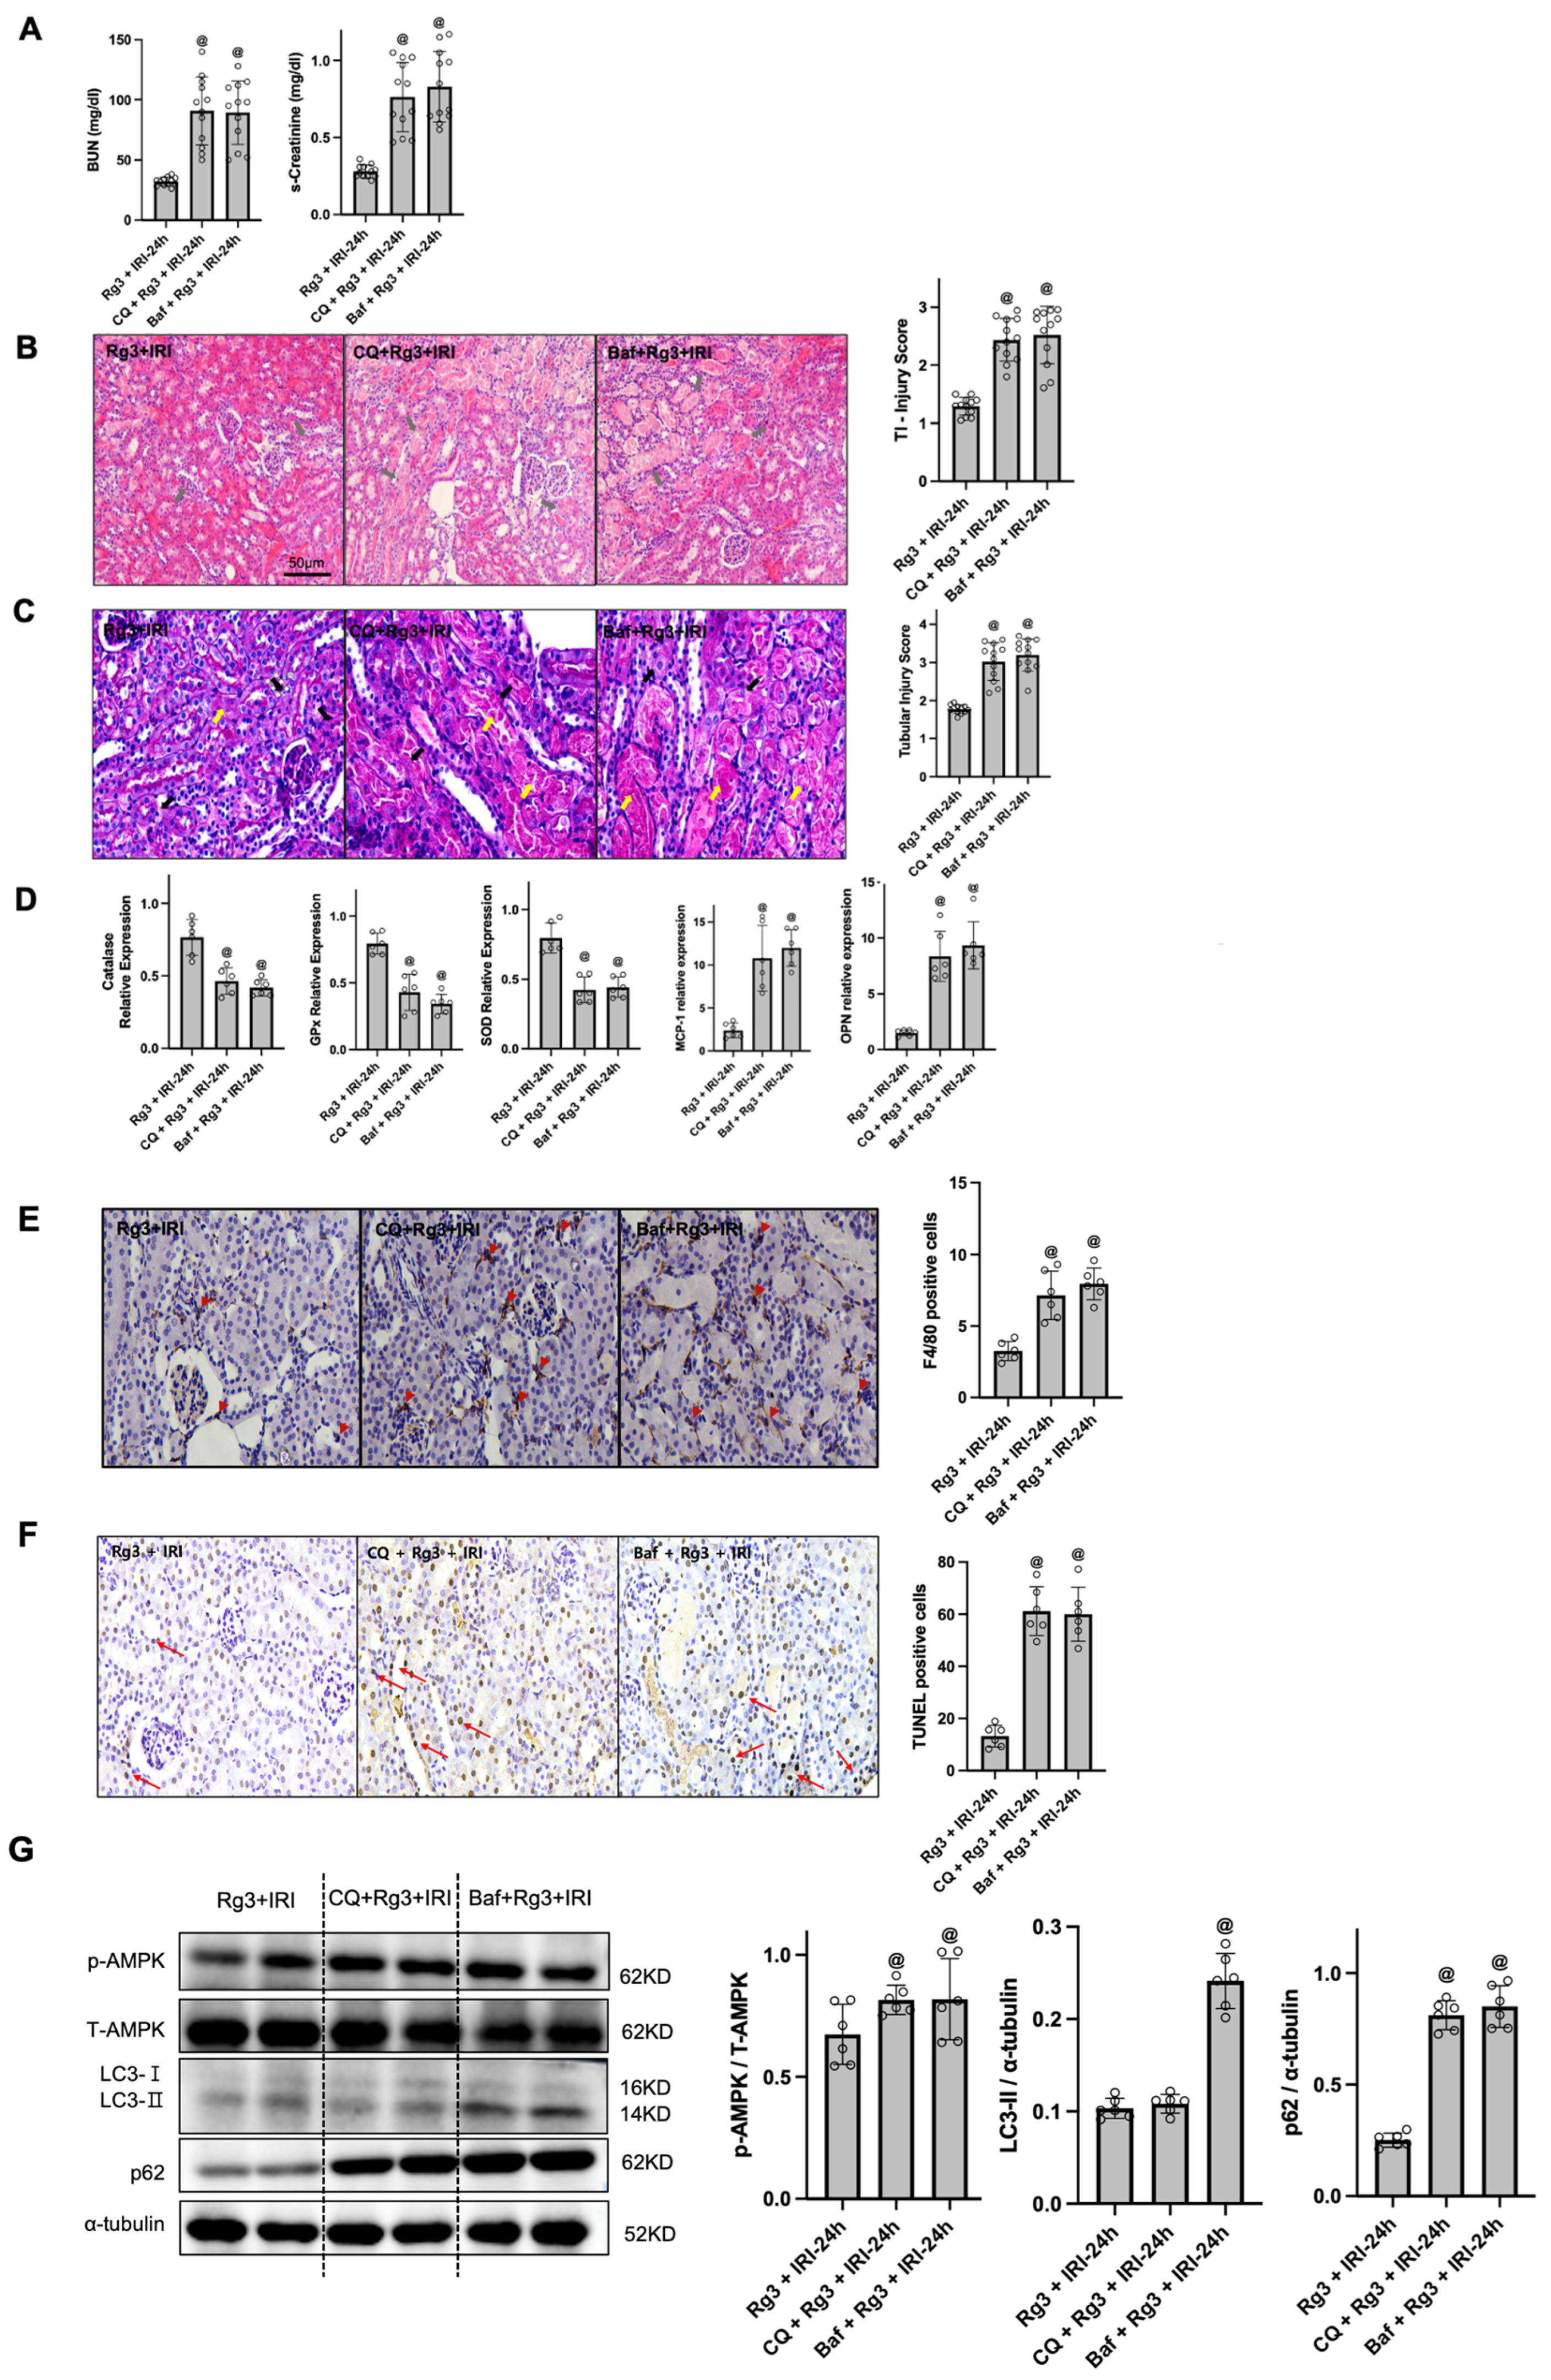
Bafilomycin A1 (Baf) and chloroquine (CQ) are widely used autophagy inhibitors in vitro and in vivo. Pretreatment with Baf or CQ elevated BUN and s-Cr in Rg3 + IRI mice (Figure 5A) and aggravated renal tubulointerstitial injury and tissue injury scores (Figure 5B). Brush border loss, vacuolisation and desquamation of the renal tubular epithelium were increased after Baf or CQ pretreatment compared with Rg3 + IRI (Figure 5C). Compared with Rg3 + IRI, the Baf + Rg3 + IRI and CQ + Rg3 + IRI groups showed lower renal mRNA expression of SOD1, catalase and Gpx and higher expression of MCP-1 and osteopontin (Figure 5D). Baf and CQ pretreatment significantly increased the number of F4/80-positive cells (Figure 5E) and TUNEL-positive cells (Figure 5F) compared with Rg3 + IRI.
Figure 5.
Co-administration of bafilomycin A1 or chloroquine is associated with loss of ginsenoside Rg3-mediated protection. (A) BUN and s-Cr levels (Rg3 + IRI, n = 12; Baf + Rg3 + IRI, n = 12; CQ + Rg3 + IRI, n = 12). (B) Representative H&E staining of kidney sections and tubular injury scores (n = 12 per group). Grey arrows, cell debris, tubular necrosis and inflammatory cells. Original magnification, ×200. (C) Representative PAS staining of kidney sections and tubular injury scores (n = 12 per group). Black arrows, cast formation or necrotic tubules; yellow arrows, dilated tubules or loss of the brush border. Original magnification, ×400. (D) Quantitative real-time RT-PCR of SOD1, catalase, Gpx, MCP-1 and osteopontin (n = 6 per group). (E) Representative immunohistochemical staining for F4/80 (n = 6 per group). Red arrowheads, F4/80-positive cells. Original magnification, ×400. (F) Representative TUNEL staining (n = 6 per group). Red arrows, TUNEL-positive cells. Original magnification, ×400. (G) Representative immunoblots of p-AMPK, total AMPK, LC3 and p62 with α-tubulin as loading control; bar graphs show the p-AMPK/total AMPK, LC3-II/α-tubulin and p62/α-tubulin ratios by densitometry (n = 6 per group). @ p < 0.01 vs. Rg3 + IRI. Bars represent mean ± SD. Rg3 + IRI, Rg3-treated IRI sacrificed 24 h after IRI; Baf + Rg3 + IRI, bafilomycin A1- and Rg3-pretreated IRI mice; CQ + Rg3 + IRI, chloroquine- and Rg3-pretreated IRI mice. One-way ANOVA with Tukey’s test; the non-parametric analysis of injury scores is given in Table S3.
Immunoblotting demonstrated that autophagic flux was suppressed in the Baf + Rg3 + IRI group relative to Rg3 + IRI, with concomitant accumulation of LC3-II and p62 consistent with blockade of autophagosome–lysosome fusion (Figure 5G). The accumulation of LC3-II with concomitant retention of p62 after Baf or CQ administration indicates that both inhibitors blocked lysosomal degradation in vivo at the doses used. Because IRI + Baf and IRI + CQ groups without Rg3 were not included, these experiments cannot establish that the inhibitors specifically abrogated the protective effect of Rg3, as opposed to exerting an injurious effect on IRI that is independent of Rg3. In the CQ + Rg3 + IRI group, LC3-II did not differ significantly from Rg3 + IRI, whereas p62 was significantly increased. No significant difference in the p-AMPK/total AMPK ratio was observed between Rg3 + IRI and either the Baf + Rg3 + IRI or the CQ + Rg3 + IRI group (Figure 5G).
3.5. Rg3 Increases AMPK Phosphorylation and Alters Autophagy Markers in HK-2 Cells Subjected to Hypoxia/Reoxygenation
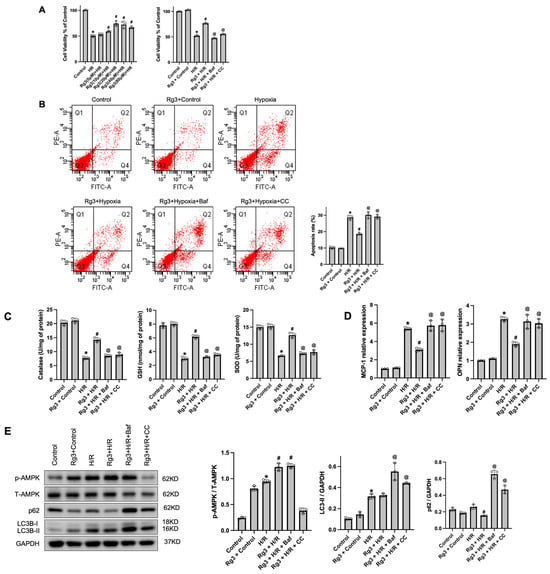
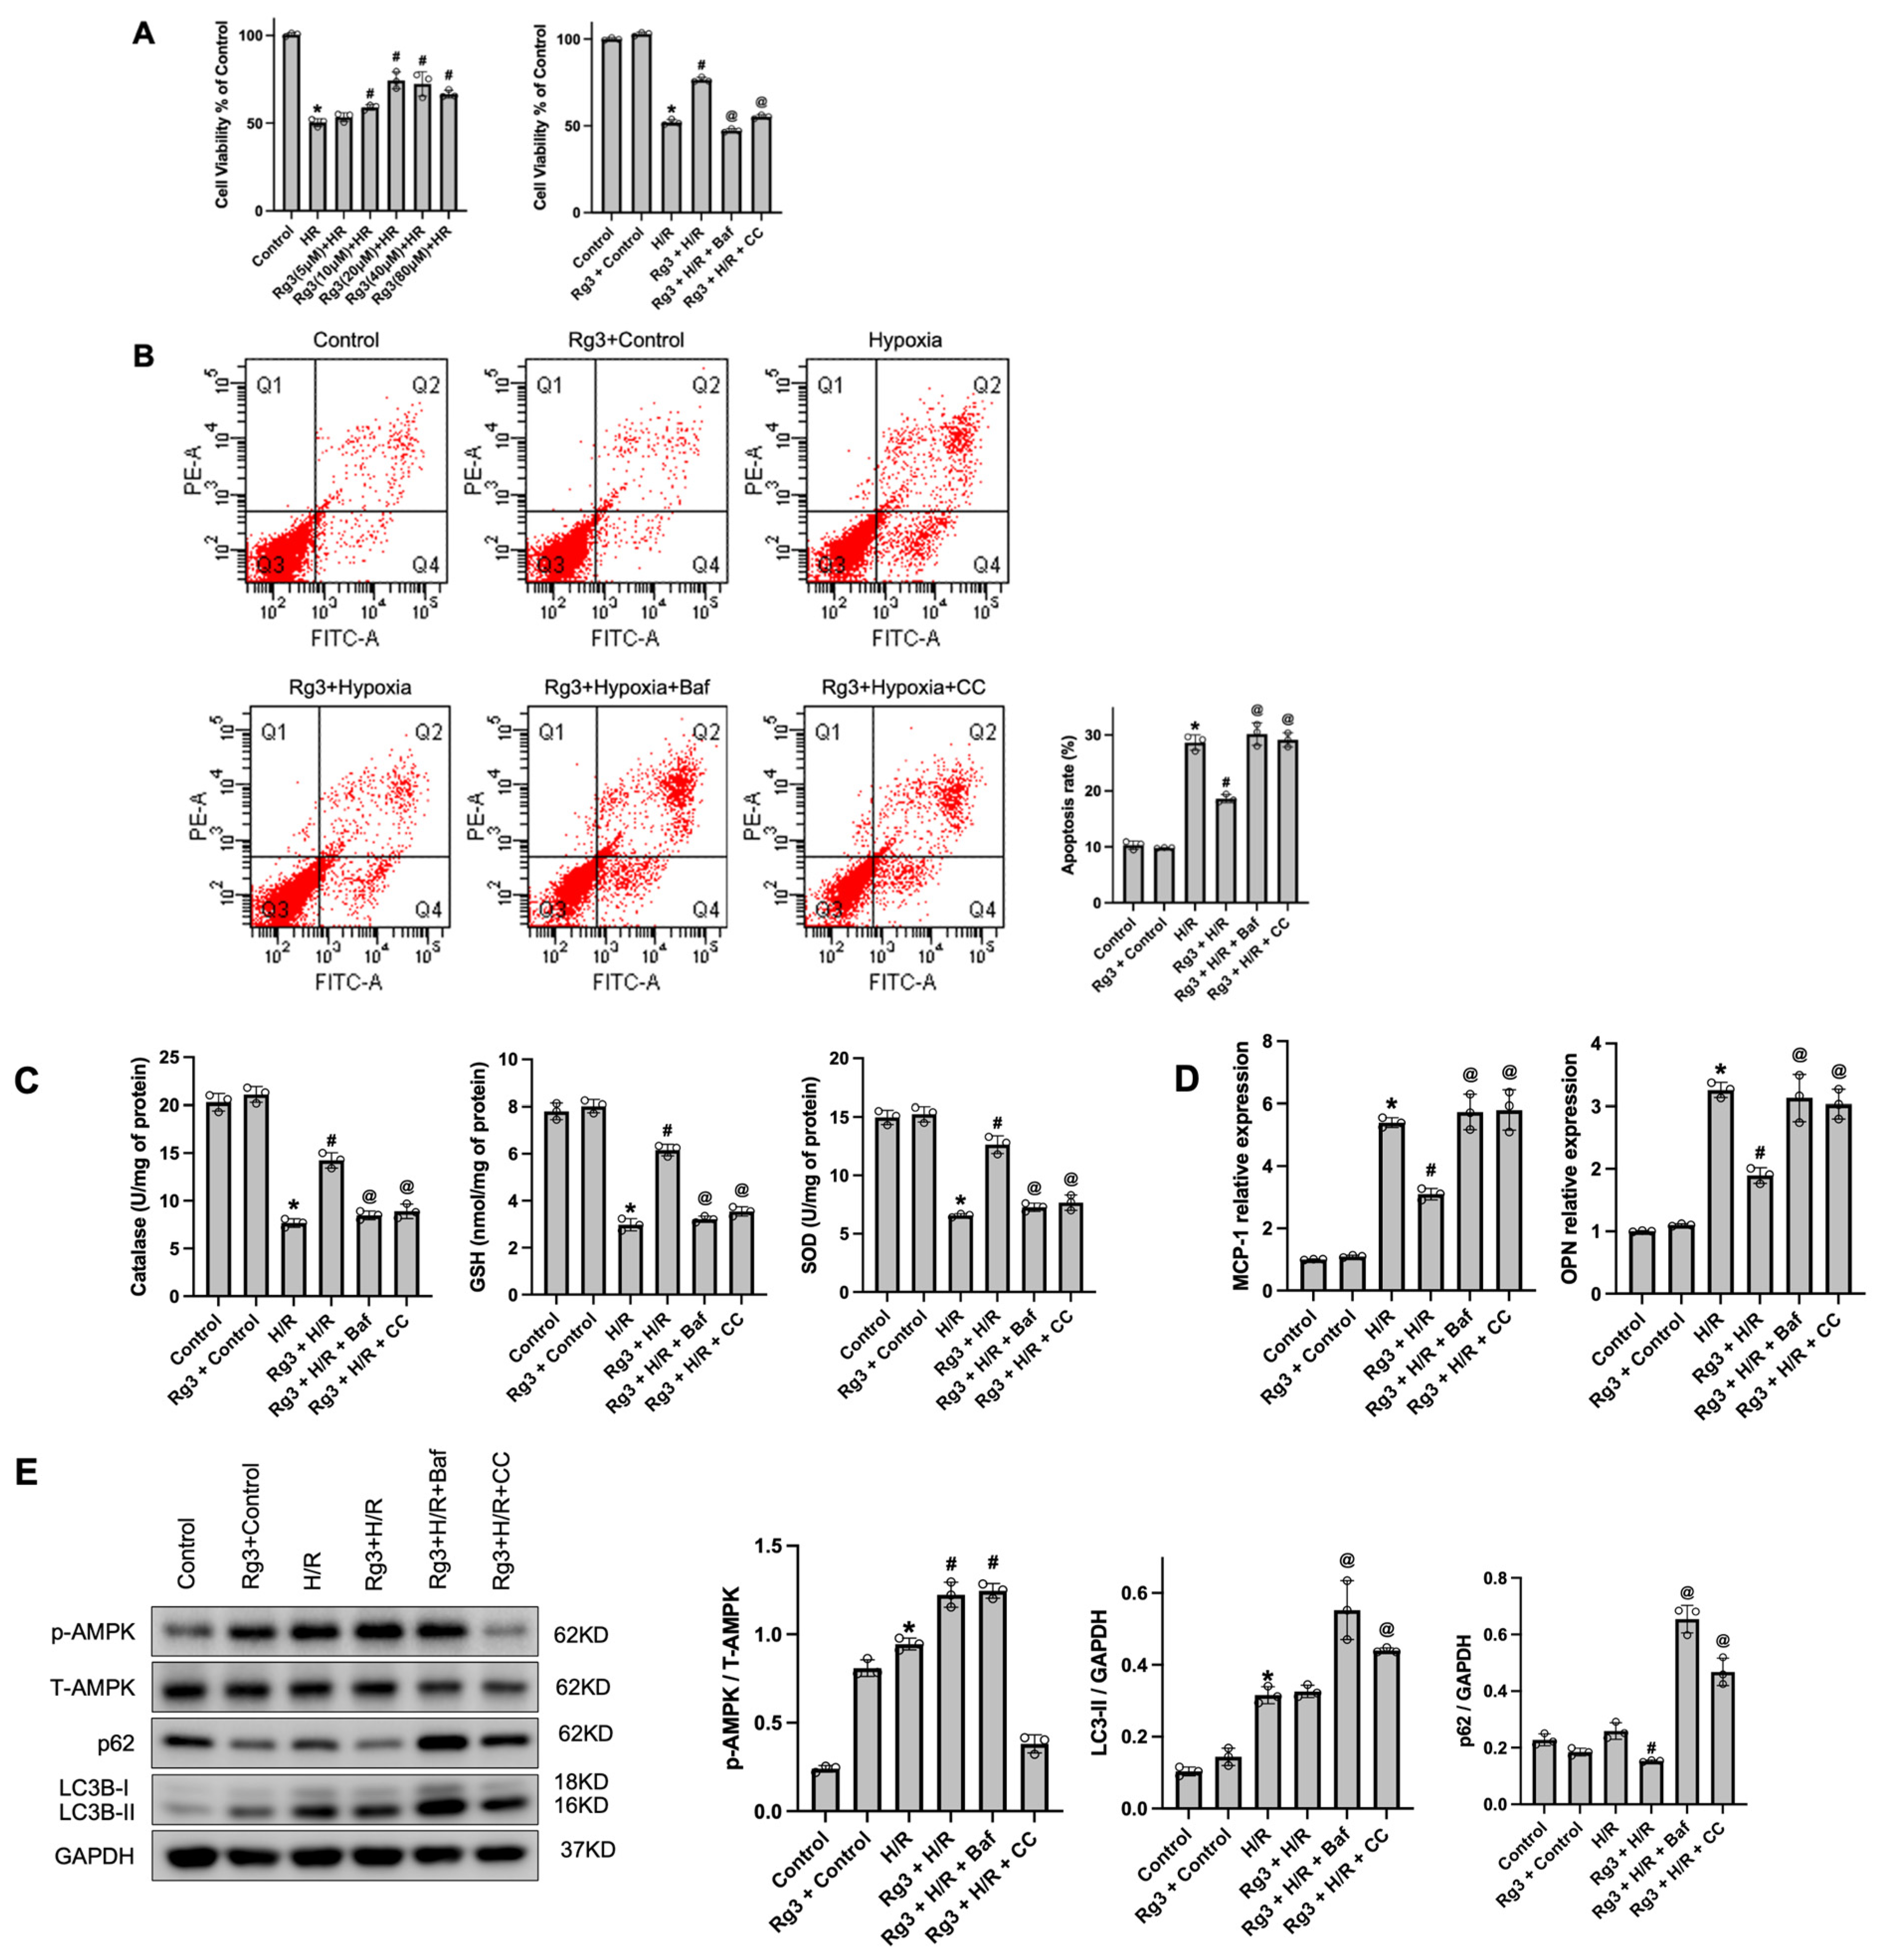
To evaluate the protective effects of Rg3 against H/R-induced injury in HK-2 cells, we assessed apoptosis, antioxidant capacity, inflammatory responses and autophagy-related signalling. Cell viability after H/R was enhanced by Rg3 in a concentration-dependent manner, with the highest viability at 20 and 40 µM; Rg3 (20 µM) significantly increased viability compared with H/R alone. This protective effect was not observed with co-treatment with either bafilomycin A1 (Baf, 100 nM) or the AMPK inhibitor compound C (CC, 10 µM), a finding compatible with the involvement of autophagy and AMPK signalling in Rg3-mediated cytoprotection, although neither inhibitor was tested in H/R cells without Rg3 (Figure 6A).
Figure 6.
Effects of Rg3 on autophagy and AMPK in hypoxia/reoxygenation (H/R)-induced injury of HK-2 cells. (A) Cell viability by MTT assay; viability under H/R was enhanced by Rg3 in a concentration-dependent manner, with the highest viability at 20 and 40 µM. The protective effect of Rg3 (20 µM) was not observed in the presence of bafilomycin A1 or compound C. (B) Apoptosis rate by annexin V/PI flow cytometry; Rg3 reduced the apoptosis rate, demonstrating an anti-apoptotic effect in injured cells. (C) GSH levels and catalase and SOD activities; Rg3 enhanced antioxidant defence, thereby mitigating oxidative stress. (D) mRNA levels of MCP-1 and osteopontin (OPN); Rg3 suppressed expression of these proinflammatory markers. (E) Immunoblot analysis of LC3B, p62, p-AMPK and total AMPK; Rg3 increased the LC3-II/I ratio, decreased p62 and elevated AMPK phosphorylation, a marker pattern compatible with enhanced autophagic flux. Data are mean ± SD. * p < 0.05 vs. control; # p < 0.05 vs. H/R; @ p < 0.05 vs. Rg3 + H/R. Control; Rg3 + control, Rg3-treated control; H/R, hypoxia/reoxygenation; Rg3 + H/R, Rg3-pretreated HK-2 cells subjected to H/R; Rg3 + H/R + Baf, bafilomycin A1- and Rg3-pretreated HK-2 cells subjected to H/R; Rg3 + H/R + CC, compound C- and Rg3-pretreated HK-2 cells subjected to H/R. Data are from three independent experiments (n = 3), each performed with a separate cell passage. One-way ANOVA with Tukey’s test.
Flow cytometric analysis with annexin V-PE/PI staining showed that H/R markedly induced apoptosis in HK-2 cells, and Rg3 pretreatment significantly reduced the percentage of apoptotic cells. Co-administration of Baf or CC with Rg3 reversed this anti-apoptotic effect, resulting in apoptosis levels comparable to or exceeding those in the H/R group (Figure 6B). H/R significantly reduced intracellular catalase, GSH levels and SOD activity, which were partially restored by Rg3; this effect was attenuated by the addition of Baf or CC, returning antioxidant activities to levels similar to those under H/R alone (Figure 6C). Quantitative real-time PCR demonstrated that H/R upregulated MCP-1 and osteopontin (OPN); Rg3 suppressed this inflammatory response, while co-treatment with Baf or CC reversed the anti-inflammatory effect of Rg3 (Figure 6D).
Immunoblotting showed that H/R increased LC3B-II together with p62 accumulation—a pattern compatible with impaired autophagic flux—along with increased AMPK phosphorylation. Rg3 treatment was associated with decreased p62 and increased AMPK phosphorylation, a marker pattern compatible with enhanced autophagic flux. Baf inhibited autophagic degradation, as evidenced by p62 accumulation despite high LC3B-II levels, and CC significantly suppressed AMPK phosphorylation, confirming its role as an AMPK inhibitor. Quantification of band intensities showed that the changes in AMPK phosphorylation and autophagy markers seen with Rg3 were not present in the presence of Baf or CC (Figure 6E).
4. Discussion
Our study provides evidence that Rg3 improves renal function and reduces oxidative stress and apoptotic cell death in ischaemia–reperfusion-injured mouse kidneys, and that these effects are accompanied by increased AMPK phosphorylation and by changes in autophagy markers consistent with restoration of autophagic flux.
After renal IRI, excessive production of ROS causes apoptosis and inflammation in the renal tubulointerstitium [31]. Even in the acute stage of AKI, inflammatory reactions occur and macrophages are activated in the kidney [32]. Rg3 has been reported to exhibit antioxidant properties, elevating SOD1, catalase and Gpx in various models [33,34], and has been reported to induce M2 polarisation in macrophages and to resolve inflammation [35]. In our study, F4/80-positive cells increased in IRI compared with control but decreased significantly in Rg3 + IRI, suggesting that Rg3 reduces oxidative stress and inflammatory cytokines, thereby limiting macrophage infiltration after renal IRI. Because macrophage phenotype (e.g., M1/M2 polarisation) was not characterised and the inflammatory response was assessed with a limited set of markers (MCP-1, osteopontin and F4/80), our data indicate reduced macrophage recruitment rather than a defined effect on macrophage activation or polarisation.
Our data are compatible with a contribution of autophagy to Rg3-mediated renoprotection, without establishing that it is required. Autophagic flux was impaired after IRI, as evidenced by modest changes in LC3-II together with accumulation of p62, and Rg3 treatment restored autophagy markers and increased AMPK phosphorylation. The loss of these effects when chloroquine or bafilomycin A1 was co-administered is consistent with the interpretation that the protective mechanism of Rg3 depends, at least in part, on autophagy activation, although in the absence of IRI + Baf and IRI + CQ control groups an independent injurious effect of the inhibitors cannot be excluded, consistent with reports that Rg3 protects neurons from cytotoxicity and attenuates mitochondrial damage through autophagic flux [21].
The modest, non-significant change in LC3-II in the IRI group relative to sham may reflect limited or transient induction of autophagy in IRI, or a balance between autophagosome formation and degradation that masks net LC3-II changes. In contrast, Rg3 alone induced a robust increase in LC3-II in both sham and IRI groups, consistent with a stimulatory effect on autophagosome biogenesis or LC3 lipidation, as reported in neuronal and cancer cell studies [21]. The dissociation between AMPK phosphorylation and p62 after IRI—p62 accumulated despite increased p-AMPK in untreated IRI, whereas it fell in Rg3-treated kidneys with even higher p-AMPK—suggests that stress-induced AMPK activation initiates autophagy but that completion of the pathway is limited by impaired lysosomal clearance after IRI, and that Rg3 restores this downstream step rather than simply amplifying the upstream signal. Because LC3-II levels reflect a dynamic equilibrium between formation and turnover, lysosomal inhibitors are essential to distinguish enhanced flux from impaired degradation [36]. The marked accumulation of LC3-II and p62 after Baf, and of p62 after CQ, in Rg3-treated IRI kidneys is the expected consequence of blocking lysosomal degradation downstream of an active flux and therefore supports, rather than contradicts, enhanced flux in the Rg3 + IRI group; the smaller effect of CQ on LC3-II is consistent with its predominant action on autophagosome–lysosome fusion rather than on lysosomal acidification. Likewise, in HK-2 cells the unchanged steady-state LC3-II with reduced p62 in Rg3-treated H/R cells, together with the further increase in LC3-II when lysosomal degradation was blocked by Baf, indicates increased turnover rather than absent autophagy. Our Baf and CQ pretreatment experiments are consistent with the interpretation that Rg3 augments autophagic flux; however, we acknowledge that changes in LC3-II and p62 together with lysosomal inhibitors do not definitively distinguish enhanced autophagosome formation from altered lysosomal degradation, and that tandem fluorescent (mRFP-GFP-LC3) reporter assays or formal flux measurements (LC3-II turnover in the presence versus absence of lysosomal inhibitors) would be required to establish this conclusively. CQ is a non-specific autophagy inhibitor that can influence lysosomal acidification, endosomal trafficking and inflammatory signalling; we therefore additionally employed bafilomycin A1, a more specific inhibitor of autophagosome–lysosome fusion. Both agents produced consistent results, with the protective effects of Rg3 no longer evident in vivo and in HK-2 cells, suggesting that the observed effects are unlikely to be artefacts of a single inhibitor. Nevertheless, bafilomycin A1 also exerts autophagy-independent effects, including inhibition of V-ATPase-dependent lysosomal and endosomal acidification, alterations in cellular metabolism and modulation of inflammatory signalling; therefore, the deterioration observed after inhibitor administration cannot be attributed exclusively to autophagy suppression, and pharmacological inhibition should be regarded as supportive rather than definitive evidence for autophagy-mediated protection.
Rg3-mediated protection was accompanied by increased AMPK phosphorylation. p-AMPK was mildly increased after renal IRI and was further enhanced by Rg3. Ischaemia–reperfusion itself can transiently activate AMPK as a compensatory response to acute ATP depletion and oxidative stress [37,38], but this endogenous activation is typically short-lived and insufficient to restore energy homeostasis during reperfusion [38]. The additional increase in p-AMPK after Rg3 administration likely reflects pharmacological amplification of this adaptive energy-sensing mechanism. Rg3 may stabilise and prolong AMPK activation by improving mitochondrial integrity and reducing oxidative burden, thereby sustaining autophagic flux and promoting cytoprotection. Thus, Rg3 does not simply induce AMPK activation de novo but reinforces an existing stress-responsive pathway, resulting in more durable autophagy-mediated protection. It should be noted, however, that the contribution of AMPK was inferred from increased AMPK phosphorylation and from the use of compound C, which inhibits several other kinases in addition to AMPK; genetic approaches (e.g., AMPKα knockdown or kidney-specific knockout) were not employed, and the involvement of other upstream regulators (LKB1, CaMKKβ) and downstream effectors (ULK1, mTORC1) was not examined. Our mechanistic conclusions regarding AMPK should therefore be interpreted with this limitation in mind. Moreover, the non-significant increase in p-AMPK after Baf or CQ in vivo and the baseline increase in p-AMPK without a measurable change in LC3-II or p62 in Rg3-treated control cells indicate that AMPK activation alone is not sufficient to drive autophagic flux and that lysosomal blockade may itself feed back on AMPK; the inhibition of Rg3-mediated protection by compound C supports an upstream contribution of AMPK, but a bidirectional relationship cannot be excluded.
Renal IRI induces multiple overlapping forms of cell death—including apoptosis, necrosis and necroptosis—that interact dynamically with autophagy. In our study, Rg3 markedly reduced apoptosis, as shown by decreased TUNEL-positive cells and annexin V/PI-positive fractions in both models, accompanied by enhanced autophagic flux. This suggests that Rg3-mediated autophagy is cytoprotective, removing damaged organelles and mitigating mitochondrial dysfunction and thereby preventing apoptosis initiation. The relationship between autophagy and necroptosis is more complex and context-dependent [39]. Autophagy has been reported to suppress necroptotic cell death [40], whereas other reports indicate that autophagy may facilitate necroptosis and that its suppression reduces necroptosis-related death, particularly in endothelial cells [41]. Although necroptosis-specific markers such as RIPK1, RIPK3 and MLKL were not evaluated here, the attenuation of tubular necrosis and oxidative stress after Rg3 treatment raises the possibility that Rg3-induced autophagy may also restrain necroptotic and necrotic injury. This possibility remains speculative and was not experimentally tested in the present study.
Importantly, autophagy is a double-edged sword in renal injury. Timely activation after AKI promotes removal of damaged organelles, reduces apoptosis and supports cellular repair—for example, autophagy activation protects renal tubular epithelial cells against cisplatin- and urinary protein-induced injury [42]. However, excessive or persistent autophagy during later phases of injury and repair may become maladaptive, leading to cellular senescence, tubular atrophy, fibrosis and impaired organ recovery [43,44,45,46]. Baisantry et al. showed that autophagy in proximal tubular S3 segments after ischaemic AKI promotes tubular senescence, thereby contributing to renal fibrosis and maladaptive repair [47], and Tang et al. highlighted that while early autophagy induction after reperfusion is beneficial, prolonged activation correlates with increased fibrosis and adverse tissue remodelling [48]. Conversely, Yuan et al. found that autophagy deficiency in renal macrophages increases susceptibility to cisplatin- and ischaemia-induced injury through the miR-195a-5p/SIRT3 pathway [49]. These data underscore that both cell-type specificity and the timing and duration of autophagy modulation determine whether autophagy is protective or detrimental. In our study, neither the in vivo nor the in vitro data showed histological or biochemical findings suggestive of excessive autophagy-related cell death; Rg3 improved renal function, with autophagy-marker changes compatible with restoration of IRI-impaired autophagic flux. Nevertheless, different dosing, timing or prolonged activation may carry a risk of harm, and future work should determine whether the extent of autophagy activation by Rg3 correlates with injury severity or adverse outcomes across doses and time points.
This study has several limitations. First, Rg3 exerted renoprotective effects in association with increased AMPK phosphorylation and changes in autophagy markers, we were unable to identify the specific enzyme or binding protein through which Rg3 initiates these effects. Rg3 has been reported to promote neuronal survival by activating Akt signalling, which inhibits the TSC1/TSC2 complex—a negative regulator of mTOR and autophagy [50]. Further studies using proteomic approaches and Akt-targeted genetic or pharmacological inhibition are needed to clarify the direct molecular target of Rg3 in renal cells. Second, while our data show an association between AMPK phosphorylation and the autophagy-marker changes observed with Rg3, the upstream kinase responsible for AMPK phosphorylation remains to be elucidated; future investigations should determine whether Rg3 activates AMPK via the LKB1 or CaMKKβ pathway. Third, although this study focused on the autophagy-dependent cytoprotective mechanism, necroptosis-related markers were not directly evaluated. Integrative studies are therefore required to investigate whether Rg3 modulates necroptotic signalling or interacts with other programmed cell death pathways, which would provide a more comprehensive understanding of the cytoprotective network governed by Rg3 in renal injury. Fourth, Rg3 was administered 1 h before ischaemia in all experiments; our findings therefore establish a preventive effect and do not demonstrate therapeutic efficacy when Rg3 is given after injury has occurred, which is the clinically more relevant scenario in acute kidney injury. Fifth, oxidative stress was assessed through antioxidant enzyme expression and activities rather than by direct measurement of reactive oxygen species or oxidative damage (e.g., lipid peroxidation, 8-OHdG); the conclusion that Rg3 reduces oxidative stress is therefore based on indirect evidence. Sixth, the evidence for autophagy- and AMPK-dependence relies on pharmacological inhibitors that have autophagy- and AMPK-independent actions, no genetic loss-of-function approach was used, and the inhibitor study did not include IRI + Baf and IRI + CQ groups without Rg3; although the inhibitor-treated groups returned to values indistinguishable from untreated IRI (BUN 89–91 vs. 112 mg/dL), the intrinsic effect of each inhibitor on IRI cannot be separated from the reversal of Rg3 protection. Autophagy was assessed by immunoblotting of LC3-II and p62 only, without ultrastructural quantification of autophagosomes by transmission electron microscopy or tandem fluorescent reporters. In addition, antioxidant enzyme expression was examined only at 6 and 24 h and macrophage infiltration only at 24 and 72 h, so the full temporal profiles of oxidative stress and inflammation were not captured. Seventh, experiments were conducted exclusively in male mice and in an immortalised human proximal tubular cell line; sex-related differences in susceptibility to renal IRI and in autophagy regulation were not addressed, and extrapolation from HK-2 cells and an acute murine injury model to human acute kidney injury should be made with caution; in addition, oxygen tension and hypoxia-inducible factor stabilisation were not measured directly in either the in vivo or the oil-immersion model, so that ischaemia and reoxygenation—and the resulting increase in reactive oxygen species—are inferred from the experimental design and from the resulting loss of viability and induction of apoptosis rather than measured. In addition, histological injury was scored on a single section per animal by one blinded pathologist, so inter-observer reproducibility could not be evaluated. Finally, the protective effects were observed at a single dose (10 mg/kg) and within 72 h of injury; given that excessive or prolonged autophagy may contribute to maladaptive repair, these findings should not be generalised to other doses or to longer treatment periods, and the multiplicity of endpoints analysed increases the risk of type I error.
5. Conclusions
Ginsenoside Rg3 attenuated renal dysfunction, tubular injury, oxidative stress and apoptosis in ischaemia–reperfusion-injured mouse kidneys and in HK-2 cells subjected to hypoxia/reoxygenation. These effects were accompanied by increased AMPK phosphorylation and by changes in autophagy markers (increased LC3-II, decreased p62) consistent with enhanced autophagic flux, and protection was no longer evident when lysosomal or AMPK inhibitors were co-administered. Because the study relied on pharmacological inhibitors without inhibitor-only injury controls, and because autophagic flux was not measured directly, these findings indicate an association between AMPK phosphorylation, autophagy-related processes and nephroprotection rather than a demonstrated causal mechanism. Rg3 warrants further investigation as a candidate for the prevention of ischaemic renal damage; whether it is also effective when administered after injury remains to be determined. Further studies are needed to delineate its precise molecular targets and to validate these effects in clinical settings.
Supplementary Materials
The following supporting information can be downloaded at: https://www.mdpi.com/article/10.3390/antiox15121531/s1; Figure S1: Dose-dependent effects of ginsenoside Rg3 on renal function after ischaemia–reperfusion injury (IRI); Figure S2: Schematic of the experimental design. Table S1: Number of animals analysed per group, time point and endpoint; Table S2: Two-way ANOVA (treatment × time) for time-course endpoints compared between IRI and Rg3 + IRI mice; Table S3: Non-parametric analysis of ordinal histological injury scores.
Author Contributions
Conceptualization, H.P., E.-J.K. and D.E.C.; methodology, J.J., E.J.L., Y.R.H., K.R.N. and J.-J.K.; validation, E.J.L.; formal analysis, H.P. and E.-J.K.; investigation, H.P. and E.-J.K.; resources, J.J., E.J.L., Y.R.H., K.R.N. and J.-J.K.; data curation, H.P. and E.-J.K.; writing—original draft preparation, H.P. and E.-J.K.; writing—review and editing, D.E.C.; supervision, K.R.N. and D.E.C. All authors have read and agreed to the published version of the manuscript.
Funding
This research was supported by the research fund of Chungnam National University (2025-1076-01).
Institutional Review Board Statement
The animal study protocol was approved by the Institutional Animal Care and Use Committee of Chungnam National University (approval number CNU-01181; date of approval: 26 December 2018).
Informed Consent Statement
Not applicable.
Data Availability Statement
The data presented in this study are available on request from the corresponding author.
Conflicts of Interest
The authors declare no conflicts of interest. The funders had no role in the design of the study; in the collection, analyses, or interpretation of data; in the writing of the manuscript; or in the decision to publish the results.
Abbreviations
The following abbreviations are used in this manuscript:
| AKI | acute kidney injury |
| AMPK | AMP-activated protein kinase |
| Baf | bafilomycin A1 |
| BUN | blood urea nitrogen |
| CAT | catalase |
| CC | compound C |
| CQ | chloroquine |
| DMSO | dimethyl sulfoxide |
| GPx | glutathione peroxidase |
| GSH | glutathione |
| H/R | hypoxia/reoxygenation |
| IRI | ischaemia–reperfusion injury |
| LC3 | microtubule-associated protein 1 light chain 3 |
| MCP-1 | monocyte chemoattractant protein-1 |
| OPN | osteopontin |
| PAS | periodic acid–Schiff |
| ROS | reactive oxygen species |
| s-Cr | serum creatinine |
| SOD | superoxide dismutase |
| TUNEL | terminal deoxynucleotidyl transferase dUTP nick end labelling |
References
- Ilha, J.; do Espirito-Santo, C.C.; de Freitas, G.R. mTOR Signaling Pathway and Protein Synthesis: From Training to Aging and Muscle Autophagy. Adv. Exp. Med. Biol. 2018, 1088, 139–151. [Google Scholar] [CrossRef] [Scilit] [PubMed]
- Jang, H.R.; Rabb, H. The innate immune response in ischemic acute kidney injury. Clin. Immunol. 2009, 130, 41–50. [Google Scholar] [CrossRef] [Scilit] [PubMed]
- Ricci, Z.; Cruz, D.N.; Ronco, C. Classification and staging of acute kidney injury: Beyond the RIFLE and AKIN criteria. Nat. Rev. Nephrol. 2011, 7, 201–208. [Google Scholar] [CrossRef] [Scilit] [PubMed]
- Bonventre, J.V. Mechanisms of ischemic acute renal failure. Kidney Int. 1993, 43, 1160–1178. [Google Scholar] [CrossRef] [Scilit] [PubMed]
- Johnson, K.J.; Weinberg, J.M. Postischemic renal injury due to oxygen radicals. Curr. Opin. Nephrol. Hypertens. 1993, 2, 625–635. [Google Scholar] [CrossRef] [Scilit] [PubMed]
- Paller, M.S.; Hoidal, J.R.; Ferris, T.F. Oxygen free radicals in ischemic acute renal failure in the rat. J. Clin. Invest. 1984, 74, 1156–1164. [Google Scholar] [CrossRef] [Scilit] [PubMed]
- Mizushima, N.; Levine, B.; Cuervo, A.M.; Klionsky, D.J. Autophagy fights disease through cellular self-digestion. Nature 2008, 451, 1069–1075. [Google Scholar] [CrossRef] [Scilit] [PubMed]
- Lee, J.; Giordano, S.; Zhang, J. Autophagy, mitochondria and oxidative stress: Cross-talk and redox signalling. Biochem. J. 2012, 441, 523–540. [Google Scholar] [CrossRef] [Scilit] [PubMed]
- Zhang, Y.L.; Zhang, J.; Cui, L.Y.; Yang, S. Autophagy activation attenuates renal ischemia-reperfusion injury in rats. Exp. Biol. Med. 2015, 240, 1590–1598. [Google Scholar] [CrossRef] [Scilit] [PubMed]
- Liu, S.; Hartleben, B.; Kretz, O.; Wiech, T.; Igarashi, P.; Mizushima, N.; Walz, G.; Huber, T.B. Autophagy plays a critical role in kidney tubule maintenance, aging and ischemia-reperfusion injury. Autophagy 2012, 8, 826–837. [Google Scholar] [CrossRef] [Scilit] [PubMed]
- Mizushima, N.; Yoshimori, T.; Levine, B. Methods in mammalian autophagy research. Cell 2010, 140, 313–326. [Google Scholar] [CrossRef] [Scilit] [PubMed]
- Klionsky, D.J. Autophagy: From phenomenology to molecular understanding in less than a decade. Nat. Rev. Mol. Cell Biol. 2007, 8, 931–937. [Google Scholar] [CrossRef] [Scilit] [PubMed]
- Decuypere, J.P.; Ceulemans, L.J.; Agostinis, P.; Monbaliu, D.; Naesens, M.; Pirenne, J.; Jochmans, I. Autophagy and the Kidney: Implications for Ischemia-Reperfusion Injury and Therapy. Am. J. Kidney Dis. 2015, 66, 699–709. [Google Scholar] [CrossRef] [Scilit] [PubMed]
- Nakagawa, S.; Nishihara, K.; Inui, K.; Masuda, S. Involvement of autophagy in the pharmacological effects of the mTOR inhibitor everolimus in acute kidney injury. Eur. J. Pharmacol. 2012, 696, 143–154. [Google Scholar] [CrossRef] [Scilit] [PubMed]
- Chien, C.T.; Shyue, S.K.; Lai, M.K. Bcl-xL augmentation potentially reduces ischemia/reperfusion induced proximal and distal tubular apoptosis and autophagy. Transplantation 2007, 84, 1183–1190. [Google Scholar] [CrossRef] [Scilit] [PubMed]
- Shin, J.H.; Park, Y.J.; Kim, W.; Kim, D.-O.; Kim, B.-Y.; Lee, H.; Baik, M.-Y. Change of Ginsenoside Profiles in Processed Ginseng by Drying, Steaming, and Puffing. J. Microbiol. Biotechnol. 2019, 29, 222–229. [Google Scholar] [CrossRef] [Scilit] [PubMed]
- Kim, B.M.; Kim, D.H.; Park, J.H.; Surh, Y.J.; Na, H.K. Ginsenoside Rg3 Inhibits Constitutive Activation of NF-kappaB Signaling in Human Breast Cancer (MDA-MB-231) Cells: ERK and Akt as Potential Upstream Targets. J. Cancer Prev. 2014, 19, 23–30. [Google Scholar] [CrossRef] [Scilit] [PubMed]
- Kim, S.M.; Lee, S.Y.; Yuk, D.Y.; Moon, D.C.; Choi, S.S.; Kim, Y.; Han, S.B.; Oh, K.-W.; Hong, J.T. Inhibition of NF-kappaB by ginsenoside Rg3 enhances the susceptibility of colon cancer cells to docetaxel. Arch. Pharm. Res. 2009, 32, 755–765. [Google Scholar] [CrossRef] [Scilit] [PubMed]
- Zhou, Y.D.; Hou, J.G.; Liu, W.; Ren, S.; Wang, Y.-P.; Zhang, R.; Chen, C.; Wang, Z.; Li, W. 20(R)-ginsenoside Rg3, a rare saponin from red ginseng, ameliorates acetaminophen-induced hepatotoxicity by suppressing PI3K/AKT pathway-mediated inflammation and apoptosis. Int. Immunopharmacol. 2018, 59, 21–30. [Google Scholar] [CrossRef] [Scilit] [PubMed]
- Sun, G.Z.; Meng, F.J.; Cai, H.Q.; Diao, X.B.; Zhang, B.; Bai, X.P. Ginsenoside Rg3 protects heart against isoproterenol-induced myocardial infarction by activating AMPK mediated autophagy. Cardiovasc. Diagn. Ther. 2020, 10, 153–160. [Google Scholar] [CrossRef] [Scilit] [PubMed]
- Moon, J.H.; Lee, J.H.; Lee, Y.J.; Park, S.Y. Autophagy flux induced by ginsenoside-Rg3 attenuates human prion protein-mediated neurotoxicity and mitochondrial dysfunction. Oncotarget 2016, 7, 85697–85708. [Google Scholar] [CrossRef] [Scilit] [PubMed]
- Xing, W.; Yang, L.; Peng, Y.; Wang, Q.; Gao, M.; Yang, M.; Xiao, X. Ginsenoside Rg3 attenuates sepsis-induced injury and mitochondrial dysfunction in liver via AMPK-mediated autophagy flux. Biosci. Rep. 2017, 37, BSR20170934. [Google Scholar] [CrossRef] [Scilit] [PubMed]
- Zhu, B.; Li, S.X.; Yu, L.; Hu, W.; Sheng, D.; Hou, J.; Zhao, N.; Hou, X.; Wu, Y.; Han, Z.; et al. Inhibition of Autophagy with Chloroquine Enhanced Sinoporphyrin Sodium Mediated Photodynamic Therapy-induced Apoptosis in Human Colorectal Cancer Cells. Int. J. Biol. Sci. 2019, 15, 12–23. [Google Scholar] [CrossRef] [Scilit] [PubMed]
- Jiang, D.; Chen, K.; Lu, X.; Gao, H.J.; Qin, Z.H.; Lin, F. Exercise ameliorates the detrimental effect of chloroquine on skeletal muscles in mice via restoring autophagy flux. Acta Pharmacol. Sin. 2014, 35, 135–142. [Google Scholar] [CrossRef] [Scilit] [PubMed]
- Cho, J.M.; Park, S.K.; Ghosh, R.; Ly, K.; Ramous, C.; Thompson, L.; Hansen, M.; Mattera, M.S.d.L.C.; Pires, K.M.; Ferhat, M.; et al. Late-in-life treadmill training rejuvenates autophagy, protein aggregate clearance, and function in mouse hearts. Aging Cell 2021, 20, e13467. [Google Scholar] [CrossRef] [Scilit] [PubMed]
- Wang, B.; Yang, Q.; Sun, Y.Y.; Xing, Y.; Wang, Y.; Lu, X.; Bai, W.; Liu, X.; Zhao, Y. Resveratrol-enhanced autophagic flux ameliorates myocardial oxidative stress injury in diabetic mice. J. Cell. Mol. Med. 2014, 18, 1599–1611. [Google Scholar] [CrossRef] [Scilit] [PubMed]
- Gwon, D.H.; Hwang, T.W.; Ro, J.Y.; Kang, Y.-J.; Jeong, J.Y.; Kim, D.-K.; Lim, K.; Kim, D.W.; Choi, D.E.; Kim, J.-J. High Endogenous Accumulation of omega-3 Polyunsaturated Fatty Acids Protect against Ischemia-Reperfusion Renal Injury through AMPK-Mediated Autophagy in Fat-1 Mice. Int. J. Mol. Sci. 2017, 18, 2081. [Google Scholar] [CrossRef] [Scilit] [PubMed]
- Meldrum, K.K.; Meldrum, D.R.; Hile, K.L.; Burnett, A.L.; Harken, A.H. A novel model of ischemia in renal tubular cells which closely parallels in vivo injury. J. Surg. Res. 2001, 99, 288–293. [Google Scholar] [CrossRef] [Scilit] [PubMed]
- Chang, Y.K.; Choi, H.; Jeong, J.Y.; Na, K.R.; Lee, K.W.; Lim, B.J.; Choi, D.E. Dapagliflozin, SGLT2 inhibitor, attenuates renal ischemia-reperfusion injury. PLoS ONE 2016, 11, e0158810. [Google Scholar] [CrossRef] [Scilit] [PubMed]
- Jeong, J.Y.; Na, K.R.; Shin, J.A.; Suh, K.-S.; Kim, J.-J.; Lee, K.W.; Choi, D.E. Collecting Duct-Specific CR6-Interacting Factor-1-Deletion Aggravates Renal Inflammation and Fibrosis Induced by Unilateral Ureteral Obstruction. Int. J. Mol. Sci. 2021, 22, 11699. [Google Scholar] [CrossRef] [Scilit] [PubMed]
- Snoeijs, M.G.; van Heurn, L.W.; Buurman, W.A. Biological modulation of renal ischemia-reperfusion injury. Curr. Opin. Organ Transplant. 2010, 15, 190–199. [Google Scholar] [CrossRef] [Scilit] [PubMed]
- Lech, M.; Grobmayr, R.; Ryu, M.; Lorenz, G.; Hartter, I.; Mulay, S.R.; Susanti, H.E.; Kobayashi, K.S.; Flavell, R.A.; Anders, H.-J. Macrophage phenotype controls long-term AKI outcomes--kidney regeneration versus atrophy. J. Am. Soc. Nephrol. 2014, 25, 292–304. [Google Scholar] [CrossRef] [Scilit] [PubMed]
- Zhao, Y.; Wang, Y.; Zhang, M.; Gao, Y.; Yan, Z. Protective effects of ginsenosides (20R)-Rg3 on H2O2-induced myocardial cell injury by activating Keap-1/Nrf2/HO-1 signaling pathway. Chem. Biodivers. 2021, 18, e2001007. [Google Scholar] [CrossRef] [Scilit] [PubMed]
- Bi, S.; Qu, Y.; Shao, J.; Zhang, J.; Li, W.; Zhang, L.; Ni, J.; Cao, L. Ginsenoside Rg3 ameliorates stress of broiler chicks induced by Escherichia coli lipopolysaccharide. Front. Vet. Sci. 2022, 9, 878018. [Google Scholar] [CrossRef] [Scilit] [PubMed]
- Kang, S.; Park, S.J.; Lee, A.Y.; Huang, J.; Chung, H.Y.; Im, D.S. Ginsenoside Rg3 promotes inflammation resolution through M2 macrophage polarization. J. Ginseng Res. 2018, 42, 68–74. [Google Scholar] [CrossRef] [Scilit] [PubMed]
- Yoshii, S.R.; Mizushima, N. Monitoring and Measuring Autophagy. Int. J. Mol. Sci. 2017, 18, 1865. [Google Scholar] [CrossRef] [Scilit] [PubMed]
- Cai, J.; Chen, X.Y.; Liu, X.Y.; Li, Z.; Shi, A.; Tang, X.; Xia, P.; Zhang, J.; Yu, P. AMPK: The key to ischemia-reperfusion injury. J. Cell. Physiol. 2022, 237, 4079–4096. [Google Scholar] [CrossRef] [Scilit] [PubMed]
- Hallows, K.R.; Mount, P.F.; Pastor-Soler, N.M.; Power, D.A. Role of the energy sensor AMP-activated protein kinase in renal physiology and disease. Am. J. Physiol. Ren. Physiol. 2010, 298, F1067–F1077. [Google Scholar] [CrossRef] [Scilit] [PubMed]
- Zhang, L.; Cui, T.X.; Wang, X.J. The Interplay Between Autophagy and Regulated Necrosis. Antioxid. Redox Signal. 2023, 38, 550–580. [Google Scholar] [CrossRef] [Scilit] [PubMed]
- Lim, J.; Park, H.; Heisler, J.; Maculins, T.; Roose-Girma, M.; Xu, M.; Mckenzie, B.; van Lookeren Campagne, M.; Newton, K.; Murthy, A. Autophagy regulates inflammatory programmed cell death via turnover of RHIM-domain proteins. eLife 2019, 8, e44452. [Google Scholar] [CrossRef] [Scilit] [PubMed]
- Khan, M.J.; Alam, M.R.; Waldeck-Weiermair, M.; Karsten, F.; Groschner, L.; Riederer, M.; Hallström, S.; Rockenfeller, P.; Konya, V.; Heinemann, A.; et al. Inhibition of Autophagy Rescues Palmitic Acid-induced Necroptosis of Endothelial Cells. J. Biol. Chem. 2012, 287, 21110–21120. [Google Scholar] [CrossRef] [Scilit] [PubMed]
- Liu, W.J.; Luo, M.N.; Tan, J.; Chen, W.; Huang, L.-Z.; Yang, C.; Pan, Q.; Li, B.; Liu, H.-F. Autophagy activation reduces renal tubular injury induced by urinary proteins. Autophagy 2014, 10, 243–256. [Google Scholar] [CrossRef] [Scilit] [PubMed]
- Li, S.; Li, H.; Yang, D.; Yu, X.; Irwin, D.M.; Niu, G.; Tan, H. Excessive Autophagy Activation and Increased Apoptosis Are Associated with Palmitic Acid-Induced Cardiomyocyte Insulin Resistance. J. Diabetes Res. 2017, 2017, 2376893. [Google Scholar] [CrossRef] [Scilit] [PubMed]
- Luo, S.; Rubinsztein, D.C. Apoptosis blocks Beclin 1-dependent autophagosome synthesis: An effect rescued by Bcl-xL. Cell Death Differ. 2010, 17, 268–277. [Google Scholar] [CrossRef] [Scilit] [PubMed]
- Nishida, K.; Yamaguchi, O.; Otsu, K. Crosstalk between autophagy and apoptosis in heart disease. Circ. Res. 2008, 103, 343–351. [Google Scholar] [CrossRef] [Scilit] [PubMed]
- Xiang, Y.; Fu, Y.; Wu, W.W.; Tang, C.Y.; Dong, Z. Autophagy in acute kidney injury and maladaptive kidney repair. Burns Trauma 2023, 11, tkac059. [Google Scholar] [CrossRef] [Scilit] [PubMed]
- Baisantry, A.; Bhayana, S.; Rong, S.; Ermeling, E.; Wrede, C.; Hegermann, J.; Pennekamp, P.; Sörensen-Zender, I.; Haller, H.; Melk, A.; et al. Autophagy induces prosenescent changes in proximal tubular S3 segments. J. Am. Soc. Nephrol. 2016, 27, 1609–1616. [Google Scholar] [CrossRef] [Scilit] [PubMed]
- Tang, L.X.; Zhang, W.Z.Q.; Liao, Y.; Wang, W.; Deng, X.; Wang, C.; Shi, W. Autophagy: A double-edged sword in ischemia-reperfusion injury. Cell. Mol. Biol. Lett. 2025, 30, 42. [Google Scholar] [CrossRef] [Scilit] [PubMed]
- Yuan, Y.J.; Yuan, L.H.; Yang, J.C.; Liu, F.; Liu, S.; Li, L.; Liao, G.; Tang, X.; Cheng, J.; Liu, J.; et al. Autophagy-deficient macrophages exacerbate cisplatin-induced mitochondrial dysfunction and kidney injury via miR-195a-5p-SIRT3 axis. Nat. Commun. 2024, 15, 4383. [Google Scholar] [CrossRef] [Scilit] [PubMed]
- Rubinsztein, D.C.; Marino, G.; Kroemer, G. Autophagy and aging. Cell 2011, 146, 682–695. [Google Scholar] [CrossRef] [Scilit] [PubMed]
Disclaimer/Publisher’s Note: The statements, opinions and data contained in all publications are solely those of the individual author(s) and contributor(s) and not of MDPI and/or the editor(s). MDPI and/or the editor(s) disclaim responsibility for any injury to people or property resulting from any ideas, methods, instructions or products referred to in the content. |
© 2026 by the authors. Licensee MDPI, Basel, Switzerland. This article is an open access article distributed under the terms and conditions of the Creative Commons Attribution (CC BY) license.