


Abstract
Chronic and acute alcohol exposure induce tissue-specific pathophysiological changes across multiple organ systems. Rho-associated coiled-coil kinases (ROCK1 and ROCK2) are key effectors of RhoA GTPases and participate in diverse biological processes, including the regulation of cytoskeletal dynamics, inflammation, fibrosis, apoptosis and redox homeostasis; however, their contribution to alcohol-related disorders remains incompletely understood. In this study, we evaluated ROCK1 and ROCK2 expression by qPCR and performed a cross-tissue, multi-model analysis integrating peripheral blood (PB) from human cohorts with alcohol use disorder (AUD) and acute alcohol consumption (AAC), in vitro cultures of ethanol-treated human peripheral blood mononuclear cells (PBMCs) and mouse astrocytes, and animal models. Additionally, pathway-level transcriptional profiling was conducted to assess upstream activators, core Rho/ROCK components, and downstream inflammatory, fibrotic, and apoptotic signatures in PB from AUD patients, liver tissue from the NIAAA mouse model, and astrocyte cultures. Apoptosis-related transcriptional changes were assessed using the BCL2/BAX mRNA ratio. Ethanol exposure was associated with increased expression of ROCK isoforms across several models and tissues. Alterations in ROCK1/ROCK2 expression and in RhoA/ROCK-related transcriptional signatures were accompanied by tissue-specific inflammatory, fibrotic, and apoptosis-related transcriptional changes. These findings suggest that ethanol exposure is associated with alterations in ROCK1/ROCK2 expression and RhoA/ROCK-related transcriptional signatures across different experimental settings. They also support further investigation of the functional relevance of this pathway and its potential implications as a biomarker and therapeutic target in alcohol-related disorders.
1. Introduction
Rho-associated coiled-coil containing protein kinases (ROCK), ROCK1 and ROCK2, are central downstream effectors of the small GTPase RhoA, regulating a broad spectrum of cellular processes, including actin cytoskeleton dynamics, cell motility, apoptosis, and gene expression [1]. Although structurally similar, ROCK1 and ROCK2 exhibit distinct tissue distribution patterns and differential regulatory roles in physiological and pathological contexts [2]. ROCK1 is widely expressed across tissues, whereas ROCK2 is relatively enriched in the central nervous system, suggesting potential isoform-specific functions in neuroimmune responses. Beyond the brain, ROCK2 contributes to liver homeostasis by modulating cytoskeletal organization and stress responses, potentially influencing alcohol-induced metabolic stress and hepatic dysfunction [1,3]. Notably, the Rho/ROCK pathway has been implicated in inflammation, oxidative stress, endothelial dysfunction, and fibrosis [4,5,6,7], processes that are hallmarks of organ damage and are frequently observed in alcohol-related diseases (ARDs). ARDs encompass a spectrum of disorders caused by chronic or acute alcohol consumption, including liver disease, neurodegeneration, and immune dysfunction [8]. Additionally, ROCK kinases have been implicated in cardiovascular disease, diabetes, and cancer [9,10,11], conditions that are also associated with chronic alcohol exposure and commonly co-occur in patients with harmful drinking [12,13].
Alcohol consumption, whether acute or chronic, is a major public health concern worldwide and is associated with a wide array of systemic pathologies [14]. Although the neurotoxic, hepatotoxic, and immunomodulatory effects of ethanol are well documented [15,16,17], the molecular mediators that orchestrate these responses remain incompletely characterized. Ethanol has been shown to impact signaling pathways related to cytoskeletal remodeling, neuroinflammation, and hepatic stress responses [18,19], processes in which the ROCK kinases may play important roles. Recent studies have suggested that modulation of ROCK signaling may be implicated in alcohol-induced intestinal barrier dysfunction [20], brain injury [21], and progression of non-ischemic dilated cardiomyopathy (NIDCM), also known as alcoholic cardiomyopathy (ACM) [22]. These findings highlight the potential involvement of the RhoA/ROCK pathway in mediating cellular responses to alcohol exposure across multiple organ systems. Notably, pharmacological inhibition of ROCK has shown protective effects in preclinical models of alcohol-related neuroinflammation and cardiovascular pathology, further supporting its potential as a therapeutic target [22,23]. Despite these promising findings, further research is needed to delineate tissue-specific functions, isoform selectivity, and downstream effector pathways involved in alcohol-mediated damage.
In this setting, comprehensive assessments of ROCK1 and ROCK2 expression in models of alcohol exposure, across both human and animal systems, remain limited. This gap is particularly relevant given the close relationship between ethanol-induced oxidative stress, inflammatory activation, cytoskeletal remodeling, and tissue injury. To address this issue, we conducted a multi-model, translational investigation aimed at characterizing the expression patterns of ROCK1 and ROCK2 in response to ethanol exposure across diverse biological systems.
This integrative approach, combining clinical samples, in vitro systems, and animal models, provides an opportunity to investigate potential alterations in ROCK signaling across multiple biological compartments and may contribute to a better understanding of its potential involvement in alcohol-related tissue injury.
2. Materials and Methods
2.1. Samples from Patients with Excessive Ethanol Consumption
2.1.1. Samples from Patients with Acute Alcohol Consumption (AAC)
This clinical study included 25 adolescents and young adults with acute alcohol intoxication (13 males and 12 females), who were admitted to the Emergency Department of the University Hospital of Salamanca (Spain) with moderate to severe acute alcohol intoxication, as previously reported [24]. Patients had a mean age of 20.11 years (SD = 4.27). In addition, 23 healthy controls (7 males and 16 females), with a mean age of 23.38 years (SD = 2.92), were independently recruited among medical and nursing students. Controls were selected to represent a broadly similar age and sex profile to the AAC group, although strict individual matching was not performed. Both groups were analyzed only within the AAC-control comparison, and no direct comparison with the AUD cohort was performed. Subjects with chronic or acute illness or medication use were excluded.
Controls did not consume alcohol beyond light sporadic intake, had not consumed alcohol during the 72 h before blood draw, and had not engaged in binge drinking episodes in the past 3 months. These control subjects displayed normal hematological and plasma biochemical parameters and reported no chronic or acute illness. Urine toxicology screening was performed, and patients whose clinical data or history indicated illicit drug use (except cannabis) were excluded from the study.
According to established criteria [25], acute alcohol intoxication was defined by clinical signs, including ataxia, slurred speech, impaired reasoning, or disorientation, a blood alcohol concentration (BAC) > 1 g/L at hospital admission, and consumption of at least five standard drinks (50 g of ethanol) in men or four (40 g) in women during the 6 h preceding admission. The exact interval between the last alcoholic drink and blood collection was not systematically recorded. Exploratory correlation analyses between BAC and ROCK1/ROCK2 mRNA expression were performed in the 25 patients included in the AAC cohort.
Blood samples, including PAXgene Blood RNA tubes, were collected from patients with AAC immediately upon hospital admission and before administration of pharmacological treatment. The study protocol was approved by the corresponding Clinical Research Ethics Committee (CEIm) under approval number PI2025/03/1875, including the deferred-consent procedure. Because patients presented with acute alcohol intoxication and were not always able to provide valid informed consent at admission, written informed consent for research participation and the use of previously collected samples and clinical data was obtained once they had clinically recovered and were able to provide valid consent. If consent was declined, the participant was not included in the study, and the collected samples were used only for clinical purposes. Samples from healthy controls were obtained following an overnight fast and after written informed consent.
2.1.2. Samples from Patients with Alcohol Use Disorder (AUD)
Nine patients (7 males and 2 females) with AUD according to DSM-5 criteria [26], who were referred to the Alcoholism Unit of the University Hospital of Salamanca, were included, together with nine healthy controls selected to represent a broadly similar adult age and sex profile. Strict individual matching was not performed. This cohort was analyzed independently from the AAC cohort, and no direct statistical comparison between AAC and AUD participants was performed.
As previously reported [24], all patients in this group had a pattern of chronic, daily heavy ethanol intake, actively drinking ≥100 g of ethanol per day for at least 5 years before entering the study. All patients had normal prothrombin time, hemoglobin concentration, and serum albumin levels, and tested negative for hepatitis B surface antigen and antibodies to the hepatitis C virus. They did not have any other chronic or acute conditions that could interfere with the study results, nor were they polydrug abusers. Advanced liver disease was excluded based on clinical, analytical, and ultrasonographic assessments: individuals presenting with physical stigmata of chronic liver disease (e.g., cutaneous signs, hepatosplenomegaly, gynecomastia, and/or muscle wasting), liver ultrasonographic findings other than steatosis, or elevated liver transaminases > 2–3 times the reference limits were excluded. In addition, nine healthy volunteers who reported drinking less than 15 g of ethanol per day, with normal results on liver function tests and standard hematologic and biochemical panels, were included (Supplementary Table S2). Before enrolment, all participants provided written informed consent, and the study was approved by the Ethics Committee of the University Hospital of Salamanca under approval number PI2023/07/1389.
Blood samples for hematological and biochemical analyses, as well as PAXgene Blood RNA tubes, were collected from each subject under fasting conditions. Total RNA was then extracted from the PAXgene tubes for PCR expression analyses [15].
2.2. In Vitro Cultures of Peripheral Blood Mononuclear Cells (PBMCs) Exposed to Alcohol
PB samples (20 mL) were obtained from seven healthy donors via venipuncture under aseptic conditions using EDTA-coated Vacutainer® tubes. For PBMC isolation, blood was carefully layered onto 15 mL of Ficoll-Paque™ (Histopaque®-1077) (Sigma-Aldrich, catalog no. 10771; supplied by Merck Life Science S.L., Madrid, Spain) in 50 mL sterile tubes and centrifuged at 400× g for 30 min at room temperature without brake to allow gradient separation. The PBMC layer was collected from the plasma–Ficoll interface. Subsequently, cells were washed with PBS and centrifuged at 300× g for 10 min at 4 °C. Cell pellets were resuspended in pre-warmed DMEM supplemented with 10% FBS, 100 U/mL penicillin, and 100 µg/mL streptomycin. Viable cells were counted using a hemocytometer and trypan blue exclusion.
PBMC cultures were subjected to four experimental conditions: (i) untreated control, (ii) ethanol (50 mM), (iii) LPS (100 ng/mL), and (iv) ethanol (50 mM) plus LPS (100 ng/mL).
The LPS used was derived from Escherichia coli (Serotype 055: B5 strain; Sigma-Aldrich; St. Louis, MO, USA; L5418).
Ethanol and LPS concentrations were selected according to previous experimental studies investigating alcohol-induced modulation of innate immune responses. A concentration of 50 mM ethanol, corresponding to approximately 2.3 g/L, has been extensively used in in vitro models of alcohol exposure, whereas 100 ng/mL LPS represents a commonly used experimental stimulus for TLR4-mediated inflammatory activation in monocytes and macrophages [25,26]. In particular, previous studies have used 50 mM ethanol and 100 ng/mL LPS to investigate alcohol-mediated regulation of inflammatory pathways, including miR-155-dependent responses [25]. These concentrations were used as experimental exposures and should not be interpreted as directly reproducing circulating ethanol or endotoxin concentrations in humans.
Cultures were incubated for 24 h at 37 °C in a sealed Billups-Rothenberg chamber to minimize ethanol evaporation during the experimental period. Following incubation, culture supernatants were collected and centrifuged at 300× g for 10 min; the resulting supernatant was discarded, and cell pellets were retained. Adherent cells were recovered by adding 2 mL of cold PBS directly to each well and gently scraping with a sterile cell scraper. The resulting suspensions were combined with their respective pellets and centrifuged under the same conditions. The final cell pellets were lysed in 200 μL of TRIzol™ Reagent (Invitrogen, Life Technologies Corporation, Carlsbad, CA, USA), homogenized thoroughly, and stored at −80 °C until RNA extraction.
2.3. In Vitro Cultures of Mouse Astrocytes Exposed to Alcohol
2.3.1. Mice
All experimental procedures on animals were performed in accordance with Spanish legislation (RD53/2013) under license from the Spanish government and the European Union (2010/63/EU). Additionally, protocols were approved by the Bioethics Committee of the University of Salamanca. All efforts were made to minimize the number of animals used and ensure minimal suffering. C57BL/6J mice were used in this study. Animals were maintained in specific-pathogen-free facilities at the University of Salamanca under controlled conditions.
The animals were maintained following the protocol as previously described [24], with a 12 h light/dark cycle, 45–65% relative humidity, a temperature of 20–25 °C, and ad libitum access to standard diet and free access to water. Animals were acclimatized to the animal facility conditions for at least one week before the start of the experiments.
2.3.2. Collection and Primary Culture of Astrocytes
Primary cultures of mouse cortical astrocytes were obtained from newborn C57BL/6J male and female mice on postnatal day P0–P1, following the previously described protocol [27]. The cortical tissue was digested with EBSS solution (116 mM NaCl, 5.4 mM KCl, 1.01 mM NaH2PO4, 1.5 mM MgSO4, 26 mM NaHCO3, 4 mM D-glucose, 10 mg/mL phenol red) supplemented with 0.2% (w/v) BSA, 20 µg/mL DNAse I, and 0.05% (w/v) trypsin. The cellular pellet was resuspended in low-glucose DMEM supplemented with 4 mM glutamine, 10% (v/v) fetal bovine serum, and antibiotics (100 U/mL penicillin, 100 µg/mL streptomycin, and 0.25 µg/mL amphotericin B), seeded in 175 cm2 sterile flasks, and incubated at 37 °C with 5% CO2. After 7 days in vitro, the flasks were shaken overnight at 200 rpm to remove non-astrocytic cells. The supernatant was discarded, and the adherent astrocyte-enriched cells were reseeded at 50,000 cells/cm2 in appropriate plates and maintained for an additional 3–4 days before use in experiments. The cell cultures were then incubated for 24 h at 37 °C in a sealed Billups-Rothenberg chamber to minimize ethanol evaporation under the following conditions: (i) untreated control, (ii) ethanol (50 mM), (iii) LPS (100 ng/mL), and (iv) a combination of ethanol (50 mM) and LPS (100 ng/mL). Ethanol and LPS concentrations were selected based on the experimental rationale described in Section 2.2.
After the incubation, the culture medium was removed, and the cells were washed with PBS. Afterward, 300 μL of TRIzol™ Reagent was added to the plates of cell cultures exposed to different experimental conditions. The lysate was pipetted up and down several times to homogenize. Homogenates were then stored at −80 °C until RNA extraction.
2.4. Analysis of Tissues from Mouse and Rat Models of Ethanol Exposure
2.4.1. NIAAA Mouse Model: TISSUE Collection (Liver, Brain, Adipose Tissue, and Duodenum)
Twelve male C57BL/6J mice aged 8–10 weeks were used and maintained under standard laboratory conditions (12 h light/12 h dark cycle, temperature-controlled at 22 ± 2 °C, with ad libitum access to food and water). Animals were randomly assigned to either the ethanol-fed group or the isocaloric control group before initiation of the experimental protocol. Investigators were not blinded to group allocation during the experimental procedures or tissue collection.
To induce alcohol-related liver injury, the NIAAA chronic-plus-binge model was performed as previously described [28], consisting of 5 days of a liquid diet containing 5% ethanol followed by an acute oral dose of ethanol (5 g/kg). Animals were euthanized by an approved method 9 h after the final gavage, and a sterile laparotomy was performed to collect a portion of the left liver lobe for molecular analyses. This time point corresponds to the established experimental protocol used in this model. However, only a single post-gavage time point was evaluated in the present study, and therefore the temporal evolution of ROCK1/ROCK2 expression could not be assessed. The liver tissue was rapidly washed in PBS, cut into small fragments, and immediately snap-frozen in liquid nitrogen and stored at −80 °C until processing. This study was carried out and reported in accordance with the ARRIVE 2.0 guidelines. All procedures on animals adhered to EU Directive 2010/63/EU and Recommendation 2007/526/EC regarding the protection of animals used for experimental and other scientific purposes, as implemented under Spanish Royal Decree 1201/2005.
2.4.2. Rat Model of Operant Alcohol Self-Administration
Twenty-one male Wistar rats (Harlan, Barcelona, Spain), weighing 275–325 g at the start of the experiments, were used. Animals were housed in groups of 4 per cage in a temperature- and humidity-controlled environment (21 ± 1 °C) on a 12 h reverse light/dark cycle (lights off at 08:00 h). Experimental sessions were performed during the dark phase, and food and water were available ad libitum. Animals were acclimatized to the animal facility conditions for at least one week before the beginning of the operant alcohol self-administration protocol.
All research was conducted in strict adherence to the European Directive 2010/63/EU and Royal Decree 53/2013 (BOE, 2013) on the protection of animals used for scientific purposes. The experimental protocol was approved by the Ethics Committee of the Complutense University of Madrid under approval number ES280790000086.
Animals were randomly selected from each home cage and allocated to the experimental conditions, ensuring that both alcohol- and saccharin-exposed animals were represented within each cage.
Operant alcohol self-administration: we followed the same protocol described in [28]. Briefly, the operant alcohol sessions were conducted in eight modular chambers (Med Associates Inc., St. Albans, VT, USA). The chambers were equipped with two retractable levers on either side of a drinking reservoir positioned in the centre of the front panel of the chamber. The levers were counterbalanced to respond as the active lever (delivering 0.1 mL) or as the inactive lever. During the first four days of training, animals received a 1% w/v saccharin solution (Sigma-Aldrich, S.L., Madrid, Spain) in the dipper. Thereafter, the following sequence was used on a fixed-ratio 1 schedule of reinforcement: 0.2% saccharin for three sessions, 0.2% saccharin and 0.2% alcohol for three sessions, 0.16% saccharin and 2% alcohol for three sessions, 0.12% saccharin and 4% alcohol for three sessions, 0.08% saccharin and 6% alcohol for three sessions, 0.04% saccharin and 8% alcohol for three sessions, 0.02% saccharin and 10% alcohol for three sessions and 10% alcohol for eight weeks. Then, the alcohol concentration was increased to 15% for four days and to 20% for the remaining sessions (six weeks). All the operant alcohol sessions lasted 30 min under a fixed-ratio 1 schedule 7 days a week for the entire study. Twelve animals that had access only to saccharin (0.005%) were used as the control group for the gene expression experiments (the calibrator group—i.e., the non-alcohol-treated group). To determine blood alcohol concentrations and for real-time quantitative PCR experiments, blood samples from the rat tail vein were collected in vivo using capillary tubes (Microvette CB 300 K2E; SARSTEDT, Numbrecht, Germany) immediately after the self-administration session. Total RNA was isolated from whole blood using Trizol LS Reagent (Life Technologies, Carlsbad, CA, USA) and was stored at −80 °C. The alcohol concentration in plasma was measured using the EnzyChrom ethanol assay kit following the protocol recommended by the manufacturer (Bioassay Systems, Hayward, CA, USA). All measurements were performed in duplicate, with a mean blood alcohol concentration of 38 mg/dL. This model was designed to reproduce voluntary and repeated alcohol self-administration and reinforcement rather than acute high-level intoxication; therefore, blood alcohol concentrations should not be directly compared with those observed during human binge intoxication.
2.4.3. Sample Size Determination
Sample sizes for the animal experiments were selected based on previous studies using the same established models and on our prior experience with these protocols, while also considering the principle of reduction in animal experimentation. For the human cohorts, sample sizes were determined by the number of eligible biological samples available from previously established and clinically characterized cohorts that fulfilled the predefined inclusion and exclusion criteria. No formal a priori power calculation was performed. Therefore, given the sample sizes available, particularly in the AUD cohort, these analyses should be considered exploratory and hypothesis-generating.
2.4.4. Inclusion and Exclusion Criteria
All animals that completed the experimental protocol were included in the analyses. No animals or biological samples were excluded from the study.
2.5. RNA Extraction, Reverse Transcription and Real-Time PCR (RT-PCR)
The expression of specific mRNAs in PB was determined from PAXgene™ Blood RNA Tubes. Total RNA was extracted using the PAXgene™ Blood RNA Kit (QIAGEN GmbH, Hilden, Germany; 762174) according to the manufacturer’s instructions and stored at −80 °C until analysis. In experiments using astrocytes and PBMCs, total RNA was extracted using TRIzol™ reagent following the manufacturer’s protocol. Total RNA from mouse liver tissue was extracted using the NucleoSpin® RNA kit (MACHEREY-NAGEL GmbH & Co. KG, Düren, Germany; 740955.250), according to the manufacturer’s instructions.
RNA concentration and purity were assessed using a NanoDrop spectrophotometer. cDNA was synthesized using the High-Capacity cDNA Reverse Transcription Kit (Applied Biosystems, Thermo Fisher Scientific Baltics UAB, Vilnius, Lithuania; 4368814). Quantitative real-time PCR was performed using a StepOnePlus™ Real-Time PCR System (Applied Biosystems). Each sample was analyzed in duplicate technical replicates. Primer sequences, annealing temperatures, and amplification efficiencies calculated from standard curves are presented in Supplementary Table S3. Amplification efficiencies ranged from 81.6% to approximately 110.84% and are reported individually in Supplementary Table S3. Primer specificity was verified by analysis of the melting curves, with a single amplification product required for acceptance (Supplementary Figures S1 and S2). Reference genes were selected according to the corresponding biological sample and experimental model. Beta-actin (ACTB) was used for PB samples and astrocytes, whereas tyrosine 3-monooxygenase/tryptophan 5-monooxygenase activation protein (YWHAZ) was used for PBMCs. For mouse tissues, the following reference genes were used for normalization: serine and arginine-rich splicing factor 4 (SRSF4) for brain, duodenum, and liver samples; hypoxanthine phosphoribosyltransferase (Hprt) for visceral and epididymal adipose tissue; and TATA-binding protein (TBP) for peripheral adipose tissue. In rat blood samples obtained from the operant alcohol self-administration model, 18S ribosomal RNA was used as the reference gene [29]. Reference gene selection was based on their previous use and/or validation in studies published by our research group using the corresponding experimental models [24,30]. In addition, candidate reference genes were evaluated in the present study by examining the consistency of their Ct values within and between the corresponding control and experimental groups. Genes exhibiting low Ct variability across biological samples and comparable Ct values between experimental conditions were selected for normalization.
Relative gene expression was calculated using the 2^−ΔΔCt method and expressed relative to the corresponding control group.
Given that ROCK1 and ROCK2 are key downstream effectors of Rho GTPases and participate in pathological processes such as fibrosis, inflammation, endothelial dysfunction, and neuroinflammation, we extended the analysis beyond ROCK1 and ROCK2 expression to include transcriptional profiling of genes related to RhoA/ROCK signaling. Considering the functional redundancy and context-dependent specialization of both isoforms, this approach was intended to characterize RhoA/ROCK-related transcriptional patterns across different tissues rather than to provide a direct measure of ROCK kinase activity. Nucleotide sequences and annealing temperatures of the primers used to assess ROCK1, ROCK2, and related pathway genes, including (i) upstream regulators, (ii) components of the Rho/ROCK signaling network, including Rho guanine nucleotide exchange factors (RhoGEFs), and (iii) downstream transcriptional signatures associated with tissue-specific pathological outcomes, are listed in Supplementary Table S3. This approach was applied to hepatic tissue, PB, and astrocytes, enabling cross-tissue comparison of RhoA/ROCK-related transcriptional signatures.
The present study was designed as an exploratory investigation aimed at characterizing ROCK1/ROCK2 expression and related transcriptional changes across different human and experimental models of alcohol exposure. This initial approach was intended to provide a basis for further mechanistic studies, including those addressing the potential interactions between ROCK signaling and redox regulation. Accordingly, direct measurements of oxidative stress and redox status were not included in the original experimental design.
2.6. Western Blotting
Liver tissue from the NIAAA mouse model was lysed in RIPA buffer supplemented with protease and phosphatase inhibitors. Aliquots containing 40 μg of protein were separated by SDS-PAGE on 12% acrylamide gels and transferred to 0.2 μm nitrocellulose membranes. Membranes were blocked with 5% low-fat milk in PBST for 2 h and incubated overnight at 4 °C with antibodies against ROCK1 (H-11, sc-365628; Santa Cruz Biotechnology, Dallas, TX, USA), ROCK2 (D-11, sc-398519; Santa Cruz Biotechnology), and vinculin (V4504; Sigma-Aldrich), used as a loading control. Membranes were then incubated with the corresponding HRP-conjugated secondary antibodies (#7071 anti-mouse IgG-HRP or #7074 anti-rabbit IgG-HRP; Cell Signaling, Danvers, MA, USA).
Protein bands were visualized using SuperSignal™ West Femto substrate. Densitometric analysis was performed using ImageJ version 1.54g [31], and ROCK1 and ROCK2 signals were normalized to vinculin expression in the same sample. Quantitative results are expressed relative to the mean value of the control group. Western blot analysis was performed using liver samples from three control mice and four ethanol-exposed mice, representing seven independent biological samples from the original experimental groups (n = 5 controls and n = 7 ethanol-exposed mice). Statistical comparisons between control and ethanol-exposed samples were performed using the Mann–Whitney U test. Full uncropped membrane images are provided in Supplementary Figure S3.
2.7. Statistical Analysis
In Supplementary Tables S1 and S2, quantitative variables are expressed as the mean (standard deviation [SD]), while qualitative variables are expressed as absolute (n) and relative (%) frequencies. In the qPCR analysis, all data are presented as the mean (standard error of the mean [SEM]). Ct values were normalized to a reference gene. Parametric or non-parametric tests were selected according to data distribution and sample size. Differences between two independent groups were assessed using the Mann–Whitney U test, whereas comparisons involving more than two groups were analyzed using one-way ANOVA followed by Dunnett’s multiple-comparisons test, where appropriate.
For in vitro experiments involving PBMCs and primary astrocytes exposed to ethanol (EtOH) and lipopolysaccharide (LPS), two-way ANOVA was used to evaluate the main effects of EtOH and LPS and their interaction (EtOH × LPS).
To account for multiple testing across transcriptional endpoints, the Benjamini–Hochberg false discovery rate (BH-FDR) procedure was applied separately within each experimental model. For human peripheral blood and mouse liver, adjustments were performed both within predefined functional gene families and across all genes analyzed within each model. For the two-way ANOVA analyses, BH-FDR correction was applied separately to the EtOH and LPS main effects and their interaction across genes within each experimental system.
For genes showing an EtOH × LPS interaction that remained statistically significant after BH-FDR correction, subsequent simple-effects comparisons were performed using the Šídák method (EtOH vs. Control, LPS vs. Control, EtOH + LPS vs. LPS, and EtOH + LPS vs. EtOH). In both PBMCs and primary astrocytes, comparisons of individual treatments against the control group were additionally adjusted using Dunnett’s procedure. Post hoc adjustments were performed separately within each gene.
Both raw and adjusted p-values are reported in the corresponding Supplementary Tables, with adjusted p-values ≤ 0.05 considered statistically significant. Where appropriate, effect estimates and their 95% confidence intervals were also reported to complement hypothesis-testing results.
Exploratory associations between BAC at admission and ROCK1 and ROCK2 mRNA expression in the AAC cohort were assessed using Spearman’s rank correlation coefficient. p-values were adjusted for the two comparisons using the Benjamini–Hochberg false discovery rate procedure.
All statistical analyses were performed using GraphPad Prism software version 8.0, with specific details provided in the figure legends. Gene expression analyses were performed using coded samples, so the identity of the experimental group was not available during qPCR processing and initial data analysis. However, formal blinding was not implemented during all stages of sample collection, tissue dissection, animal procedures, or cell-culture experiments. Therefore, although coding was used for gene-expression analyses, the study was not fully blinded.
3. Results
3.1. Characteristics of the Study Cohort
Patients with AUD and AAC
The main demographic and clinical characteristics of the AAC and AUD cohorts and their respective control groups are summarized in the corresponding Supplementary Tables S1 and S2. The two cohorts represent different patterns of alcohol exposure and were analyzed independently. Therefore, no direct comparison between AAC and AUD participants was performed.
In the AUD group, the mean daily alcohol consumption was 146 g (SD = 12.0), with a chronic intake history of at least five years. Biochemical analyses revealed significantly elevated serum levels of aspartate aminotransferase (AST), alanine aminotransferase (ALT), and alkaline phosphatase (ALP). AST and GGT levels were also significantly elevated in AAC patients compared with their control counterparts. Finally, AAC patients exhibited significantly higher total leukocyte counts than their controls.
3.2. Expression of ROCKs in the Peripheral Blood (PB) of AAC and AUD Patients
When assessing ROCK1 and ROCK2 gene expression levels in PB of patients with AAC and AUD, a significant increase in both isoforms was observed compared to their respective control groups (Figure 1A–D). These results demonstrate altered ROCK1 and ROCK2 expression in PB across different alcohol-exposure paradigms.
Figure 1.
Relative mRNA expression of ROCK1 and ROCK2 in peripheral blood (PB) of patients with acute alcohol consumption (AAC), alcohol use disorder (AUD), and healthy controls. ROCK1 and ROCK2 expression in AAC patients compared with healthy controls (A,B) and in AUD patients compared with healthy controls (C,D). Data are presented as relative expression compared with the corresponding control group (mean ± SEM). Differences between groups were assessed using the Mann–Whitney U test, with p-values adjusted using the Benjamini–Hochberg false discovery rate (BH-FDR) procedure within each cohort. Raw p-values, model-wide BH-FDR-adjusted p-values, effect sizes (rank-biserial correlation, r_rb), and 95% confidence intervals (95% CI) were as follows: (A) ROCK1, p = 0.001, adjusted p = 0.002, r_rb = 0.704 (95% CI: 0.430–0.870); (B) ROCK2, p = 0.050, adjusted p = 0.050, r_rb = 0.540 (95% CI: 0.180–0.770); (C) ROCK1, p = 0.00185, adjusted p = 0.0162, r_rb = 0.827 (95% CI: 0.506–1.000); and (D) ROCK2, p = 0.0006, adjusted p = 0.0102, r_rb = 0.917 (95% CI: 0.694–1.000). AAC: controls, n = 23; patients, n = 25. AUD: controls, n = 9; patients, n = 9. Complete statistical results are provided in Supplementary Tables S4 and S5.
To complement the statistical comparisons, effect sizes and their corresponding 95% confidence intervals were calculated for gene expression changes in PB from patients with AAC and AUD and in liver tissue from alcohol-exposed mice (Supplementary Table S4). In patients with AAC and AUD, ROCK1 and ROCK2 showed moderate to large effect sizes, consistent with the observed differences in gene expression between groups.
To account for multiple testing across transcriptional endpoints, BH-FDR correction was applied within predefined functional gene families and across all genes analyzed within each experimental model (Supplementary Table S5). In the AAC cohort, ROCK1 remained significant after adjustment (BH-FDR-adjusted p = 0.002), whereas ROCK2 showed a borderline adjusted p-value (p = 0.050). In the AUD cohort, ROCK1, ROCK2, and BAX remained significant after model-wide BH-FDR correction. Several other genes showed nominal associations that did not remain significant after model-wide adjustment (Supplementary Table S5).
All patients included in the AAC cohort had a BAC >1 g/L at admission, consistent with the predefined inclusion criteria. The mean BAC was 2.30 ± 0.56 g/L. An exploratory Spearman correlation analysis was performed to assess the association between admission BAC and ROCK1 and ROCK2 mRNA expression. Negative correlations were observed between BAC and ROCK1 (ρ = −0.199; p = 0.3402) and ROCK2 (ρ = −0.393; p = 0.0519) expression. However, neither correlation reached statistical significance, either before or after BH-FDR correction (adjusted p = 0.3402 and 0.1039 for ROCK1 and ROCK2, respectively) (Supplementary Figure S4).
3.3. Expression of ROCKs in PBMCs Exposed to Alcohol and LPS
The analysis of gene expression levels of ROCK1 and ROCK2 in PBMCs exposed to different in vitro treatments revealed a significant increase in ROCK1 expression only in cells simultaneously exposed to ethanol and LPS, compared to the control condition (Figure 2A).
Figure 2.
Relative mRNA expression of ROCK1 and ROCK2 in PBMCs exposed to different in vitro treatments. PBMCs were treated with ethanol (EtOH), lipopolysaccharide (LPS), or a combination of both (EtOH + LPS). Panel (A) shows ROCK1 expression; panel (B) shows ROCK2 expression under the indicated conditions. Data are presented as mean ± SEM from seven independent experiments (n = 7), each performed using PBMCs obtained from a different donor. Statistical differences were assessed using two-way ANOVA to evaluate the main effects of EtOH and LPS and their interaction (EtOH × LPS), with p-values adjusted across genes using the Benjamini–Hochberg false discovery rate (BH-FDR) procedure separately for each ANOVA term. A significant EtOH × LPS interaction was observed for ROCK1 (p = 0.0247, BH-FDR-adjusted p = 0.0494, partial η2 = 0.354, 95% CI: 0.0005–0.651), but not for ROCK2 (p = 0.6486, BH-FDR-adjusted p = 0.6486, partial η2 = 0.020, 95% CI: 0.000–0.342). Post hoc analyses were performed using Dunnett’s multiple-comparisons test for comparisons against the control group and Šídák-adjusted simple-effects comparisons to characterize the significant interaction. For ROCK1, significant differences were observed between EtOH + LPS and Control (Dunnett-adjusted p = 0.0166, adjusted 95% CI: 0.467–4.587), EtOH + LPS and LPS (Šídák-adjusted p = 0.0146, adjusted 95% CI: 0.515–5.004), and EtOH + LPS and EtOH (Šídák-adjusted p = 0.0239, adjusted 95% CI: 0.309–4.798). For ROCK2, no significant differences were observed between the treatment groups and the control group (Dunnett-adjusted p = 0.9785 for EtOH, p = 1.0000 for LPS, and p = 0.6675 for EtOH + LPS). ns, not significant, based on multiplicity-adjusted post hoc comparisons. Complete statistical results are provided in Supplementary Tables S6–S8.
To evaluate the effects of ethanol and LPS on ROCK1 and ROCK2 expression in PBMCs, a two-way ANOVA was performed (Table S6). A significant EtOH × LPS interaction was observed for ROCK1 expression (p = 0.0247, BH-FDR-adjusted p = 0.0494, partial η2 = 0.354), whereas no significant interaction was detected for ROCK2 (p = 0.6486). Subsequent Šídák-adjusted comparisons showed that ROCK1 expression was significantly higher following combined EtOH + LPS exposure than following LPS alone (mean difference = 2.760, adjusted p = 0.0146) or EtOH alone (mean difference = 2.553, adjusted p = 0.0239) (Table S7). Dunnett-adjusted comparisons also showed significantly higher ROCK1 expression following combined EtOH + LPS exposure compared with the control condition (adjusted p = 0.0166), whereas neither EtOH nor LPS alone significantly altered ROCK1 expression compared with the control condition (Table S8). No significant differences in ROCK2 expression were observed between the treatment groups and the control condition (Table S8).
3.4. Expression of ROCKs in Tissues from Rodent Models
To assess the translational relevance of our findings and to explore the response of ROCK1 and ROCK2 kinases in tissues other than blood, we analyzed ROCK expression across various tissues from rodent models.
3.4.1. Expression of ROCKs in In Vitro Cultures of Mouse Astrocytes Exposed to Alcohol
Given that alcohol can induce neuroinflammation and central nervous system injury, we evaluated ROCK1 and ROCK2 expression in primary mouse astrocyte cultures exposed to various treatments. This analysis revealed a significant increase in both isoforms only in cells treated simultaneously with ethanol and LPS, compared to the control condition (ROCK1: Dunnett-adjusted p = 0.0240, adjusted 95% CI: 0.223–3.348; ROCK2: Dunnett-adjusted p = 0.0195, adjusted 95% CI: 0.687–8.071; Figure 3A,B). Two-way ANOVA revealed a significant EtOH × LPS interaction for ROCK1 (p = 0.000839, BH-FDR-adjusted p = 0.00671, partial η2 = 0.471, 95% CI: 0.126–0.689), but not for ROCK2 (p = 0.05132, BH-FDR-adjusted p = 0.16422, partial η2 = 0.230, 95% CI: 0.000–0.539). Subsequent Šídák-adjusted comparisons showed that ROCK1 expression was significantly higher following combined EtOH + LPS exposure than following LPS alone (mean difference = 2.487, adjusted p = 0.00108) or EtOH alone (mean difference = 2.608, adjusted p = 0.00067). The increase in ROCK1 expression parallels our findings in PBMCs subjected to the same experimental conditions, whereas ROCK2 expression differed between the two cellular models. These findings suggest that ethanol and LPS may similarly influence ROCK1 expression in PBMCs and astrocytes in response to combined alcohol-associated inflammatory stimuli.
Figure 3.
Relative mRNA expression of ROCK1 and ROCK2 in primary mouse astrocytes under different in vitro treatments. Primary astrocyte cultures were treated with ethanol (EtOH), lipopolysaccharide (LPS), or a combination of both (EtOH + LPS). Panel (A) shows ROCK1 expression, and panel (B) shows ROCK2 expression. Data are presented as mean ± SEM from six independent experiments (n = 6). Statistical differences were assessed using two-way ANOVA to evaluate the main effects of EtOH and LPS and their interaction (EtOH × LPS), with p-values adjusted across genes using the Benjamini–Hochberg false discovery rate (BH-FDR) procedure separately for each ANOVA term. Dunnett’s multiple-comparisons test was used for comparisons against the control group, and Šídák-adjusted simple-effects comparisons were performed to characterize the significant interaction for ROCK1. A significant EtOH × LPS interaction was observed for ROCK1 (p = 0.000839, BH-FDR-adjusted p = 0.00671, partial η2 = 0.471, 95% CI: 0.126–0.689), but not for ROCK2 (p = 0.05132, BH-FDR-adjusted p = 0.16422, partial η2 = 0.230, 95% CI: 0.000–0.539). For ROCK1, significant differences were observed between EtOH + LPS and Control (Dunnett-adjusted p = 0.0240, adjusted 95% CI: 0.223–3.348), EtOH + LPS and LPS (Šídák-adjusted p = 0.00108, adjusted 95% CI: 0.821–4.154), and EtOH + LPS and EtOH (Šídák-adjusted p = 0.00067, adjusted 95% CI: 0.941–4.274). For ROCK2, expression was significantly higher in the EtOH + LPS group than in the control group (Dunnett-adjusted p = 0.0195, adjusted 95% CI: 0.687–8.071), whereas neither EtOH nor LPS alone differed significantly from Control (Dunnett-adjusted p = 0.9974 and p = 1.0000, respectively). Statistical significance was defined as adjusted p < 0.05; ns, not significant. Complete statistical results are provided in Supplementary Tables S9–S11.
3.4.2. Expression of ROCKs in Tissues of the NIAAA Mouse Model
Considering the central role of the liver in alcohol metabolism and the contribution of the Rho/ROCK pathway to alcohol-induced tissue injury, ROCK1 and ROCK2 expression were evaluated in multiple tissues from the NIAAA mouse model. A significant increase in ROCK1 expression was observed in duodenal tissue, whereas ROCK2 expression was significantly increased in both brain and duodenum of mice fed the alcohol diet compared with controls (Figure 4A–D). In other tissues, although no significant differences were detected, a trend toward increased expression of both ROCK isoforms was noted (Figure 4E–H and Figure 5A,B).
Figure 4.
Relative mRNA expression of ROCK1 and ROCK2 in diverse tissues from mice subjected to the NIAAA chronic ethanol model. Gene expression levels of ROCK1 and ROCK2 were measured in the brain (A,B), duodenum (C,D), peripheral fat (E,F), and visceral fat (G,H). Data are presented as relative expression compared with the control group (mean ± SEM). Differences between groups were assessed using the Mann–Whitney U test. Exact p-values are indicated in the corresponding panels; ns, not significant (p ≥ 0.05). Control group, n = 5; NIAAA alcohol-fed mice group, n = 7.
Figure 5.
ROCK1 and ROCK2 expression in liver tissue from mice subjected to the NIAAA ethanol model. (A,B) Relative mRNA expression of ROCK1 and ROCK2 in liver tissue, respectively. (C,D) Representative Western blot images of ROCK1 and ROCK2 protein expression, respectively. (E,F) Corresponding densitometric quantification of ROCK1 and ROCK2 protein levels normalized to vinculin (loading control) and expressed relative to the mean of the control group (set to 1). Lanes 1–3, control samples (EtOH (−); 69/70/71); lanes 4–7, samples from mice subjected to the NIAAA ethanol model (EtOH (+); 45/47/48/51). For mRNA expression analysis, the initial sample sizes were n = 5 controls and n = 7 NIAAA alcohol-fed mice. For Western blot analysis, the control group comprised n = 3 mice and the NIAAA alcohol-fed group n = 4 mice. Quantitative data are presented as mean ± SEM. Statistical comparisons were performed using the two-tailed exact Mann–Whitney U test. For mRNA expression, the raw p-values, model-wide Benjamini–Hochberg false discovery rate (BH-FDR)-adjusted p-values, effect sizes (rank-biserial correlation, r_rb), and bootstrap percentile 95% confidence intervals (95% CI) were as follows: ROCK1, p = 0.1905, adjusted p = 0.3810, r_rb = 0.600 (95% CI: −0.200–1.000), and ROCK2, p = 0.0635, adjusted p = 0.1693, r_rb = 0.800 (95% CI: 0.200–1.000). Neither ROCK1 nor ROCK2 protein expression differed significantly between groups (p = 0.0571 for both). Complete mRNA statistical results are provided in Supplementary Tables S4 and S5. Full uncropped membranes are provided in Supplementary Figure S3.
Consistent with these results, protein analysis revealed numerically higher ROCK1 and ROCK2 levels in liver samples from animals exposed to the alcohol diet (Figure 5C–F and Supplementary Figure S3). Densitometric analysis showed a 2.58-fold increase in ROCK1 and a 2.56-fold increase in ROCK2 protein expression compared with controls (Figure 5E,F), although these differences did not reach statistical significance. These findings suggest a trend toward increased hepatic ROCK1 and ROCK2 protein expression following chronic-plus-binge ethanol exposure, consistent with the direction of the observed changes at the transcriptional level.
3.4.3. ROCK Expression in an Experimental Rat Model of Chronic Operant Alcohol Self-Administration
When assessing ROCK1 and ROCK2 gene expression levels in PB from an experimental rat model of chronic alcohol intake, a statistically significant increase in both isoforms was observed compared with control animals, demonstrating altered ROCK expression under chronic ethanol exposure conditions (Figure 6A,B). Notably, these findings are consistent with those observed in PB from patients with AAC and AUD, suggesting similar changes in ROCK expression across different patterns of ethanol exposure.
Figure 6.
Relative mRNA expression of ROCK1 and ROCK2 in peripheral blood (PB) of the rat model of chronic operant alcohol self-administration. Gene expression levels of ROCK1 (A) and ROCK2 (B) were measured in PB from rats subjected to chronic operant alcohol self-administration. Data are presented as relative expression compared with the control group (mean ± SEM). Differences between groups were assessed using the Mann–Whitney U test. Exact p-values are indicated in the corresponding panels; ns, not significant (p ≥ 0.05). Control group, n = 12; chronic operant alcohol self-administration group, n = 9.
3.5. Pathway-Level Gene Expression Analysis of Rho/ROCK Signaling
3.5.1. Alterations in RhoA/ROCK-Related Gene Expression in Peripheral Blood (PB) of Patients with AUD
In PB samples from AUD patients, increased expression of ROCK pathway activators was observed, specifically coagulation factor II (F2; prothrombin) and lysophosphatidic acid receptor 1 (LPAR1), which showed nominal statistical significance (F2: p = 0.027; LPAR1: p = 0.0142), but did not remain significant after BH-FDR correction (adjusted p = 0.0918 and p = 0.0604, respectively; Figure 7A). Within the Rho/ROCK signaling core, the guanine nucleotide exchange factor ARHGEF1 also showed increased expression (nominal p = 0.050; BH-FDR-adjusted p = 0.1214; Figure 7B). Analysis of downstream transcriptional signatures showed an overall pattern of increased expression across several assessed genes; however, none remained statistically significant after BH-FDR correction, including prostaglandin-endoperoxide synthase 2 (PTGS2; nominal p = 0.050; BH-FDR-adjusted p = 0.1214; Figure 7C).
Figure 7.
Relative mRNA expression of RhoA/ROCK-related transcriptional signatures in PB from patients with AUD. (A) Expression of ROCK pathway activators: coagulation factor II (F2; prothrombin), coagulation factor II (thrombin) receptor (F2R), sphingosine-1-phosphate receptor (S1PR), and lysophosphatidic acid receptor 1 (LPAR1). (B) Expression of core RhoA/ROCK signaling components, including Rho guanine nucleotide exchange factors (RhoGEFs; ARHGEF1, ARHGEF2, ARHGEF8, and ARHGEF11). (C) Expression of inflammatory and endothelial-related transcriptional markers: C–C motif chemokine ligand 2 (CCL2), C–X–C motif chemokine ligand 8 (CXCL8), interleukin 1 beta (IL1B), prostaglandin-endoperoxide synthase 2 (PTGS2), and E-selectin. (D) Expression of the pro- and anti-apoptotic markers BAX and BCL2. Data are presented as relative expression compared with the control group (mean ± SEM). Differences between groups were assessed using the Mann–Whitney U test, followed by Benjamini–Hochberg false discovery rate (BH-FDR) correction across all genes analyzed within the AUD model. Effect sizes are expressed as rank-biserial correlation coefficients (r_rb), with 95% confidence intervals (95% CI). For genes showing nominal statistical significance, the corresponding results were as follows: F2, p = 0.027, r_rb = 0.640 (95% CI: 0.170–1.000); LPAR1, p = 0.0142, r_rb = 0.679 (95% CI: 0.259–0.951); and BAX, p = 0.0078, r_rb = 0.728 (95% CI: 0.333–1.000). ARHGEF1 and PTGS2 each had a reported nominal p-value of 0.050, with r_rb = 0.556 (95% CI: 0.062–0.951) and r_rb = 0.556 (95% CI: 0.086–0.951), respectively. After BH-FDR correction across the AUD model, only BAX remained statistically significant (adjusted p = 0.0442), whereas F2 (adjusted p = 0.0918), LPAR1 (adjusted p = 0.0604), ARHGEF1 (adjusted p = 0.1214), and PTGS2 (adjusted p = 0.1214) did not. Exact BH-FDR-adjusted p-values are indicated in the corresponding panels. Statistical significance was defined as adjusted p < 0.05. Complete effect sizes, 95% confidence intervals, and raw and adjusted p-values for all genes are provided in Supplementary Tables S4 and S5. Control group, n = 9; AUD group, n = 9.
In the AUD cohort, the analysis of effect sizes showed positive estimates for F2 (0.640, 95% CI: 0.170–1.000), LPAR1 (0.679, 95% CI: 0.259–0.951), ARHGEF1 (0.556, 95% CI: 0.062–0.951), PTGS2 (0.556, 95% CI: 0.086–0.951), and BAX (0.728, 95% CI: 0.333–1.000). In contrast, several other genes exhibited smaller effect estimates (Supplementary Tables S4 and S5). In addition, BAX expression was significantly elevated and remained significant after BH-FDR correction (nominal p = 0.0078; adjusted p = 0.0442; Figure 7D).
3.5.2. Alterations in RhoA/ROCK-Related Gene Expression in Hepatic Tissue from the NIAAA Mouse Model
In hepatic tissue from the NIAAA mouse model, changes in the expression of ROCK pathway activators, including transforming growth factor-beta (TGF-β), angiotensin II (Ang II), and endothelin-1 (ENDO1), did not reach statistical significance (Figure 8A). Within the Rho/ROCK signaling core, the Rho guanine nucleotide exchange factors ARHGEF1 and ARHGEF2 showed nominally significant increases in expression (p = 0.030 and p = 0.031, respectively), although these changes did not remain significant after model-wide BH-FDR correction (Figure 8B). Analysis of downstream transcriptional signatures revealed significant increases in the expression of C-X-C motif chemokine ligand 1 (CXCL1), C-C motif chemokine ligand 2 (CCL2), and fibronectin 1 (FN1), genes associated with inflammatory and fibrotic responses (Figure 8C). However, only CXCL1 and CCL2 remained statistically significant after model-wide BH-FDR correction. In contrast, no significant changes were observed in the expression of the apoptotic markers BAX or BCL2 under alcohol exposure conditions (Figure 8D).
Figure 8.
Relative mRNA expression of RhoA/ROCK-related transcriptional signatures in hepatic tissue from the NIAAA mouse model. (A) Expression of ROCK pathway activators: transforming growth factor-beta (TGF-β), angiotensin II (Ang II), and endothelin-1 (ENDO1). (B) Expression of core RhoA/ROCK signaling components, including Rho guanine nucleotide exchange factors (RhoGEFs; ARHGEF1, ARHGEF2, ARHGEF8, and ARHGEF11). (C) Expression of transcriptional markers associated with hepatic inflammatory and fibrotic responses: C-X-C motif chemokine ligand 1 (CXCL1), C-C motif chemokine ligand 2 (CCL2), fibronectin 1 (FN1), actin alpha 2, smooth muscle (ACTA2), and collagen type I (COL1). (D) Expression of the pro- and anti-apoptotic markers BAX and BCL2. Data are presented as mean ± SEM. Differences between groups were assessed using the Mann–Whitney U test, followed by Benjamini–Hochberg false discovery rate (BH-FDR) correction across all genes analyzed within the liver model. Effect sizes are expressed as rank-biserial correlation coefficients (r_rb), with 95% confidence intervals (95% CI). For genes showing nominal statistical significance, the corresponding results were as follows: ARHGEF1, p = 0.030, r_rb = 0.771 (95% CI: 0.314–1.000); ARHGEF2, p = 0.031, r_rb = 0.771 (95% CI: 0.314–1.000); CXCL1, p = 0.0025, r_rb = 1.000 (conservative 95% CI: −0.044–1.000); CCL2, p = 0.0025, r_rb = 1.000 (conservative 95% CI: −0.044–1.000); and FN1, p = 0.012, r_rb = 0.929 (95% CI: 0.571–1.000). The maximum observed effect sizes for CXCL1 and CCL2 reflect complete separation between groups. For these two genes, conservative confidence intervals were estimated using the exact Clopper–Pearson method based on five independent between-group pairs and transformed to the rank-biserial correlation scale. After BH-FDR correction across the liver model, only CXCL1 and CCL2 remained statistically significant (adjusted p = 0.0240 for both), whereas ARHGEF1 (adjusted p = 0.0992), ARHGEF2 (adjusted p = 0.0992), and FN1 (adjusted p = 0.0640) did not. Exact BH-FDR-adjusted p-values are indicated in the corresponding panels. Statistical significance was defined as adjusted p < 0.05. Complete statistical results are provided in Supplementary Tables S4 and S5. Control group, n = 5; NIAAA alcohol-fed group, n = 7.
In liver tissue, large positive effect sizes were observed for ARHGEF1 (r_rb = 0.771, 95% CI: 0.314–1.000), ARHGEF2 (r_rb = 0.771, 95% CI: 0.314–1.000), CXCL1 (r_rb = 1.000, conservative 95% CI: −0.044–1.000), CCL2 (r_rb = 1.000, conservative 95% CI: −0.044–1.000), and FN1 (r_rb = 0.929, 95% CI: 0.571–1.000). The maximum observed effect sizes for CXCL1 and CCL2 reflected complete separation between the alcohol-exposed and control groups. In contrast, several other genes, including BAX and BCL2, showed confidence intervals spanning zero, indicating uncertainty regarding the direction and magnitude of the observed effects (Supplementary Table S4).
In addition, BH-FDR correction was applied both within functional gene families and across all transcriptional endpoints analyzed in the liver model. CXCL1 and CCL2 remained statistically significant after model-wide adjustment (BH-FDR-adjusted p = 0.024 for both genes). Although FN1 remained significant after adjustment within its functional gene family (adjusted p = 0.0200), this association did not remain significant after model-wide correction (adjusted p = 0.0640). Other nominally significant transcriptional changes, including ARHGEF1 and ARHGEF2, also did not survive model-wide BH-FDR adjustment (adjusted p = 0.0992 for both genes) (Supplementary Table S5).
3.5.3. RhoA/ROCK-Related Gene Expression in Astrocytes Under Different In Vitro Treatments
Gene expression analyses in astrocytes exposed to different experimental conditions revealed a general upward trend in the expression of most evaluated genes under the combined ethanol and LPS (EtOH + LPS) condition (Figure 9). Statistically significant increases were observed in the expression of the ROCK pathway activators sphingosine-1-phosphate receptor (S1PR) and lysophosphatidic acid receptor 1 (LPAR1) following combined EtOH + LPS exposure compared with controls (Figure 9A). Within the Rho/ROCK signaling core, ARHGEF1 was also significantly upregulated under the same conditions (Figure 9B). Analysis of downstream transcriptional signatures demonstrated a significant increase in the chemokine CCL2, whereas CXCL1 showed an increase that did not reach statistical significance after Dunnett adjustment (Figure 9C). In addition, expression of the apoptotic markers BAX and BCL2 was significantly increased exclusively in the EtOH + LPS condition compared with controls (Figure 9D). Two-way ANOVA was performed to evaluate the effects of EtOH, LPS, and their interaction on gene expression in primary astrocytes. After BH-FDR correction across genes, significant main effects of LPS were observed for ROCK1, S1PR, LPAR1, ARHGEF1, ARHGEF2, CXCL1, IL1B, ICAM1, BAX, and BCL2, whereas no significant main effects of EtOH remained after adjustment. Significant EtOH × LPS interactions were identified for ROCK1 and BCL2, indicating that the effect of ethanol on the expression of these genes depended on the presence of LPS (Supplementary Table S9).
Figure 9.
Relative mRNA expression of RhoA/ROCK-related transcriptional signatures in primary mouse astrocytes exposed to ethanol and/or LPS. (A) Expression of ROCK pathway activators: sphingosine-1-phosphate receptor (S1PR) and lysophosphatidic acid receptor 1 (LPAR1). (B) Expression of core RhoA/ROCK signaling components, including Rho guanine nucleotide exchange factors (RhoGEFs; ARHGEF1, ARHGEF2, ARHGEF8, and ARHGEF11). (C) Expression of inflammatory and astrocyte reactivity-related transcriptional markers: C-X-C motif chemokine ligand 1 (CXCL1), C-C motif chemokine ligand 2 (CCL2), interleukin 1 beta (IL1B), prostaglandin-endoperoxide synthase 2 (PTGS2), intercellular adhesion molecule 1 (ICAM1), and vascular cell adhesion molecule 1 (VCAM1). (D) Expression of the pro- and anti-apoptotic markers BAX and BCL2. Data are presented as mean ± SEM from six independent experiments (n = 6). Statistical differences were assessed using two-way ANOVA to evaluate the main effects of ethanol (EtOH) and lipopolysaccharide (LPS) and their interaction (EtOH × LPS). p-values for each ANOVA term were adjusted across genes using the Benjamini–Hochberg false discovery rate (BH-FDR) procedure. A significant EtOH × LPS interaction was observed for BCL2 (p = 0.000179, BH-FDR-adjusted p = 0.00287, partial η2 = 0.479, 95% CI: 0.167–0.679). For BCL2, significant differences were observed between EtOH + LPS and LPS (Šídák-adjusted p = 0.0000709, adjusted 95% CI: 1.698–5.056) and between EtOH + LPS and EtOH (Šídák-adjusted p = 0.0000372, adjusted 95% CI: 1.866–5.224). S1PR and PTGS2 showed nominally significant EtOH × LPS interactions that did not remain significant after BH-FDR correction (adjusted p = 0.05936 for both genes). Significant LPS main effects after BH-FDR correction were observed for S1PR, LPAR1, ARHGEF1, ARHGEF2, CXCL1, IL1B, ICAM1, BAX, and BCL2. Comparisons of individual treatment conditions against the control group were performed using Dunnett’s multiple-comparisons test. Significant differences relative to Control were observed for S1PR (EtOH + LPS, adjusted p = 0.0045), LPAR1 (EtOH + LPS, adjusted p = 0.0273), ARHGEF1 (LPS, adjusted p = 0.0173; EtOH + LPS, adjusted p = 0.0140), CCL2 (EtOH + LPS, adjusted p = 0.0328), IL1B (LPS, adjusted p = 0.0310), BAX (EtOH + LPS, adjusted p = 0.0064), and BCL2 (EtOH + LPS, adjusted p = 0.0003). Exact Dunnett-adjusted p-values are indicated for comparisons against the control group in the corresponding panels; ns, not significant (adjusted p ≥ 0.05). Complete statistical results, including effect sizes, 95% confidence intervals, and adjusted p-values, are provided in Supplementary Tables S9–S11.
Subsequent Šídák-adjusted simple-effects comparisons were performed for ROCK1 and BCL2, the two genes showing significant EtOH × LPS interactions after BH-FDR correction. For ROCK1, expression was significantly higher following combined EtOH + LPS exposure than following LPS alone (mean difference = 2.487, adjusted p = 0.00108) or EtOH alone (mean difference = 2.608, adjusted p = 0.00067). Similarly, BCL2 expression was significantly higher following combined EtOH + LPS exposure than following LPS alone (mean difference = 3.377, adjusted p = 0.0000709) or EtOH alone (mean difference = 3.545, adjusted p = 0.0000372). Neither EtOH nor LPS alone significantly altered ROCK1 or BCL2 expression compared with the control condition (Supplementary Table S10).
Additional Dunnett-adjusted comparisons against the control group showed significant increases in ARHGEF1 and IL1B expression following LPS exposure. Combined EtOH + LPS exposure was associated with significant increases in ROCK1, ROCK2, S1PR, LPAR1, ARHGEF1, CCL2, BAX, and BCL2 expression compared with controls. No significant differences were observed following EtOH exposure alone (Supplementary Table S11).
To assess the transcriptional balance between pro- and anti-apoptotic markers across tissues, the BCL2/BAX mRNA ratio was analyzed. In PB samples from patients with AUD, a significant decrease (p = 0.0111) in the BCL2/BAX mRNA ratio was observed, suggesting a shift toward a pro-apoptotic transcriptional profile (Figure 10A). In contrast, no significant changes in this ratio were observed in liver tissue from the NIAAA mouse model or in astrocytes under the experimental conditions analyzed (Figure 10B,C).
Figure 10.
BCL2/BAX mRNA ratio in peripheral blood, liver, and astrocytes under alcohol exposure. (A) BCL2/BAX mRNA ratio in peripheral blood (PB) samples from patients with alcohol use disorder (AUD) and healthy controls. (B) BCL2/BAX mRNA ratio in hepatic tissue from mice subjected to the NIAAA ethanol model. (C) BCL2/BAX mRNA ratio in primary mouse astrocytes exposed to ethanol (EtOH), lipopolysaccharide (LPS), or their combination (EtOH + LPS). Boxplots show the median (center line), interquartile range (box), and minimum and maximum values (whiskers). Exact p-values are indicated for the corresponding comparisons. Statistical significance was defined as p < 0.05. Non-significant comparisons are indicated as ns, where shown. PB: control group, n = 9; AUD group, n = 9. Liver: control group, n = 5; NIAAA alcohol-fed group, n = 7. Astrocytes: six independent experiments (n = 6).
4. Discussion
Our findings showed alterations in ROCK1 and/or ROCK2 expression across several models in response to ethanol exposure. Increased expression of one or both isoforms was observed in human subjects with acute or chronic alcohol exposure, in vitro models involving PBMCs and astrocytes, and tissues from animal models. However, because these experimental paradigms differ in species, tissues, doses, and exposure conditions, the specific contribution of exposure duration to ROCK1/ROCK2 expression cannot be determined from the present study.
These observations suggest an association between alcohol exposure and RhoA/ROCK-related transcriptional changes across different biological systems, although their functional relevance remains to be established.
Ethanol is also well known to induce oxidative stress, and previous studies have shown that ethanol can activate RhoA/ROCK signaling in animal models, including mouse intestinal epithelial cells [20] and lung parenchymal tissue [32].
Importantly, the multiple-testing analysis provided additional support for ROCK1 and ROCK2 alterations in the human cohorts, although the strength of the statistical evidence varied across models and isoforms. These findings support the relevance of ROCK-related transcriptional changes following alcohol exposure, while emphasizing the need to distinguish FDR-supported associations from exploratory observations.
Consistent with the transcriptional findings, densitometric analysis showed numerically higher hepatic ROCK1 and ROCK2 protein levels in alcohol-exposed mice compared with controls. Although these differences did not reach statistical significance, the concordant direction of changes at the mRNA and protein levels suggests a possible increase in hepatic ROCK expression following chronic ethanol exposure. However, the limited sample size warrants cautious interpretation, and further studies are needed to confirm these findings.
Our findings are relevant because Rho-kinase signaling has been implicated in inflammation and tissue injury through different mechanisms, including potential interactions with redox-regulatory pathways, that can be attenuated by pharmacological inhibition [3,33]. In experimental ethanol exposure models, increased ROCK2 activity in the brain promotes microglial activation, oxidative stress, and neuronal apoptosis, largely via NF-κB-dependent pathways. Consistently, ROCK2 inhibition has been shown to ameliorate ethanol-induced brain injury [21]. In the liver, increased Rho/ROCK signaling drives hepatic injury and fibrogenesis, and ROCK activation in mouse hepatic stellate cells induces cytoskeletal contraction and myofibroblastic transformation, leading to extracellular matrix deposition and increased portal pressure [34]. Moreover, Rho-kinase signaling in immune cells can amplify inflammatory cytokine production and perpetuate immune activation. For example, ROCK2 modulates macrophage and T-cell responses, and its inhibition reduces the production of pro-inflammatory cytokines, including IL-17 and TNF-α, and has been associated with reduced fibrosis in liver injury models [3]. Rho/ROCK is also implicated in endothelial and barrier dysfunction, as ethanol-triggered ROCK activation in the gut epithelium has been shown to increase intestinal permeability [20]. In addition, ROCK inhibition maintained intestinal and vascular barrier function in a rat model of necrotizing enterocolitis [35].
Given these diverse roles, ROCKs have been investigated as potential therapeutic targets in alcohol-related disorders. Fasudil, a ROCK inhibitor in clinical use, has been shown to attenuate mouse liver injury and fibrogenesis in vivo by inhibiting stellate cell activation [36]. Rats treated with lentiviral ROCK2 shRNA showed neuroprotective and anti-inflammatory effects, attenuating ethanol-mediated hippocampal neuronal damage via antioxidant, anti-apoptotic, and anti-inflammatory responses [21]. Likewise, the selective ROCK inhibitor ripasudil (currently approved for glaucoma) has demonstrated anti-inflammatory and cytoprotective effects, reducing cytokine release, oxidative stress, and cell death in an acute pneumonia mouse model through modulation of RhoA/ROCK signaling [37]. These examples align with a growing body of preclinical evidence that targeting the Rho/ROCK pathway confers diverse anti-inflammatory, anti-fibrotic, endothelial-protective and neuroprotective benefits in different disease contexts, with potential mechanistic overlap with alcohol-related toxicity [34,38,39]. Within this framework, both ROCK1 and ROCK2 have also been proposed as candidate biomarkers in several pathological conditions, reflecting their association with cellular stress, inflammation, and tissue injury [40,41].
In this context, we performed an extended pathway-level analysis to further characterize Rho/ROCK pathway-related gene expression across different tissues and to explore additional potential therapeutic targets and biomarkers. Our analysis revealed coordinated changes in the upstream regulators and downstream effectors of this pathway, with tissue-specific differences. Upstream RhoA regulators showed changes in expression across several models; for example, the Rho-specific guanine nucleotide exchange factor ARHGEF1 exhibited increased expression in multiple experimental systems, although the statistical support varied across models and experimental conditions. This finding is consistent with the known role of ARHGEF1 in linking GPCR signals to RhoA [42]. Likewise, LPAR1, the receptor for lysophosphatidic acid, was increased, and changes related to thrombin signaling through the F2-F2R pathway were observed. Both LPA and F2 are known activators of RhoA/ROCK signaling and can contribute to inflammatory responses. Downstream of ROCK, we observed increased expression of several inflammatory and fibrotic marker genes. Notably, the chemokines CCL2 and CXCL1 were upregulated, as were PTGS2 and FN1, among others. However, the pattern of these changes differs across tissues. In the liver, we observed concurrent upregulation of chemokines and pro-fibrogenic genes (e.g., FN1), consistent with inflammatory and profibrogenic transcriptional patterns described in alcohol-associated liver disease, where MCP-1/CCL2 and CXCL1 are elevated and drive monocyte/neutrophil recruitment [43] alongside extracellular matrix deposition (fibronectin, collagen) during fibrosis [44].
However, after correction for multiple testing, only a subset of these transcriptional changes remained statistically significant. In the AUD cohort, ROCK1, ROCK2, and BAX retained significance after model-wide BH-FDR adjustment, whereas several upstream regulators and inflammatory markers showed nominal associations that did not survive correction. In mouse liver, CXCL1 and CCL2 remained significant after model-wide adjustment, while other transcriptional changes, including those involving RhoGEFs and fibrotic markers, should be considered exploratory. Thus, although the overall expression patterns suggest alterations in the transcriptional regulation of RhoA/ROCK-related signaling networks, the statistical evidence for individual pathway components varies across experimental models.
Similarly, in astrocyte cultures, we observed increased expression of neuroinflammation-related genes under combined ethanol and LPS exposure, with CCL2 showing a statistically significant increase compared with controls after Dunnett adjustment, whereas CXCL1 did not. These transcriptional changes are consistent with an astrocytic inflammatory response, although they do not establish neuroinflammation in vivo. Additionally, trends toward increased expression, although not statistically significant in comparisons against controls, were observed for genes such as PTGS2, ICAM1, and VCAM1 under combined ethanol and LPS exposure.
This finding is relevant in light of previous studies showing marked induction of PTGS2 and iNOS via NF-κB activation in ethanol-exposed astrocytes [45]. Similarly, human brain tissue from individuals with excessive ethanol intake has shown increased MCP-1/CCL2 expression associated with activated glia [46]. Moreover, ICAM-1 and VCAM-1 have roles in neuroinflammation, and their increased expression may be related to an active immune response in the CNS [47,48,49].
Notably, the two-way ANOVA revealed significant EtOH × LPS interactions for ROCK1 and BCL2 after BH-FDR correction, and subsequent Šídák-adjusted comparisons confirmed higher expression of both genes under combined exposure compared with either stimulus alone. Dunnett-adjusted comparisons also identified significant increases in the expression of several inflammatory and signaling-related genes following combined EtOH + LPS exposure compared with controls, although these differences should not be interpreted as evidence of statistical interactions.
Furthermore, significant differences in ARHGEF1 and IL1B expression were observed following LPS exposure alone. These findings suggest that the transcriptional response to ethanol and LPS is gene-dependent, with evidence of an interaction for selected genes rather than a uniform synergistic response across the pathway. This experimental context may be relevant to alcohol-associated gut barrier disruption and microbial translocation, which can increase systemic endotoxin exposure.
In PBMCs exposed to ethanol and LPS in vitro, ROCK1 also showed a significant EtOH × LPS interaction after BH-FDR correction, with higher expression under combined exposure than with either stimulus alone, whereas no significant interaction was detected for ROCK2. This finding further suggests that the transcriptional response to combined ethanol and inflammatory stimulation may differ between ROCK isoforms.
We further explored apoptosis-related transcriptional changes using the BCL2/BAX mRNA ratio as a proxy for the balance between pro- and anti-apoptotic gene expression. We observed a significant decrease in this ratio in PB from patients with AUD, suggesting a shift toward a pro-apoptotic transcriptional profile in the systemic compartment. In contrast, this ratio did not change significantly in the liver from the NIAAA model or in astrocytes under our in vitro conditions. Importantly, transcript levels may not reflect protein abundance or functional apoptosis; therefore, these results should be interpreted cautiously. Taken together, these pathway-level data indicate coordinated alterations in the expression of genes related to RhoA/ROCK signaling, including upstream regulators and downstream inflammatory and fibrotic targets, with tissue-specific patterns across the experimental models analyzed. Although these transcriptional changes are compatible with altered regulation of the RhoA/ROCK signaling network, they do not demonstrate functional activation of ROCK1 or ROCK2.
Although our study is exploratory, it presents some important contributions. First, it adopted a translational and multimodal design, integrating human cohorts with complementary in vitro and in vivo systems, and, to our knowledge, represents one of the first studies to comprehensively examine alterations in ROCK1 and ROCK2 expression across different models of alcohol exposure. Second, by examining both acute and chronic alcohol exposure and simultaneously evaluating ROCK1 and ROCK2 across multiple biological compartments, our study provides a broader perspective on potential tissue- and isoform-dependent responses to alcohol exposure. Importantly, we provide evidence of altered ROCK expression in the PB of individuals with acute and chronic alcohol exposure, addressing a significant gap given the increasing prevalence and clinical relevance of binge drinking. Third, we performed pathway-level profiling of upstream regulators and core components, including RhoGEFs, as well as downstream transcriptional programs, allowing for a broader and more mechanistically informative comparison across tissues. This approach enabled the identification of tissue-specific transcriptional patterns related to inflammatory, fibrotic, and apoptosis-related responses. Finally, these findings provide a basis for future mechanistic studies investigating the functional and biological relevance of ROCK-related expression changes following alcohol exposure. Importantly, the concordance of ROCK-related expression changes across different tissues, species, and experimental systems provides cross-model consistency to the observations. However, this consistency does not compensate for the limited sample size of individual cohorts or replace the need for validation in larger independent populations.
Several limitations should also be acknowledged. The clinical cohorts were relatively small, particularly the AUD cohort, and several experimental groups also included a limited number of animals or biological replicates. These sample sizes reduce statistical power, especially for the detection of small or moderate effects. Accordingly, non-significant findings should be interpreted cautiously and should not be considered evidence of absence of an effect. No formal a priori power calculation was performed because the size of the human cohorts was constrained by the number of eligible biological samples available under the predefined inclusion and exclusion criteria, whereas animal group sizes were based on previous studies using the same experimental models and on reduction principles in animal experimentation. Although multiple-testing corrections were applied to reduce the risk of false-positive findings, several initially observed associations did not remain significant after adjustment and should therefore be considered exploratory. Moreover, the post hoc comparisons in astrocytes were adjusted within each gene, and their interpretation should be distinguished from the BH-FDR-adjusted analyses across genes.
Residual confounding should also be considered when interpreting the clinical findings. The AAC and AUD cohorts represented distinct alcohol-exposure settings and were analyzed independently against their respective control groups, without direct comparisons between cohorts. In both cohorts, controls were selected to represent broadly similar age and sex profiles to the corresponding patient groups, although strict individual matching was not performed. Some differences in age and sex distribution therefore remained. Given the small sample sizes, these differences should be interpreted cautiously, as estimates are relatively imprecise and p-values may be sensitive to individual observations. In addition, information on potential confounders, including smoking status and BMI, was not systematically available. Furthermore, the small sample size, particularly in the AUD cohort, limited the feasibility of reliable multivariable adjustment and meaningful stratified analyses by age or sex. Therefore, residual confounding cannot be excluded, and the clinical findings should be interpreted with caution.
Furthermore, in the AAC cohort, the exact interval between the last alcoholic drink and blood sampling could not be reliably determined. Although all participants fulfilled predefined criteria for alcohol consumption during the 6 h preceding admission and BAC was measured at admission, variability in the timing and pattern of alcohol intake may have influenced peripheral blood gene expression. A single BAC measurement at admission may not adequately reflect the timing, duration, or cumulative magnitude of alcohol exposure. Exploratory correlation analyses revealed inverse associations between BAC and ROCK1 and ROCK2 mRNA expression, although neither reached statistical significance, either before or after BH-FDR correction.
The animal models used in this study also have specific limitations. In the NIAAA model, tissues were analyzed at a single time point, 9 h after the final ethanol gavage. Therefore, transient changes occurring earlier or later cannot be excluded, and the absence of significant hepatic ROCK1/ROCK2 mRNA changes at this time point should not be interpreted as evidence of absence of hepatic involvement. The operant alcohol self-administration model also produced relatively low blood alcohol concentrations compared with those typically observed during acute human intoxication. However, this model primarily reproduces voluntary and repeated alcohol intake rather than high peak ethanol exposure. Therefore, direct quantitative equivalence between rat BAC and human heavy or binge drinking should not be assumed. Although the use of different alcohol-exposure paradigms allows the investigation of ROCK-related changes across experimental models, each reproduces only certain aspects of human alcohol exposure. Additional time-course and dose–response experiments are needed to characterize the kinetics and exposure dependence of ROCK1/ROCK2 alterations across tissues.
Another limitation is that formal blinding was not implemented throughout all stages of the study. Although gene-expression analyses were performed using coded samples and animals in the NIAAA model were randomly allocated to the experimental groups, investigators were not blinded during all procedures involving sample collection, tissue processing, animal experiments, or cell-culture treatments. This represents a potential source of investigator-related bias that cannot be completely excluded. Most study outcomes were based on quantitative molecular measurements, which may reduce, but do not eliminate, the influence of such bias.
Furthermore, the in vitro ethanol and LPS concentrations represent experimental exposure conditions and may not directly reflect physiological concentrations or exposure dynamics in vivo. Specific osmolarity-matched controls were not included, and potential osmotic contributions to the observed transcriptional responses cannot be excluded. Although sealed incubation chambers were used to minimize ethanol evaporation, ethanol concentrations were not directly monitored throughout the exposure period. In addition, LPS purity was not independently assessed beyond the specifications provided by the manufacturer.
Therefore, the findings obtained under combined EtOH and LPS exposure should be considered hypothesis-generating, and further studies incorporating appropriate osmolarity controls and in vivo approaches to evaluate TLR4-dependent signaling could help assess their physiological relevance and clarify the contribution of LPS/TLR4 signaling to the observed responses.
In addition, our analyses were primarily based on gene expression, with protein expression assessed only in a limited subset of liver samples, and did not directly assess ROCK kinase activity or the mechanisms underlying the observed transcriptional changes. Specifically, phosphorylation of downstream ROCK substrates, ROS levels, oxidative damage markers, and antioxidant activity were not evaluated, nor were loss-of-function or pharmacological intervention experiments performed. Therefore, functional activation of the RhoA/ROCK pathway, a redox-mediated mechanism, and causal relationships between ROCK signaling and the observed tissue-specific transcriptional responses cannot be established from the present study. Similarly, the BCL2/BAX ratio was assessed at the mRNA level and should be interpreted as a measure of the pro-/anti-apoptotic transcriptional profile rather than as direct evidence of apoptosis or apoptotic susceptibility. Overall, the present findings should be considered exploratory and require confirmation in larger independent cohorts and further mechanistic studies incorporating ROCK activity measurements, redox assessments, and functional interventions.
5. Conclusions
Our multi-model, cross-tissue analysis shows that alcohol exposure is associated with altered ROCK1 and/or ROCK2 expression across human cohorts, in vitro systems, and animal models. These changes were accompanied by tissue-specific alterations in the expression of genes related to RhoA/ROCK signaling, inflammation, fibrosis, and apoptosis. The present findings are exploratory and hypothesis-generating and do not establish functional activation of the pathway, a redox-mediated mechanism, or a causal role in alcohol-induced tissue injury. Further mechanistic studies directly assessing ROCK activity, oxidative stress, and downstream functional consequences will be required to determine the biological relevance of these expression changes and their potential value as biomarkers or therapeutic targets in alcohol-related disorders.
Supplementary Materials
The following supporting information can be downloaded at https://www.mdpi.com/article/10.3390/antiox15111476/s1, Supplementary Tables S1–S11, containing demographic and clinical characteristics, primer sequences, and additional statistical analyses. Table S1: Demographic and clinical characteristics of AAC patients and healthy controls; Table S2. Demographic and clinical characteristics of AUD patients and healthy controls; Table S3. Nucleotide sequences of primer pairs applied for the RT-PCR; Table S4. Effect size estimates and 95% confidence intervals for gene expression changes in peripheral blood from patients with acute and chronic alcohol exposure and in the liver of alcohol-exposed mice; Table S5. Raw and Benjamini–Hochberg false discovery rate (BH-FDR)-adjusted p-values for gene expression analyses across human and experimental models of alcohol exposure; Table S6. Two-way ANOVA and effect-size analysis of ROCK1 and ROCK2 expression in PBMCs exposed to ethanol and LPS; Table S7. Šídák-adjusted simple-effects analysis of ROCK1 and ROCK2 expression in PBMCs exposed to ethanol and LPS; Table S8. Dunnett-adjusted post hoc comparisons of ROCK1 and ROCK2 expression in PBMCs exposed to ethanol and LPS versus control. Table S9. Two-way ANOVA and effect-size analysis of gene expression in primary astrocytes exposed to ethanol and LPS; Table S10. Multiplicity-adjusted simple-effects comparisons for genes showing an FDR-supported EtOH × LPS interaction in primary astrocytes; Table S11. Dunnett-adjusted post hoc comparisons of gene expression in primary astrocytes exposed to ethanol and LPS versus control. Figure S1. Melting curve analysis of ROCK and housekeeping genes amplified by quantitative real-time PCR (qPCR) in human and mouse samples; Figure S2. Melting curve analysis of ROCK1, ROCK2, and 18S ribosomal RNA in rat samples; Figure S3. Full uncropped Western blot membrane images corresponding to ROCK1, ROCK2, and vinculin detection in liver tissue from the NIAAA mouse model; Figure S4. Correlation between blood alcohol concentration and ROCK1 and ROCK2 mRNA expression in patients with acute alcohol intoxication.
Author Contributions
P.S.A.: Methodology; investigation; formal analysis; visualization; writing—original draft; Writing—review and editing; C.H.F.: Investigation, methodology, formal analysis, writing—original draft, writing—review and editing; P.C.-A.: Methodology; investigation, writing—review and editing; S.M.I.R.: Methodology; investigation, writing—review and editing; C.R.: methodology and investigation, writing—review and editing; D.S.-G.: investigation, formal analysis, writing—review and editing; V.E.-A.: Methodology; investigation; formal analysis, writing—review and editing; M.-L.A.: Methodology; investigation, writing—review and editing; D.P.-M.: Methodology; investigation, writing—review and editing; D.A.A.: Investigation, visualization, writing—review and editing; B.C.: Investigation, methodology, writing—review and editing; M.-Á.P.-N.: Investigation, methodology, writing—review and editing; C.F.: Investigation; methodology; writing—review and editing; A.M.: Investigation; methodology, writing—review and editing; J.-A.L.-M. Supervision, formal analysis, writing—review and editing; G.S.: Supervision; formal analysis, writing—review and editing; Á.A.: Supervision; formal analysis, writing—review and editing; M.R.P.: Conceptualization; supervision, methodology; investigation; formal analysis; visualization; writing—original draft; Writing—review and editing; M.M.: Conceptualization, supervision; formal analysis, project administration, funding acquisition; writing—original draft; writing—review and editing. All authors have read and agreed to publish this version of the manuscript.
Funding
M.R.P. holds a Sara Borrell contract (CD22/00054) funded by the Instituto de Salud Carlos III (ISCIII) and cofunded by the European Union–Next Generation EU. D.S.G. holds a PFIS contract (FI21/00189) funded by ISCIII and co-funded by the European Union. This study was funded by the ISCIII and co-funded by the European Union (FEDER/FSE, “Una manera de hacer Europa”/“El FSE invierte en tu futuro”/Plan de Recuperación, Transformación y Resiliencia PRTR) through the projects PI24/00819 and RD24/0005/0006 (Á.A), PI20/00743 and RD24/0003/0017 (M.M.), PMP21/00057 (G.S.), by the Agencia Estatal de Investigación PID2022-138525OB-I00 (G.S.) funded by MICIU/AEI/10.13039/501100011033 (FEDER, “Una manera de hacer Europea”), and by Junta de Castilla y León, Spain, through projects GRS3005/A1/2024, GRS 2916/A1/2023 and GRS3498/A1/2025 (awarded to M.M). Additional support was provided by “Cris contra el Cáncer” (G.S.), by “programa de excelencia PR_EX_2024-22 PR_EX_2024-22” (G.S.), by the Spanish Society of Internal Medicine (SEMI) Research Grant 2023 and Sociedad Castellano-Leonesa-Cántabra de Medicina Interna (SOCALMI) 2022 grant (both awarded to M.M.), and by Mideloy Research (JALM). JALM is a Member of the Instituto de Investigación Sanitaria Hospital 12 de Octubre (imas12), Madrid, Spain.
Institutional Review Board Statement
The human studies were conducted in accordance with the Declaration of Helsinki and were approved by the corresponding Research Ethics Committee. The AUD cohort was approved under protocol PI2023/07/1389 (approval date: 27 November 2023), and the AAC cohort, including the deferred-consent procedure, was approved under protocol PI2025/03/1875 (approval date: 28 April 2025).
Informed Consent Statement
Informed consent was obtained from all subjects involved in the study.
Data Availability Statement
The data presented in this study are available upon request from the corresponding author. The data are not publicly available for ethical reasons.
Conflicts of Interest
Author José-Antonio López-Moreno is affiliated with Mideloy Research. The remaining authors declare that the research was conducted in the absence of any commercial or financial relationships that could be construed as potential conflicts of interest.
Abbreviations
The following abbreviations are used in this manuscript:
| Abbreviation | Full term |
| ROCK1 | Rho-associated coiled-coil containing protein kinase 1 |
| ROCK2 | Rho-associated coiled-coil containing protein kinase 2 |
| ARDs | Alcohol-related diseases |
| NIDCM | Non-ischemic dilated cardiomyopathy |
| ACM | Alcoholic cardiomyopathy |
| AAC | Acute alcohol consumption |
| AUD | Alcohol use disorder |
| PBMCs | Peripheral blood mononuclear cells |
| EtOH | Ethanol |
| LPS | Lipopolysaccharide |
| NIAAA model | Mouse model of chronic and binge ethanol feeding |
| qRT-PCR | Quantitative real-time polymerase chain reaction |
| RhoGEFs | Rho guanine nucleotide exchange factors |
| ACTB | Beta-actin |
| YWHAZ | Tyrosine 3-monooxygenase/tryptophan 5-monooxygenase activation protein |
| PB | Peripheral blood |
| SRSF4 | Serine/arginine-rich splicing factor 4 |
| HPRT1 | Hypoxanthine phosphoribosyltransferase 1 |
| TBP | TATA-box binding protein |
| 18S | 18S ribosomal RNA |
| SD | Standard deviation |
| SEM | Standard error of the mean |
| AST | Aspartate aminotransferase |
| ALT | Alanine aminotransferase |
| ALP | Alkaline phosphatase |
| GGT | Gamma-glutamyl transferase |
| F2 | Coagulation factor II |
| F2R | Coagulation factor II receptor |
| S1PR | Sphingosine 1-phosphate receptor |
| LPAR1 | Lysophosphatidic acid receptor 1 |
| RhoA | Ras homolog family member A |
| RHGEF1 | Rho guanine nucleotide exchange factor 1 |
| ARHGEF2 | Rho guanine nucleotide exchange factor 2 |
| ARHGEF8 | Rho guanine nucleotide exchange factor 8 |
| ARHGEF11 | Rho guanine nucleotide exchange factor 11 |
| CCL2 | C-C motif chemokine ligand 2 |
| CXCL8 | C-X-C motif chemokine ligand 8 |
| IL1B | Interleukin 1 beta |
| PTGS2 | Prostaglandin-endoperoxide synthase 2 |
| E-selectin | E-selectin |
| BAX | BCL2-associated X protein |
| BCL2 | B-cell lymphoma 2 |
| GF-β | Transforming growth factor beta |
| AngII | Angiotensin II |
| ENDO1 | Endothelin-1 |
| ARHGEF1 | Rho guanine nucleotide exchange factor 1 |
| CXCL1 | C-X-C motif chemokine ligand 1 |
| FN1 | Fibronectin 1 |
| ACTA2 | Actin alpha 2, smooth muscle |
| COL1 | Collagen type I |
| ICAM-1 | Intercellular adhesion molecule 1 |
| VCAM-1 | Vascular cell adhesion molecule 1 |
| L-17 | Interleukin 17 |
| TNF-α | Tumor necrosis factor alpha |
| CNS | Central nervous system |
| iNOS | Inducible nitric oxide synthase |
References
- Schmidt, S.I.; Blaabjerg, M.; Freude, K.; Meyer, M. RhoA Signaling in Neurodegenerative Diseases. Cells 2022, 11, 1520. [Google Scholar] [CrossRef] [Scilit] [PubMed]
- Guan, G.; Cannon, R.D.; Coates, D.E.; Mei, L. Effect of the Rho-Kinase/ROCK Signaling Pathway on Cytoskeleton Components. Genes 2023, 14, 272. [Google Scholar] [CrossRef] [Scilit] [PubMed]
- Nalkurthi, C.; Schroder, W.A.; Melino, M.; Irvine, K.M.; Nyuydzefe, M.; Chen, W.; Liu, J.; Teng, M.W.; Hill, G.R.; Bertolino, P.; et al. ROCK2 inhibition attenuates profibrogenic immune cell function to reverse thioacetamide-induced liver fibrosis. JHEP Rep. Innov. Hepatol. 2022, 4, 100386. [Google Scholar] [CrossRef] [Scilit] [PubMed]
- Wei, L.; Shi, J. Insight Into Rho Kinase Isoforms in Obesity and Energy Homeostasis. Front. Endocrinol. 2022, 13, 886534. [Google Scholar] [CrossRef] [Scilit] [PubMed]
- Glotfelty, E.J.; Tovar-y-Romo, L.B.; Hsueh, S.-C.; Tweedie, D.; Li, Y.; Harvey, B.K.; Hoffer, B.J.; Karlsson, T.E.; Olson, L.; Greig, N.H. The RhoA-ROCK1/ROCK2 Pathway Exacerbates Inflammatory Signaling in Immortalized and Primary Microglia. Cells 2023, 12, 1367. [Google Scholar] [CrossRef] [Scilit] [PubMed]
- Palomo, I.; Wehinger, S.; Andres, V.; García-García, F.J.; Fuentes, E. RhoA/rho Kinase Pathway Activation in Age-Associated Endothelial Cell Dysfunction and Thrombosis; Wiley: Hoboken, NJ, USA, 2024; Available online: http://hdl.handle.net/20.500.12105/19918 (accessed on 22 May 2025).
- Yu, B.; Sladojevic; Nikola, B.; John, E.; Liao, J.K. Targeting Rho-associated coiled-coil forming protein kinase (ROCK) in cardiovascular fibrosis and stiffening. Expert Opin. Ther. Targets 2020, 24, 47–62. [Google Scholar] [CrossRef] [Scilit] [PubMed]
- National Institute on Alcohol Abuse and Alcoholism (NIAAA). 2024. Available online: https://www.niaaa.nih.gov/ (accessed on 22 March 2025).
- Hartmann, S.; Ridley, A.J.; Lutz, S. The Function of Rho-Associated Kinases ROCK1 and ROCK2 in the Pathogenesis of Cardiovascular Disease. Front. Pharmacol. 2015, 20, 276. [Google Scholar] [CrossRef] [Scilit] [PubMed]
- Cheng, C.-I.; Chen, P.-H.; Lin, Y.-C.; Kao, Y.-H. High glucose activates Raw264.7 macrophages through RhoA kinase-mediated signaling pathway. Cell Signal. 2015, 27, 283–292. [Google Scholar] [CrossRef] [Scilit] [PubMed]
- Barcelo, J.; Samain, R.; Sanz-Moreno, V. Preclinical to clinical utility of ROCK inhibitors in cancer. Trends Cancer 2023, 9, 250–263. [Google Scholar] [CrossRef] [Scilit] [PubMed]
- Anderson, B.O.; Berdzuli, N.; Ilbawi, A.; Kestel, D.; Kluge, H.P.; Krech, R.; Mikkelsen, B.; Neufeld, M.; Poznyak, V.; Rekve, D.; et al. Health and cancer risks associated with low levels of alcohol consumption. Lancet Public Health 2023, 8, e6–e7. [Google Scholar] [CrossRef] [Scilit] [PubMed]
- Leong, C.; Bolton, J.M.; Ekuma, O.; Prior, H.J.; Singal, D.; Nepon, J.; Konrad, G.; Paillé, M.; Finlayson, G.; Nickel, N. Association of alcohol use disorder on alcohol-related cancers, diabetes, ischemic heart disease and death: A population-based, matched cohort study. Addiction 2022, 117, 368–381. [Google Scholar] [CrossRef] [Scilit] [PubMed]
- Alcohol. Available online: https://www.who.int/news-room/fact-sheets/detail/alcohol (accessed on 22 May 2025).
- Fernández-Regueras, M.; Carbonell, C.; Salete-Granado, D.; García, J.-L.; Gragera, M.; Pérez-Nieto, M.-Á.; Morán-Plata, F.-J.; Mayado, A.; Torres, J.-L.; Corchete, L.-A.; et al. Predominantly Pro-Inflammatory Phenotype with Mixed M1/M2 Polarization of Peripheral Blood Classical Monocytes and Monocyte-Derived Macrophages among Patients with Excessive Ethanol Intake. Antioxidants 2023, 12, 1708. [Google Scholar] [CrossRef] [Scilit] [PubMed]
- Park, S.H.; Seo, W.; Xu, M.-J.; Mackowiak, B.; Lin, Y.; He, Y.; Fu, Y.; Hwang, S.; Kim, S.-J.; Guan, Y.; et al. Ethanol and its Nonoxidative Metabolites Promote Acute Liver Injury by Inducing ER Stress, Adipocyte Death, and Lipolysis. Cell. Mol. Gastroenterol. Hepatol. 2023, 15, 281–306. [Google Scholar] [CrossRef] [Scilit] [PubMed]
- Shabani, Z.; Jafarzadeh Gharehziaaddin, M. Effects and Potential Mechanisms of Alcohol Use Disorder on the Fate Determination of Newly Born Neurons in the Hippocampus. Alcohol Alcohol. 2020, 55, 598–602. [Google Scholar] [CrossRef] [Scilit] [PubMed]
- Gao, D.-P.; Wang, L.-W.; Xie, D.-L.; Li, Q.; Yu, Z.-P.; Tang, Z.-H.; Cui, K.-K.; Cai, Y. Chronic Alcohol Exposure Alters the Levels and Assembly of the Actin Cytoskeleton and Microtubules in the Adult Mouse Hippocampus. J. Integr. Neurosci. 2024, 23, 118. [Google Scholar] [CrossRef] [Scilit] [PubMed]
- Zhu, Y.; Jia, Y.; Zhang, E. Oxidative stress modulation in alcohol-related liver disease: From chinese botanical drugs to exercise-based interventions. Front. Pharmacol. 2025, 16, 1516603. [Google Scholar] [CrossRef] [Scilit] [PubMed]
- Elamin, E.; Masclee, A.; Dekker, J.; Jonkers, D. Ethanol disrupts intestinal epithelial tight junction integrity through intracellular calcium-mediated Rho/ROCK activation. Am. J. Physiol.-Gastrointest. Liver Physiol. 2014, 306, G677–G685. [Google Scholar] [CrossRef] [Scilit] [PubMed]
- Li, X.; Tong, J.; Liu, J.; Wang, Y. Down-regulation of ROCK2 alleviates ethanol-induced cerebral nerve injury partly by the suppression of the NF-κB signaling pathway. Bioengineered 2020, 11, 779–790. [Google Scholar] [CrossRef] [Scilit] [PubMed]
- Li, L.; Jing, L.; Zhao, J.; Lv, J.; Yang, W.; Li, W.; Zhou, L. Valsartan inhibits RhoA-ROCK2-MYL pathway in rat model of alcoholic cardiomyopathy. Exp. Ther. Med. 2019, 18, 4313–4321. [Google Scholar] [CrossRef] [Scilit] [PubMed]
- Qi, X.; Guo, M.; Sun, G.; Zhao, H.; Huang, C.; Zhong, X.; Bai, S.; Huang, X.; Wu, C.; Huang, Z.; et al. Inhibition of the Rho/ROCK pathway promotes the expression of developmental and migration-related genes in astrocytes exposed to alcohol. Alcohol 2024, 115, 5–12. [Google Scholar] [CrossRef] [Scilit] [PubMed]
- Rojas-Pirela, M.; Salete-Granado, D.; Andrade-Alviárez, D.; Prieto-Rojas, A.; Rodríguez, C.; Aguilar-Sánchez, M.-L.; Puertas-Miranda, D.; Pérez-Nieto, M.; Rueda-Cala, V.; Pérez, C.; et al. Dysregulated Expression of Canonical and Non-Canonical Glycolytic Enzyme Isoforms in Peripheral Blood from Subjects with Alcohol Use Disorder and from Individuals with Acute Alcohol Consumption. Antioxidants 2025, 14, 1143. [Google Scholar] [CrossRef] [Scilit] [PubMed]
- Mandrekar, P.; Bala, S.; Catalano, D.; Kodys, K.; Szabo, G. The opposite effects of acute and chronic alcohol on lipopolysaccharide-induced inflammation are linked to IRAK-M in human monocytes. J. Immunol. 2009, 183, 1320–1327. [Google Scholar] [CrossRef] [Scilit] [PubMed]
- Bala, S.; Tang, A.; Catalano, D.; Petrasek, J.; Taha, O.; Kodys, K.; Szabo, G. Induction of Bcl-3 by acute binge alcohol results in toll-like receptor 4/LPS tolerance. J. Leukoc. Biol. 2012, 92, 611–620. [Google Scholar] [CrossRef] [Scilit] [PubMed]
- Jimenez-Blasco, D.; Busquets-Garcia, A.; Hebert-Chatelain, E.; Serrat, R.; Vicente-Gutierrez, C.; Ioannidou, C.; Gómez-Sotres, P.; Lopez-Fabuel, I.; Resch-Beusher, M.; Resel, E.; et al. Glucose metabolism links astroglial mitochondria to cannabinoid effects. Nature 2020, 583, 603–608. [Google Scholar] [CrossRef] [Scilit] [PubMed]
- Calleja-Conde, J.; Echeverry-Alzate, V.; Giné, E.; Bühler, K.; Nadal, R.; Maldonado, R.; de Fonseca, F.R.; Gual, A.; López-Moreno, J.A. Nalmefene is effective at reducing alcohol seeking, treating alcohol-cocaine interactions and reducing alcohol-induced histone deacetylases gene expression in blood. Br. J. Pharmacol. 2016, 173, 2490–2505. [Google Scholar] [CrossRef] [Scilit] [PubMed]
- Echeverry-Alzate, V.; Giné, E.; Bühler, K.M.; Calleja-Conde, J.; Olmos, P.; Gorriti, M.A.; Nadal, R.; de Fonseca, F.R.; A López-Moreno, J. Effects of topiramate on ethanol-cocaine interactions and DNA methyltransferase gene expression in the rat prefrontal cortex. Br. J. Pharmacol. 2014, 171, 3023–3036. [Google Scholar] [CrossRef] [Scilit] [PubMed]
- Rojas-Pirela, M.; Herrera-Flores, C.; Costa-Alba, P.; Salete-Granado, D.; Aguilar, M.-L.; Puertas-Miranda, D.; Cicuéndez, B.; Pérez-Nieto, M.; Pérez-Albornoz, C.; Folgueira, C.; et al. Analysis of Antimicrobial Peptide Expression Under Acute and Chronic Alcohol Exposure: A Cross-Sectional Study and a Systematic Review of the Literature. Int. J. Mol. Sci. 2026, 27, 2026. [Google Scholar] [CrossRef] [Scilit] [PubMed]
- Gallo-Oller, G.; Ordoñez, R.; Dotor, J. A new background subtraction method for Western blot densitometry band quantification through image analysis software. J. Immunol. Methods 2018, 457, 1–5. [Google Scholar] [CrossRef] [Scilit] [PubMed]
- Aydinoglu, F.; Ergurhan Kiroglu, O.; Astarci, E.; Balli, E.; Ogulener, N. Effects of ethanol on RhoA/Rho-kinase-mediated calcium sensitization in mouse lung parenchymal tissue. Eur. J. Pharmacol. 2015, 764, 318–327. [Google Scholar] [CrossRef] [Scilit] [PubMed]
- Mera, C.; Godoy, I.; Ramírez, R.; Moya, J.; Ocaranza, M.P.; Jalil, J.E. La inhibición de Rho quinasa post infarto mejora el remodelado y la función ventricular: Mecanismos involucrados a nivel preclínico. Rev. Chil. Cardiol. 2017, 36, 209–220. [Google Scholar] [CrossRef] [Scilit]
- Klein, S.; Frohn, F.; Magdaleno, F.; Reker-Smit, C.; Schierwagen, R.; Schierwagen, I.; Uschner, F.E.; van Dijk, F.; Fürst, D.O.; Djudjaj, S.; et al. Rho-kinase inhibitor coupled to peptide-modified albumin carrier reduces portal pressure and increases renal perfusion in cirrhotic rats. Sci. Rep. 2019, 9, 2256. [Google Scholar] [CrossRef] [Scilit] [PubMed]
- Grothaus, J.S.; Ares, G.; Yuan, C.; Wood, D.R.; Hunter, C.J. Rho kinase inhibition maintains intestinal and vascular barrier function by upregulation of occludin in experimental necrotizing enterocolitis. Am. J. Physiol.-Gastrointest. Liver Physiol. 2018, 315, G514–G528. [Google Scholar] [CrossRef] [Scilit] [PubMed]
- Han, Q.-J.; Mu, Y.-L.; Zhao, H.-J.; Zhao, R.-R.; Guo, Q.-J.; Su, Y.-H.; Zhang, J. Fasudil prevents liver fibrosis via activating natural killer cells and suppressing hepatic stellate cells. World J. Gastroenterol. 2021, 27, 3581–3594. [Google Scholar] [CrossRef] [Scilit] [PubMed]
- He, P.; Guo, Y.; Wang, J.; Yan, L.; Feng, A. Protection of ripasudil, a Rho kinase inhibitor, in lipopolysaccharides-induced acute pneumonia in mice. Am. J. Transl. Res. 2019, 11, 6433–6443. [Google Scholar] [PubMed]
- Joshi, A.R.; Muke, I.; Bobylev, I.; Lehmann, H.C. ROCK inhibition improves axonal regeneration in a preclinical model of amyotrophic lateral sclerosis. J. Comp. Neurol. 2019, 527, 2334–2340. [Google Scholar] [CrossRef] [Scilit] [PubMed]
- Montagnoli, T.L.; da Silva, J.S.; Sudo, S.Z.; Santos, A.D.; Gomide, G.F.; de Sá, M.P.L.; Zapata-Sudo, G. ROCK Inhibition as Potential Target for Treatment of Pulmonary Hypertension. Cells 2021, 10, 1648. [Google Scholar] [CrossRef] [Scilit] [PubMed]
- Li, C.; Jin, Y.; Ma, J.; Sun, R.; Huang, J.; Qi, Y.; Yu, J. Diagnostic value of ROCK2 protein in immune checkpoint inhibitors-associated myocarditis. Int. J. Cardiol. 2025, 427, 133104. [Google Scholar] [CrossRef] [Scilit] [PubMed]
- Cheng, C.; Liu, X.-B.; Xu, D.-L.; Zhang, J. Increased ROCK1 not ROCK2 in circulating leukocytes in rats with myocardial ischemia/reperfusion. Perfusion 2020, 35, 819–825. [Google Scholar] [CrossRef] [Scilit] [PubMed]
- Patel, M.; Karginov, A.V. Phosphorylation-mediated regulation of GEFs for RhoA. Cell Adhes. Migr. 2014, 8, 11–18. [Google Scholar] [CrossRef] [Scilit] [PubMed]
- Xu, M.-J.; Zhou, Z.; Parker, R.; Gao, B. Targeting inflammation for the treatment of alcoholic liver disease. Pharmacol. Ther. 2017, 180, 77–89. [Google Scholar] [CrossRef] [Scilit] [PubMed]
- Aziz-Seible, R.S.; Casey, C.A. Fibronectin: Functional character and role in alcoholic liver disease. World J. Gastroenterol. WJG 2011, 17, 2482–2499. [Google Scholar] [CrossRef] [Scilit] [PubMed]
- Blanco, A.M.; Pascual, M.; Valles, S.L.; Guerri, C. Ethanol-induced iNOS and COX-2 expression in cultured astrocytes via NF-kappa B. NeuroReport 2004, 15, 681–685. [Google Scholar] [CrossRef] [Scilit] [PubMed]
- He, J.; Crews, F.T. Increased MCP-1 and microglia in various regions of the human alcoholic brain. Exp. Neurol. 2008, 210, 349–358. [Google Scholar] [CrossRef] [Scilit] [PubMed]
- Chaudhari, A.; Padmar, J.; Awathale, S.; Goyal, S.; Nakhate, K.; Sherikar, A. From glial cells to pain pathways: ICAM-1 as a central player in neuroinflammation and neuropathy. Discov. Neurosci. 2025, 20, 5. [Google Scholar] [CrossRef] [Scilit]
- Rosenman, S.J.; Shrikant, P.; Dubb, L.; Benveniste, E.N.; Ransohoff, R.M. Cytokine-induced expression of vascular cell adhesion molecule-1 (VCAM-1) by astrocytes and astrocytoma cell lines. J. Immunol. 1995, 154, 1888–1899. [Google Scholar] [CrossRef] [Scilit]
- Zameer, A.; Hoffman, S.A. Increased ICAM-1 and VCAM-1 expression in the brains of autoimmune mice. J. Neuroimmunol. 2003, 142, 67–74. [Google Scholar] [CrossRef] [Scilit] [PubMed]
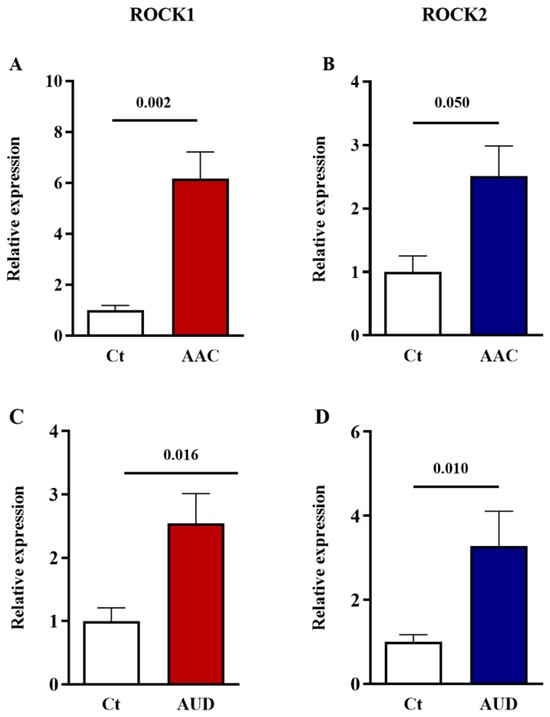
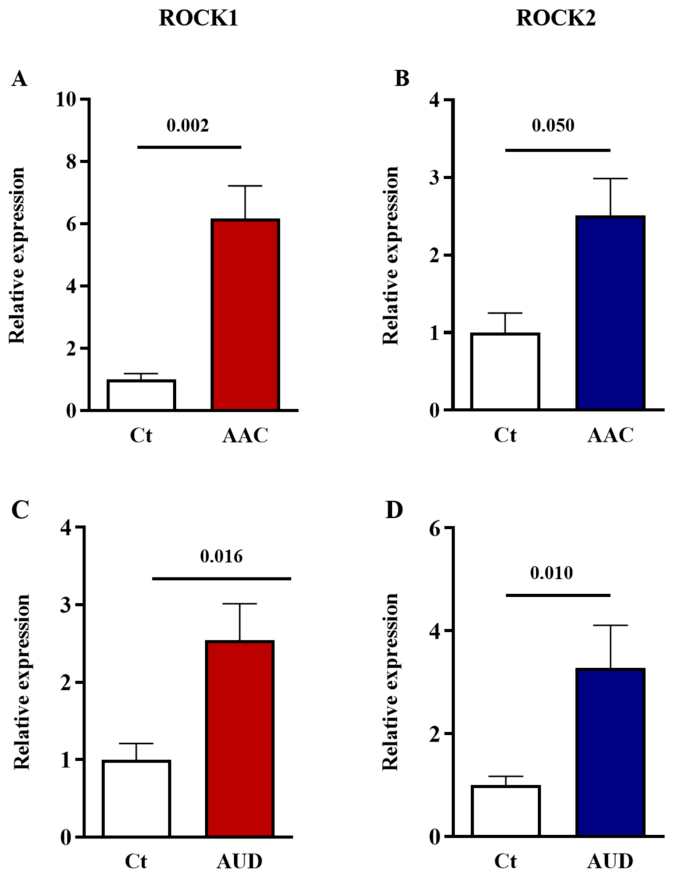
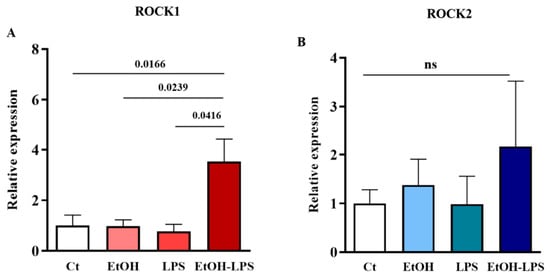
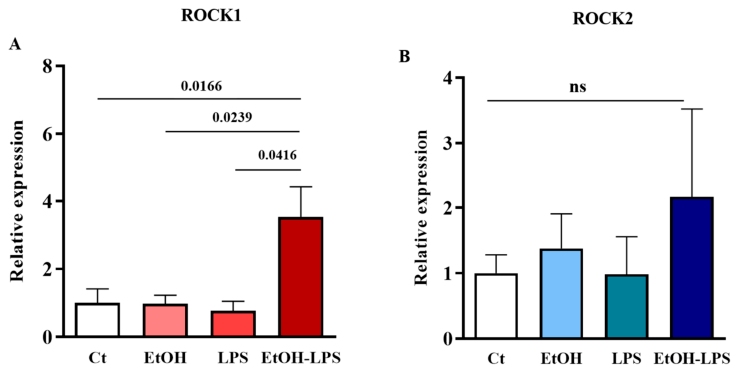
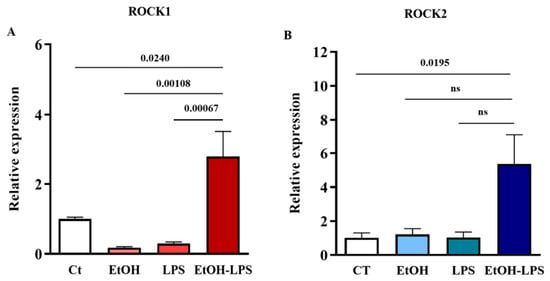
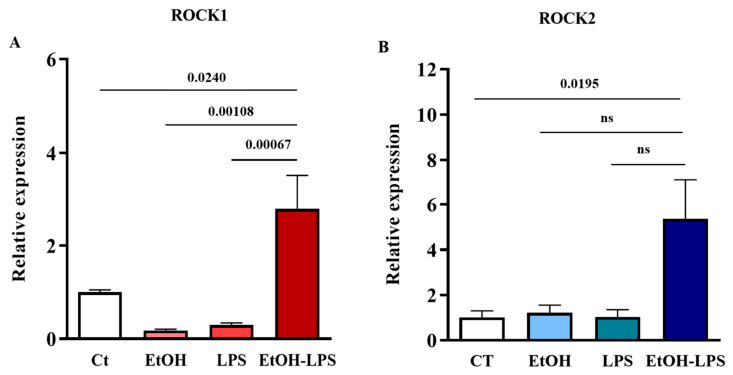
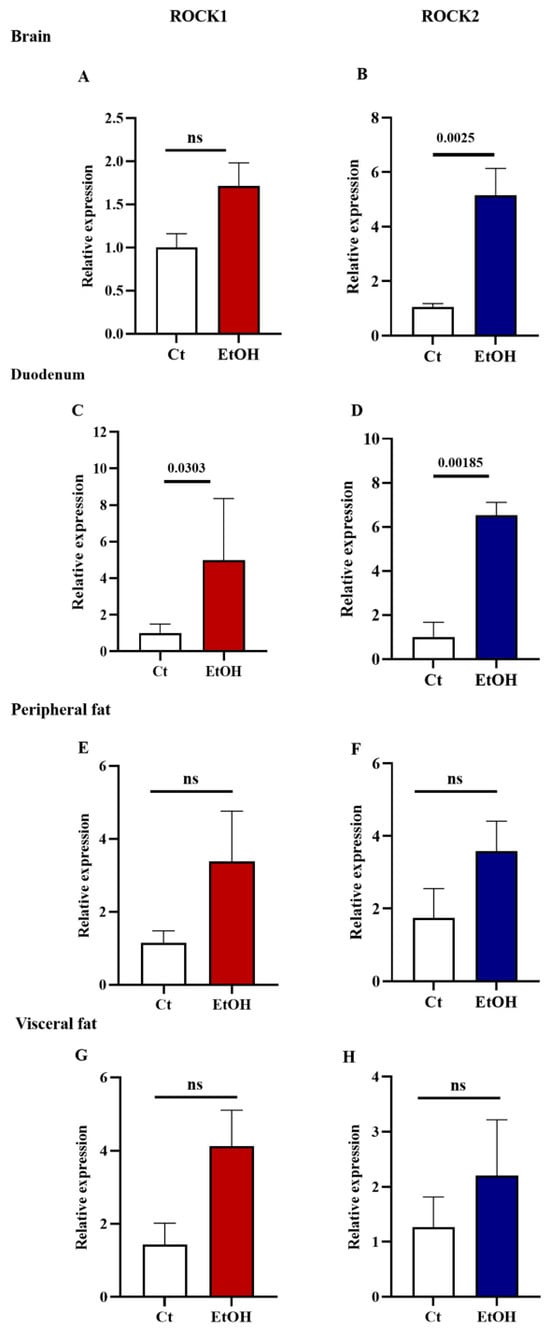
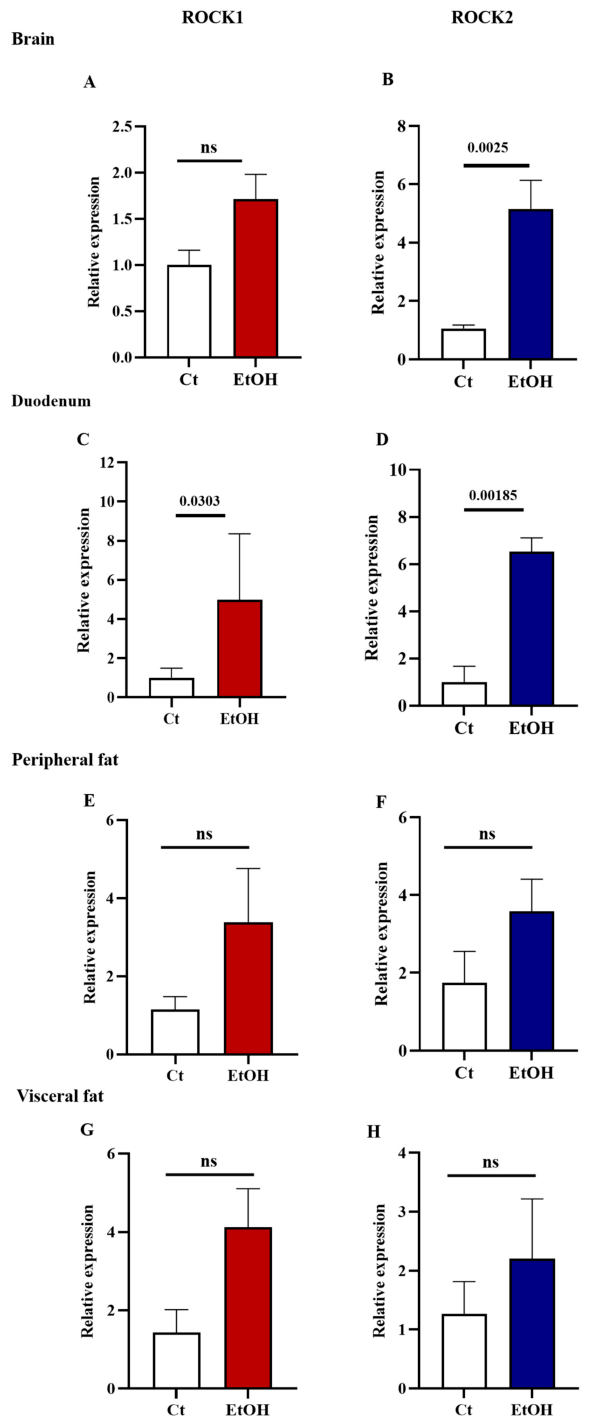
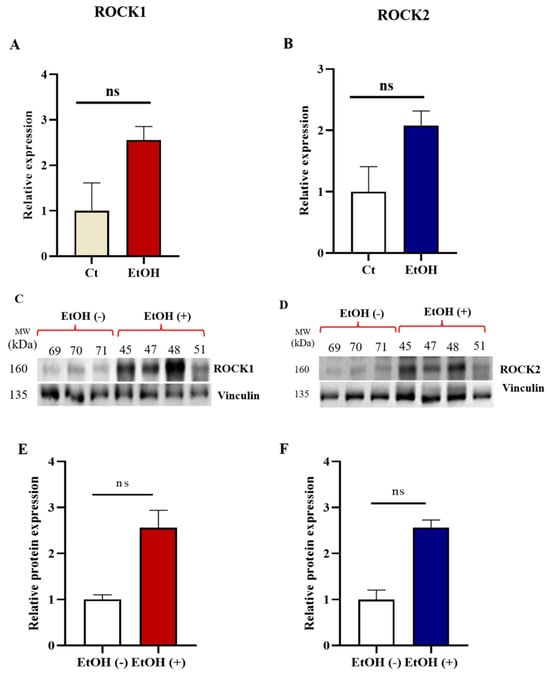
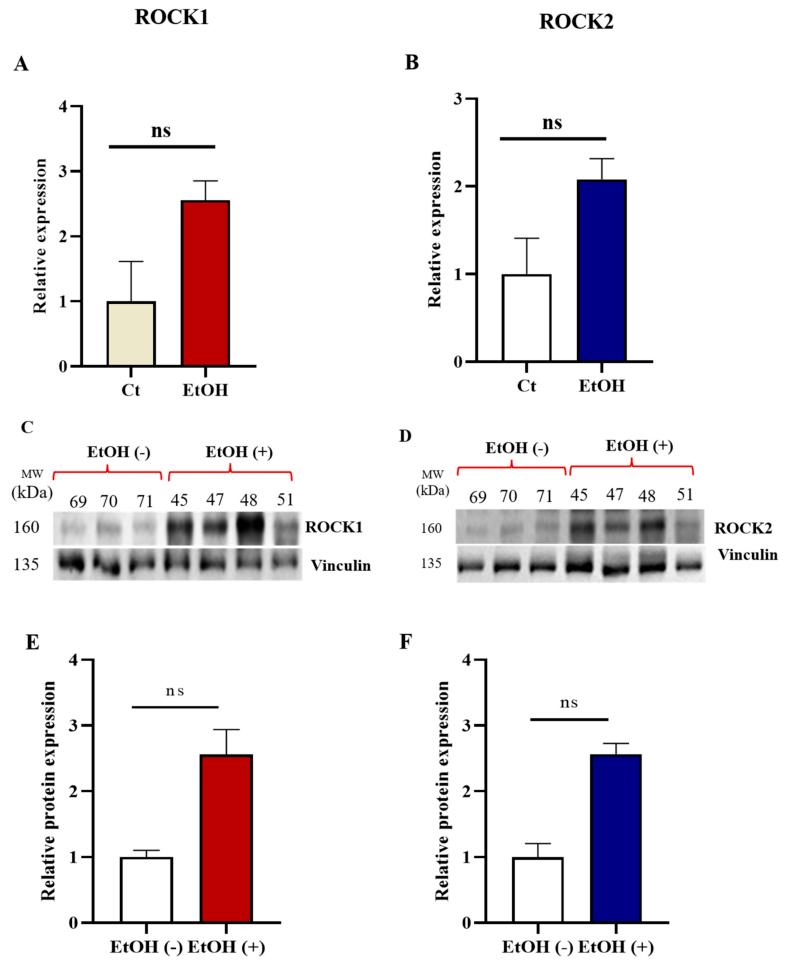
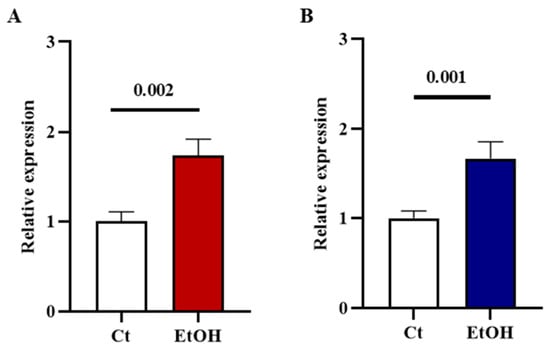
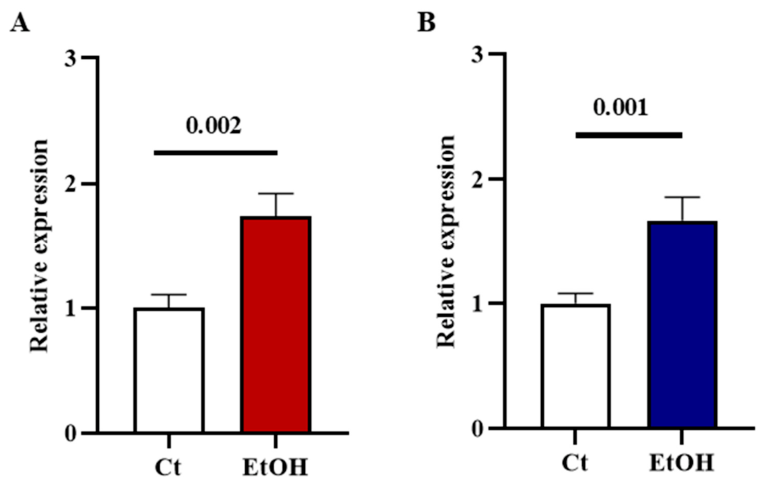
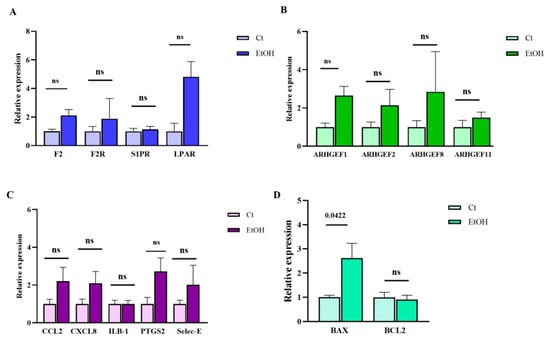
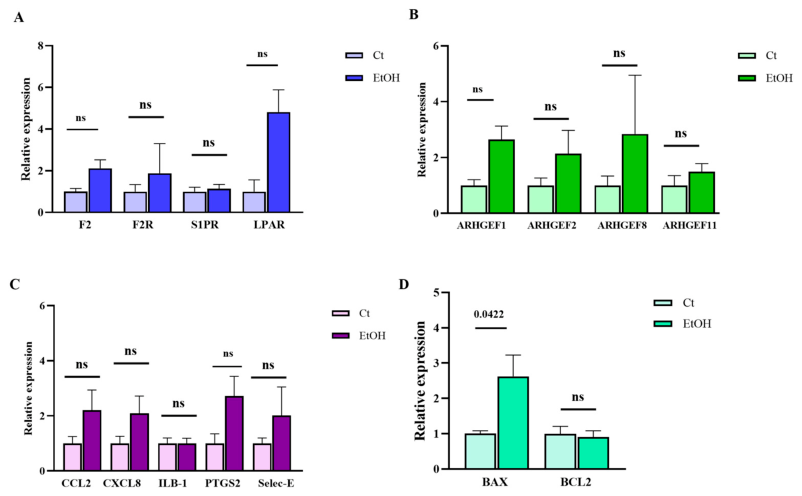
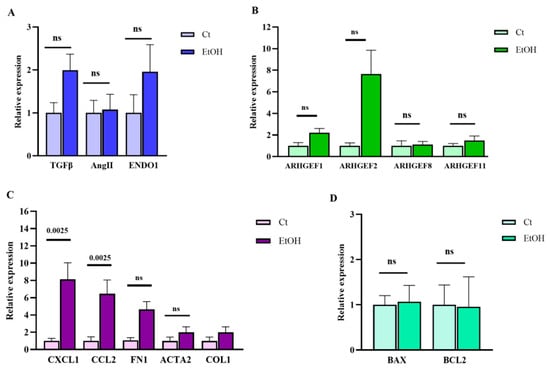
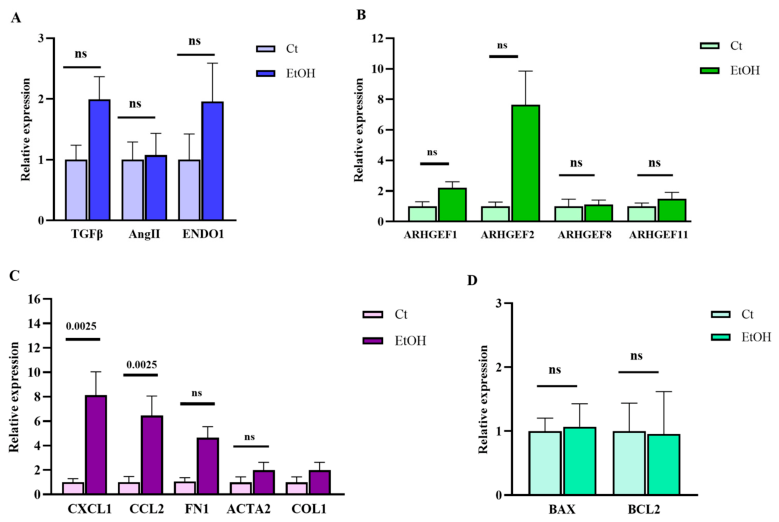
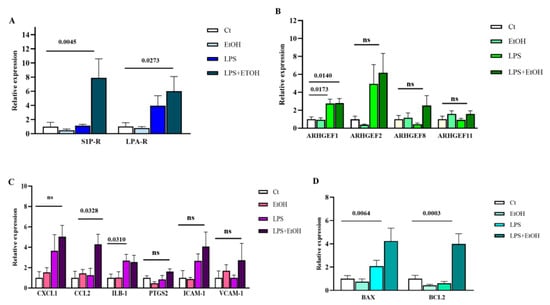
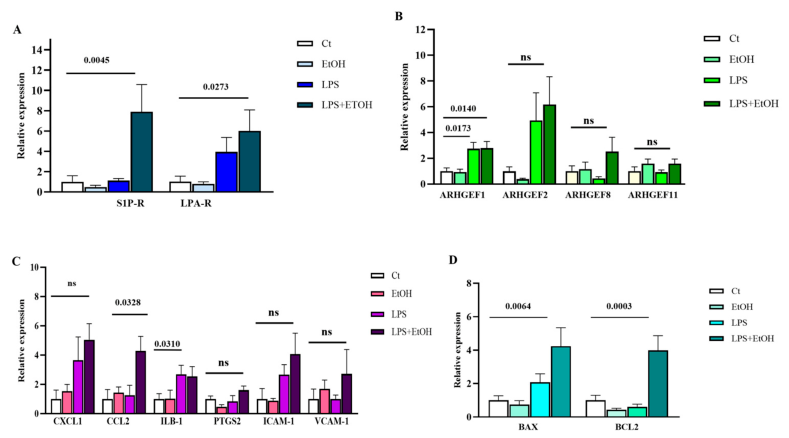
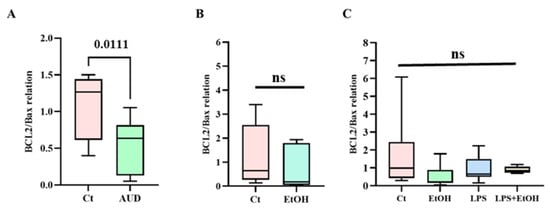
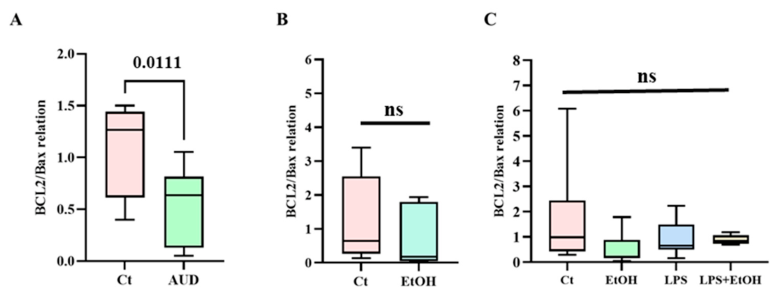
Disclaimer/Publisher’s Note: The statements, opinions and data contained in all publications are solely those of the individual author(s) and contributor(s) and not of MDPI and/or the editor(s). MDPI and/or the editor(s) disclaim responsibility for any injury to people or property resulting from any ideas, methods, instructions or products referred to in the content. |
© 2026 by the authors. Licensee MDPI, Basel, Switzerland. This article is an open access article distributed under the terms and conditions of the Creative Commons Attribution (CC BY) license.